
Submitted:
04 January 2025
Posted:
06 January 2025
You are already at the latest version
Abstract
It is widely accepted that a resting muscle does not present detectable electromyographic signals at the skin surface (sEMG). For this reason, studies on resting muscle tone often focus on measuring mechanical properties, such as stiffness, tension, and elasticity, either through palpation or specific devices. In this study, the superficial flexor muscle of the fingers was analyzed. First, the Power Spectral Density (PSD) was obtained in a resting state (PSD_pre). Subsequently, the muscle was subjected to a fatigue protocol, and immediately, after returning to the resting state, the PSD was measured once again (PSD_pos). The results suggest that the muscle at rest presents detectable electromyographic signals. Furthermore, the Wilcoxon signed rank test indicates a statistically significant decrease in PSD_pre compared to PSD_pos, with a 95% confidence level (p-value = 0.00443). In other words, the resting muscle, after experiencing fatigue, shows a greater accumulation of power in its sEMG signal compared to the pre-fatigue state.
Keywords:
Muscle tone
; Fatigue
; electromyography
; sEMG
; Resting muscle
1. Introduction
Muscle tone has received several definitions [1]. In this work, we will define muscle tone in two categories: resting muscle tone (MTR) and postural muscle tone (MTP). The MTR is the tone that the muscles exhibit when they are not exerting any force, not even to maintain posture. In contrast, MTP refers to the tone that allows body stability in calm, gravity-neutral positions, such as when reclining, sitting, or standing in a relaxed manner [2]. MTP tone allows the body to maintain posture through muscle contractions that may be voluntary, but which, for the most part, occur automatically and without conscious intervention. For instance, the muscles of the legs can make voluntary contractions, but they can also be activated involuntarily to keep the body upright. MTP is regulated by control mechanisms involving the spinal cord and cerebellum, and can be affected by some diseases [3,4]. Various studies have found no electromyographic (EMG) activity in the muscle at normal rest, suggesting the absence of electrical activity in the motoneurons involved [5,6]. Muscle tone at rest is determined mainly by the viscoelastic properties of contractile tissue. For this reason, the study of MTR and MTP is based on mechanical variables such as stiffness, tension and elasticity, which can be evaluated manually by experts through palpation or with devices such as the Myoton [7]. Although it is considered that in the absence of certain pathologies, healthy muscle at rest does not exhibit myoelectric activity [5,6], in this work we show that muscle at rest, both before and after having been subjected to fatigue, appears to exhibit electrical activity, reflected in different patterns and PSD properties of the sEMG signal.
2. Materials and Methods
Twenty-eight participants, both male and female, were recruited for the study. Of these, twenty-five were between 18 and 24 years old, and three were over 55 years old. The majority were students (25 participants), while the remaining three were professors from the School of Engineering at the Autonomous University of San Luis Potosí. The invitation was made through posters placed in the hallways. The inclusion criteria were: no injuries to the hand, arm or elbow normally used (right hand in right-handed people and left hand in left-handed people); not having any illness at the time of measurements; not having ingested drugs or alcohol in the last 24 hours, caffeine, food or medications 8 hours previous to the study; not having subjected the forearm muscles to fatigue in the last 24 hours; and be willing to sign a letter of informed consent. The protocol was approved by the Bioethics Committee of the School of Medicine of the Autonomous University of San Luis Potosí. The procedure consisted of measuring the resting electromyographic activity (sEMG) of the superficial flexor muscle of the fingers, before and after performing a maximum contraction with a Biopac dynamometer. First, at rest, sEMG signals were recorded for 20 seconds. Then, each participant took the dynamometer and exerted their maximum contraction force until it decreased to 50% of the initial force. Subsequently, they released the dynamometer and kept their arm at rest for another 20 seconds. At the end of this time, the data were stored and the experiment was terminated. The procedure is detailed below.
Protocol
- The computer equipment and software were prepared to simultaneously record the sEMG signal and the force exerted on a dynamometer.
- The participant sat in a chair with a backrest, the electrodes were placed to record the sEMG of the superficial flexor muscle of the fingers of the hand (see Figure 1) and the procedure was explained in detail.
- The participant was asked to place their forearm on a horizontal table, thus verifying that the muscles were at complete rest and that no muscles near the electrodes were active.
- The dynamometer was placed near the participant’s hand and they were instructed on how to grasp and release it correctly, repeating the action several times to ensure that they understood the procedure.
- After confirming that the forearm was at rest, the measurement was started, recording the sEMG activity for 20 seconds.
- At the end, of the 20 seconds, the participant was instructed to take the dynamometer and exert his maximum force, simultaneously recording the sEMG and the force exerted. This phase concluded when the force dropped to 50% of the initial one.
- Upon reaching 50% of the force, the participant was instructed to release the dynamometer and return to the rest position for 20 seconds, recording the sEMG in this rest phase.
- At the end of the last 20 seconds, the recording was stopped, the participant was informed of the end of the experiment, the data was saved on disk and the electrodes were removed. The data was obtained and processed with the Biopac Student Lab© (BSL) software version 4.1, using the MP36© model under the Microsoft Windows© version 10 operating system.
3. Data Analysis and Results
During this protocol, the muscle goes through three states: in the first state, ”Resting," the muscle is in total rest and without fatigue (with at least 24 hours of rest). In the second state, ”Strength," the muscle makes a maximum contraction, reaching a certain degree of fatigue when the force decreases to 50% of the initial one. In the third state, ”Fatigued," the muscle is once again in total rest, similar to the Resting state but now with accumulated fatigue.
For each of the 28 subjects, sEMG signals were analyzed using BSL 4.1 software to calculate the PSD of a 20-second segment recorded during Resting (PSD_pre) and Fatigued (PSD_pos) states. The objective was to assess whether fatigue influences the energy accumulated in the sEMG spectrum by comparing PSD_pre and PSD_pos values.
In the Shapiro-Wilk normality test, a p-value = was obtained for PSD_pre and p-value = for PSD_pos, so it can be concluded that they do not follow a normal distribution. Both the distribution of the PSD_pre and the PSD_pos seem to follow a power law (Figure 2), a pattern that occurs both in natural phenomena and in those created by humans. In a power law distribution, low-intensity events are very frequent and high-intensity events are rare; Examples include the frequency of use of words in English, where few words are used a lot and many words are used very little, or the magnitude of earthquakes; Low-intensity earthquakes are much more frequent than high-intensity ones [8].
In the Bootstrapping test, p-values of 0.003 and 0.567 were obtained for PSD_pre and PSD_pos respectively, which allows us to say that PSD_pre, although quite similar, is not distributed as a power law, while PSD_pos does exhibit a power law distribution. The bootstrap function of R software runs simulations to assess how well a power law describes the data by comparing it to a range of synthetic datasets [9].
To facilitate statistical analysis, we applied the log() function in R to transform the PSD_pre and PSD_pos data (resulting in log_PSD_pre and log_PSD_pos), linearizing the power-law relationship. The power law can be expressed as: , where ”k" and ”a" are constants. By applying the logarithm on both sides, a linear relationship is obtained: . This linear form is easier to analyze with conventional statistical techniques. Data with power law distributions usually present heteroskedasticity [10], that is, non-constant variance. The logarithmic transformation reduces this heteroskedasticity, making the data more suitable for tests such as t-tests or Wilcoxon tests.
The Shapiro-Wilk test indicated that log_PSD_pre is not normally distributed (p-value = 0.00812), while log_PSD_pos is (p-value = 0.07109). Therefore, the Wilcoxon signed rank test was used, suitable for paired data not normally distributed. This test, performed in R, suggests a statistically significant decrease in log_PSD_pre with respect to log_PSD_pos at 95% confidence (p-value = 0.00443). In other words, the muscle at complete rest, after fatigue, shows a greater accumulation of power in its sEMG signal compared to the pre-fatigue state.
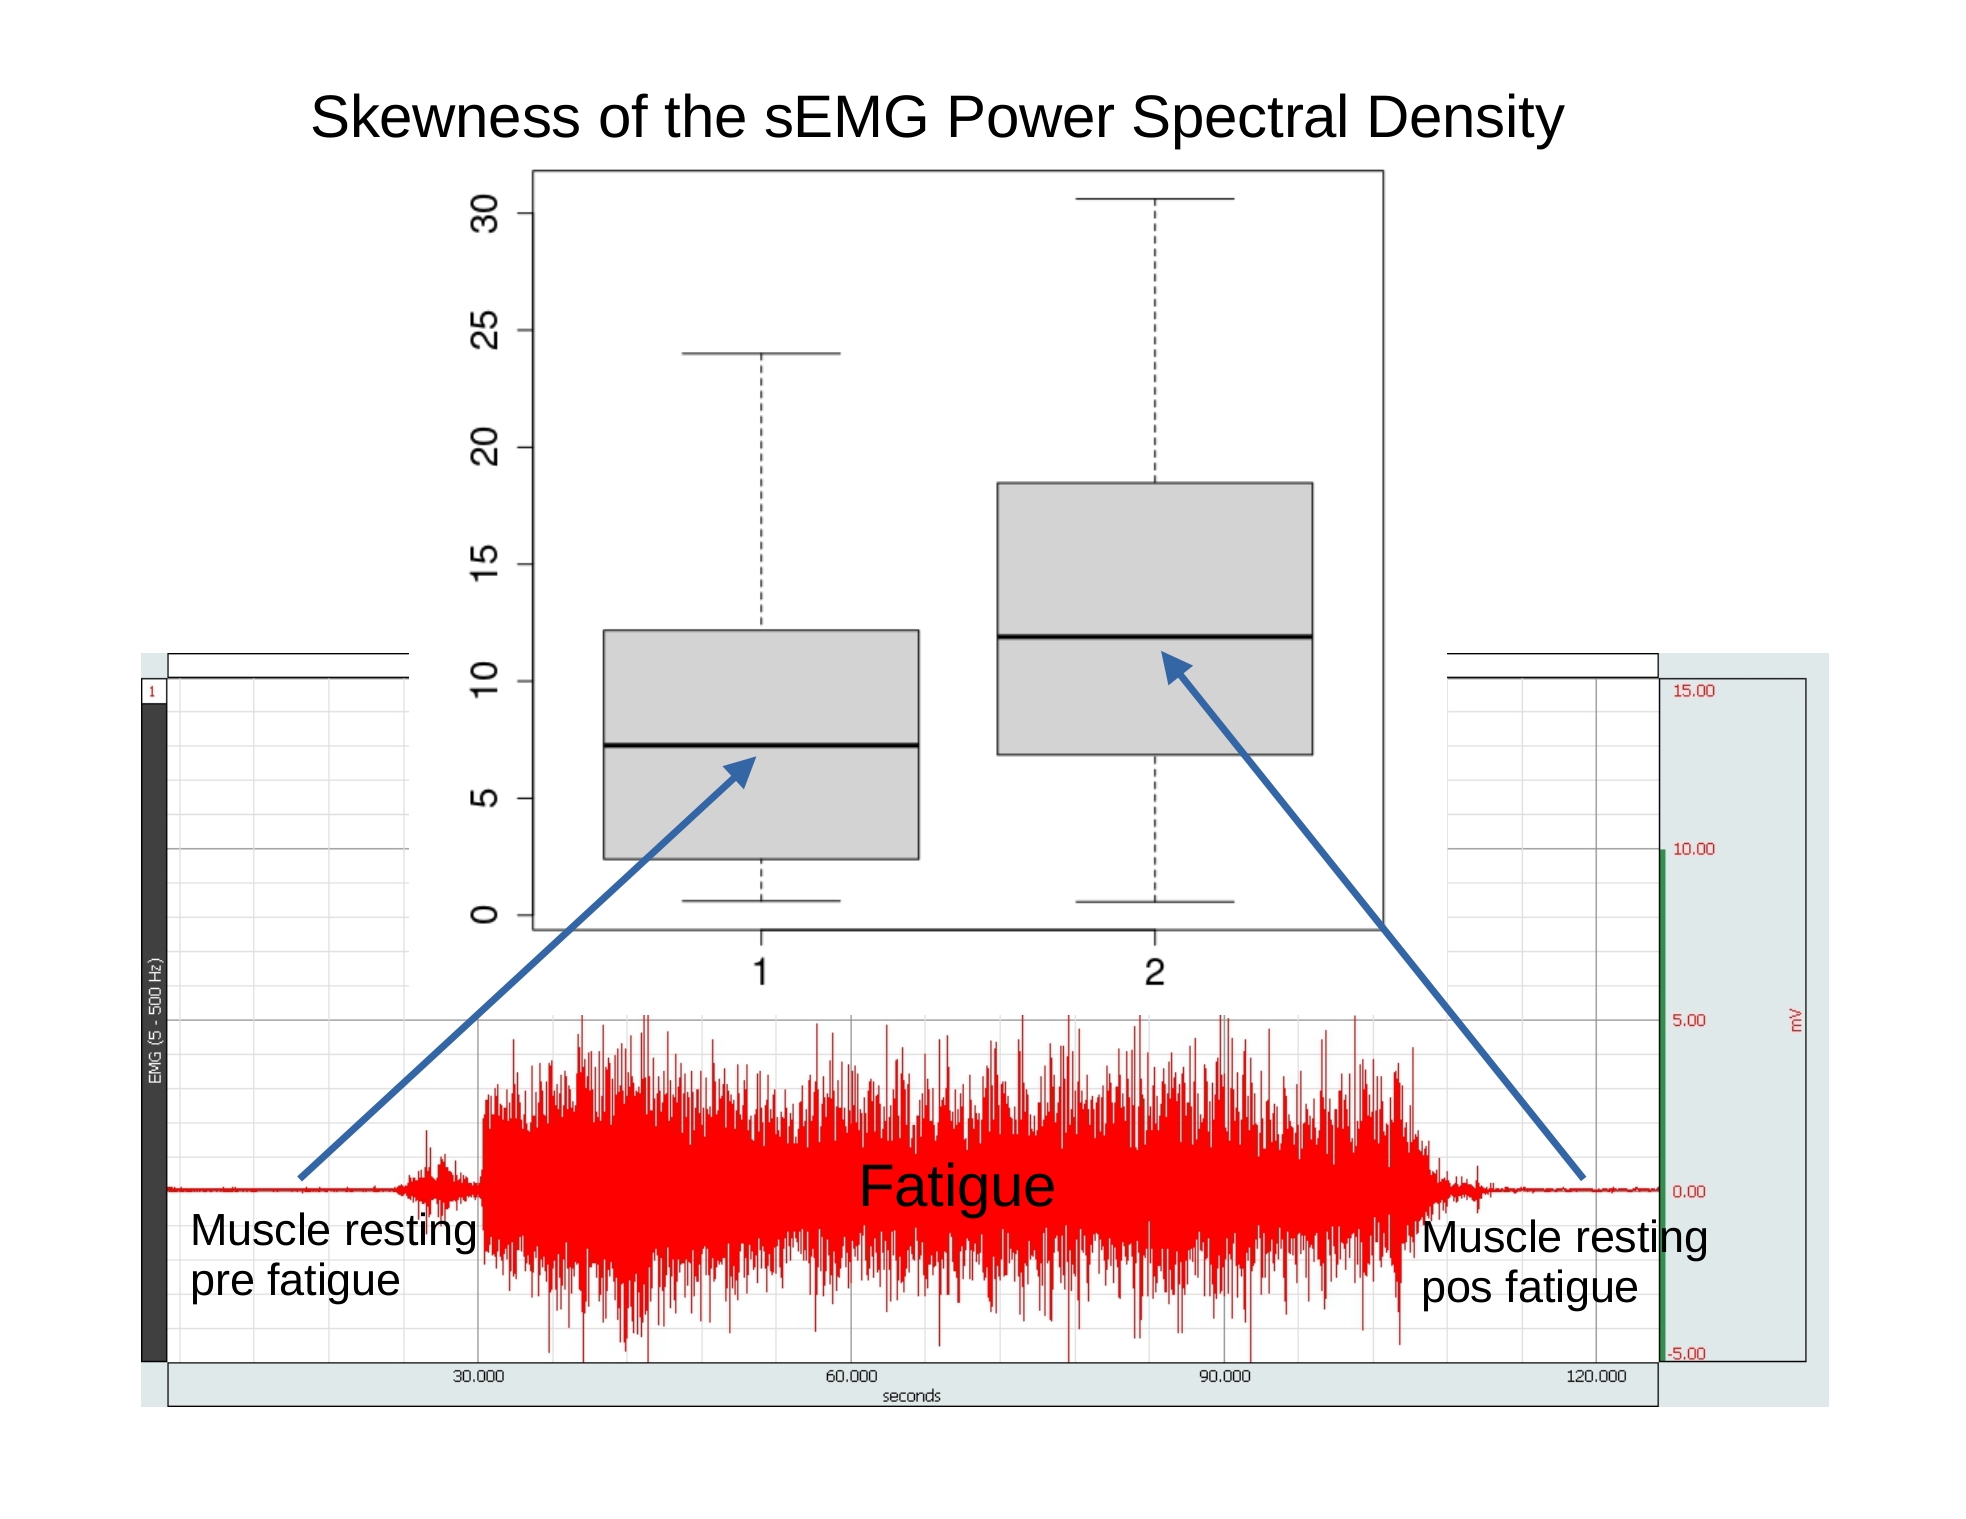
Fatigue also appears to alter the symmetry of the power distribution in the spectrogram of the sEMG signal. To investigate this change, the skewness of the PSD_pre and PSD_pos data was calculated using BSL software. A Wilcoxon signed-rank test showed that, with 95% confidence and a p-value of 0.01492, the mass of the power distribution in the spectrogram shifts further to the left in PSD_pos (see Figure 3).
4. Discussion
The study presents several points to consider. The sample is relatively small, with a size of n=28, twenty-five of them being 25 young male and female adults, between 18 and 24 years of age, while the remaining three are adult men over 55 years old. No classification was made by tobacco use, alcohol consumption or presence of diseases, since, with this reduced sample size, the data obtained in these subgroups would not have been statistically significant. Furthermore, the participants belong to a very specific group of the population: undergraduate students from the School of Engineering of the Autonomous University of San Luis Potosí. PSD_pre measurements were taken immediately before fatigue induction, while PSD_pos measurements were taken just after fatigue. However, we do not have information on how long after fatigue the PSD maintains its properties; We assumed as an inclusion criterion that 12 hours of rest could be sufficient for the effects of fatigue to end. We are also not sure of the reason or purpose of these changes: could they be a muscle strategy to recover from fatigue, or simply an expression of a fatigued muscle?
5. Conclusions
It has been found using sEMG that muscle at rest appears to show electromyographic signals, and that some properties of the power spectral density of those signals in muscle at rest, after having been subjected to fatigue, appear to be different from the properties of those same signals in the muscle at rest before said fatigue.
Author Contributions
Conceptualization, Jesus Acosta-Elias, Laura Espinosa and Ricardo Espinosa-Tanguma; Data curation, Omar Vital-Ochoa and Santiago Mendez-Moreno; Formal analysis, Jesus Acosta-Elias; Writing – original draft, Jesus Acosta-Elias. All coauthors read and edited the manuscript.
Funding
This work was partially supported by the Autonomous University of San Luis Potosí. No additional specific grant funding was received.
Data Availability Statement
The datasets generated and/or analysed during the current study are available in the repository: https://purl.archive.org/muscle
Conflicts of Interest
The authors declare they don’t have any conflict of interest with respect to the subject of this manuscript.
References
- Shortland, A.P. Muscle tone is not a well-defined term. Developmental Medicine & Child Neurology 2018, 60, 637–637. [Google Scholar] [CrossRef]
- Schoenrock, B.; Zander, V.; Dern, S.; Limper, U.; Mulder, E.; Veraksitš, A.; Viir, R.; Kramer, A.; Stokes, M.J.; Salanova, M.; et al. Bed Rest, Exercise Countermeasure and Reconditioning Effects on the Human Resting Muscle Tone System. Frontiers in Physiology 2018, 9. [Google Scholar] [CrossRef] [PubMed]
- Ganguly, J.; Kulshreshtha, D.; Almotiri, M.; Jog, M. Muscle Tone Physiology and Abnormalities. Toxins 2021, 13. [Google Scholar] [CrossRef] [PubMed]
- Menon, P.; Vucic, S. The Upper Motor Neuron—Improved Knowledge from ALS and Related Clinical Disorders. Brain Sciences 2021, 11. [Google Scholar] [CrossRef] [PubMed]
- Masi, A.T.; Hannon, J.C. Human resting muscle tone (HRMT): Narrative introduction and modern concepts. Journal of Bodywork and Movement Therapies 2008, 12. [Google Scholar] [CrossRef] [PubMed]
- Knutson, G.A.; Owens, E.F.J. Active and passive characteristics of muscle tone and their relationship to models of subluxation/joint dysfunction: Part I. The Journal of the Canadian Chiropractic Association 2003, 47. [Google Scholar]
- Stefaniak, W.; Marusiak, J.; Baczkowicz, D. Myotonometric assessment of peroneus longus muscle mechanical properties during contraction in athletes with and without chronic ankle instability. Journal of Biomechanics 2024, 176, 112308. [Google Scholar] [CrossRef]
- Newman, M. Power laws, Pareto distributions and Zipf’s law. Contemporary Physics 2005, 46, 323–351. [Google Scholar] [CrossRef]
- Gillespie, C.S. Fitting Heavy Tailed Distributions: The poweRlaw Package. Journal of Statistical Software 2015, 64, 1–16. [Google Scholar] [CrossRef]
- Kenari, N.S.; Bayat, F.; Libbrecht, M.W. VSS-Hi-C: variance-stabilized signals for chromatin contacts. Bioinformatics 2024, 40, btae715. [Google Scholar] [CrossRef] [PubMed]
Figure 1.
Two electrodes were placed on the forearm; a third electrode was placed near the elbow (not visible in the image).
Figure 1.
Two electrodes were placed on the forearm; a third electrode was placed near the elbow (not visible in the image).

Figure 2.
It can be seen in both histograms that low values of PSD are very frequent, and high values are very infrequent, as happens in a power law distributions.
Figure 2.
It can be seen in both histograms that low values of PSD are very frequent, and high values are very infrequent, as happens in a power law distributions.
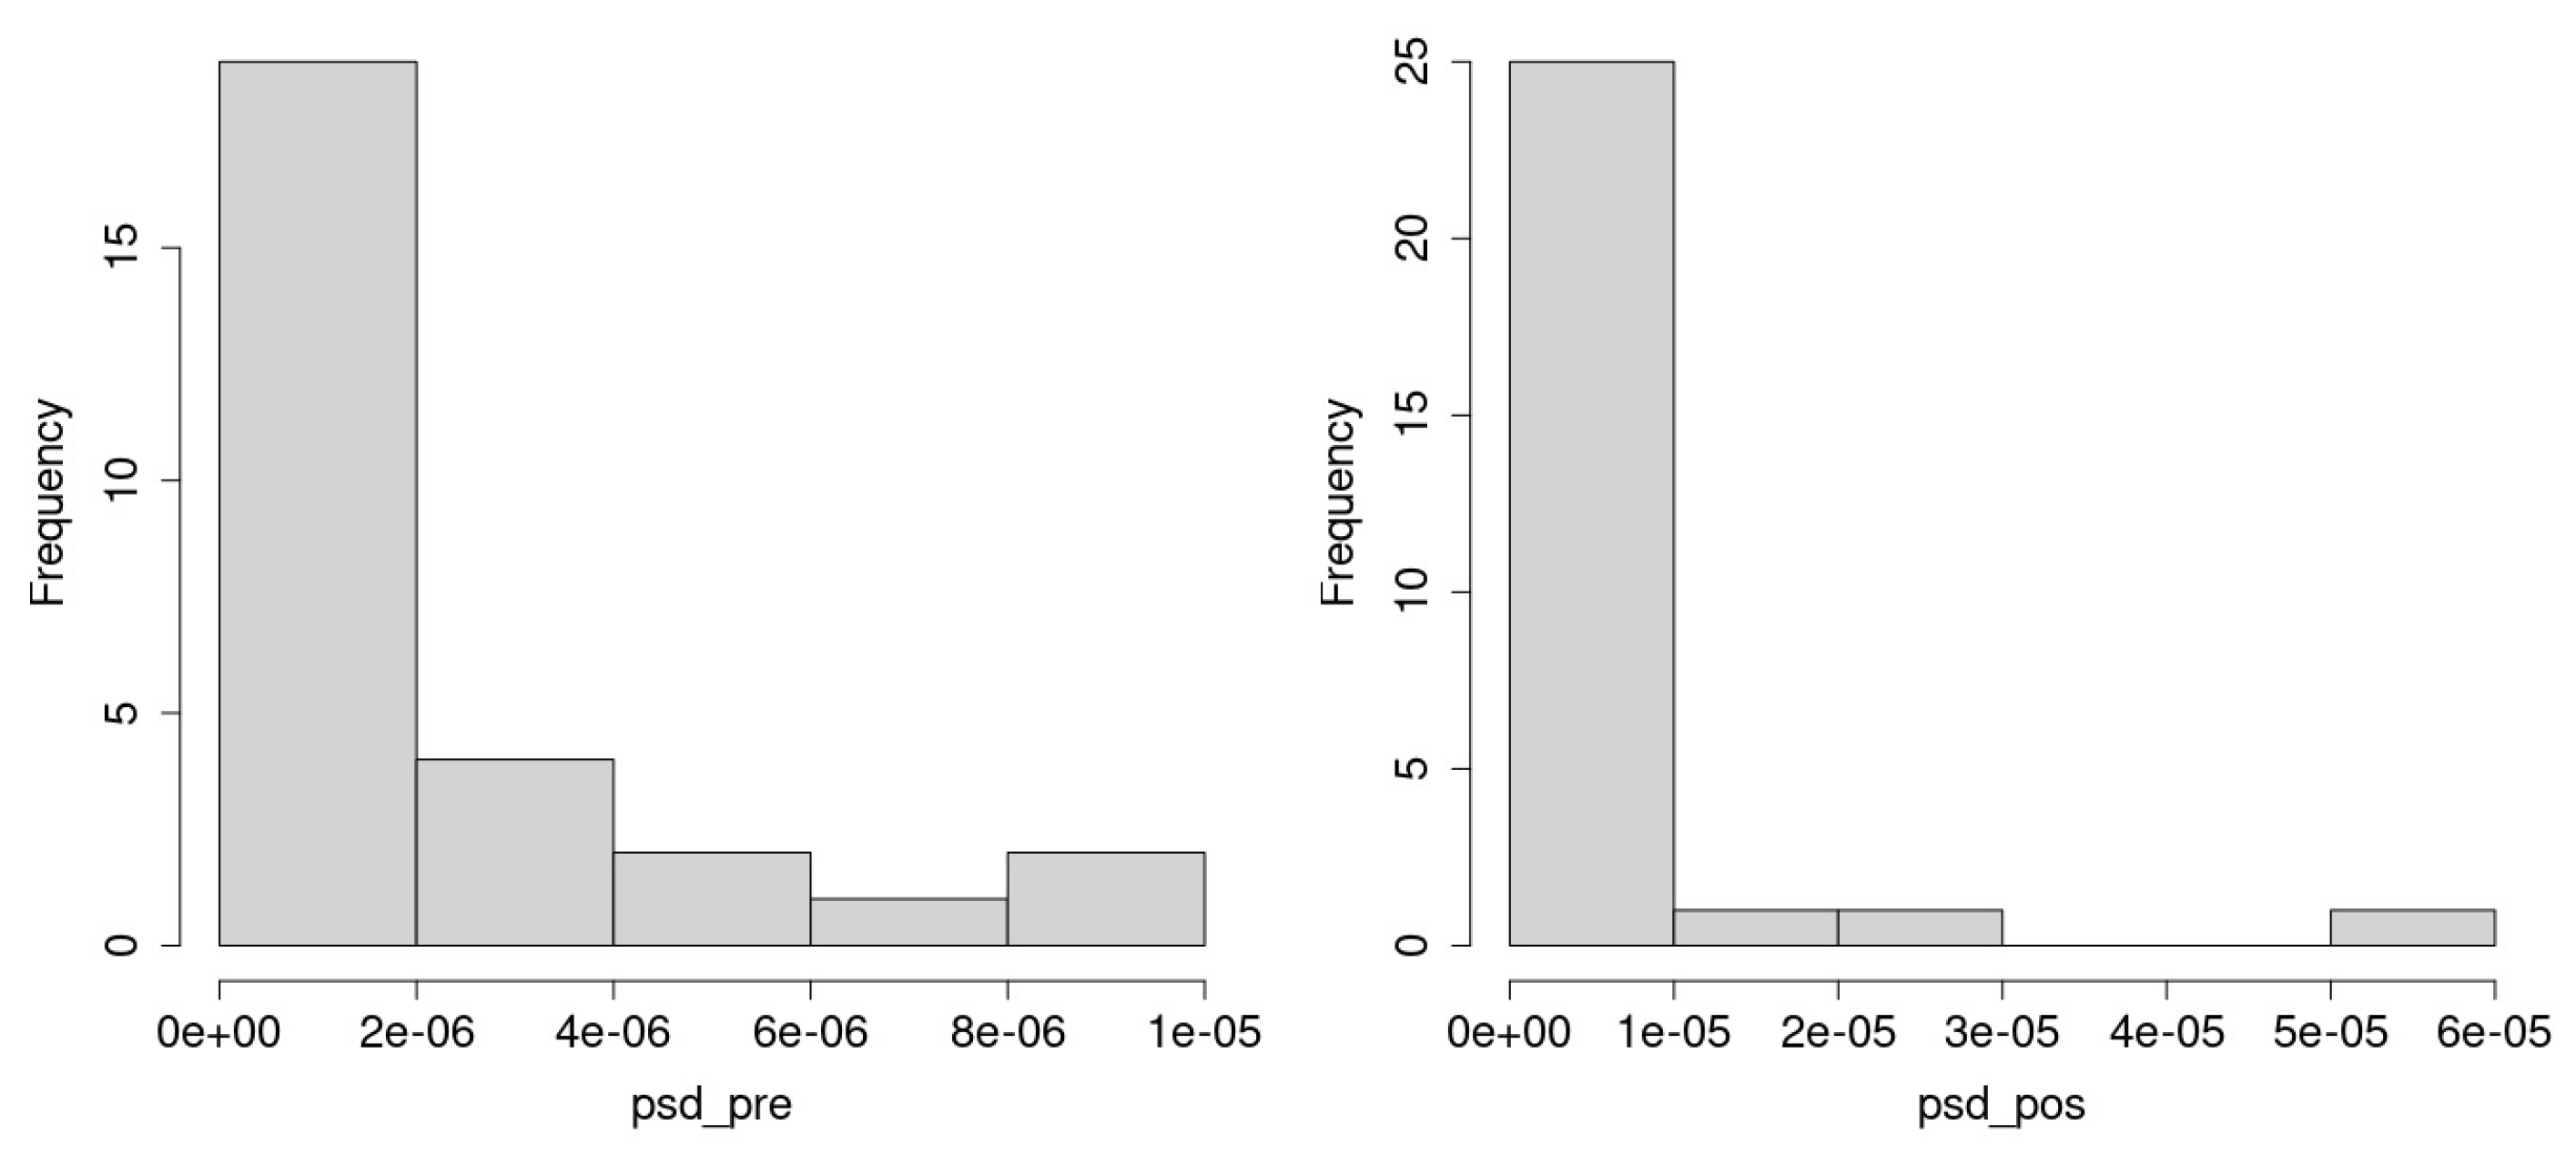
Figure 3.
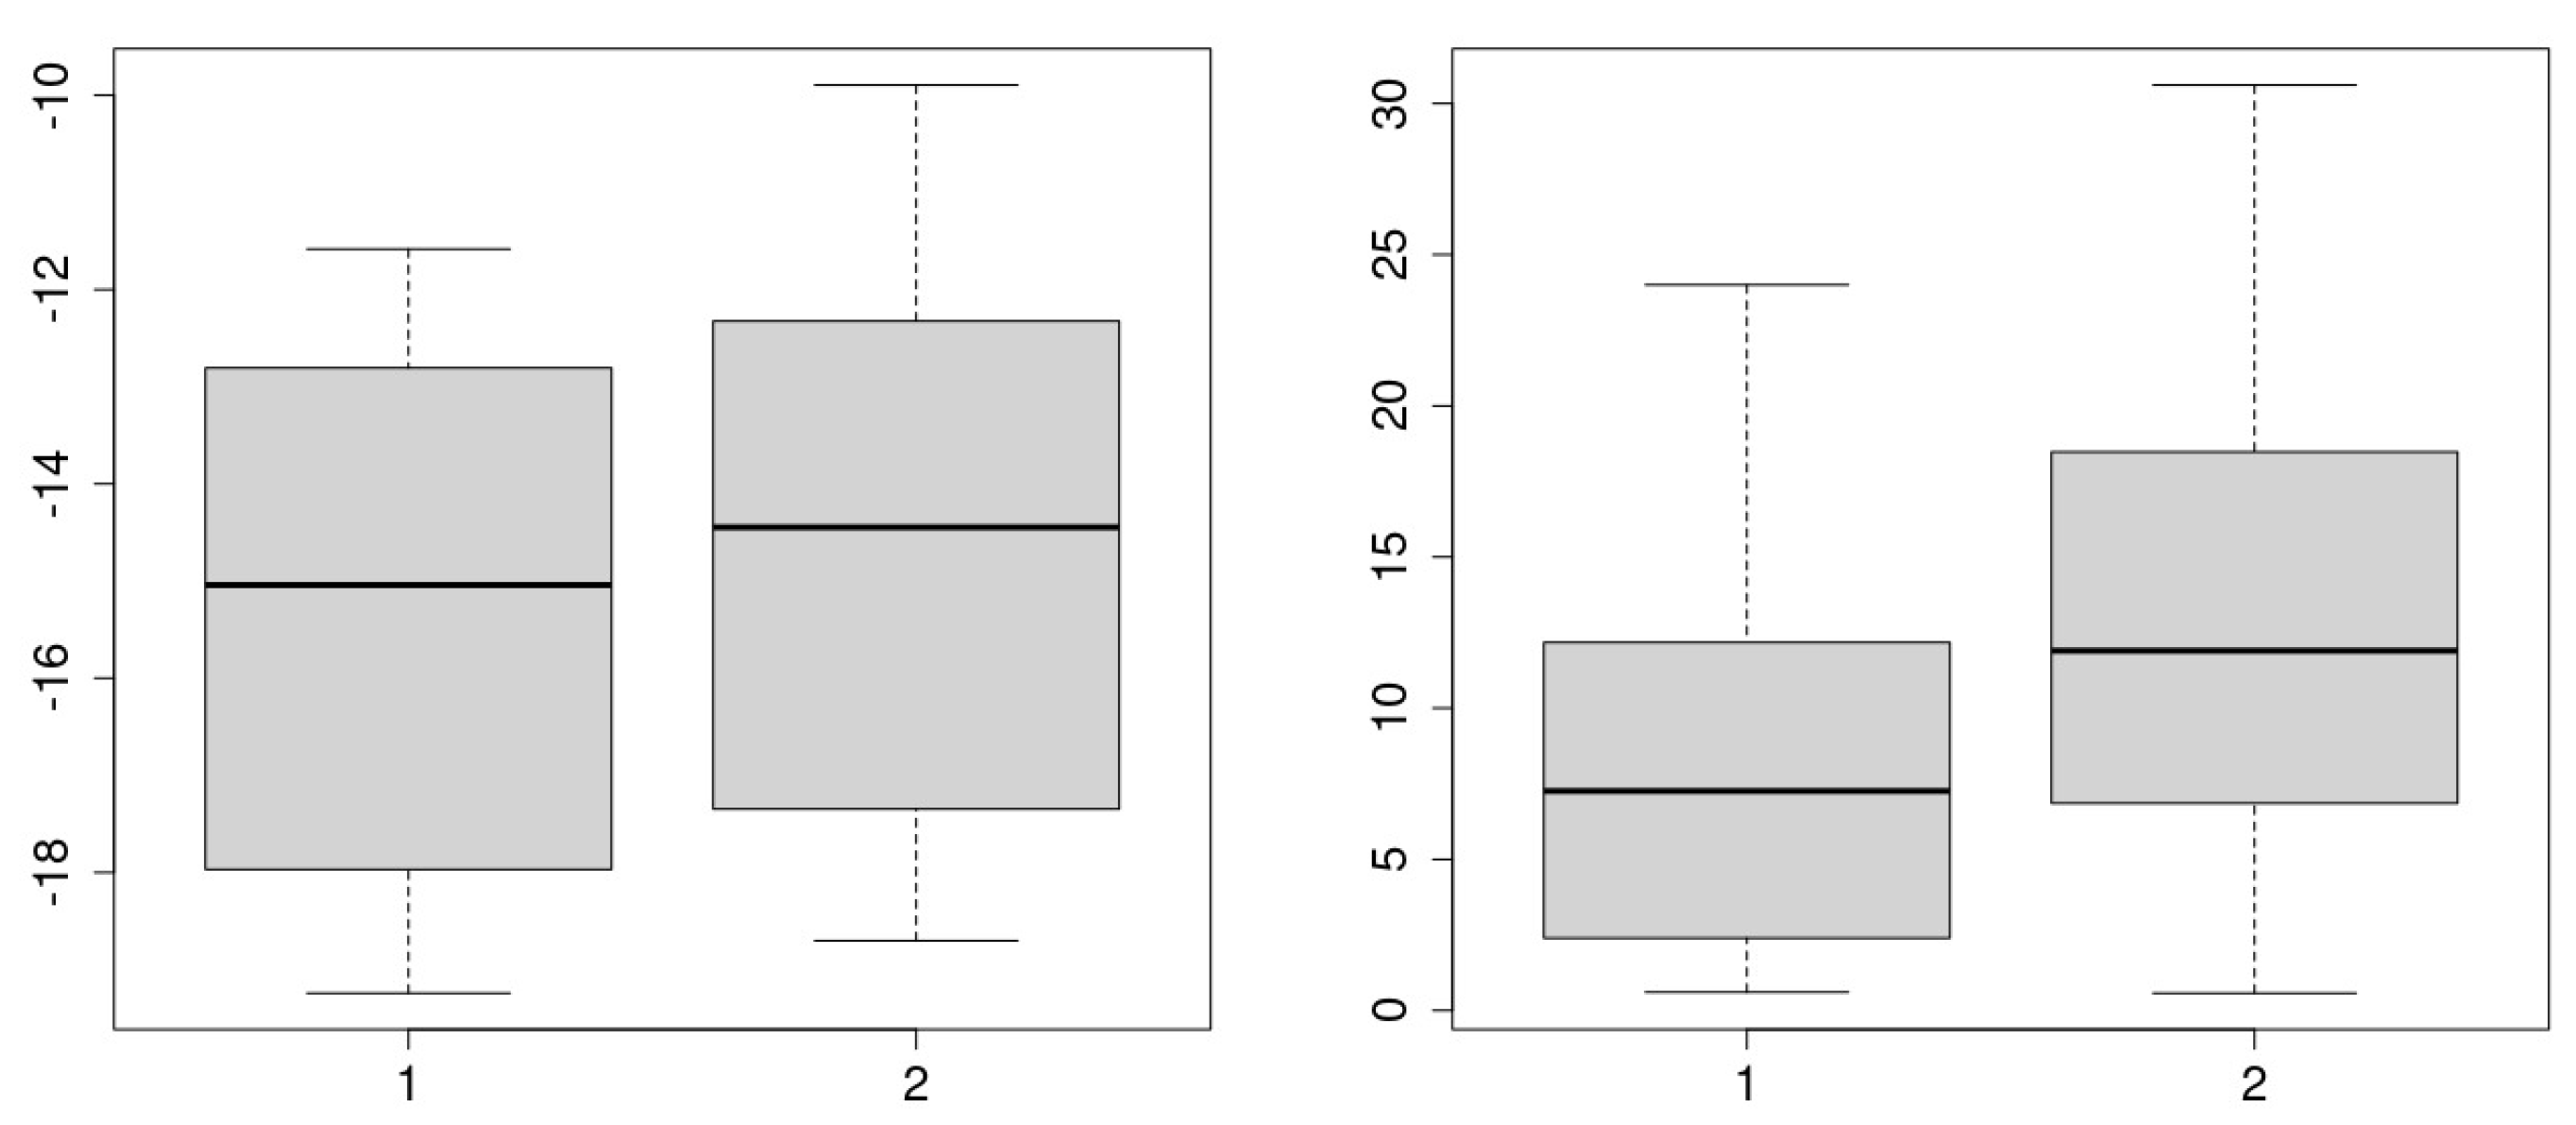
In the boxplot on the left (PSD), it can be observed that the median of log_PSD_pre (1) is lower than the median of log_PSD_pos (2). In the boxplot on the right (Skewness), it can be observed that the median skewness is higher in PSD_pos (2) compared to PSD_pre (1).
Figure 3.
In the boxplot on the left (PSD), it can be observed that the median of log_PSD_pre (1) is lower than the median of log_PSD_pos (2). In the boxplot on the right (Skewness), it can be observed that the median skewness is higher in PSD_pos (2) compared to PSD_pre (1).
Disclaimer/Publisher’s Note: The statements, opinions and data contained in all publications are solely those of the individual author(s) and contributor(s) and not of MDPI and/or the editor(s). MDPI and/or the editor(s) disclaim responsibility for any injury to people or property resulting from any ideas, methods, instructions or products referred to in the content. |
© 2025 by the authors. Licensee MDPI, Basel, Switzerland. This article is an open access article distributed under the terms and conditions of the Creative Commons Attribution (CC BY) license (http://creativecommons.org/licenses/by/4.0/).
Copyright: This open access article is published under a Creative Commons CC BY 4.0 license, which permit the free download, distribution, and reuse, provided that the author and preprint are cited in any reuse.


