
Submitted:
03 January 2025
Posted:
03 January 2025
You are already at the latest version
Abstract
L-Theanine, a natural amino acid found in green tea (Camellia sinensis) leaves, is known for its diverse psychotropic effects. This study aimed to evaluate the inhibitory effect of L-theanine on melanin production and uncover its regulatory mechanism. We evaluated the anti-melanogenic activities of L-theanine in vitro and in vivo. In B16F10 murine melanoma cells induced by α-melanocyte-stimulating hormone, melanin content and intracellular tyrosinase activity were determined, and melanogenesis-related protein expression and signaling pathways were analyzed by Western blotting. Melanin reduction was further assessed using the zebrafish embryo test. L-Theanine reduced the intracellular tyrosinase activity and melanin content of B16F10 cells. It also attenuated the expression melanogenesis-related proteins, such as microphthalmia-associated transcription factor, tyrosinase (TYR), TYR-related protein-1, and dopachrome tautomerase. L-Theanine modulated the protein kinase A (PKA), cAMP responder element binding protein (CREB), phosphorylation of /protein kinase B (Akt), glycogen synthase kinase-3β (GSK-3β), and β-catenin. The antimelanogenic activity of L-theanine (<2 mg/mL) was further confirmed using in zebrafsh larvae. L-Theanine inhibited melanogenesis by downregulating the PKA/CREB and Akt/GSK-3β/β-catenin signaling pathways. In summary, the L-theanine can be considered as a skin-whitening compound for use in cosmetic and pharmaceutical products.
Keywords:
L-Theanine
; Melanogenesis
; B16F10
; Zebrafish
1. Introduction
Melanogenesis is the process of melanin synthesis and distribution on melanocytes. It is essential for determining the color of skin, hair, and eyes [1]. Melanin protects the skin from ultraviolet ray damage; however, excessive melanin production can form spots and freckles, and even increase the risk of developing skin cancer [2]. Tyrosinase (TYR) is an important enzyme in controlling melanogenesis in melanosomes, so TYR inhibitors are widely used for skin whitening [3]. Many useful and commercial TYR inhibitors are extensively used in cosmetics or medial treatments [4]. However, some of them can cause skin irritation, contact dermatitis or erythema, peeling, and other adverse effects [5]. Therefore, the discovery of effective and safe TYR inhibitors is an important but challenging endeavor in the developing skin-whitening products [6].
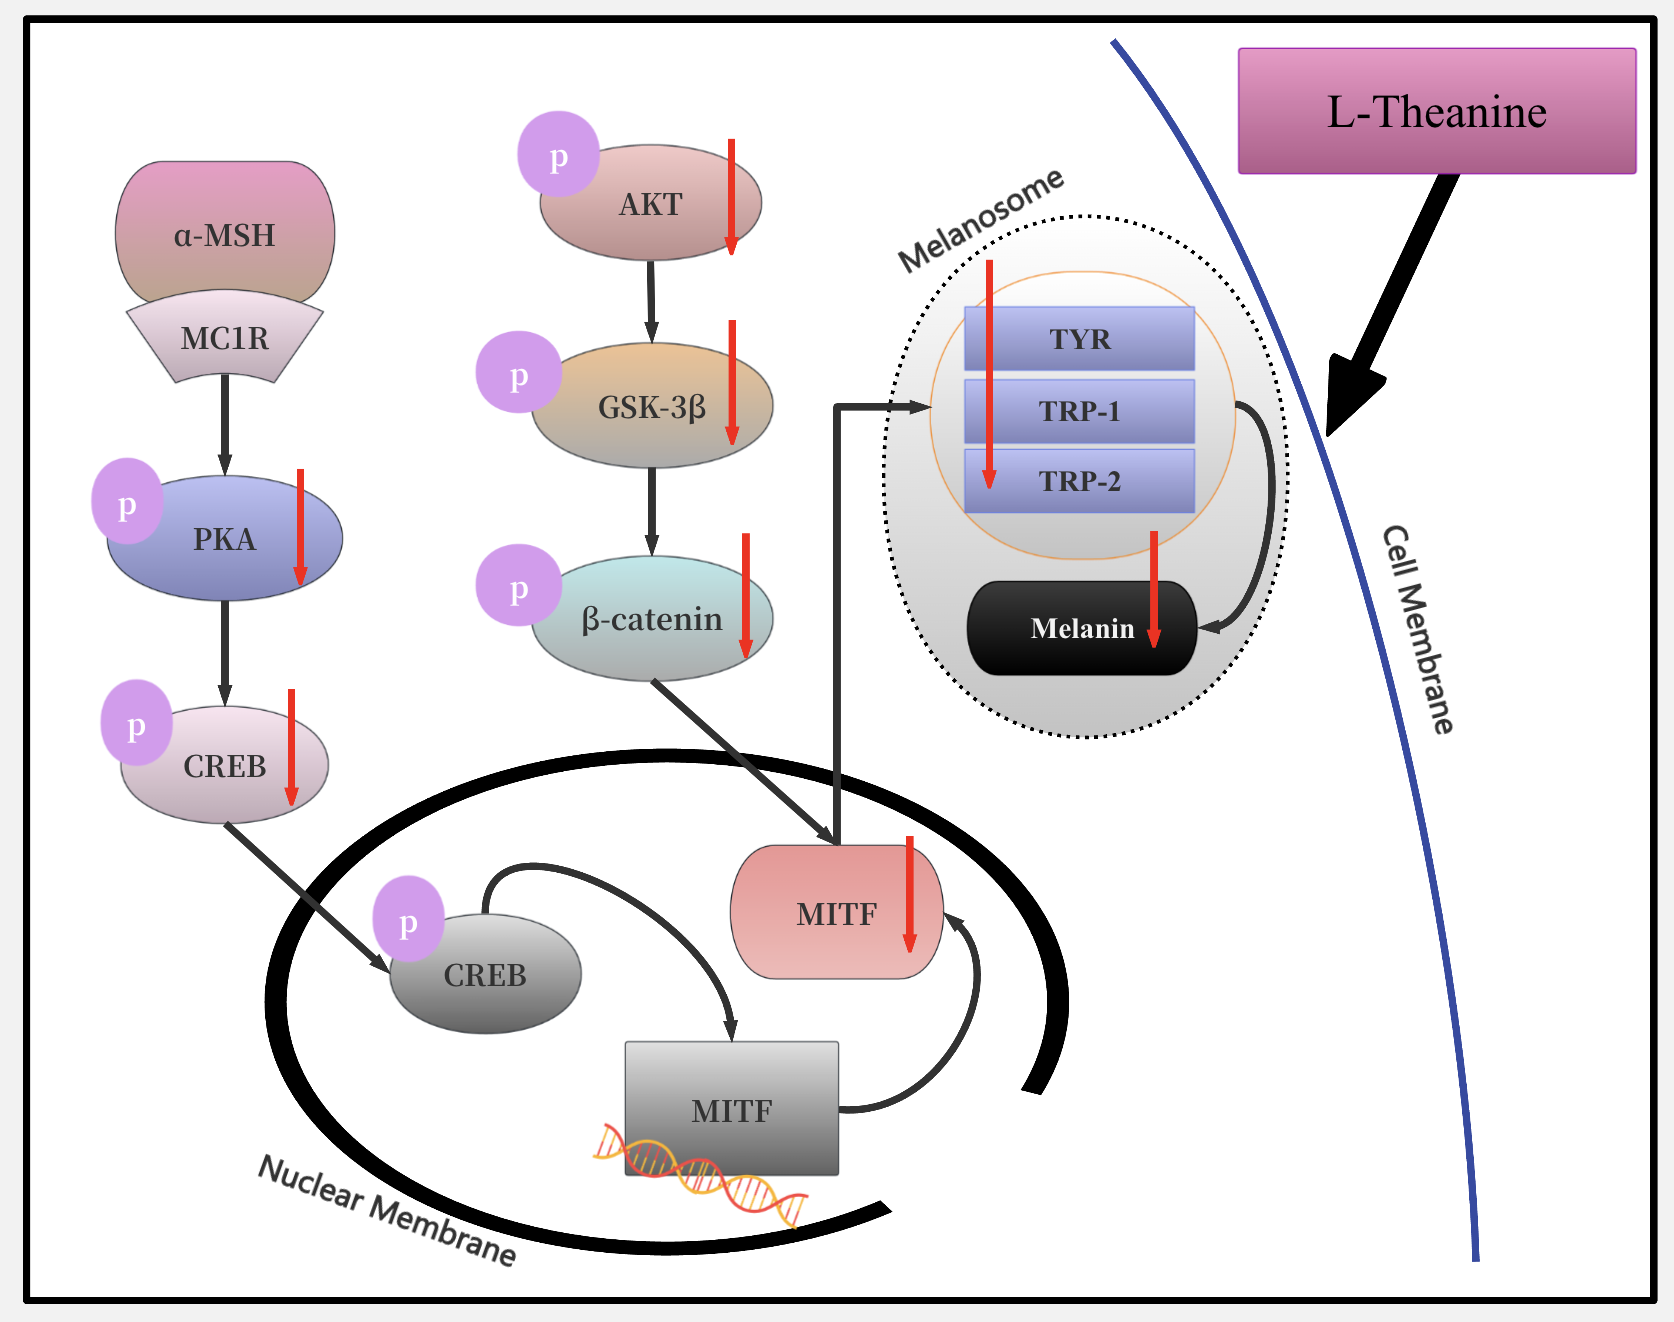
Melanogenesis is regulated by several signal-transduction pathways, including the PKA/CREB, Akt/GSK-3β/β-catenin, and mitogen-activated protein kinase (MAPK) pathways [7,8,9]. These signaling pathways regulate microphthalmia-associated transcription factor (MITF) activity, playing a crucial role in the transcription of melanogenesis-related proteins such as TYR, TYR-related protein-1 (TRP-1), and dopachrome tautomerase (DCT), ultimately influencing melanin production [10].
α-Melanocyte-stimulating hormone (α-MSH) is secreted by melanocytes and keratinocytes after UV exposure [11]. When melanocortin 1 receptor combines with α-MSH, it induces adenylyl cyclase (AC) to form intracellular cyclic adenosine monophosphate (cAMP), which in turn activates PKA [7,12]. A phosphorylation of CREB can be activated by PKA at Ser 133 to directly bind to the MITF promoter region and stimulate MITF transcription [12].
The Akt/GSK-3β/β-catenin signaling pathway importantly influence melanogenesis. Akt, activated by PI3K, phosphorylates GSK-3β at Ser9, leading to its inactivation [13]. The phosphorylated GSK-3β enhances MITF binding to the TYR promoter, thereby promoting melanogenesis [14]. β-Catenin, which upregulates MITF expression, is phosphorylated by GSK-3β at Ser33 and Ser37, leading to its degradation via the proteasome [15].
The phosphorylation of the MAPK pathway, including extracellular signal-regulated kinase (ERK), c-Jun NH2-terminal kinase (JNK), and p38, can influence MITF expression [16,17]. Previous studies have shown that inhibiting the phosphorylation of p38 or JNK, or activating ERK phosphorylation can reduce MITF expression, leading to the downregulation of melanogenesis [18,19,20].
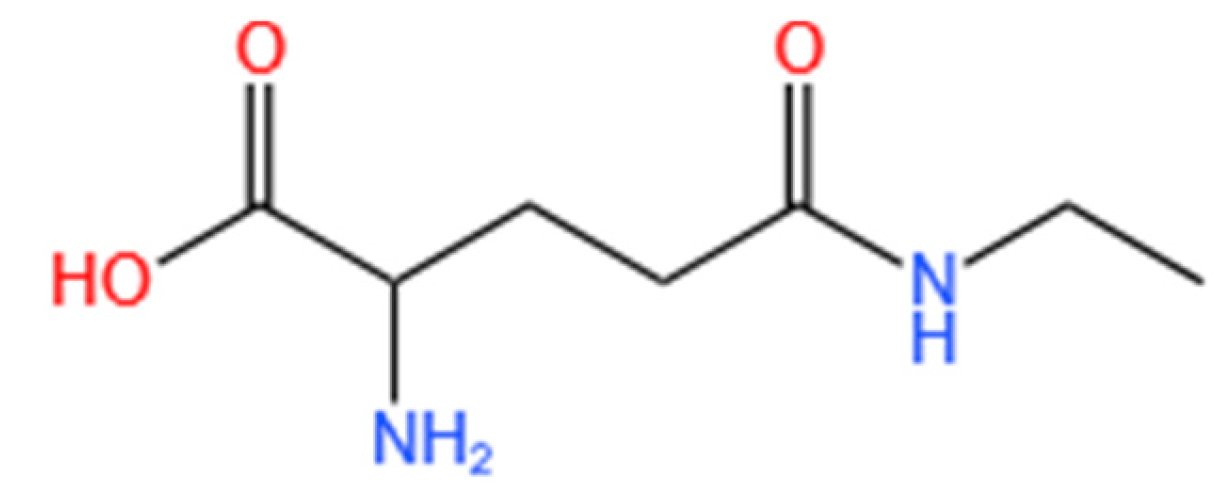
Theanine (N-ethyl-γ-glutamine) is a non-protein amino acid found in high concentrations in the leaves of Camellia sinensis (green tea) [21]. Recent research has shown that L-theanine exerts various psychotropic effects, including protection against cerebral ischemia-reperfusion injury, stress reduction, anti-tumor activity, anti-aging properties, anti-anxiety, and antioxidant effects [22,23,24]. Despite the anti-melanogenic effects of green tea [25], research focusing on the role of L-theanine in inhibiting melanin production is limited. The present study aims to analyze the melanogenesis-inhibition effect of L-theanine and to reveal its possible regulatory mechanism.
Figure 1.
Chemical structures of L-theanine re-drawn using ChemDraw Ultra 11.0 software (Cambridge Soft Corporation, Cambridge, USA).
Figure 1.
Chemical structures of L-theanine re-drawn using ChemDraw Ultra 11.0 software (Cambridge Soft Corporation, Cambridge, USA).
2. Results
2.1. Effects of L-Theanine on the Viability, Melanin Content, and Intracellular Tyrosinase Activity of B16F10 Cells
Tyrosinase plays a crucial role in melanin biosynthesis. L-Theanine exerted no inhibitory effect on mushroom tyrosinase activity in vitro (data not shown). Therefore, B16F10 cells were used to evaluate the effects of L-theanine on melanin content and intracellular tyrosinase activity. To initially assess the potential cytotoxicity of L-theanine, B16F10 cells were incubated with different concentrations L-theanine (0.3-6 mM) for 24 h. Cell viability was measured using the MTT assay. As shown in Figure 2a, no obvious cytotoxic effects on b16F10 cells were observed at concentrations of up to 3 mM. Therefore, L-theanine concentrations below 3 mM were used for further experiments.
Intracellular tyrosinase activity and melanin content were measured in B16F10 cells for 24 h treatment with or without different concentrations of L-theanine (0.6–3 mM) or α-MSH (1 μM). As shown in Figure 2b and Figure 2c, L-theanine significantly reduced intracellular tyrosinase activity and melanin content. This suggested that the decrease in melanin content may be due to the reduction in Tyrosinase activity.
2.2. Effect of L-Theanine on the Expression Levels of Melanogenesis-Related Proteins in B16F10 Cells
Melanin production can reportedly be affected by the protein levels of melanogenic enzymes such as TYR, TRP-1, and DCT. MITF, a major transcription factor, regulates the expression of melanogenic enzymes during melanoigenesis [26]. Western blot analysis was performed to investigate the effect of L-theanine on melanogenic enzymes expression in B16F10 cells. The protein levels of TYR, TRP-1, TRP-2, and MITF were significantly decreased by L-theanine (Figure 3). These findings suggested that L-theanine decreased melanin content by reducing the expression of melanogenic enzymes, which was attributed to reduced MITF expression.
2.3. L-Theanine Reduced Melanogenesis Through the PKA/CREB Signaling Pathway
α-MSH activated PKA, leading to the phosphorylation and upregulation of CREB in melanocytes. Phosphorylated CREB directly induces the MITF transcription to promote melanogenesis [27]. This study explored whether L-theanine inhibited melanogenesis through the PKA/CREB signaling pathway in B16F10 cells. Results showed that phosphorylated PKA and CREB protein levels were inhibited (Figure 4), suggesting that CREB inhibition was affected by PKA. Thus, the L-theanine-induced downregulation of melanongenesis may be mediated by the PKA-CREB signal pathway.
2.4. L-Theanine Reduced Melanogenesis Through the Akt/GSK-3β/β-Catenin Signaling Pathway
PI3K/AKT and GSK-3β pathways negatively regulate MITF activity, leading to the suppression of melanogenesis [28]. GSK-3β activated by phosphorylation facilitates β-catenin phosphorylation and degradation, leading to a reduction in MITF expression [29]. Accordingly, we examined whether L-theanine inhibited melanogenesis through the Akt/GSK-3β/β-catenin signaling pathway in B16F10 cells. Western analyses revealed that phosphorylated Akt protein level was promoted and phosphorylated GSK-3β and β-catenin protein level was inhibited (Figure 5). Results suggested that the inhibitory effect of L-theanine on melanogenesis may be mediated by the Akt/GSK-3β/β-catenin signal pathways.
2.5. Effects of L-Theanine on Melanin Pigmentation In Vivo Zebrafish Assay
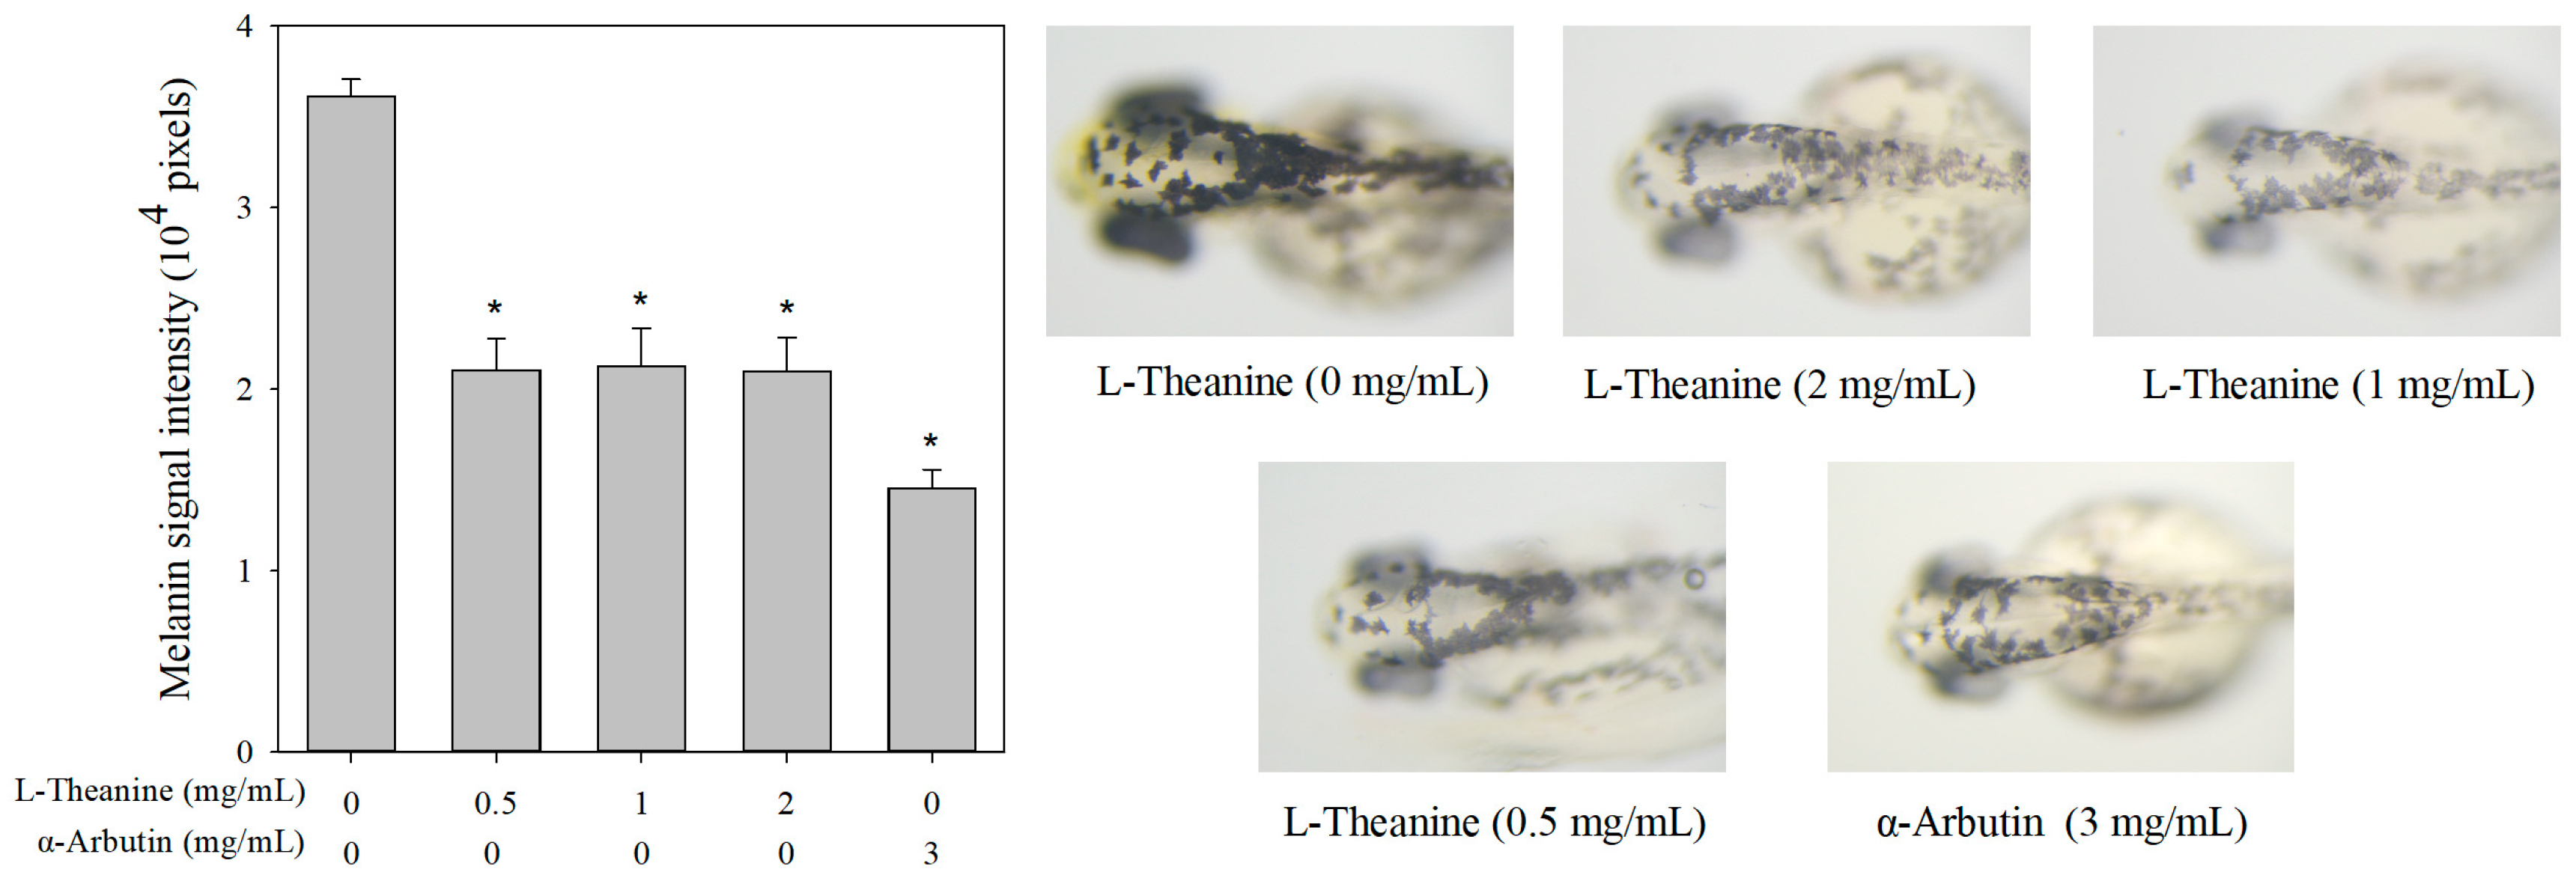
Zebrafish has been established as a key vertebrate model for exploring the depigmentation activities of melanogenic regulatory compounds [30]. To examine the potential effects of L-theanine on melanogenesis in vivo, a zebrafish assay was used. At concentrations below 2 mg/mL, L-theanine did not affect the survival of zebrafish embryos or larvae and has no impact on their development or phenotype (Table S1). Additionally, L-theanine showed a significant inhibitory effect on melanin production in zebrafish compared with the control group, but no significant difference among different concentrations was found (Figure 6).
3. Discussion
L-Theanine provides numerous physiological and pharmacological benefits, so it is widely utilized in the food and pharmaceutical industries [31]. Based on the in vitro mushroom tyrosinase activity-inhibition test, L-theanine did not exert any inhibitory effect (data not shown). B16F10 cells were used to evaluate the inhibitory effects of L-theanine on melanin production. Accordingly, we assessed L-theanine's potential as a hypopigmenting agent for cosmetic applications.
First, at concentrations below 3 mM, L-theanine showed no significant cytotoxic effect on B16F10 cells, whereas melanin content and intracellular tyrosinase activity decreased. L-Theanine also reduced the protein levels of TYR, TRP-1, DCT, and MITF. Several studies have demonstrated that upstream signaling pathways regulate MITF expression, which in turn influences the activity of melanogenesis-related protein, ultimately controlling melanin production [18,32]. All these data suggested that L-theanine inhibited MITF expression, which in turn reduced the levels of TYR, TRP-1, and DCT. The ultimate outcome was decreased melanin production in B16F10 cells.
L-Theanine further reduced the protein levels of phospholyrated PKA and CREB in α-MSH-induced B16F10 cells. Consistent with Zhou’s finding [33], L-theanine inhibited PKA activity, reduced CREB phosphorylation, and subsequently downregulated MITF expression. Additionally, the Akt/GSK-3β/β-catenin signaling pathway played a role in regulating melanin production. L-theanine increased phosphorylated Akt levels and reduced phosphorylated GSK-3β and β-catenin levels. The effects of L-theanine were similar to previous findings [34,35], showing its ability to modulate the Akt/GSK-3β/β-catenin signaling pathway and thus reduce melanogenesis. In vivo zebrafish test results reveals that L-theanine can reduce melanin production, similar to Huang’s study [36].
Otherwise, no significant differences were found in the protein levels of phosphorylated ERK, JNK, and p38 MAPKs (Figure S1). The MAPK signaling pathways can not affect melanin production in B16F10 cells treated with L-theanine.
The above findings suggested that in B16F10 cells, L-theanine regulated melanogenesis-related proteins by modulating the PKA/CREB and Akt/GSK-3β/β-catenin pathways, ultimately reducing melanogenesis. In vivo zebrafish assay results further confirmed that L-theanine can reduce melanin production. Therefore, L-theanine can be a good whitening agent in the cosmetic industry.
4. Materials and Methods
4.1. Materials
L-theanine was purchased by Shanghai Macklin Biochemical Co., Ltd. Mushroom tyrosinase, α-arbutin, α-MSH and 3,4-dihydroxyphenylalanine (L-DOPA) were purchased from Sigma-Aldrich. Primary antibodies against MITF, TYR, DCT, ERK, p-ERK (T202/T185), JNK, p-JNK, p38, p-p38, CREB, p-CREB (S133), GSK-3β, p-GSK-3β(S9), PKC-β, p-PKC-β, β-catenin, and β-actin were purchased from ABclonal. TRP-1 was from Abcam. p-β-catenin (S675) were from Cell Signaling Technology. All other chemicals, unless specified otherwise, were obtained from Sigma-Aldrich.
4.2. Cell Culture
B16F10 murine melanoma cells were purchased from the BeNa Culture Collection (Anhui, China). The cells were incubated in Dulbecco’s modified Eagle’s medium (DMEM) supplemented with 10% fetal bovine serum and 1% penicillin/streptomycin in a humidified atmosphere with 5% CO2 at 37 °C.
4.3. Cell Viability Assay
The MTT assay was used to assess the cell viability, with 100 µL cells (1 x 10⁵ cells/mL) was added to 96-well tissue culture plates and treated with various concentrations (0.6 - 3 mM) of L-theanine for 24 h. After incubation, 10µL DTT solution (5 mg/mL) was added for 4 h, and the absorbance at 570 nm was measured. The cell viability of the control group (0 µg/mL L-theanine) was set as 100%, and the experimental groups were compared against this control.
4.4. Melanin Content and Intracellular Tyrosinase Activity Assay
The cells were treated with 1 μM α-MSH and different sample at 37°C for 24 h. The control group was treated without α-MSH and L-theanine. The α-MSH group was treated with α-MSH without the addition of L-theanine. After being washed twice with PBS, the cells were lysed in 200 μL of 0.5% Triton X-100 in PBS at 4°C for 30 minutes. Following centrifugation at 12,000 rpm for 5 min, the supernatant was removed and stored at -20°C. The precipitate was solubilized in 200 μL of 1 N NaOH containing 10% dimethyl sulfoxide (DMSO) at 100°C for 30 minutes. The absorbance at 475 nm was measured.
The supernatant was used to assess intracellular tyrosinase activity. The supernatant (50 μL) and L-DOPA (5 mM, 150 μL) were mixed in a 96-well microplate. After incubation at 37°C for 30 minutes, the absorbance was read at 475 nm.
The supernatant protein was measured by the BCA assay. Melanin content and intracellular tyrosinase activity were calculated and corrected for the concentration of protein. The control was established as 100%, allowing for comparison between the experimental groups.
4.5. Western Blotting Assay
The cells were treated as described previously above. Cells were lysed by RIPA buffer and centrifuged at 12,000 rpm for 10 minutes at 4°C. The protein (20 μg) was separated with 12% sodium dodecyl sulfate polyacrylamide gel electrophoresis (SDS-PAGE) and transferred to the polyvinylidene difluoride (PVDF) membrane. The PVDF membrane was incubated for 1 h Tris-buffered saline (TBS) containing 5% bovine serum albumin and 0.1% Tween 20. The membrane was incubated with the primary antibody for 24 h at 4°C. ɑ-Actin was used as an internal control. After washing twice with TBS containing 0.1% Tween 20, the membrane was incubated with horseradish peroxidase-conjugated anti-mouse or anti-rabbit secondary antibodies for 1 h at room temperature. Protein band detection on the PVDF membrane was performed using NcmECL Ultra reagent and a BIO-RAD CheniDocTM XRS+ Imaging System. The relative intensity of the protein band was quantified using ImageJ software (NIH, Bethesda, MD, USA) and the value was normalized to that of the corresponding loading control. The control was regarded as 100%. * p < 0.05 as compared to the control group.
4.6. Determination of Zebrafish Embryo Mortality Rate
Zebrafish embryos (Hunter Biotech Inc., Zhejiang, China) were collected 24 hours post-fertilization and cultured in a constant-temperature incubator at 28°C, with a 14:10 h light–dark cycle [36]. Culture media containing different concentrations of sample were prepared. A total of 30 zebrafish embryos were tested in each sample. After 72 hours of culture, the number of dead embryos was recorded, and their developmental status was assessed.
4.7. Evaluation of Antimelanogenesis Effect in Zebrafish
After assessing the survival rate, it was determined that a concentration of 6 mM L-theanine did not induce death in zebrafish embryos. 30 embryos (6h post-fertilization) were placed in wells, treated with various final concentrations of the specimens, and incubated at 28°C for 48 hours. α-Arbutin was used as a positive control. Digital images of 10 randomly selected live zebrafish from each experimental group were taken using a stereomicroscope (Olympus SZX7, Japan). The melanin content of the zebrafish larvae was then analyzed using ImageJ software.
4.8. Statistical Analysis
The data are presented as the mean ± SEM for in vitro and in vivo experiments. Statistical significance was determined using one-way analysis of variance (ANOVA) followed by Tukey test, performed with GraphPad Prism software (GraphPad Software, Inc., USA). An asterisk (*) indicates a p-value below 0.05, which was considered statistically significant.
Supplementary Materials
The following supporting information can be downloaded at the website of this paper posted on Preprints.org, Figure S1: Effect of L-theanine on the protein expression levels of ERK 1/2, p-ERK 1/2, JNK 1/2/3, p-JNK 1/2/3, p-p38 MAPK and p38 MAPK in B16F10 cells. Cells were treated with the indicated concentrations for 24 h, and ɑ-MSH (1 μM) served as a positive control. (a, b)Western blot showed the protein levels of ERK 1/2, p-ERK 1/2, JNK 1/2/3, p-JNK 1/2/3, p-p38 MAPK and p38 MAPK. Densitometric analysis of (c) p-ERK 1/2/ERK 1/2, (d) p-JNK 1/2/3/JNK 1/2/3 and (e) p-p38 MAPK/p-38 MAPK expressed as the mean ± SD, representing three independent tests. The asterisk (*) means p < 0.05 compared with the positive control. Table S1: Mortality Rates of Zebrafish Larvae (n=30).
Author Contributions
Conceptualization, C.Y. and G.W.; methodology, H.P.; validation, C.Y., H.P. and Z.R.; formal analysis, G.W.; investigation, Z.R.; resources, G.W.; data curation, H.P.; writing—original draft preparation, C.Y.; writing—review and editing, H.P. and G.W.; supervision, C.Y.; project administration, H.P.; funding acquisition, C.Y. All authors have read and agreed to the published version of the manuscript.” Please turn to the CRediT taxonomy for the term explanation. Authorship must be limited to those who have contributed substantially to the work reported.
Funding
Please add: This research was funded by XIAMEN MEDICAL COLLEGE, grant number K2020-10, and NATURAL SCIENCE FOUNDATION of XIAMEN, CHINA, grant number 3502Z202373127.
Institutional Review Board Statement
The animal study protocol was approved by the Ethics Committee of The Medical Ethics Committee of Xiamen Medical College (Approval Code: 20240306014, Approval Date: 2024.3.6)
Informed Consent Statement
Not applicable.
Data Availability Statement
Data is contained within the article or supplementary material.
Acknowledgments
We extend our gratitude to the Pharmaceutical Research Laboratory at Xiamen Medical College for their equipment support during this research.
Conflicts of Interest
The authors declare no conflict of interest.
References
- D'Mello, S.A.; Finlay, G.J.; Baguley, B.C.; Askarian-Amiri, M.E. Signaling Pathways in Melanogenesis. Int J Mol Sci 2016, 17. [CrossRef]
- Nasti, T.H.; Timares, L. MC1R, eumelanin and pheomelanin: their role in determining the susceptibility to skin cancer. Photochem Photobiol 2015, 91, 188-200. [CrossRef]
- Zolghadri, S.; Bahrami, A.; Hassan Khan, M.T.; Munoz-Munoz, J.; Garcia-Molina, F.; Garcia-Canovas, F.; Saboury, A.A. A comprehensive review on tyrosinase inhibitors. J Enzyme Inhib Med Chem 2019, 34, 279-309. [CrossRef]
- Pillaiyar, T.; Manickam, M.; Namasivayam, V. Skin whitening agents: medicinal chemistry perspective of tyrosinase inhibitors. J Enzyme Inhib Med Chem 2017, 32, 403-425. [CrossRef]
- Pollock, S.; Taylor, S.; Oyerinde, O.; Nurmohamed, S.; Dlova, N.; Sarkar, R.; Galadari, H.; Manela-Azulay, M.; Chung, H.S.; Handog, E.; et al. The dark side of skin lightening: An international collaboration and review of a public health issue affecting dermatology. International Journal of Women's Dermatology 2021, 7, 158-164. [CrossRef]
- Liu, S.-C.; Sheu, M.-L.; Tsai, Y.-C.; Lin, Y.-C.; Chang, C.-W.; Lai, D.-W. Attenuation of in vitro and in vivo melanin synthesis using a Chinese herbal medicine through the inhibition of tyrosinase activity. Phytomedicine 2022, 95, 153876. [CrossRef]
- Kim, T.; Kang, J.-K.; Hyun, C.-G. 6-Methylcoumarin promotes melanogenesis through the PKA/CREB, MAPK, AKT/PI3K, and GSK3β/β-catenin signaling pathways. Molecules 2023, 28, 4551. [CrossRef]
- Lee, A.; Kim, J.Y.; Heo, J.; Cho, D.-H.; Kim, H.-S.; An, I.-S.; An, S.; Bae, S. The inhibition of melanogenesis via the PKA and ERK signaling pathways by Chlamydomonas reinhardtii extract in B16F10 melanoma cells and artificial human skin equivalents. Journal of microbiology and biotechnology 2018, 28, 2121-2132. [CrossRef]
- Jeong, H.; Yu, S.M.; Kim, S.J. Inhibitory effects on melanogenesis by thymoquinone are mediated through the β-catenin pathway in B16F10 mouse melanoma cells. Int J Oncol 2020, 56, 379-389. [CrossRef]
- Pillaiyar, T.; Manickam, M.; Jung, S.-H. Inhibitors of melanogenesis: a patent review (2009–2014). Expert opinion on therapeutic patents 2015, 25, 775-788. [CrossRef]
- Lonati, C.; Gatti, S.; Catania, A. Activation of melanocortin receptors as a potential strategy to reduce local and systemic reactions induced by respiratory viruses. Frontiers in Endocrinology 2020, 11, 569241. [CrossRef]
- Bullock, B.P.; Habener, J.F. Phosphorylation of the cAMP response element binding protein CREB by cAMP-dependent protein kinase A and glycogen synthase kinase-3 alters DNA-binding affinity, conformation, and increases net charge. Biochemistry 1998, 37, 3795-3809. [CrossRef]
- Cross, D.A.; Alessi, D.R.; Cohen, P.; Andjelkovich, M.; Hemmings, B.A. Inhibition of glycogen synthase kinase-3 by insulin mediated by protein kinase B. Nature 1995, 378, 785-789. [CrossRef]
- Khaled, M.; Larribere, L.; Bille, K.; Aberdam, E.; Ortonne, J.-P.; Ballotti, R.; Bertolotto, C. Glycogen synthase kinase 3β is activated by cAMP and plays an active role in the regulation of melanogenesis. Journal of Biological Chemistry 2002, 277, 33690-33697. [CrossRef]
- Takeda, K.; Yasumoto, K.-i.; Takada, R.; Takada, S.; Watanabe, K.-i.; Udono, T.; Saito, H.; Takahashi, K.; Shibahara, S. Induction of melanocyte-specific microphthalmia-associated transcription factor by Wnt-3a. Journal of Biological Chemistry 2000, 275, 14013-14016. [CrossRef]
- Ko, H.H.; Chang, Y.T.; Kuo, Y.H.; Lin, C.H.; Chen, Y.F. Oenothera laciniata Hill Extracts Exhibits Antioxidant Effects and Attenuates Melanogenesis in B16-F10 Cells via Downregulating CREB/MITF/Tyrosinase and Upregulating p-ERK and p-JNK. Plants (Basel) 2021, 10. [CrossRef]
- Kim, D.S.; Hwang, E.S.; Lee, J.E.; Kim, S.Y.; Kwon, S.B.; Park, K.C. Sphingosine-1-phosphate decreases melanin synthesis via sustained ERK activation and subsequent MITF degradation. J Cell Sci 2003, 116, 1699-1706. [CrossRef]
- Chung, Y.C.; Kim, M.-J.; Kang, E.Y.; Kim, Y.B.; Kim, B.S.; Park, S.-M.; Hyun, C.-G. Anti-melanogenic effects of hydroxyectoine via mitf inhibition by jnk, p38, and akt pathways in b16f10 melanoma cells. Natural Product Communications 2019, 14, 1934578X19858523. [CrossRef]
- Bu, J.; Ma, P.C.; Chen, Z.Q.; Zhou, W.Q.; Fu, Y.J.; Li, L.J.; Li, C.R. Inhibition of MITF and tyrosinase by paeonol-stimulated JNK/SAPK to reduction of phosphorylated CREB. Am J Chin Med 2008, 36, 245-263. [CrossRef]
- Yu, C.-L.; Wu, H.; Chen, Y.-P.; Chen, F.; Wang, G.-H. Orcinol Inhibits Melanogenesis in B16F10 Cells via the Upregulation of the MAPK/ERK Signaling Pathway. Natural Product Communications 2023, 18, 1934578X231156704. [CrossRef]
- Deng, W.-W.; Ogita, S.; Ashihara, H. Distribution and biosynthesis of theanine in Theaceae plants. Plant Physiology and Biochemistry 2010, 48, 70-72. [CrossRef]
- Butt, M.S.; Ahmad, R.S.; Sultan, M.T.; Qayyum, M.M.N.; Naz, A. Green tea and anticancer perspectives: updates from last decade. Critical reviews in food science and nutrition 2015, 55, 792-805. [CrossRef]
- Cooper, R. Green tea and theanine: health benefits. International journal of food sciences and nutrition 2012, 63, 90-97.
- Crespy, V.; Williamson, G. A review of the health effects of green tea catechins in in vivo animal models. The Journal of nutrition 2004, 134, 3431S-3440S. [CrossRef]
- Kim, Y.C.; Choi, S.Y.; Park, E.Y. Anti-melanogenic effects of black, green, and white tea extracts on immortalized melanocytes. Journal of Veterinary Science 2015, 16, 135-143. [CrossRef]
- Xu, W.; Gong, L.; Haddad, M.M.; Bischof, O.; Campisi, J.; Yeh, E.T.; Medrano, E.E. Regulation of microphthalmia-associated transcription factor MITF protein levels by association with the ubiquitin-conjugating enzyme hUBC9. Exp Cell Res 2000, 255, 135-143. [CrossRef]
- Flaherty, K.T.; Hodi, F.S.; Fisher, D.E. From genes to drugs: targeted strategies for melanoma. Nature Reviews Cancer 2012, 12, 349-361. [CrossRef]
- Hwang, E.; Lee, T.H.; Lee, W.J.; Shim, W.S.; Yeo, E.J.; Kim, S.; Kim, S.Y. A novel synthetic Piper amide derivative NED-180 inhibits hyperpigmentation by activating the PI 3K and ERK pathways and by regulating Ca2+ influx via TRPM 1 channels. Pigment cell & melanoma research 2016, 29, 81-91. [CrossRef]
- Han, H.; Hyun, C. Acenocoumarol, an anticoagulant drug, prevents melanogenesis in B16F10 melanoma cells. Pharmaceuticals 2023, 16, 604. [CrossRef]
- Qu, J.; Yan, M.; Fang, Y.; Zhao, J.; Xu, T.; Liu, F.; Zhang, K.; He, L.; Jin, L.; Sun, D. Zebrafish in dermatology: a comprehensive review of their role in investigating abnormal skin pigmentation mechanisms. Frontiers in Physiology 2023, 14, 1296046. [CrossRef]
- Mu, W.; Zhang, T.; Jiang, B. An overview of biological production of L-theanine. Biotechnology advances 2015, 33, 335-342. [CrossRef]
- Chung, Y.C.; Hyun, C.G. Inhibitory Effects of Pinostilbene Hydrate on Melanogenesis in B16F10 Melanoma Cells via ERK and p38 Signaling Pathways. Int J Mol Sci 2020, 21. [CrossRef]
- Zhou, X.; Oh, J.H.; Karadeniz, F.; Yang, J.; Lee, H.; Seo, Y.; Kong, C.-S. Anti-melanogenesis effect of Rosa rugosa on α-MSH-induced B16F10 cells via PKA/CREB pathway activation. Applied Sciences 2022, 13, 184. [CrossRef]
- Ko, G.-A.; Cho, S.K. Ethyl linoleate inhibits α-MSH-induced melanogenesis through Akt/GSK3β/β-catenin signal pathway. The Korean journal of physiology & pharmacology: official journal of the Korean Physiological Society and the Korean Society of Pharmacology 2018, 22, 53.
- Bellei, B.; Pitisci, A.; Catricalà, C.; Larue, L.; Picardo, M. Wnt/β-catenin signaling is stimulated by α-melanocyte-stimulating hormone in melanoma and melanocyte cells: implication in cell differentiation. Pigment cell & melanoma research 2011, 24, 309-325.
- Huang, C.-Y.; Liu, I.-H.; Huang, X.-Z.; Chen, H.-J.; Chang, S.-T.; Chang, M.-L.; Ho, Y.-T.; Chang, H.-T. Antimelanogenesis effects of leaf extract and phytochemicals from ceylon olive (Elaeocarpus serratus) in zebrafish model. Pharmaceutics 2021, 13, 1059. [CrossRef]
Figure 2.
Effects of L-theanine on B16F10 cells. (a) Cell viability. (b) Intracellular tyrosinase activity. (c) Melanin content. The asterisk (*) means p < 0.05 compared with the α-MSH group.
Figure 2.
Effects of L-theanine on B16F10 cells. (a) Cell viability. (b) Intracellular tyrosinase activity. (c) Melanin content. The asterisk (*) means p < 0.05 compared with the α-MSH group.
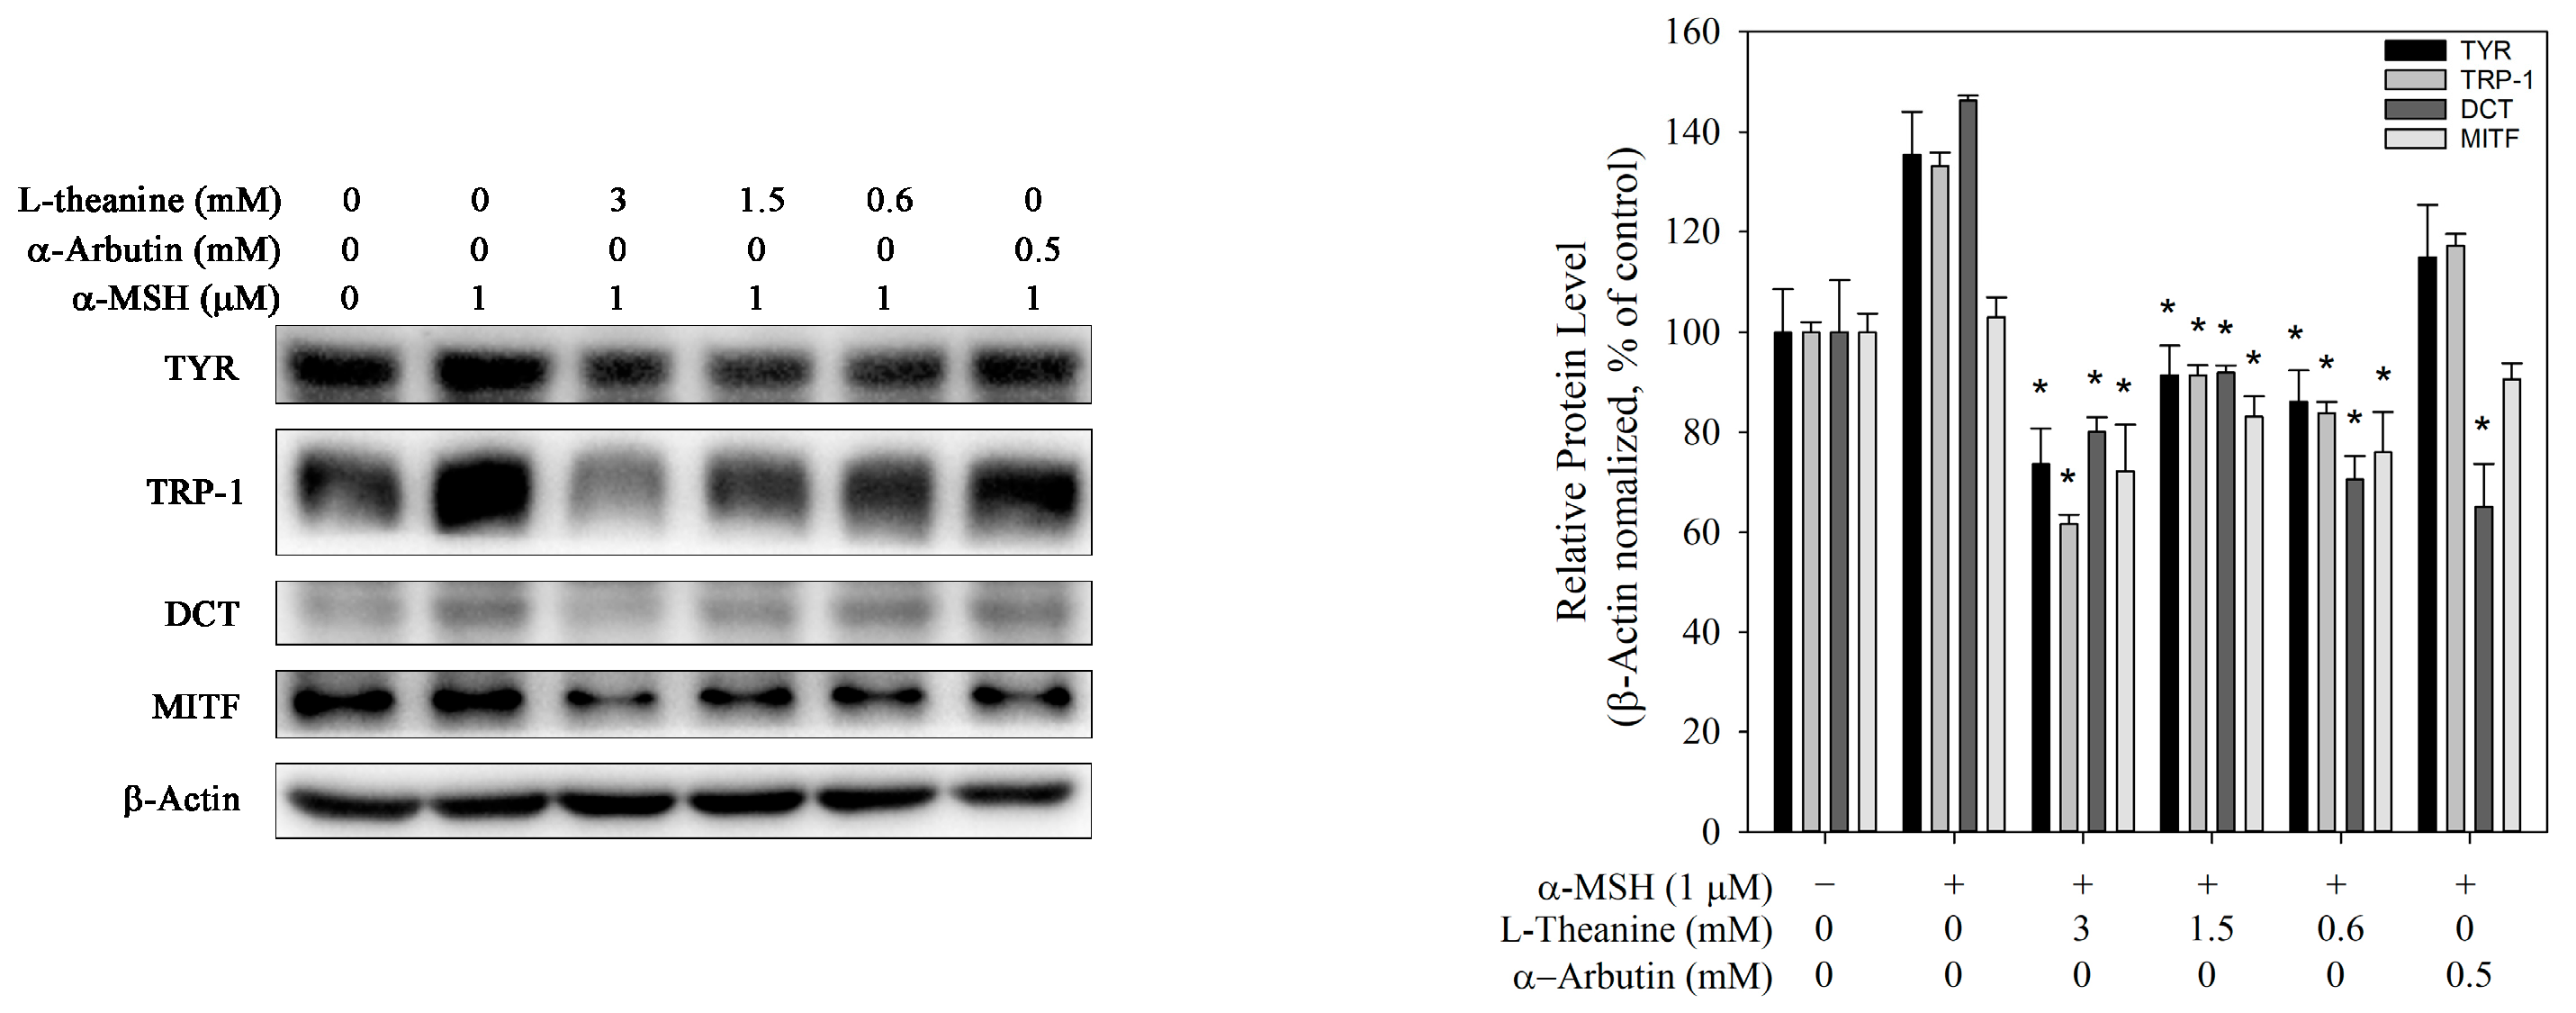
Figure 3.
Effect of L-theanine on the expression levels of melanogenic enzymes (TYR, TRP-1, TRP-2, and MITF) in B16F10 cells. Only α-MSH served as the positive control. Western blot analysis showing the protein levels of TYR, TRP-1, DCT, and MITF, normalized against β-actin expression. The asterisk (*) means p < 0.05 compared with the positive control.
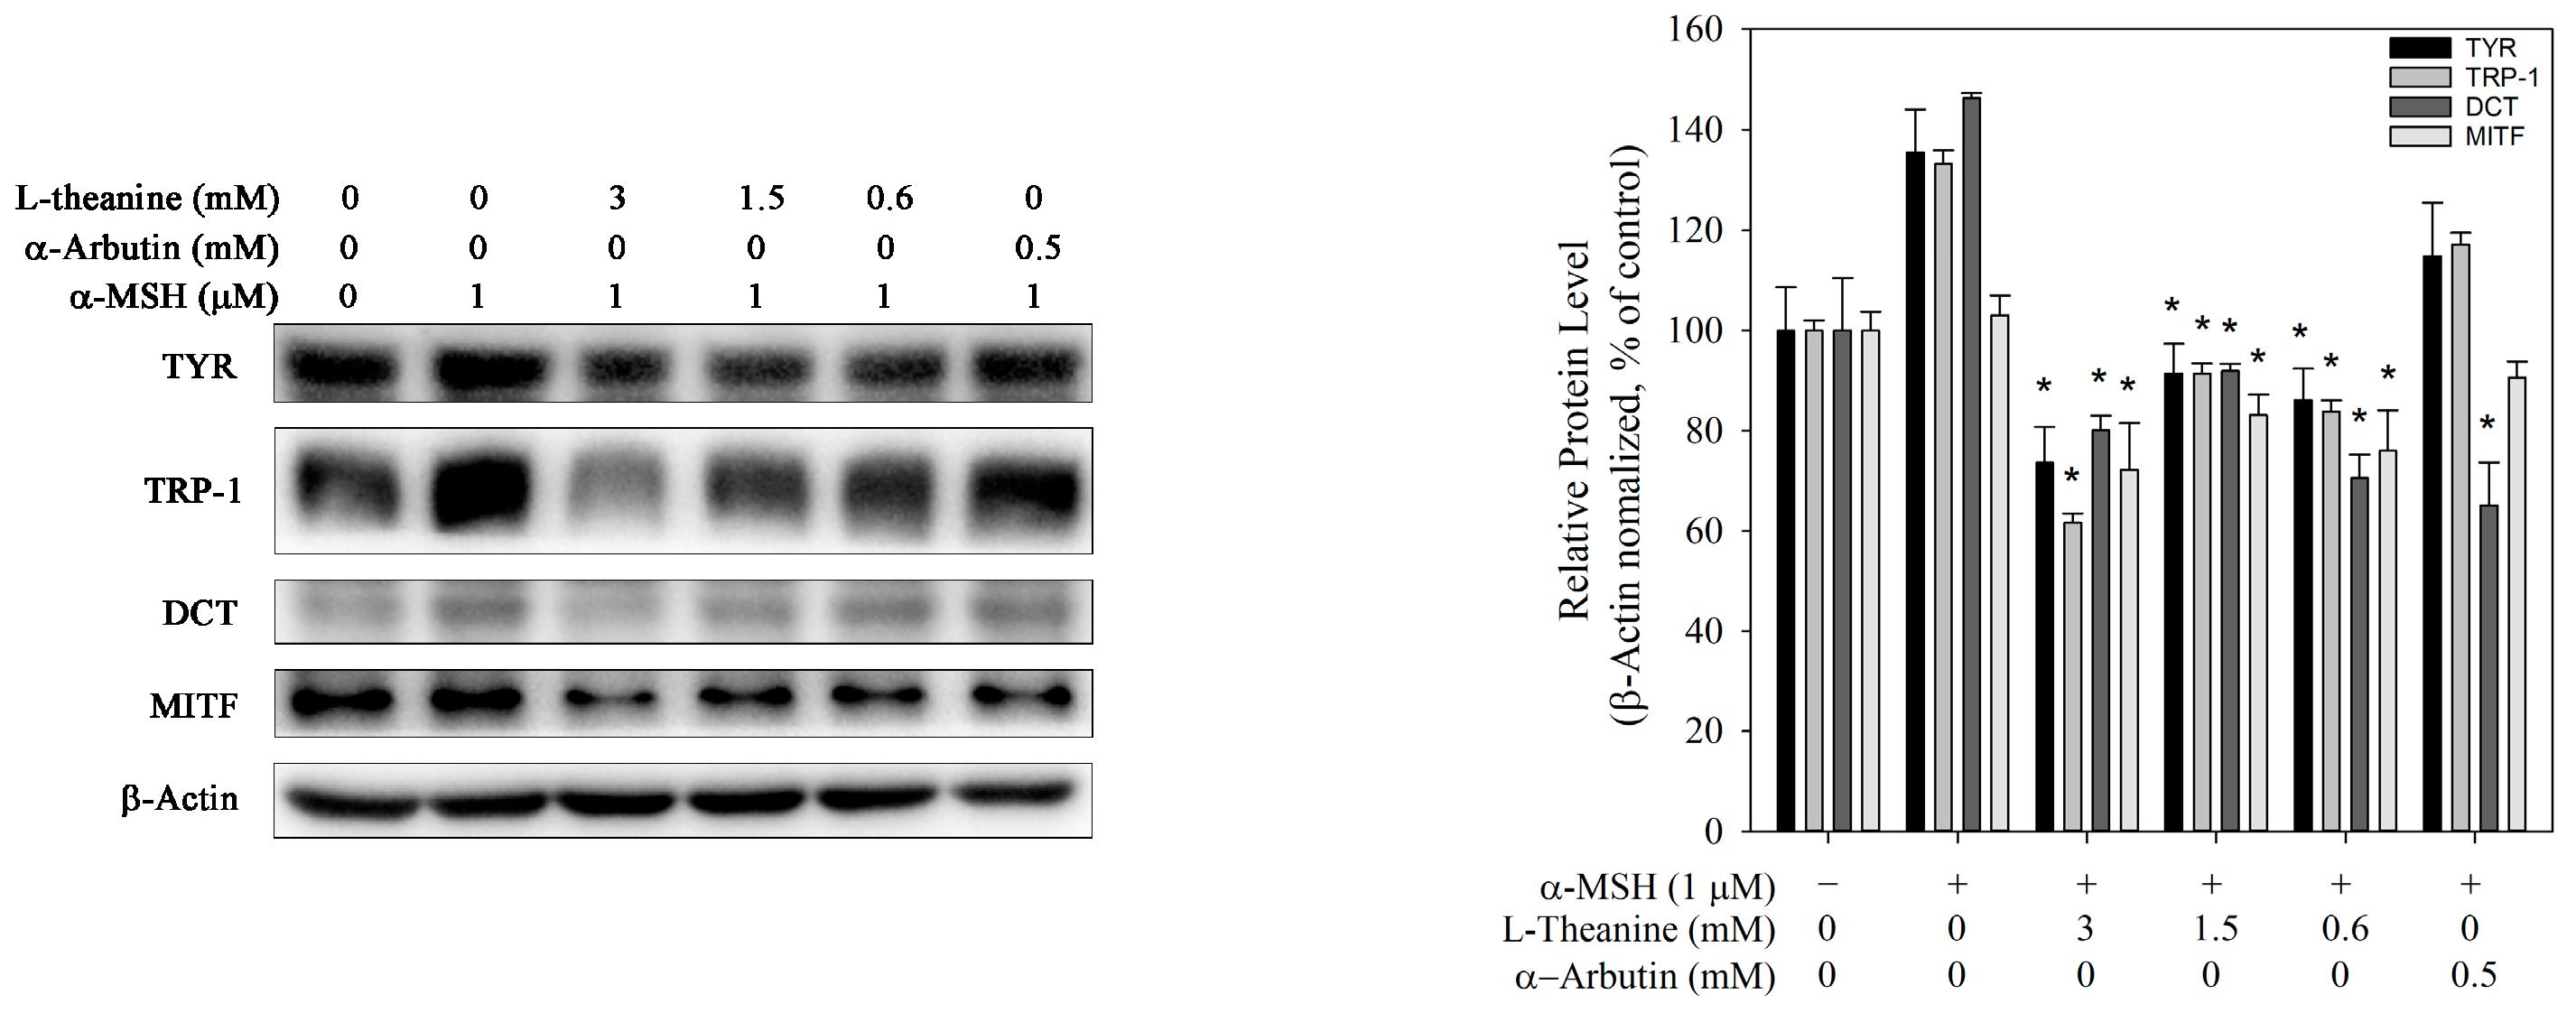
Figure 4.
Effect of L-theanine on the protein expression levels of PKA, p-PKA, CREB, and p-CREB in B16F10 cells. Cells were treated with the indicated concentrations for 24 h, and α-MSH (1 μM) served as a positive control. (a)Western blot showed the protein levels of PKA, p-PKA, CREB, and p-CREB. Densitometric analysis of (b)p-PKA/PKA and (c) p-CREB/CREB expressed as the mean ± SD, representing three independent tests. The asterisk (*) means p < 0.05 compared with the positive control.
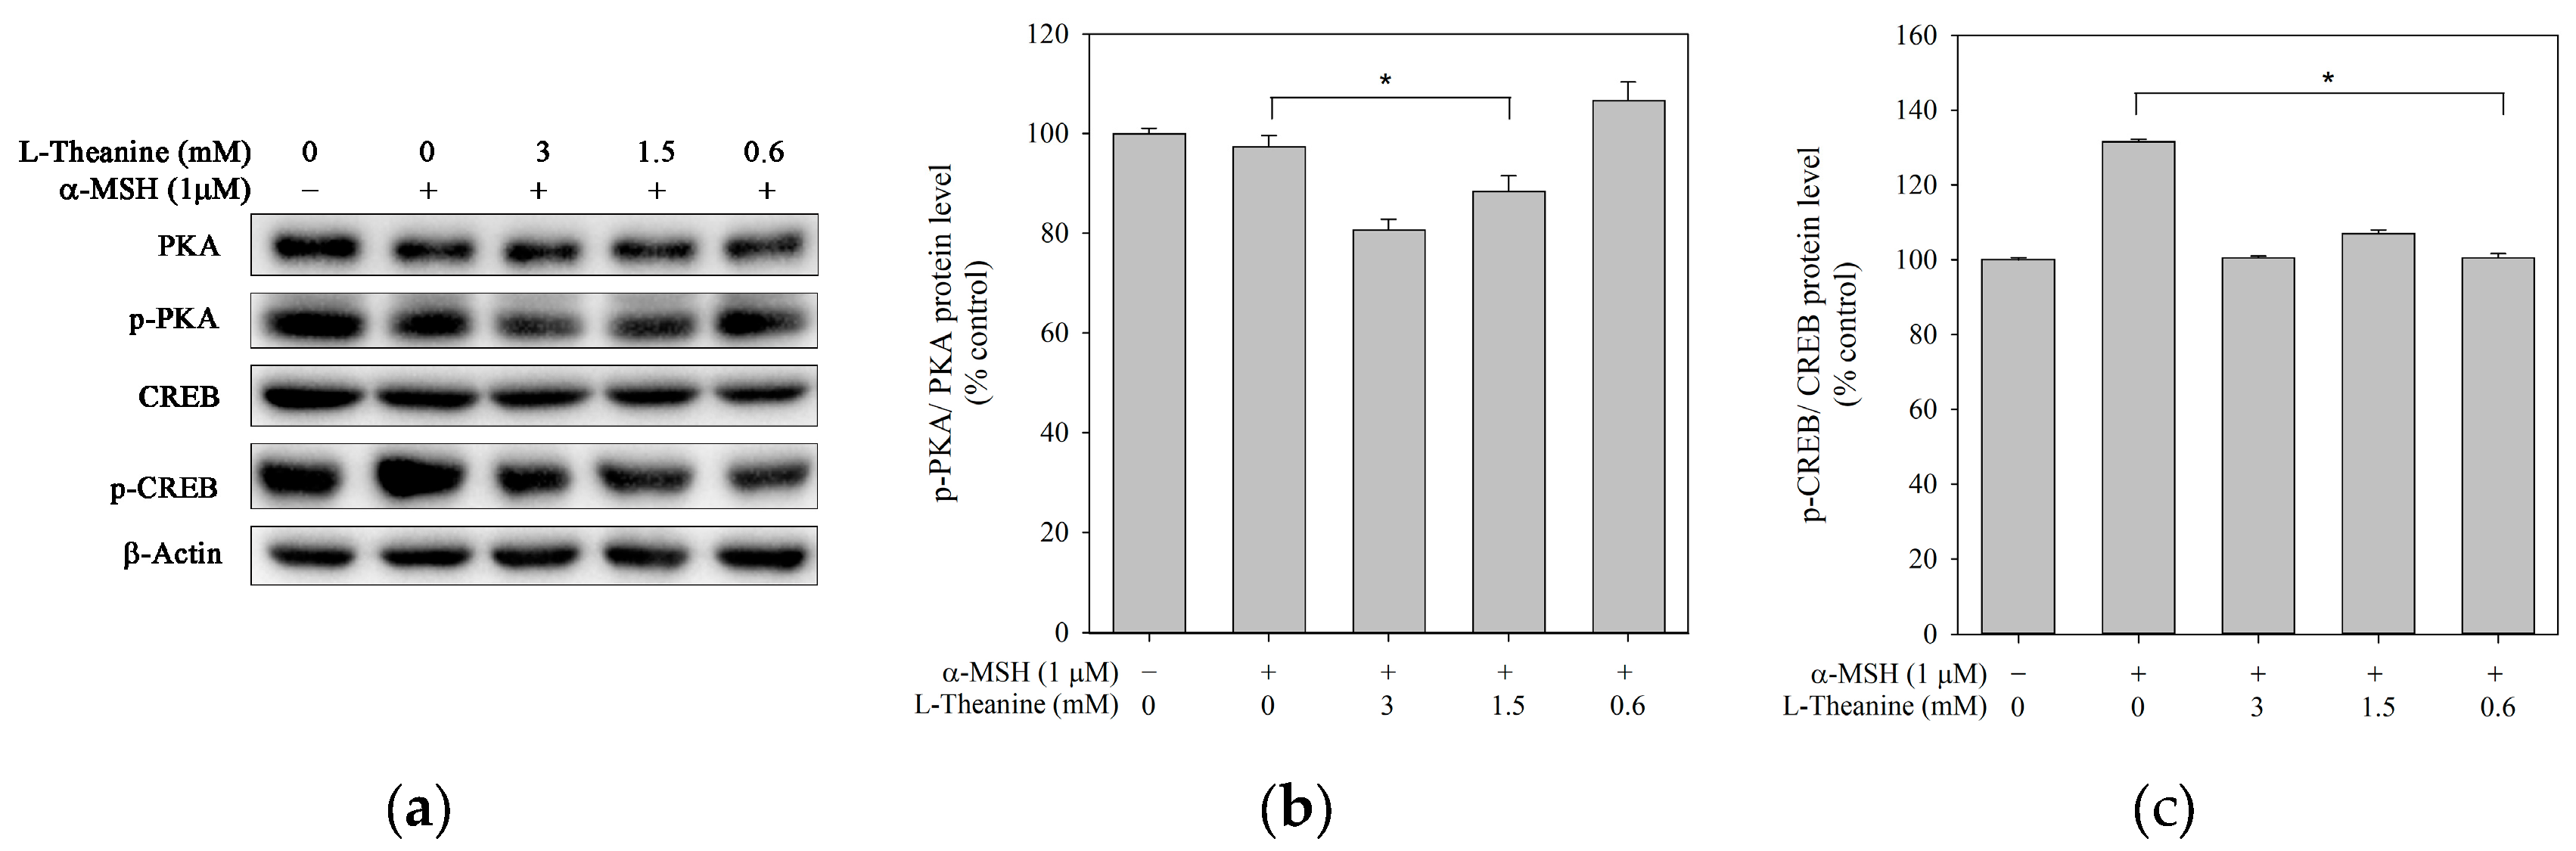
Figure 5.
Effect of L-theanine on the protein expression levels of AKT, p-AKT, GSK-3β, p-GSK-3β, β-catenin, and p-β-catenin in B16F10 cells. Cells were treated with the indicated concentrations for 24 h, and ɑ-MSH (1 μM) served as a positive control. (a,b) Western blot showed the protein levels of AKT, p-AKT, GSK-3β, p-GSK-3β, β-catenin, and p-β-catenin. Densitometric analysis of (c) p-AKT/AKT, (d) p-GSK-3β/GSK-3β and (e) p-β-catenin/β-catenin expressed as the mean ± SD, representing three independent tests. The asterisk (*) means p < 0.05 compared with the positive control.
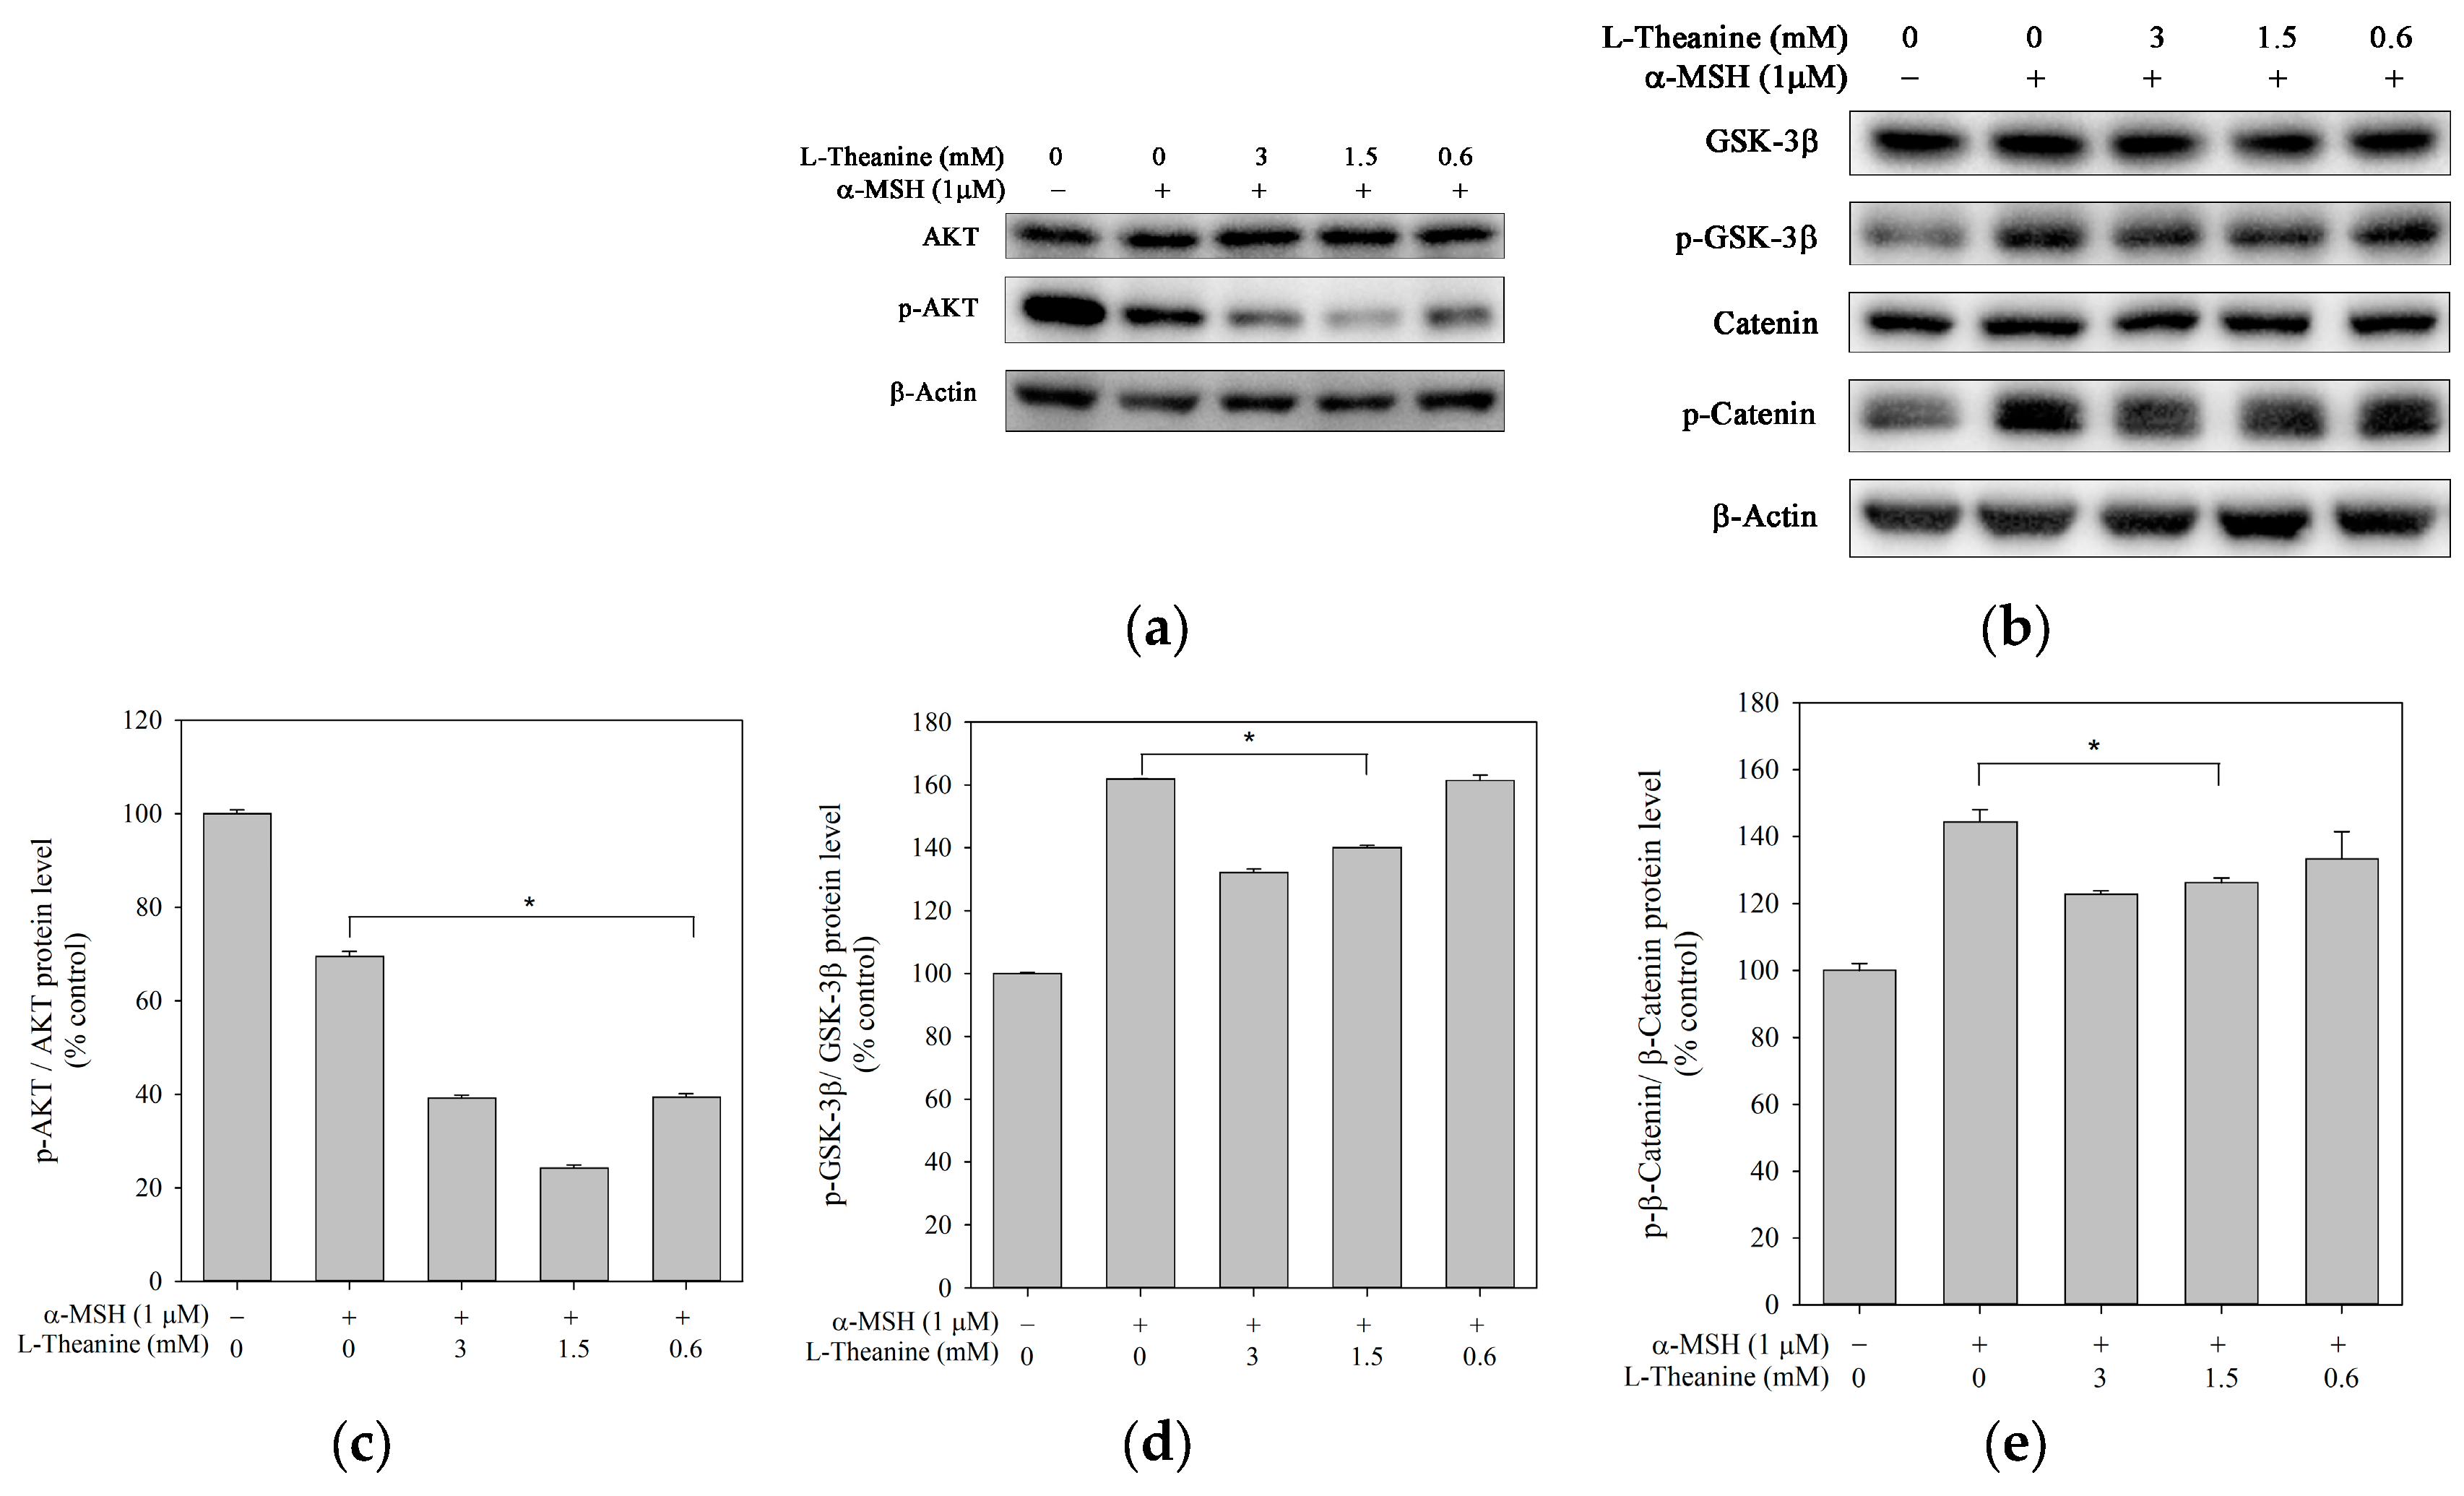
Figure 6.
Estimation and comparison of depigmenting effects of L-theanine and α-arbutin by in vivo zebrafish assay. Comparison of depigmenting effects of L-theanine and α-arbutin on zebrafish larvae, illustrating the changes in pigmentation levels. The melanin signal intensity of the control group (0 mg/mL L-theanine) was set. Results are expressed as mean ± SE and represent ten independent tests. The asterisk (*) means p < 0.05 compared with the control.
Disclaimer/Publisher’s Note: The statements, opinions and data contained in all publications are solely those of the individual author(s) and contributor(s) and not of MDPI and/or the editor(s). MDPI and/or the editor(s) disclaim responsibility for any injury to people or property resulting from any ideas, methods, instructions or products referred to in the content. |
© 2025 by the authors. Licensee MDPI, Basel, Switzerland. This article is an open access article distributed under the terms and conditions of the Creative Commons Attribution (CC BY) license (http://creativecommons.org/licenses/by/4.0/).
Copyright: This open access article is published under a Creative Commons CC BY 4.0 license, which permit the free download, distribution, and reuse, provided that the author and preprint are cited in any reuse.


