Submitted:
31 December 2024
Posted:
03 January 2025
You are already at the latest version
Abstract
Background/Objectives: Considering the physiological analogies between the eye and the kidney, this study aimed to investigate the potential relationship between retinal vascular density, assessed using Optical Coherence Tomography Angiography (OCT-A), and the renal resistive index (RRI) in patients with arterial hypertension. Methods: A total of 82 hypertensive patients were enrolled in the study. Participants underwent routine biochemical evaluations, 24-hour ambulatory blood pressure monitoring, OCT-A imaging, and renal Doppler ultrasound examinations. Results: The mean RRI in the study population was 0.616 ± 0.06. Participants were divided into two groups based on the 75th percentile threshold of RRI distribution. The group with RRI > 75th percentile exhibited Significantly higher mean triglyceride levels and urinary albumin excretion (UAE) a significantly reduced estimated glomerular filtration rate (eGFR) and a higher prevalence of smokers, approaching statistical significance. Among the hemodynamic parameters analysed, 24-hour pulse pressure (PP), daytime and nighttime PP, and nighttime systolic blood pressure (SBP) were significantly higher in the group with RRI > 75th percentile. Regarding retinal vascular density indices, the only significant difference was observed in the deep foveal vascular plexus, which displayed a reduced density in the group with RRI > 75th percentile. Logistic regression analysis revealed that RRI > 75th percentile was independently associated with increased nighttime mean pulse pressure (OR = 1.13, 95% CI: 1.049–1.221, p = 0.0014) and reduced deep foveal vascular density (OR = -0.5026, 95% CI: 1.0493–1.2211, p = 0.0044). Conclusions: Our findings demonstrate that ocular microvascular alterations are associated with RRI, a marker with a well-established prognostic value for renal disease progression and systemic macrovascular dysfunction. These results further substantiate the close relationship between renal and ocular microcirculation.
Keywords:
renal resistive index
; hypertension
; OCT-A
; microcirculation
1. Introduction
Systemic hypertension significantly impacts both the structure and function of the microvascular system[1]. The development of microvascular damage, particularly microvascular rarefaction, is believed to be a crucial pathological feature of hypertension.
Changes in the structure and function of the microvasculature, in addition to being linked to the development of hypertension by influencing flow resistance and tissue perfusion, underlie much of the organ damage associated with arterial hypertension and appear to be crucial to its pathogenesis and progression[2,3].
Since the eye and kidney share common developmental, structural, and pathogenic pathways,changes in eye microcirculation could therefore be correlated with intrarenal hemodynamic damage, which has been associated with endothelial dysfunction, subclinical organ damage, and adverse cardiovascular outcomes, and appears to be a good indicator of systemic morphofunctional arterial impairment, particularly in hypertensive individuals with or without normal renal function[2,4,5,6,7].
The ocular microcirculatory system is readily accessible for clinical and morphological assessment, allowing for repeated and non-invasive examination[8,9]. This provides a unique opportunity to observe the vascular network when impacted by systemic conditions like hypertension, diabetes mellitus, and chronic kidney disease (CKD). The integration of optical coherence tomography angiography (OCTA) into clinical practice has introduced a dependable method for examining retinal and choroidal circulation from a morphological perspective.
Since both renal and ocular microcirculation are influenced by similar mechanisms of hemodynamic and endothelial dysfunction, we aimed to investigate whetherthat changes in the renal resistive index (RRI) could be correlated with alterations in ocular microcirculation. The RRI is a well-established prognostic marker for both renal disease progression and systemic macrovascular alterations[10,11,12].
There is a substantial body of evidence that the arterial stiffness predicts future cardiovascular and total mortality risk in various patient populations and clinical studies have associated its elevation with the development of macrovascular and microvascular damage[13,14,15].
Such a relationship could provide valuable insights into the systemic nature of vascular diseases, where both the kidney and the eye may reflect shared pathophysiological mechanisms, offering potential for early diagnosis and monitoring of cardiovascular and renal conditions.
2. Materials and Methods
The population for this study was selected from patients attending the Nephrology and Hypertension Unit, designated as a Regional and European Center of Excellence for the Study of Arterial Hypertension, at the University of Palermo. Enrollment was conducted in accordance with the following exclusion criteria:
- Age <20 years or >70 years.
- Known diabetes or fasting glucose levels >126 mg/dL.
- Pregnancy.
- Systemic or ocular diseases (e.g., glaucoma, uveitis, high myopia, macular degeneration) or a history of ocular surgeries potentially causing retinal or choroidal damage.
- Nephroparenchymal, renovascular, malignant, or endocrine hypertension, or obstructive sleep apnea syndrome.
- Hereditary or non-hereditary kidney diseases, nephritic syndrome, or overt proteinuria/hematuria.
- Estimated glomerular filtration rate (eGFR) <15 mL/min/1.73 m² or renal replacement therapy (transplant or dialysis).
- Rapid decline in renal function, defined as a >25% reduction in eGFR or a >1.5-fold increase in serum creatinine levels from baseline[16].
- Poor-quality ultrasound imaging or abnormal renal morphology, as previously described[6].
- History or clinical evidence of heart failure (NYHA class II–IV), coronary artery disease, or cerebrovascular disease.
- Major non-cardiovascular conditions (e.g., liver cirrhosis, chronic obstructive pulmonary disease, or a history of malignancies).
- Conditions interfering with reliable blood pressure (BP) measurements using the oscillometric technique, such as atrial fibrillation, frequent ectopic beats, or second/third-degree atrioventricular blocks.
Patients with an arm circumference exceeding 32 cm were not excluded. Instead, appropriately sized cuffs were used to ensure accurate BP measurements.
The study protocol adhered to the principles of the Declaration of Helsinki, and written informed consent was obtained from all participants.
Study Design
A total of 82 patients with arterial hypertension (mean age 48.78 ± 12.61 years; 79% male) were enrolled and underwent the following assessments:
- Routine biochemical evaluations.
- 24-hour ambulatory brachial blood pressure monitoring (ABPM) using an oscillometric BP Lab Vasotens device.
- Optical Coherence Tomography Angiography (OCT-A).
- Renal Doppler ultrasound.
Blood Pressure Measurement
“Clinical” blood pressure (BP) was determined as the average of three consecutive measurements taken at two-minute intervals using an electronic oscillometric device (WatchBP Office, Microlife AG, Widnau, Switzerland) after five minutes of seated rest. For 24-hour ambulatory blood pressure monitoring (ABPM), an oscillometric device (BP Lab Vasotens) was used, adhering to current European Society of Hypertension (ESH) guidelines for proper recording[17]. Measurements were automatically taken at 15-minute intervals during the daytime and at 20-minute intervals during nighttime. The cuff was placed around the non-dominant arm, and patients were instructed to keep the arm still and avoid any movement during the readings. Oscillations within the cuff were recorded during gradual deflation to measure BP.
Biochemical Parameters
Routine biochemical parameters were determined using standard techniques with an automated analyzer. Low-density lipoprotein (LDL) cholesterol levels were calculated using the Friedewald formula. Glomerular filtration rate (GFR) was estimated using the CKD-EPI equation.
Ophthalmological Evaluation
A comprehensive ophthalmological examination was performed on all patients, including corrected visual acuity measurement using Early Treatment Diabetic Retinopathy Study (ETDRS) charts[18]. Intraocular pressure (IOP) was assessed with a Goldmann applanation tonometer. Anterior and posterior segment evaluations were conducted using a slit lamp under pharmacologically induced mydriasis with 1% phenylephrine drops. Retinal imaging was performed using a swept-source optical coherence tomography (SS-OCT) device (Triton; Topcon Inc., Japan).
All scans were conducted by a single operator between 10:00 AM and 12:00 PM. The right eye was examined first, and a standardized scanning protocol was followed. Poor-quality scans were repeated or discarded. Since no significant differences were observed between the two eyes, only one eye per subject was selected for analysis using a random number generator. If the selected eye’s scan quality was deemed insufficient, the contralateral eye was analysed.
Retinal Imaging Protocols
The following OCT scan protocols were used for each eye:
- 3D 7×7H Scan
- Macular Radial 6.0 Scan
- Angio-OCT 4.5 Scan
Retinal thickness (from the internal limiting membrane to the inner surface of the retinal pigment epithelium) and choroidal thickness (from the outer surface of the retinal pigment epithelium to the sclera) were automatically calculated using OCT mapping software. Measurements were presented as mean ± standard deviation across the nine regions defined by the ETDRS study grid.
The ETDRS grid divides the macula and choroid into nine fields. The grid, centered on the fovea, consists of three concentric rings with diameters of 1 mm, 3 mm, and 6 mm. The innermost and outermost rings are further divided into temporal, nasal, inferior, and superior quadrants, enabling detailed topographic analysis.
Quantitative Analysis
OCT angiograms centered on the fovea (4.5 × 4.5 mm; 320 × 320 pixels) were analyzed to evaluate the superficial vascular network and the deep vascular network. The perimeter of the foveal avascular zone (FAZ) was manually delineated by a single operator on all images of the superficial plexus. Using OCT software, the area of the FAZ was automatically calculated.
To minimize statistical error associated with subjective measurements, the final data used in the study were derived from the average of two independent measurements.
Image processing and measurements of retinal vascular density were performed using Image J software, version 1.49 (National Institutes of Health, Bethesda, MD, USA). Retinal vascular network images were generated using an automatic thresholding algorithm. Vascular density was defined as the percentage of the area occupied by blood vessels, with vessels identified as pixels exceeding the defined threshold value.
The calculations were performed on two regions of interest (ROI): the foveal and parafoveal regions. The foveal ROI was defined as a central circle with a diameter of 120 pixels (1.2 mm), while the parafoveal ROI was defined as an annulus 91 pixels wide surrounding the foveal region.
Ultrasound Evaluation
Intrarenal duplex ultrasonography was performed on all patients by a single trained operator blinded to the clinical data. The measurements were obtained using a GE Logiq P5-PRO device with a 4 MHz transducer and a Doppler frequency of 2.5 MHz. Patients were in a supine position, and the Doppler signal was obtained from the interlobar arteries by positioning the sample volume at the cortico-medullary junction.
The Renal Resistive Index (RRI) was calculated using the formula:
RRI=Peak Systolic Velocity - End-Diastolic Velocity/ Peak Systolic Velocity
Values were averaged from six measurements (three per kidney). Doppler angles were maintained at <60°, ensuring no renal compression or Valsalva maneuver, which could artificially elevate RRI.
Renal Function Parameters
In patients with urinalysis showing proteinuria, even in trace amounts, or microalbuminuria detected via semiquantitative dipstick evaluation, a 24-hour urinary albumin excretion assay was requested.
Albuminuria was measured using a turbidimetric method and expressed in mg/day. Serum creatinine levels were determined using a standardized enzymatic method (Creatinine Plus, Roche Diagnostics). The glomerular filtration rate (GFR) was estimated using the CKD-EPI (Chronic Kidney Disease Epidemiology Collaboration) equation.
The study population was stratified into two groups based on intrarenal parenchymal renal resistive index (RRI) values above and below the 75th percentile of the RRI distribution
Statistical Analysis
Statistical analysis was conducted using Medcalc version 15 and IBM-SPSS version 26 software packages. The distribution of continuous variables was evaluated for normality using the Kolmogorov-Smirnov test, which revealed a normal distribution for all variables except urinary albumin excretion and triglyceride levels, which exhibited a positively skewed distribution. These non-normally distributed variables were reported as medians and interquartile ranges and were log-transformed prior to further statistical analysis. Normally distributed continuous variables were presented as means and standard deviations. Categorical variables were expressed as percentages.
Differences between groups were assessed using the independent t-test for continuous variables and the chi-square test, or, when appropriate, Fisher's exact test for categorical variables. Potential confounders were adjusted for using analysis of covariance (ANCOVA).
To examine the relationship between retinal vascular densities and other variables, simple linear regression analysis and Pearson’s correlation coefficients were employed. To assess the independent contribution of retinal vascular densities, multiple linear regression models were constructed with each retinal vascular density variable as the dependent variable and the parameters that demonstrated significant associations with both the renal resistive index (RRI) and retinal vascular densities in univariate analyses as independent variables.
Additionally, logistic regression analysis was conducted, using RRI > or < the 75th percentile as the dependent variable, with retinal vascular densities, blood pressure values, and other clinical parameters as explanatory variables.
The null hypothesis was rejected for all two-tailed tests with p-values < 0.05.
3. Results
The mean RRI in the entire study population was 0.616 ± 0.06.
Table 1 presents the main demographic, anthropometric, and clinical characteristics of both the entire study population and the two groups in which the patients were categorized based on being above or below the 75th percentile of the distribution of RRI.
Table 2 illustrates the distribution of patients undergoing antihypertensive pharmacological treatment, including the various antihypertensive drugs and other interventions targeting the cardiovascular system.
While the percentage of subjects treated for hypertension did not differ significantly between the two groups, a higher prevalence of patients receiving centrally acting antiadrenergic agents was observed in the group with RRI > 75th percentile.
Among the hemodynamic parameters studied, 24-hour pulse pressure during the day and night, as well as nighttime systolic pressure, were higher in the group with RRI> 75th percentile (Table 3). The only significant difference between the two groups was observed in the deep foveal vascular plexus, which showed lower density in the group with a higher RRI.
Regarding the retinal vascular density parameters, the only significant difference between the two groups was observed at the level of the deep foveal vascular plexus, which showed lower density in the group with the higher RRI. See table 4.
This difference remained statistically significant even after correction through analysis of covariance (ANCOVA) for eGFR, mean nighttime pulse pressure, triglyceridemia, and smoking (p = 0.01 and p < 0.001, respectively).
Table 5 presents the statistically significant correlations between the resistance index and various parameters, including demographic factors, markers of renal damage, glomerular filtration rate, nighttime pulse pressure, and deep foveal vascular density.
Particularly strong appeared the inverse relationship between the RRI and the deep foveal density. (Figure 1)
In the group of patients in which the semiquantitative analysis of microalbuminuria was positive, comprising 18 subjects, a significant inverse correlation was observed between the logarithm of urinary albumin excretion and the superficial parafoveal vascular density (r = -0.555; p < 0.001). The small size of this subgroup does not allow us to perform statistical corrections to assess whether this relationship is independent of potential confounding factors.
The association between the resistance index and deep foveal vascular density was tested in multivariate models where, alternately, the resistance index and deep foveal vascular density were considered as dependent variables (see Table 6 and Table 7). In both cases, the relationships between these two variables remained largely significant.
Moreover, in multiple logistic regression analysis, an increase in nighttime mean pulse pressure (OR = 1.1319, CI 1.049–1.221) and a reduction in deep foveal vascular density (OR = 0.5026) (Table 8) are independently associated with a higher likelihood of a resistive index above the 75th percentile.
4. Discussion
It is widely recognized that damage to small vessels exerts a comparable effect on morbidity and mortality, particularly due to the impairment of cerebral and renal microcirculations, which are especially vulnerable to fluctuations in systemic pulsatile blood flow. In this context, albuminuria, although not universally associated with microvascular damage, is regarded as a biomarker of microvascular dysfunction and serves as an independent predictor of both morbidity and mortality[19].
The assessment of macrovascular and microvascular circulation is essential for the timely and accurate diagnosis of vascular abnormalities, playing a critical role in the primary and secondary prevention of cardiovascular diseases, as well as in determining the most effective therapeutic strategies, particularly in patients with hypertension or chronic kidney disease.
In the context of cardiovascular risk, an increased RRI, as an indicator of enhanced microvascular tone, is associated with the degree of renal impairment caused by elevated blood pressure. Several studies in the literature have reported significant correlations between RRI and various cardiovascular risk factors, such as left ventricular hypertrophy and carotid atherosclerosis[20,21,22]. Additionally, significant associations have been observed between renal resistance and aortic stiffness, measured both by pulse wave velocity and central pulse pressure[23].
The retina is a complex structure closely integrated with the body’s cardiovascular system. It is one of the most metabolically active organs and consumes a significant amount of oxygen relative to its weight. A sophisticated network of blood vessels delivers oxygen and nutrients to the various layers of the retina. The inner two-thirds are supplied by capillary networks originating from the central retinal artery. The superficial vascular plexus is located within the ganglion cell layer, while the intermediate and deep vascular plexuses are positioned above and below the inner nuclear layer, collectively referred to as the deep capillary complex[24].
Vascular and/or cardiac dysfunction often impacts retinal health due to its intricate and complex vascular network.
Our study results demonstrate that ocular microvascular alterations, assessed via retinal capillary density analysis using OCTA, are clearly associated with a hemodynamic index obtained through Doppler ultrasound of renal arteries—the intraparenchymal renal resistance index (RRI). The RRI is a well-established prognostic marker for both renal disease progression and systemic macrovascular alterations.
Importantly, this association remains significant after adjusting for potential confounding factors such as glomerular filtration rate (eGFR), nighttime pulse pressure, triglycerides, smoking, and certain drugs. This relationship is biologically plausible due to the physiopathological connections between the kidney and the eye and aligns partially with our previous studies.
In one of these, which included patients with primary nephropathies, we observed a strong inverse relationship between renal function and retinal vascular density[25]. Similarly, findings from Chua et al. corroborate our results, showing an association between deep foveal vascular density and eGFR and office BP[26]. This suggests that systemic hypertension and arterial stiffness may impact one retinal vascular layer differently than the other and we can hypothesize that a sparser network of retinal capillaries, an expression of microvascular rarefaction, could reflect similar alterations in renal microcirculation.
However, these studies did not include an evaluation of renal arteries, as our current study does.
Vascular density in the deep and superficial capillary plexuses has been found to be reduced in patients with hypertension, particularly in the macula in other previous studies[27,28,29,30].
In patients diagnosed with hypertension, stratified by cardiovascular risk based on factors such as the presence of organ damage, blood glucose levels, and adiposity indices, an increased risk correlates with a lower perfusion density in both the superficial and deep capillary plexuses.
Our analysis did not reveal any significant associations with the density of the superficial foveal plexus.
In a meta-analysis of eleven studies, nine published results examined the superficial foveal plexus in 787 eyes of 659 patients with systemic hypertension and 513 eyes of 449 healthy controls. The analysis revealed a significant reduction in vascular density in the eyes of patients with systemic hypertension compared to the control group ([SMD], −0.50 [−0.70, −0.30], P < 0.00001)[30].
Regarding the density of the deep foveal plexus, the same meta-analysis conducted on seven studies, which included a total of 618 eyes from 517 patients with systemic hypertension and 296 eyes from 232 healthy controls, demonstrated a significantly lower vascular density in patients with systemic hypertension compared to healthy controls (SMD, −0.38 [−0.64, −0.13], p = 0.004).
In a subsequent study involving renal artery eco-doppler analysis, we identified an inverse relationship between RRI and choroidal thickness[31].
Moreover, a recent Australian study of 150 hypertensive patients reported a connection between retinal capillary rarefaction, increased albumin-to-creatinine ratio, reduced eGFR, and elevated pulse wave velocity, the latter being a known indicator of vascular stiffness[32]. Although our study did not measure pulse wave velocity, we observed that nighttime pulse pressure, an indirect proxy for stiffness, was significantly and independently correlated with the RRI. This aligns with our previous research demonstrating a close relationship between aortic pulse wave velocity and intrarenal resistance indices[31,33].
The strong relationship between systemic vascular stiffness and intrarenal resistance indices suggests that the observed association between RRI and retinal vascular density may be mediated by increased arterial stiffness. The pulsatile nature of central hemodynamics has a detrimental impact on vital organs. In a healthy cardiovascular system, the elasticity of large arteries buffers pulse and flow oscillations generated by cyclical left ventricular systoles, ensuring continuous microcirculatory flow. However, vascular aging, hypertension, and other cardiovascular risk factors reduce this buffering capacity, exposing the microcirculation to heightened pulsatile stress. This is particularly relevant for organs with high blood flow and low resistance, such as the brain, kidneys, and potentially the chorioretinal region[31].
These findings support the concept of “cross-talk” between the micro- and macrovasculature. Our results suggest that evaluating the retinal capillary network could provide indirect insights into the systemic arterial tree's health. Additionally, the loss of statistical significance in the relationship between eGFR and retinal vascular density when RRI is included in multivariate models suggests that previously observed associations between eGFR and the chorioretinal circulation are primarily mediated by vascular factors.
Nonetheless, given the relatively small sample size, number of data related to albuminuria and the cross-sectional design of this study, the results should be interpreted with caution. Further longitudinal and larger-scale studies are necessary to confirm these findings.
5. Conclusions
In conclusion, our results confirm the existence of a strong relationship between the renal and the ocular microcirculation, and further support the hypothesis of intimate physiopathological connections between the micro-and macrocirculatory districts. Further prospective studies with a larger sample size are needed to confirm our findings.
Author Contributions
Conceptualization, Caterina Carollo, Maria Vadalà, Riccardo Polosa, Vincenza Maria Elena Bonfiglio, Giuseppe Mulè and Giulio Geraci; Data curation, Alessandra Sorce, Nicola Sinatra, Emanuele Orlando, Emanuele Cirafici and Miriam Bennici; Formal analysis, Alessandra Sorce, Giuseppe Mulè and Giulio Geraci; Investigation, Nicola Sinatra, Emanuele Orlando, Emanuele Cirafici and Miriam Bennici; Methodology, Alessandra Sorce, Riccardo Polosa, Giuseppe Mulè and Giulio Geraci; Project administration, Caterina Carollo and Giulio Geraci; Resources, Caterina Carollo and Maria Vadalà; Software, Alessandra Sorce; Supervision, Caterina Carollo, Maria Vadalà, Vincenza Maria Elena Bonfiglio, Giuseppe Mulè and Giulio Geraci; Validation, Caterina Carollo, Maria Vadalà, Riccardo Polosa, Vincenza Maria Elena Bonfiglio and Giuseppe Mulè; Visualization, Caterina Carollo, Maria Vadalà, Riccardo Polosa, Vincenza Maria Elena Bonfiglio, Giuseppe Mulè and Giulio Geraci; Writing – original draft, Caterina Carollo, Maria Vadalà, Riccardo Polosa, Vincenza Maria Elena Bonfiglio, Giuseppe Mulè and Giulio Geraci; Writing – review & editing, Alessandra Sorce..All authors have read and agreed to the published version of the manuscript.”
Funding
“This research received no external funding”
Institutional Review Board Statement
The study was conducted in accordance with the Declaration of Helsinki, and approved by the Ethics Committee of PALERMO CEL 1 (protocol n.28 10/12/2024).
Informed Consent Statement
Informed consent was obtained from all subjects involved in the study.
Conflicts of Interest
The authors declare no conflicts of interest.
References
- «Structure and function of small arteries - PubMed». Consultato: 31 dicembre 2024. [Online]. Disponibile su: https://pubmed.ncbi.nlm.nih.gov/2217559/.
- C. W. Wong, T. Y. Wong, C.-Y. Cheng, e C. Sabanayagam, «Kidney and eye diseases: common risk factors, etiological mechanisms, and pathways», Kidney International, vol. 85, fasc. 6, pp. 1290–1302, giu. 2014. [CrossRef]
- A. S. Izzard, D. Rizzoni, E. Agabiti-Rosei, e A. M. Heagerty, «Small artery structure and hypertension: adaptive changes and target organ damage», J Hypertens, vol. 23, fasc. 2, pp. 247–250, feb. 2005. [CrossRef]
- U. Raff, T. K. Schwarz, B. M. W. Schmidt, M. P. Schneider, e R. E. Schmieder, «Renal resistive index--a valid tool to assess renal endothelial function in humans?», Nephrol Dial Transplant, vol. 25, fasc. 6, pp. 1869–1874, giu. 2010. [CrossRef]
- Y. Doi et al., «Association of renal resistive index with target organ damage in essential hypertension», Am J Hypertens, vol. 25, fasc. 12, pp. 1292–1298, dic. 2012. [CrossRef]
- «Geraci: Renal haemodynamics and severity of carotid... - Google Scholar». Consultato: 31 dicembre 2024. [Online]. Disponibile su: https://scholar.google.com/scholar_lookup?hl=en&volume=25&publication_year=2015&pages=160-166&journal=Nutr+Metab+Cardiovasc+Dis&issue=2&author=G+Geraci&author=G+Mul%C3%A8&author=M+Mogavero&title=Renal+haemodynamics+and+severity+of+carotid+atherosclerosis+in+hypertensive+patients+with+and+without+impaired+renal+function.
- M. M. Schwartz, E. J. Lewis, T. Leonard-Martin, J. B. Lewis, e D. Batlle, «Renal pathology patterns in type II diabetes mellitus: relationship with retinopathy. The Collaborative Study Group», Nephrol Dial Transplant, vol. 13, fasc. 10, pp. 2547–2552, ott. 1998. [CrossRef]
- «Mule: Retinal vascular imaging in cardiovascular... - Google Scholar». Consultato: 31 dicembre 2024. [Online]. Disponibile su: https://scholar.google.com/scholar_lookup?&title=Retinal%20vascular%20imaging%20in%20cardiovascular%20medicine%3A%20new%20tools%20for%20an%20old%20examination&journal=Atherosclerosis&doi=10.1016%2Fj.atherosclerosis.2017.11.001&volume=268&pages=188-90&publication_year=2018&author=Mul%C3%A8%2CG&author=Vadal%C3%A0%2CM&author=Geraci%2CG&author=Cottone%2CS.
- «Cheung: Retinal microvasculature as a model to study... - Google Scholar». Consultato: 31 dicembre 2024. [Online]. Disponibile su: https://scholar.google.com/scholar_lookup?&title=Retinal%20microvasculature%20as%20a%20model%20to%20study%20the%20manifestations%20of%20hypertension&journal=Hypertension&doi=10.1161%2FHYPERTENSIONAHA.111.189142&volume=60&pages=1094-103&publication_year=2012&author=Cheung%2CCYL&author=Ikram%2CMK&author=Sabanayagam%2CC&author=Wong%2CTY.
- S. K. Sharma et al., «Prognostic Role of Measurement of Renal Resistive Index in Systemic Sclerosis», Mediterr J Rheumatol, vol. 32, fasc. 4, pp. 345–349, dic. 2021. [CrossRef]
- A. Lubas, G. Kade, e S. Niemczyk, «Renal resistive index as a marker of vascular damage in cardiovascular diseases», Int Urol Nephrol, vol. 46, fasc. 2, pp. 395–402, 2014. [CrossRef]
- J. Radermacher, S. Ellis, e H. Haller, «Renal Resistance Index and Progression of Renal Disease», Hypertension, vol. 39, fasc. 2, pp. 699–703, feb. 2002. [CrossRef]
- J. A. Chirinos, P. Segers, T. Hughes, e R. Townsend, «Large Artery Stiffness in Health and Disease: JACC State-of-the-Art Review», J Am Coll Cardiol, vol. 74, fasc. 9, pp. 1237–1263, set. 2019. [CrossRef]
- S. Laurent e P. Boutouyrie, «Arterial stiffness: a new surrogate end point for cardiovascular disease», J Nephrol, vol. 20 Suppl 12, pp. S45-50, nov. 2007.
- P. I. Georgianos, P. A. Sarafidis, e A. N. Lasaridis, «Arterial Stiffness: A Novel Cardiovascular Risk Factor in Kidney Disease Patients», Current Vascular Pharmacology, vol. 13, fasc. 2, pp. 229–238, gen. 2015.
- R. Bellomo, C. Ronco, J. A. Kellum, R. L. Mehta, P. Palevsky, e Acute Dialysis Quality Initiative workgroup, «Acute renal failure - definition, outcome measures, animal models, fluid therapy and information technology needs: the Second International Consensus Conference of the Acute Dialysis Quality Initiative (ADQI) Group», Crit Care, vol. 8, fasc. 4, pp. R204-212, ago. 2004. [CrossRef]
- G. Mancia et al., «2023 ESH Guidelines for the management of arterial hypertension The Task Force for the management of arterial hypertension of the European Society of Hypertension: Endorsed by the International Society of Hypertension (ISH) and the European Renal Association (ERA)», Journal of Hypertension, vol. 41, fasc. 12, pp. 1874–2071, dic. 2023. [CrossRef]
- «Early Treatment Diabetic Retinopathy Study design and baseline patient characteristics. ETDRS report number 7», Ophthalmology, vol. 98, fasc. 5 Suppl, pp. 741–756, mag. 1991. [CrossRef]
- «N-Terminal Pro-Brain Natriuretic Peptide, C-Reactive Protein, and Urinary Albumin Levels as Predictors of Mortality and Cardiovascular Events in Older Adults | Acute Coronary Syndromes | JAMA | JAMA Network». Consultato: 31 dicembre 2024. [Online]. Disponibile su: https://jamanetwork.com/journals/jama/fullarticle/200640.
- «Increased renal resistive index in patients with essential hypertension: a marker of target organ damage. | Nephrology Dialysis Transplantation | Oxford Academic». Consultato: 31 dicembre 2024. [Online]. Disponibile su: https://academic.oup.com/ndt/article-abstract/14/2/360/1832953.
- S. Sezer, S. Karakan, T. Çolak, e M. Haberal, «Nocturnal Nondipping Hypertension Is Related to Dyslipidemia and Increased Renal Resistivity Index in Renal Transplant Patients», Transplantation Proceedings, vol. 43, fasc. 2, pp. 530–532, mar. 2011. [CrossRef]
- «Clinical Usefulness of Duplex Ultrasonography for the Assessment of Renal Arteriosclerosis in Essential Hypertensive Patients». Consultato: 31 dicembre 2024. [Online]. Disponibile su: https://www.jstage.jst.go.jp/article/hypres/24/1/24_1_13/_article/-char/ja/.
- «Central Pulse Pressure and Aortic Stiffness Determine Renal Hemodynamics | Hypertension». Consultato: 31 dicembre 2024. [Online]. Disponibile su: https://www.ahajournals.org/doi/full/10.1161/HYPERTENSIONAHA.111.177469.
- J. P. Campbell et al., «Detailed Vascular Anatomy of the Human Retina by Projection-Resolved Optical Coherence Tomography Angiography», Sci Rep, vol. 7, fasc. 1, p. 42201, feb. 2017. [CrossRef]
- G. Mule et al., «Association between early-stage chronic kidney disease and reduced choroidal thickness in essential hypertensive patients», Hypertension Research, vol. 42, gen. 2019. [CrossRef]
- «Impact of systemic vascular risk factors on the choriocapillaris using optical coherence tomography angiography in patients with systemic hypertension | Scientific Reports». Consultato: 31 dicembre 2024. [Online]. Disponibile su: https://www.nature.com/articles/s41598-019-41917-4.
- «Optical coherence tomography angiography changes in cardiovascular systemic diseases and risk factors: A Review - Monteiro-Henriques - 2022 - Acta Ophthalmologica - Wiley Online Library». Consultato: 31 dicembre 2024. [Online]. Disponibile su: https://onlinelibrary.wiley.com/doi/full/10.1111/aos.14851.
- C. Sun et al., «Systemic hypertension associated retinal microvascular changes can be detected with optical coherence tomography angiography», Sci Rep, vol. 10, fasc. 1, p. 9580, giu. 2020. [CrossRef]
- «Use of optical coherence tomography angiography for assessment of microvascular changes in the macula and optic nerve head in hypertensive patients without hypertensive retinopathy - ScienceDirect». Consultato: 31 dicembre 2024. [Online]. Disponibile su: https://www.sciencedirect.com/science/article/pii/S0026286219301943.
- «Tan: The application of optical coherence tomography... - Google Scholar». Consultato: 31 dicembre 2024. [Online]. Disponibile su: https://scholar.google.com/scholar_lookup?journal=Front.%20Med.&title=The%20Application%20of%20Optical%20Coherence%20Tomography%20Angiography%20in%20Systemic%20Hypertension:%20A%20Meta-Analysis&author=W.%20Tan&author=X.%20Yao&author=T.-T.%20Le&author=A.C.S.%20Tan&author=C.Y.%20Cheung&volume=8&publication_year=2021&pmid=34859021&doi=10.3389/fmed.2021.778330&.
- G. Mulè et al., «Relationship of choroidal thickness with pulsatile hemodynamics in essential hypertensive patients», J Clin Hypertens (Greenwich), vol. 23, fasc. 5, pp. 1030–1038, mag. 2021. [CrossRef]
- «Retinal capillary rarefaction is associated with arterial and kidney damage in hypertension | Scientific Reports». Consultato: 31 dicembre 2024. [Online]. Disponibile su: https://www.nature.com/articles/s41598-020-79594-3.
- «Relationship Between Carotid Atherosclerosis and Pulse Pressure with Renal Hemodynamics in Hypertensive Patients | American Journal of Hypertension | Oxford Academic». Consultato: 31 dicembre 2024. [Online]. Disponibile su: https://academic.oup.com/ajh/article-abstract/29/4/519/2622367.
Figure 1.
Correlation between RRI and Deep – Layer Foveal Vascular Density.
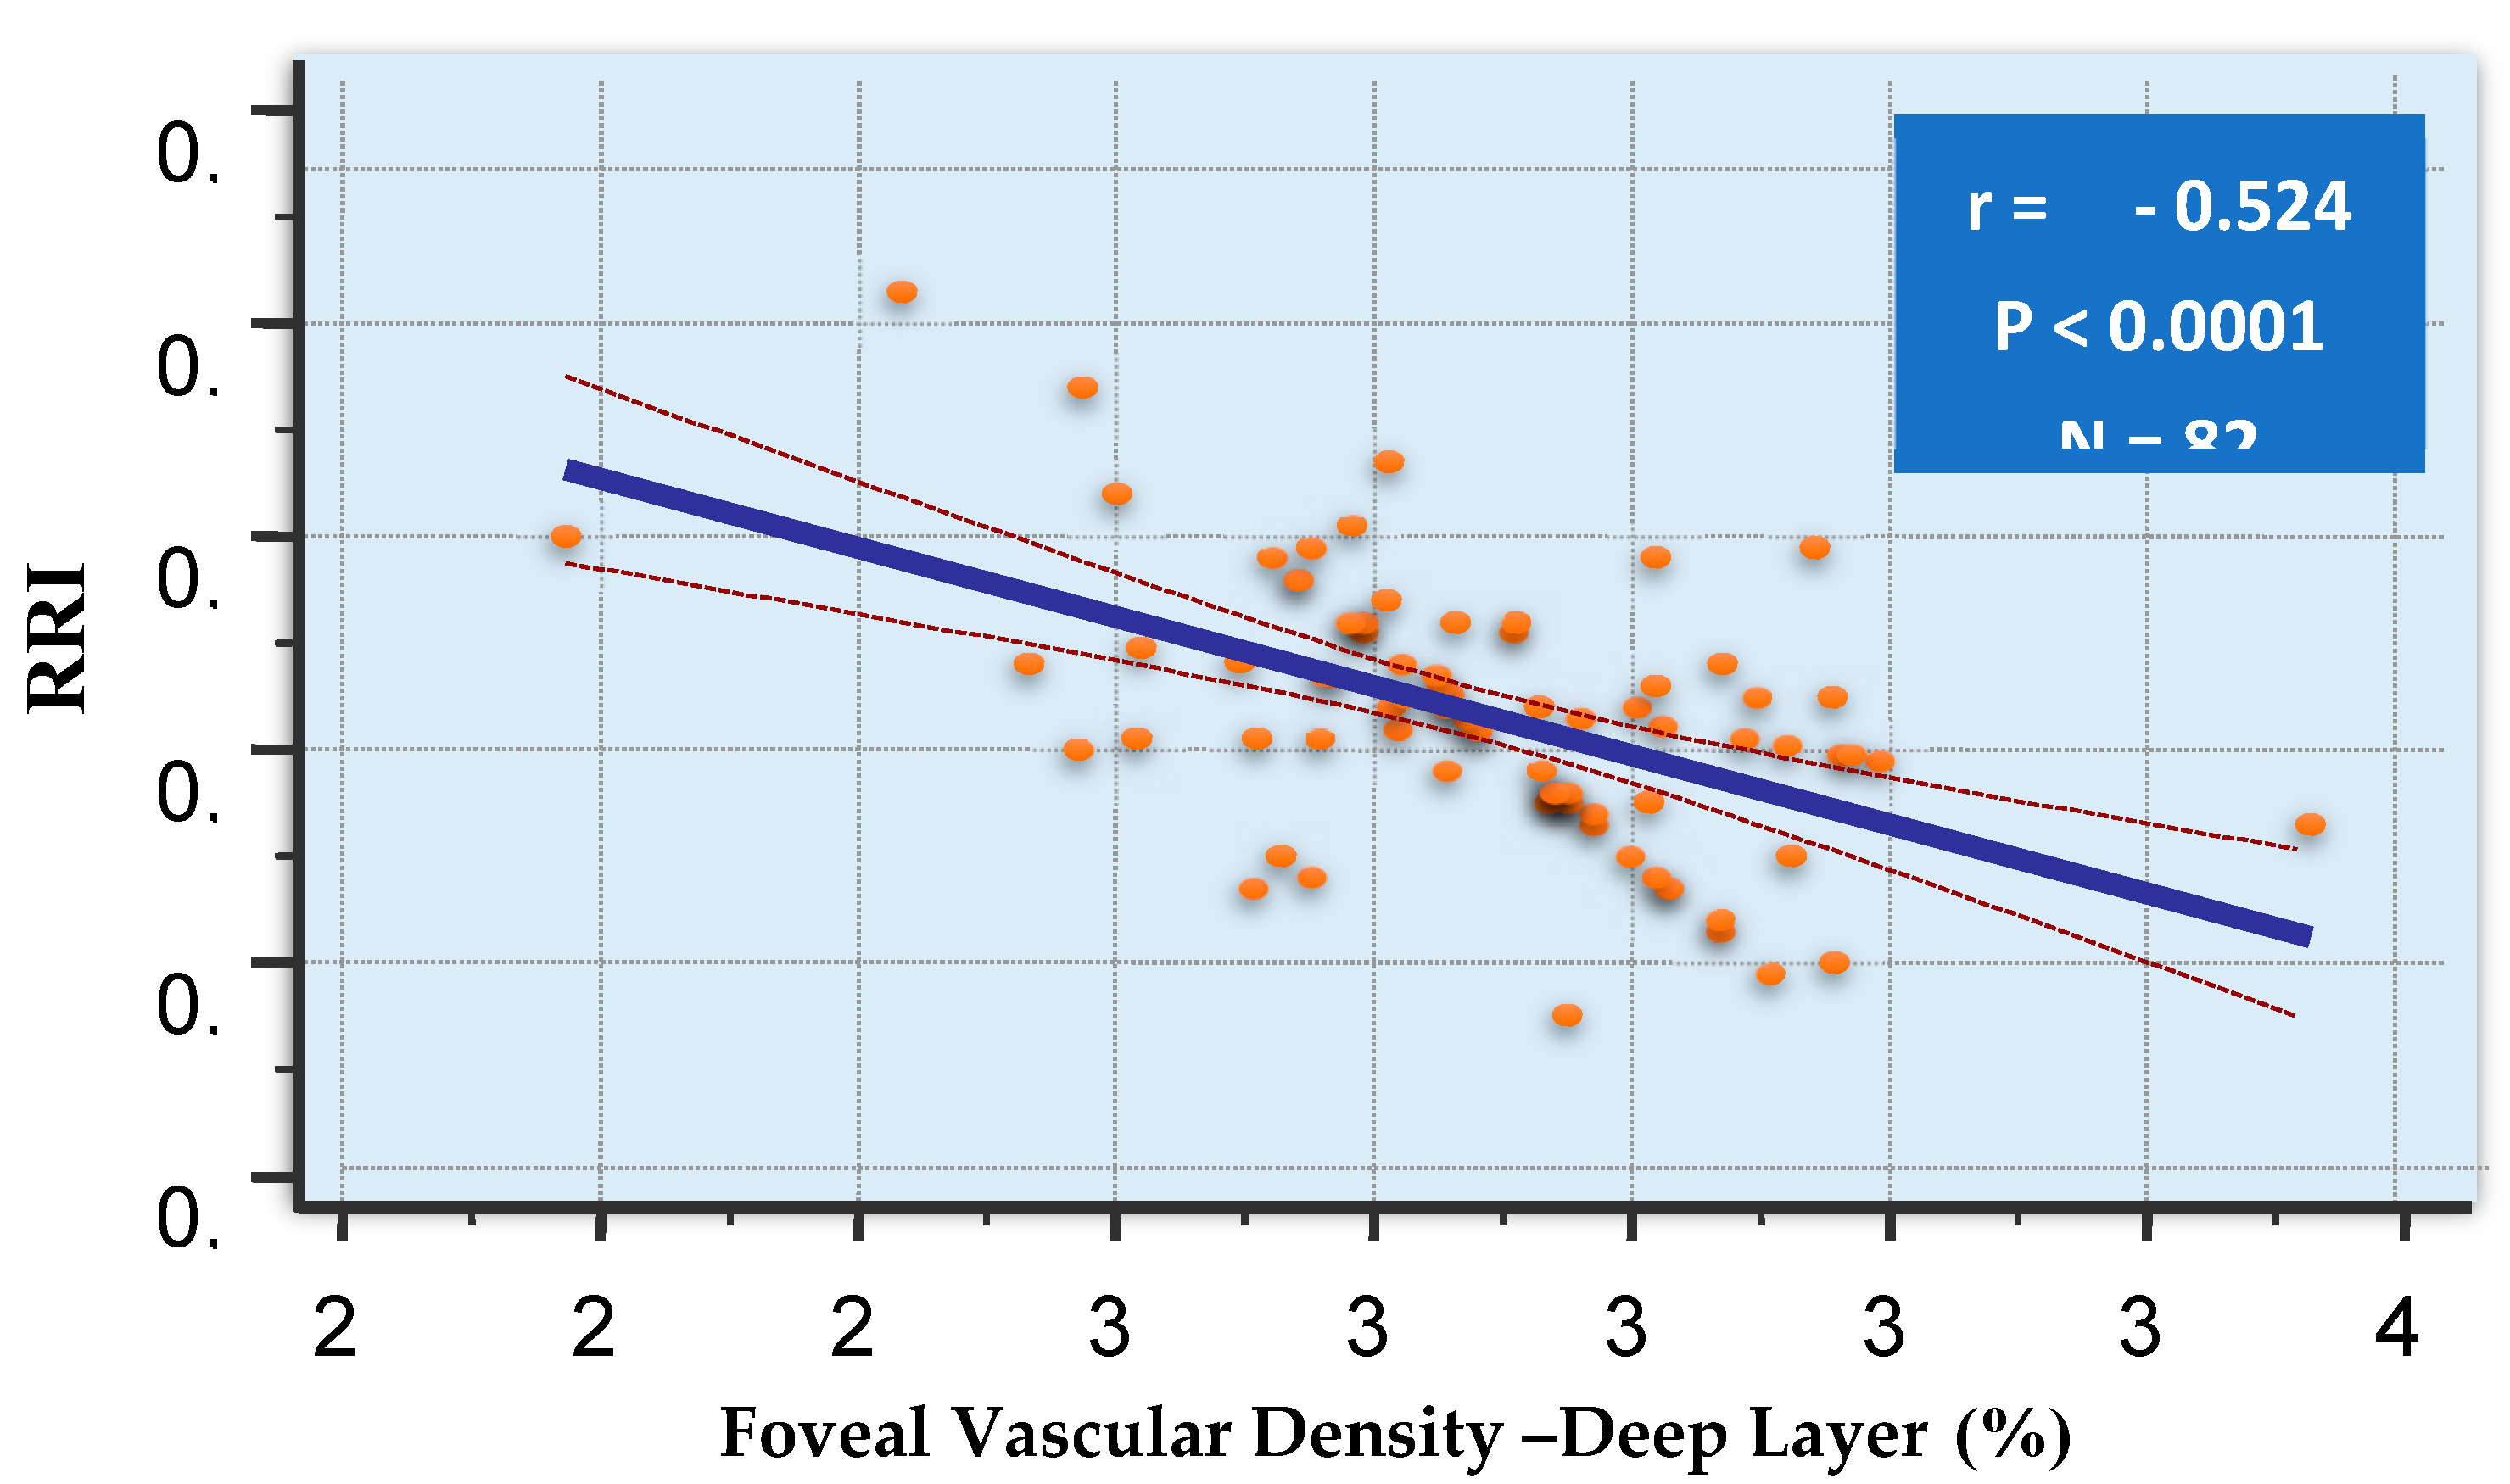

Table 1.
Main demographic, anthropometric, clinical, and biochemical characteristics of the study population.
Table 1.
Main demographic, anthropometric, clinical, and biochemical characteristics of the study population.
| TOTAL | RRI<75 pct | RRI>75 pct | p | |
|---|---|---|---|---|
| Age, y | 48±13 | 48±12 | 52±14 | ns1 |
| Male sex (%) | 79 | 78 | 83 | ns |
| BMI (kg/m2) | 28±4.6 | 27.5±4.6 | 29.4±4.5 | ns |
| Waist circumference (cm) | 96±13 | 96±13 | 99±12 | ns |
| Smokers (%) | 22.2 | 17.4 | 38.9 | 0.054 |
| eGFR (mL/min/1.73 m²) | 87±20 | 90±19 | 76±24 | 0.018 |
| Urinary albumin excretion (mg/day) | 76 (31-252) | 36 (30-86) | 387(126-646) | 0.009 |
| Total Cholesterol (mg/dL) | 194±29 | 196±29 | 186±26 | ns |
| HDL-Cholesterol (mg/dL) | 48±12 | 49±12 | 45±9 | ns |
| Tryglicerides(mg/dL) | 118 (75-154) | 106 (89-131) | 122 (80-165) | 0.02 |
| Blood glucose (mg/dL) | 96±17 | 96±18 | 97±14 | ns |
1 (ns= not significant).
Table 2.
Percentage of Pharmacologically Treated Patients.
| TOTAL | RRI<75 pct | RRI>75 pct | p | |
|---|---|---|---|---|
| Pharmacologically treated hypertensive subjects | 67.1 | 69.4 | 58.8 | ns1 |
| Antihypertensive drugs | ||||
| Angiotensin-converting enzyme (ACE) inhibitors,% | 29.1 | 27.4 | 35.3 | ns |
| Sartans, % | 37.9 | 40.3 | 29.4 | ns |
| Calcium channel blockers, % | 35.4 | 38.7 | 23.5 | ns |
| Alpha-2 Adrenergic Receptor Agonists, % | 7.6 | 3.2 | 23.5 | 0.005 |
| α – Blockers,% | 27.8 | 29 | 23.6 | ns |
| α β-blockers,% | 12.7 | 12.9 | 11.8 | ns |
| β-blockers,% | 12.7 | 14.5 | 5.8 | ns |
| Diuretics % | 35.4 | 33.9 | 41.2 | ns |
| Other cardiovascular agents | ||||
| Statins, % | 11.4 | 9.7 | 17.6 | ns |
| Antiplatelet agents, % | 25.3 | 29 | 11.8 | ns |
| Allopurinol, % | 6.3 | 4.8 | 11.8 | ns |
1 ns= not significant.
Table 3.
Hemodynamic parameters of whole population and two subgroups.
| TOTAL | RRI<75 pct | RRI>75 pct | p | |
|---|---|---|---|---|
| Clinic SBP (mmHg) | 137±12 | 137±13 | 136±11 | ns |
| Clinic DBP (mmHg) | 86±9 | 87±9 | 85±9 | ns |
| Clinic PP (mmHg) | 51±9 | 50±9 | 52±12 | ns |
| Heart Rate (bpm) | 73±11 | 74±12 | 72±11 | ns |
| Mean 24-h SBP (mmHg) | 130±13 | 133±13 | 138±13 | ns |
| Mean 24-h DBP (mmHg) | 82±9 | 83±9 | 82±9 | ns |
| 24-h PP (mmHg) | 47±10 | 45±10 | 52±9 | 0.013 |
| Daytime SBP (mmHg) | 134±13 | 129±13 | 134±13 | ns |
| Daytime DBP (mmHg) | 85±9 | 86±10 | 85±9 | ns |
| Daytime PP (mmHg) | 48±11 | 47±11 | 54±9 | 0.038 |
| Nighttime SBP (mmHg) | 119±14 | 117±13 | 126±15 | 0.03 |
| Nighttime DBP (mmHg) | 75±10 | 75±10 | 75±10 | ns |
| Nighttime PP (mmHg) | 44±10 | 43±9 | 51±10 | 0.001 |
Abbreviations—SBP: systolic blood pressure; DBP: diastolic blood pressure; PP: pulse pressure; ns = not significant.
Table 4.
Retinal vascular density parameters of whole population and two subgroups.
| TOTAL | RRI<75 pct | RRI>75 pct | p | P* | |
|---|---|---|---|---|---|
| Parafoveal Vascular Plexus Density (%) – Superficial Layer | 37.3±0.87 | 37.4±0.84 | 36.9±0.89 | 0.053 | ns |
| Parafoveal Vascular Plexus Density (%) – Deep Layer | 38.3±1.08 | 38.3±1.06 | 38.3±1.19 | 0.956 | ns |
|
Foveal Vascular Density (%) –Superficial Layer |
34.5±1.88 | 34.7±1.69 | 33.7±2.34 | 0.147 | ns |
|
Foveal Vascular Density (%) –Deep Layer |
32.9±1.95 | 33.26±1.72 | 31.47±2.11 | 0.01 | 0.001 |
p* after ANCOVA correction for eGFR, log-transformed triglycerides, mean nocturnal pulse pressure, and smoking).
Table 5.
Correlations between RRI and other parameters.
| Age | eGFR | Nighttime PP |
UAE | Deep foveal plexus vascular density |
|||
|---|---|---|---|---|---|---|---|
| (RRI) | r = | 0,235 | -0.288 | 0,3027 | 0,555* | -0,524 | |
| p= | 0,0336 | 0,0087 | 0,0057 | <0,001 | <0,001 |
Table 6.
Multiple linear regression analysis.
|
Dependent variable: RRI |
B* | SE | R partial | P |
| Covariates | ||||
|
Foveal Vascular Density (%) –Deep Layer |
-0.0158 | 0.0029 | -0.549 | <0.0001 |
| Mean nighttime PP (mmHg) | 0.0020 | 0.0006 | 0.3063 | 0.0007 |
| Constant | 1.0468 |
*B unstandardized regression coefficient. SE standard error; R correlation coefficient. Other variables that did not reach statistical significance include: eGFR, LogT, smoking, centrally acting anti-adrenergic drugs.
Table 7.
Multiple linear regression analysis.
|
Dependent variable: Foveal Vascular Density (%) –DeepLayer |
B* | SE | R partial | p |
| Covariates | ||||
| RRI | -18.98 | 3.43 | -0.549 | <0.0001 |
| Mean nighttime PP (mmHg) | 0.048 | 0.0027 | 0.2615 | 0.025 |
| Constant | 42.38 |
*B unstandardized regression coefficient. SE standard error; R correlation coefficient. Other variables that did not reach statistical significance include: eGFR, LogT, smoking, centrally acting anti-adrenergic drugs.
Table 8.
Multiple logistic regression analysis.
|
Dependent variable: RRI > o < 75 pct |
Odds ratio |
95%IC |
P |
| Covariates | |||
|
Foveal Vascular Density (%) –Deep Layer |
-0,5026 | 0,3129 - 0,8073 | 0.0044 |
| Mean nighttime PP (mmHg) | 1,1319 | 1,0493 - 1,2211 | 0.0014 |
| Constant | 15,3587 |
*Other variables that did not reach statistical significance include: eGFR, LogT, smoking, centrally acting anti-adrenergic drugs.
Disclaimer/Publisher’s Note: The statements, opinions and data contained in all publications are solely those of the individual author(s) and contributor(s) and not of MDPI and/or the editor(s). MDPI and/or the editor(s) disclaim responsibility for any injury to people or property resulting from any ideas, methods, instructions or products referred to in the content. |
© 2025 by the authors. Licensee MDPI, Basel, Switzerland. This article is an open access article distributed under the terms and conditions of the Creative Commons Attribution (CC BY) license (http://creativecommons.org/licenses/by/4.0/).
Copyright: This open access article is published under a Creative Commons CC BY 4.0 license, which permit the free download, distribution, and reuse, provided that the author and preprint are cited in any reuse.


