

Submitted:
01 August 2024
Posted:
03 August 2024
You are already at the latest version
Abstract
Introduction: ophthalmological assessment of the retinal circulation and the level of VEGF-A is currently considered a non-invasive and safe diagnostic tool to assess the peripheral microcircu-lation
Objective: to study retinal hemodynamics and VEGF-A levels in patients with type 1 diabetes mellitus after pancreas transplantation
Settings and Design:
A prospective, single-stage, single-center, non-randomized clinical trial
Methods: 79 patients (158 eyes) with type 1 diabetes mellitus and end-stage diabetic nephropathy participated in the study. Patients were divided into 3 groups: group 1, potential recipients of pancreas and kidney transplant from the waiting list; group 2, patients after kidney transplanta-tion; and group 3, patients after simultaneous pancreas and kidney transplantation. Ophthalmo-logical examination included measuring the macular hemoperfusion density. The level of VEGF-A was examined in the patients' tear by enzyme immunoassay.
Results: retinal hemoperfusion density and VEGF-A concentration were expected to correlate with the severity of diabetic changes in the fundus of patients. A lower index of retinal hemoperfusion density and a high level of VEGF-A were noted in patients with proliferative ret-inopathy and macular oedema. Group 3 showed the lowest frequency of the active phase of the proliferative retinopathy and retinal macular oedema, characterized by a higher retinal hemoperfusion density in the foveal and the parafoveal zone of the macular region, and low VEGF-A concentration in tear.
Conclusion: measurement of retinal hemoperfusion density and determination of tear VEGF-A concentration are informative objective methods for diagnosing the severity of diabetic changes of the fundus.
Keywords:
type 1 diabetes mellitus
; diabetic retinopathy
; simultaneous pancreas and kidney transplantation
; retinal hemoperfusion
; optical coherence tomography angiography
; vascular endothelial growth factor
1. Introduction
Pancreatic transplantation is a surgical method for the treatment of diabetes mellitus (DM), which allows to achieve the longest life expectancy and provides high-quality medical and social rehabilitation.[1] It is performed mostly as simultaneous pancreas-kidney (SPK) transplantation in patients with type 1 diabetes complicated by stage 5 chronic kidney disease as the outcome of diabetic nephropathy (DN).[2,3,4]
Diabetic retinopathy (DR) is a specific late microvascular complication of DM. Signs of diabetic retinal damage are more common in patients with type 1 diabetes than in patients with other types of the disease. Within 10 years after the diagnosis of type 1 diabetes, half of the patients show signs of retinopathy, with 60% of them at high risk of significant or complete loss of visual functions.[5]
Vascular endothelial growth factor type A (VEGF-A) is a well-known immunological biomarker of microvascular endothelial dysfunction. VEGF-A is a polypeptide that regulates the vasculogenesis. It is produced by endothelial cells, macrophages, CD4 lymphocytes, plasma cells, myocytes, megakaryocytes, and neoplastic cells.[6] In the pathogenesis of DR, VEGF-A increases vascular permeability and neovascularization observed in the proliferative retinopathy and diabetic macular oedema (DMO).[7] The high VEGF-A concentration is reported in ocular media (aqueous humor of the anterior chamber, vitreous body) and tear samples in patients with DR. However, the VEGF-A concentration may be decreased with intravitreal injections of angiogenesis inhibitors and laser retinal coagulation.[8,9,10]
Ophthalmologic studies investigating the course of DR after restoration of the physiological regulation of carbohydrate metabolism achieved by pancreas transplantation are few and contradictory.[11,12] Besides, these studies are mostly based on the results of traditional examination not evaluating quantitatively the retinal hemodynamics and VEGF-A levels.
2. Objective
To study retinal hemodynamics and VEGF-A level in patients with type 1 diabetes mellitus after restoration of physiological euglycemia through pancreatic transplantation.
3. Materials and Methods
3.1. Study Design
A prospective, single-stage, single-center, non-randomized clinical study.
3.2. Compliance Criteria
Inclusion criteria: confirmed diagnosis of type 1 diabetes mellitus and stage 5 chronic kidney disease as the outcome of DN; satisfactory function of pancreatic and renal transplant; obtained informed consent.
Non-inclusion criteria: loss of pancreatic and/or renal transplant function.
3.3. Duration of the Study
The study was conducted between January 2021 and November 2023.
3.4. Characteristics of the Study Group
The study group consisted of 79 patients with type 1 diabetes mellitus and stage 5 chronic kidney disease secondary to DN.
3.5. Ophthalmological Examination
All patients had their maximum corrected visual acuity measured using a KR-1 autorefractometer (Topcon, Japan), a CC-100 sign projector (Topcon, Japan), and a standard set of lenses; intraocular pressure was measured using a CT-1P pneumotonometer (Topcon, Japan); anterior chamber of the eye was examined by biomicroscopy using a slit SL-2G lamps (Topcon, Japan); angle of the anterior chamber of the eye was examined by gonioscopy using a slit lamp and a Goldman three-mirror lens (Volk, USA); fundus was examined by biomicroophthalmoscopy and fundus photoregistration using a retinal camera TRC-NW8 (Topcon, Japan). The central retinal thickness (CRT) and perfusion density of the superficial and deep capillary plexus of the retina (SCP and DCP) in the foveal and parafoveal zones of the macular region were measured with RS-3000 Advance2 optical coherence tomograph with angiography function (Nidek, Japan). The photosensitivity of the macular region was measured by a fundus microperimeter MAIA (CenterVue, Italy).
3.6. Laboratory Studies
The glycemic profile was assessed by measuring glucose and glycated hemoglobin (HbA1c) in venous blood. Serum urea and creatinine levels were studied, followed by the calculation of glomerular filtration rate (GFR) using the CKD–EPI formula. Venous blood and tear were collected on the day of the ophthalmological examination.
The VEGF-A level (pg/ml) was measured in tear samples by solid-phase enzyme immunoassay using the Human VEGF Quantikine ELISA Kit diagnostic kit (R&D Systems, USA) on a Perkin-Elmer Victor X3 luminometer (Perkin-Elmer, USA). Tear production was stimulated by inhalation of ammonia vapors by the patient. The tear released in response to irritation was removed from the lower conjunctival arch with a mechanical micropipette.
3.7. Patient Groups
Seventy-nine patients (158 eyes) with type 1 diabetes and end-stage DN were divided into 3 groups: group 1 (n=30), patients on the waiting list for kidney transplantation or SPK; group 2 (n=24), patients who underwent kidney transplantation; group 3 (n=25), patients after SPK. The demographic data of the patients are presented in Table 1. Laboratory parameters of transplant function are presented in Table 2. Patients in groups 2 and 3 were expected to have significantly lower azotemia compared to those in group 1. In group 3, in contrast to groups 1 and 2, the glycemic indices were within the reference limits.
3.8. Statistical Analysis
The results were analyzed using the StatTech v.3.1.0 software package (Stattech LLC, Russia) and Microsoft Office Excel 2019 (Microsoft, USA). The numerical data are presented as a median (Me) with the lower and upper quartiles [Q1; Q3]. Qualitative characteristics are presented as absolute values and percentages. The two groups were compared quantitatively with the Student's t-test for the normal distribution or the Mann-Whitney U-test. The three groups were compared with the one-factor analysis of variance or the Kruskal-Wallis criterion. For a comparative analysis of qualitative characteristics, the exact Fisher criterion or Pearson Chi-square test were used. The differences were significant at p<0.05.
4. Results
4.1. Diabetic Retinopathy Status
No significant differences were found in the stages of diabetic fundus changes in patients of the studied groups. Proliferative changes of the fundus were observed in most patients (in group 1, 22 [73%], in group 2, 17 [70%], and in group 3, 18 [72%]) and the severe non-proliferative stage of the disease was observed in several patients (in group 1, 8 [27%], in group 2, 7 [30%], and in group 3, 7 [28%]) (p>0.05).
Due to advanced stages of DR, the most of the examined eyes (in group 1, 52 [86%], in group 2, 42 [87%], and in group 3, 44 [88%], p>0.05) received the following treatment:
retinal laser coagulation (in group 1, 14 [23%], in group 2, 10 [21%], in group 3, 10 [20%]);
intravitreal injections of angiogenesis inhibitors (in group 1, 3 [5%], in group 2, 5 [10%], in group 3, 4 [8%]);
vitrectomy (in group 1, 3 [5%], in group 2, 4 [8%], in group 3, 6 [12%]);
and combined treatment (in group 1, 32 [53%], in group 2, 23 [48%], in group 3, 24 [48%]).
Absolute or significant loss of visual functions (with visual acuity from photosensitivity to zero level) were diagnosed in 16 (10%) eyes (in group 1, 7 [12%], in group 2, 4 [8%], and in group 3, 5 [10%]; p>0.05). These changes were most likely related to the background lack of timely treatment of the proliferative stage of the disease, which resulted in the terminal fundus changes, including traction rheumatogenic retinal detachment and/or secondary neovascular glaucoma (Figure 1). Eyes with terminal changes were not further analyzed due to the expected lack of a positive effect of glycemic levels on the complete loss of retinal architectonics and visual functions.
4.2. Ophthalmoscopic and Functional Parameters
The active phase of the proliferative retinopathy, characterized by the areas of neovascularization of the retina and optic disc, the preretinal and intraocular hemorrhages, was more common in groups 1 and 2 (group 1, 20 eyes [45%], group 2, 16 eyes [47%]) compared to group 3 (7 eyes [19%]) (p<0.05).
The DMO incidence was low in group 3, 5 cases [10%] versus 14 cases (23%) in group 1 and 14 cases (29%) in group 2 (p<0.05). The high prevalence of DMO was confirmed by a higher value of retinal thickness in patients of groups 1 and 2 compared to group 3 (CRT was 306.1µm [296.2; 312.9] in group 1 and 316.5 µm [294.8; 406.0] in group 2 versus 281.4 µm [268.1; 291.7] in group 3, p<0.05).
The low frequency of the active phase of proliferation and DMO among group 3 patients was accompanied by the highest photosensitivity (25.7 [23.1; 27.7] dB in group 3 versus 22.8 [19.2; 24.8] dB in group 1 and 23.2 [19.4; 25.2] dB in group 2, p<0.05).
All cases of DMO and the active phase of the proliferative retinopathy in pancreatic transplant recipients were detected within the first 24 months of the posttransplant period.
4.3. Retinal Hemoperfusion Density and Tear VEGF-A Levels
The retinal hemoperfusion density depended on the severity of changes in the fundus. In eyes with proliferative retinopathy and DMO, the retinal hemoperfusion had the lowest density (Table 3 and Figure 2).
In group 3, the retinal hemoperfusion density of the macular region in the foveal and parafoveal zones was greater than that in the groups 1 and 2 (Table 4).
5. Discussion
Our study showed the proliferative retinopathy in most of the patients with terminal impairment of excretory renal function (n=70, 73%). Several authors previously established a direct correlation between the severity of fundus changes and the stage of nephropathy in DM patients.[13,14] This pattern is nothing more than a manifestation of the pathological effect of chronic hyperglycemia on the general microvascular system of the body.
Unlike the kidneys, the eye is an accessible organ for noninvasive assessment of the state of the microvascular bed. Modern instrumental methods of visualization of ocular blood flow and enzyme immunoassay of tear samples have long become integral diagnostic procedures in identifying and evaluating the effect of DR treatment.[15]
Optical coherence tomography angiography is a sensitive method for diagnosing early changes in retinal blood flow in DM patients in the absence of visible signs of retinopathy. The progression of diabetic changes in the fundus and the development of maculopathy deteriorate the qualitative and quantitative angiographic data.[16] Similar to the previous results, our study discovered higher hemoperfusion density of SCP in patients with non-proliferative retinopathy and without DMO compared to patients with proliferative fundus changes and maculopathy (in fovea at the non-proliferative stage, 18.3 [15.1; 20.0]%, at the proliferative stage, 14.4 [12.4 16.5]%, p=0.005; in parafovea at the non-proliferative stage, 28.4 [26.7; 31.3]%, at the proliferative stage, 23.2 [21.2; 25.7]%, p<0.001) and deep capillary plexus (in fovea at the non-proliferative stage, 23.6 [21.0; 25.2]%, at the proliferative stage, 19.3 [18.1; 23.6]%, p<0.001; in parafovea at the non-proliferative stage, 36.2 [34.5; 38.2]%, at the proliferative stage, 31.9 [29.7; 34.9] %, p<0.001).
In DMO patients with the signs of proliferative activity of the fundus, we observed the expected high VEGF-A levels in tear samples (in patients with DMO, 2673.5 [2296.3; 2944.7] pg/ml; in the active phase of the proliferative process, 2395.7 [2284.2; 2590.1]), which is consistent with the results of previous studies and corresponds to the underlying vascular endothelial dysfunction.[17,18]
Hyperglycemia is an undeniably modifiable risk factor for the development and progression of vascular complications of diabetes that became eliminable when the pancreatic transplantation was introduced into clinical practice. In our study, most patients after achieving physiological euglycemia, compared with patients on insulin therapy, also achieved stabilization of diabetic changes of the fundus, characterized by the lowest frequency of the active phase of proliferative retinopathy (19% of cases in group 3 versus 45% of cases in group 1 and 47% of cases among group 2 patients; p<0.05) and DMO (10% of cases in group 3 versus 23% of cases in group 1 and 29% of cases among group 2 recipients; p<0.05). Ophthalmoscopic signs of stabilization of retinopathy in pancreatic transplant recipients were confirmed by better quantitative data from objective examination. Thus, the achievement of reference glycemia was accompanied by higher retinal hemoperfusion density (SCP in fovea, 18.8 [16.4; 19.2]%, in parafovea, 29.9 [28.6; 30.2]%; DCP in fovea, 25.5 [24.0; 26.2]%, in parafovea, 37.2 [36.7; 38.8]%) and low levels of VEGF-A (1826.7 [1706.5; 2078.4] pg/ml). In this study, we provide the first objective quantitative assessment of retinal blood flow and tear VEGF-A, a biomarker of endothelial microvascular dysfunction, in patients after pancreatic transplantation.
The ophthalmoscopic data obtained in our study is comparable with the results of the largest retrospective analysis in the number of participants to date, Kim Y.J. et al.[19] The authors analyzed the medical histories of 153 patients (303 eyes) who underwent surgical treatment for diabetes between 2007 and 2015. Similar to our results, Kim Y.J. et al. reported proliferative retinopathy in 72.9% of patients. During the average 4.2±2.2 years of follow-up, a stable DR without need for surgical and laser intervention was observed in 71.6% of cases (217 eyes). In 20.5% of cases (62 eyes), the disease progressed, mostly during the first year after pancreatic transplantation (92.0% of the cases). Patients with progressive retinopathy were young, had type 1 diabetes and poorly controlled glycemia before surgery, and showed a marked decrease in HbA1c levels after transplantation.
It is noteworthy that in our study, all cases of DMO and active proliferation in pancreatic transplant recipients were discovered within the first 24 months after the surgical treatment of DM.
Deterioration of the fundus in the early posttransplant period in some patients after pancreatic transplantation was previously reported in a prospective study by Voglová B. et al.[20] Within 1 year after surgery, ophthalmoscopy showed foci of active proliferation (n=10) and DMO (n=6) in 16 (37.2%) of 43 patients.
Our study design, in contrast to the methodologies employed by the aforementioned authors, did not allow for retrospective or prospective analysis of a single patient cohort from the initiation of insulin therapy to the attainment of long-term euglycemia through surgery. We compared the ophthalmological status of patients after pancreatic transplantation with that of similar patients receiving insulin therapy. Therefore, accurately determining the cause of the unstable ophthalmoscopic picture in a small proportion of pancreatic transplant recipients is difficult. These changes in the fundus could be caused both by the lack of timely, adequate therapy for DR before transplantation and by a transient violation of retinal blood flow based on a significant and rapid decrease in blood glucose levels.[21]
6. Conclusions
Patients with type 1 diabetes mellitus and stage 5 chronic kidney disease as the outcome of DN have pronounced fundus changes corresponding to the proliferative retinopathy. The restoration of physiological euglycemia by transplantation of functionally active pancreatic tissue is accompanied by decrease in the frequency of active phase of the proliferative retinopathy and DMO. Measuring the retinal hemoperfusion density and the VEGF-A concentration in tear samples allows to objectively diagnose the severity of diabetic changes of the fundus and asses the effect of restored physiological euglycemia on the state of peripheral blood circulation.
Author Contributions
Conceptualization, Evgeniy V. Bulava, Irina V. Vorobyova, Ilya V. Dmitriev and Aslan G. Balkarov; design, Evgeniy V. Bulava, Irina V. Vorobyova and Ilya V. Dmitriev; definition of intellectual content, Irina V. Vorobyova and Ilya V. Dmitriev; literature search, Evgeniy V. Bulava; clinical studies, Evgeniy V. Bulava and Irina V. Vorobyova; data acquisition, Evgeniy V. Bulava and Irina V. Vorobyova; data analysis, Evgeniy V. Bulava, Irina V. Vorobyova and Ilya V. Dmitriev; statistical analysis, Evgeniy V. Bulava and Ilya V. Dmitriev; manuscript preparation, Evgeniy V. Bulava and Ilya V. Dmitriev; manuscript editing, Evgeniy V. Bulava, Irina V. Vorobyova and Ilya V. Dmitriev; manuscript review, Irina V. Vorobyova, Ilya V. Dmitriev and Aslan G. Balkarov; guarantor, Evgeniy V. Bulava, Irina V. Vorobyova, Ilya V. Dmitriev and Aslan G. Balkarov. All authors have read and agreed to the published version of the manuscript.
Funding
This research received no external funding.
Institutional Review Board Statement
The trial was conducted in accordance with the Declaration of Helsinki (as revised in 2013). The study was approved by the Ethics Committee of the Federal State Budgetary Educational Institution for Further Vocational Education, the Russian Medical Academy of Continuous Professional Education of the Russian Ministry of Health (Protocol No. 1 dated January 18, 2021).
Informed Consent Statement
Informed consent was obtained from all subjects involved in the study.
Conflicts of Interest
The authors declare no conflicts of interest.
References
- Robertson RP. Medical Management of Diabetes Mellitus: Options and Limitations. In: Transplantation of the Pancreas. Gruessner RWG, Gruessner AC (eds.). Springer, Cham; 2023. pp. 55-57. [CrossRef]
- Kandaswamy R, Stock PG, Miller JM, White J, Booker SE, Israni AK; et al. OPTN/SRTR 2021 Annual Data Report: Pancreas. Am J Transplant. 2023;23(2 Suppl 1):S121-S177. [CrossRef]
- Kaufman DB. Pancreas Allocation in the United States. In: Transplantation of the Pancreas. Gruessner RWG, Gruessner AC (eds.). Springer, Cham; 2023. pp. 117-129. [CrossRef]
- Arbogast H. Pancreas Allocation in the Eurotransplant Area. In: Transplantation of the Pancreas. Gruessner RWG, Gruessner AC (eds.). Springer, Cham; 2023. pp. 129-141. [CrossRef]
- Yau JW, Rogers SL, Kawasaki R, Lamoureux EL, Kowalski JW, Bek T; et al. Global prevalence and major risk factors of diabetic retinopathy. Diabetes Care. 2012;35(3):556-564. [CrossRef]
- Karaman S, Leppänen VM, Alitalo K. Vascular endothelial growth factor signaling in development and disease. Development. 2018;145(14):dev151019. [CrossRef]
- Wu MY, Yiang GT, Lai TT, Li CJ. The Oxidative Stress and Mitochondrial Dysfunction during the Pathogenesis of Diabetic Retinopathy. Oxid Med Cell Longev. 2018;2018:3420187. [CrossRef]
- Podkowinski D, Orlowski-Wimmer E, Zlabinger G, Pollreisz A, Mursch-Edlmayr AS, Mariacher S; et al. Aqueous humour cytokine changes during a loading phase of intravitreal ranibizumab or dexamethasone implant in diabetic macular oedema. Acta Ophthalmol. 2020;98(4):e407-e415. [CrossRef]
- Nišić F, Pidro A, Lepara O, Fajkić A, Mioković AP, Suljić E; et al. Effect of pan-retinal laser photocoagulation on intravitreal vascular endothelial growth factor concentration in proliferative diabetic retinopathy. Rom J Ophthalmol. 2022;66(3):265-270. [CrossRef]
- Ang WJ, Zunaina E, Norfadzillah AJ, Raja-Norliza RO, Julieana M, Ab-Hamid SA; et al. Evaluation of vascular endothelial growth factor levels in tears and serum among diabetic patients. PLoS ONE. 2019;14(8):e0221481. eCollection 2019. [CrossRef]
- Tsai FY, Lau LI, Li AF, Chen SJ, Wang SE, Lee FL; et al. Acute macular edema and peripapillary soft exudate after pancreas transplantation with accelerated progression of diabetic retinopathy. J Chin Med Assoc. 2017;80(5):319-325. [CrossRef]
- Giannarelli R, Coppelli A, Sartini MS, Del Chiaro M, Vistoli F, Rizzo G; et al. Pancreas transplant alone has beneficial effects on retinopathy in type 1 diabetic patients. Diabetologia. 2006;49(12):2977-2982. [CrossRef]
- Saini DC, Kochar A, Poonia R. Clinical correlation of diabetic retinopathy with nephropathy and neuropathy. Indian J Ophthalmol. 2021;69(11):3364-3368. [CrossRef]
- Fang J, Luo C, Zhang D, He Q, Liu L. Correlation between diabetic retinopathy and diabetic nephropathy: A two-sample Mendelian randomization study. Front Endocrinol (Lausanne). 2023;14:1265711. eCollection 2023. [CrossRef]
- Estaji M, Hosseini B, Bozorg-Qomi S, Ebrahimi B. Pathophysiology and diagnosis of diabetic retinopathy: A narrative review. J Investig Med. 2023;71(3):265-278. [CrossRef]
- Sun Z, Yang D, Tang Z, Ng DS, Cheung CY. Optical coherence tomography angiography in diabetic retinopathy: An updated review. Eye (Lond). 2021;35(1):149-161. [CrossRef]
- Wu R, Zhu Z, Zhou D. VEGF, apelin and HO-1 in diabetic patients with retinopathy: A correlation analysis. BMC Ophthalmol. 2020;20(1):326. [CrossRef]
- Park YG, Jee D, Kwon JW. Aqueous Humor Cytokine Levels in Diabetic Macular Edema Patients with Cotton-Wool Spots. J Diabetes Res. 2019;2019:8137417. [CrossRef]
- Kim YJ, Shin S, Han DJ, Kim YH, Lee JY, Yoon YH; et al. Long-term Effects of Pancreas Transplantation on Diabetic Retinopathy and Incidence and Predictive Risk Factors for Early Worsening. Transplantation. 2018;102(1):e30-e38. [CrossRef]
- Voglová B, Hladíková Z, Nemétová L, Zahradnická M, Kesslerová K, Sosna T; et al. Early worsening of diabetic retinopathy after simultaneous pancreas and kidney transplantation-Myth or reality? Am J Transplant. 2020;20(10):2832-2841. [CrossRef]
- Feldman-Billard S, Larger É, Massin P. Early worsening of diabetic retinopathy after rapid improvement of blood glucose control in patients with diabetes. Diabetes Metab. 2018;44(1):4-14. [CrossRef]
Figure 1.
Terminal diabetic ocular changes in the studied patients: A, iris rubeosis, hyphema, mature cataract (photo registration); B, total traction retinal detachment with sub-atrophic deformation of the eyeball (B-scan ultrasonography); and C, full thickness macular retinal rupture (optical coherence tomography).
Figure 1.
Terminal diabetic ocular changes in the studied patients: A, iris rubeosis, hyphema, mature cataract (photo registration); B, total traction retinal detachment with sub-atrophic deformation of the eyeball (B-scan ultrasonography); and C, full thickness macular retinal rupture (optical coherence tomography).
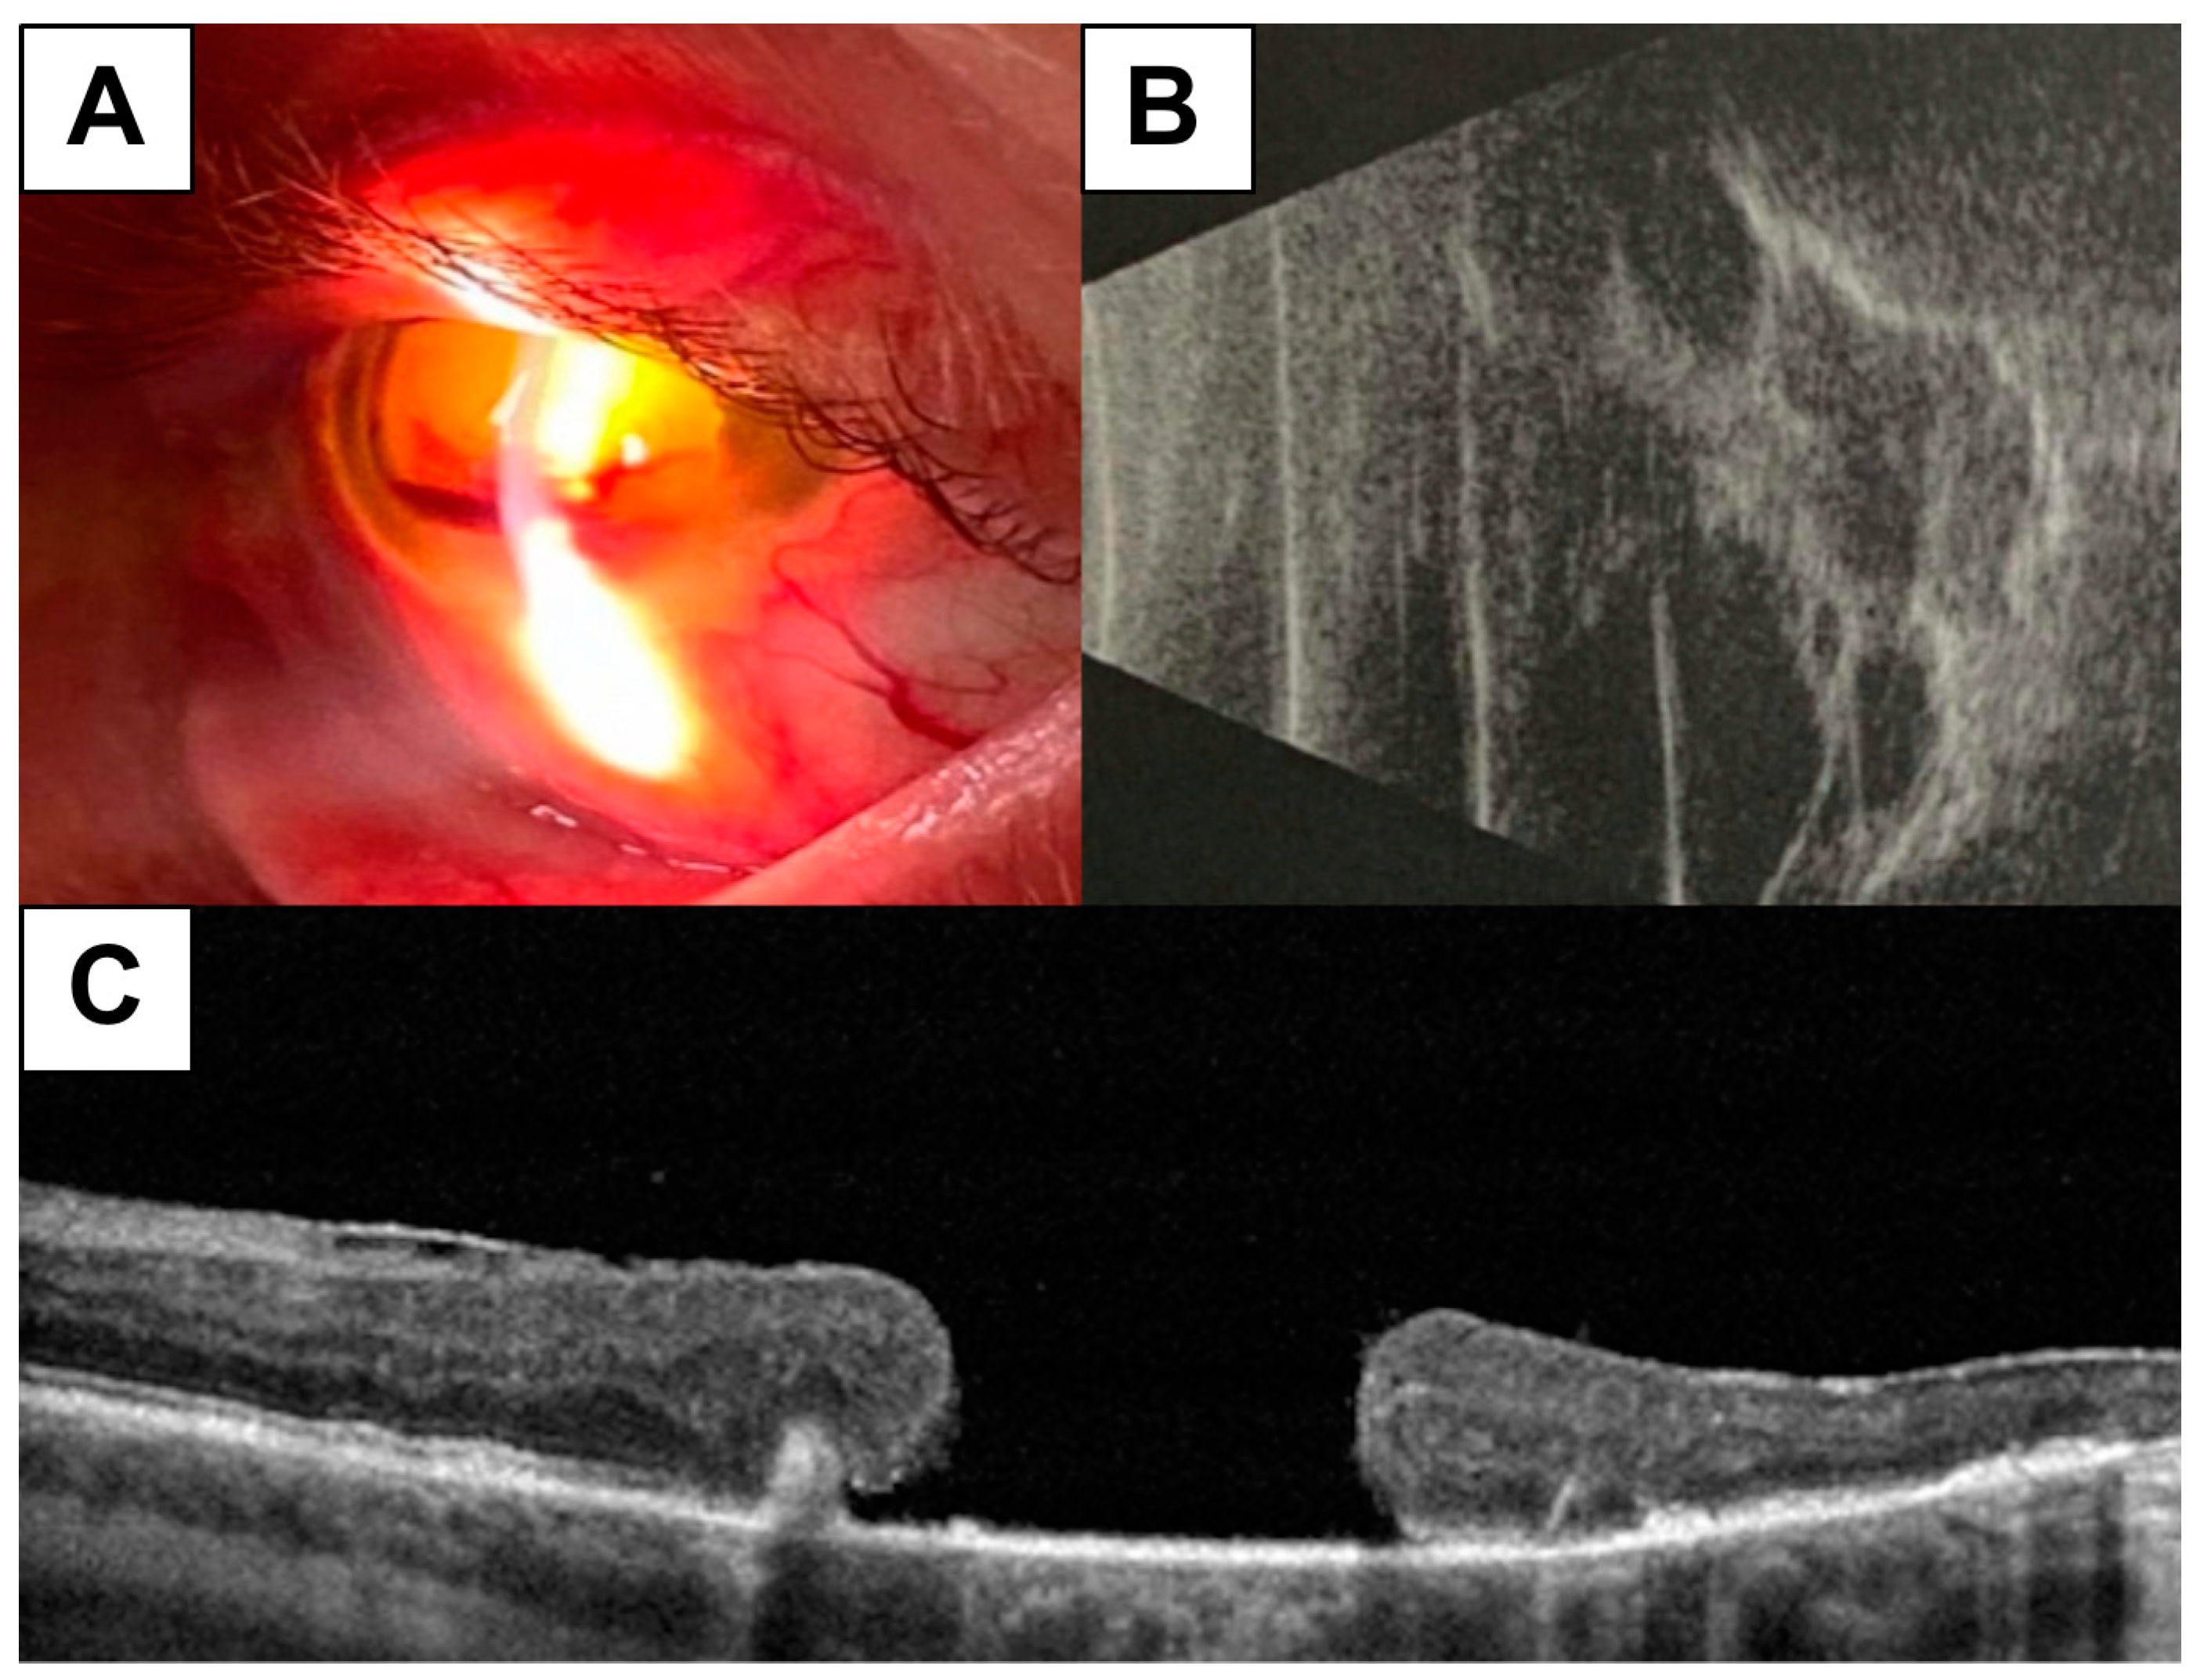
Figure 2.
Retinal hemoperfusion density analysis. Box and whisker plots showing the percentage of retinal hemoperfusion density are show for A, superficial capillary plexus in fovea; B, superficial capillary plexus in parafovea; C, deep capillary plexus in fovea; D, deep capillary plexus in parafovea. DR, diabetic rethinopathy; DME, diabetic macular oedema.
Figure 2.
Retinal hemoperfusion density analysis. Box and whisker plots showing the percentage of retinal hemoperfusion density are show for A, superficial capillary plexus in fovea; B, superficial capillary plexus in parafovea; C, deep capillary plexus in fovea; D, deep capillary plexus in parafovea. DR, diabetic rethinopathy; DME, diabetic macular oedema.
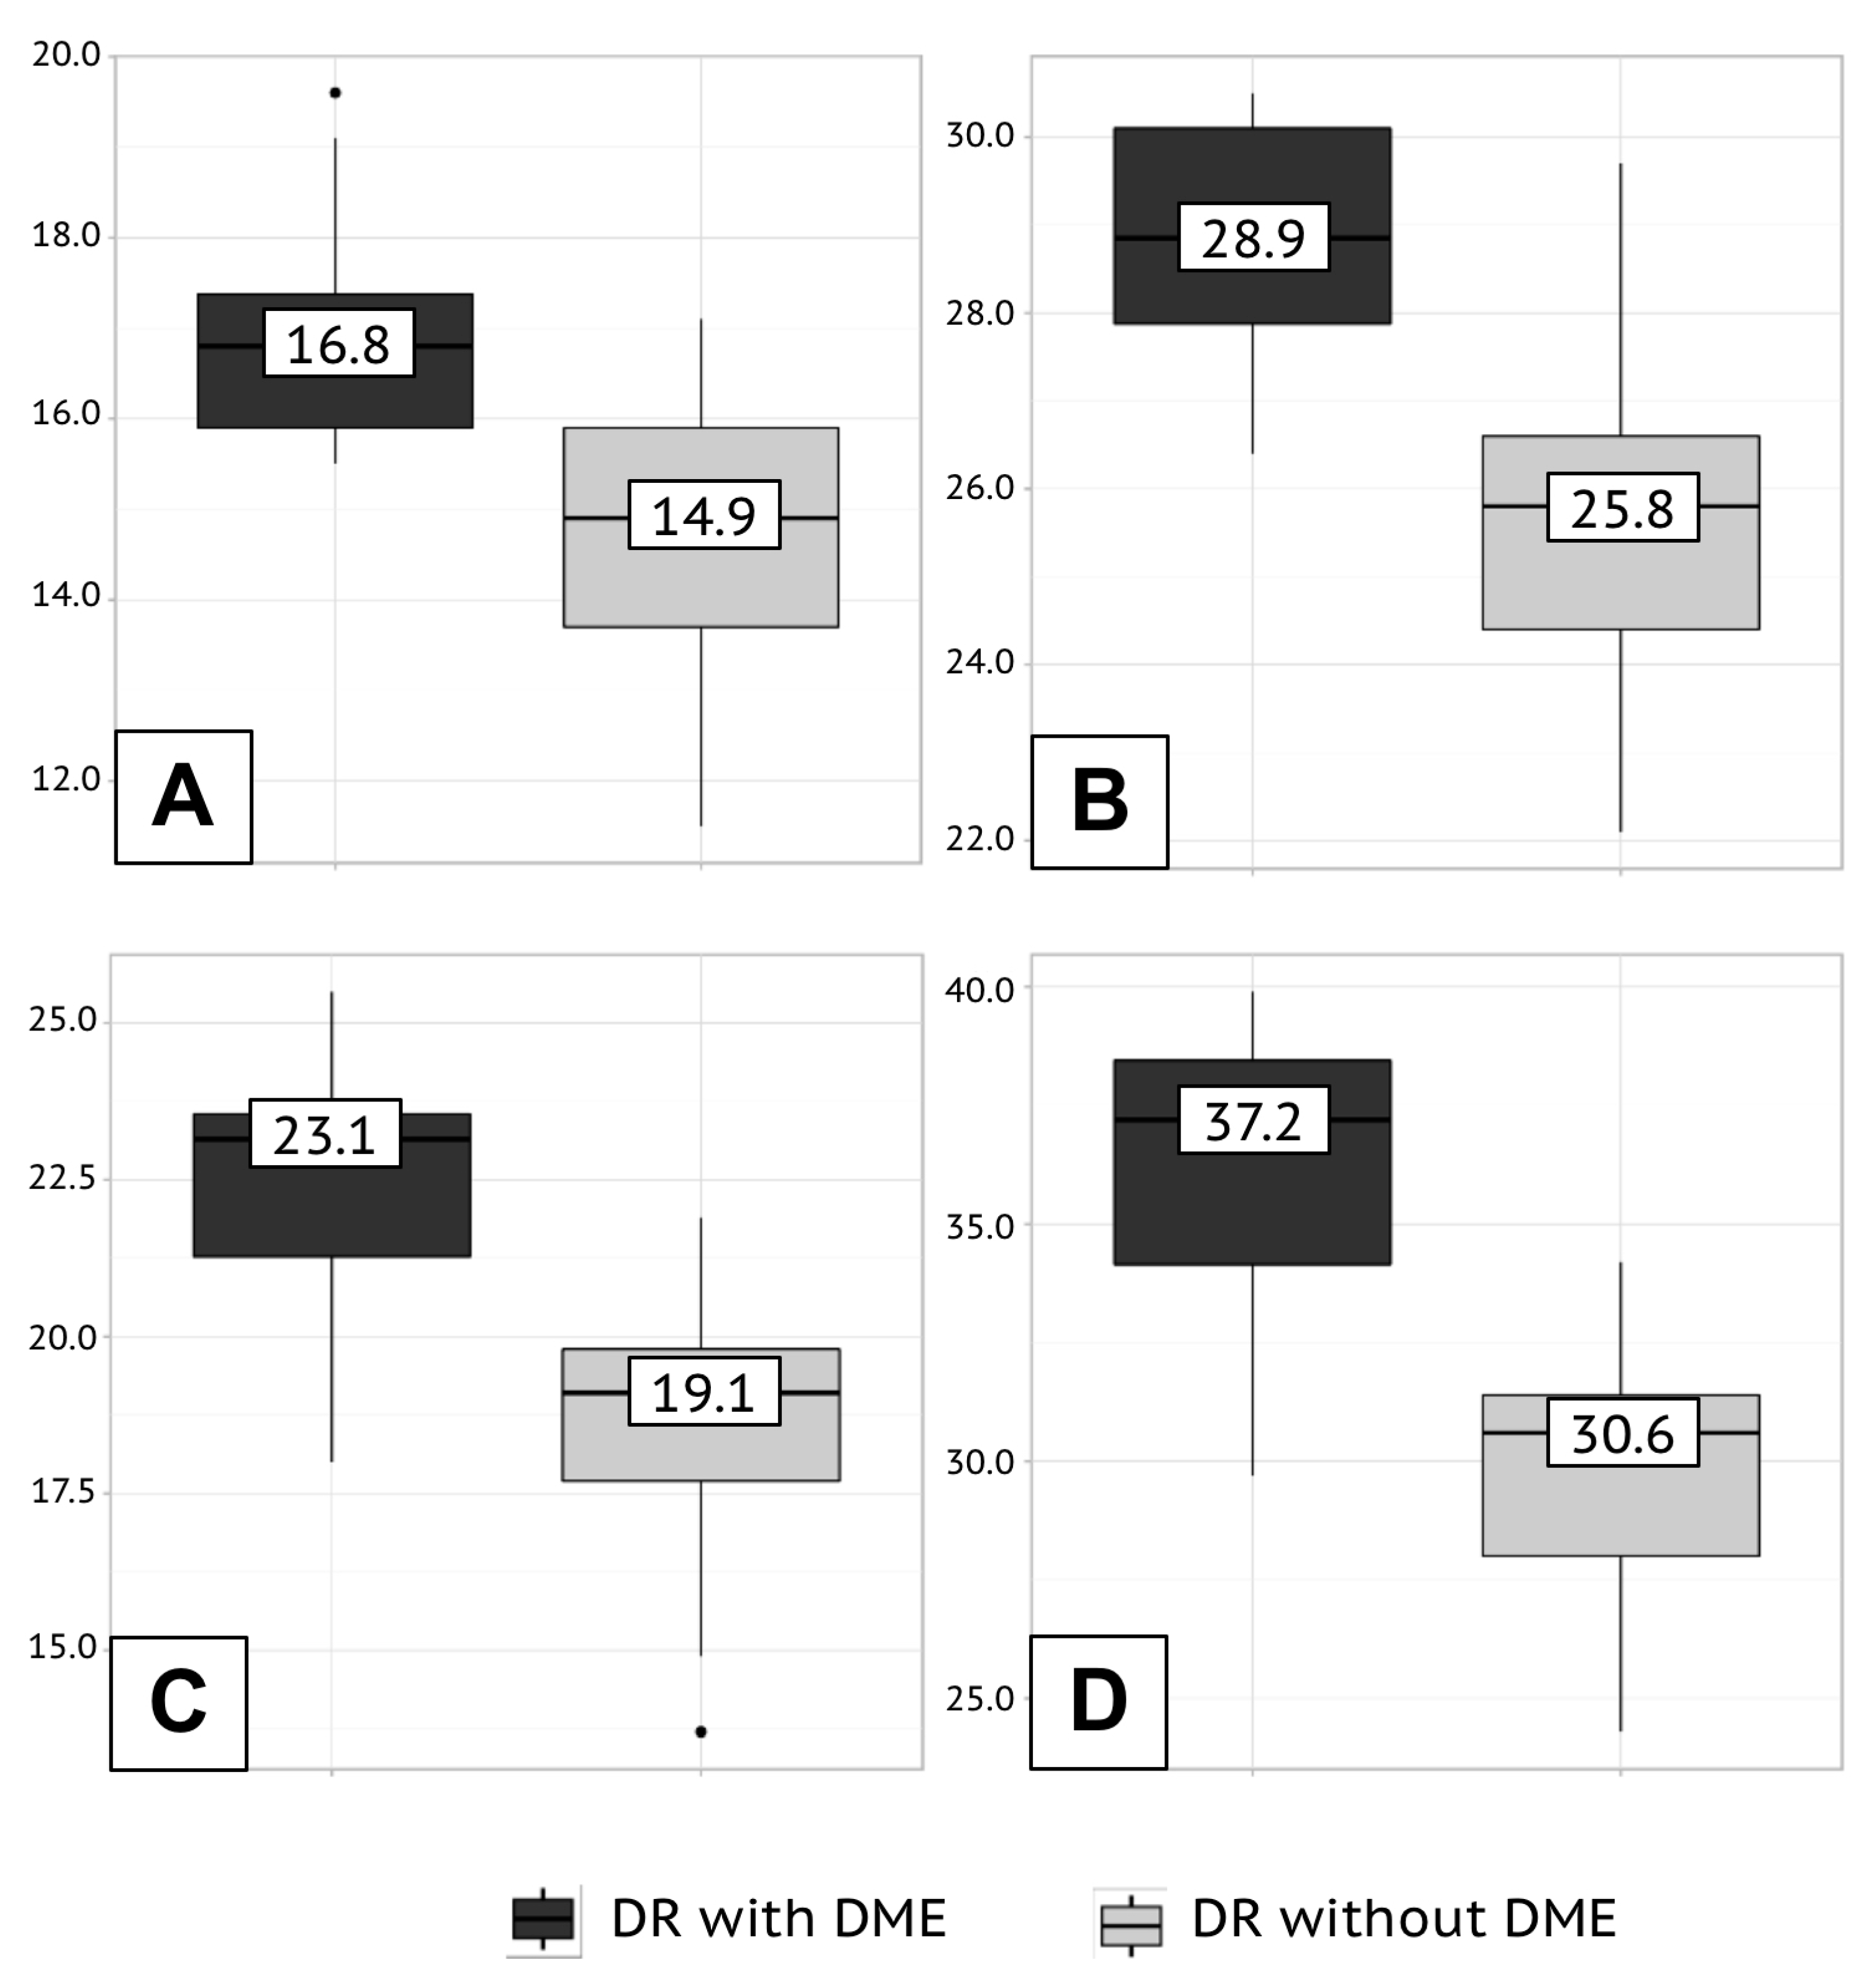

Table 1.
Patient demographic data.
| Parameter | Group 1 (n=30) | Group 2 (n=24) | Group 3 (n=25) | p-value |
|---|---|---|---|---|
| Men/women, n (%)/n (%) |
14 (47)/ 16(53) | 11 (46)/ 13(54) | 9 (36)/ 16(64) | р group 1-2 = 0.675 р group 1-3 = 0.045 р group 2-3 = 0.047 |
| Age, Me [Q1; Q3], years | 38 [34, 41] | 40 [34;45] | 39[32, 42] | р group 1-2 = 0.356 р group 1-3 = 0.581 р group 2-3 = 0.463 |
| Duration of diabetes, Me [Q1; Q3], years | 26 [22; 31] | 28 [25;31] | 27[23; 33] | р group 1-2 = 0.311 р group 1-3 = 0.289 р group 2-3 = 0.264 |
| Timing after transplantation Me [Q1; Q3], years |
– | 4 [2; 6] | 5 [3;7] | р group 2-3 = 0.346 |
Table 2.
Blood test results.
| Parameter | Group 1 | Group 2 | Group 3 | p-value |
|---|---|---|---|---|
| Fasting glycemia Me [Q1; Q3], mmol/l |
8.3 [7.6; 9.1] |
8.0 [7.4; 8.8] |
5.1 [3.9; 5.8] |
р group 1-2 = 0.723 р group 1-3 = 0.009† р group 2-3 = 0.011† |
| HbA1c Me [Q1; Q3], % |
9.2 [8.7; 11.2] |
9.1 [8.5; 10.7] |
5.2 [4.8; 5.7] |
р group 1-2 = 0.704 р group 1-3 = 0.013† р group 2-3 = 0.018† |
| Creatinine Me [Q1; Q3], µmol/l |
470.3 [376.2; 593.8] |
115.8 [81.1; 162.2] |
114.5 [76.7; 158.9] |
р group 1-2 <0.001† р group 1-3 <0.001† р group 2-3 = 0.341 |
| Urea Me [Q1; Q3], mmol/l |
7.8 [6.8; 8.4] |
6.1 [4.7; 7.0] |
6.4 [4.9; 7.2] |
р group 1-2 = 0.038† р group 1-3 = 0.043† р group 2-3 = 0.656 |
| GFR Me [Q1; Q3], ml/min/1.73m2 |
– | 60.1 [48.7; 63.9] |
58.8 [49.4; 64.8] |
р group 2-3 = 0.479 |
| †, significant differences (p<0.05) | ||||
Table 3.
The retinal perfusion density depending on the stage of retinopathy.
| The superficial capillary plexus of the retina | ||||
|---|---|---|---|---|
| The stage of DR | Me | Q1–Q3 | p-value | |
| Fovea | NPDR | 18.3 | 15.1 –20.0 | 0.005† |
| PDR | 14.4 | 12.4–16.5 | ||
| Parafovea | NPDR | 28.4 | 26.7–31.3 | <0.001† |
| PDR | 23.2 | 21.2–25.7 | ||
| Deep capillary plexus of the retina | ||||
| The stage of DR | Me | Q1–Q3 | p-value | |
| Fovea | NPDR | 23.6 | 21.0–25.2 | <0.001† |
| PDR | 19.3 | 18.1–23.6 | ||
| Parafovea | NPDR | 36.2 | 34.5–38.2 | <0.001† |
| PDR | 31.9 | 29.7–34.9 | ||
| †, significant differences (p<0.05); DR, diabetic retinopathy; NPDR, non-proliferative diabetic retinopathy; PDR, proliferative diabetic retinopathy | ||||
Table 4.
The retinal perfusion density analysis depending on the group.
| The superficial capillary plexus of the retina | ||||
| Me | Q1–Q3 | p-value | ||
| Fovea | Group 1 | 16.6 | 14.8–17.7 | р group 1-2 = 0.434 р group 1-3 = 0.031† р group 2-3 = 0.027† |
| Group 2 | 16.4 | 15.9–17.4 | ||
| Group 3 | 18.8 | 16.4–19.2 | ||
| Parafovea | Group 1 | 27.7 | 26.8–28.4 | р group 1-2 = 0.248 р group 1-3 = 0.017† р group 2-3 = 0.038† |
| Group 2 | 28.0 | 27.8–28.7 | ||
| Group 3 | 29.9 | 28.6–30.2 | ||
| Deep capillary plexus of the retina | ||||
| Me | Q1–Q3 | p-value | ||
| Fovea | Group 1 | 22.2 | 21.4–23.7 | р group 1-2 = 0.673 р group 1-3 = 0.019† р group 2-3 = 0.022† |
| Group 2 | 22.4 | 20.5–23.8 | ||
| Group 3 | 25.5 | 24.0–26.2 | ||
| Parafovea | Group 1 | 35.1 | 33.8–36.6 | р group 1-2 = 0.077 р group 1-3 = 0.03† р group 2-3 <0.001† |
| Group 2 | 34.8 | 32.3–37.1 | ||
| Group 3 | 37.2 | 36.7–38.8 | ||
| †, significant differences (p <0.05) | ||||
Table 5.
The tear VEGF-A concentration in several clinical manifestations of diabetic retinopathy.
| VEGF–A, pg/ml | Changes in the fundus | Me | Q1–Q3 | p-value | |
| DR±DMO | DR with DMO | 2673.5 | 2296.3–2944.7 | <0.001† | |
| DR without DMO | 1856.2 | 1687.1–1933.6 | |||
| PDR | Active phase | 2395.7 | 2284.2–2590.1 | <0.001† | |
| Remission phase | 1687.7 | 1553.8–1809.4 | |||
| †, significant differences (p<0.05); DR, diabetic retinopathy; DMO, diabetic macular oedema; PDR, proliferative diabetic retinopathy | |||||
Table 6.
Tear VEGF-A concentration in different patient groups.
|
VEGF–A, pg/ml |
Me | Q1–Q3 | p-value | |
| Group 1 | 2270.3 | 1860.1–2380.8 | р group 1-2 =0.139 р group 1-3 =0.016† р group 2-3 = 0.023† |
|
| Group 2 | 2241.3 | 1995.8–2391.6 | ||
| Group 3 | 1826.7 | 1706.5–2078.4 | ||
| †, significant differences (p <0.05) | ||||
Disclaimer/Publisher’s Note: The statements, opinions and data contained in all publications are solely those of the individual author(s) and contributor(s) and not of MDPI and/or the editor(s). MDPI and/or the editor(s) disclaim responsibility for any injury to people or property resulting from any ideas, methods, instructions or products referred to in the content. |
© 2024 by the authors. Licensee MDPI, Basel, Switzerland. This article is an open access article distributed under the terms and conditions of the Creative Commons Attribution (CC BY) license (http://creativecommons.org/licenses/by/4.0/).
Copyright: This open access article is published under a Creative Commons CC BY 4.0 license, which permit the free download, distribution, and reuse, provided that the author and preprint are cited in any reuse.


