1. Introduction
Boron Neutron Capture Therapy (BNCT) is a two-step treatment involving the administration of a compound containing the
10B isotope to the patient. One of the two boron carriers approved for clinical use is
10BPA (4-borono-l-phenylalanine). The increased metabolic activity of cancer cells is exploited in BNCT, also associated with increased expression of transporters from the SLC (LAT) protein family, which results in higher a concentration of the
10B compound in cancer cells compared to normal cells [
2,
3]. For effective therapy, the boron concentration ratio between cancer and normal cells should be at least 3:1 [
4,
5,
6]. The affected area of the patient's body is then irradiated with a field of thermal or epithermal neutrons, depending on the tumor location. In cancer cells loaded with boron, due to its high cross-section for the thermal neutron capture process (3835 barns at 25 meV of neutron energy), the
10B isotope turns into an unstable, short-living isotope
11B, which decays into short-range highly energetic particles: an α particle and a lithium nucleus (
7Li). Their high Linear Energy Transfer (LET) results in high dose deposition and short tissue penetration of less than 10 µm, which corresponds to the size of a single cell [
7]. Thus, only the cells containing
10B are damaged, with minimum influence on the surrounding normal cells [
4,
6,
8]. Both of these factors, the appropriate concentration of
10B in the tumor cells (20-35 µg
10B/g of tissue), and proper neutron field, enables highly selective tumor destruction by BNCT [
6,
9]. The greatest advantage of this therapy is the selective destruction of tumor cells without requiring precise knowledge of the tumor's location. Although there has been increasing interest in BNCT recently, mainly through the development of technology to provide neutron sources capable of being installed inside the hospital environment and thus establishment of new patient centers, there are still several aspects that need to be improved to increase the effectiveness of the therapy [
7].
The focus of the presented work is a preclinical evaluation of BNCT for melanoma. For this purpose of in vitro research, an appropriate cellular model is required [
10,
11,
12]. Recently, spheroids have been increasingly used as a model in cancer therapy research, due to their many similarities to solid tumors [
13,
14,
15,
16]. These include layered structures with the outermost layer composed of proliferating cells, a middle layer of viable but nonproliferating cells, and a central necrotic core of dead cells. This organization, driven in part by the limited availability of nutrients and oxygen, participated in the creation of a tumor-like microenvironment characterized by lower pH, hypoxia, and the accumulation of metabolic waste [
17,
18]. Additionally, the cell-cell contact, cell signaling, and extracellular matrix deposition observed in both tumors and 3D cultures, form some protection barriers against drug penetration and radiotherapy. Both structures show similarities in growth kinetics or expression pattern of certain genes, mainly involving proliferation, migration and invasion. The similarities, among spheroids and solid tumors make spheroids a promising in vitro model which could reflect tumor response to therapy [
17,
18,
19]. One promising application of BNCT is in the treatment of melanoma. It is a very aggressive form of skin cancer originating in melanocytes, the melanin-producing cells in the epidermis. The high mortality rate of melanoma patients is associated with late diagnosis, poor prognosis, and limited treatment efficacy [
1]. BNCT offers a potential opportunity to prolong survival and improve the quality of life in the case of this disease [
7].
The purpose of our study was to evaluate melanoma spheroids as a model for in vitro testing of the BNCT effect. We investigated melanoma cells in two models (2D and 3D cell culture) as well as melanocytes as a control (2D) to assess DNA damage after BNCT and neutron radiation alone. In addition, we evaluated the growth inhibition of melanoma spheroids (measuring changes in diameter and Ki67 protein levels), and DNA damage after BNCT at two different radiation doses, with and without the presence of 10B in the cells.
2. Materials and Methods
2.1. Cell Cultures
Commercially available human melanoma cell lines FM55p and WM266-4 obtained from the ESTDAB Melanoma Cell Bank (Tübingen, Germany) were used. Cells were cultured in RPMI 1640 medium (Cat. No. 21875091 Gibco™ Paisley, UK) supplemented with 10% with Fetal Bovine Serum (Cat. No. 10500064 Gibco™ Paisley, UK), 2 mM L-Glutamine (Cat. No. 25030081 Gibco™ Paisley, UK), 100 U/mL Penicillin and 100 µg/mL Streptomycin (Cat. No. 15140122 Gibco™). The melanocyte cell line HEMa-LP, was cultured in M254 medium (Cat. No. M254500 Gibco™ Paisley, UK) with Human Melanocyte Growth Supplement-2 (Cat. No. S0165 Gibco™ Paisley, UK), 100 U/mL Penicillin and 100 µg/mL Streptomycin (Cat. No. 15140122 Gibco™). Cells were seeded into T75 cm2 dish and cultured at 37°C and 5% CO2 atmosphere. The culture medium was replaced every second day.
Melanoma 3D spheroids were obtained in 96 well U-shape low adhesive plate (Cat. No. 34896 3DTM Cell Floater Plate SPL Life Science, Korea) after seeding 2000 cells per well. Spheroids were incubated at 37°C in a humidified atmosphere of 5% CO2, and the 75% culture medium was replaced every second day.
2.2. BPA-Fructose Solution Preparation
BPA solution was prepared at a concentration of 0.14 M.
10B-enriched p-boronophenylalanine (Cat. No. 00905018, Interpharma Praha) was mixed in water with a 10% molar excess of fructose [
20]. The pH of the solution was changed to alkaline with NaOH, to allow easier dissolution of BPA crystals. Then the solution was stirred up to the BPA was completely dissolved, then the pH was neutralized with HCl.
2.3. Boron Uptake Experiments
Cells in the exponential growth phase and the 7th-day old spheroids were used to determine the uptake of 10B. Cells growing in T75 cm2 dishes, and spheroids in plates, were incubated for 2 h, 4 h, 6 h, and 24 h with BPA (50 µg 10B/ml). Control samples were incubated with a standard growth medium. After incubation, the medium was removed and cells were washed three times with PBS w/o Ca2+, Mg2+ (Cat. No. 10010056 GibcoTM Paisley, UK). Next, cells were harvested by trypsinization (0.25% trypsin (Trypsin – EDTA, Cat. No. 25200072 Gibco™ Paisley, UK)) and centrifuged at 260 g for 10 min (Hermle Z300K). Subsequently, pellets of cells were resuspended in fresh medium, and cells were counted with trypan blue dye (Cat. No. T8154, Sigma Aldrich) in automatic cell counter LUNA II. Single-cell suspension was transferred into 5 ml Eppendorf tubes and centrifuged at 300 g for 5 min (Eppendorf 5424R). Regarding spheroids, they were collected in tubes after incubation and after centrifugation they were washed three times with PBS w/o Ca2+, Mg2+. Pellets of cells (spheroids) were weighed (cell mass was 50 – 100 mg), and 1 ml of concentrated nitric acid was added to each sample, then they were left for 1.5 h under the fume hood and finally placed in the refrigerator until ICP-MS measurement.
2.4. Inductively Coupled Plasma Mass Spectrometry (ICP-MS) Measurements
To confirm boron uptake by cells and exclude any possible contamination, ICP-MS measurements were performed. Samples previously pretreated with nitric acid were transferred into Teflon hermetic vessels and subjected to mineralization supported by microwave radiation (Anton Paar, Multiwave 3000, 4 x XF100, max. 60 atm., p-rate 0.4 bar/s, IR 240°C). Digest of samples was diluted 10 times with 1% v/v nitric acid directly before the analysis by an Inductively Coupled Plasma Mass Spectrometer (Perkin Elmer Elan DRC-e) with parameters given in
Table 1. Boron concentration was measured as
10B isotope, with the use of a calibrator curve prepared using a Merck ICP-MS Multi Element Standard no. IV (23 Elements) Centipur, where the abundance of boron in the standard was:
10B – 19.9% and
11B – 80.1%. Since the cells were incubated with medium with monoisotopic compound (
10B), mathematical corrections were made on the obtained results. After each sample blank signal was checked and additional standard was used to control stability of the measurements (boron standard solution of 10 mg/l in water dedicated to ICP-MS, ARISTAR).
2.5. Neutron Irradiation. Experimental Design
Cells were irradiated in the thermal column of the Triga Mark II research nuclear reactor of the Applied Nuclear Energy Laboratory (L.E.N.A.) of Pavia University. Samples were placed in the thermal column as shown in
Figure 1, 130.95 cm from the center of the reactor core, in an air channel with dimensions 40 x 20 x 100 cm
3. It is made of graphite blocks which thermalize the fission neutron and contains two bismuth filters to reduce the gamma radiation background coming from the reactor core. Cells were irradiated with thermal neutrons so that the 2D cultures containing boron received a dose of about 2 Gy. In the case of spheroids the delivered dose was about 2 Gy for the first set of 96 well plates and 6 Gy for the second one. The thermal neutron flux at the sample irradiation position can be determined directly from the reactor power. Thus the reactor powers for irradiation were determined using Equation 1 [
21,
22] to achieve the assumed doses with an irradiation time
fixed to 600 s. The reactor power, thermal neutron flux, and doses received by cells (with and without boron) are shown in
Table 2. Each cell line, containing boron and without it, was irradiated with the same thermal neutron fluence.
The total dose
administered to the cells during the time interval
with the reactor power at the level of
P (in kW) was calculated based on the following parametrization given in Ref. [
22]:
where
is the background dose rate equal to the sum of contributions due to:
14N(n,p)
14C reaction, neutron scattering on hydrogen, and γ-rays at the irradiation position (including the 2.2 MeV photons from the
1H(n,γ)
2H reaction). The dose rate associated with boron was estimated by determination of the
10B (n,α)
7Li reaction contribution assuming 1 ppm of
10B multiplied by the concentration, C_B, the latter determined for each cell line by ICP-MS measurements before the irradiation. Both
and
were estimated assuming the reactor working at the maximum power (250 kW).
The
and
dose rates were determined using Monte Carlo simulations with the PHITS v3.341 [
23] and MCNPv6.2 [
24] codes. Simulations were done in two steps. The MCNP code was used to determine the neutron and γ-rays background fluxes at the irradiation position. Both the geometry and the models of particle interaction with the reactor material and samples were optimized based on the previously performed dosimetric measurements in the thermal column [
22]. The characterization of the neutron field and the accompanying γ flux were performed using both Monte Carlo methods (MCNP5) and activation measurements (set of Au, In, Mn, Cu, W foils) for neutron energies up to several MeV. Alanine dosimeters were used to measure doses from gamma quanta. Details of the simulation tuning and the dosimetric measurements can be found in [
22]. With MCNP we have determined the energy distribution and flux of neutrons and γ-rays passing through a cube of 20 cm side surrounding the irradiated samples. This data was used as a source for the PHITS simulations performed to determine the doses delivered to the irradiated cells. We have implemented detailed geometry of the T25 cell culture flask for the 2D cultures and the 96 well plate for spheroids assuming they are made of 1 mm thick polystyrene (the elemental composition was taken from [
25]). Based on the known volume of the samples (1.5 cm
3), and the flask area (25 cm
2) we have implemented an 80 μm thick layer of medium and 10 μm thick 2D cell cultures. In the case of spheroids, the 1 mm cell spheres immersed in 0.2 cm
3 of medium were simulated. The elemental composition of the medium was taken from Ref. [
21] while cells were simulated as the average adult male healthy soft tissue according to the ICRU-44 recommendations [
26]. The dose rates were estimated for each of the cell flasks and each of the spheroid separately, assuming for
1 ppm of
10B concentrations. The values are reported in
Table 3.
These values were also quite uniform for all the simulated 2D cell cultures and spheroids (the standard deviation of the estimated dose rates did not exceed 1%). The mean values of
and
obtained for cells cultured in 2D and spheroids are presented in
Table 3 together with the contributions due to the neutron interactions with nitrogen, hydrogen and due to γ-rays.
Using the calculated values of
and
we estimated doses delivered to the irradiated cell cultures according to Equation 1. The obtained values are gathered in Table 2 alongside with the measured boron concentrations, used reactor powers, and neutron fluxes. Since the precise elemental content of the studied cell cultures is not known we have checked the influence of the assumed mass elemental ratios on the estimated doses by repeating the calculations for ICRU-44 human skin [
26]. Significant changes in the dose values were found for the nitrogen only, and thus, we reported them as systematic uncertainty od the calculations. As one can see the dose values for spheroids are generally higher than those for the 2D cultures. In the following sections, for simplicity, all cells and spheroids irradiated with neutrons after incubation with or without BPA are referred as the lower dose group (2 Gy of reference dose) and the higher dose group (6 Gy of reference dose).
Cells and spheroids were divided into the following groups: (1) IR_B: cells incubated with
10BPA for 4 h before neutron irradiation; (2) IR: cells without
10BPA and irradiated with neutrons; (3) C_B: cells incubated with
10BPA for 4 h and not exposed to neutrons; (4) C: cells without
10BPA and not irradiated with neutrons. Cells were grown and irradiated in T25 cm
2 flasks (2D culture) and 96-well plate (spheroids). All experiments were conducted in triplicate. Biological assays were carried out 1 h, 24 h, and 48 h after neutron irradiation and they included: DNA damage assay, spheroids proliferation assay, as well as microscopic imaging (
Figure 2).
2.6. DNA Damage Level – Comet Assay
Cells and spheroids were collected as described above. The pellet of the cells was resuspended in a freezing medium and stored at -80°C until the test. To avoid crystals formation the melanoma cells were frozen in the RPMI medium with 20% FBS and 10% Dimethyl Sulfoxide, DMSO (Cat. No. D12345, Invitrogen™), while melanocytes were frozen in Medium 254, with 20% FBS, and 10% DMSO.
DNA damages were tested by the standardized alkaline comet assay, as described by Panek A. et al., [
27] with minor modifications. Cells were thawed in a water bath (37°C), immediately transferred into 4 ml of standard growth medium, and centrifuged in a chilled centrifuge at 750 g (Hermle Z300K ) for 3 min. Next, cells were mixed with 0.5% low melting agarose gel in a ratio of 1:3 and transferred onto a pre-coated basic slide with 1% agarose gel. Cells were lysed by incubating for 1 h at 4°C in a pre-chilled Lysis Buffer (2.5 M NaCl, 100 mM EDTA, 10 mM TRIS, 175 mM NaOH, pH=10 mixed with 10% DMSO and 1% Triton-X) immediately before use. Next, slides were washed for 3 min in distilled water and transferred into the chilled electrophoresis chamber and they were incubated for 20 min at 4°C in pre-chilled Electrophoresis Buffer (0.3 M NaOH, 1 mM EDTA in chilled distilled water, pH>13). Alkaline electrophoresis was performed under the following parameters: 4°C, 28 V, 300 mA for 30 min. After the electrophoresis DNA was neutralized by washing slides three times for 5 min each in Tris buffer, pH = 7.5. Finally, DNA was stained with ethidium bromide (4 µg/ml) and visualized using the epifluorescence microscope Olympus BX-50 (100 W mercuric lamp, excitation filter 515-560 nm, barrier filter from 590 nm; Olympus, Tokyo, Japan) connected to a CCD camera (Pulnix, Kinetic, Liverpool, UK). The Komet 3.0 program (Kinetic Imaging Company, Liverpool, UK) was used to analyze the comet images. DNA damage was quantified using the DNA tail parameter (percentage of DNA in the comet tail), where changes in its distribution are considered as a sensitive indicator of DNA damage. For each sample, 100 – 200 cells were counted in three replicates.
2.7. Spheroids Growth Analysis
An average of 43 spheroids images were taken just before neutron irradiation and also 1 h, 24 h, and 48 h after irradiation. The spheroids’ size (diameter) and shape (circularity) were analyzed with the ImageJ software (v 1.52p) using customized macro. Spheroids diameter was normalized to the diameter measured before the irradiation.
2.8. Proliferation Assay
At 1 h, 24 h, and 48 h after irradiation six spheroids were collected into a 1.5 ml Eppendorf tube. Spheroids were dissociated as described above. The pellet of cells was fixed in ice-cold 70% ethanol and stored at -20°C until analysis. Fixed cells were prepared for cytometer analysis according to the manufacturer's protocol. Briefly, cells were washed with PBS with 1% FBS and centrifuged at 500 g (Hermle Z300K) for 10 min. twice, and resuspended to a concentration of 1 x 10⁷/ml. Next, 100 µl of cell suspension was transferred into a 5 ml tube and 20 µl of anti-Ki67 antibody (Cat. No. 556026, BD Biosciences) was added, mixed gently, and incubated for 30 min at room temperature in the dark. Then, cells were washed with PBS with 1% FBS and centrifuged at 500 g (Hermle Z300K) for 5 min and resuspended in PBS with 1% FBS and PI was added. Cells were analyzed with a Cell Stream Flow Cytometer (Luminex). The fluorescence signal was collected in channel C3 (for Ki67) for excitation at 488 nm and emission at 528/46 nm, and in channel C6 (for PI), for excitation at 488 nm and emission at 702/87 nm. Analysis was performed using the Cell Stream Analysis 1.2.272 software.
2.9. Statistical Analysis Applied to the Obtained Data
The statistical significance of compared data samples was quantified using the two sample t test at the significance level of 95% with the alternative hypothesis assuming significant differences between means of each samples (not assuming the equality of variances). In case of the DNA damage scoring, spheroids shape parameters and the proliferation assay Ki67 expression level, the uncertainties were estimated as the variance of the mean with the following formula:
where n is the size of the sample,
are the measured values and
represets their mean value. Additionally, the uncertainties of the estimated doses delivered to the cells were calculated using the Error Propagation Law taking into account the uncertainties of all the quantities used In Equation 1. The dominant contribution to this uncertainties appears to be do to the boron concentration listed in
Table 2.
4. Discussion
The 3D cellular models, including spheroids and tumorspheres, are often used in research for finding new biomarkers, or anticancer therapies [
11,
12,
29,
30]. Spheroids produced from melanoma cells constitute a well-described in vitro research model [
10,
29,
31,
32,
33,
34].
Melanoma cell lines exhibit varying uptake of BPA based on their metabolism, as previously demonstrated by M. Carpano et al. [
20]. This study not only showed the biodistribution of
10B in different organs but also showed the pharmacodynamics of BPA in melanoma tumors. Therefore, testing boron carriers on
in vitro models that best reflect the nature of the tumor is the optimal strategy for pre-clinical BNCT studies. Additionally, it is crucial to measure the concentration of
10B to assess the pharmacokinetics of BPA in the tested cell lines [
20,
35,
36,
37,
38]. In our study, we confirmed that boron concentration in melanoma is dependent on the duration of incubation with BPA, reaching its maximum after 4 hours. These changes in kinetics were significant for the 3D culture.
Our research carried out on 2D cell cultures showed the lowest
10B concentration in the primary, pigmented FM55p cell line (0.057 ± 0.015 µg
10B/10
6 cells), then the metastatic, non-pigmented WM266-4 (0.156 ± 0.002 µg
10B/10
6 cells) and the highest
10B concentration was demonstrated by normal, pigmented HEMa-LP cell line (0.238 ± 0.017 µg
10B/10
6 cells). Opposite results obtained by Faião-Flores et al. show a higher
10B concentration in murine melanoma cells (B16F10) than in human melanocytes [
39]. However, the melanoma cell line used in their study also had higher levels of melanin compared to melanocytes. These findings support the theory that cells containing melanin have a greater capacity to uptake BPA. Moreover, Coderre et al. examined BPA uptake by differently pigmented melanoma cells, proving that amelanotic melanoma cells were characterized by lower
10B concentration than melanin-containing cells [
40]. In contrast to these findings, our results indicate that amelanotic melanoma cells had a higher
10B concentration than the pigmented melanoma cell line.
Wittig et al., in their publication, tested different temperatures and medium compositions on BPA uptake and efflux [
41]. These authors supported the hypothesis about BPA transportation by the L-system for neutral amino acids and provided evidence that BPA taken up by cells is not metabolized or used as a substrate in melanogenesis. These results were not consistent with the theory of greater BPA uptake by pigmented cells and agree with our results. A similar experiment was conducted by Carpano et al., confirming the cell line- and time-dependent uptake of BPA by melanoma cells, and obtaining the highest concentration
10B after 4 h of incubation [
20]. They used three different melanoma cell lines that achieved
10B concentration: Mel-J – pigmented, metastatic (0.119 ± 0.016 µg B/10
6 cells), then for A375- amelanotic, metastatic (0.109 ± 0.007 µg B/10
6 cells), and the lowest for M8- amelanotic, primary (0.035 ± 0.007 µg B/10
6 cells) cell line [
20]. For melanoma spheroids, the results of
10B concentration were opposite to those of FM55p and WM266-4 cell lines in 2D culture. The highest
10B content was observed in FM55p spheroids at 0.70 ± 0.15 µg B/10
6 cells at 4 h of incubation, which was 12 times higher than that obtained in 2D culture. In spheroids of the WM266-4 cell line,
10B concentration was 0.25 ± 0.03 µg B/10
6 cells at 4 h of incubation (1.6 times higher than for 2D culture). We would assume that metabolic activity and LAT1 transporter expression contribute to boron uptake and efflux [
2,
3,
42]. Yu et al. also obtained higher boron concentration in spheroids than in 2D culture after 4 h BPA incubation with human pancreatic cancer cells [
43]. They compared two cell lines, Panc-1 and BxPC-3 in the 3D and 2D type of cultures and obtained a lower
10B concentration for the 3D BxPC-3 cell line than for 2D and the opposite for Panc-1 cell line. These may suggest that the uptake of
10B depends not only on the cell line but also on the type of culture used (2D vs 3D).
To assess the impact of neutron irradiation with and without
10B on melanoma cells in 3D cell culture, we carried out analysis of the size and shape of spheroids, DNA damage, and cell proliferation. Comet assay was performed for melanoma cells growing in 2D cell culture and for melanocytes (2D). The influence of a 2 Gy dose of neutron irradiation (IR_B) on 2D cell culture was different for the tested cell lines. At 1 h after neutron irradiation , the highest DNA of damage level was obtained for melanocytes with 18.3 ± 1.1% of tail DNA, next for the primary melanoma cell line, FM55p, 16.4 ± 0.5% of tail DNA, and no increase in DNA damage level for metastatic melanoma – WM266-4 cell line. For the HEMa-LP and FM55p cell lines DNA damages were significantly higher for IR_B than IR cells. However, for melanocytes, they decreased to control and IR level at 24 h after irradiation while for FM55p it was still on the same level as measured at 1 h after irradiation. Such an effect on the normal line may indicate an effective DNA repair system. Rodriguez et al., examined DNA damage following BNCT in melanoma cells (Mel-J cell line) by the histone H2AX phosphorylation (γH2AX) analysis [
44]. Their results showed high DNA damage in melanoma cells which decreased 24 h after irradiation. A similar observation was made by Chen et al., who studied the impact of BNCT on hepatocellular carcinoma cells [
45]. They found the highest incidence of double-strand breaks 4 h post-irradiation, with the damage decreasing over time. Analysis of DNA damage in the FM55p cell line spheroids revealed higher DNA damage (19.9 ± 0.8 % of tail DNA) in comparison to 2D cells. Moreover, those damages were always significantly greater for the IR_B (with boron) than IR (without boron) spheroids. Additionally, dose-dependent DNA strand breaks were observed for the IR_B spheroids resulting in higher DNA damage for spheroids irradiated with a dose of 6 Gy (24.4 ± 0.6 % tail DNA). For the WM266-4 cell line, DNA damage was observed in 3D in contrast to the 2D cell culture. The damage was lower than for primary melanoma spheroids for both doses time (14.9 ± 0.9 % of tail DNA for 2 Gy and 18.7 ± 0.6 % of tail DNA for 6 Gy 1 h after irradiation). The results of the comet assay may suggest that spheroids are more susceptible to BNCT than 2D cell cultures. Similar findings were published by Yu et al., revealing higher DNA damage in spheroids of human pancreatic cancer cell lines than in 2D culture [
43].
The BNCT effect observed as spheroid growth inhibition (diameter) of the FM55p cell line spheroids, combined with high levels of Ki67 protein, may suggest a cell cycle arrest in the G2/M phase. After 24 h, there was an increase in spheroid diameter (faster for those irradiated with the lower 2Gy dose), and a decrease in Ki67 protein levels. This may indicate cell entry into the G0 phase of divided intact or repaired cells. WM266-4 cell line spheroids were also affected by BNCT. Similar to FM55p, WM266-4 spheroids show dose-dependent growth inhibition after BNCT demonstrated by both analysis of spheroid diameters and Ki67 protein levels. In IR_B spheroids irradiated with a dose of 2 Gy, growth inhibition (no increase in diameter) is noticeable not before 24 h after irradiation. In addition, for this dose, the Ki67 protein level was significantly lower than in the control starting from 24 h after irradiation (not before) and did not differ from the protein level for IR spheroids. In IR_B spheroids irradiated with a dose of 6 Gy growth inhibition appeared before decrease in spheroid diameter. The different results of the proliferation test for melanoma cell lines indicate a different response of the two melanoma cell lines to BNCT treatment. Considering this result, together with changes in spheroid diameter it could mean that BNCT inhibits cell proliferation of the WM266-4 cell line more effectively than FM55p (6Gy dose). These results may also suggest the disintegration of spheroids, which corresponds with the Ki67 protein levels that were significantly lower than in control and IR spheroids. A substantial reduction in the Ki67 protein level after BNCT in murine melanoma cells was observed by Faião-Flores et al. in comparison to control and neutron radiation [
46]. The decrease in spheroid diameter and reduction in the Ki67 protein level may indicate effective damage of the outer layer of proliferating cells caused by BNCT. Yu et al. observed disassembling of spheroids after BNCT [
47]. They showed a high number of double-strand breaks (γH2AX) and the presence of dead cells in the proliferating layer in spheroids suggesting that those cells are more susceptible to BNCT. Cells undergoing irradiation show G2/M cell cycle phase arrest which was demonstrated on hepatocarcinoma cells [
45], glioma stem/progenitor cells, a differentiated human glioma cell line [
48], and follicular thyroid carcinoma [
49].
For the experiments on the FM554 cell line without 10BPA irradiated with 6 Gy dose the results for time points at 24h and 48h are missing due to unexpected contamination of analyzed spheroids. Unfortunately, due to time constrains it was impossible to perform this experiment again. The other effects influencing the presented studies are freezing and thawing procedures, that could influence the level of DNA damage. Thus, they can affect the quality of the extracted DNA and the sensitivity and specificity of the comet assay analysis.
3.1. Conclusions
Melanoma is an aggressive, often late-detected skin cancer that is challenging to treat, highlighting the need for effective therapies. One promising approach is Boron Neutron Capture Therapy (BNCT). Melanoma spheroids can serve as valuable in vitro models for testing new boron carriers and evaluating the effects of BNCT. Our study demonstrates that the uptake of BPA and cellular response to treatment can vary depending on the cell lines and culture conditions. While further investigations are needed, our findings suggest a personalized approach to selecting the appropriate treatment method, particularly in choosing boron carriers for BNCT. A deeper understanding of cell metabolism and DNA repair mechanisms, alongside the use of suitable cell models, is essential for improving the efficacy of BNCT in melanoma therapy.
Author Contributions
Conceptualization: M.Sz., E.Ł.S. ; Data curation: M.Sz., A.P., A.T.; Formal analysis: M.Sz., M.S., A.P., A. T.; Funding acquisition: M.Sz., K. D.-K., E.Ł.S.; Investigation: M.Sz., A.T., K.D.-K. , S.A.; Methodology: M.Sz., M.S., A.P., A.T., S.A., E.Ł.S.; Project administration: E.Ł.S.; Resources: M.Sz., M.S., A.P., A.T., K. D.-K., G.P., S.A., E.Ł.S.; Supervision: M.S., E.Ł.S.; Validation: M.Sz., E.Ł.S.; Visualization: M.Sz.; Writing - original draft: M.Sz. M.S.; Writing - review & editing: All authors. All authors have read and agreed to the published version of the manuscript.
Figure 1.
Scheme of the thermal column with the position of the cells during irradiation marked (X). Cells were irradiated at a distance of 130.95 cm from the center of the reactor core. Colors represent the walls of the thermal column made from graphite (in green), bismuth (in orange), and boral (in purple). Figure made based on Ref. [
22].
Figure 2.
Scheme of the cell irradiation experiment. Melanoma cells (FM55p and WM266-4) and melanocytes (HEMa-LP) cultured in T25 cm2 flasks were irradiated with neutrons in the presence (IR_B) or absence (IR) of BPA. 7th-day melanoma spheroids formed in a 96-well low adhesive plate were irradiated with neutrons in the presence (IR_B) or absence (IR) of BPA. Control samples (not irradiated cells, incubated (C_B) or not (C) with BPA. Biological assays: a) comet assay b) spheroids size and shape assessment and c) Ki67 protein analysis, were performed 1 h, 24 h, and 48 h after irradiation. Created with BioRender.com.
Figure 3.
Boron concentration in cells after incubation with BPA, measured in melanoma cells (FM55p and WM266-4) and melanocytes (HEMa-LP) cultured in 2D type of culture and in the 3D model. Green diamond indicates HEMa-LP; red and pink squares – WM266-4 2D and 3D, respectively; dark and light blue circles – FM55p 2D and 3D, respectively. Data points represent mean concentration with standard deviation calculated using three measurements.
Figure 4.
Comet assay tests results obtained for a) FM55p melanoma line cells, b) WM266-4 melanoma cells and c) HEMa-LP melanocytes. Dark blue bars depict IR_B cells (2 Gy dose), the light blue bars indicate IR cells (2 Gy dose), the dark green bars correspond to C_B cells and light green bars indicate C cells (not irradiated). Data represent mean values with the standard deviation. * indicates statistically significant differences between IR_B and IR cells by the t-Student test (p<0.05), results shown in
Appendix B. The DNA damage scoring in a tail (expressed in percentage) was calculated as the DNA damage transcriptor [
28]; d) The
10B concentration (black bars) and the level of DNA damage (comet assay results) depending on cell line, type of cell culture, and delivered radiation dose. Squares, circles and triangles indicate the level of DNA damage after 1h, 24h, and 48h after irradiation, respectively; e) The DNA damages as a function of the
10B concentration for the same three points in time.
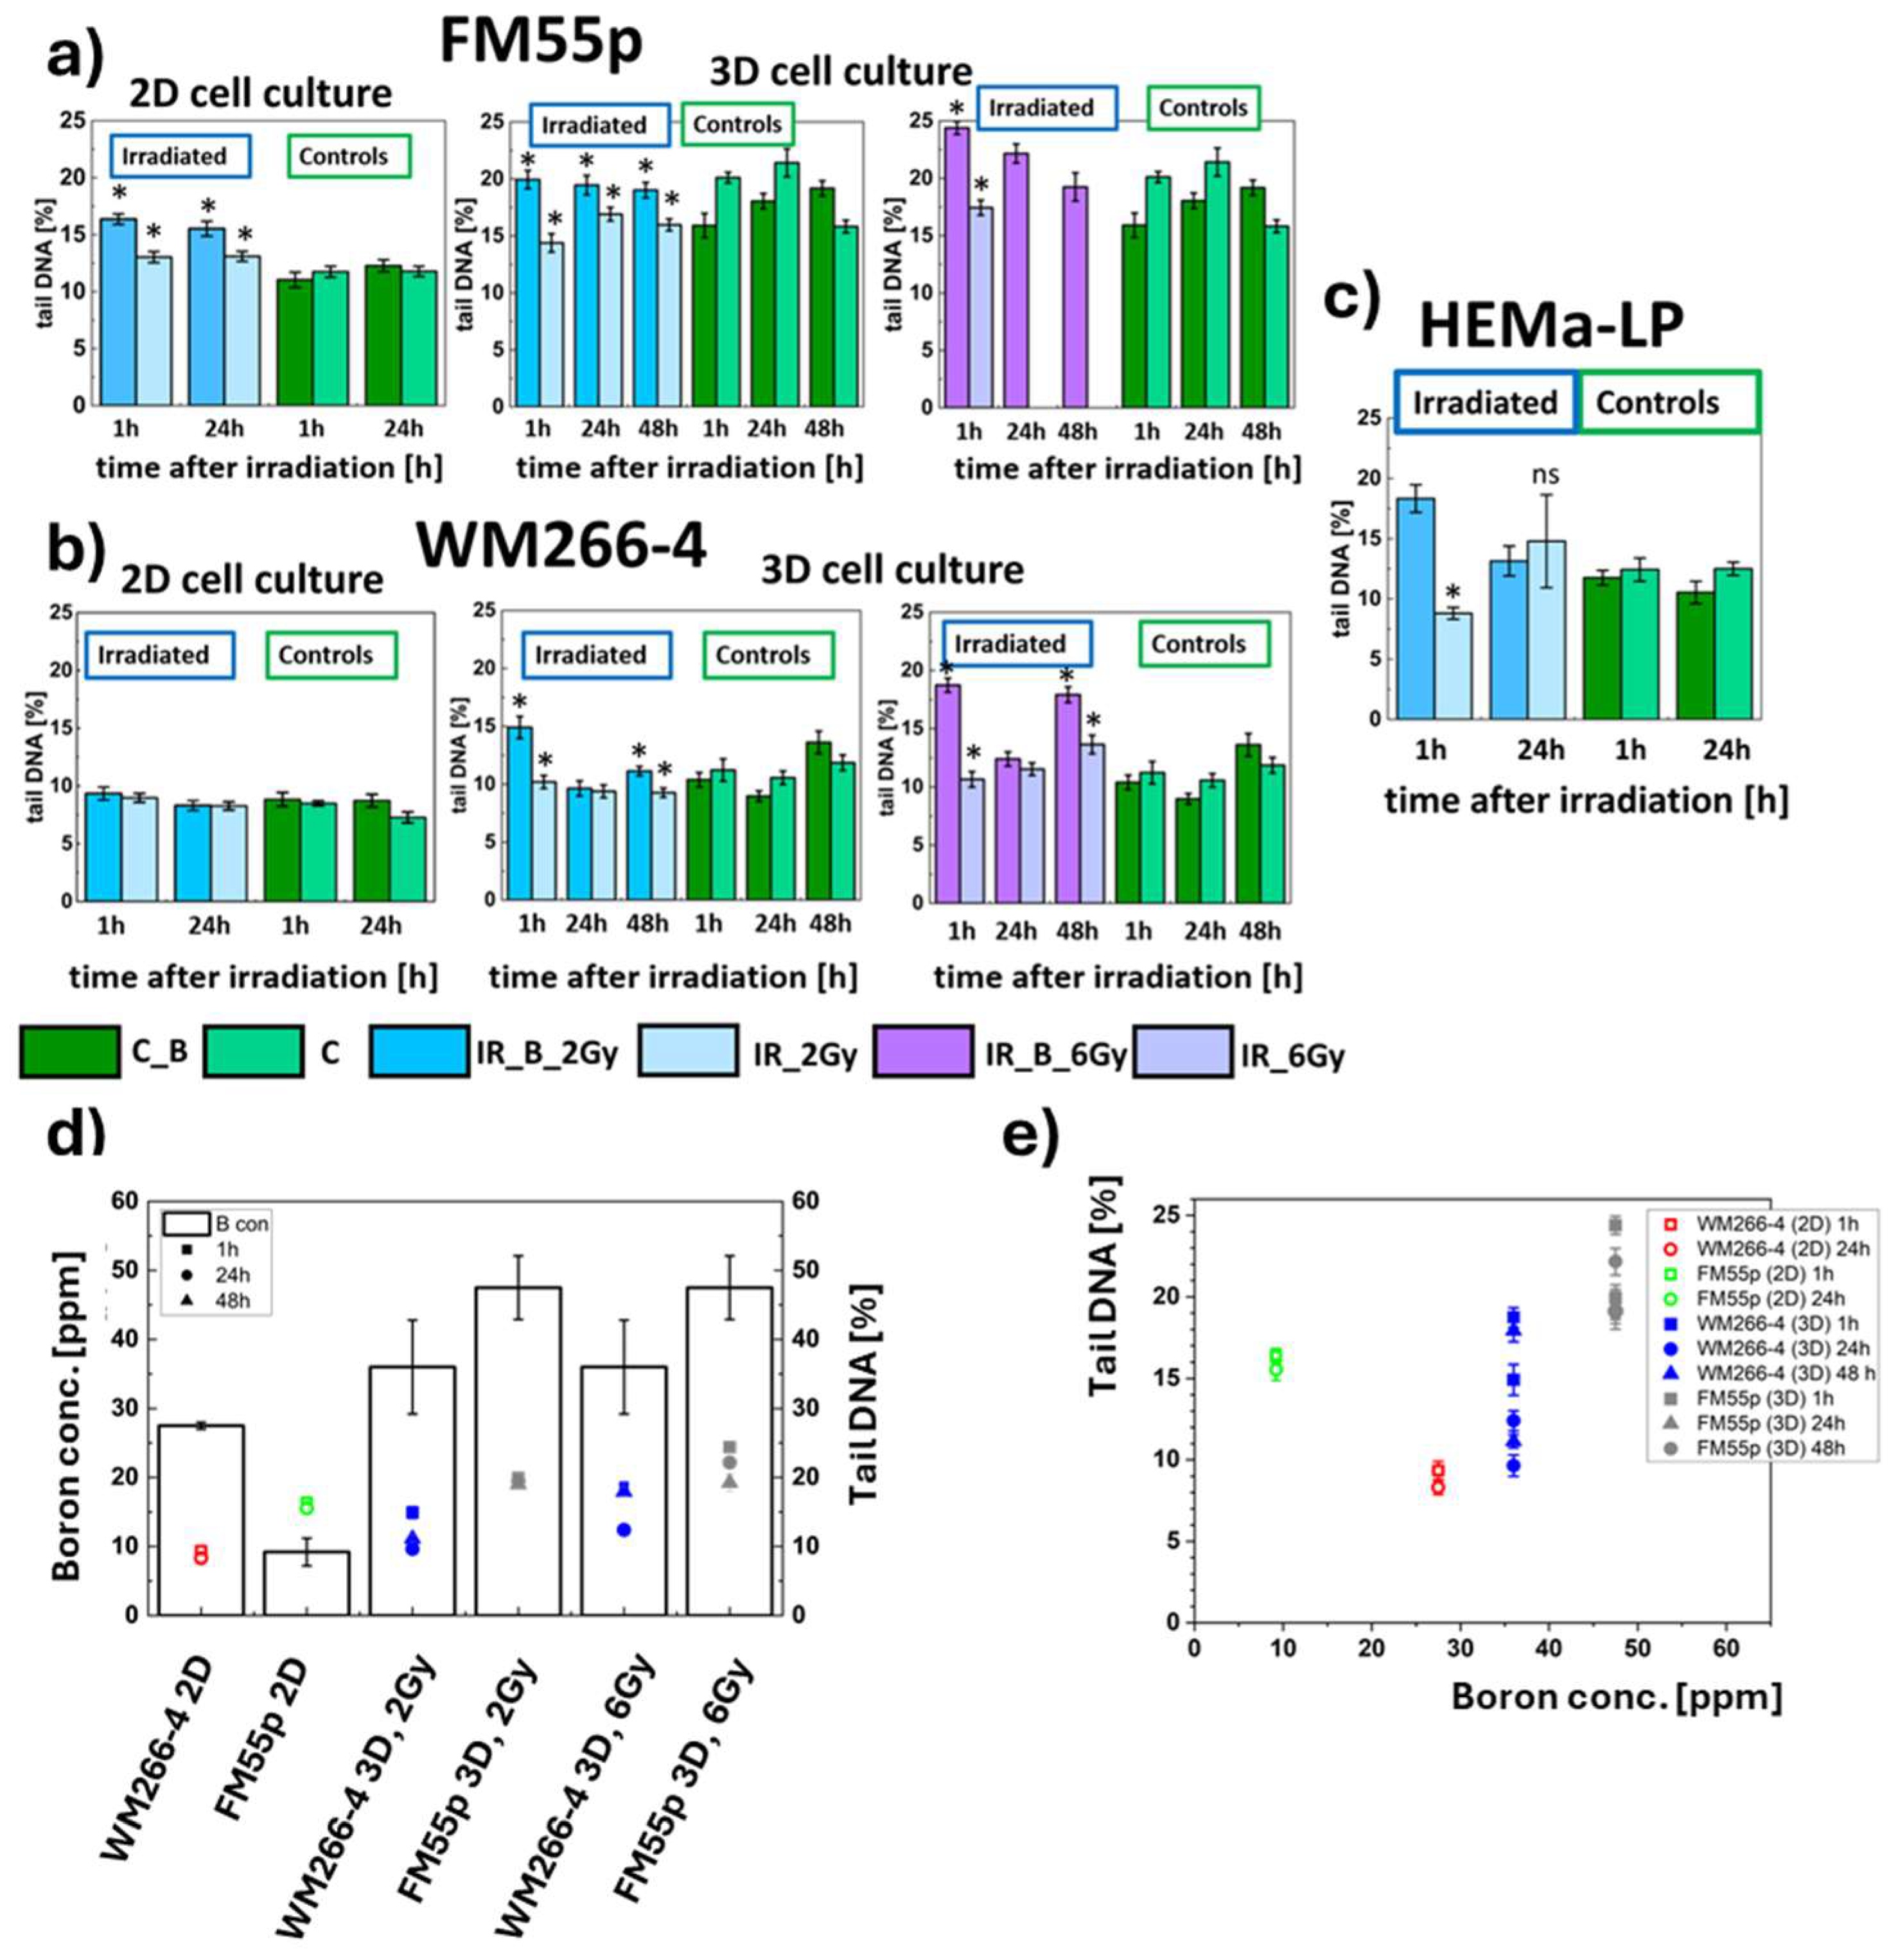
Figure 5.
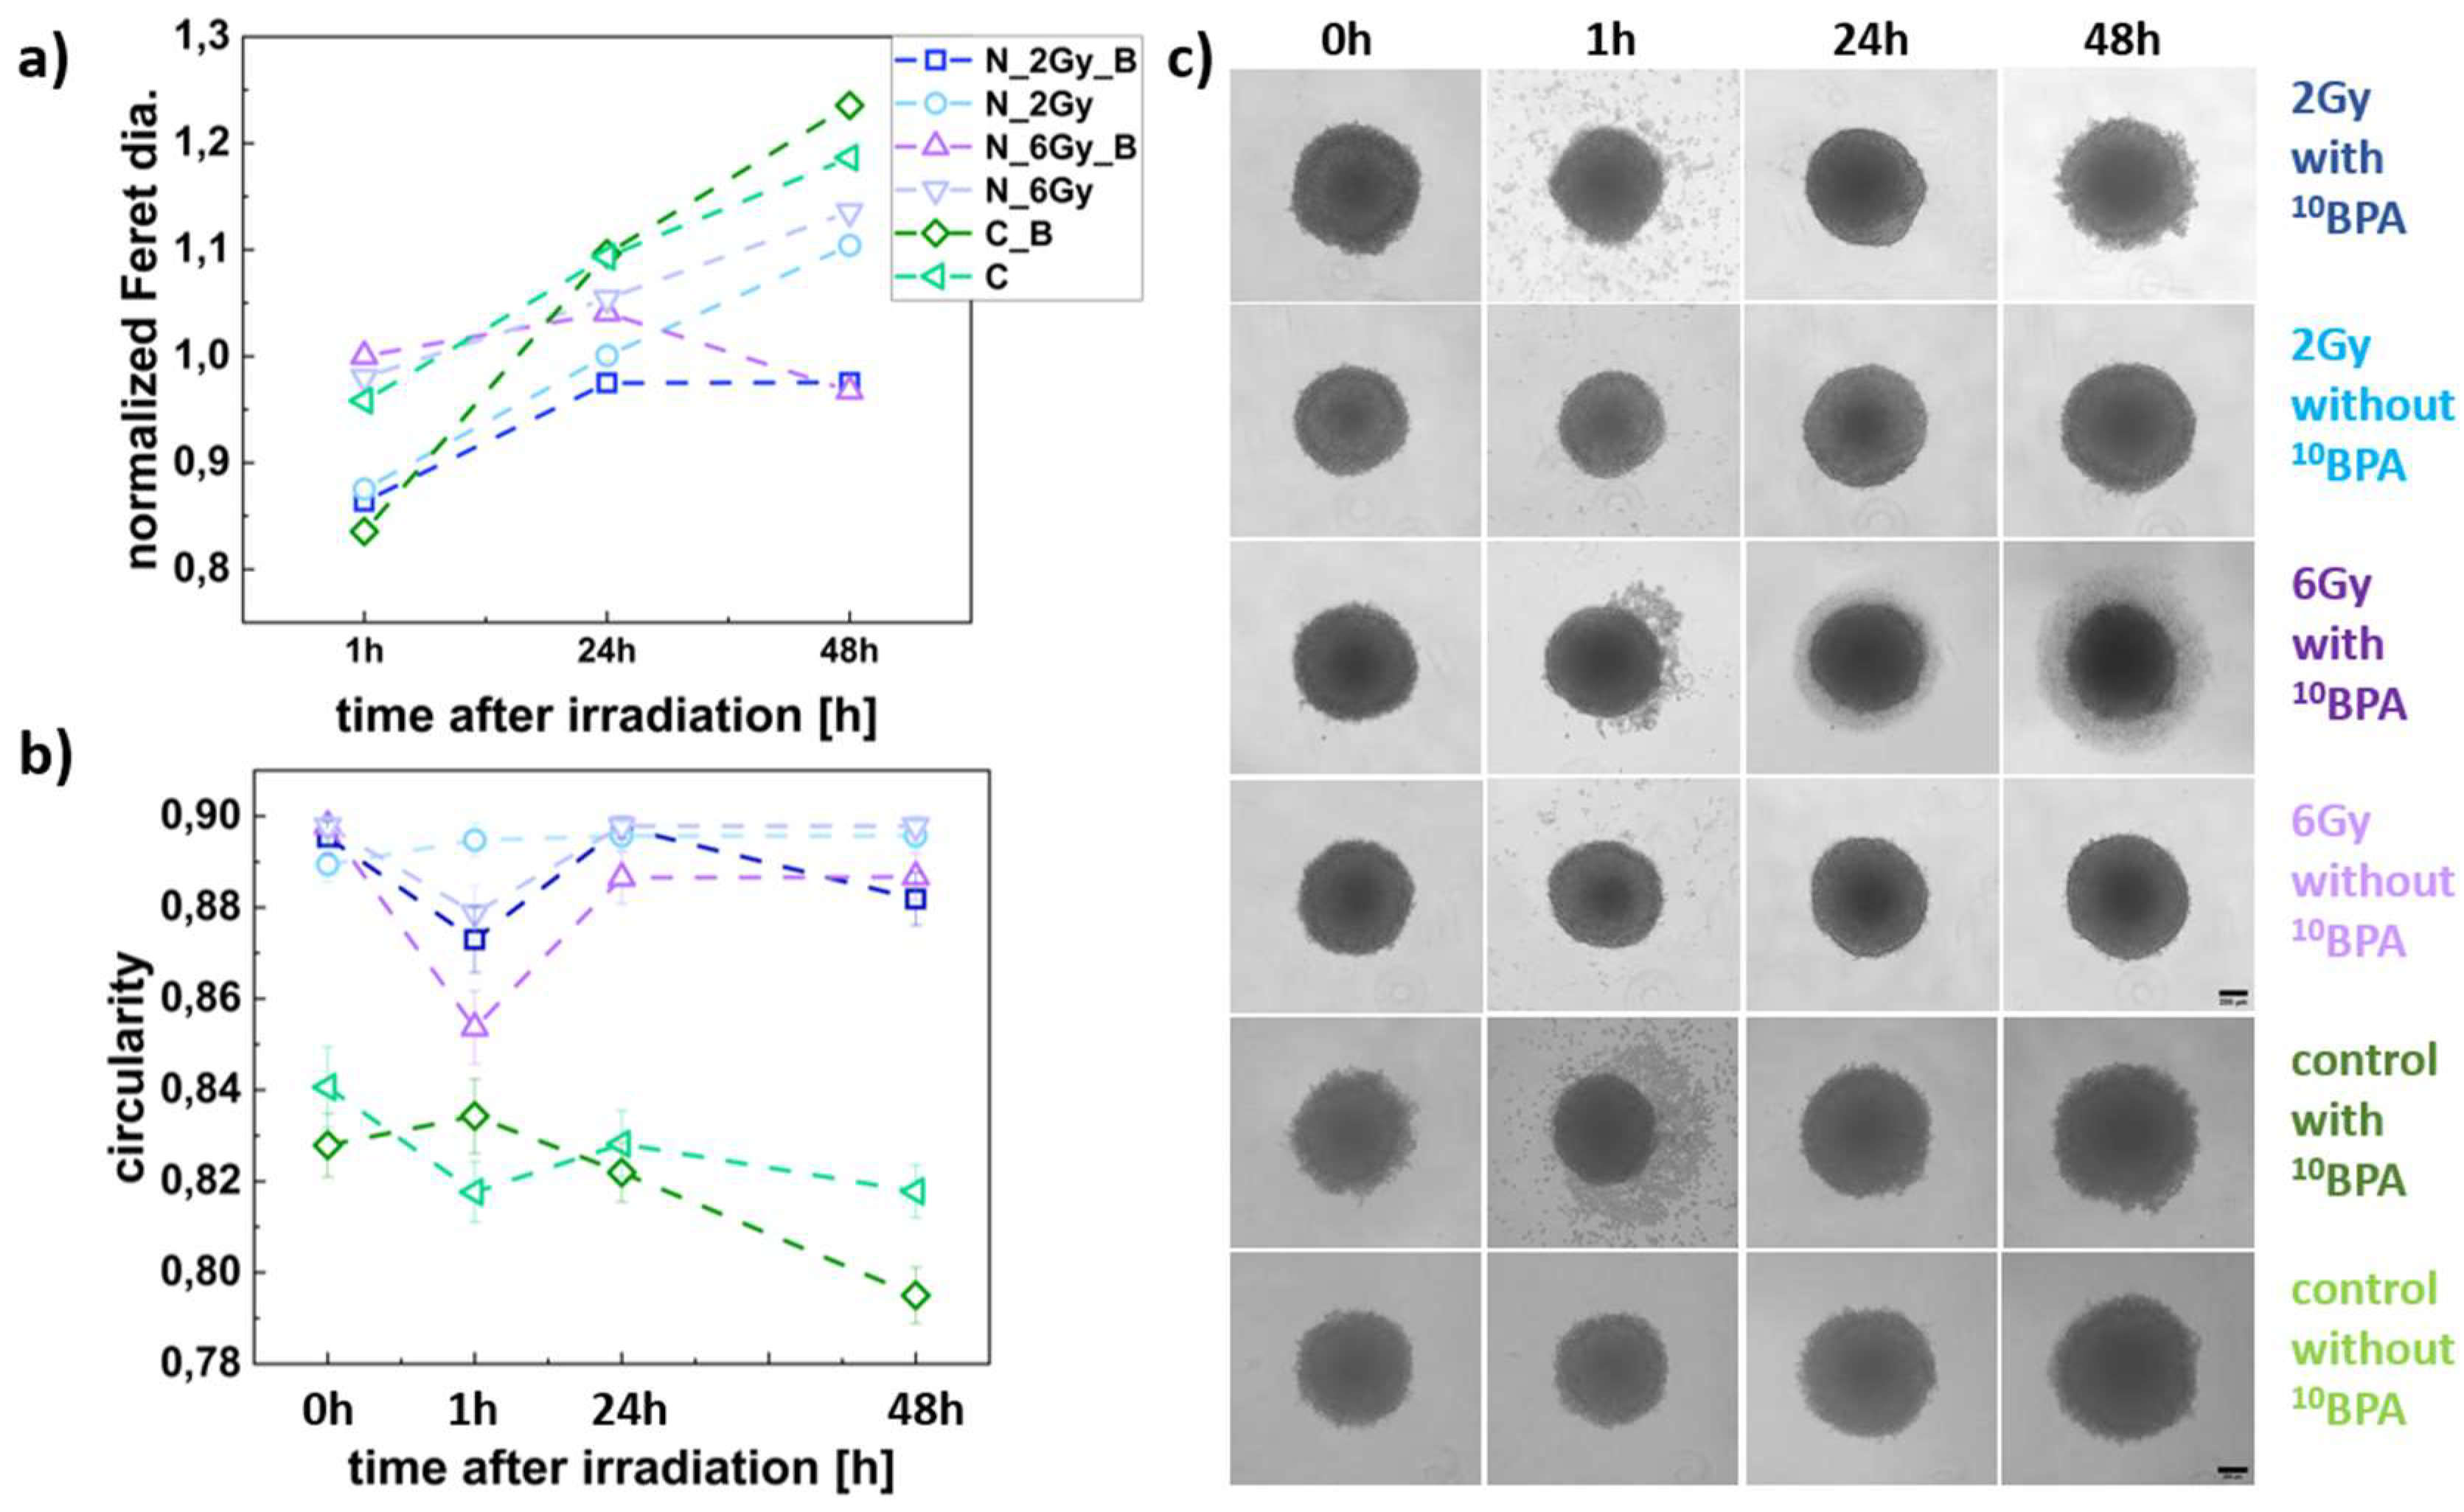
FM55p spheroid size and shape parameters. (a) Changes in normalized Feret diameter for the IR_B, IR, C_B, and C spheroids in time; (b) variations in spheroid shape (circularity) for the IR_B, IR, C_B, and C, data analyzed for n= 23-62 spheroids; (c) Panel of representative images of the IR_B, IR, C_B, and C spheroids. Dark blue squares represent IR_B spheroids (2 Gy dose), light blue squares represent the IR spheroids (2 Gy dose); purple squares represent IR_B spheroids (6 Gy dose), a dark green squares mean C_B spheroids (without neutron irradiation), and light green squares represent the C spheroids (without neutron irradiation and BPA incubation). Scale bars represent 200 µm. The estimated Feret diameters were normalized to the value obtained at 0h.
Figure 5.
FM55p spheroid size and shape parameters. (a) Changes in normalized Feret diameter for the IR_B, IR, C_B, and C spheroids in time; (b) variations in spheroid shape (circularity) for the IR_B, IR, C_B, and C, data analyzed for n= 23-62 spheroids; (c) Panel of representative images of the IR_B, IR, C_B, and C spheroids. Dark blue squares represent IR_B spheroids (2 Gy dose), light blue squares represent the IR spheroids (2 Gy dose); purple squares represent IR_B spheroids (6 Gy dose), a dark green squares mean C_B spheroids (without neutron irradiation), and light green squares represent the C spheroids (without neutron irradiation and BPA incubation). Scale bars represent 200 µm. The estimated Feret diameters were normalized to the value obtained at 0h.
Figure 6.
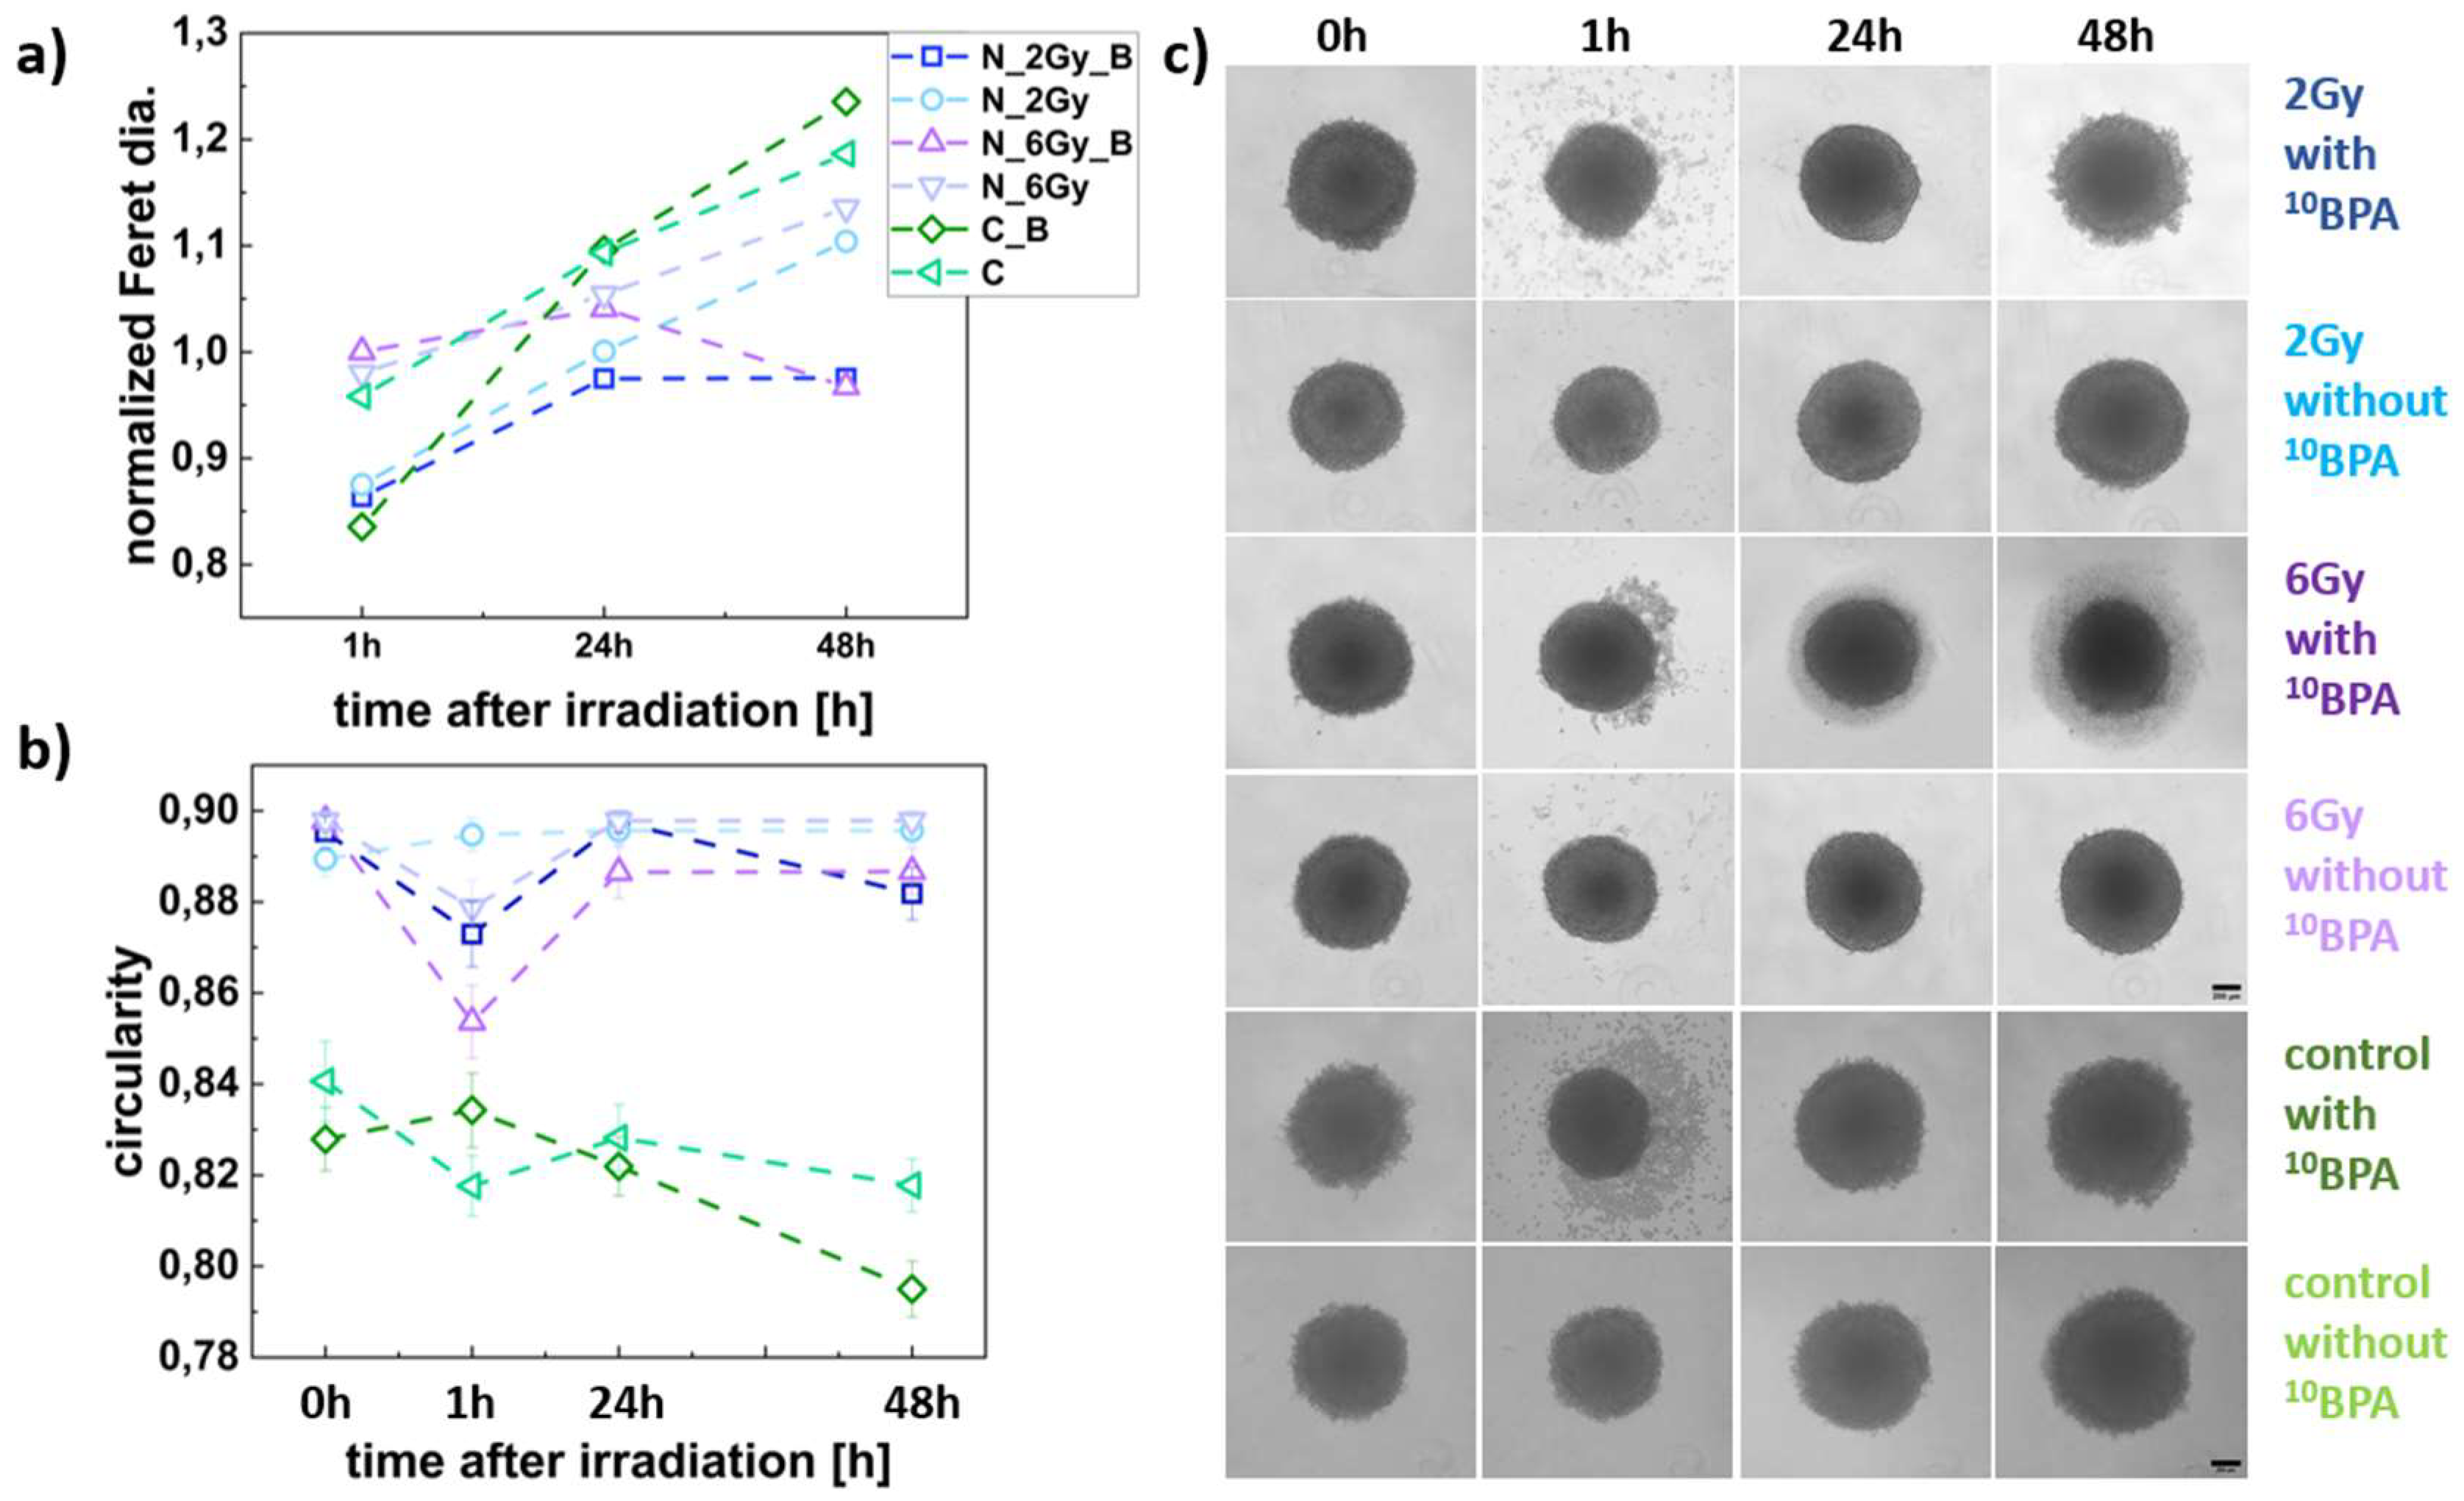
WM266-4 spheroid size and shape parameters. (a) Changes in normalized Feret diameter for the IR_B, IR, C_B, and C spheroids in time; (b) variations in spheroid shape (circularity) for the IR_B, IR, C_B, and C, data analyzed for n= 35-66 spheroids; (c) Panel of representative images of the IR_B, IR, C_B, and C spheroids. Dark blue squares represent the IR_B spheroids (2 Gy dose), light blue squares represent the IR spheroids (2 Gy dose); purple squares represent IR_B spheroids (6 Gy dose),light purple squares correspond to the IR spheroids (6 Gy dose), a dark green squares represent the C_B spheroids (without neutron irradiation), and light green squares represent C spheroids (without neutron irradiation and BPA incubation). Scale bars represent 200 µm. The estimated Feret diameters were normalized to the value obtained at 0h.
Figure 6.
WM266-4 spheroid size and shape parameters. (a) Changes in normalized Feret diameter for the IR_B, IR, C_B, and C spheroids in time; (b) variations in spheroid shape (circularity) for the IR_B, IR, C_B, and C, data analyzed for n= 35-66 spheroids; (c) Panel of representative images of the IR_B, IR, C_B, and C spheroids. Dark blue squares represent the IR_B spheroids (2 Gy dose), light blue squares represent the IR spheroids (2 Gy dose); purple squares represent IR_B spheroids (6 Gy dose),light purple squares correspond to the IR spheroids (6 Gy dose), a dark green squares represent the C_B spheroids (without neutron irradiation), and light green squares represent C spheroids (without neutron irradiation and BPA incubation). Scale bars represent 200 µm. The estimated Feret diameters were normalized to the value obtained at 0h.
Figure 7.
Ki67 protein expression in FM55p and WM266-4 spheroids. The graphs show the level of the Ki67 protein for spheroid-forming cells after 1 h, 24 h, and 48 h after neutron irradiation for (a) FM55p cell line and (b) WM266-4 cell line. The dark blue bar depicts the IR_B cells (2 Gy dose); the light blue bar indicates the IR cells (2 Gy dose); the dark purple indicates IR_B cells (6 Gy dose); the light purple depicts IR cells (6 Gy dose); the dark green bar depicts C_B cells and light green bar indicate C cells (not irradiated). Data represent mean values with the standard deviation. * indicates statistically significant differences of IR_B and IR cells to the control C by the t-Student test (p<0.05), results shown in
Appendix C.
Table 1.
Operating parameters of the ICP-MS instrument.
Table 1.
Operating parameters of the ICP-MS instrument.
| Parameter |
Value |
| RF power [W] |
1250 |
| Vacuum pressure [bar] |
9.86⋅10-9
|
| Nebulizing gas flow ml/min] |
1.04 |
| Cooling gas flow [ml/min] |
17.00 |
| Auxiliary gas flow [ml/min] |
1.02 |
| Lens voltage [V] |
10 |
Table 2.
Boron concentrations (CB), thermal neutron fluxes (Φt) and corresponding reactor powers, and doses estimated for all the irradiated cell cultures (both, 2D and 3D). Dtot and D0 denote the dose delivered to the cells incubated with boron and without it, respectively. For each cell line boron-containing cells and cells without boron were irradiated with the same thermal neutron flux. Boron concentration in cells was estimated based on the studies described in Sec. 2.3, while the doses were calculated using Eq. 1. The systematic uncertainties correspond to the unknown elemental content of the irradiated cells and correspond mainly to the assumed nitrogen mass ratio.
| Cell line |
Reactor power [kW] |
Φt
[cm-2s-1] |
CB
[ppm] |
Dtot
[Gy] |
D0
[Gy] |
| WM266-4 2D |
20 |
9.60 ⋅ 108
|
27.5 ± 0.5 |
2.05 ± 0.05stat ± 0.14sys
|
0.33 ± 0.01stat ± 0.04sys
|
| FM55p 2D |
60 |
2.88 ⋅ 109
|
9.2 ± 2.0 |
2.71 ± 0.38stat ± 0.40sys
|
0.98 ± 0.02stat ± 0.04sys
|
| HEMa-LP |
20 |
9.60 ⋅ 108
|
26.4 ± 1.7 |
1.98 ± 0.12stat ± 0.14sys
|
0.33 ± 0.01stat ± 0.04sys
|
| WM266-4 3D |
17 |
8.16 ⋅ 108
|
36.0 ± 6.8 |
3.14 ± 0.48stat ± 0.07sys
|
0.61 ± 0.03stat ± 0.07sys
|
| FM55p 3D |
12 |
5.76 ⋅ 108
|
47.5 ± 4.6 |
2.78 ± 0.24stat ± 0.05sys |
0.43 ± 0.02stat ± 0.03sys
|
| WM266-4 3D |
51 |
2.45 ⋅ 109
|
36.0 ± 6.8 |
9.33 ± 1.50stat ± 0.2sys
|
1.82 ± 0.09stat ± 0.20sys
|
| FM55p 3D |
36 |
1.73 ⋅ 109
|
47.5 ± 4.6 |
8.30 ± 0.80stat ± 0.14sys
|
1.28 ± 0.07stat ± 0.14sys
|
Table 3.
Values of the dose rates due to background processes () and the 10B (n,α)7Li reaction for both the 2D and 3D cell cultures estimated by Monte Carlo simulations assuming the reactor power = 250 kW and boron concentration of 1 ppm. The contributions due to the neutron scattering on hydrogen (), the 14N (n,p)14C reaction (), and γ-rays () are also reported.
| Cell culture |
[mGy/s] |
[mGy/s] |
[mGy/s] |
[mGy/s] |
[mGy/s] |
| 2D |
9.79 ± 0.09 |
1.31 ± 0.01 |
0.699 ± 0.001 |
3.28 ± 0.01 |
5.81 ± 0.07 |
| Spheroids |
14.98 ± 0.08 |
1.70 ± 0.03 |
0.119 ± 0.005 |
4.26 ± 0.08 |
10.6 ± 0.7 |