
Submitted:
31 December 2024
Posted:
03 January 2025
You are already at the latest version
Abstract
This paper proposes the sizing optimization method and energy management strategy for stationary hybrid energy storage system dedicated to DC power supply system. The hybrid energy storage consists of two modules – supercapacitor, mainly dedicated to regenerative energy utilization and electrochemical battery, aimed to peak power reduction. It is shown that the parameters of both modules could be sized independently. The supercapacitor module parameters are sized, based on the results of simulation determining the regenerative power, resulting limited catenary receptivity. The simulation model of DC electrification system is validated by comparing the results of simulation with the measurements of 15-min average power in 24-hour cycle as an average values of one year. The battery module is sized based on the statistical data of 15-min substation power values occurrences. The battery energy capacity, its maximum discharge C-rate and the conditions determining its operation are optimized to achieve the maximum ratio of annual income resulting from peak power reduction to annual operating cost resulting from battery aging process and total life cycle. The case study prepared for typical 3 kV DC substation with mixed railway traffic shows that peak power could be reduced by ~ 1 MW, giving ~ 10 years of payback period of battery module installation, while the energy consumption could be decreased by 1.9 MWh/24 h, giving the payback period of supercapacitor module installation ~ 7.5 years. The payback period of the whole energy storage system (ESS) is ~ 8.4 years.
Keywords:
hybrid energy storage system
; DC traction substation
; regenerative braking
; peak power shaving
1. Introduction
Over the last several years intensively increasing emission of CO2, resulting from the burning of fossil fuels have led to climate changes exerting an influence on both: ecosystems and public health [1]. The mentioned fact have put a pressure on improving of energy efficiency of all stages of energy conversion and utilization, including railway transportation systems [2] in order to limit CO2 emissions. In this area the significant role in the last several years have played an introduction of a rolling stock with regenerative braking in a wide scale. In DC electrification systems the regenerative energy could be used under condition of high catenary receptivity. Otherwise regenerative energy is converted into heat in the braking resistors of trains. High receptivity of catenary could be insured by other trains drawing power mode or by stationary devices such as ESS [3,4] or regenerative inverters [5]. Among the stationary energy storage used for the purpose of regenerative power utilization the most perspective are supercapacitors due to high power density, large number of charge-discharge cycles and decreasing prices of supercapacitors [2], [6].
Beside of high energy consumption, the crucial problem of the up to date electric power systems is appearance of load demand peaks [7]. The problem is especially significant in traction substations, which power demand may be described as a stochastic process, since it depends on the railway traffic and its fluctuation on the track supplied by the substation. In many countries peak power for big consumers is considered as energy consumption in half-hourly measurement periods, however for instance in Poland the duration of measurement period is 15 min. The peak power demand charge in case of traction substation consists 10-40 % of the total electricity charge [8], hence it is highly desirable to decrease the quantity from financial point of view.
Numerous authors have undertaken the optimization problems for sizing, locating and energy management strategy (EMS) of trackside supercapacitor energy storage. In [9] Iannuzzi at al. have proposed and experimentally validated optimization approach to ESS sizing. The approach considers minimization of line losses, improvement of voltage profile and minimization of storage device size and mass volume. In [10] Barrero at al. have shown the deep analysis of improvement of energy efficiency in the metro line for the stationary energy storage for its variable size. The influence of the traffic on the effectiveness of energy storage operation has been undertaken. Jalali and Farjah in [11] have proposed use of an artificial intelligence methods of energy storage location optimization. Finally, Sirmelis at al. in [12] have discussed the optimization of stationary supercacitor ESS sizing optimization based on cost analysis.
At the same time the problem of peaks shaving have been undertaken by numerous researchers. One of the most perspective methods of peak power reduction is use of energy storage [7]. In [13] Chua at al. have introduced the fuzzy control based method to forecast the power demand peaks based on the previous day measure results. The effectiveness of the approach have been confirmed experimentally. The significant contribution has been carried out by Fossati at al. in [14], where the genetic algorithm based optimization model dedicated for sizing of ESS has been introduced. As well the EMS based on fuzzy expert system has been optimized jointly with the parameters of ESS. Moreover, the aging effect has been taken into account. The specific solution for peak power reduction based on battery energy storage dedicated to traction load has been introduced by Jarnut at al. in [15]. In [16] Ovalle at al. have introduced the sizing methodology for energy storage system dedicated to DC railway system as an alternative to new traction substation installation. Graber at al. in [17] have proposed the finance – based method to quantify the size and location of the battery trackside ESS, to minimize annual cost of energy.
In [18] authors have presented the optimization method based in fuzzy logic dedicated traction substation with energy storage end renewable power source. Ciccarelli at al. in [19] have proposed the simplified control strategy for a trackside ESS to energy saving, voltage drops reduction and maximum line current reduction.In[20] Zheng at al. have proposed the implementation of hybrid energy storage consisting of supercapacitor and electrochemical battery on board of the rail transit vehicle. Li at al. in [21] has proposed deep reinforcement learning based energy management strategy for hybrid energy storage system applied in several DC traction substation. The proposed algorithm lead to decrease of energy consumption and daily cost reduction. Hybrid energy storage are deeply investigated as a solution for autonomous electric vehicles [22], [23], the chosen concepts of EMS used in that area could be successfully transferred into area of stationary ESS hybrid.
This paper introduces the concept of hybrid energy storage system designed for two purposes: utilization of regenerative energy and peak power reduction. Regenerative energy utilization is carried out by supercapacitor part, while peak power demand is being decreased by discharging of electrochemical battery in case if 15-min substation power exceeds the given limit (trigger power PTR). During operation of electrochemical battery supercapacitor also takes part in battery peak current limitation therefore reducing aging process. We have introduced the EMS dedicated for the solution and energy storage system sizing optimization methodology. The sizing methodology is based on the 24-h profile substation instantaneous power obtained by the simulation (for supercapacitor sizing) and the 15-min power values obtained by the measurements from the last year (for battery sizing). The histogram of the 15-min power values of traction substation enables to predict the number of charge/discharge cycles of the battery per year as well as their depth of discharge, which determines the aging process intensity for the given degree of peak power reduction (ΔPAVR) after installing of energy storage. The procedure is based on the aging model of the given electrochemical battery.
The paper also presents the validation of simulation model of 3 kV DC power supply system with limited receptivity based measurement data of 1-year 15-min power profile of traction substation and simulation data of 24-h instantaneous power profile. Both data types are used for parameters optimization hence the validation could be carried out optionally with optimization procedure. The proposed energy storage optimization procedure with validation of power supply model is presented in Fig. 2.
Fig. 1 presents the general scheme of connection of stationary hybrid energy storage system to the DC busbar of 3 kV DC traction substation.The ESS consists of two modules: Supercapacitor – 1 and electrochemical battery – 2.
The procedure of energy storage parameters sizing is presented in Fig. 2 and consists of the following steps:
- a)
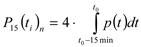
- carrying out the measurements of the 15-min substation traction power during one year (the historical data of 15-min power is available, hence the values are registered according to the agreement with the DNO)
- b)
- carrying out the simulation of the railway line based on the timetable of the trains’ operation in order to obtain the instantaneous values of the traction power for 24-h cycle, including the regeneration power available. The regeneration power is available as the result of the limited overhead catenary receptivity. The 24-h cycle of instantaneous power profile is needed to carry out theevaluation of annual regenerative energy
- c)
- comparing the 15-min power obtained by the simulationin the previous point with an average 15-min power measured in the real substation in order to validate the correctness of the simulation model. This point is not necessary for the sizing procedure, butprovides with the validation of the simulation model with the real world
- d)
- carrying out the second simulation of 24-h operation of the traction substation with the traffic concentration near to the analyzed substation, given comparable valuewith the maximum 15-min power during 1-year measurements
- e)
- sizing the parameters of the supercapacitormodule: energy capacity and the power of DC/DC converter based on the payback period value of the ESS installation, according to the known methods[12]
- f)
- sizing the parameters of the battery moduleof the energy storage based on the histogram of the 15-min power measurements and simulation of the energy storage model with the 24-h values with the traffic concentration.
In the proposed sizing procedure, particularly for sizing of electrochemical battery for peak power demand reduction important step is carrying out the simulation of train traffic occurring during peak power occurrence during 1-year measurement process (step d). The values of substation power doesn’t include the direct data regarding the traffic, which should be implemented in simulation model. Therefore the implemented traffic timetable is obtained by modifying the timetable given by the railway infrastructure operator and implemented in step b. Timetable modifications should be made alternately with comparing the peak power value after simulation the one measured in the physical substation.
2. Validation of Simulation Model of DC Electrification System with Limited Receptivity
The time profile of substation power is obtained by means of simulation model of an electrified railway line with regenerative braking and limited catenary receptivity, as described in details in [24] and in [25]. The simulation has been carried out for the real railway line. All the necessary parameters [24] of the railway line have been taken from the real world, including timetable of train operation, parameters of the rolling stock, vertical and horizontal profile, overhead catenary, returning rails, substation internal resistances and others. Four types of rolling stock have been modeled: an electric multiple unit (Type 1), two types of passenger carriage trains (Type 2 and 3) and freight train (Type 4), traction characteristics of the rolling stock are presented in Fig. 3. Table 1 presents the main parameters of the rolling stock operating in the analyzed railway line, the parameters as well as the traction characteristics have been taken from the manufacturers data.
According to the procedure two simulations have been carried out: comprising normal train operation according to the standard scenario timetable and according to the timetable with the train traffic concentration occurring near to the traction substation, where the energy storage is considered to be installed. The traffic concentration has been achieved by shifting train patters in time and extension of their dwell time. The simulation has been iteratively repeated in order to obtain the maximum value of 15-min substation power of the analyzed substation relatively close to the maximum value provided by 1-year measurements. As far as traction substation is concerned, the obtained model is the projection of the maximum 15-min substation load during one year. The graphic timetable of trains operation is shown in Fig. 4, the train traffic concentration occurring near to the analyzed traction substation is shown in Fig. 4. c). The real names of the stations have been removed according to the request of traction energy supplier.
The longer is the period of measurement data acquisition, the more accurate the forecast of peak power occurrences. The assumption has been made that in future period of ESS operation the histogram of 15-min power is close to the histogram of the registered power values in the past. The assumption is true if the passenger and goods flow doesn’t change in a large degree.
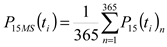
The values of 15-min power have been registered during 1 year on the points of connections of traction substation to the medium voltage (15 kV) supplying grid.The values of the 15-min power are obtained as follows (Eq. 1).
The values of traction power of traction substation has been obtained by subtraction the total substation power (measured on the connections of supplying lines) and of the non-traction and auxiliary power (as well measured in the corresponding connections of 15 kV switchgear).The validation of the simulation model has been performed by comparing the 15-min power profile in 24-h cycle, obtained by simulation, according to the timetable (without traffic concentration) with an averaged 24-h, 15-min measured power profile, obtained according to Equation2.
Furthermore, the 24-h energy consumption obtained by the simulation has been compared with the average24-h energy consumption obtained by the measurements. The average 24-h energy measured has been calculated according to Equation 3.
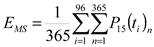
Fig. 5 a) presents the comparison of 15-min averaged power obtained by the simulation and average 15-min power obtained by the measurements. For two above variables the Pearson correlation coefficient has been calculated, giving the value 0.61.Fig. 4 b) shows the correlation diagram between the measured and simulated values of 15-min power. The measured average 24-h energy consumption (Eq. 3)is 34.46 MWh, while 24-h energy consumption obtained by simulation is 31.00 MWh, giving the relative difference of 10 %.
The results of the validation confirm that the simulation model is consistent with the real railway system.The distinguishing features of the validated model are the following:
- -
- the model contains 160 trains of different types operating during 24-h cycle,
- -
- trains of type 1 and 3 are equipped with regenerative braking, the model includes limited receptivity of overhead catenary
In the available literature there are not many papers presenting validation of the simulation models of the electrified railway transportation by comparing with the real world measurements. The features listed above confirm a consistency of the simulation model with real railway electrification system with regenerative braking and limited overhead catenary receptivity.Therefore, it is justified to carry out the sizing process based on the results of the simulation.
3. Algorithm of ESS operation
The algorithm of the ESS operation should insure meeting the following conditions:
- -
- maximization use ofavailable excessive regenerative energy of the braking trains,
- -
- maximum decreasing of peak power and insuring that the peak power is below the new limit,
- -
- maximization of a live cycle of the lithium-ion battery.
The proposed energy management algorithm belongs to the group of deterministic based rule strategies. The algorithm of the EMS is depicted in Fig. 6. The algorithm is based on a real time value of an average 15-min power calculated in according to Equation 4:
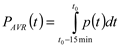
If the average 15-min power exceeds the given trigger power PTR, the battery is being discharged and the demand power of traction substation is being partly covered by the battery (2), (4) in Fig. 5 a). The power of discharge depends on the value of power demanded by the traction substation. If the instantaneous substation power demand exceed the given limit, and supercapacitor state of charge is above the given valueUSCtr, supercapacitor is being discharged. If an average powerPAVRcalculated acc. to Equation 4 value doesn’t exceed the given threshold value PTR, the battery doesn’t work, it remains charged, while the supercapacitor operated according to the algorithmshown in Fig. 6 b) – algorithm of SC.
Fig. 7 a) depicts an instantaneous values of the hybrid energy storage elements during battery discharge.
In Fig. 7 b) there is shown 15-min average power during 24-h operation with and without hybrid energy storage system. In the same figure the difference of the maximum 15-min power (ΔPAVR) is depicted. It also can be noticed that during the most of 24-hperiod the 15-min power is lower with ESS than without it. It is caused by decrease of the energy consumption due to the excessive regenerative power stored in the supercapacitor. Only between 0:00 and 3:00 a.m. the power is of the same value, because only freight trains are operating at that time (timetable Fig. 4) which are not equipped with the regenerative braking.
The parameters deciding about the effectiveness of the ESS operation and resulted cost savings are:
- -
- active energy saved by use of regenerative power (E24reg),
- -
- reduction of maximum 15-min power resulting from ESS operation (ΔPAVR).
4. Results and Discussion
4.1 Supercapacitor Module
The main role of supercapacitor module (1 in Fig. 1) is use of extensive regenerative energy of braking trains. The influence of the supercapacitor parameters on the live cycle of the battery in relation to peak current limitation is much less than their influence on regenerative energy use. Therefore the criteria of battery life cycle is not considered in the supercapacitor sizing process. The only criteria of the supercapacitor parameters sizing is investment payback period. The methodology of sizing was presented in [12]. The payback period is calculated according to Equation 5.

Where CSC is the cost of supercapacitor module installation, calculated according to the cost model [26], as follows (Eq. 6),

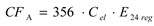
Whereas the annual savings resulting from the regenerative energy,as follows
(Eq. 7),
The optimization variables of supercapacitor sizing process are: power of DC/DC converter PDC/DC, numbers of cells connected in serious (nsc) and number of cell connected in parallel (msc) inasupercapacitor pack. Serious number of cells is assumed 1000, giving the nominal voltage of supercapacitor pack 2700 V. The minimum state of charge is assumed 50 % of the nominal voltage (1350 V).The issue of optimal level of minimum state of charge of supercapacitor pack is undertaken in [27].The price parameters used in the Equations (5-7) are shown in Table 2. The supercapacitors of 3000 F capacitance and 2,7 V has been assumed, the internal resistance (0.29 mΩ) has been taken from the manufacturer data.
Fig. 8 a) shows the energy recovered by ESS and Fig. 8 b) the payback period, both as the functionsof DC/DCconverterpower and numbers of cell branches connected in parallel (energy capacitance). In the case study the payback period is minimum for mSC=3 and PDC/DC = 900 kW, giving the value of 7,46 years. However, as the diagram shows, the range of the parameters, where the values of payback period is close to the minimum is relatively extended within the range of parameters.
Authors should discuss the results and how they can be interpreted from the perspective of previous studies and of the working hypotheses. The findings and their implications should be discussed in the broadest context possible. Future research directions may also be highlighted.
4.2 Electrochemical Battery Module
The initial calculations indicate that the optimal energy capacity of superapacitor module in terms of regenerative energy use is much too low to reduce the 15-min peak power demand. The usable energy capacity of a superapacitor pack of the parameters n SC = 1000, mSC = 3 and depth of discharge 50 % is 6,83 kWh,while the energy capacity needed for 15-min peak power demand decrease by 1 MW is 250 kWh. Therefore for the purpose of 15-min peak power demand the electrochemical battery is needed, due to the much lower ratio of energy capacity to price of that energy storage, than supercapacitors.
As a electrochemical battery (1. in Fig. 1) it is considered to use LFP Li-ion batterydue to its appropriate parameters, relatively low cost [6] and well described aging model [28].However the proposed procedure of parameters optimization of the energy storage system is appropriate for other electrochemical battery types potentially used in the considered application. The appropriate aging model should be used.
According to the proposed EMS, the parameter determining the reduction of 15-min max. power (ΔPAVR) is the trigger value PTR. Degree of the peak power reduction determines the number of cycles and battery depth of discharge in each particular cycle of battery operation. The number of discharges results from the annual number of each 15-min power presented in Fig. 9. The maximum achievable value of peak power reduction ΔPAVR depends on the battery energy capacity and discharge rate. In Fig. 9 there are also marked the values of 15-min peak power which could be avoided with battery of 500 Ah capacity and different values ofC-rates during discharge.
The relationship between trigger power PPT and degree of power reduction ΔPAVR is not linear, it is shown in Fig. 10.
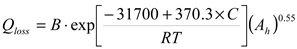
As it ismentioned above, the number of cycles and the DoD during each cycle depend on the value of 15-min peak power reduction (ΔPAVR). The higher is the value ΔPAVR, the bigger is number of battery cycles and depth of discharge of each cycle. According to the aging model of LFP battery [28], the life cycle depends on the total electric charge flowing through the battery cells (Ah), C-rate (C), and the temperature (T). The model formulated and validated based on the laboratory measurements [28] is commonly used by number of researches. The loss of battery capacity is expressed by Arrhenius Equation[28], as follows (Eq. 8),
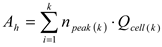
The crucial variable of the aging model is the total charge flowing through the battery Ah. For this purpose it is necessary to determine the single cell charge Qcell flowing during one discharge as the function peak power reduction ΔPAVR. The results of the single cell charge Qcell as the function of ΔPAVR for assumed battery capacity and C-rate are depicted in Fig. 11.
Based on the single cell charge values shown in Fig. 11 as the function of peak power reduction and the annual number of each peak power value occurrence the total annual cell charge could be determined according to equation 9.
The results of a total annual cell charge are shown in Fig. 12. The results show that the increase of C-rate during discharge allows to obtain a higher reduction of peak powerΔPAVR , but it also leads to an increaseof the cell annual chargeAh.
Based on the annual cell current Ah and the aging model (Eq. 8) the value of charge terminating the life cycle of the battery is determined. It is assumed that the battery life cycle is over after 20 % loss of the capacity or after 12 years of operation. Based on this information the annual operation cost have been proposed, defined as follows (Eq. 10).
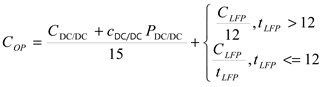
Where tLFP is an expected time of battery life cycle resulting from the aging model(Eq. 8). For the low values of an expected annual charge Ah, tLFP achieves the values significantly exceeding the time duration given by the manufacturers. The first part of sum expression (Eq. 10) presents the value of the DC/DC converter annual operation cost. It is assumed that the life cycle of the converter is 15 years. The power of DC/DC converter assumed in (Eq. 10)is adjusted to the maximum C-rate during the battery discharge. The cost of LFP battery pack is determined according to (Eq. 11), the model is taken from [26]:
The annual cost savings resulting from the reduction of peak power demand is expressed according to (Eq. 12)

Where cpower is the price of the demanded power expressed in ($/MW·year). For each variant of the battery parameters the ratio between annual cost savings and annual operation cost is proposed to be determined by profitability index – α (Eq. 13)

The solution is assumed to be profitable if the index value α > 1. The price parameters of the battery module are shown in Table 3.The LFP cells of 100 Ah has been assumed, the price has been taken from the manufacturer data.
The values of profitability index α for the various parameters of energy capacity and C-rate are presented inFig. 13wherethe parameters of the most profitable solution could be found.
The results of the α-index in Fig. 13 are presented as the function of the ΔPAVR. It provides the information of the profitability of the demand power reduction. For the adaptation of the EMS for the selected battery parameters the exact value of the trigger power PTR should be found and implemented. Having the values of the ΔPAVR and battery parameters corresponding to the most favorable solutions in Fig. 13, the corresponding values of the trigger power PTR could be found in Fig. 10.
The separate modules of ESS system: supercapacitor and battery could operate separately. The optimization method of the supercapacitor module dedicated to regenerative energy use is described in section 4.1, the EMS is shown in Fig. 6 b). The battery module could operate separately for purpose of 15-min peak power demand. Assuming only peak power reduction purpose of the battery operation, the influence of supercapacitor on the total LFP battery peak current reduction is minimal, therefore the battery life cycle is approximately the same in case with and without supercapacitor module.
Moreover, the investigation of battery module implementation for only the regenerative energy use instead of the supercapacitor module have been investigated. The results has shown that the 24-h single LFP cell charge Qcell in that case is 970 Ah. In this conditions the number of cycles is around 350 per 24 h. The battery operates in a narrow range of SoC (around 12 %) but the average daily operation time is 8 hours and20 min. According to the aging model the duration of the life-cycle for that condition of battery operation, assuming discharge rate 2 C is between 3 and 5 years.
The cost of each modules of hybrid ESS as well as the annual savings and payback period of each element and the total payback period of hybrid ESS are depicted in Table 4.
5. Conclusions
The paper presents the concept of trackside hybrid energy storage system dedicated to regenerative energy usage and peak power demand reduction. The dedicated EMS is developed for the hybrid ESS. The novel method of the battery module sizing of hybrid energy storage system is proposed. The method is based on the historical data of the 15-min average power (or half-hourly power) of traction substation during last year. Having the expected frequency of 15-min peak power values the energy, C-rate during discharge and the threshold power PTR of energy management strategy are determined to obtain the maximum index value α.
Meanwhile the sizing method of the supercapacitor module is based on the known methods assuming simulation results of 24-h power profile of traction substation including the regenerative power available, resulting from catenary receptivity limitation. The simulation model has been validated based on the comparison with 15-min power measurements.
For the average peak power the 15-min degree of averaging has been used as it is a standard in Polish power energy law. In energy tariffs in most countries half-hourly power value is used to measure the peak demand. The presented EMS and the method of battery sizing is appropriate for all degrees of averaging. The longer the period of power averaging is, the bigger the energy capacity of battery ESS must be.
The case study with usage of traffic and Polish 3 kV DC railway power supply system data and assuming the current energy storage elements’ prices and the prices of active energy and peak power demand show that the supercapacitor module of ESS, dedicated to regenerative power utilization is more profitable than the battery module for peak power demand. The battery unit with the optimum parameters is around 16 % cheaper than the supercapacitor module. However the savings resulting from the battery unit operation are around 40 % lower than from usage of the supercapacitor module. The total payback period for the whole ESS is 8.4 years.
If we take into account permanent increase of energy cost for transport in Poland with shocking increase in 2022 year effectiveness of ESS application in traction system will be much higher. Amount of annual energy consumption by railways for traction purposes is about 2 400 000 MWh. So only 10% reduction of traction energy consumption makes 240 000 MWh which gives CO2 reduction of roughly assessing 154565 t (due to fact that most of electrical energy generated in Poland is in coal power plants- [29] - emission in 2024 is estimated 178,9 gCO2eq/MJ i.e. 644,04 kg CO2/MWh). Extra income added due to usage of European Emission allowances (16th of December 2024 it was 63,32 euro/t of CO2 [22]) makes nearly 9,8 mln euro, which would again boost effectiveness of ESS installation.
Each module of the proposed hybrid ESS could operate in an autonomous way. The influence of supercapacitor on the battery life cycle is minimal. Therefore, the schedule of any kind of installation is flexible – at the beginning only supercapacitor or battery module could be installed and operate separately while the second module could be installed in a further future.
Author Contributions
Conceptualization-A.S. and W.J.; methodology-A.S, W.J. and T.M.; validation:A.N and M.W.: formal analysis: M.L and M.W.; investigation:W.J. and T.M.; resources:W.J.; writing—original draft preparation:W.J..; writing—review and editing: A.S. and A.N.,; visualization: W.J. and A.N. All authors have read and agreed to the published version of the manuscript.
Conflicts of Interest
Declare conflicts of interest or state “The authors declare no conflicts of interest.” Authors must identify and declare any personal circumstances or interest that may be perceived as inappropriately influencing the representation or interpretation of reported research results. Any role of the funders in the design of the study; in the collection, analyses or interpretation of data; in the writing of the manuscript; or in the decision to publish the results must be declared in this section. If there is no role, please state “The funders had no role in the design of the study; in the collection, analyses, or interpretation of data; in the writing of the manuscript; or in the decision to publish the results”.
Abbreviations
The following abbreviations are used in this manuscript:
| Ah | total charge flowing through the battery (Ah) |
| B | pre-exponential factor |
| C | rate of battery discharge |
| CDC/DC | constant cost of DC/DC converter manufacturing and installation ($) |
| cDC/DC | unit cost of DC/DC converter manufacturing and installation ($/kW) |
| Cel | unit price of active electric energy ($/MWh) |
| CFA | annual savings resulting from regenerative energy use by supercapacitor module of ESS ($) |
| CLFP | cost of LFP battery pack ($) |
| cLFP | price of single LFP battery cell |
| COP | annual operation cost of LFP module ($) |
| cpower | unit price of demand power ($/MW·year) |
| CSC | cost of supercapacitormodule installation ($) |
| cSC | price of single supercapacitor cell |
| CΔP | annual savings resulting from peak power reduction ($) |
| DoD | depth of discharge |
| E24reg | energy returned by SC module during 24-h operation (MWh) |
| EMS | average 24-h energy consumption during the preceding year (MWh) |
| i | number of 15-min period during 24-h cycle ({1:96}) |
| mLFP | number of LFP battery cells connected in parallel |
| mSC | number of supercapacitors cells connected in parallel |
| n | number of 24-h periods during the preceding year ({1:365}) |
| nLFP | number of LFP battery cells connected in series |
| npeak | number of 15-min power measured values during 1-year registration |
| nSC | number of supercapacitors cells connected in serious |
| p | instantaneous power (W) |
| P15 | 15-min measured power (W) |
| P15MS | 15-min measured power for the15-min period in 24-h cycle as an average of the measured values in ti 15-min periods during the preceding year (W) |
| P15Sim | 15-min power obtained by the simulation (W) |
| PAVR | average 15-min power calculated as an rolling average (W) |
| PLFP | instantaneous power of LFP battery part of the ESS in connection to 3 kV DC (W) |
| PLFPmax | maximum power of P¬LFP assumed in EMS of ESS(W) |
| PPSC | payback period of supercapacitor module installation (years) |
| PSC | instantaneous power of supercapacitor part of the ESS in connection to 3 kV DC (W) |
| PSCmax | maximum power of P¬SC assumed in EMS of ESS (W) |
| PTR | threshold value of the average rolling power (W) |
| PTS | power on a busbar of a traction substation (W) |
| Qcell | LFP battery single cell charge during single discharge (Ah) |
| Qloss | loss of battery capacity (%) |
| R | gas constant |
| SoC | state of charge |
| T | temperature |
| tLFP | duration in time of LFP battery life-cycle |
| USC | state of charge of supercapacitor pack (V) |
| USCtr | threshold state of charge of supercapacitor pack assumed in EMS of ESS (V) |
| α | profitability index of the battery module installation |
| ΔPAVR | difference of peak 15-min power of traction substation between the cases with and without ESS |
| DNO | Distribution Grid Operator |
| DoD | Depth of Discharge |
| EMS | Energy Management Strategy |
| ESS | Energy Storage System |
| LFP | LiFePO4 battery |
| SC | Supercapacitor |
| SoC | State of Charge |
| TE | Tractive Effort |
Appendix A
Appendix A.1
The appendix is an optional section that can contain details and data supplemental to the main text—for example, explanations of experimental details that would disrupt the flow of the main text but nonetheless remain crucial to understanding and reproducing the research shown; figures of replicates for experiments of which representative data is shown in the main text can be added here if brief, or as Supplementary data. Mathematical proofs of results not central to the paper can be added as an appendix.

Table A1.
This is a table caption.
| Title 1 | Title 2 | Title 3 |
|---|---|---|
| entry 1 | Data | data |
| entry 2 | Data | data 1 |
Appendix B
All appendix sections must be cited in the main text. In the appendices, Figures, Tables, etc. should be labeled starting with “A”—e.g., Figure A1, Figure A2, etc.
References
- K. R. van Daalen et al., “The 2024 Europe report of the Lancet Countdown on health and climate change: unprecedented warming demands unprecedented action,” Lancet Public Heal., vol. 9, no. 7, pp. e495–e522, 2024.
- H. Douglas, C. Roberts, S. Hillmansen, and F. Schmid, “An assessment of available measures to reduce traction energy use in railway networks,” Energy Convers. Manag., vol. 106, pp. 1149–1165, 2015. [CrossRef]
- J. Yuan, L. Peng, H. Zhou, D. Gan, and K. Qu, “Recent research progress and application of energy storage system in electrified railway,” Electr. Power Syst. Res., vol. 226, no. February 2023, p. 109893, 2024. [CrossRef]
- M. Domínguez et al., “Review on the use of energy storage systems in railway applications,” Renew. Sustain. Energy Rev., vol. 207, 2025. [CrossRef]
- T. Suzuki, “DC power-supply system with inverting substations for traction systems using regenerative brakes,” IEE Proc. B - Electr. Power Appl., vol. 129, no. 1, pp. 18–26, 1982. [CrossRef]
- M. Aneke and M. Wang, “Energy storage technologies and real life applications – A state of the art review,” Appl. Energy, vol. 179, pp. 350–377, 2016. [CrossRef]
- M. Uddin, M. F. Romlie, M. F. Abdullah, S. Abd Halim, A. H. Abu Bakar, and T. Chia Kwang, “A review on peak load shaving strategies,” Renew. Sustain. Energy Rev., vol. 82, no. 3, pp. 3323–3332, 2018. [CrossRef]
- W. Jefimowski and A. Nikitenko, “Case study of stationary energy storage device in a 3 kV DC traction system,” in MATEC Web of Conferences. 13th International Conference Modern Electrified Transport – MET’2017, 2018, vol. 180, pp. 1–6. [CrossRef]
- D. Iannuzzi, F. Ciccarelli, and D. Lauria, “Stationary ultracapacitors storage device for improving energy saving and voltage profile of light transportation networks,” Transp. Res. Part C Emerg. Technol., vol. 21, no. 1, pp. 321–337, 2012. [CrossRef]
- R. Barrero, X. Tackoen, and J. Van Mierlo, “Analysis and configuration of supercapacitor based energy storage system on-board light rail vehicles,” pp. 1512–1517, 2008.
- S. J. Kashani and E. Farjah, “Applying Neural Network and Genetic Algorithm for Optimal Placement of Ultra- Capacitors in Metro Systems,” 2011 IEEE Electr. Power Energy Conf., pp. 35–40, 2011.
- U. Sirmelis, J. Zakis, and L. Grigans, “Optimal supercapacitor energy storage system sizing for traction substations,” in 2015 IEEE 5th International Conference on Power Engineering, Energy and Electrical Drives (POWERENG), 2015, pp. 592–595.
- K. H. Chua, Y. S. Lim, and S. Morris, “A novel fuzzy control algorithm for reducing the peak demands using energy storage system,” Energy, vol. 122, pp. 265–273, 2017. [CrossRef]
- J. P. Fossati, A. Galarza, A. Martín-Villate, and L. Fontán, “A method for optimal sizing energy storage systems for microgrids,” Renew. Energy, vol. 77, pp. 539–549, 2015. [CrossRef]
- M. Jarnut, J. Kaniewski, and V. Protsiuk, “Energy Storage System for Peak Power Reduction of Traction Substation,” in 2018 Innovative Materials and Technologies in Electrical Engineering (i-MITEL), 2018, vol. 67, pp. 1–5.
- A. Ovalle, J. Pouget, S. Bacha, L. Gerbaud, and E. Vinot, “Energy storage sizing methodology for mass-transit direct-current wayside support : Application to French railway company case study ☆,” Appl. Energy, vol. 230, no. August, pp. 1673–1684, 2018. [CrossRef]
- G. Graber, V. Calderaro, V. Galdi, A. Piccolo, R. Lamedica, and A. Ruvio, “Techno-economic sizing of auxiliary-battery-based substations in DC railway systems,” IEEE Trans. Transp. Electrif., vol. 4, no. 2, pp. 616–625, 2018. [CrossRef]
- P. Pankovits, J. Pouget, B. Robyns, F. Delhaye, and S. Brisset, “Towards railway-smartgrid: Energy management optimization for hybrid railway power substations,” in IEEE PES Innovative Smart Grid Technologies, Europe, 2014, pp. 1–6.
- F. Ciccarelli, D. Iannuzzi, D. Lauria, and P. Natale, “Optimal Control of Stationary Lithium-Ion Capacitor-Based Storage Device for Light Electrical Transportation Network,” IEEE Trans. Transp. Electrif., vol. 3, no. 3, pp. 618–631, 2017. [CrossRef]
- C. Zheng, S. Wei, Z. Wang, S. Liu, and Y. Yuan, “Research and implementation on hybrid energy storage system experimental platform of rail transit,” Energy Procedia, vol. 105, pp. 3603–3608, 2017. [CrossRef]
- G. Li and S. W. Or, “Multi-agent deep reinforcement learning-based multi-time scale energy management of urban rail traction networks with distributed photovoltaic–regenerative braking hybrid energy storage systems,” J. Clean. Prod., vol. 466, no. June, p. 142842, 2024. [CrossRef]
- https://www.statista.com/statistics/1322214/carbon-prices-european-union-emission-trading-scheme/ (uploaded 17th Dec 2024).
- M. Wieczorek and M. Lewandowski, “A mathematical representation of an energy management strategy for hybrid energy storage system in electric vehicle and real time optimization using a genetic algorithm,” Appl. Energy, vol. 192, pp. 222–233, 2017. [CrossRef]
- W. Jefimowski and A. Szeląg, “The multi-criteria optimization method for implementation of a regenerative inverter in a 3 kV DC traction system,” Electr. Power Syst. Res., vol. 161, pp. 61–73, 2018. [CrossRef]
- W. Jefimowski W, Z. Drążek Distributed Module-Based Power Supply Enhancement System for 3 kV DC Traction. Energies. 2023; 16(1):401. [CrossRef]
- The Boston Consulting Group Inc., “Focus Batteries for Electric Cars: Challenges, Opportunities, and the Outlook to 2020,” 2010. [Online]. Available: https://www.bcg.com/documents/file36615.pdf.
- W. Jefimowski, A. Nikitenko, Z. Drążek, and M. Wieczorek, “Stationary supercapacitor energy storage operation algorithm based on neural network learning system,” Bull. Polish Acad. Sci. Tech. Sci., vol. 68, no. 4, pp. 733–738, 2020. [CrossRef]
- J. Wang et al., “Cycle-life model for graphite-LiFePO 4 cells,” J. Power Sources, vol. 196, no. 8, pp. 3942–3948, 2011.
- REGULATION OF THE MINISTER OF CLIMATE AND ENVIRONMENT of 26 October 2023 on the greenhouse gas emission factor for electricity in 2024 (in Polish: ROZPORZĄDZENIE MINISTRA KLIMATU I ŚRODOWISKA z dnia 26 października 2023 r. w sprawie wskaźnika emisji gazów cieplarnianych dla energii elektrycznej w 2024 r. Dz.U. RP, 2.11.2023)-.
Figure 1.
General scheme of hybrid energy storage system connectionto DC busbar of traction substation, 1 – supercapacitor module; 2 – electrochemical battery module.
Figure 1.
General scheme of hybrid energy storage system connectionto DC busbar of traction substation, 1 – supercapacitor module; 2 – electrochemical battery module.
Figure 2.
Flowchart of the proposed energy storage sizing method.
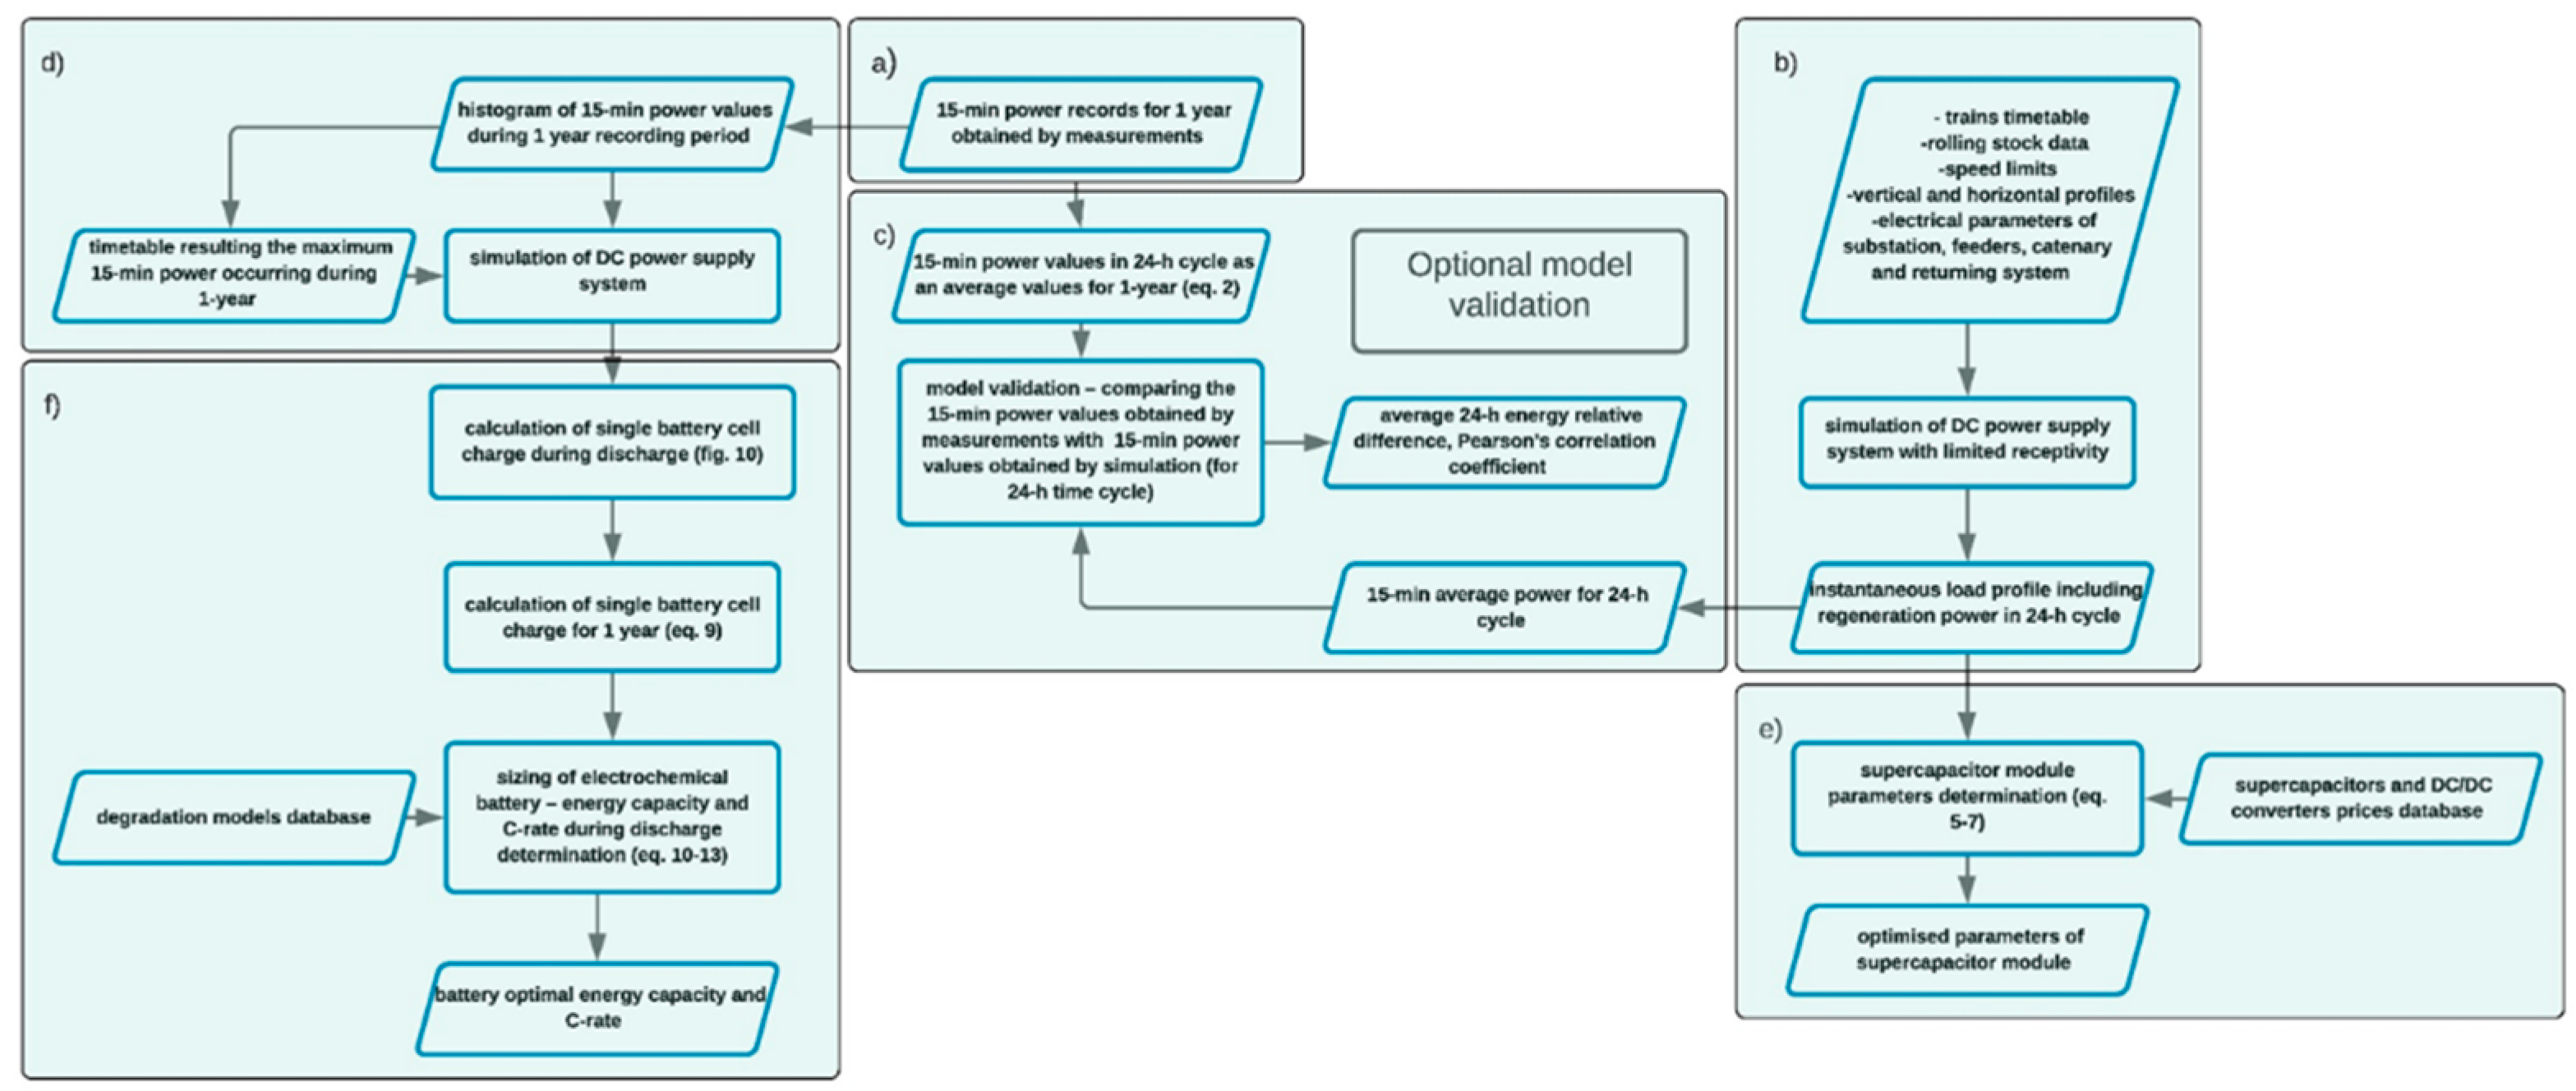
Figure 3.
Traction characteristics and the traction current assuming the nominal pantograph voltage 3 kV of the rolling stock under consideration.
Figure 3.
Traction characteristics and the traction current assuming the nominal pantograph voltage 3 kV of the rolling stock under consideration.
Figure 4.
Train timetable in 24-h cycle modelled in the simulation model with traffic damming around 6 p.m near to Station 8 marked with the orange ellipse.
Figure 4.
Train timetable in 24-h cycle modelled in the simulation model with traffic damming around 6 p.m near to Station 8 marked with the orange ellipse.
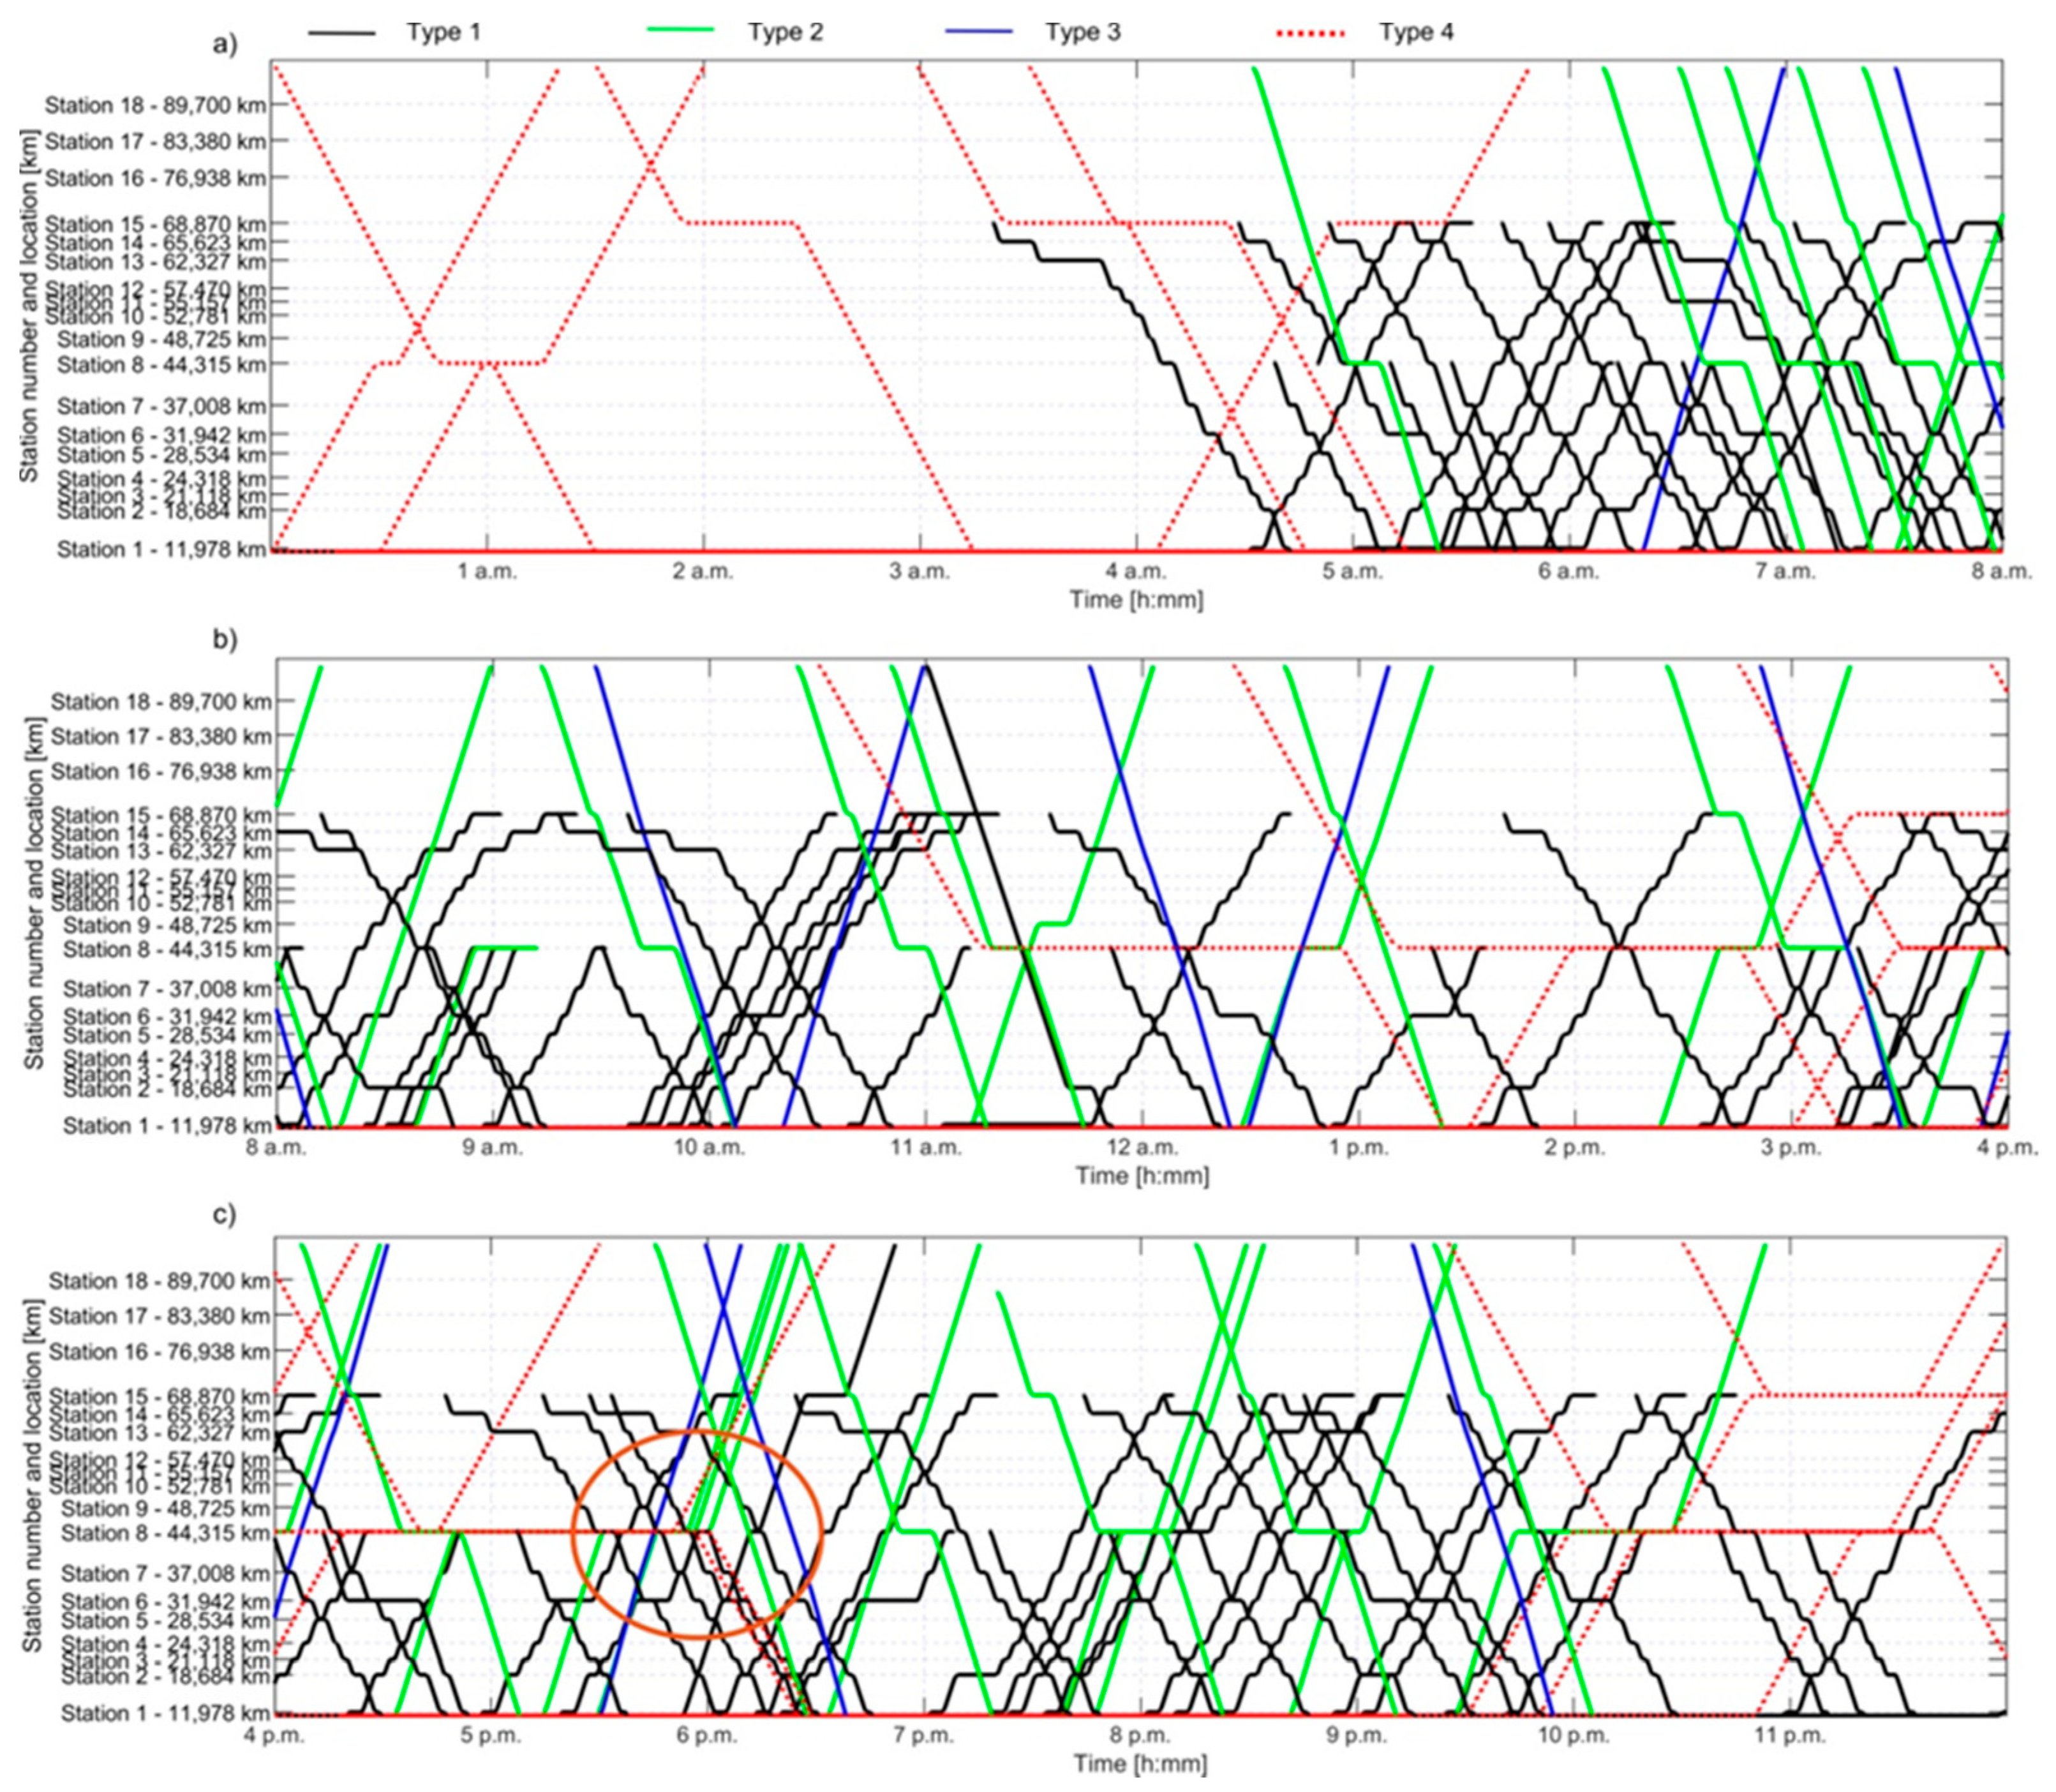
Figure 5.
a) Comparison of 15-min average power obtained by measurements and simulation; b) correlation diagram of 15-min average power obtained by measurements and simulation.
Figure 5.
a) Comparison of 15-min average power obtained by measurements and simulation; b) correlation diagram of 15-min average power obtained by measurements and simulation.
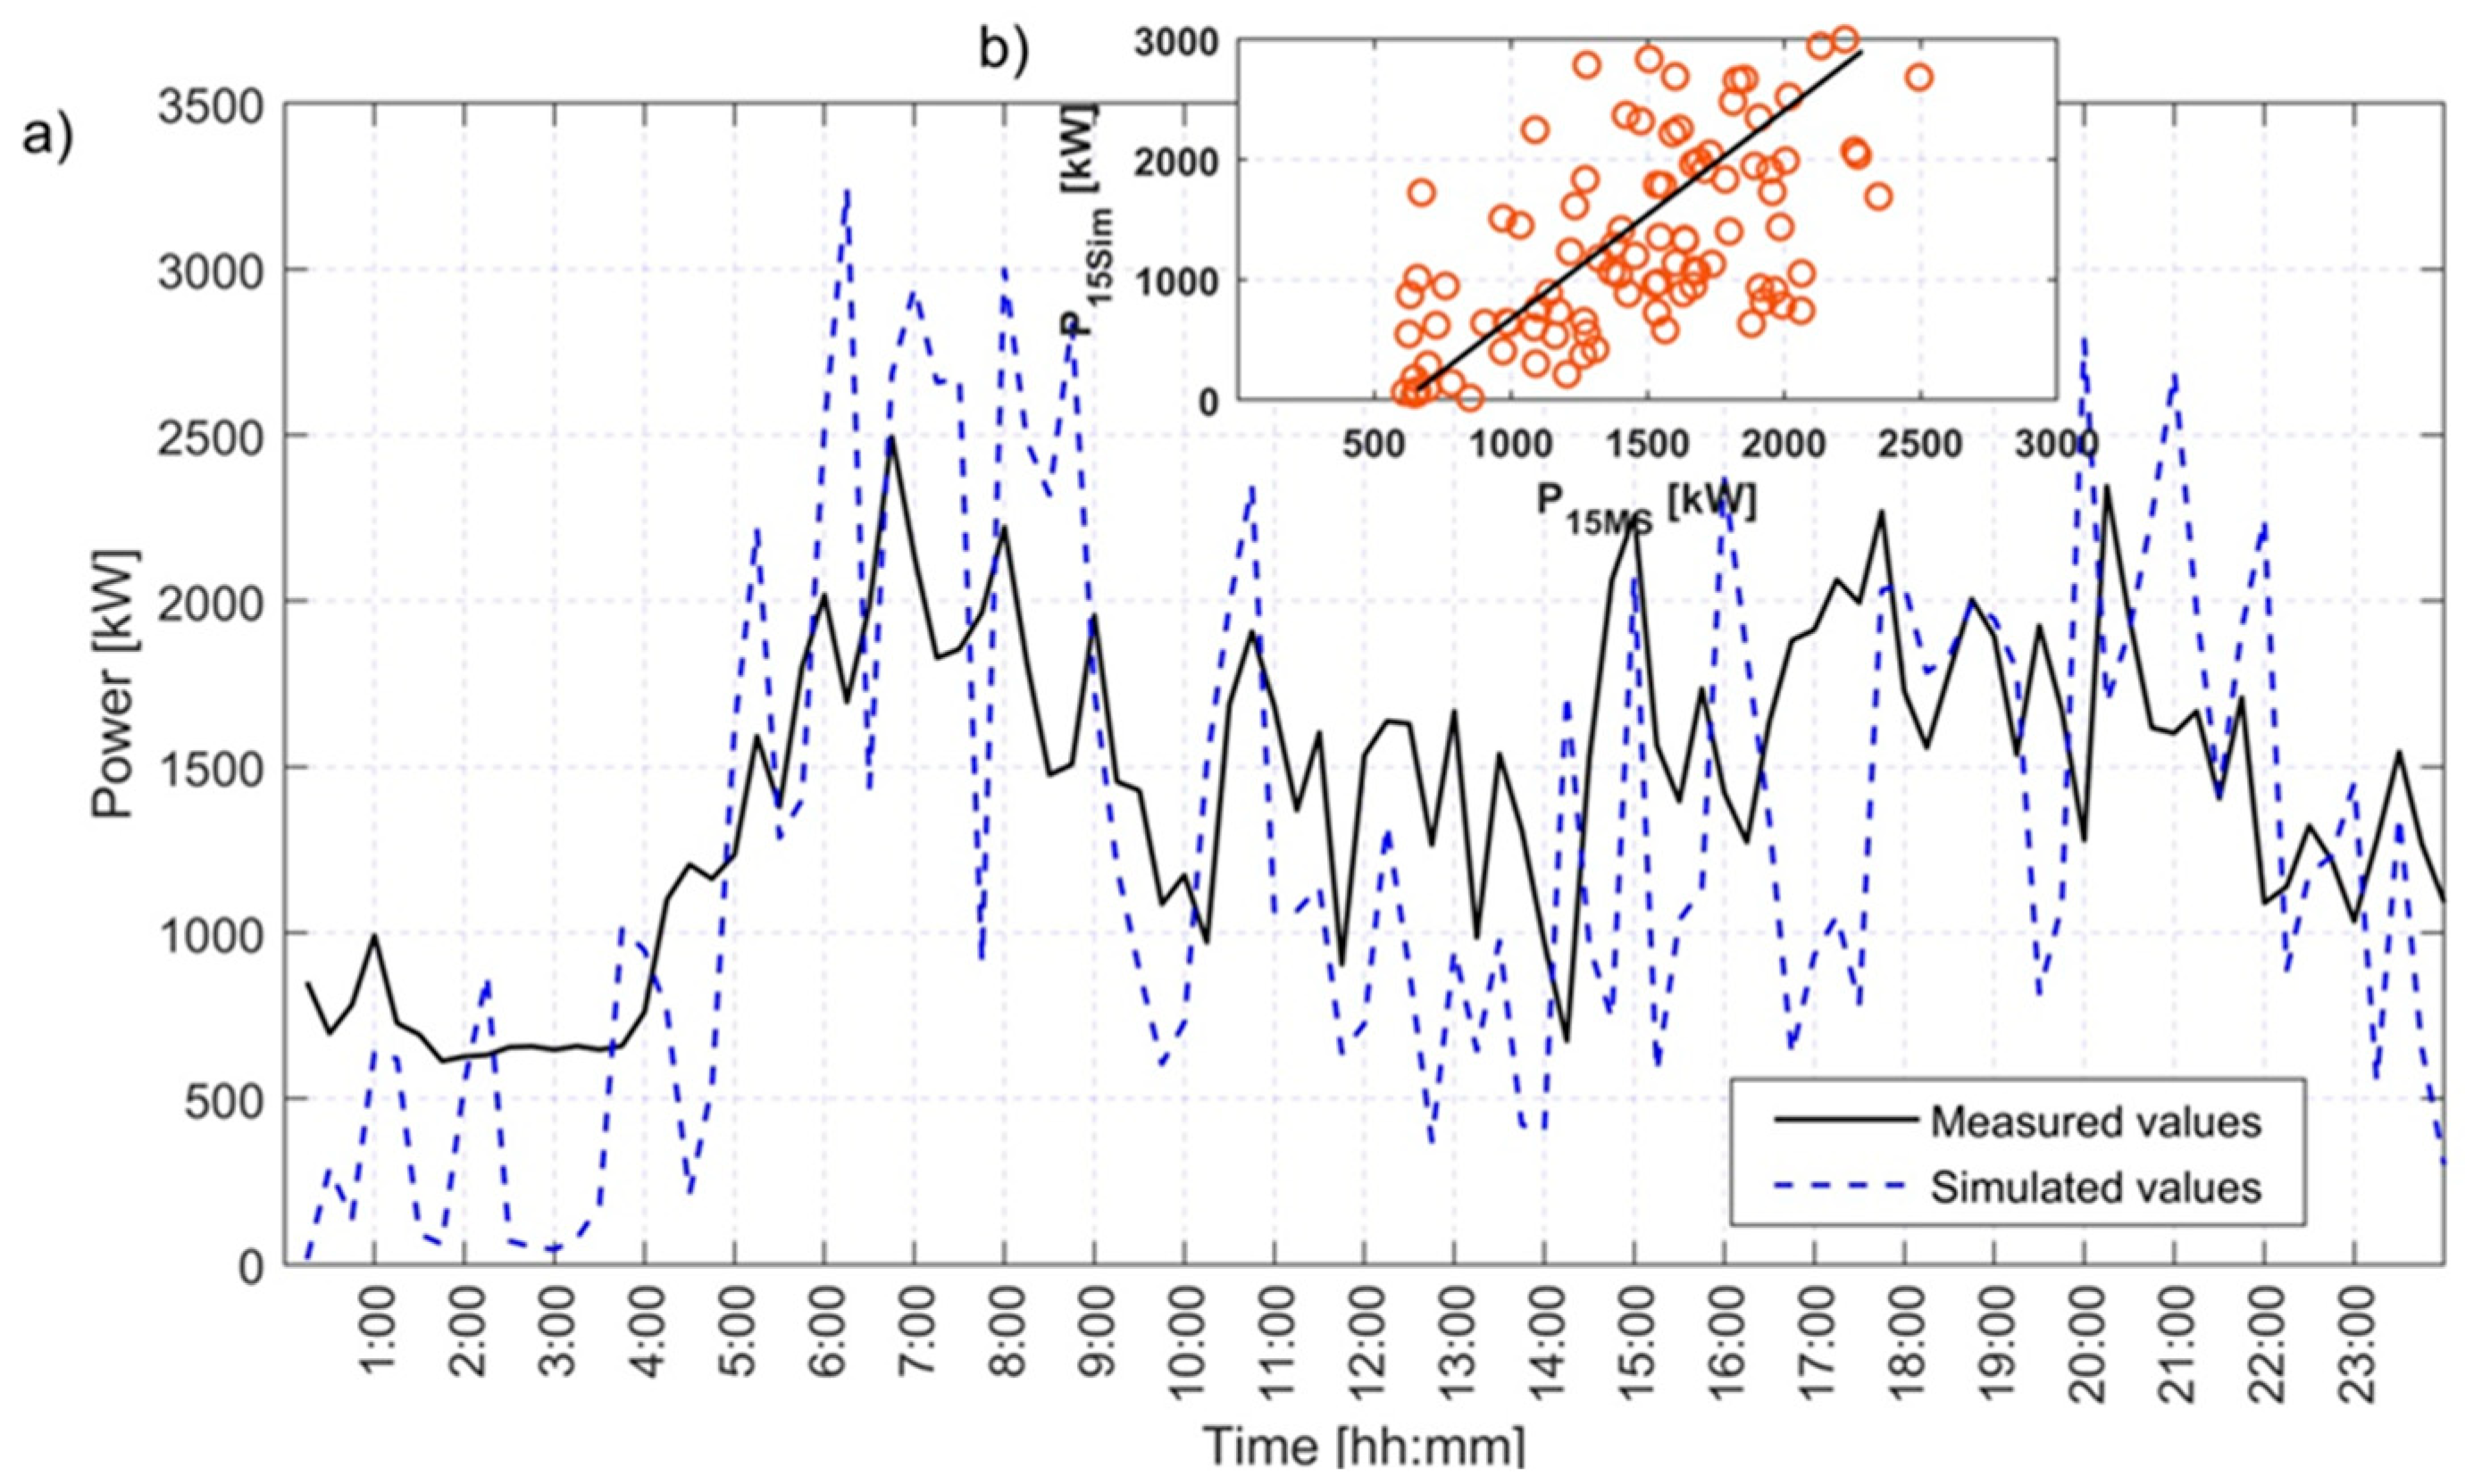
Figure 6.
Flowchart of energy management strategy; a) general algorithm of hybrid ESS operation; b) algorithm of supercapacitor operation.
Figure 6.
Flowchart of energy management strategy; a) general algorithm of hybrid ESS operation; b) algorithm of supercapacitor operation.
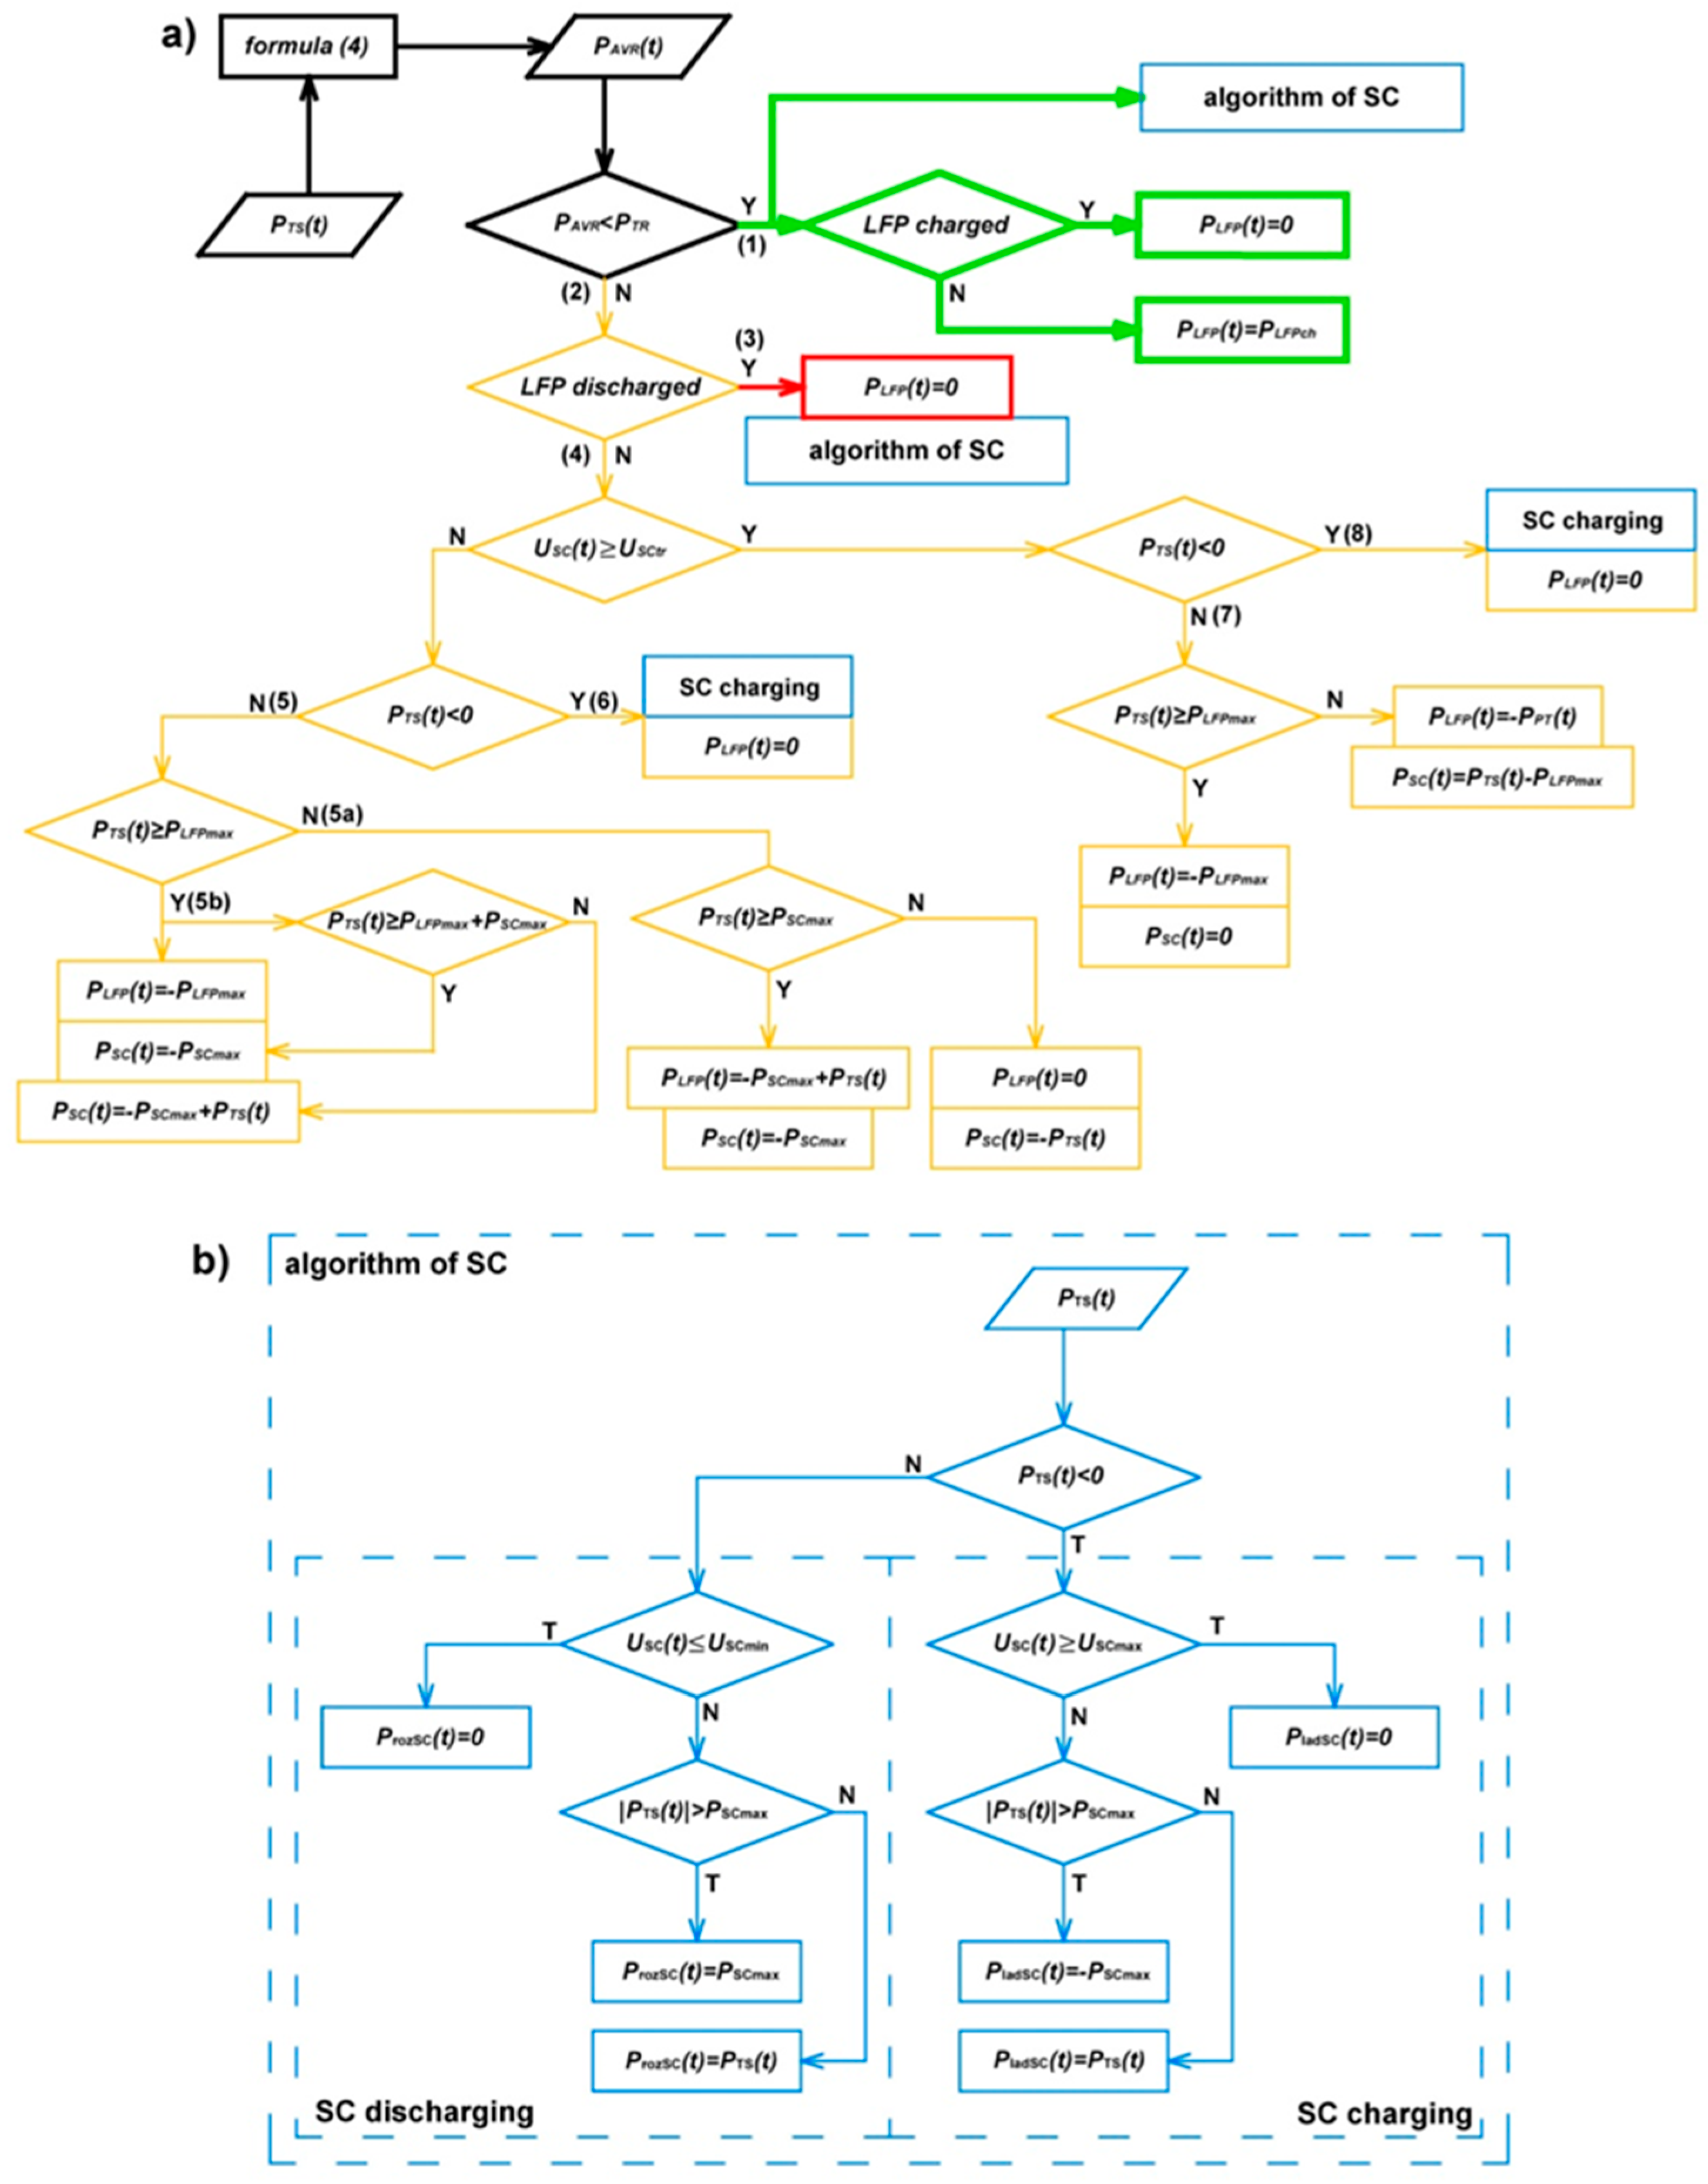
Figure 7.
a) values of hybrid ESS elements instantaneous power trigger power exceeding; b) transients of 15-min RMS substation power during 24-h cycle operation with and without hybrid ESS (ΔPAVR – value of the difference of the maximum 15-min average power).
Figure 7.
a) values of hybrid ESS elements instantaneous power trigger power exceeding; b) transients of 15-min RMS substation power during 24-h cycle operation with and without hybrid ESS (ΔPAVR – value of the difference of the maximum 15-min average power).
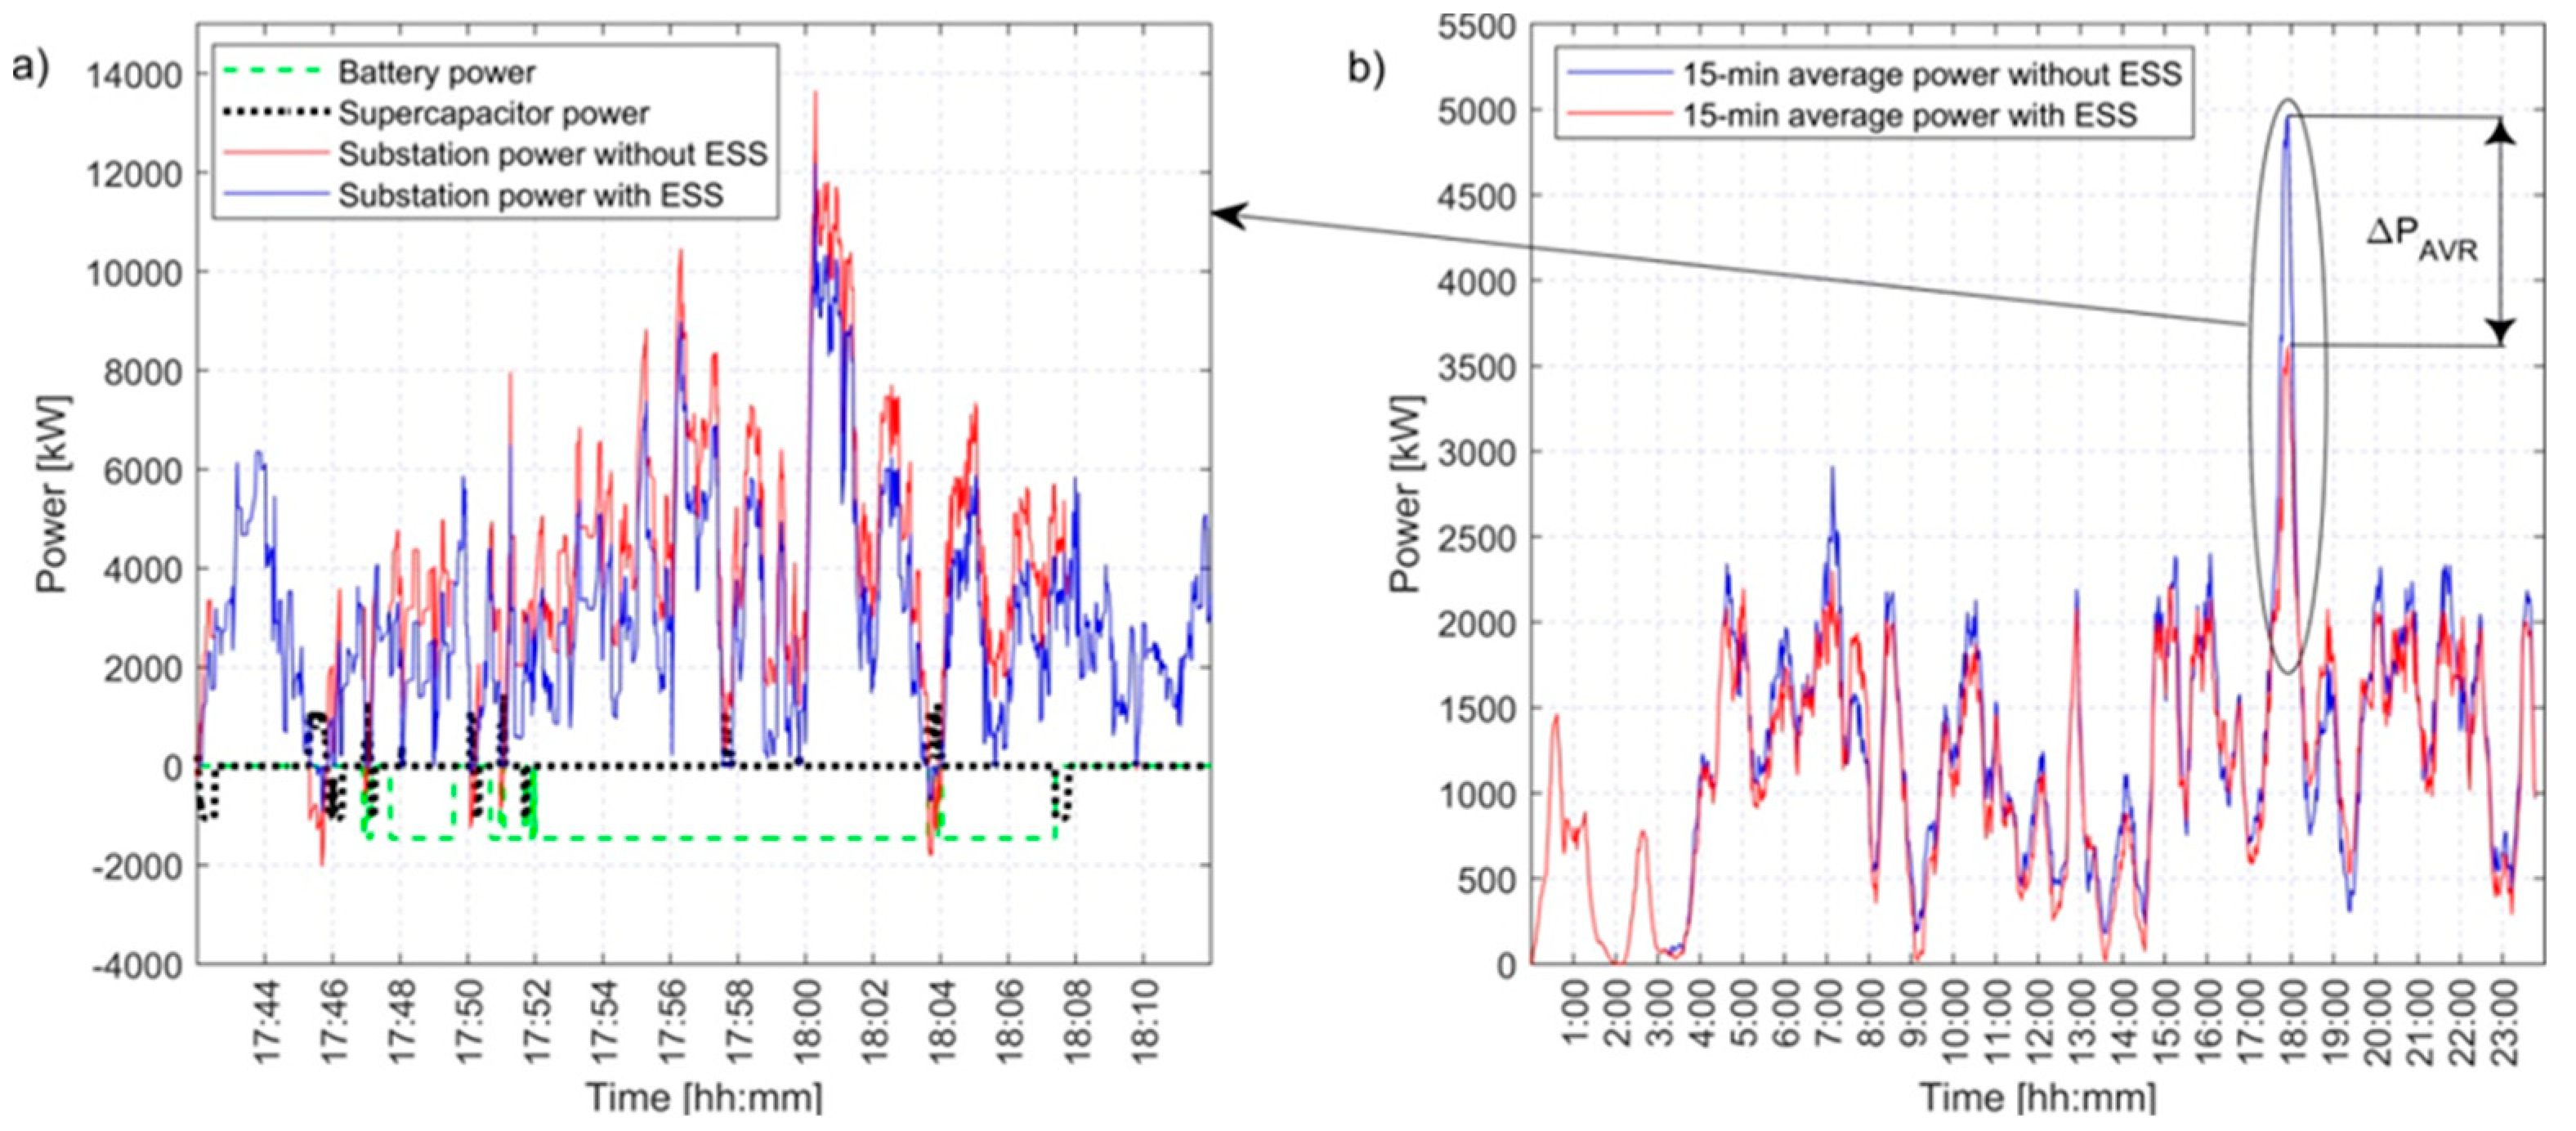
Figure 8.
a) 24-h energy recovered by ESS; b) diagram of payback period values, both as a function ofinstalled power of DC/DC converter and supercapacitor pack energy capacity.
Figure 8.
a) 24-h energy recovered by ESS; b) diagram of payback period values, both as a function ofinstalled power of DC/DC converter and supercapacitor pack energy capacity.
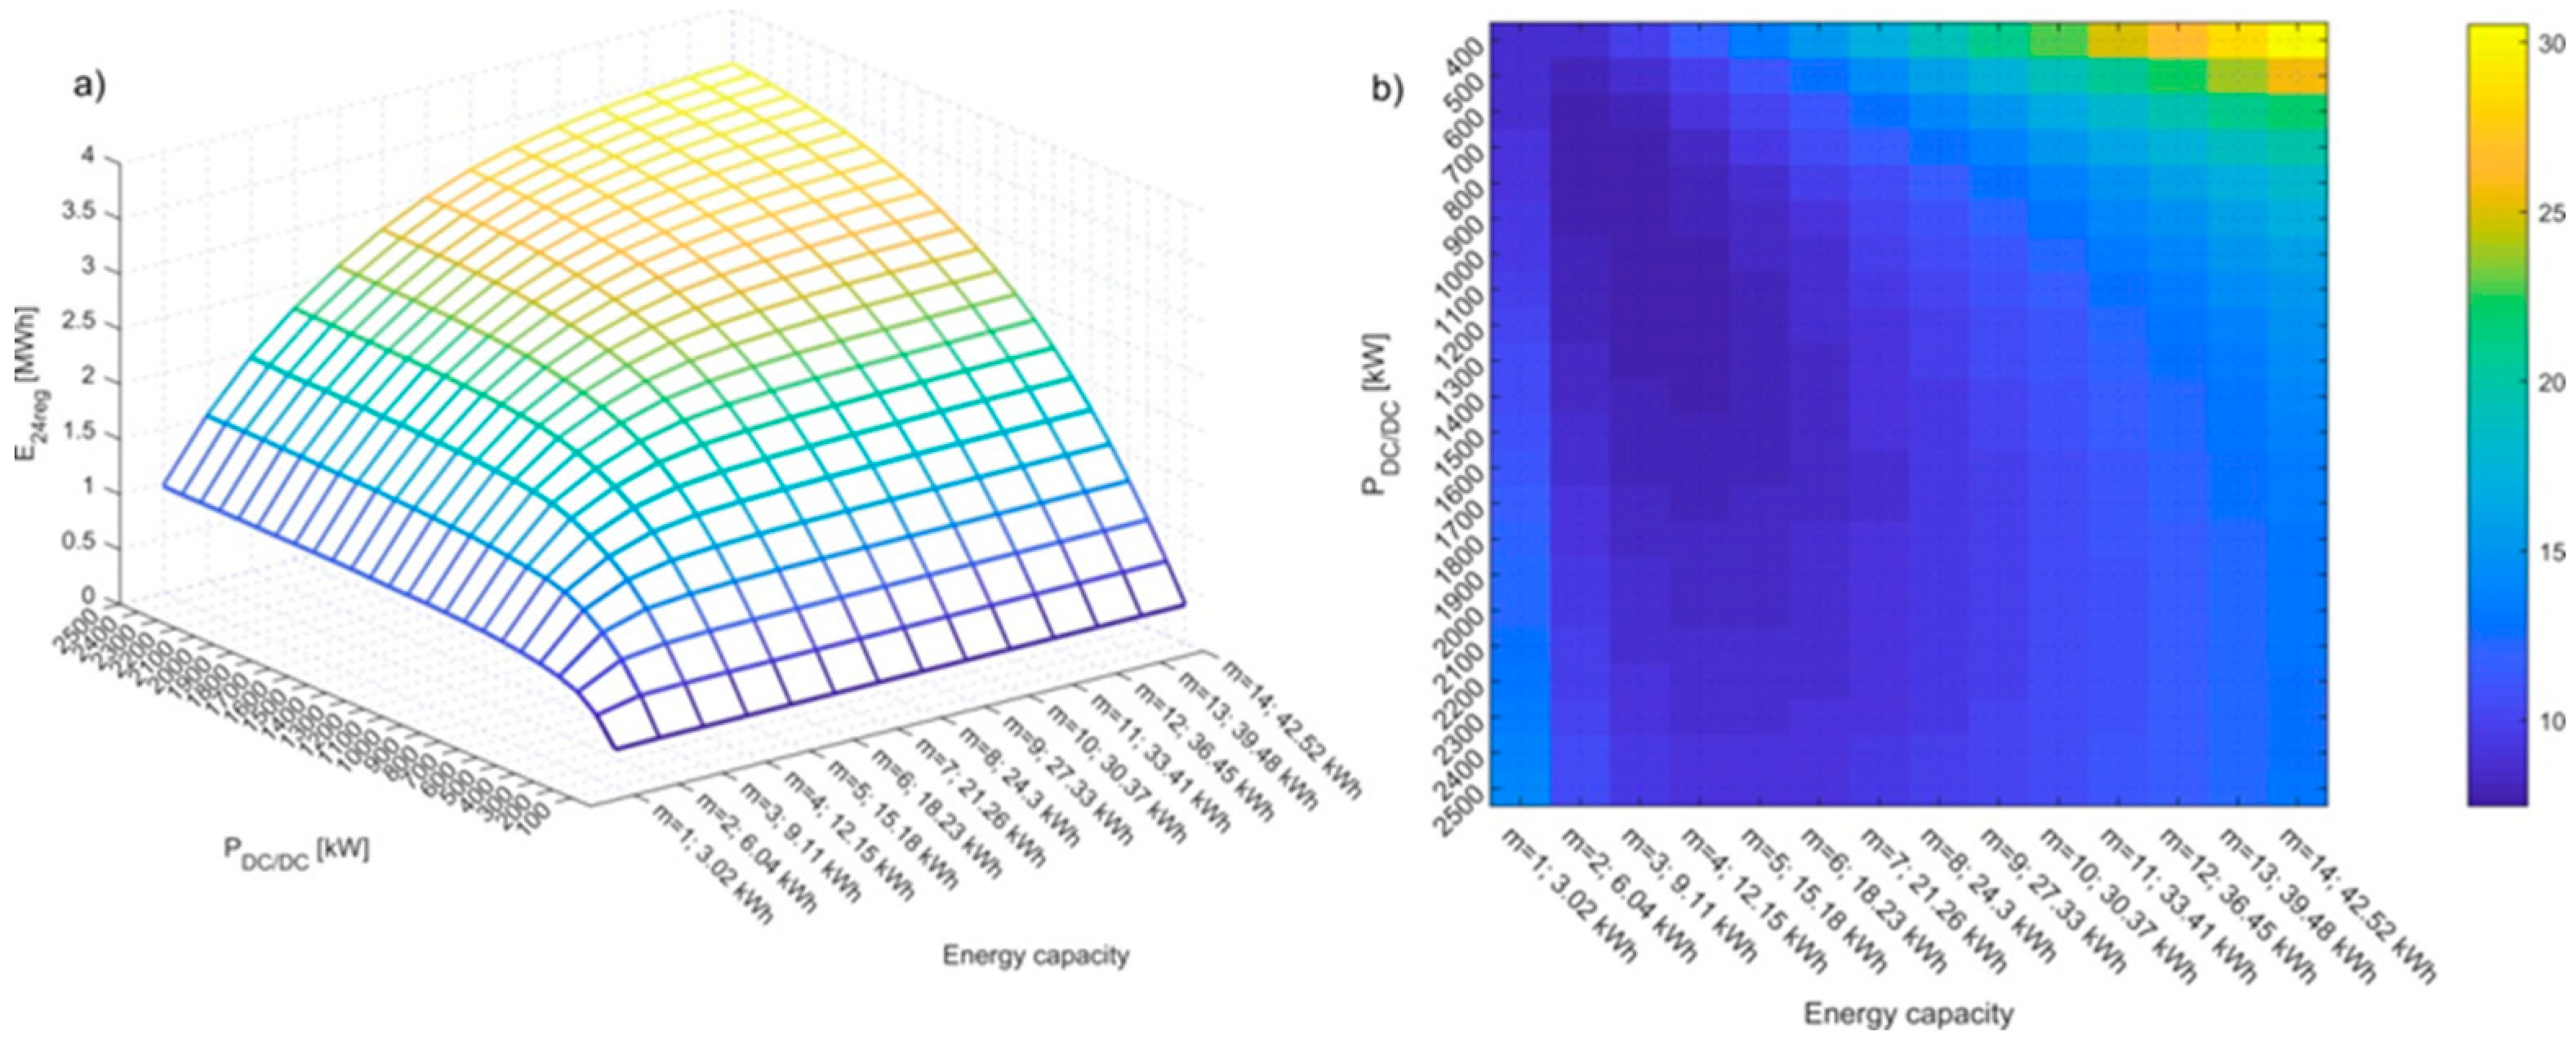
Figure 9.
Histogram of 15-min power during one year of measurement npeak.
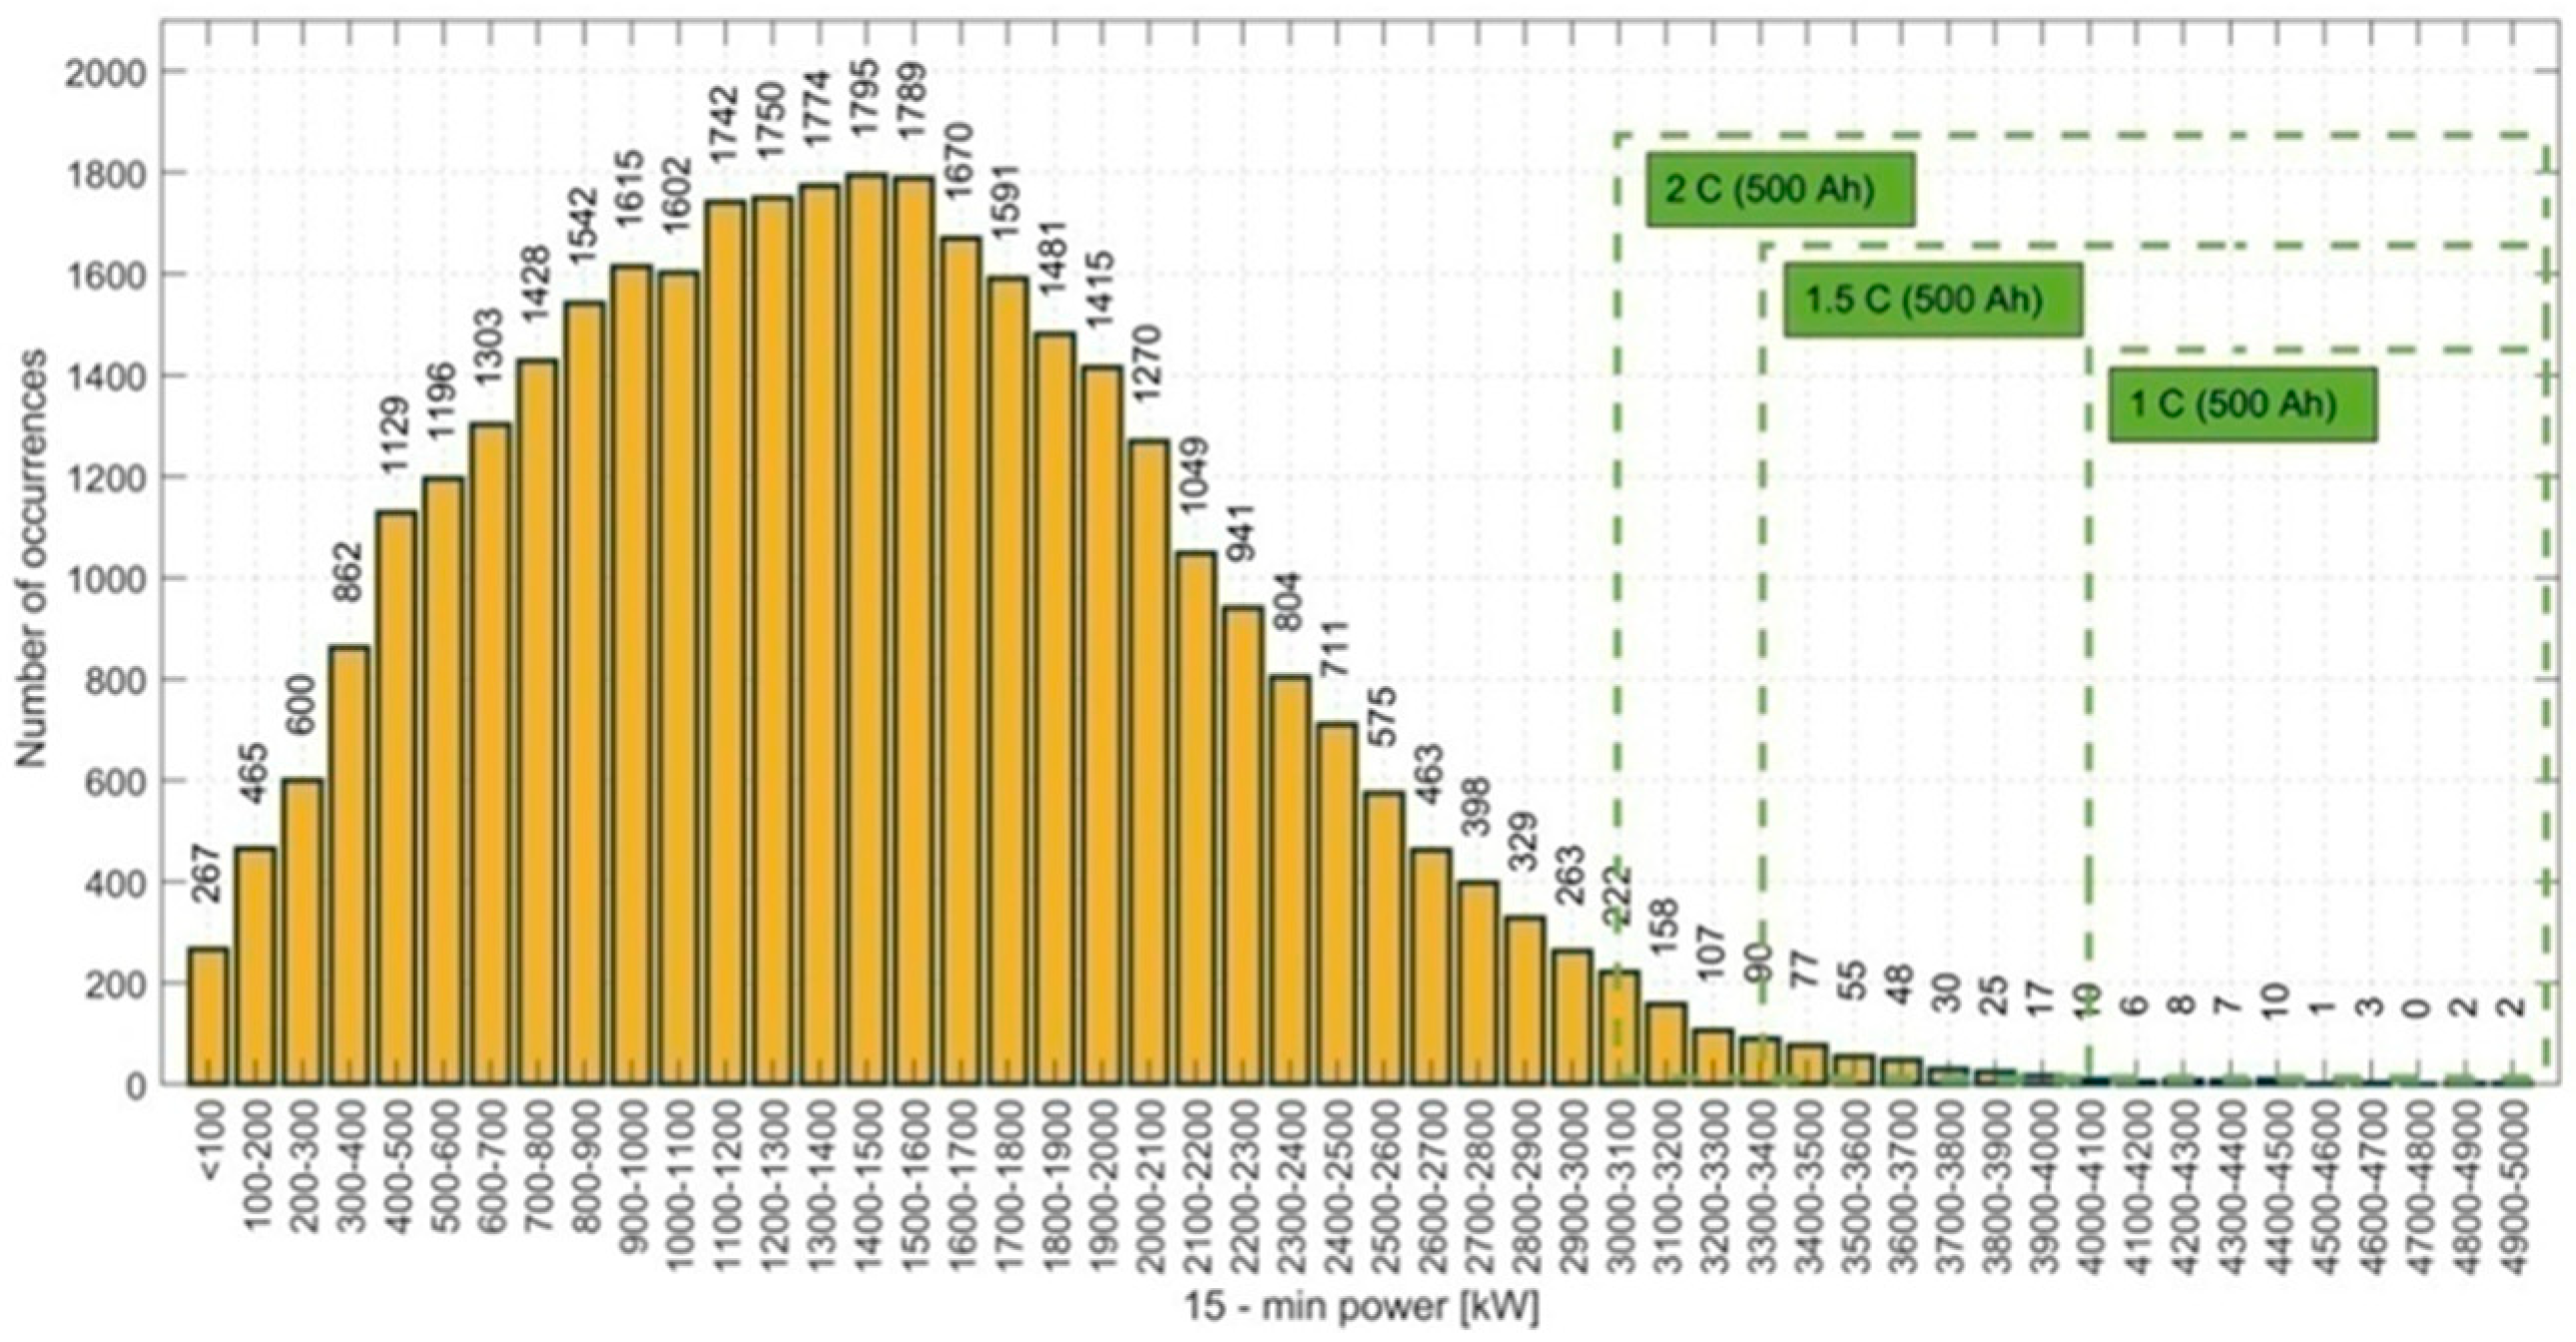
Figure 10.
The relationship between value of trigger power PTR and the reduction of the peak power demand ΔPAVR.
Figure 10.
The relationship between value of trigger power PTR and the reduction of the peak power demand ΔPAVR.
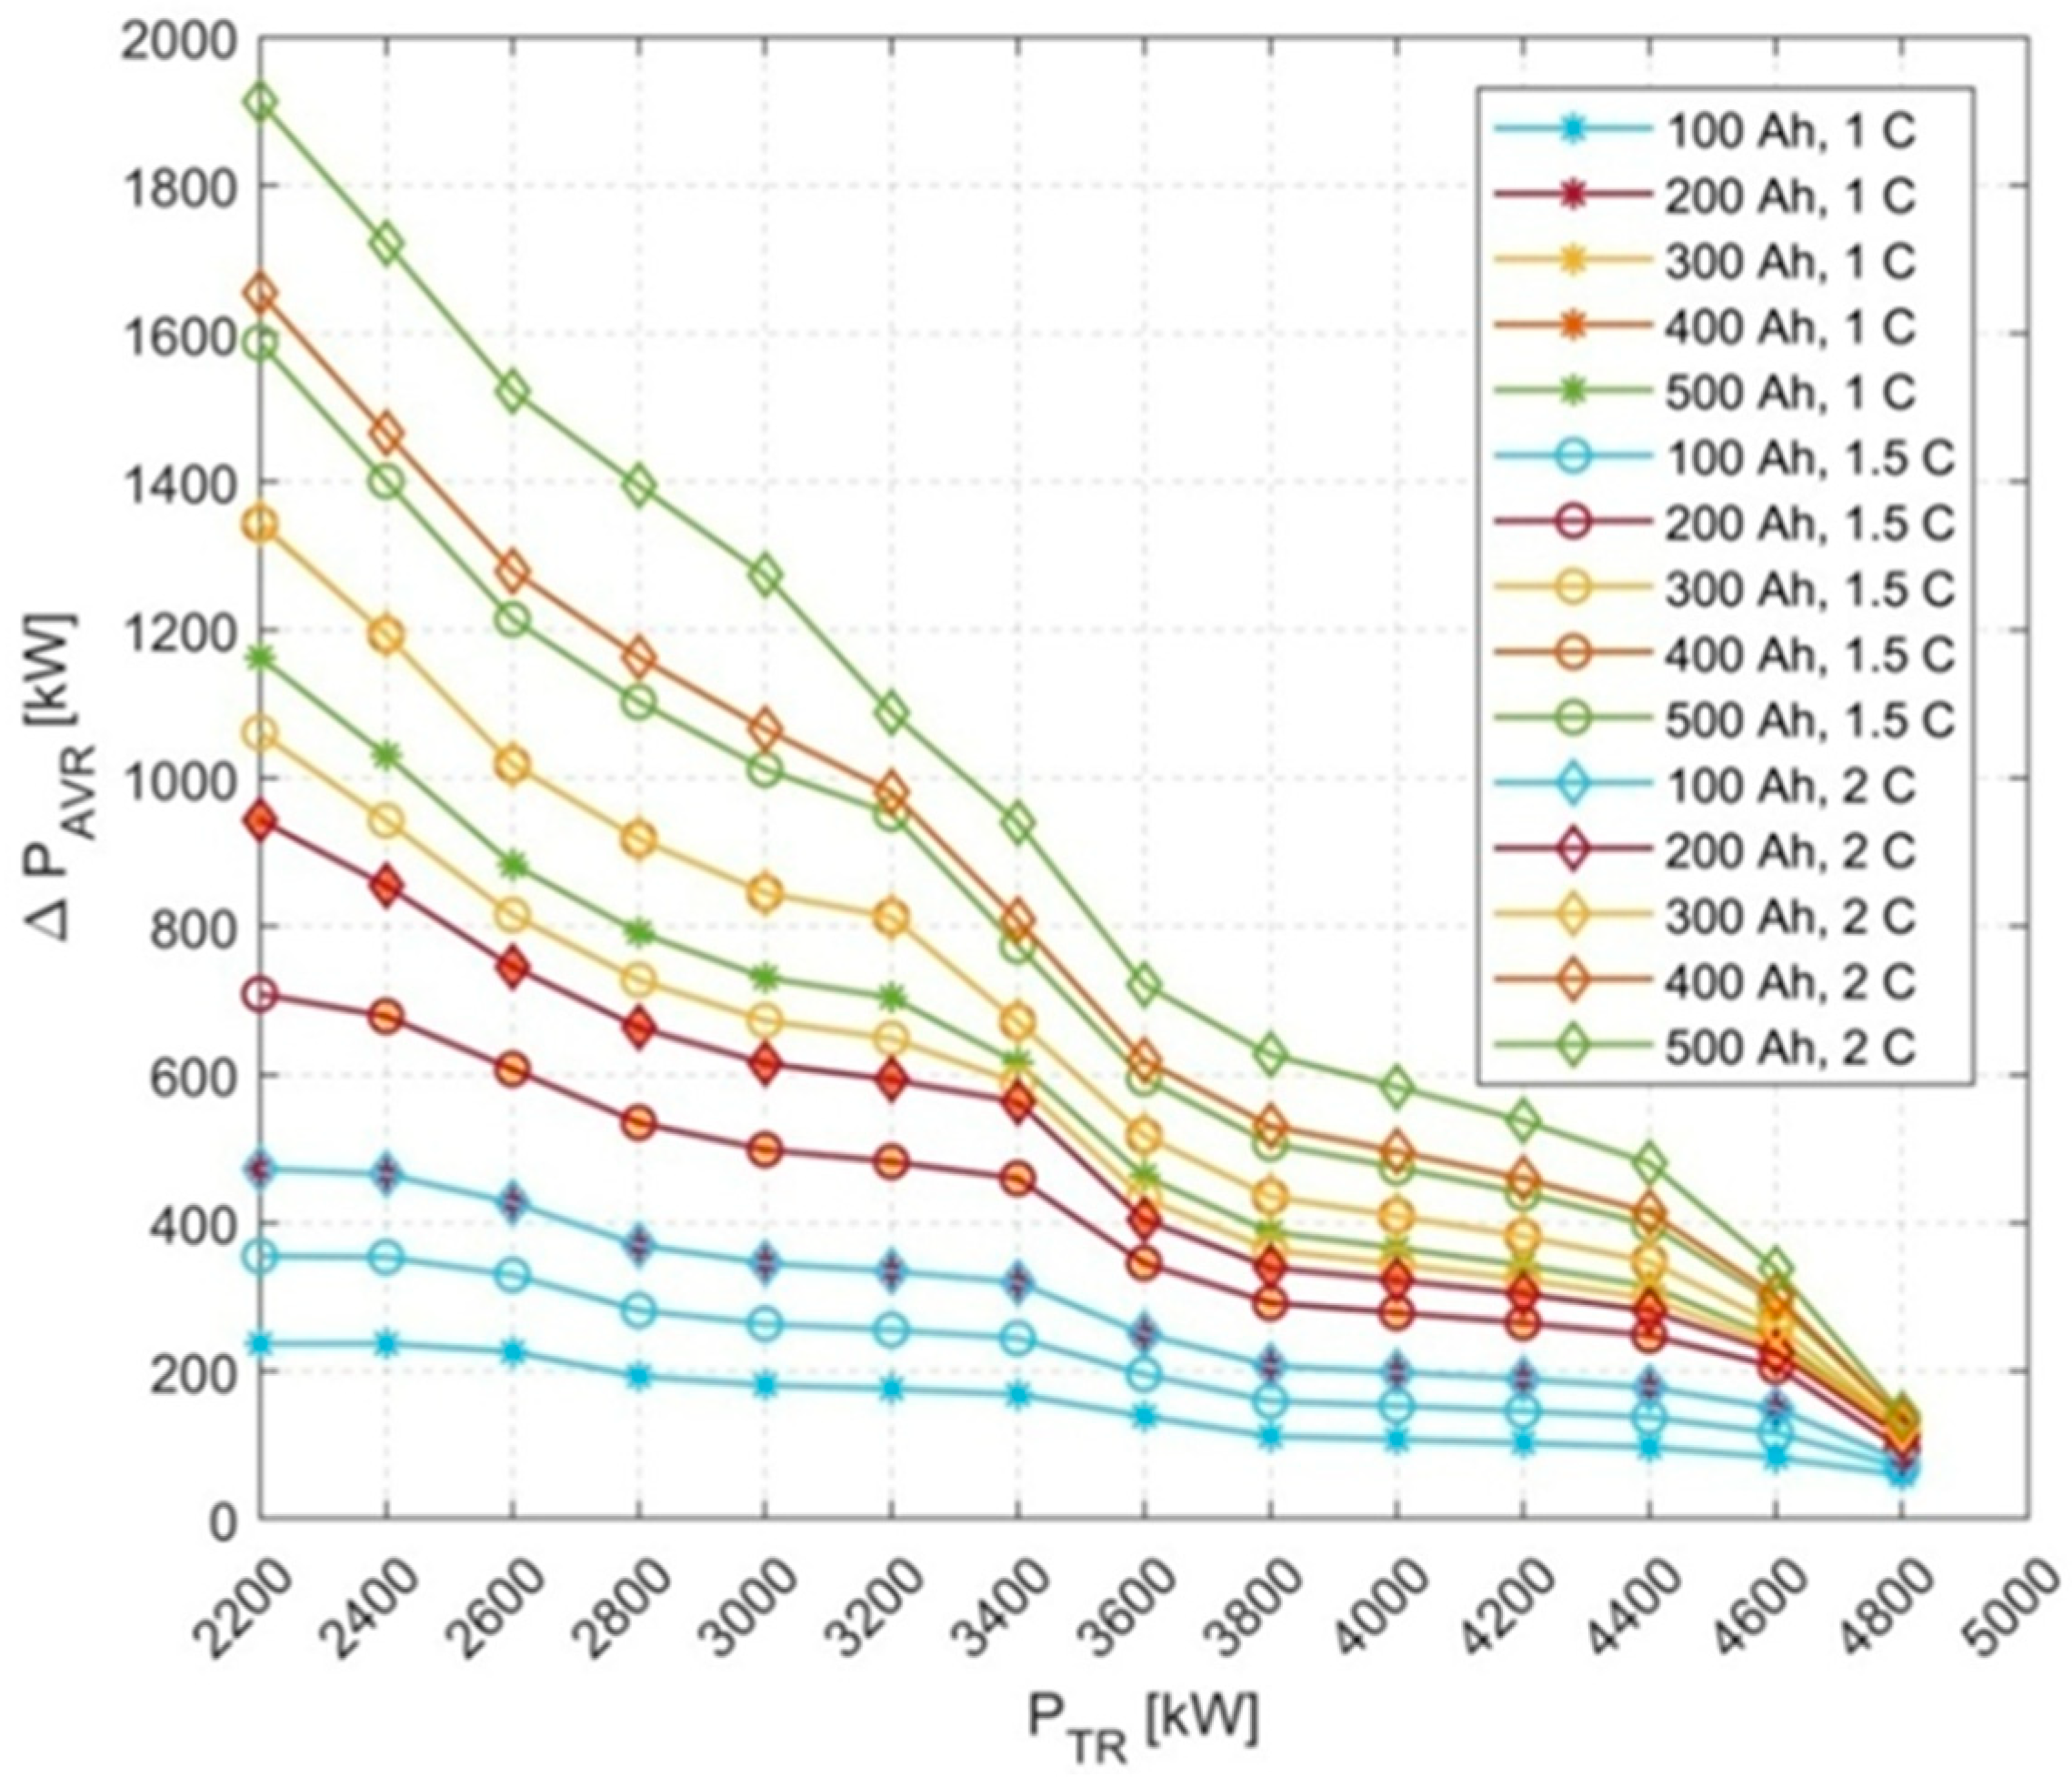
Figure 11.
Single battery cell charge flowing during discharge as the function of 15-min peak power reduction (ΔPAVR) for different battery capacity and discharge C-rate.
Figure 11.
Single battery cell charge flowing during discharge as the function of 15-min peak power reduction (ΔPAVR) for different battery capacity and discharge C-rate.
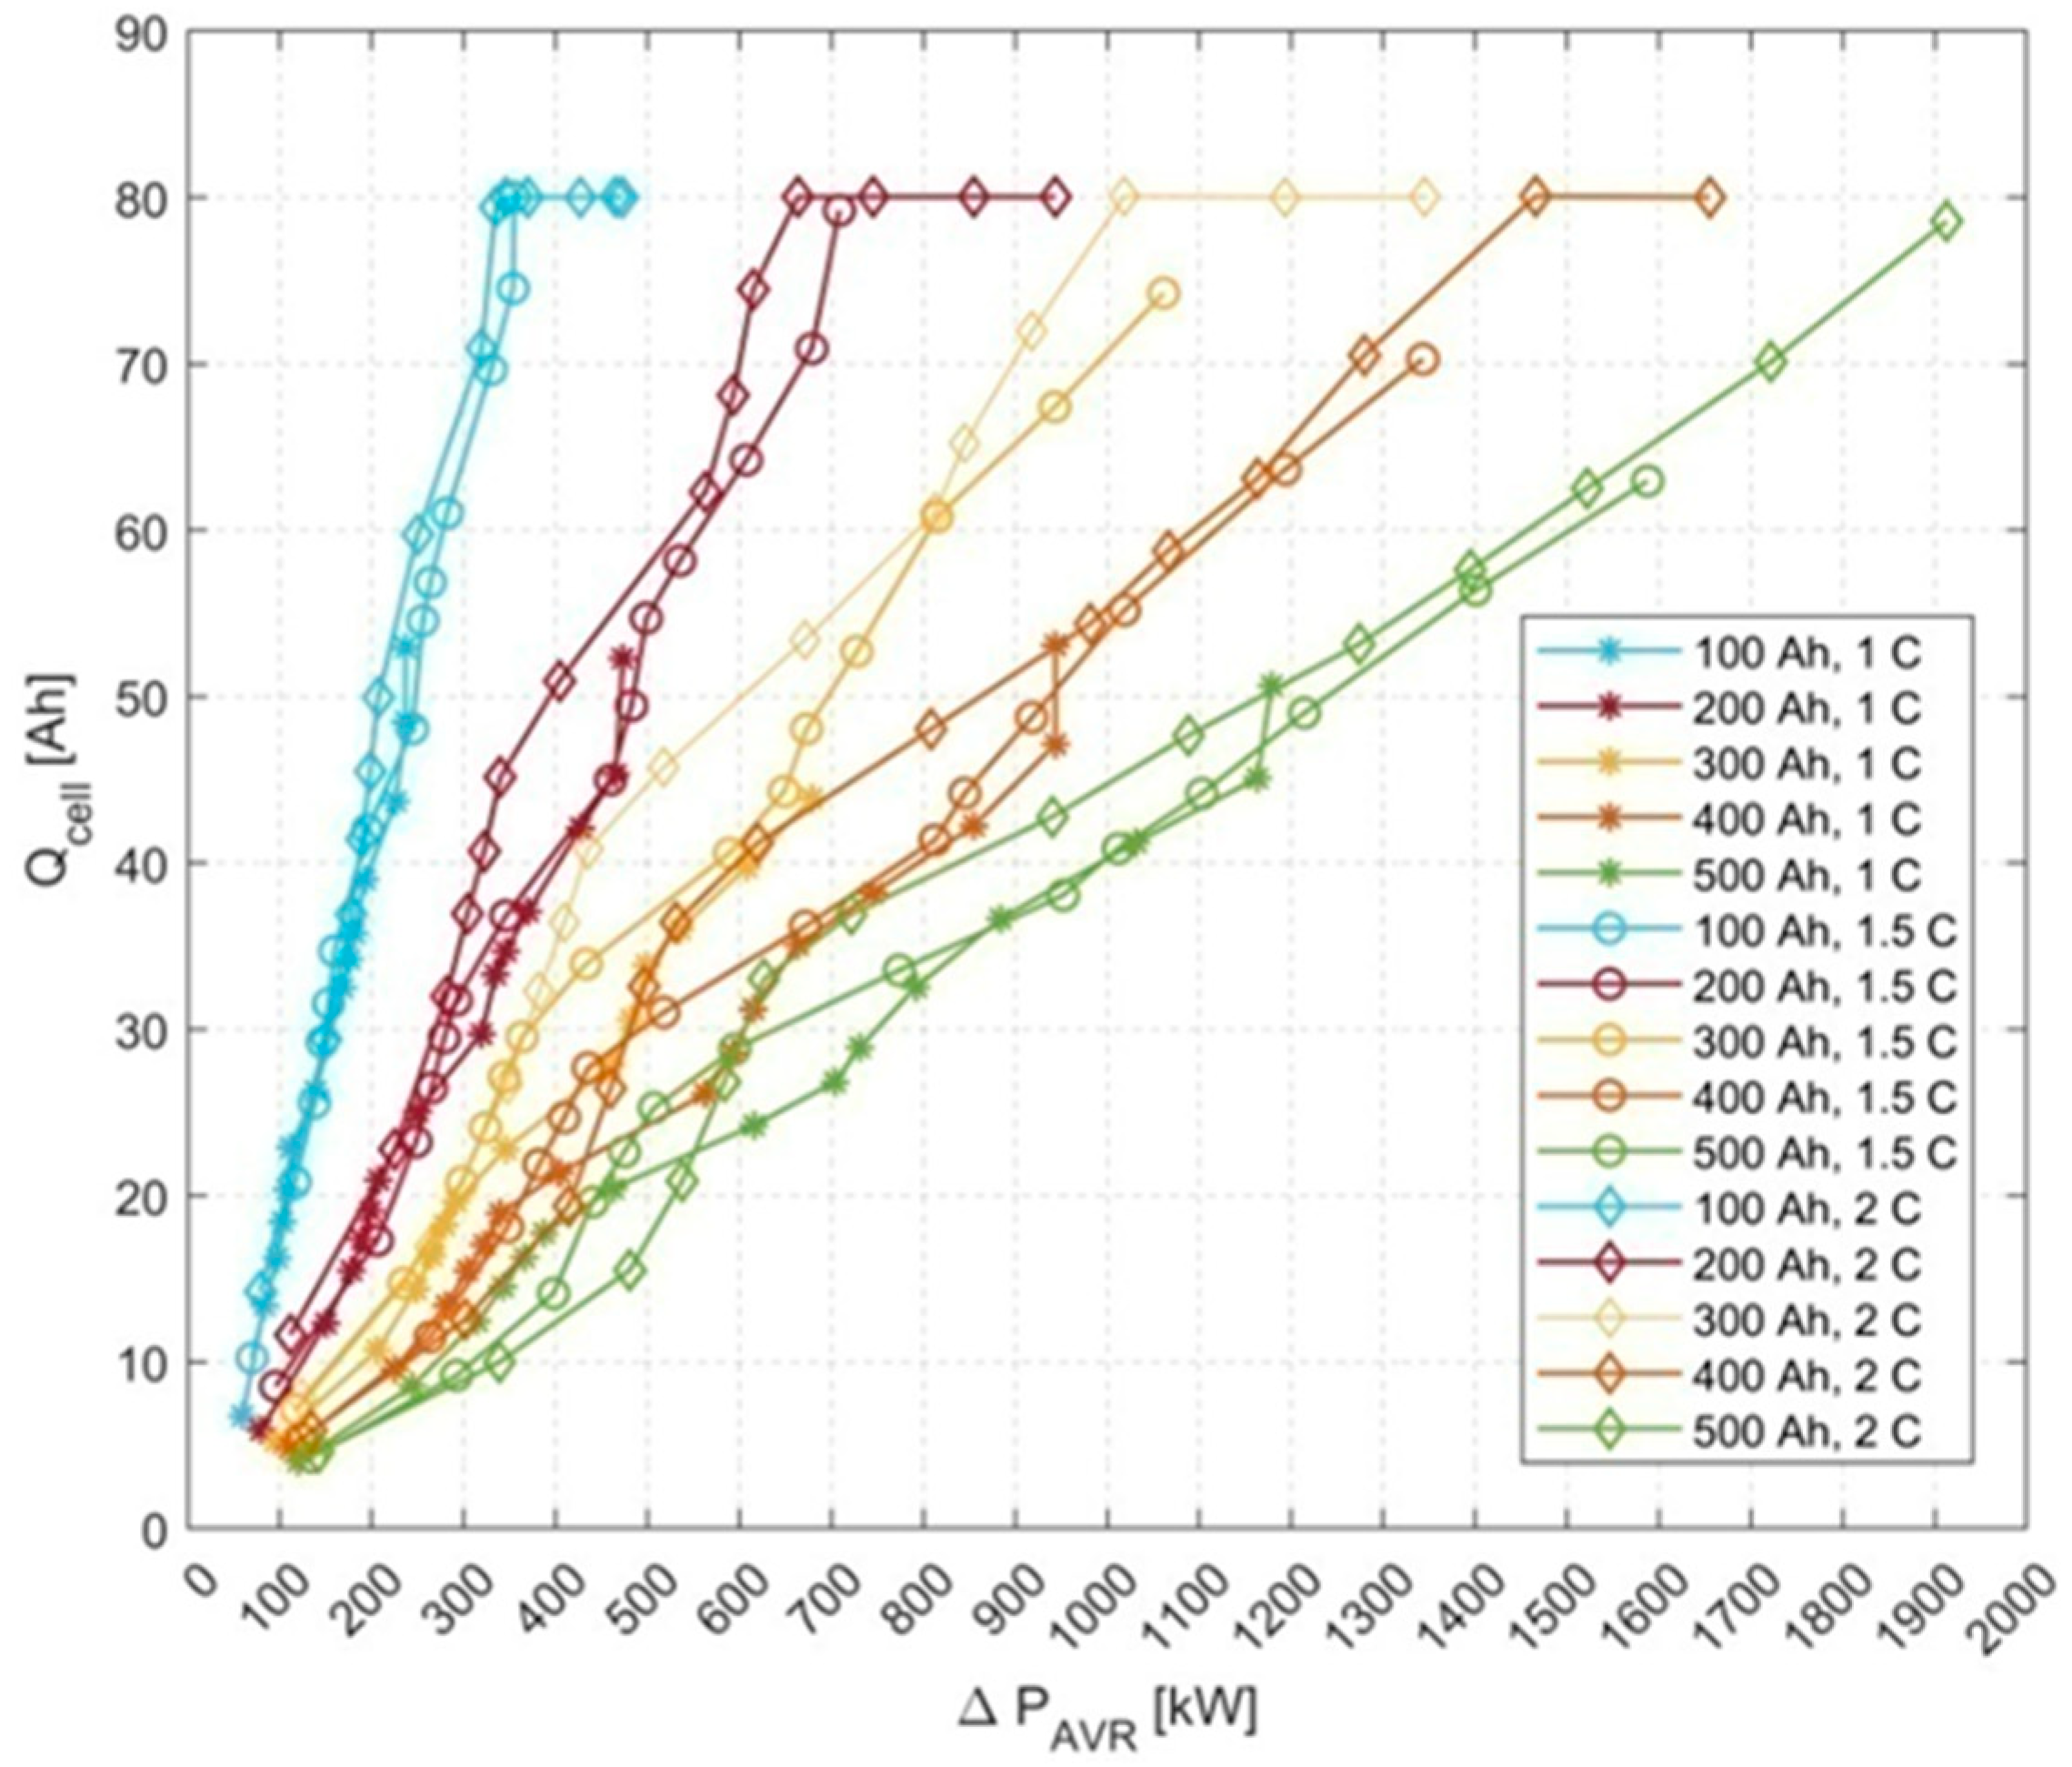
Figure 12.
Total annual cell charge flowing through the single battery cell as a function of 15-min peak power reduction (ΔPAVR) for different battery capacity and discharge C-rate.
Figure 12.
Total annual cell charge flowing through the single battery cell as a function of 15-min peak power reduction (ΔPAVR) for different battery capacity and discharge C-rate.
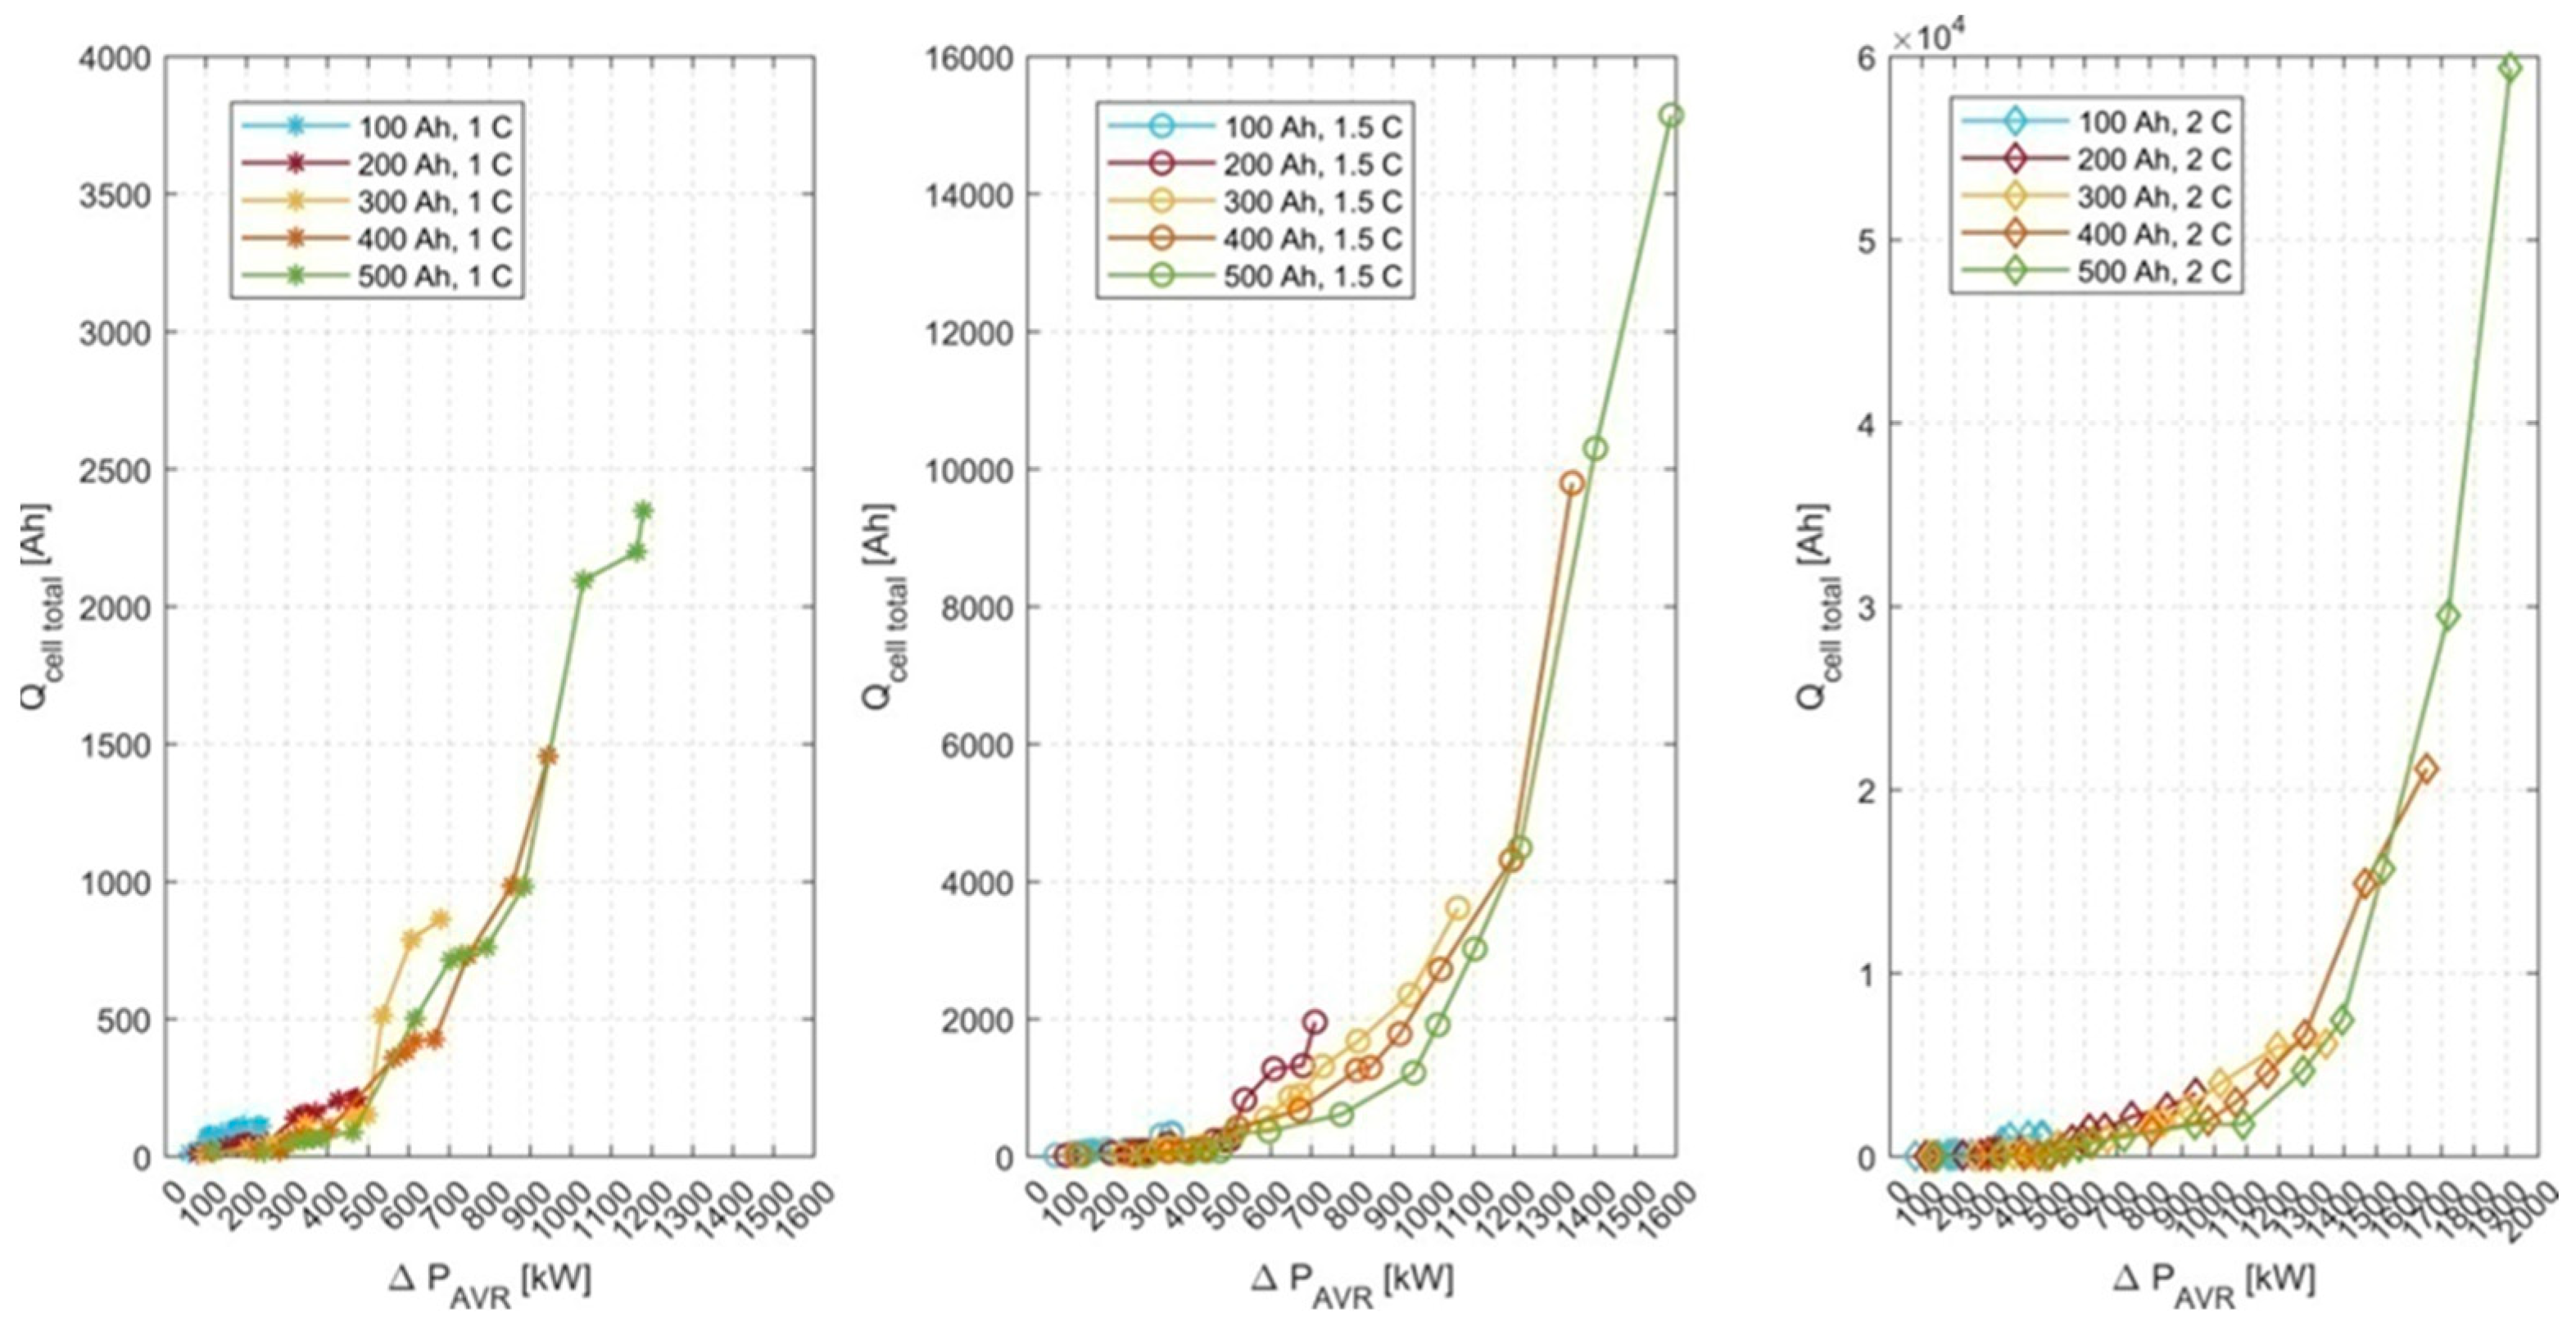
Figure 13.
The values of α coefficient as a function of difference of 15-min peak power (ΔPAVR) for different battery capacity and discharge C-rate.
Figure 13.
The values of α coefficient as a function of difference of 15-min peak power (ΔPAVR) for different battery capacity and discharge C-rate.
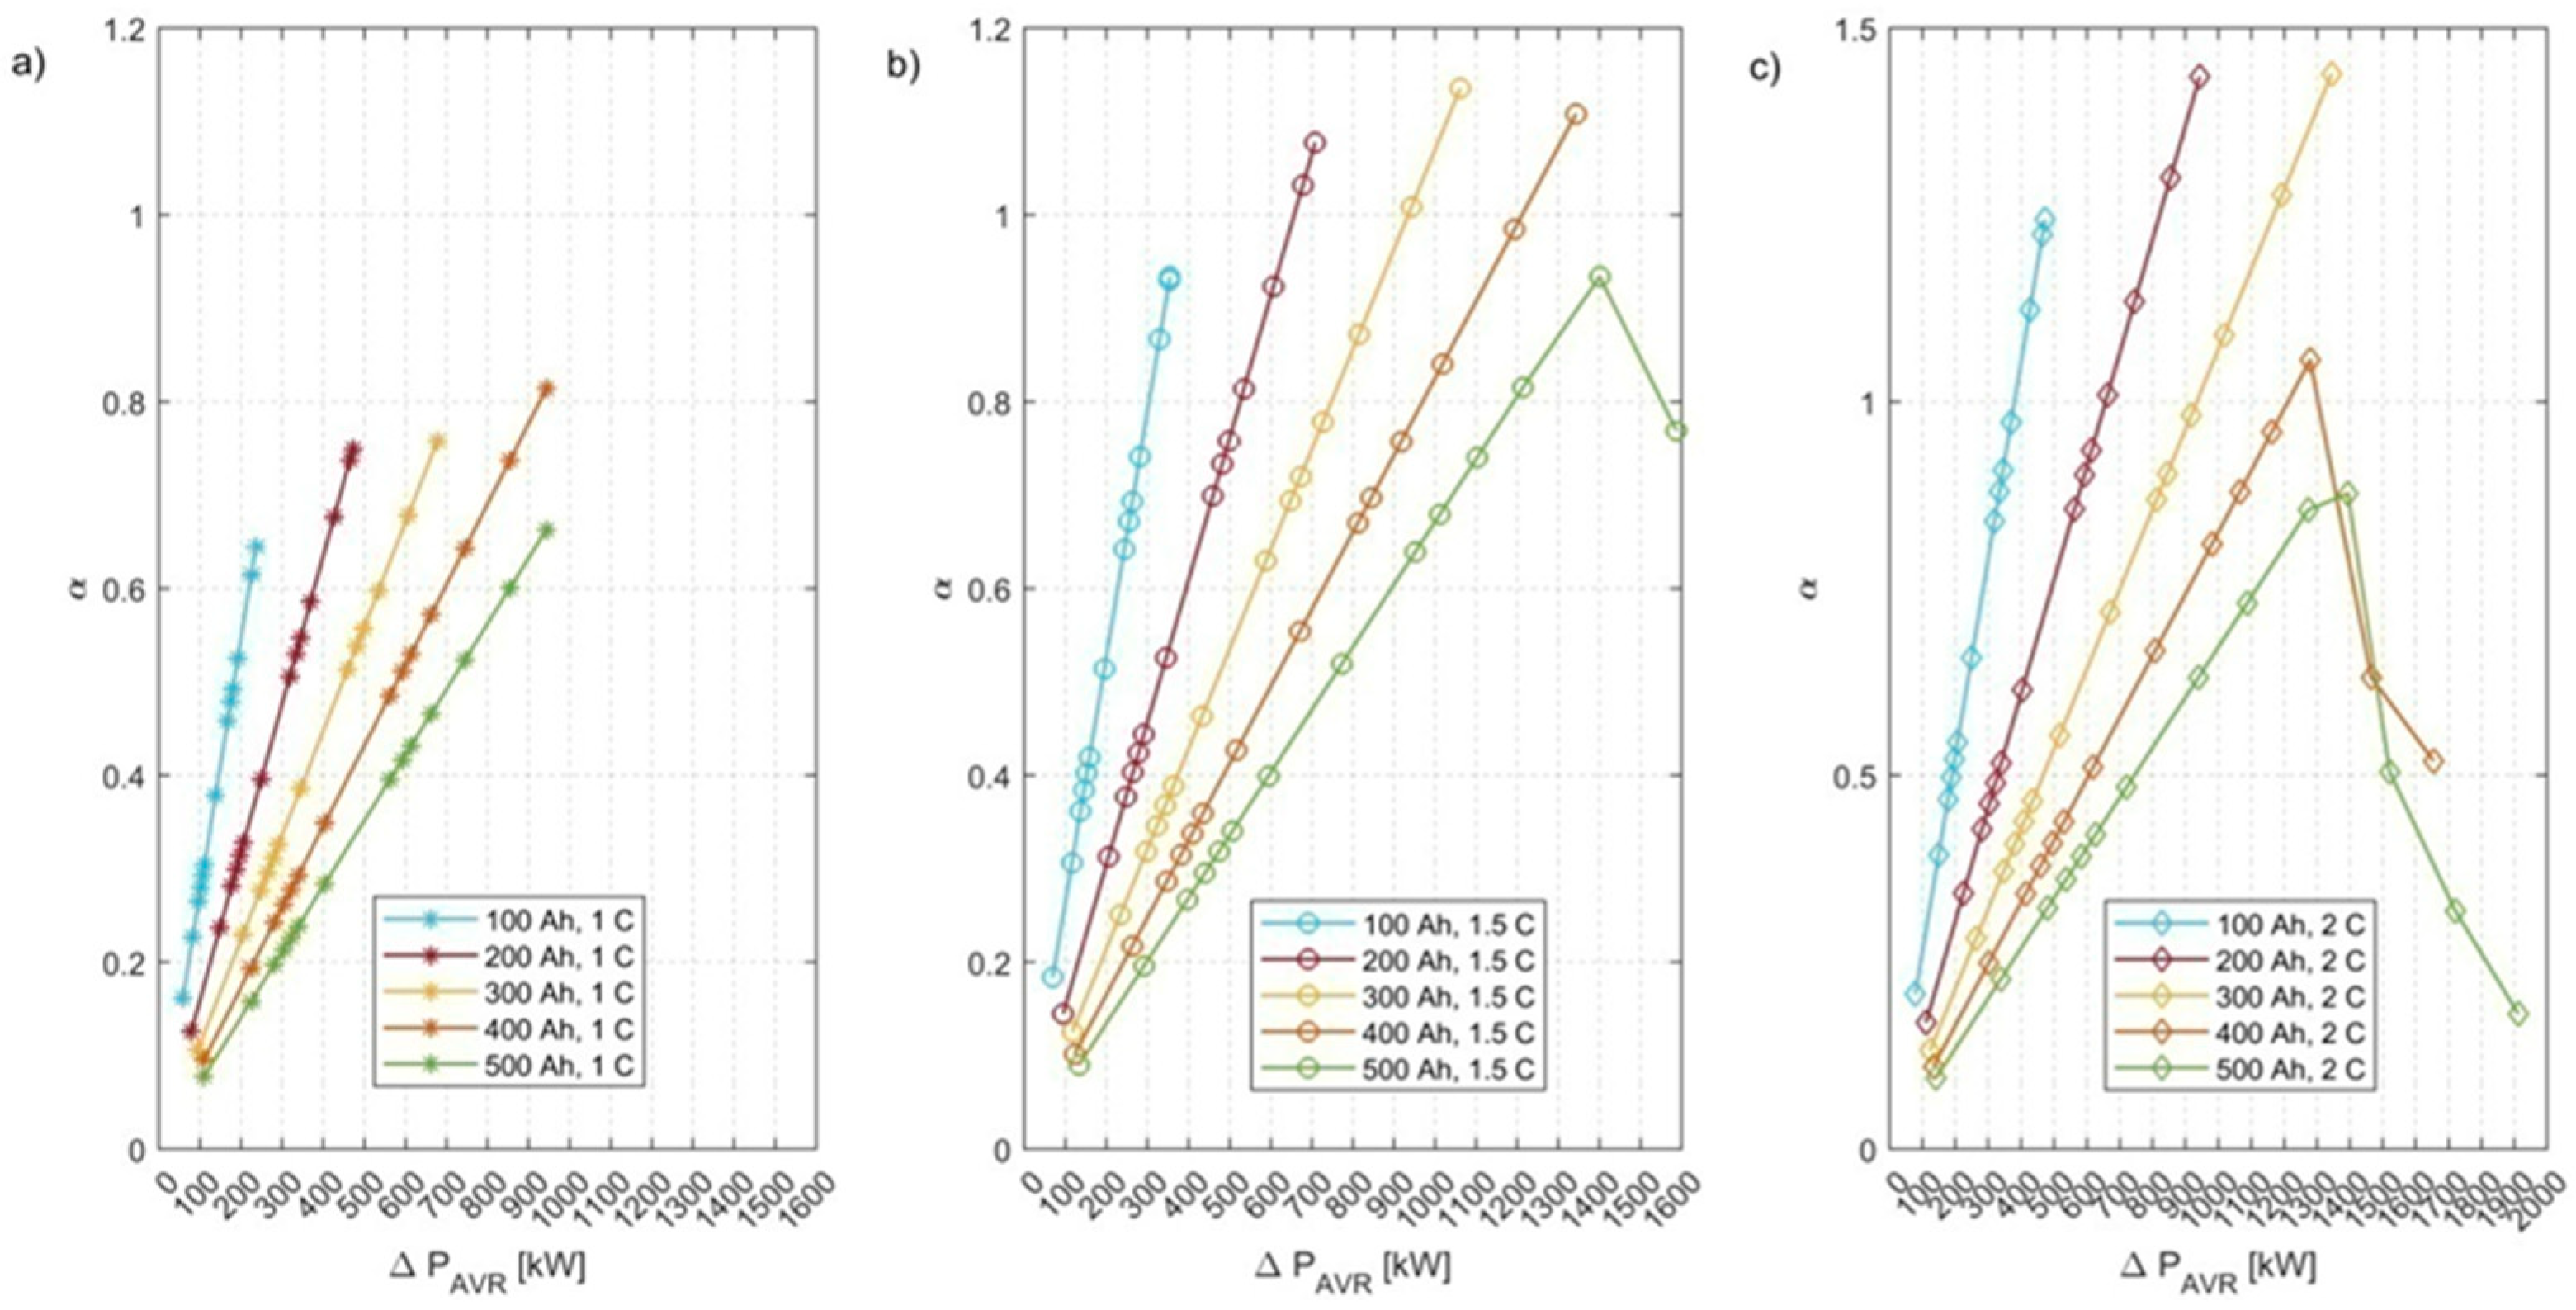
Table 1.
Rolling stock parameters used in the case study.
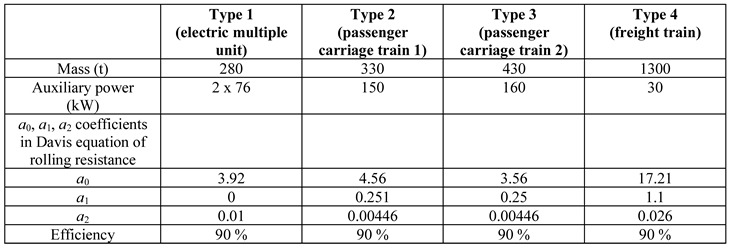
Table 2.
The price parameters used in supercapacitor module sizing optimization procedure.
| Parameter | Value |
|---|---|
| CDC/DC | 102000 ($) |
| cDC/DC | 102($/kW) |
| cSC | 55($) |
| Cel | 87.4 ($/MWh) |
Table 3.
The price parameters of LFP battery module used in optimization procedure.
| Parameter | Value |
|---|---|
| cpower | 38,273 ($/year) |
| cLFP | 110 ($) |
| Cel | 87.4 ($/MWh) |
Table 4.
Costs, savings and payback period values for each ESS module operating separately and together as hybrid ESS.
Table 4.
Costs, savings and payback period values for each ESS module operating separately and together as hybrid ESS.
| Cost of SC ($) | Cost of LFP ($) | Saving resulting from SC operation ($/year) | Saving resulting from LFP operation ($/year) |
|---|---|---|---|
| 425364 | 357818 | 59970 | 36124 |
| Payback period of SC (years) | Payback period of LFP (years) | ||
| 7,46 | 9,9 | ||
| Total payback period (years) | |||
| 8,41 | |||
Disclaimer/Publisher’s Note: The statements, opinions and data contained in all publications are solely those of the individual author(s) and contributor(s) and not of MDPI and/or the editor(s). MDPI and/or the editor(s) disclaim responsibility for any injury to people or property resulting from any ideas, methods, instructions or products referred to in the content. |
© 2025 by the authors. Licensee MDPI, Basel, Switzerland. This article is an open access article distributed under the terms and conditions of the Creative Commons Attribution (CC BY) license (http://creativecommons.org/licenses/by/4.0/).
Copyright: This open access article is published under a Creative Commons CC BY 4.0 license, which permit the free download, distribution, and reuse, provided that the author and preprint are cited in any reuse.


