1. Introduction
Changes in cell morphology are important indicators of various diseases and serve as an important diagnostic and prognostic tool [
1]. Morphological analysis provides crucial insights into the functional state of cells, enables predictions of disease progression, and provides information on underlying genetic, environmental, or pathological conditions [
2,
3,
4,
5]. Advanced techniques for analyzing morphological changes provide invaluable diagnostic and prognostic information for various diseases, including malignancies, metabolic disorders (e.g., diabetes), and inflammation [
6,
7,
8,
9].
The COVID-19 pandemic has increased the focus on understanding the long-term impact of the virus on various organ systems and highlighted the urgent need for innovative morphological analysis techniques to assess cell damage and recovery [
10,
11,
12]. Research has demonstrated significant numerical and morphological changes in white blood cells (WBC) in individuals with COVID-19, varying between mild and severe cases [
13,
14,
15]. Therefore, a daily complete blood count (CBC) with manual differentiation of leukocytes is recommended in hospitalized COVID-19 patients to monitor changes that may predict adverse outcomes and disease progression [
16,
17]. Recent studies emphasize the potential of leukocyte morphology and related parameters as indicators of disease severity and progression [
18,
19].
In clinical practice, leukocyte morphology is primarily assessed by a CBC with differential, which allows microscopic examination to identify the different cell types and their characteristics [
20]. This method provides important information about the patient's overall health and helps detect abnormalities that may indicate underlying infections or other hematologic disorders. Therefore, monitoring leukocyte morphology based on the blood count is crucial for making treatment decisions and optimizing patient management. Understanding leukocyte morphology is crucial for diagnosing leukocyte disorders, as abnormal leukocyte morphology may indicate underlying infections.
However, conventional methods for assessing leukocyte morphology may not capture subtle changes, highlighting the need for advanced imaging techniques and machine learning algorithms that provide more detailed insights into cellular alterations [
21,
22,
23]. Furthermore, conventional microscopy suffers from limitations in throughput, resolution, and field of view [
24,
25], hindering effective analysis of large cell populations. It is also labor-intensive, subjective, and requires highly skilled personnel, with inherent variability in manual assessments affecting accuracy. While manual microscopy remains a valuable tool, automated and digital systems are increasingly employed for their efficiency and accuracy, particularly in high-throughput settings, complementing manual methods by reducing labor and improving diagnostic turnaround times [
26,
27,
28].
Lens-free shadow imaging technology (LSIT) offers a cost-effective, portable, and efficient method for imaging and analyzing cells [
29,
30,
31,
32,
33]. This technique is particularly valuable for medical diagnostics [
34], cell monitoring [
35], and telemedicine applications [
36], as it does not require complex equipment or staining reagents [
37]. LSIT uses computer-assisted techniques to capture and analyze cell images without traditional lenses, reducing costs and simplifying the imaging process [
38,
39].
LSIT is a variant of digital inline holography (DIH), a lens-free imaging technique that records the interference pattern of light scattered from microscopic objects (shadow pattern) [
40,
41]. By eliminating lenses, DIH reduces the size and cost of the system and enables compact and portable devices. It captures phase and amplitude information, facilitating 3D imaging and quantitative analysis of biological samples, including cell size and shape [
42]. This lensless approach significantly reduces system costs and allows a larger FOV than conventional microscopes, enabling high-throughput analysis of numerous cells. LSIT extracts essential information about the size, shape, and other properties of cells from these shadow images, enabling innumerable applications in cell analysis [
43].
In previous studies, we have developed and successfully used Cellytics, an LSIT-based device, to identify NK cells, CD34+ cells, and continuous cell monitoring [
44,
45]. However, as a single-channel device with only one analytical pathway, its throughput and versatility in simultaneously processing multiple samples were limited. To address these limitations, we introduce a multichannel version of Cellytics that expands analytical capabilities and enables simultaneous analysis, increasing throughput and efficiency in research applications.
This study has two main objectives: First, to evaluate the performance of the multichannel Cellytics by examining parameters such as image sharpness and the ability to identify and analyze microspheres. Secondly, we will investigate the potential of this improved device for direct analysis of leukocyte morphology, particularly in the context of leukocyte activation, using our previously developed activation stimulator cocktail (ASC) for NK cells. We investigate shadow parameters derived from LSIT, such as peak-to-peak distance (PPD) and maximum-to-minimum distance standard deviation (MMD-SD), to distinguish between activated and non-activated leukocytes. We also introduce a new shadow parameter, the leukocyte activation parameter (LAP), to quantify the activation of leukocytes in response to ASCs. This work aims to improve LSIT-based blood cell analysis and provide a technical basis for rapid and cost-effective analysis of leukocytes. This will facilitate the development of more accessible and efficient diagnostic tools for laboratories and clinics, improve the understanding of immune responses, and enable timely interventions in various health conditions.
2. Materials and Methods
2.1. Cell Preparation and Activation
2.1.1. Blood Sample Preparation
Whole blood samples were obtained from healthy donors with approval from Korea University Anam Hospital (approval number: 2021AN0040). WBCs were isolated by removing red blood cells (RBCs) with RBC lysis buffer (BioLegend, San Diego, CA, USA). Whole blood was diluted 1:20 with RBC lysis buffer, mixed gently, and incubated for 12 min at room temperature. The samples were centrifuged at 300 × g for 5 minutes at 4 °C to separate the erythrocytes and platelets. The resulting pellet was washed twice with phosphate-buffered saline (PBS) to remove any remaining erythrocytes and platelets, resulting in a purified leukocyte sample.
2.1.2. Activation Stimulator Cocktail (ASC)
ASC (Metaimmunetech, Sejong, Republic of Korea) was based on compositions used in previous NK cell studies and consisted of recombinant human IL-2 (Peprotech, Inc., Cranbury, NJ, USA), recombinant human IL-12 (R&D Systems, Inc., Minneapolis, MN, USA), PMA (Sigma-Aldrich, St. Louis, MO, USA) and ionomycin (Sigma-Aldrich). ASC was used in four concentrations: 100%, 75%, 50% and 25%. For example, for the 100 concentration, 10 μL of ASC was mixed with 1 mL of the WBC sample; for the 50% concentration, 5 μL of ASC and 5 μL of medium were mixed with 1 mL of the sample.
2.1.3. WBC Activation
Isolated WBCs were activated with ASC. Since neutrophils comprise approximately 50–70% of the WBC population, the ASC composition (IL-2, IL-12, PMA, and ionomycin) was chosen to stimulate multiple cell types within the WBC population, including neutrophils (directly through PMA and ionomycin and indirectly through IL-2 and IL-12 via T cells, Th1 cells, and NK cells). This approach allowed the assessment of overall leukocyte activation and provided insight into the effects of ASC on neutrophil activation within the mixed population.
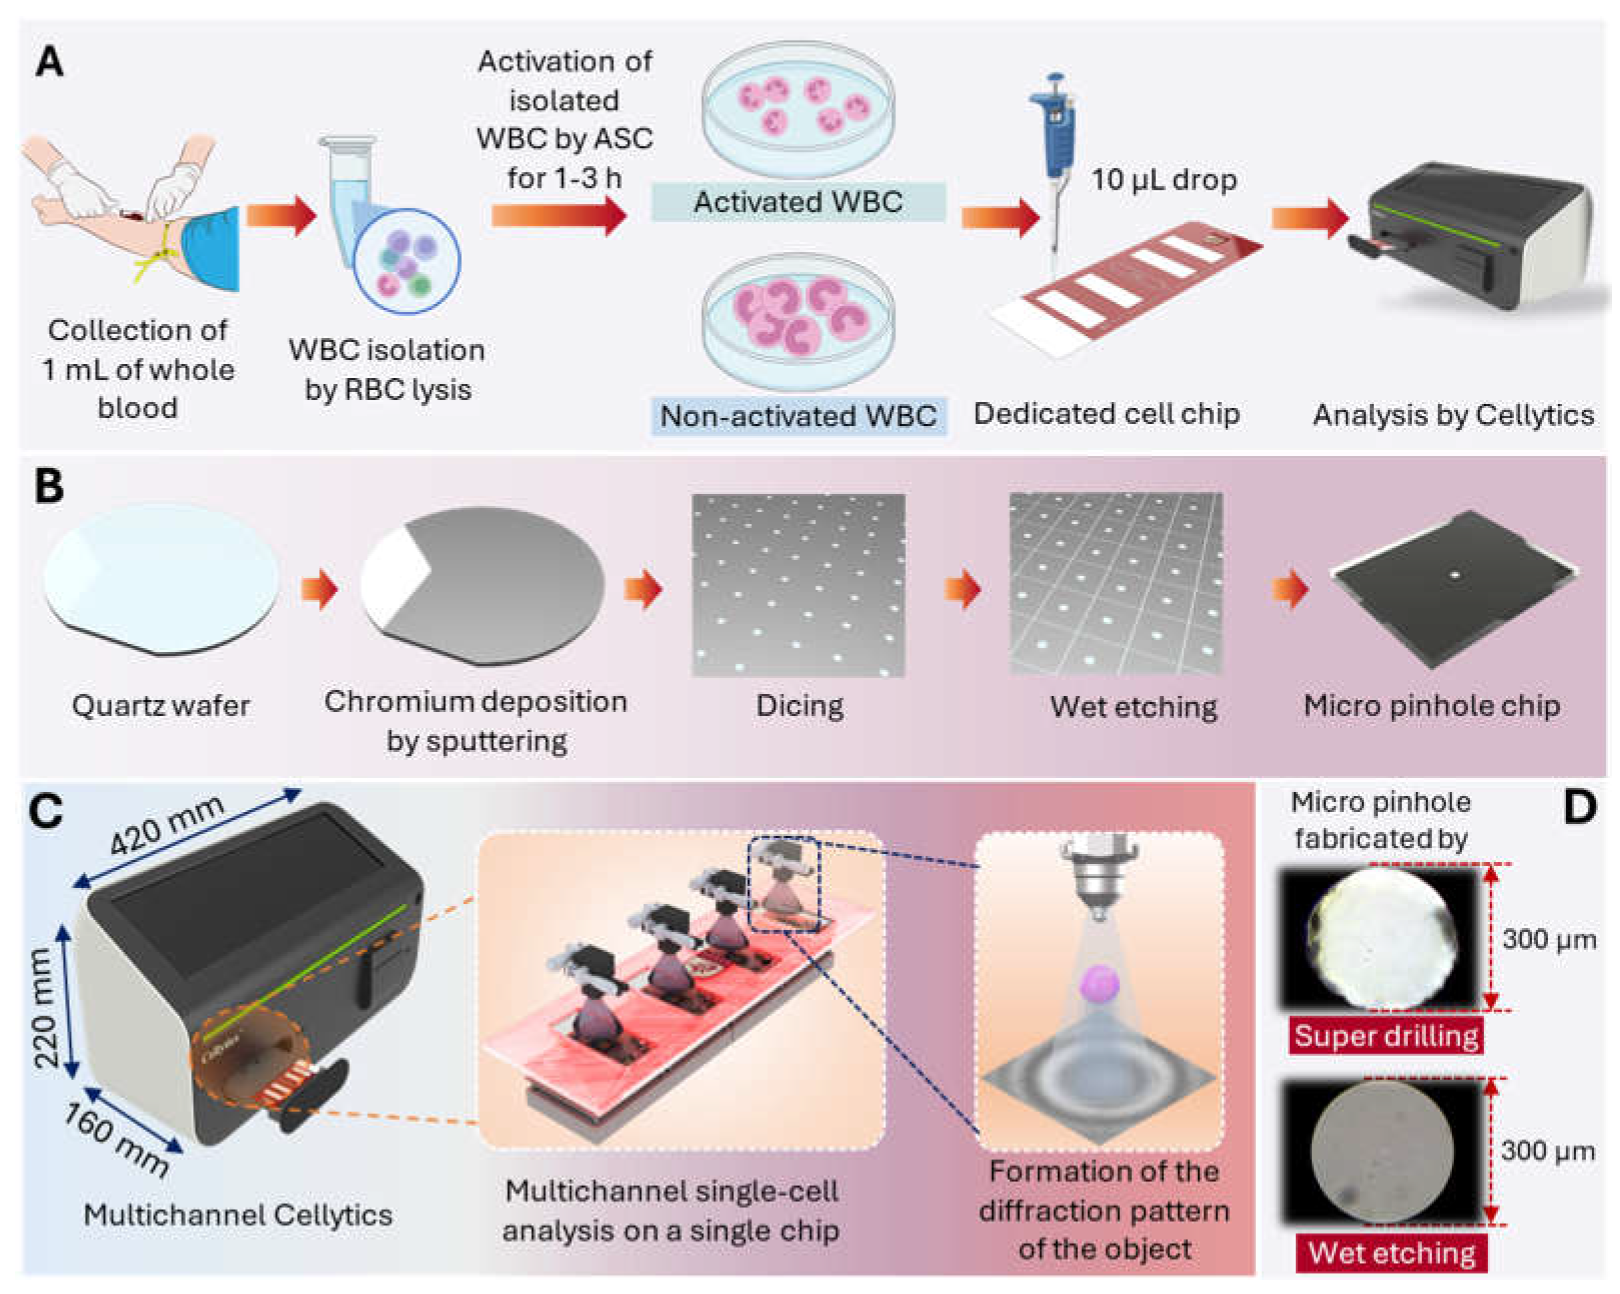
Figure 1A outlines the experimental workflow for the Cellytics analysis of WBCs. This includes the isolation of the leukocytes, activation by ASC, the loading onto the special cell chip, and the subsequent Cellytics analysis.
2.1.4. Selection and Comparison of Shadow Parameter Combination
Activated neutrophils undergo characteristic morphological changes upon activation, including increased cell size (due to cytoplasmic enlargement and cytoskeletal reorganization) and decreased internal complexity (due to granule degranulation). These changes are reflected in flow cytometry as increased forward scatter (FSC) and decreased side scatter (SSC), respectively. Similarly, Cellytics was used in this study to analyze the corresponding shadow parameters: PPD and MMD. PPD, which is linearly related to cell or particle size, is determined by analyzing the difference in pixel values between the central maximum and minimum of the diffraction pattern. MMD, defined as the maximum-to-minimum distance, allows the evaluation of internal complexity by measuring the difference between the diffraction pattern's first-order minimum and maximum values. The MMD standard deviation (MMD-SD) was also used to assess cellular complexity; smaller MMD-SD values indicate a more circular shape, while larger values indicate a more oval shape.
2.2. Enhancement of the Multi-channel Cellytics
2.2.1. Micro-Pinhole Chip Fabrication
The micro pinhole chips for the 4-channel optical system were produced on 0.5 mm thick quartz disks using a wet etching process.
Figure 1B shows the fabrication process of a micro-pinhole chip using wet etching. A 100 nm thick chromium layer was sputtered onto the quartz wafer, followed by photoresist coating, UV exposure through a photomask, and development to define the hole pattern. Quartz was chosen as the substrate material due to its optical transparency and chemical inertness. Chromium was selected as the mask material because of its high etch resistance and ease of deposition [
46]. Wet etching was used to selectively remove the chromium, resulting in uniform pinholes with a diameter of 300 μm. The remaining photoresist was then removed, and the wafer was cleaned. The patterned and etched wafer was cut into 5.8 mm × 6.8 mm. As shown in
Figure 1B, the final pinhole chip was designed for optical compatibility with the LED and CMOS image sensor to ensure accurate shadow diffraction patterns and high-throughput cell analysis in the Cellytics system. This fabrication process provides a reliable and reproducible method for manufacturing micro pinhole chips.
2.2.2. Optimization of Pinhole Diameter
A comparative test was conducted to optimize the pinhole diameter with diameters from 100 μm to 400 μm in 50 μm increments. A specially designed circuit board with integrated LED was used for the test setup. The micro pinhole chips were imaged using an optical microscope with 400x magnification (CKX31SF, Olympus).
2.2.3. Comparison with Conventional Pinhole Design
Conventional pinholes, fabricated from plastic by injection molding, are designed to fit onto LED-equipped PCBs, resulting in a bulky design. The post-molding drilling process creates uneven cut surfaces. Microscopic examination (200× magnification) revealed that these conventional pinholes have irregular holes caused by debris or defects (
Figure 1D). Visual inspection confirms differences in aperture quality and shape. Wet etching produces pinholes with smoother edges, a more circular shape, and less debris than super drilling. These differences in pinhole morphology can significantly impact optical performance, with the more circular aperture of the wet-etched pinhole expected to produce a sharper and predictable diffraction pattern.
2.2.4. Multi-channel Cellytics
Figure 1C shows the schematic of the multi-channel Cellytics device, showing overall dimensions and components. The multi-channel Cellytics system comprises four identical optical channels, each consisting of a 470 nm LED (LB W5SM-FZHX-35, Osram, Munich, Germany), a 300 μm diameter pinhole aperture, and a 5-megapixel monochrome CMOS image sensor (MT9P031I12STM−DP, ONSEMI, Phoenix, AZ, USA). The LED mounted on a specially developed circuit board is precisely aligned with the pinhole and converts the emitted incoherent light into semi-coherent light. This semi-coherent light illuminates the samples (10 μL volume per chamber) in a special four-chamber chip. The chip is on a custom-designed PCB for close contact with the CMOS image sensor. The light passes through the pinhole, and the sample projects shadow diffraction patterns on the sensor. Proprietary software analyzes these shadow images, enabling precise measurements of the size and morphology of individual cells and facilitating high-throughput cell analysis and quantification.
3. Results and Discussion
3.1. Optimization of pinhole diameter
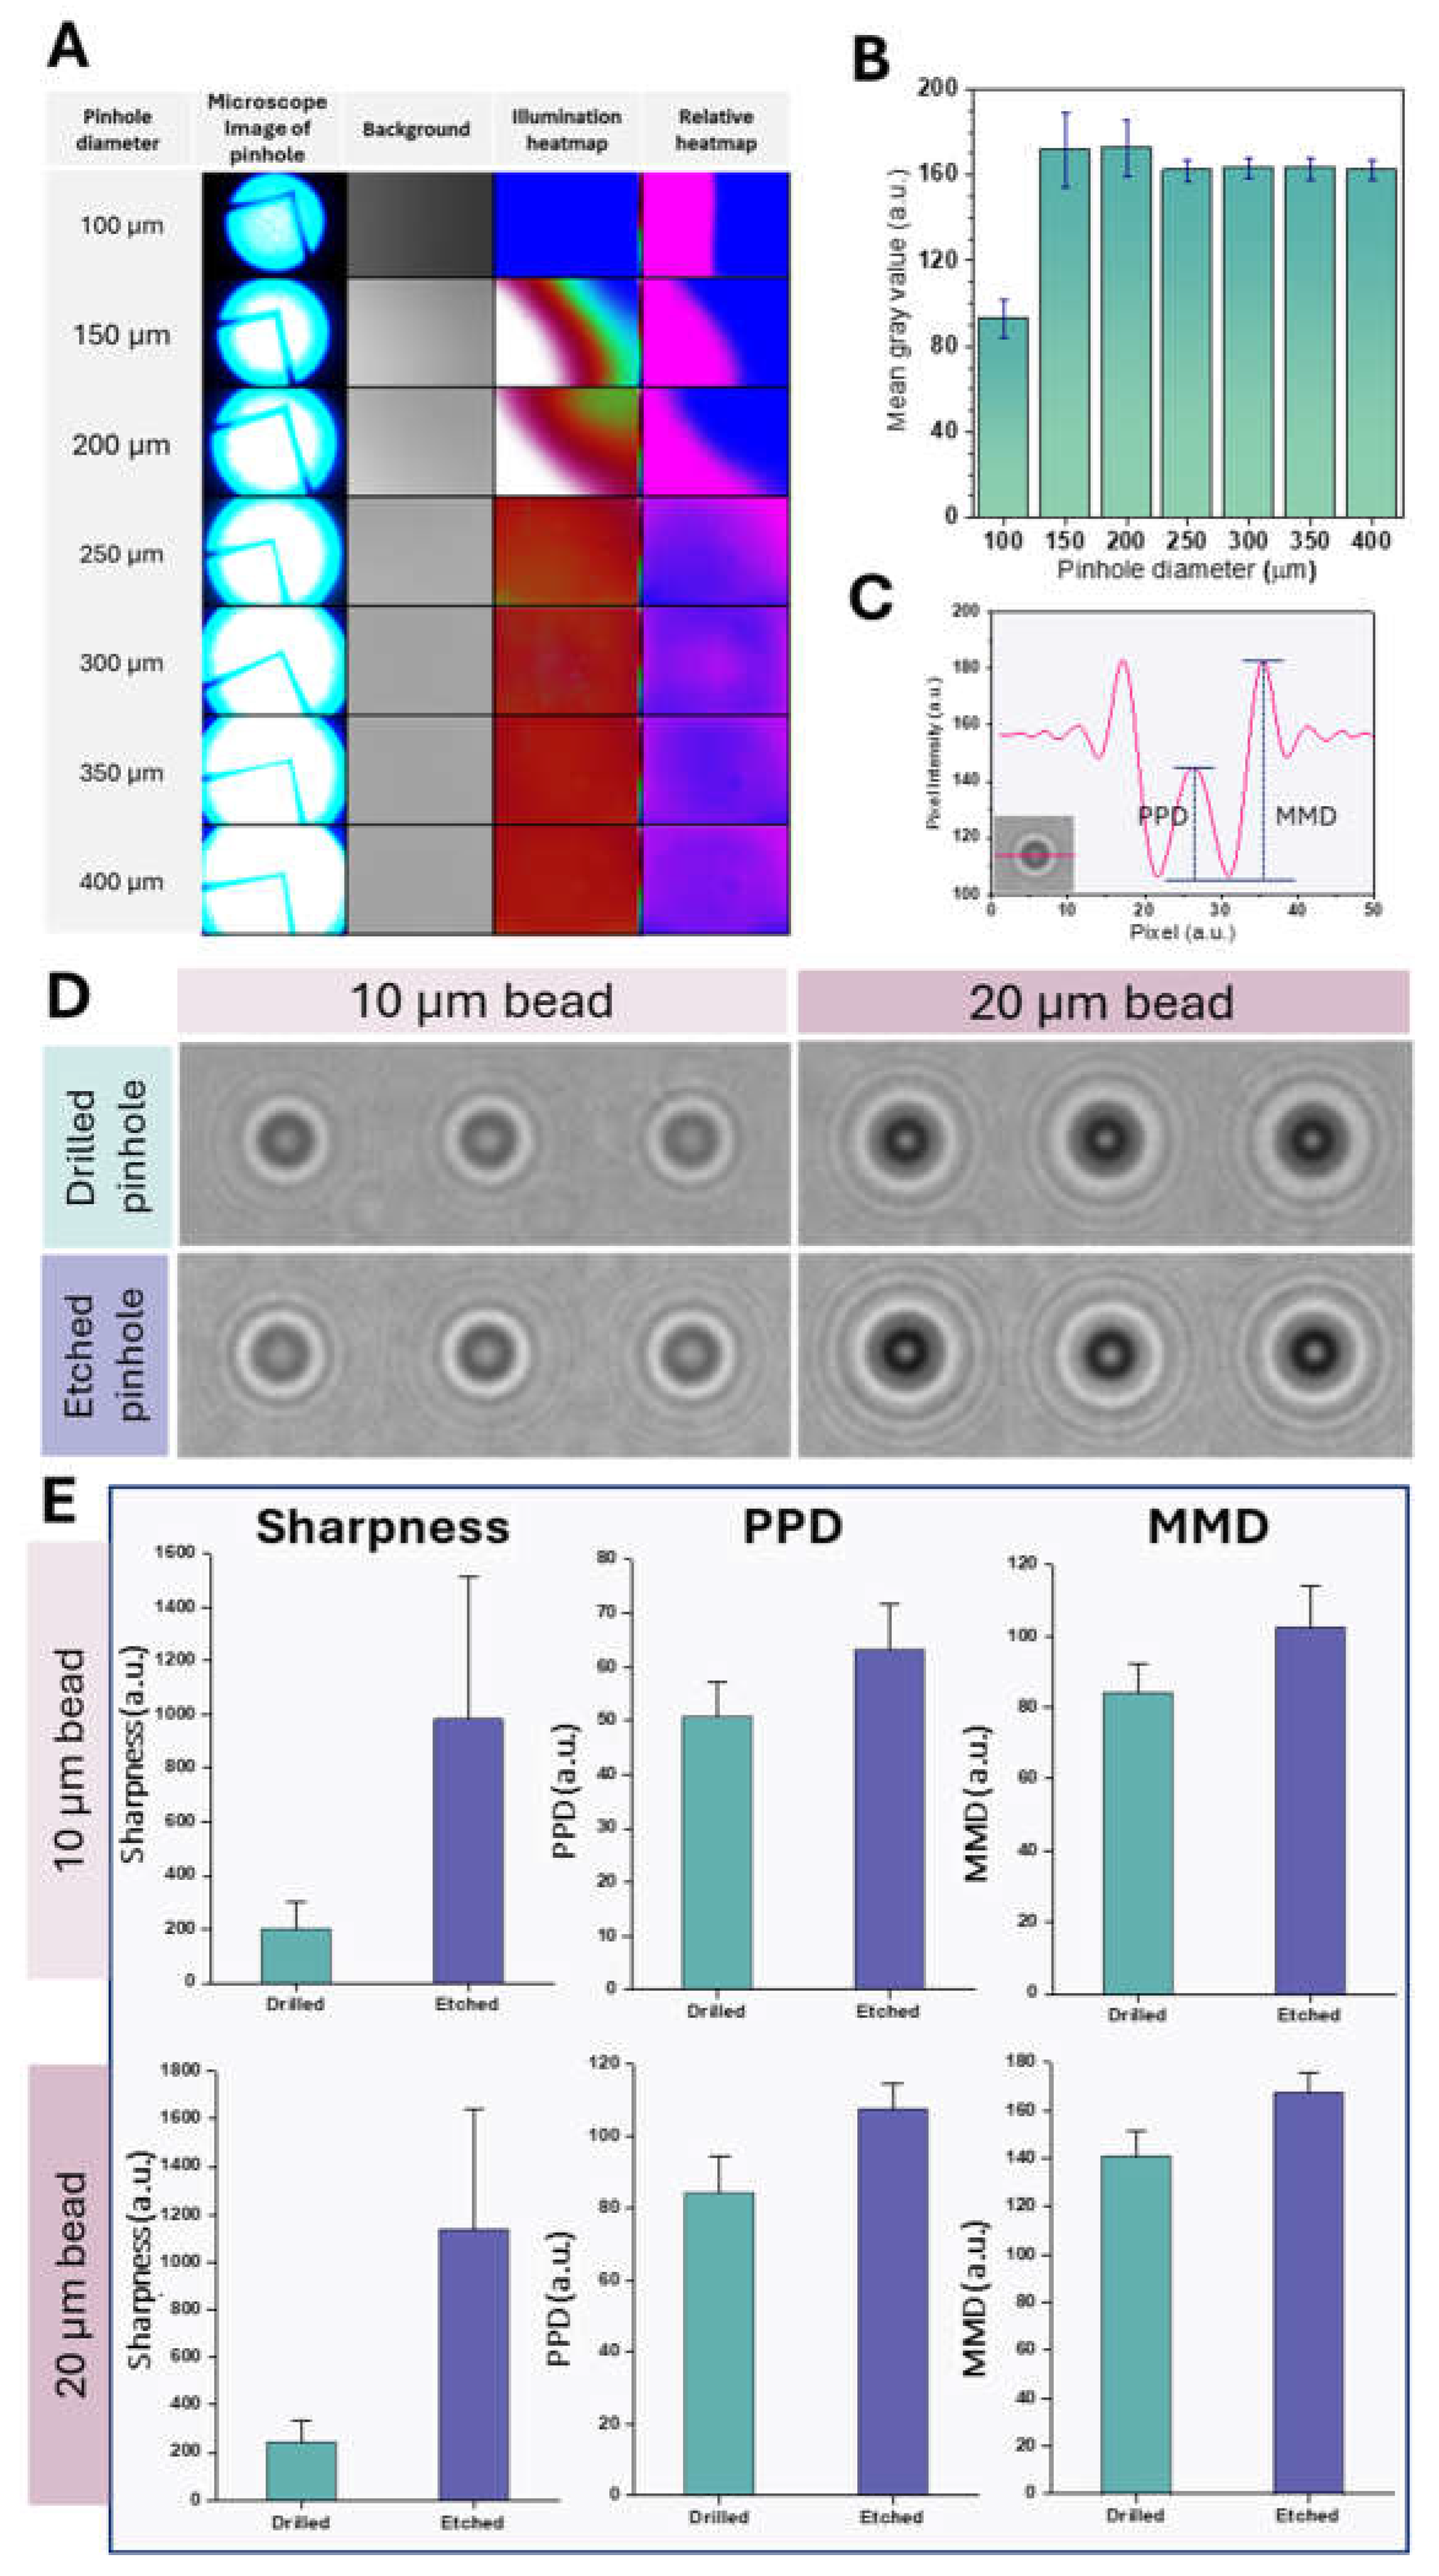
Figure 2A shows microscope images of the pinholes, background illumination patterns, and corresponding absolute and relative heat maps. As the pinhole diameter increased, the light transmittance increased, reflected in brighter illumination heatmaps. This is to be expected as a larger aperture transmits more light. The relative heat maps showed a more uniform light distribution for pinhole diameters of 300 µm and larger. These differences in light transmission and distribution have implications for lens-free imaging applications; for example, uniform illumination is critical for accurate particle sizing [
47].
The relationship between the hole diameter and the mean gray value was investigated (
Figure 2B). The mean gray value increased significantly between 100 µm and 150 µm pinhole diameter. This increase is likely due to stronger diffraction effects at smaller pinhole diameters, resulting in a lower gray value. While smaller pinhole diameters generally provide higher resolution by reducing blur, they also reduce the signal-to-noise ratio (SNR) due to less photon collection, which can lower the mean gray value by increasing image noise [
48]. Conversely, larger pinhole diameters increase light and photon capture, which improves SNR but may reduce resolution due to more blur. This can result in a more uniform mean gray value as the noise is averaged over a larger area [
49]. A further increase in the hole diameter from 150 µm to 400 µm did not significantly change the mean gray value. This plateau above 150 µm indicates that increasing the pitch circle diameter beyond this point does not significantly improve the intensity. Within the 150 µm to 400 µm range, the relatively stable mean gray value likely reflects a balance where the resolution is sufficient to maintain image quality without excessive noise. Based on these observations, a pinhole diameter of 300 µm was selected as optimal for balancing signal intensity and uniformity.
Figure 2D shows the diffraction patterns for 10 µm and 20 µm beads made with drilled and etched pinholes. The images obtained with etched pinholes were sharper and more pronounced diffraction ring patterns than those obtained with drilled pinholes for both bead sizes, indicating better optical performance. This improved performance is likely due to the excellent uniformity and smoothness of the etched pinholes compared to the drilled pinholes. This uniformity minimizes edge roughness, an important factor in reducing wavefront errors and improving the quality of diffracted light. Edge roughness in pinholes can lead to aberrations such as trefoil and coma, which affect image quality [
48]. The smoother edges of etched pinholes also reduce scattering, which is crucial for a sharper image with a smaller central spot size. The scattering from irregular edges of drilled pinholes can lead to a wider and less defined point spread function, which has a negative impact on spatial resolution [
49]. This improved image quality with etched pinholes is essential for clearly defining shadow parameter boundaries.
Figure 2E shows the sharpness, PPD, and MMD values for drilled and etched pinholes with 10 µm and 20 µm beads. Etched pinholes consistently exhibited higher sharpness, PPD, and MMD values than drilled pinholes for both bead sizes. These results show that etched pinholes consistently performed better for sharpness, PPD, and MMD-SD regardless of bead size. As previously mentioned, the higher values for sharpness, PPD, and MMD-SD for etched pinholes indicate better image resolution and contrast, likely due to the smoother and more uniform apertures. These results confirm the findings from
Figure 2D, which shows sharper diffraction images for etched pinholes.
3.2. Assessment of Leukocyte Activation Using LSIT-Derived Shadow Parameters
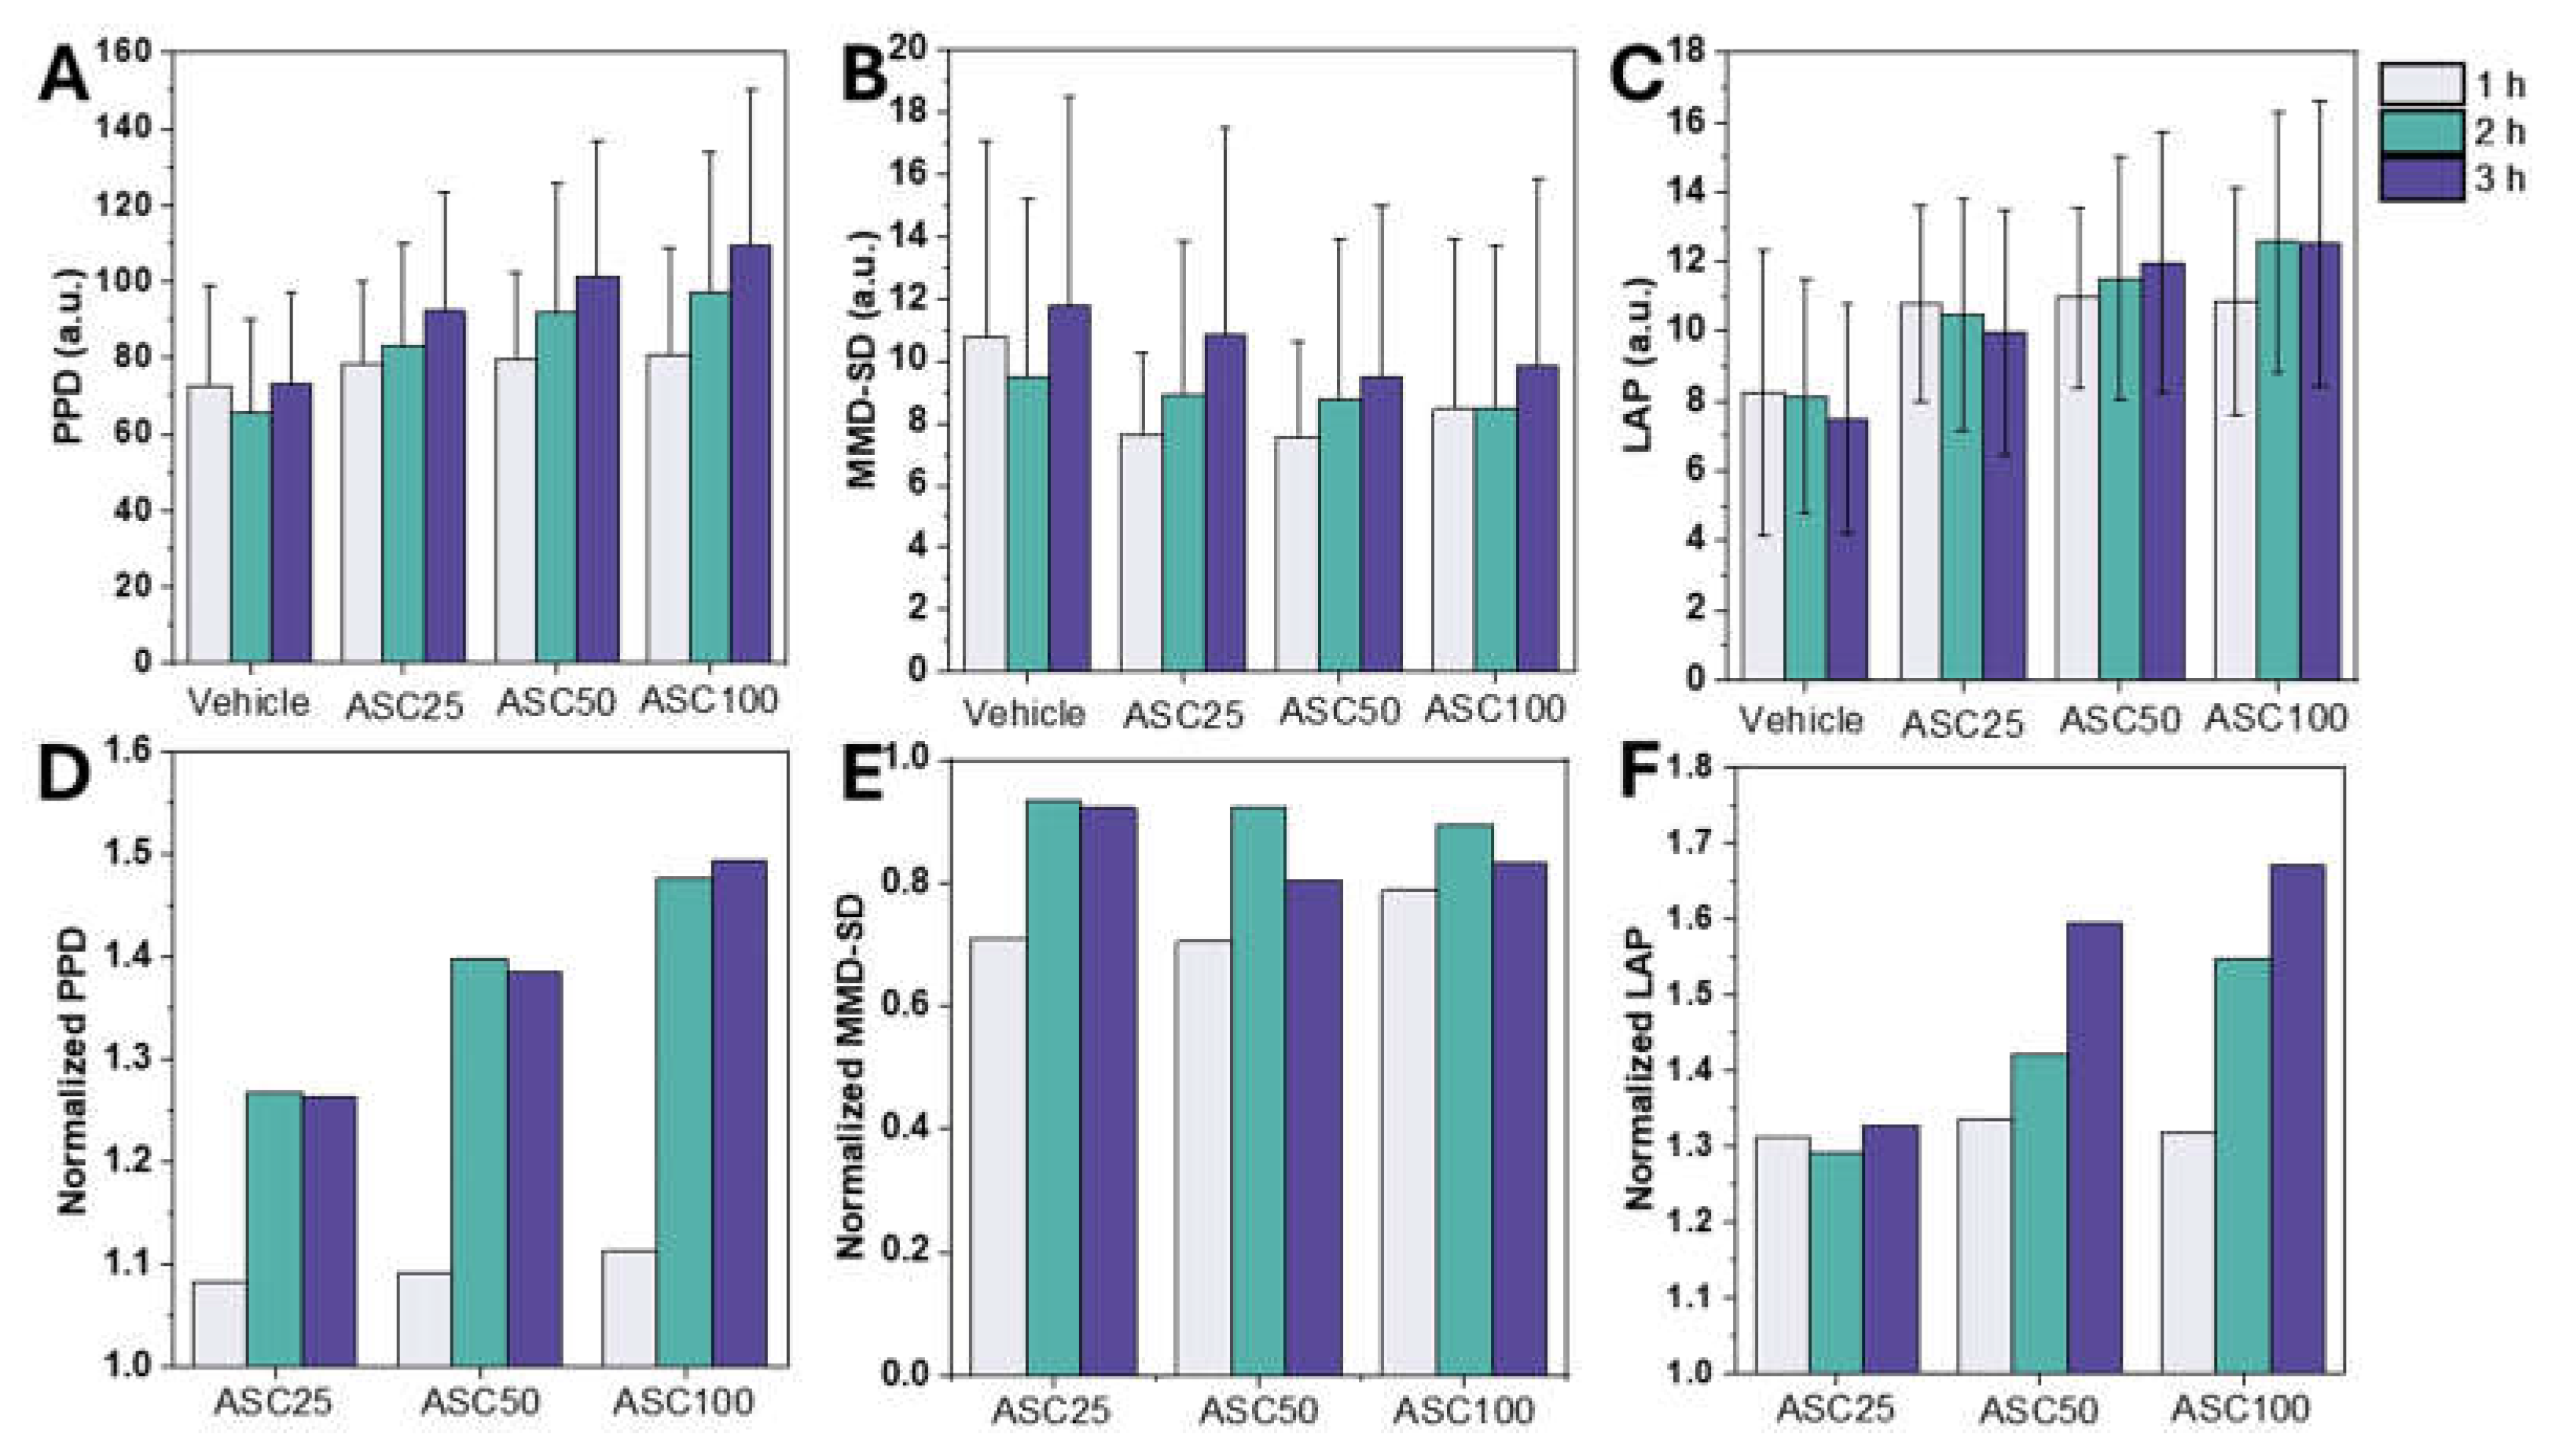
Figure 3 illustrates the comparative analysis of leukocyte activation measured by the LSIT-derived shadow parameters. The two key parameters examined were PPD and MMD-SD, which provide quantifiable distinctions between activated and non-activated WBCs. Leukocytes isolated from whole blood were exposed to an ASC for 1–3 h.
Figure 3A shows the PPD values over different ASC stimulation periods. A statistically significant increase in PPD was observed after one hour of ASC treatment. This trend suggests that PPD is a sensitive indicator of leukocyte activation that likely correlates with ASC-induced cellular morphologic changes. PPD, a shadow parameter extracted from the diffraction patterns of micro-objects, is linearly related to their actual size, making it a reliable measure for size measurement [
36]. PPD values increased with increasing ASC concentration, with the highest values observed at ASC100 (
Figure 3A), indicating a time-dependent effect of ASC on WBC morphology.
Figure 3B shows MMD-SD measurements under similar conditions. Conversely, to PPD trends, MMD-SD showed an initial decrease within an hour of stimulation and then stabilized, highlighting its utility in showing structural dynamics during activation. In contrast to PPD, MMD-SD, a parameter related to internal complexity, showed a less clear trend and decreased slightly with increasing ASC concentration. This decrease may be due to the larger cell size observed in ASC-stimulated samples, which in turn may reduce internal complexity compared to the vehicle control. The relatively stable or decreasing trend in MMD-SD suggests that ASC stimulation does not significantly affect the variability of maxima-to-minima distances in the light scattering patterns, indicating that ASC primarily affects other aspects of leukocyte morphology or internal structure.
Conventional shadow parameters such as PPD and MMD-SD describe specific aspects of leukocyte activation but may not comprehensively capture the overall morphological changes. LAP was developed as a composite metric that integrates these shadow parameters to measure both cell size and internal complexity after leukocyte activation. LAP values generally increased with increasing ASC concentration, similar to the trend observed for PPD. The effect of incubation time was also more pronounced for LAP, with a general increase of one to two hours observed at higher ASC concentrations (
Figure 3C). This more significant effect of incubation time on LAP compared to PPD and MMD-SD suggests that LAP may be more sensitive to time-dependent changes in leukocyte activation.
Normalization of the data allowed a more explicit comparison of the relative changes induced by ASC and showed an equal increase in PPD and LAP. Normalized PPD and LAP showed an apparent rise with ASC concentration, while normalized MMD-SD decreased slightly or remained relatively stable (
Figure 3D–F). These changes in shadow parameters (PPD, MMD-SD, and LAP) can be interpreted as indicators of leukocyte activation. The observed increases in PPD and LAP likely reflect changes in cell size and internal complexity, consistent with previous studies showing that leukocyte activation is associated with changes in cell morphology [
44,
48].
The results show that leukocyte activation with ASC significantly affects LSIT-derived shadow parameters. PPD and MMD-SD serve as reliable indicators of activation status and show both time- and dose-dependent variations. These results emphasize the potential utility of LSIT shadow parameters in clinical diagnostics to differentiate between activated and non-activated leukocytes. While PPD and MMD-SD each reflect different morphological changes, LAP provides a consistent measure of leukocyte activation. This comprehensive parameter minimizes the variability observed in the individual measures. Given its strong correlation with activation status, LAP could serve as a valuable diagnostic biomarker for immune responses and enable more accurate monitoring of leukocyte activation in clinical and research settings. While these results provide useful insights into the effects of ASC on leukocyte shadow parameters, further studies are needed to investigate the specific cellular mechanisms underlying the observed changes and to explore the impact of other stimuli.
3.3. Comparison between FACS and PPD vs. MMD-SD Density Plots
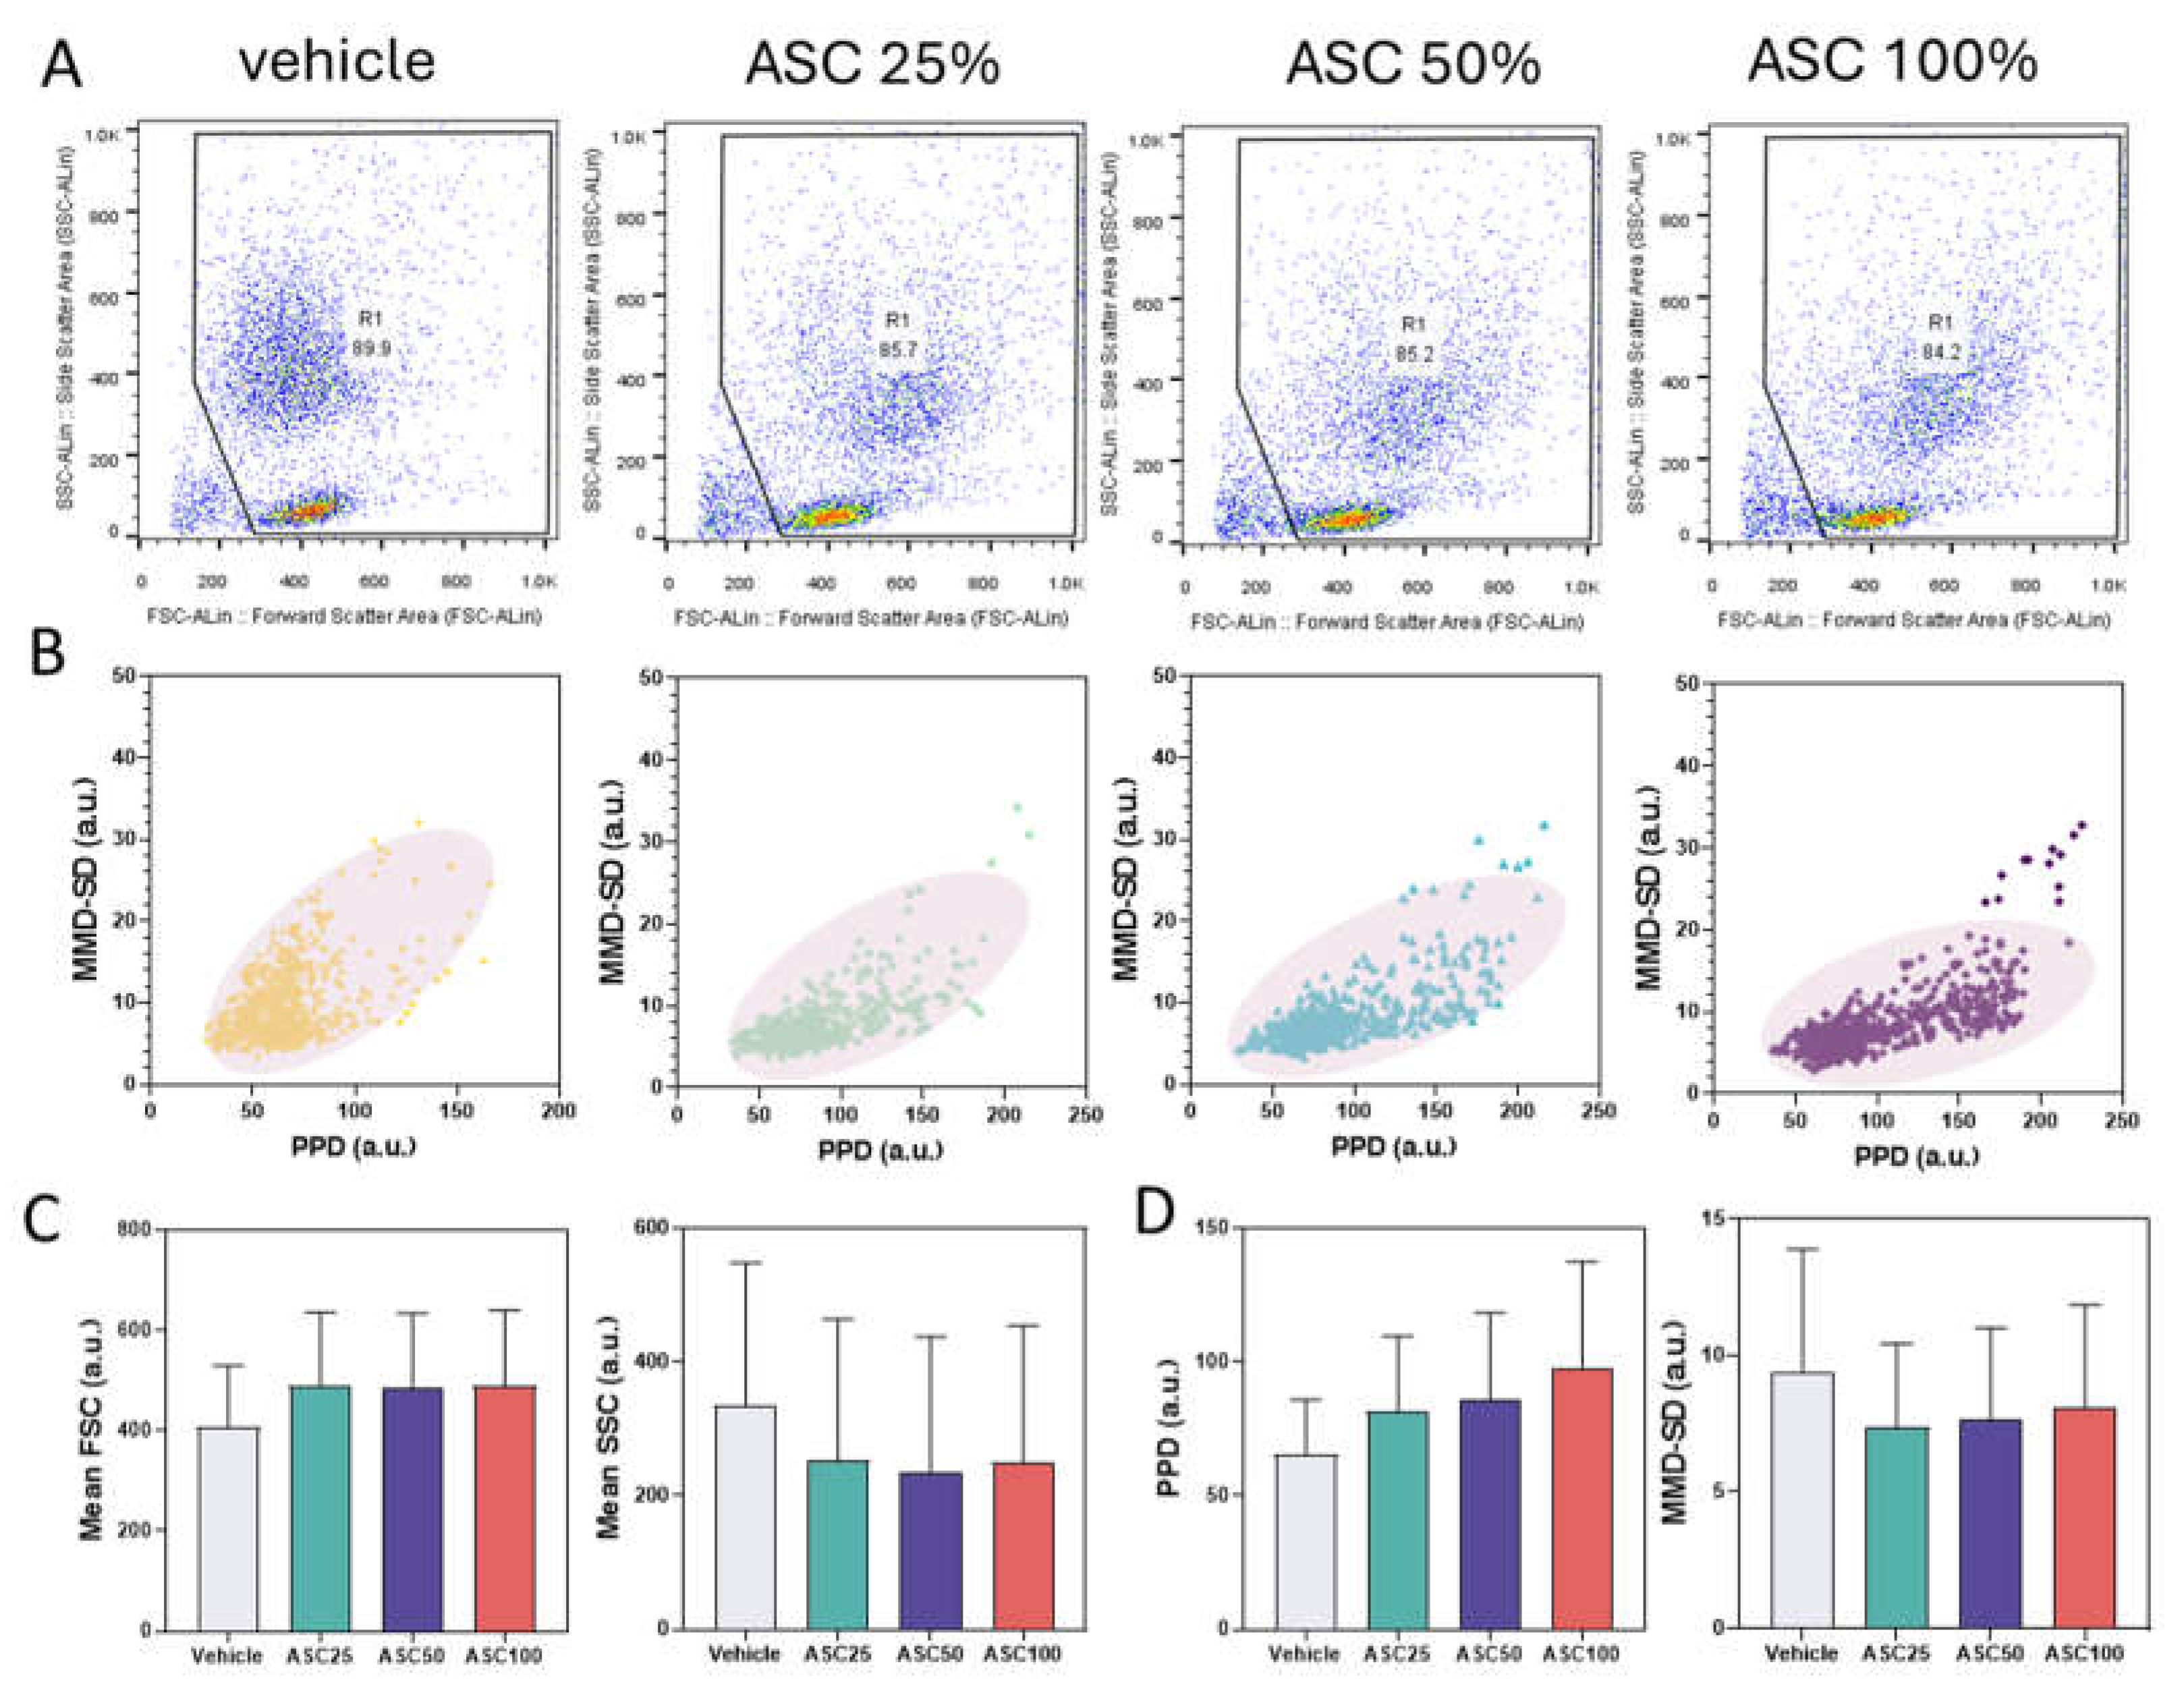
Figure 4 shows data from leukocyte activation experiments and compares FACS analyses (
Figure 4A), PPD vs. MMD-SD density plots (
Figure 4B), and correlations between forward/side scatter and PPD/MMD-SD (
Figure 4C and 4D). These analyses compare the leukocyte populations before and after activation with ASC. The R1 gate in the FACS plots isolates the analyzed leukocyte population based on the forward and side scatter signals.
The FACS dot plots show the cell distribution based on forward scatter (FSC) and side scatter (SSC) (
Figure 4A). FSC is generally associated with cell size, while SSC is linked to the internal complexity or granularity of the cell [
49,
50]. Increasing ASC concentration resulted in higher FSC values, indicating larger cell size, and a slight decrease in SSC, indicating lower cellular complexity. The percentage of cells within the R1 gate decreased slightly with activation (e.g., from 89.9% to 84.2%), suggesting increasing heterogeneity or the emergence of subpopulations. This downward shift in scattering intensity is likely due to cell deformation, changes in granularity, or altered refractive properties due to activation, possibly associated with changes in cell size, or granularity. These changes are consistent with WBC activation, leading to altered physical properties that can be detected by flow cytometry.
With increasing ASC concentration, the data point cluster in the PPD vs. MMD-SD density plots shifted to higher PPD and lower MMD-SD values, which correlates with the FACS data (
Figure 4B). The increase in PPD corresponds to the increase in FSC (cell size), and the decrease in MMD-SD corresponds to the reduction of SSC (cellular complexity/granularity). The changing position and shape of the density ellipses, representing the highest data density areas, further illustrate these changes. Activated leukocytes show tighter or more displaced clusters than non-activated cells, indicating more uniform morphological changes upon activation. The tilt of the cluster toward the PPD axis signifies an increase in size (related to forward scatter). At the same time, the decrease in MMD values reflects decreased internal complexity (related to side scatter). This density shift supports the hypothesis that ASC-induced activation causes measurable morphological changes. The downward population shift in the PPD × MMD-SD scatter plots is consistent with the FACS observations.
Figure 4C,D show the mean FSC, SSC, PPD, and MMD-SD values for the vehicle control and three ASC concentrations (ASC25, ASC50, and ASC100). The trends in PPD and MMD-SD closely mirror the trends observed in mean FSC and mean SSC from the FACS analysis: a slight increase in mean FSC and PPD with increasing ASC concentration and a decrease in mean SSC and MMD-SD. This supports the hypothesis that ASC stimulation induces changes in cell morphology. The increase in FSC and PPD indicates an increase in cell size (possibly due to cell swelling and increased cytoplasmic volume). In contrast, the decrease in SSC and MMD-SD indicates decreased internal complexity (possibly due to decreased granularity). These results are consistent with the observations in
Figure 4A,B.
The observed correlation between FACS data and PPD/MMD-SD suggests that ASC may induce cell membrane changes that lead to cell size and complexity changes. Although the trends are similar, the magnitude of the changes in PPD and MMD-SD may not be directly proportional to the changes in FSC and SSC due to differences in measurement principles or sensitivity of the technique. It's essential to recognize that PPD and MMD-SD are indirect measures of cell size and complexity; although they correlate well with FSC and SSC, they may not capture all aspects of cell morphology.
3.4. Flow Cytometry Analysis of CD64 and CD66b Expression and Correlation with LAP
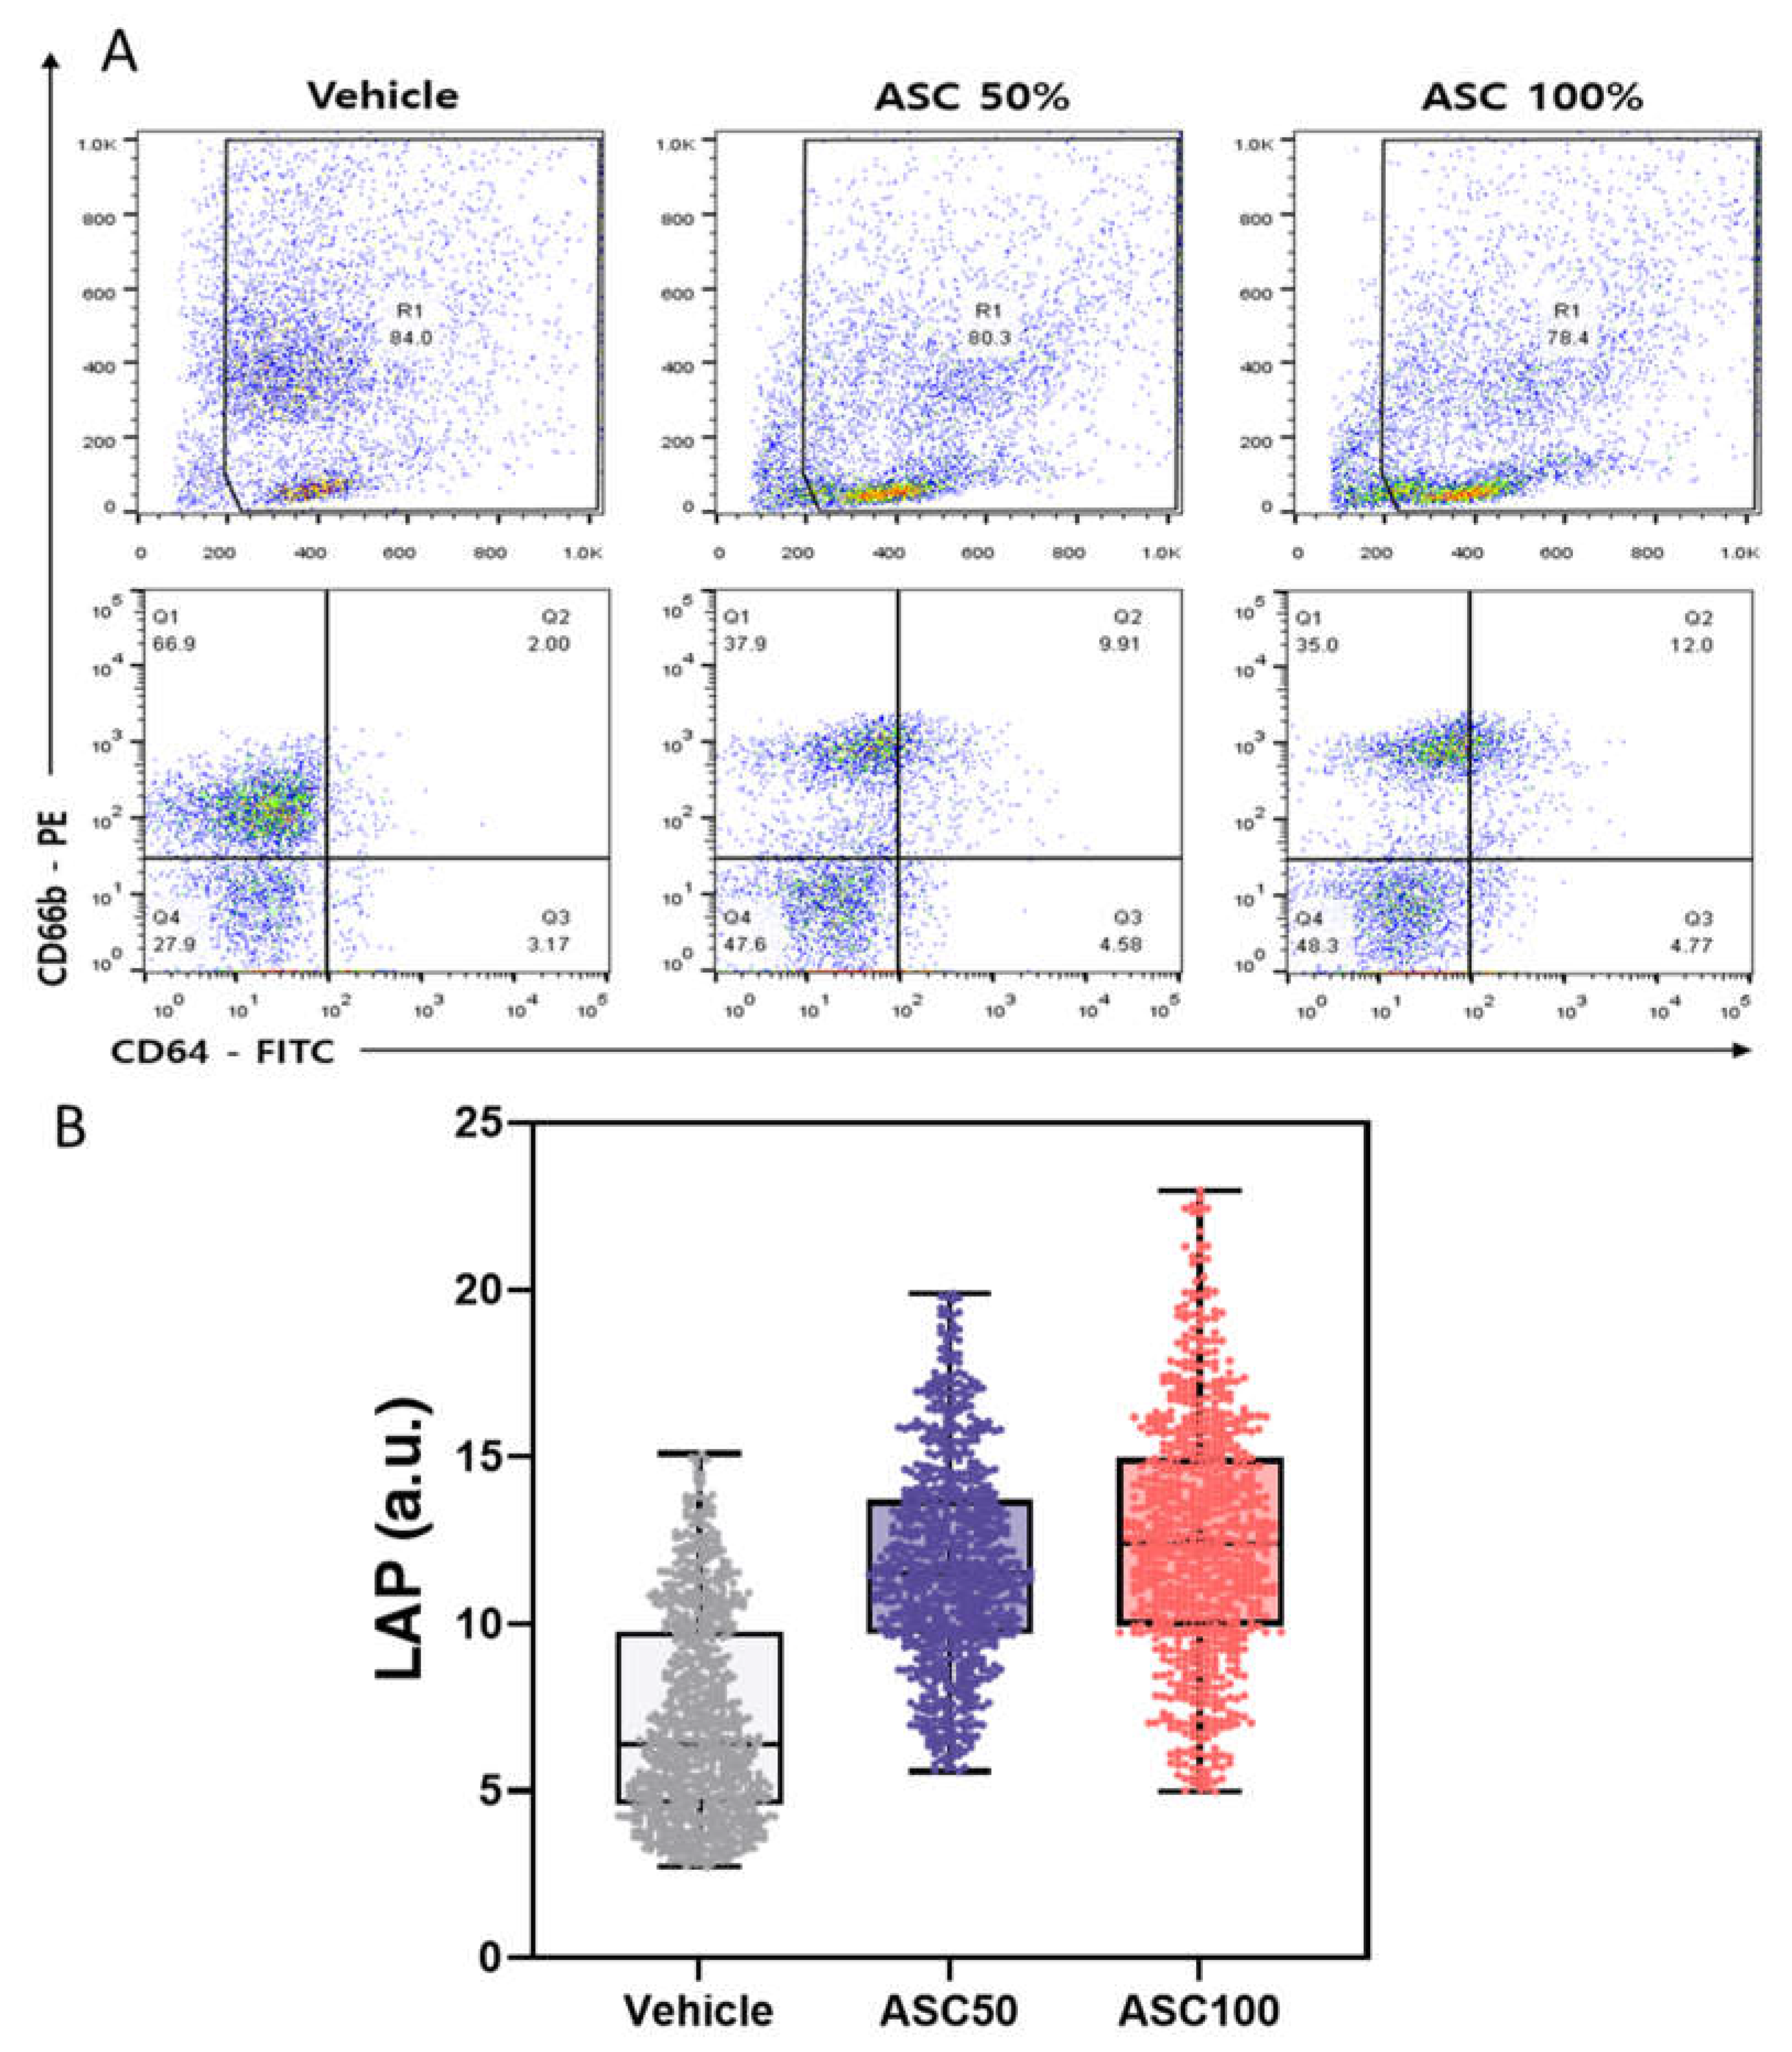
Figure 5A shows the results of flow cytometric analysis of CD64 and CD66b expression on leukocytes under different ASC stimulation conditions. The top panel shows scatter plots with the R1 gate defining the analyzed leukocyte population. The percentage of cells within the R1 gate is indicated for each condition. The bottom panel shows the quadrant analysis based on CD64 and CD66b expression and indicates the percentage of cells in each quadrant (Q1: CD64-/CD66b⁺, Q2: CD64⁺/CD66b⁺, Q3: CD64⁺/CD66b-, Q4: CD64-/CD66b-).
With increasing ASC concentration, a significant increase in the CD64⁺/CD66b⁺ population (activated neutrophils) (Q2) was observed, while the CD64-/CD66b⁺ population (resting granulocytes) (Q1) decreased. The CD64⁺/CD66b- (monocyte/macrophage) population (Q3) remained relatively constant (3-5%), indicating that ASC did not significantly activate monocytes in this experiment. The double negative (CD64-/CD66b-) population (Q4) increased from 28% to 48% upon ASC activation. This seemingly counterintuitive increase can be explained by several possibilities, e.g., downregulation (shedding, internalization, or altered gene expression) of CD64 or CD66b on activated cells, shifting them to the double-negative quadrant [
51,
52]. Alternatively, reducing CD64⁺ or CD66b⁺ cell populations due to cell death (with subsequent loss of marker expression) could also contribute to the relative increase in double-negative cells. The observed changes suggest that ASC stimulation may induce a distinct neutrophil subpopulation characterized by CD64 and CD66b loss. Further studies are needed to describe this subpopulation and its functional role. The observed increase in Q2 and decrease in Q1 strongly suggest that ASC triggers neutrophil activation and converts quiescent granulocytes to an activated state.
Figure 5B shows the distribution of LAP values for different ASC concentrations. The mean LAP value and data dispersion (indicated by the IQR and data point distribution) increased with increasing ASC concentration, suggesting a dose-dependent effect of ASC on leukocyte activation. These results are consistent with the FACS analysis (
Figure 5A) and the analysis of PPD and MMD-SD (
Figure 4) and support the conclusion that ASC effectively activates leukocytes. The LAP parameter derived from shadow images using Cellytics is a reliable indicator of leukocyte activation and correlates well with established methods such as FACS. This suggests that LAP could be a valuable tool for quantifying leukocyte activation. The greater scatter in the data at higher ASC concentrations could indicate a more heterogeneous response to ASC stimulation, possibly due to different sensitivity of individual cells or activation states. Using shadow parameters derived from shadow images offers potential advantages over conventional methods such as FACS, such as label-free analysis and a more straightforward experimental setup. The observed correlation between the shift in cell populations in FACS and the changes in LSIT shadow parameters demonstrates the potential of LSIT to provide comparable information on leukocyte activation using a label-free approach. This could be particularly valuable for high-throughput screening or limited antibody availability. While this study provides valuable insight into the effects of ASC on leukocyte activation, further research is needed to validate the clinical utility of LSIT and LAP in more extensive and diverse patient populations, including those with different disease states.
4. Conclusions
In this study, a multichannel LSIT-based device for fast and cost-effective leukocyte analysis was presented. Optimizing the parameters of the micro-pinhole chip, especially the use of etched pinholes, resulted in better image quality and sharpness. Using shadow parameters, including the novel LAP, we could effectively quantify the morphological changes of leukocytes after activation with an ASC. These results, consistent with flow cytometry results, showed marked changes in shadow parameters indicative of ASC-stimulated WBC activation. The developed multichannel LSIT device and LAP parameter provide a promising tool for rapid and accurate assessment of leukocyte activation that could have applications in clinical diagnostics and immunological research. By combining PPD and MMD-SD shadow parameters, the LAP parameter provides a reliable standard for the measurement of leukocyte activation and paves the way for applications in clinical and scientific contexts.
Author Contributions
H.C.: investigation, data curation, formal analysis, visualization, writing–original draft preparation, reviewing, and editing. S.K.: investigation, data curation, formal analysis, visualization, reviewing, and editing. I.L.: investigation, data curation, formal analysis, visualization, and methodology. S.S. (Sanghoon Shin): data curation and formal analysis. H.J.: data curation, formal analysis, and visualization. Y.-S.L.: methodology, validation, IRB approval, reviewing, and editing. M.-H.N.: methodology, validation, IRB approval, reviewing, and editing. H.S.J.: conceptualization, formal analysis, manuscript writing, writing—final draft, reviewing, and editing. S.S. (Sungkyu Seo): conceptualization, formal analysis, visualization, supervision, writing—final draft, reviewing and editing, funding acquisition, and project administration. All authors have read and agreed to the published version of the manuscript.
Institutional Review Board Statement
The study was conducted in accordance with the Declaration of Helsinki, and approved by the Institutional Review Board of the Anam Hospital of Korea University. (#2021AN0040, 27 January 2021).
Data Availability Statement
Data will be made available on request.
Acknowledgments
This study was supported by the Basic Science Research Programs of the National Research Foundation (NRF) of Korea (Grant#: RS-2024-00353675, 2021R1I1A3056109), the ITRC (Information Technology Research Center) support program supervised by the IITP (Institute for Information and Communications Technology Planning and Evaluation) and funded by the Ministry of Science and ICT (MSIT), Korea (Grant#: IITP-2024-RS-2023-00258971), the Korea Institute of Marine Science and Technology Promotion (KIMST) support program funded by the Ministry of Oceans and Fisheries, Korea (Grant#:20210660), and a Korea University Grant.
Conflicts of Interest
The authors declare that they have no known competing financial interests or personal relationships that could have appeared to influence the work reported in this paper.
References
- Leach, M. The Diagnostic Utility of Eosinophil Morphology. Br. J. Haematol. 2020, 191, 325. [Google Scholar] [CrossRef] [PubMed]
- Wu, P.-H.; Gilkes, D.M.; Phillip, J.M.; Narkar, A.; Cheng, T.W.-T.; Marchand, J.; Lee, M.-H.; Li, R.; Wirtz, D. Single-Cell Morphology Encodes Metastatic Potential. Sci. Adv. 2020, 6, eaaw6938. [Google Scholar] [CrossRef]
- Alizadeh, E.; Castle, J.; Quirk, A.; Taylor, C.D.L.; Xu, W.; Prasad, A. Cellular Morphological Features Are Predictive Markers of Cancer Cell State. Comput. Biol. Med. 2020, 126, 104044. [Google Scholar] [CrossRef]
- Jovic, A.; Saini, K.; Carelli, R.; Pham, T.; Corona, C.; Mei, J.; Phelan, M.; Boutet, S.C.; Jacobs, K.; Kim, J.; et al. Abstract 2392: Multi-Dimensional Morphology Analysis Enables Identification and Label-Free Enrichment of Heterogeneous Tumor Cell Populations. Cancer Res. 2023, 83, 2392–2392. [Google Scholar] [CrossRef]
- Aw Yong, K.M.; Zeng, Y.; Vindivich, D.; Phillip, J.M.; Wu, P.-H.; Wirtz, D.; Getzenberg, R.H. Morphological Effects on Expression of Growth Differentiation Factor 15 (GDF15), a Marker of Metastasis. J. Cell. Physiol. 2014, 229, 362–373. [Google Scholar] [CrossRef]
- Subramanian, H.; Roy, H.K.; Pradhan, P.; Goldberg, M.J.; Muldoon, J.; Brand, R.E.; Sturgis, C.; Hensing, T.; Ray, D.; Bogojevic, A.; et al. Nanoscale Cellular Changes in Field Carcinogenesis Detected by Partial Wave Spectroscopy. Cancer Res. 2009, 69, 5357–5363. [Google Scholar] [CrossRef] [PubMed]
- Pretorius, E.; Bester, J.; Vermeulen, N.; Alummoottil, S.; Soma, P.; Buys, A.V.; Kell, D.B. Poorly Controlled Type 2 Diabetes Is Accompanied by Significant Morphological and Ultrastructural Changes in Both Erythrocytes and in Thrombin-Generated Fibrin: Implications for Diagnostics. Cardiovasc. Diabetol. 2015, 14, 30. [Google Scholar] [CrossRef]
- He, H.; Liao, R.; Zeng, N.; Li, P.; Chen, Z.; Liu, X.; Ma, H. Mueller Matrix Polarimetry—an Emerging New Tool for Characterizing the Microstructural Feature of Complex Biological Specimen. J. Lightwave Technol. 2019, 37, 2534–2548. [Google Scholar] [CrossRef]
- Hart, M.; Selig, M.; Azizi, S.; Walz, K.; Lauer, J.; Rolauffs, B. Cell Morphology as a Biological Fingerprint for Describing Chondrocyte Phenotype under Inflammatory Attack. Bone Joint J 2023, 105-B, 7–7. [CrossRef]
- Karapetyan, A.; Niazyan, L.; Shushanyan, R.; Abgaryan, T.; Iritsyan, S.; Galechyan, T.; Sargsyan, K.; Grigoryan, A. Morphological Abnormalities of Peripheral Blood Cells among Patients with COVID-19 Disease. Heliyon 2024, 10, e24527. [Google Scholar] [CrossRef] [PubMed]
- Gabr, H.; Bastawy, S.; Abdel Aal, A.A.; Khalil, N.M.; Fateen, M. Changes in Peripheral Blood Cellular Morphology as Diagnostic Markers for COVID-19 Infection. Int. J. Lab. Hematol. 2022, 44, 454–460. [Google Scholar] [CrossRef]
- Kaur, G.; Sandeep, F.; Olayinka, O.; Gupta, G. Morphologic Changes in Circulating Blood Cells of COVID-19 Patients. Cureus 2021, 13, e13416. [Google Scholar] [CrossRef]
- Khalil, N.A.; Almugadam, B.S.; Elkhider, A. Relationship between the Hematological Indices and COVID-19. Biomed. Biotechnol. Res. J. (BBRJ) 2022, 6, 422–428. [Google Scholar] [CrossRef]
- Lüke, F.; Orsó, E.; Kirsten, J.; Poeck, H.; Grube, M.; Wolff, D.; Burkhardt, R.; Lunz, D.; Lubnow, M.; Schmidt, B.; et al. Coronavirus Disease 2019 Induces Multi-Lineage, Morphologic Changes in Peripheral Blood Cells. EJHaem 2020, 1, 376–383. [Google Scholar] [CrossRef]
- Jain, S.; Meena, R.; Kumar, V.; Kaur, R.; Tiwari, U. Comparison of Hematologic Abnormalities between Hospitalized Coronavirus Disease 2019 Positive and Negative Patients with Correlation to Disease Severity and Outcome. J. Med. Virol. 2022, 94, 3757–3767. [Google Scholar] [CrossRef]
- Pozdnyakova, O.; Connell, N.T.; Battinelli, E.M.; Connors, J.M.; Fell, G.; Kim, A.S. Clinical Significance of CBC and WBC Morphology in the Diagnosis and Clinical Course of COVID-19 Infection. Am. J. Clin. Pathol. 2021, 155, 364–375. [Google Scholar] [CrossRef] [PubMed]
- Feng, X.; Li, S.; Sun, Q.; Zhu, J.; Chen, B.; Xiong, M.; Cao, G. Immune-Inflammatory Parameters in COVID-19 Cases: A Systematic Review and Meta-Analysis. Front. Med. (Lausanne) 2020, 7, 301. [Google Scholar] [CrossRef] [PubMed]
- Mishra, P.; Agarwal, S.; Patni, P.; Pathak, S.; Kaur, M.; Rehman, N. Peripheral Blood Morphology and Hemogram in COVID-19 Patients Correlates with Disease Severity. Med. J. Dr. D.Y. Patil Vidyapeeth 2022, 15, S278–S285. [Google Scholar] [CrossRef]
- Zini, G.; Bellesi, S.; Ramundo, F.; d’Onofrio, G. Morphological Anomalies of Circulating Blood Cells in COVID-19. Am. J. Hematol. 2020, 95, 870–872. [Google Scholar] [CrossRef]
- Stouten, K.; Riedl, J.A.; Levin, M.-D.; van Gelder, W. Examination of Peripheral Blood Smears: Performance Evaluation of a Digital Microscope System Using a Large-Scale Leukocyte Database. Int. J. Lab. Hematol. 2015, 37, e137–40. [Google Scholar] [CrossRef] [PubMed]
- Zhu, M.; Chen, W.; Sun, Y.; Li, Z. Improved U-Net-Based Leukocyte Segmentation Method. J. Biomed. Opt. 2023, 28, 045002. [Google Scholar] [CrossRef] [PubMed]
- Rosen, J.; Alford, S.; Allan, B.; Anand, V.; Arnon, S.; Arockiaraj, F.G.; Art, J.; Bai, B.; Balasubramaniam, G.M.; Birnbaum, T.; et al. Roadmap on Computational Methods in Optical Imaging and Holography [Invited]. Appl. Phys. B 2024, 130, 166. [Google Scholar] [CrossRef] [PubMed]
- Bouchet, A.; Montes, S.; Ballarin, V.; Díaz, I. Intuitionistic Fuzzy Set and Fuzzy Mathematical Morphology Applied to Color Leukocytes Segmentation. Signal Image Video Process. 2020, 14, 557–564. [Google Scholar] [CrossRef]
- Goda, K.; Ayazi, A.; Gossett, D.R.; Sadasivam, J.; Lonappan, C.K.; Sollier, E.; Fard, A.M.; Hur, S.C.; Adam, J.; Murray, C.; et al. High-Throughput Single-Microparticle Imaging Flow Analyzer. Proc. Natl. Acad. Sci. U. S. A. 2012, 109, 11630–11635. [Google Scholar] [CrossRef] [PubMed]
- Yan, K.; Xue, L.; Wang, S. Field of View Scanning Based Quantitative Interferometric Microscopic Cytometers for Cellular Imaging and Analysis. Microsc. Res. Tech. 2018, 81, 397–407. [Google Scholar] [CrossRef] [PubMed]
- Ye, X.; Fang, L.; Chen, Y.; Tong, J.; Ning, X.; Feng, L.; Xu, Y.; Yang, D. Performance Comparison of Two Automated Digital Morphology Analyzers for Leukocyte Differential in Patients with Malignant Hematological Diseases: Mindray MC-80 and Sysmex DI-60. Int. J. Lab. Hematol. 2024, 46, 457–465. [Google Scholar] [CrossRef] [PubMed]
- Zhao, Y.; Diao, Y.; Zheng, J.; Li, X.; Luan, H. Performance Evaluation of the Digital Morphology Analyser Sysmex DI-60 for White Blood Cell Differentials in Abnormal Samples. Sci. Rep. 2024, 14, 14344. [Google Scholar] [CrossRef]
- Nam, M.; Yoon, S.; Hur, M.; Lee, G.H.; Kim, H.; Park, M.; Kim, H.N. Digital Morphology Analyzer Sysmex DI-60 vs. Manual Counting for White Blood Cell Differentials in Leukopenic Samples: A Comparative Assessment of Risk and Turnaround Time. Ann. Lab. Med. 2022, 42, 398–405. [Google Scholar] [CrossRef]
- Su, Y.; Yang, C.; Peng, Y.; Yang, C.; Wang, Y.; Wang, Y.; Yan, F.; Xing, B.; Ji, R. Lensless Shadow Microscopy-Based Shortcut Analysis Strategy for Fast Quantification of Microplastic Fibers Released to Water. Water Res. 2024. [Google Scholar] [CrossRef]
- Seo, S.; Su, T.-W.; Tseng, D.K.; Erlinger, A.; Ozcan, A. Lensfree holographic imaging for on-chip cytometry and diagnostics. Lab Chip 2009, 9, 777–787. [Google Scholar] [CrossRef]
- Mudanyali, O.; Tseng, D.; Oh, C.; Isikman, S.O.; Sencan, I.; Bishara, W.; Oztoprak, C.; Seo, S.; Khademhosseini, B.; Ozcan, A. Compact, light-weight and cost-effective microscope based on lensless incoherent holography for telemedicine applications. Lab Chip 2010, 10, 1417–1428. [Google Scholar] [CrossRef] [PubMed]
- Baker, M.; Gollier, F.; Melzer, J.E.; McLeod, E. Lensfree Air-Quality Monitoring of Fine and Ultrafine Particulate Matter Using Vapor-Condensed Nanolenses. ACS Appl. Nano Mater. 2023, 6, 11166–11174. [Google Scholar] [CrossRef] [PubMed]
- Shin, S.; Oh, S.; Seo, D.; Kumar, S.; Lee, A.; Lee, S.; Kim, Y.-R.; Lee, M.; Seo, S. Field-Portable Seawater Toxicity Monitoring Platform Using Lens-Free Shadow Imaging Technology. Water Res. 2023, 230, 119585. [Google Scholar] [CrossRef]
- Im, H.; Castro, C.M.; Shao, H.; Liong, M.; Song, J.; Pathania, D.; Fexon, L.; Min, C.; Avila-Wallace, M.; Zurkiya, O.; et al. Digital Diffraction Analysis Enables Low-Cost Molecular Diagnostics on a Smartphone. Proc. Natl. Acad. Sci. U. S. A. 2015, 112, 5613–5618. [Google Scholar] [CrossRef] [PubMed]
- Jin, G.; Yoo, I.-H.; Pack, S.P.; Yang, J.-W.; Ha, U.-H.; Paek, S.-H.; Seo, S. Lens-free shadow image based high-throughput continuous cell monitoring technique. Biosens. Bioelectron. 2012, 38, 126–131. [Google Scholar] [CrossRef] [PubMed]
- Roy, M.; Seo, D.; Oh, C.-H.; Nam, M.-H.; Kim, Y.J.; Seo, S. Low-cost telemedicine device performing cell and particle size measurement based on lens-free shadow imaging technology. Biosens. Bioelectron. 2015, 67, 715–723. [Google Scholar] [CrossRef] [PubMed]
- Seo, D.; Oh, S.; Lee, M.; Hwang, Y.; Seo, S. A Field-Portable Cell Analyzer without a Microscope and Reagents. Sensors (Basel) 2017, 18, 85. [Google Scholar] [CrossRef] [PubMed]
- Baik, M.; Shin, S.; Kumar, S.; Seo, D.; Lee, I.; Jun, H.S.; Kang, K.-W.; Kim, B.S.; Nam, M.-H.; Seo, S. Label-Free CD34+ Cell Identification Using Deep Learning and Lens-Free Shadow Imaging Technology. Biosensors (Basel) 2023, 13, 993. [Google Scholar] [CrossRef] [PubMed]
- Vaghashiya, R.; Shin, S.; Chauhan, V.; Kapadiya, K.; Sanghavi, S.; Seo, S.; Roy, M. Machine Learning Based Lens-Free Shadow Imaging Technique for Field-Portable Cytometry. Biosensors 2022, 12. [Google Scholar] [CrossRef] [PubMed]
- Seo, D.; Han, E.; Kumar, S.; Jeon, E.; Nam, M.-H.; Jun, H.S.; Seo, S. Field-Portable Leukocyte Classification Device Based on Lens-Free Shadow Imaging Technique. Biosensors 2022, 12, 47. [Google Scholar] [CrossRef]
- Rostykus, M.; Soulez, F.; Unser, M.; Moser, C. Compact In-Line Lensfree Digital Holographic Microscope. Methods 2018, 136, 17–23. [Google Scholar] [CrossRef]
- Roy, M.; Seo, D.; Oh, S.; Yang, J.-W.; Seo, S. A review of recent progress in lens-free imaging and sensing. Biosens. Bioelectron. 2017, 88, 130–143. [Google Scholar] [CrossRef]
- Wu, Y.; Ozcan, A. Lensless Digital Holographic Microscopy and Its Applications in Biomedicine and Environmental Monitoring. Methods 2018, 136, 4–16. [Google Scholar] [CrossRef] [PubMed]
- Lee, I.; Lee, A.; Shin, S.; Kumar, S.; Nam, M.-H.; Kang, K.-W.; Kim, B.S.; Cho, S.-D.; Kim, H.; Han, S.; et al. Use of a Platform with Lens-Free Shadow Imaging Technology to Monitor Natural Killer Cell Activity. Biosens. Bioelectron. 2024, 261, 116512. [Google Scholar] [CrossRef] [PubMed]
- Roy, M.; Jin, G.; Seo, D.; Nam, M.-H.; Seo, S. A Simple and Low-Cost Device Performing Blood Cell Counting Based on Lens-Free Shadow Imaging Technique. Sens. Actuators B Chem. 2014, 201, 321–328. [Google Scholar] [CrossRef]
- Sahu, V.; Dewangan, P.; Vardhan, R.V.; Rinfela, V.; Menon, P.K.; Pal, P. A Study on Chromium Thin Film with Positive Photoresist as a Masking Layer towards the Wet Bulk Micromachining of Borofloat Glass. Micro Nano Syst. Lett. 2024, 12. [Google Scholar] [CrossRef]
- Smeesters, L.; Magnus, I.; Thienpont, H.; Sorgato, S. Broadband Uniform Illumination Optics for Industrial Applications. In Proceedings of the Illumination Optics VII; Kidger, T.E., David, S., Schupp, T., Eds.; SPIE, June 17 2024.
- Roy, M.; Jin, G.; Pan, J.-H.; Seo, D.; Hwang, Y.; Oh, S.; Lee, M.; Kim, Y.J.; Seo, S. Staining-Free Cell Viability Measurement Technique Using Lens-Free Shadow Imaging Platform. Sens. Actuators B Chem. 2016, 224, 577–583. [Google Scholar] [CrossRef]
- Watson, J.V. Light Scatter Applications. In Introduction to Flow Cytometry; Cambridge University Press: Cambridge, 1991; pp. 186–200 ISBN 9780521380614.
- Mourant, J.R.; Marina, O.C.; Sanders, C.K. The Contribution of Specific Organelles to Side Scatter. In Proceedings of the Biomedical Applications of Light Scattering VII; Wax, A.P., Backman, V., Eds.; SPIE, February 21 2013.
- Sack, U. CD64 Expression by Neutrophil Granulocytes. Cytometry B Clin. Cytom. 2017, 92, 189–191. [Google Scholar] [CrossRef]
- Yoon, J.; Terada, A.; Kita, H. CD66b Regulates Adhesion and Activation of Human Eosinophils. J. Immunol. 2007, 179, 8454–8462. [Google Scholar] [CrossRef] [PubMed]
Figure 1.
Multi-channel Cellytics Device and Workflow. (A) Experimental workflow for Cellytics analysis of WBCs, including WBC isolation, ASC activation, loading onto the dedicated cell chip, and Cellytics analysis. (B) The fabrication process of a micro-pinhole chip using wet etching, including sequential steps of chromium deposition by sputtering and wet etching of a quartz wafer. (C) Schematic of the multi-channel Cellytics device showing overall dimensions and components, a close-up view of the microfluidic chip (highlighting individual channels and flow control), and a schematic representation of diffraction pattern formation. (D) Comparison of 300 µm micro-pinholes fabricated by super drilling and wet etching.
Figure 2.
Pinhole Characterization and Performance. (A) Characterization of pinholes with varying diameters: Microscope images, background illumination patterns, and corresponding absolute and relative heatmaps. (B) Mean and standard deviation of pixel gray values as a function of pinhole diameter. (C) Measurement of peak-to-peak distance (PPD) and maxima-to-minima distance (MMD) from a diffraction pattern: PPD is the distance between the two peaks of the central maximum, and MMD is the distance between the central maximum and an adjacent minimum. (D) Shadow images of 10 µm and 20 µm beads obtained using drilled and etched pinholes. (E) Comparison of sharpness, PPD, and MMD for drilled and etched pinholes with 10 µm and 20 µm beads (error bars represent standard deviation).
Figure 3.
Effect of ASC Stimulation on Leukocyte Shadow Parameters. (A–C) Absolute PPD, MMSD, and LAP values, respectively, at different ASC concentrations (25%, 50%, and 100%) and incubation times (1, 2, and 3 h). (D–F) Normalized PPD, MMSD, and LAP values, respectively (error bars represent standard deviation).
Figure 4.
Correlation between FACS Analysis and LSIT-Derived Shadow Parameters. (A) FACS dot plots (FSC-ALin vs. SSC-ALin) for vehicle control and ASC concentrations (25%, 50%, and 100%). (B) Corresponding PPD vs. MMSD density plots. (C) Mean FSC and SSC values across ASC concentrations. (D) Mean PPD and MMSD values across ASC concentrations (error bars represent standard deviation).
Figure 5.
Comparison of Leukocyte Activation Measured by Flow Cytometry and leukocyte activation parameter (LAP). (A) Flow cytometric analysis of CD64 and CD66b expression, showing the R1-gated leukocyte population (top) and quadrant analysis (bottom) defining CD64⁺/CD66b⁻ (monocytes/macrophages), CD64⁺/CD66b⁺ (activated neutrophils), CD64⁻/CD66b⁻ (negative population/lymphocytes), and CD64⁻/CD66b⁺ (resting granulocytes) for vehicle control, 50% ASC, and 100% ASC. (B) The corresponding distribution of LAP values (raincloud plot; boxes: IQR; horizontal lines: median; whiskers: 1.5× IQR; dots: individual data points).
|
Disclaimer/Publisher’s Note: The statements, opinions and data contained in all publications are solely those of the individual author(s) and contributor(s) and not of MDPI and/or the editor(s). MDPI and/or the editor(s) disclaim responsibility for any injury to people or property resulting from any ideas, methods, instructions or products referred to in the content. |
© 2025 by the authors. Licensee MDPI, Basel, Switzerland. This article is an open access article distributed under the terms and conditions of the Creative Commons Attribution (CC BY) license (http://creativecommons.org/licenses/by/4.0/).