
Submitted:
30 December 2024
Posted:
03 January 2025
You are already at the latest version
Abstract
Moniliophthora perniciosa is one of the main pathogens affecting the cocoa crop. The control of this phytopathogen is generally carried out by means of resistant genotypes accompanied by phytosanitary pruning. The identification of plant genes related to the plant defense mechanism is important to unravel the molecular basis of plant-pathogen interaction. One potential gene studied is the binding protein (BiP), a molecular chaperone located in the lumen of the endoplasmic reticulum that binds to newly synthesized proteins as they are translocated into the ER and maintains it in a competent state for subsequent folding and oligomerisation. BiP is an abundant protein under all growth conditions, but its synthesis is markedly induced under conditions that lead to accumulation of unbound polypeptides in the ER, such as when plants are under pathogen attack. In this study, we overexpressed the SoyBiPD gene in Solanum lycorperscum plants and inoculated them with M. perniciosa. The control (untransformed) plants showed severe symptoms of witches' broom disease, while the symptoms of the transgenic lineages varied from severe to mild according to the level of BiP in transgenic lineages. We further applied a gel-free proteomics technique to investigate the molecular mechanisms induced by BiP overexpression that confers M. perniciosa resistance. We inoculated BiP-plant (tomato superexpressing BiP) and control plants (Non-transgenic) with a mix of M. perniciosa spores. Proteins were extracted and analyzed by mass spectrometry to identify up-regulated and differentially abundant proteins between treatments associated with gene overexpression. The uninoculated NT plants showed 196 proteins, 15 of which were up-regulated, while the uninoculated BiP plants showed 214 proteins, 33 of which were up-regulated. After inoculation, the total number of proteins detected decreased to 178 in the NT group, with 37 up-regulated, and to 171 in the BiP plants, with 30 up-regulated. The identification of these proteins showed that plants overexpressing SoyBiPD had a higher abundance of resistance-related proteins such as PR2, PR3 and PR10, proteins that are part of the plant's immune system and contribute to resistance against pathogens. Transgenic lines showed higher activity of glucanase, superoxide dismutase (SOD), catalase (CAT) and guaiacol peroxidase (GPX). In addition, plants overexpressing BiP, both inoculated and non-inoculated, accumulated less hydrogen peroxide (H₂O₂) compared to NT plants, suggesting a more efficient control in the production or detoxification of ROS. Interaction network analysis revealed the activation of clusters associated with defense and the interconnection between different metabolic and signaling pathways, reinforcing the defensive readiness and metabolic capacity of plants superexpressing BiP. Taken together, our results indicate that overexpression of BiP in plants increases the abundance of defense proteins, improves antioxidant capacity, modulates the accumulation of ROS and increases the activity of fungal cell wall degradation enzymes, even in the absent of M. perniciosa attack, contributing to a state of defensive readiness and greater tolerance to biotic stress. This study deepens our understanding of the molecular mechanisms of BiP-mediated induced resistance to biotic stress. Further, it highlights the biotechnological potential of the BiP gene for developing crops that are more resistant to witches' broom and other economically relevant diseases. Its application could be a promising approach to reducing losses caused by pathogens in species of economic interest, such as cocoa.
Keywords:
Witches' Broom disease
; Biotic Stress Resistance
; Proteomics
1. Introduction
Cocoa (Theobroma cacao L.) is an agricultural crop of great economic importance worldwide, being the basis for the production of chocolate and a variety of derived products [1,2]. Global cocoa production reached around 4,449 million tons in 2023, demonstrating the magnitude of this commodity. In Brazil, production reached 290,000 tons in the same year, consolidating the country as an important producer in the cocoa market [3]. However, cocoa production faces significant challenges, especially the diseases that affect the cocoa tree. Among the most significant, witches' broom, caused by the hemibiotrophic fungus Moniliophthora perniciosa [4,5], represents a particularly serious threat, especially in the producing countries of South and Central America [6,7]. The infection manifests itself through abnormal tissue growth and deformations in shoots, flowers and fruit, culminating in the death of the infected tissues [8,9,10]. The complex life cycle of M. perniciosa, characterized by monokaryotic (biotrophic) and dikaryotic (necrotrophic) phases, involves penetration into plant tissues, intercellular colonization and the subsequent production of spores that spread the disease [4,11,12].
Responding effectively to the threat posed by witches' broom requires an in-depth understanding of plant defense mechanisms and plant-pathogen interactions. The search for solutions to control this disease has driven research on several fronts, with emphasis on integrated management practices, such as crop rotation, the use of resistant varieties and the application of appropriate agronomic techniques. These approaches are essential for reducing the spread of the pathogen and reducing damage to crops [13,14]. At the same time, research into plant defense mechanisms, especially the activation of resistance genes, is emerging as a promising alternative for increasing crop resilience to diseases [15,16]. Proteomic analyses have excelled in identifying essential molecular targets for plant defense. Do Carmo et al. (2023) explored protein interactions between T. cacao and necrosis-inducing proteins (NEPs) from M. perniciosa, where three target proteins were identified in cacao that interact directly with the NEP, MpNep2.
In this context, BiP (Binding immunoglobulin protein) has emerged as an important protein, since its increased expression is associated with protection against cell damage [18;19]. BiP is a molecular chaperone located in the lumen of the endoplasmic reticulum (ER), belonging to the HSP70 family (Heat Shock Proteins). This class of proteins is involved in the regulation of various cellular processes, such as the translocation of proteins into the ER, protein quality control and protection against cellular stress [20,21,22]. In the ER, BiP plays a key role in regulating the proper folding of proteins in the secretory pathway, ensuring the correct three-dimensional conformation of molecules prior to their secretion [23,24]. It acts as a stress sensor, helping to identify and degrade malformed proteins through the proteosomal degradation pathway, and is vital for maintaining protein homeostasis and preventing cell dysfunction [24,25,26]. The regulation of BiP expression is crucial for cellular homeostasis and has been identified in all genomes of eukaryotic organisms [18,27]. A signaling pathway known as the Unfolded Protein Response (UPR) is triggered when there is an increase in secretory activity or accumulation of misfolded proteins within the endoplasmic reticulum, activated by a decrease in free BiP [23,28]. Stress events, such as biotic or abiotic, lead to the activation of this pathway, where a signaling cascade, mediated by the phosphorylation of stress response initiator proteins, induces molecular chaperones including BiP, one of the most induced, to correct malformed proteins [18,23,29]. Studies indicate that increased BiP synthesis in plants is associated with a more effective response to biotic stresses, such as fungal infestations and insect attacks [30,31]. In addition, overexpression of this gene via transgenesis is directly related to increased tolerance to abiotic stresses, such as water deficit [32,33,34].
SoyBiPD, isolated from soybean (Glycine max L.) [33], encodes a BiP-type chaperone protein. In a previous study, transgenic lines of Solanum lycopersicum var. Micro-Tom overexpressing the soyBiPD gene were tested for inoculation with the M. perniciosa fungus, where a correlation was observed between greater accumulation of BiP and better plant response in growth, productivity and resistance to infection (Alcântara et al., 2024 submitted article). Therefore, this study aims to further investigate the potential of the soyBiPD gene when overexpressed in model tomato plants (S. lycopersicum) in response to attack by the pathogen M. perniciosa. To this end, we used proteomic analysis techniques, including mass spectrometry, to identify up-regulated and differentially abundant proteins (those present in both samples compared, but at different intensities) in control plants (NT) and in those overexpressing the gene, infected and not infected with the M. perniciosa fungus.
The results of this research may contribute significantly to the advancement of knowledge on plant-pathogen interaction, particularly in the context of resistance to witches' broom, by providing information on the molecular mechanisms of plant defense against M. perniciosa mediated by BiP overexpression. The identification of key proteins involved in the defense response, as well as the use of the BiP gene as a target, could lead to more resistant cultivars, impacting several agricultural crops, in addition to cocoa.
2. Results
2.1. BiP Overexpression Affects Protein Composition in Plants, Under Stressed or Non-Stressed Condition
In a previous study we identified that transgenic S. lycopersicum cv. Micro-Tom, expressing BiP presented resistance to M. perniciosa (Alcântara et al., 2024 submitted paper). In so, we decided to better understand the molecular differences that could be related with our findings. NT and transgenic lineages were inoculated with M. perniciosa basidiospores and again, we observed that NT plants showed severe symptoms of infection, including hyperplasia, overgrowth and blackening of whereas lineages with the highest accumulation of BiP (L9, L10 and L12) remained asymptomatic throughout the experimental period (45 days after infection), with no visible signs of infection (Figure 1).
Mass spectrometry analysis was carried comparing transgenic plants (L12) and control plants (NT), both inoculated and non-inoculated with M. perniciosa revealing a significant number of proteins in different experimental conditions. In non-inoculated plants, 1,911 total proteins were identified in NT plants, while 1,909 proteins were detected in L12 transgenic plant. In inoculated plants, 1,588 total proteins were identified in NT, while 1,406 proteins were detected in L12. After filtering the data, based on identification in 100% of the triplicates, 273 proteins were retained in NT plants and 377 proteins in L12 BiP plants in unstressed treatment; considering the inoculated treatment, 254 proteins were retained in NT plants and 246 proteins in transgenic plants (supplementary Figure 4). Venn diagrams show the number of up-regulated and differentially abundant proteins between the experimental conditions. In the comparative non-inoculated treatment (supplementary Figure 5A), 14 proteins were up-regulated to NT plants, while 34 proteins were up-regulated to transgenic plants, with 181 differentially abundant proteins between the groups. In the comparative treatment after inoculation (supplementary Figure 5B), 37 proteins were identified as up-regulated in NT plants, while 30 proteins were up-regulated in transgenic plants, with 141 proteins differentially abundant between the two groups. For the principal component analysis (PCA) and the Venn diagram, all the proteins identified as up-regulated and differential were considered. However, the analysis of these proteins only included proteins that met the significance criteria (p-value < 0.05 and |fold-change| > 1.5) (supplementary table 1;2).
Heatmap showed the differentially abundant proteins for each treatment. A total of 57 up-regulated and differentially abundant proteins were identified in non-inoculated comparisons of NT plants versus L12 BiP plants (Figure 2A), while 78 proteins were detected as up-regulated or differentially abundant in NT versus L12 BiP under inoculated treatment (Figure 3A), allowing a more detailed view of the specific changes imposed in the proteomic profile (Supplementary Table 1;2).
The comparative proteomic analysis of the non-inoculate heatmap (Figure 2A), revealed significant differences in specific proteins abundance. Hierarchical clustering highlighted proteins as up-regulated or differentially abundant, associated with various biological processes. In NT plants, up-regulated proteins associated with energy metabolism were identified, such as glyceraldehyde-3-phosphate dehydrogenase and malate dehydrogenase, involved in glycolysis and the citric acid cycle. In the field of regulation and signaling, proteins such as histone H2A, which acts in DNA compaction, and RING-type domain-containing protein, involved in ubiquitination, stood out. In addition, the chlorophyll a-b binding protein was detected, which plays an important role in photosynthesis, especially in light capture and energy transfer. However, in the transgenic plants, up-regulated proteins such as luminal-binding protein precursor (BiP), an essential chaperone for protein folding, as well as aspartic proteinase and annexin, which act in protein degradation and membrane stabilization were identified. In energy metabolism, proteins such as triosephosphate isomerase and malate dehydrogenase were observed, while in regulation and signaling, 14-3-3 domain-containing protein and isocitrate dehydrogenase (NADP+) stood out. Among the differentially abundant proteins between the treatments, the most abundant proteins in the transgenic plants included those related to energy metabolism, such as glycinamide ribonucleotide synthetase, which is essential for purine biosynthesis. Proteins related to regulation and signaling such as leucine-rich repeat-containing N-terminal with potential involvement in pathogen recognition and proteins involved in protein folding such as peptidyl-prolyl cis-trans isomerase. On the other hand, among the most abundant proteins in NT plants, carboxypeptidase, involved in protein degradation, stood out. The functional characterization of the proteins (Figure 2B) revealed that the proteins with the greatest participation were those associated with ATPase activity and cofactor binding, both representing 26.1% of the total proteins. In addition, 21.7% of the proteins showed enzyme inhibitor activity. Proteins associated with oxidoreductive activity and heat shock protein binding were also detected, accounting for 13% each. In the biological processes (Figure 2B) (Supplementary Table 1), the largest proportion of proteins (21.2%) were involved in the generation of metabolic precursors and energy, followed by proteins associated with protein folding (15.2%), highlighting the role of chaperones in the endoplasmic reticulum. Other significant categories included proteins involved in glucose metabolism and regulation of molecular functions, both accounting for 12.1%.
2.2. The Identification of UP-Regulated and Differentially Abundant Proteins Reveals That Plants That Accumulate BiP Respond Differently Than Control Plants to Pathogen Infection, Activating Defense and Oxidative Stress Proteins
We identified in NT plants, up-regulated proteins related to photosynthesis and chloroplast metabolism, such as ATP synthase subunits (Δ and ε) and photosystem II oxygen evolution system proteins, such as 23 kDa subunit and PSB27-H1. Metabolic proteins were also observed, such as glyceraldehyde-3-phosphate dehydrogenase (glycolysis) and ribose-5-phosphate isomerase (pentose pathway). In the field of regulation and signaling, proteins such as CP12 domain-containing protein and calmodulin-binding domain-containing protein stood out. In contrast, L12 BiP-transgenic plants showed up-regulated proteins related to energy metabolism and sugar metabolism, such as glyceraldehyde-3-phosphate dehydrogenase and sucrose-phosphate synthase. We also identified proteins related to regulation and signaling processes, such as the bulb-type lectin domain-containing protein, which can help regulate responses to oxidative stress and cellular homeostasis (Figure 3A).
Among the differentially abundant proteins, it was observed that NT plants showed greater accumulation of proteins associated with photosynthesis, such as ATP synthase subunit beta and photosystem II stability/assembly factor, reflecting greater photosynthetic activity. Related to energy metabolism, phosphoglycerate kinase was detected, while in regulation and signaling, plastocyanin stood out, suggesting greater participation in processes related to photosynthesis and electron transport. On the other hand, L12 BiP-transgenic plants showed greater abundance of the protein related to energy metabolism, glycinamide ribonucleotide synthetase, which is essential for purine biosynthesis. In regulation and signaling, peptidyl-prolyl cis-trans isomerase, involved in protein folding, was detected, indicating specific adaptations to stress and the maintenance of cellular homeostasis.
Functional characterization of the proteins (Figure 3B, Supplementary Table 2) showed that 47.1% of the proteins in the treatment were involved in tetrapyrrole binding, associated with photosynthesis and pigment metabolism. Other molecular functions included proteins with chitin-binding activities, ATP synthase activity, and specific binding to protein domains, each representing 17.6%, reflecting functional diversification in response to inoculation. In the biological processes, 16.2% of the proteins were related to the generation of metabolic precursors and energy. Proteins involved in carbohydrate metabolism and photosynthesis were also predominant, accounting for 14.4% each. In addition, there was a high participation of proteins associated with the response to biotic and abiotic stimuli (10.8%). Other processes included proteins associated with response to chemical (8.1%) and oxidative (6.3%) stimuli, response to light (5.4%) and oxidation reduction (4.6%), showing adaptation and defense to pathogen-induced stress.
The comparative analysis of NT and L12 BiP treatments under non-inoculated and M. perniciosa-inoculated conditions revealed differences in the abundance of proteins associated with defense and oxidative stress (Figure 4A and B). In the NT versus L12 BiP-transgenic not-inoculated treatment (Figure 4A), 16 proteins were detected. NT plants showed the up-regulated of 27 kDa acidic endochitinase, a protein associated with chitin degradation, which is a common component of fungal cell walls. In contrast, BiP plants exhibited a more diverse protein profile geared towards defense even without inoculation, with up regulated proteins including two isoforms of the SCP domain-containing protein, associated with pathogen recognition and triggering defense responses, and the RRL-RLP Leucine-rich repeat-containing protein, known for its role in pathogen recognition. Other important defense proteins, such as the chitin-binding type-1 domain-containing protein and the bulb-type lectin domain-containing protein, were also found exclusively in L12 BiP-transgenic plants, both associated with pathogen recognition and response to biotic stimuli. In addition, antioxidant proteins, such as thioredoxin domain-containing protein and annexin, were also up-regulated to the transgenic plants. Although peroxidase was present in both genotypes, its accumulation was significantly higher in NT, while it was possible to detect PR10 protein, wound-induced proteinase inhibitor 1 and proteinase inhibitor II in both genotypes, with higher abundance in L12 BiP plants.
Under M. perniciosa infection we kept identifying a diverse accumulation of defense proteins on L12 BiP-transgenic plants (Figure 4B). In inoculated NT plants, some up-regulated proteins are associated with stress and defense responses as osmotin homolog, related to the response to osmotic stress, and glutaredoxi that acts in the control of oxidative stress. In addition, the Avr9/Cf-9 rapidly elicited protein, known for its role in elicitor-activated defense, was also up-regulated to NT plants. In inoculated BiP-transgenic plants, there was a greater abundance of up-regulated proteins, many of which are directly linked to the degradation of fungal cell wall components and defense against pathogens, such as the glucan endo-1,3-beta-D-glucosidase protein, where 3 isoforms were identified. Other defense and biotic stress response proteins, such as pathogenesis-related protein PR2, PR1 protein and PR10 protein, were also detected only in transgenic plants, reinforcing the activation of a more robust defense response. In addition, BiP-trangenic L12 plants presented up-regulated antioxidant proteins, such as thioredoxin-dependent peroxiredoxin, as well as several isoforms of peroxidase with high levels of abundance. Among the proteins shared after inoculation, superoxide dismutase stands out, which was slightly more abundant in NT. Although both genotypes accumulated superoxide dismutase, NT seems to focus on a specific antioxidant response, while L12 exhibits a broader profile of antioxidant enzymes.
2.3. Comparative Analysis of Protein-Protein Interaction Networks Reveals Distinct Clusters and Key Proteins in Plants Overexpressing BiP in Response to Stress
Analysis of protein-protein interaction network comparing the non-inoculated NT versus L12-transgenic BiP samples revealed a total of 1,258 nodes, corresponding to proteins, and 15,670 connections, representing the interactions between them (Figure 5). Among the proteins highlighted in the interaction network, 17 were identified with greater abundance in the NT samples, while 22 proteins showed greater abundance in the L12 samples. The interactions were organized into 21 distinct clusters (CL1-CL21), each associated with different biological functionalities. The clusters with the highest number of proteins include Cluster 3 (CL3), which covers small molecule metabolic processes, with 293 proteins, and which stands out for its relevance in regulating cellular homeostasis and the production of secondary metabolites. Cluster 2 (CL2), focused on transmembrane proton transport, was the second largest, with 191 proteins. Cluster 5 (CL5), related to protein folding, also stood out, with 162 proteins. In addition to the clusters mentioned above, the analysis identified clusters associated with stress and plant defense, such as Cluster 16 (CL16), which is related to the response to heat, and Cluster 21 (CL21), which addresses the response to biotic stimuli. Further statistical analysis revealed 140 proteins classified as bottlenecks (supplementary table 3), of which 2 were detected in the NT samples. These included the homologous proteins ARG2 (arginase), belonging to CL3, and the protein EIF (iso)4G (MI domain-containing protein), grouped in CL5. In transgenic samples, 6 bottleneck proteins were identified, including the homologous protein Ca2 (carbonic anhydrase), which belongs to CL1, the protein A0A3Q7IIS5 (subunit B of the vacuolar proton pump) in CL2, and the proteins A0A3Q7G863 (serine hydroxymethyltransferase) and ER69 (5-methyltetrahydropteroiltriglutamate), present in CL3. Additionally, in Cluster 4, the protein A0A3Q7FZI5 (cytosolic triose triphosphate isomerase) was identified, and in Cluster 5, the protein A0A3Q7EQ38 (glycinamide ribonucleotide synthase). In addition to the proteins classified as bottlenecks, the interaction network contains 521 proteins considered hubs, which play central roles in regulating molecular interactions.
In the comparative analysis of the interaction network, the samples inoculated with M. perniciosa NT versus L12 BiP (Figure 6) revealed a total of 1,573 nodes (proteins) and 33,186 connections, which reflect the interactions between them. Among the proteins highlighted in the network, 47 were identified with greater abundance in the NT samples, while 30 proteins showed greater abundance in the L12 BiP samples. The interactions were organized into 24 distinct clusters (CL1-CL24). Among the clusters with the highest number of proteins, Cluster 2 (CL2) stands out, which is related to the generation of early metabolites and energy, containing 882 proteins. Cluster 1 (CL1), associated with the translation process, includes 624 proteins, while Cluster 4 (CL4), which covers carbohydrate metabolism processes, is made up of 614 proteins.
In the interaction network of the inoculated treatment, clusters related to plant defense were identified, such as Cluster 3 (CL3), which is associated with cellular redox homeostasis, Cluster 16 (CL16), which is related to the response to biotic stimuli, and Cluster 19 (CL19), which is related to defense against fungi. Cluster 22 (CL22) is involved in the biosynthetic process of secondary metabolites, while Cluster 23 (CL23) is specifically classified as a defense cluster, reflecting plant responses and adaptations. In addition, the analysis revealed the presence of 228 proteins classified as bottlenecks (supplementary table 4), 9 of which were identified as being more abundant in the NT samples. Among them, the homologous proteins CAB7-2 (Chlorophyll a-b binding protein, chloroplastic), ATPb (ATP synthase subunit beta) and Ca2 (Carbonic anhydrase) are grouped together in CL2. The protein A0A3Q7FFY2 (Photosystem II stability/assembly factor) is found in CL3. In CL4, the proteins A0A3Q7FSA0 (Pentose-5-phosphate 3-epimerase), SlFBA7 (Fructose-bisphosphate aldolase), A0A3Q7HGJ9 (Phosphoglycerate kinase) and AGPL3 (Glucose-1-phosphate adenylyltransferase) were grouped together. In CL7, the PIIF (Wound-induced proteinase inhibitor 1) protein was identified. In BiP L12 plants, 4 bottleneck proteins were detected, including the homologous protein Cyp-3 (Cysteine proteinase 3) in CL1 and the protein A0A3Q7F9X5 (Cytochrome c domain-containing protein) in CL2. The 2-CP2 (Thioredoxin-dependent peroxiredoxin) protein was identified in CL3 and the PMEU1 (pectinesterase inhibitor U1) protein in CL14. The interaction network also included 661 proteins considered to be hubs.
2.4. Immunodetection Validate the Higher Accumulation of Defense Proteins on BiP Transgenic Plants
Western blot analysis revealed significant differences in the accumulation of BiP, catalase (CAT), β-1,3-glucanase (PR2), and Chitinase (PR3) proteins between transgenic and NT plants under both inoculated and not-inoculated with M. perniciosa. The accumulation of BiP (~70 kDa) was consistently higher in transgenic plants compared to NT plants. NT plants exhibited low BiP accumulation regardless of inoculation. In transgenic plants, BiP accumulation was significantly higher, with the L12-I line showing the highest accumulation after inoculation (p < 0.05) (Figure 7A).
For catalase (~55 kDa), the lowest accumulation was detected in inoculated NT plants (NT-I), while higher accumulation was observed in non-inoculated NT plants (NT-NI). In transgenic plants, CAT accumulation was considerably higher, particularly in the L12-I and L9-I lines, which exhibited the highest accumulation after inoculation (p < 0.05) (Figure 7B). The accumulation of PR2 (~25 kDa) was significantly higher in the transgenic lines L9-I, L12-NI, and L12-I. In NT plants, the highest accumulation was observed in NT-NI, followed by NT-I (p < 0.05) (Figure 7C). The PR3 protein (~25 kDa) was detected in all samples, with the lowest accumulation observed in NT plants. In transgenic plants, PR3 accumulation was significantly higher, particularly in the L12-NI and L12-I lines (p < 0.05) (Figure 7D).
2.5. BiP Accumulation Is Related with Lower H₂O₂ Content and Higher Antioxidant Enzymes Activity in Plants
NT plants inoculated with M. perniciosa showed the highest accumulation of H₂O₂, in comparison to the observed in the inoculated transgenic lineages (p < 0.05). Among the transgenic lineages, L12 showed the lowest accumulation of H₂O₂, while L2 and L9 showed intermediate levels, but lower than those of the inoculated NT plants. In non-inoculated plants, the accumulation of H₂O₂ was consistently lower in all transgenic lineages (L2, L9 and L12) compared to NT plants (Figure 8A). We further analyzed hydrogen peroxide (H₂O₂) content using a histochemical test (DAB) confirming the quantitative data. In the non-inoculated treatment, the transgenic plants showed uniform and less pronounced staining, while the NT plants showed slightly more intense staining. After inoculation, the transgenic plants showed less intense coloration when compared to NT plants, where a greater accumulation of H₂O₂ was observed, as evidenced by the more pronounced brown coloration (Figure 8B).
We further analyzed the activity of enzymes known to be related with detoxification: (Superoxide dismutase (SOD), Guaiacol peroxidase (GPX) and with pathogen response: β-1,3-glucanase.
SOD activity showed significant variations between all transgenic lineages (L2, L9 and L12) and NT plants (Figure 9A) . Transgenic lineages L9 and L12 showed the highest SOD activities, being significantly higher than NT plants (p < 0.05) in non-inoculated or inoculation treatment. L2 lineages showed intermediate activity in both inoculated and non-inoculated plants, while NT plants showed the lowest levels of SOD in both conditions. Inoculation with M. perniciosa intensified SOD activity in the transgenic lineages, with significant increases compared to non-inoculated plants (p < 0.05).
Guaiacol peroxidase (GPX) activity (Figure 9B) followed a similar pattern to that observed for SOD. L12 lineages exhibited the highest GPX activity in inoculated plants, with a significantly higher value compared to NT plants (p < 0.05). In non-inoculated plants, lineages L9 and L12 also maintained high GPX enzyme activity, while NT plants showed the lowest values (p < 0.05). L2 lineage, although it showed increased levels of GPX in both conditions, had lower values than L9 and L12 lineages. Inoculation resulted in a significant increase in GPX activity in transgenic plants compared to non-inoculated plants (p < 0.05).
β-1,3-glucanase activity (Figure 9C) was considerably higher in inoculated transgenic plants compared to inoculated NT plants (p < 0.05). Lineage L12 showed the highest β-1,3-glucanase activity among all the lineages tested, followed by L9 and L2, which also showed significant increases compared to NT plants (p < 0.05). In non-inoculated plants, β-1,3-glucanase activity remained relatively stable and similar to the control, with no significant differences between transgenic and NT plants (p > 0.05)
3. Discussion
Overexpression of the molecular chaperone BiP in transgenic plants has been associated with the response to osmotic stress and drought tolerance by maintaining cellular homeostasis and delaying hypersensitive cell death [33;35;36;37]. Despite its association with abiotic stress, little is known about BiP’s role in plant resistance to biotic stress. The studies are mainly focusing on metabolic [38;39] and signaling pathways [40] that suffer modifications under BiP-accumulation and that could be related with the plant: pathogen interaction. In contrast, our study focused on the fundamental protein-composition modification imposed by BiP accumulation that could be related with plant resistance to fungal attack. For so, it was essential to first obtain transgenic Solanun lycopersicum plant, overexpreeing BiP, that presented acquired resistance to the very aggressive pathogen, M. perniciosa (Alcântara et al, 2024; submitted article).
M. perniciosa is a high-impact pathogen, responsible for plant death and reduced productivity. Infection by this fungus activates immune responses in plants, including the activation of defense proteins and the modulation of cellular signaling mechanisms, which are essential for controlling the infection and reducing damage [41]. The resistance observed in transgenic plants overexpressing BiP against M. perniciosa suggests that BiP accumulation may alter the plant's protein composition, enhancing its defense against the fungus.
The observation that the total number of proteins identified on transgenic and NT plants was similar suggested that BiP overexpression alone didn’t cause significant changes in the basic metabolic processes of plants. However, the protein composition was variable. NT plants showed a higher abundance of proteins related to energy metabolism, such as glyceraldehyde-3-phosphate dehydrogenase (GAPDH) and malate dehydrogenase (MDH), both playing a role in glycolysis, generating ATP and metabolic intermediates that are essential for cell survival. In addition, under oxidative stress, this protein can undergo oxidative post-translational modifications (oxPTMs), such as sulfenylation and nitrosylation, which redirect its function towards cell signaling. These changes allow it to act in processes such as the response to oxidative damage and the regulation of apoptosis, highlighting its relevance as a mediator of cellular responses to stress [42]. MDH, a member of the citric acid cycle, contributes to the production of NADH, which is essential for the continuity of metabolic flows and for maintaining the reducing power in cells [43]. This activity must be important for NT plants, allowing them to meet normal metabolic demands and face the challenges imposed by environmental stresses. In addition, proteins related to structural and genomic regulation have been identified, such as histone H2A and the RING-type domain-containing protein indicating a greater control over DNA compression and protein regulation by ubiquitination, fundamental processes for maintaining cellular balance [44;45]. In contrast, in transgenic plants proteome BiP stood out, evidencing the overexpression of this chaperone. In addition, the increased abundance of proteins such as triosephosphate isomerase (TPI), a crucial enzyme on glycolyses, and 14-3-3 domain-containing protein, involved in cell signalling processes, indicated adjustments in metabolism and cell signaling. Together, this result suggests that different pathways, related to cell maintenance and immune responses in plants, are triggered on BiP-transgenic plants [46;47] even in the absence of stressors. Indeed, it has been reported that the acquired tolerance to drought on transgenic plants overexpressing BiP [33] is somehow related with the UPR (Unfolded protein response) pathway, which induces ER-associated quality control genes to promote the restoration of ER homeostasis [48,49,50,51,52,53]. In so, BiP-mediated resistance to M. perniciosa must be linked to its capacity to modulate stress mediated cell death pathways negatively [51;54] as well as others pathways related to stress, giving the plant an advantage in responding to stressors once they appear.
After M. perniciosa inoculation, protein profiles revealed different strategies adopted by NT and BiP-transgenic plants. In NT plants, proteins that play key roles in the stability and functionality of photosystem II stood out, such as the ATP synthase subunits (Δ and ε) [55], the 23 kDa subunit proteins (PsbP) and PSB27-H1. PsbP contributes to the efficiency of water photolysis, [56] while PSB27-H1 helps repair PSII under stress [57]. Further, the presence of ribose-5-phosphate isomerase reinforces the importance of the pentose pathway, which is essential for nucleotide synthesis and cell regeneration [58], highlighting the need for greater energy input to cope with biotic stress. On the other hand, when challenged with M. perniciosa, BiP-transgenic plants protein profile showed a metabolic direction aimed at energy mobilization and the maintenance of cellular homeostasis, as Glycinamide ribonucleotide synthetase [59], sucrose-phosphate synthase [60;61] and peptidyl-prolyl cis-trans isomerase [62]. These proteins are mainly related with production of nucleotides necessary for cell development, sucrose production and to provide additional energy contributing to signaling and metabolic support under stress and protein folding, even under pathogen infection [62]. The biological process of the proteins confirmed these differences, indicating that NT plants prioritize photosynthetic processes to maintain basic energy flows, while BiP-transgenic plants adjust their energy metabolism and cell repair mechanisms.
We further analyzed specific proteins related with plant defense mechanism, as PRs and antioxidant enzymes. The higher abundance of defense proteins in BiP- transgenic plants suggests that they have a pre-established state of defense, even in the absent of infection, witch is usually characterized by the basal activation of responses mechanisms to biotic and oxidative stress. In others pathossystem, this state of metabolic alert enables the early activation of proteins associated with the recognition of pathogen molecular signals, even before direct contact with the infectious agent, contributing to a faster and more effective response [63;64]. In fact, it has been already shown that BiP accumulation in transgenic Arabdopsis thaliana and Glycine max promotes a delay in the perception of stress symptoms in plants and negatively regulates the process of programed cell death (PCD) [35;54]. The higher accumulation of peroxidase and wound-induced proteinase observed on NT plants, in the absent of M. perniciosa, suggests that even in control conditions NT plants are dealing with a molecular stressfuller situation in comparison to BiP transgenic plants [65;66]. We decided to further quantificate antioxidant enzymes activities in 3 different BiP-trangenics lineages (L2, L9 and L12) to evaluate if the mechanism was conserved between the lineages. The observation that all BiP-transgenic lineages tested presented a higher activity of catalase, GPX and SOD, in the absent or during M. perniciosa infection, brings the notion that under BiP accumulation plants have an improved ability to eliminate ROS. This mechanism must be especially important to plant defense against M. perniciosa, once the production of ROS, including superoxide and hydrogen peroxide, was already reported to act as an initial barrier to limit the progression of witches’ broom disease [67,68,69]. The quantification of hydrogen peroxide in plants validated the proteomic data, once the NT plants had the highest levels of hydrogen peroxide, while transgenic plants exhibited significantly lower levels, both in inoculated and non-inoculated conditions.
The mass spectrometry revealed also that others proteins related specific to plant defense mechanisms were more abundant on BiP transgenic plants, even in the absent of M. perniciosa, as RRL-RLP Leucine-rich repeat-containing protein, PR-10 and PR1. RRL-RLP Leucine-rich repeat-containing protein in others pathosystems is recognized for its function in immunity triggered by pathogen-associated molecular patterns (PAMP-Triggered Immunity, PTI), allowing the recognition of conserved structures, such as flagellins in bacteria and chitins in fungi [70]. Its lower abundance in NT plants may indicate a limitation in the efficiency of the immune response to infectious agents. Interesting, the pathogenesis related proteins PR-10 and PR-1 was already reported to be part of a defense dynamics that occur in cocoa plants during the interaction with the fungus M. perniciosa [69;71]. In witches’ broom, PR10 contributes to the inhibition of M. perniciosa replication and facilitates the plant's defense response against infection [72] while PR1 is associated with the plant immune response, playing key roles in the recognition of pathogens and the activation of defense responses [73;74]. In so, the highest level of this PRs proteins on transgenic plants must be giving a molecular advantage to face M. perniciosa infection, or any other stressfull situation, strengthening the plant defensive capacity and may prepare the plant to deal more effectively with future aggressions, in the long term. When challenged with M. perniciosa, BiP transgenic plants presented an even higher abundance of defense proteins as PR1, PR 2 (glucan endo-1,3-beta-D-glucosidase), PR3 (chitin-binding type-1 domain protein) and PR10. These PR proteins may act as antimicrobial agents and modulators of the cellular environment, creating unfavorable conditions for the growth and spread of the pathogen [75]. The higher accumulation of PRs protein was also confirmed when we quantificate the activity of glucanase (PR2) and by western blot assay (PR 1 and PR10). The higher accumulation of PRs after M. perniciosa inoculation reinforces the role of BiP in promoting the production of defense-related proteins which is essential for the replication and protein synthesis of the invaders [72;76]. The study by Santos et al. (2023) revisits the molecular mechanisms of the interaction between T. cacao and M. perniciosa, highlighting the role of proteins such as PR1, PR2, PR10, peroxidase and superoxide dismutase (SOD) in the defense against the pathogen, suggesting that these proteins was promising biotechnological targets for genetic engineering programs aiming resistance to witches’ broom disease. Similarly, the present study with BiP-transgenic plants also identified key proteins associated with defense, such as PRs and antioxidants, corroborating the importance of these elements in modulating the response to oxidative stress and defense against fungal infections. These findings open new perspectives for the use of BiP as a biotechnological tool in the development of cocoa cultivars more resistant to M. perniciosa, with implications for disease control. Further studies, including investigations into the specific molecular mechanisms involved in resistance, are needed to clarify the role of BiP in the plant-pathogen interaction and to explore its potential in other crops susceptible to fungal diseases.
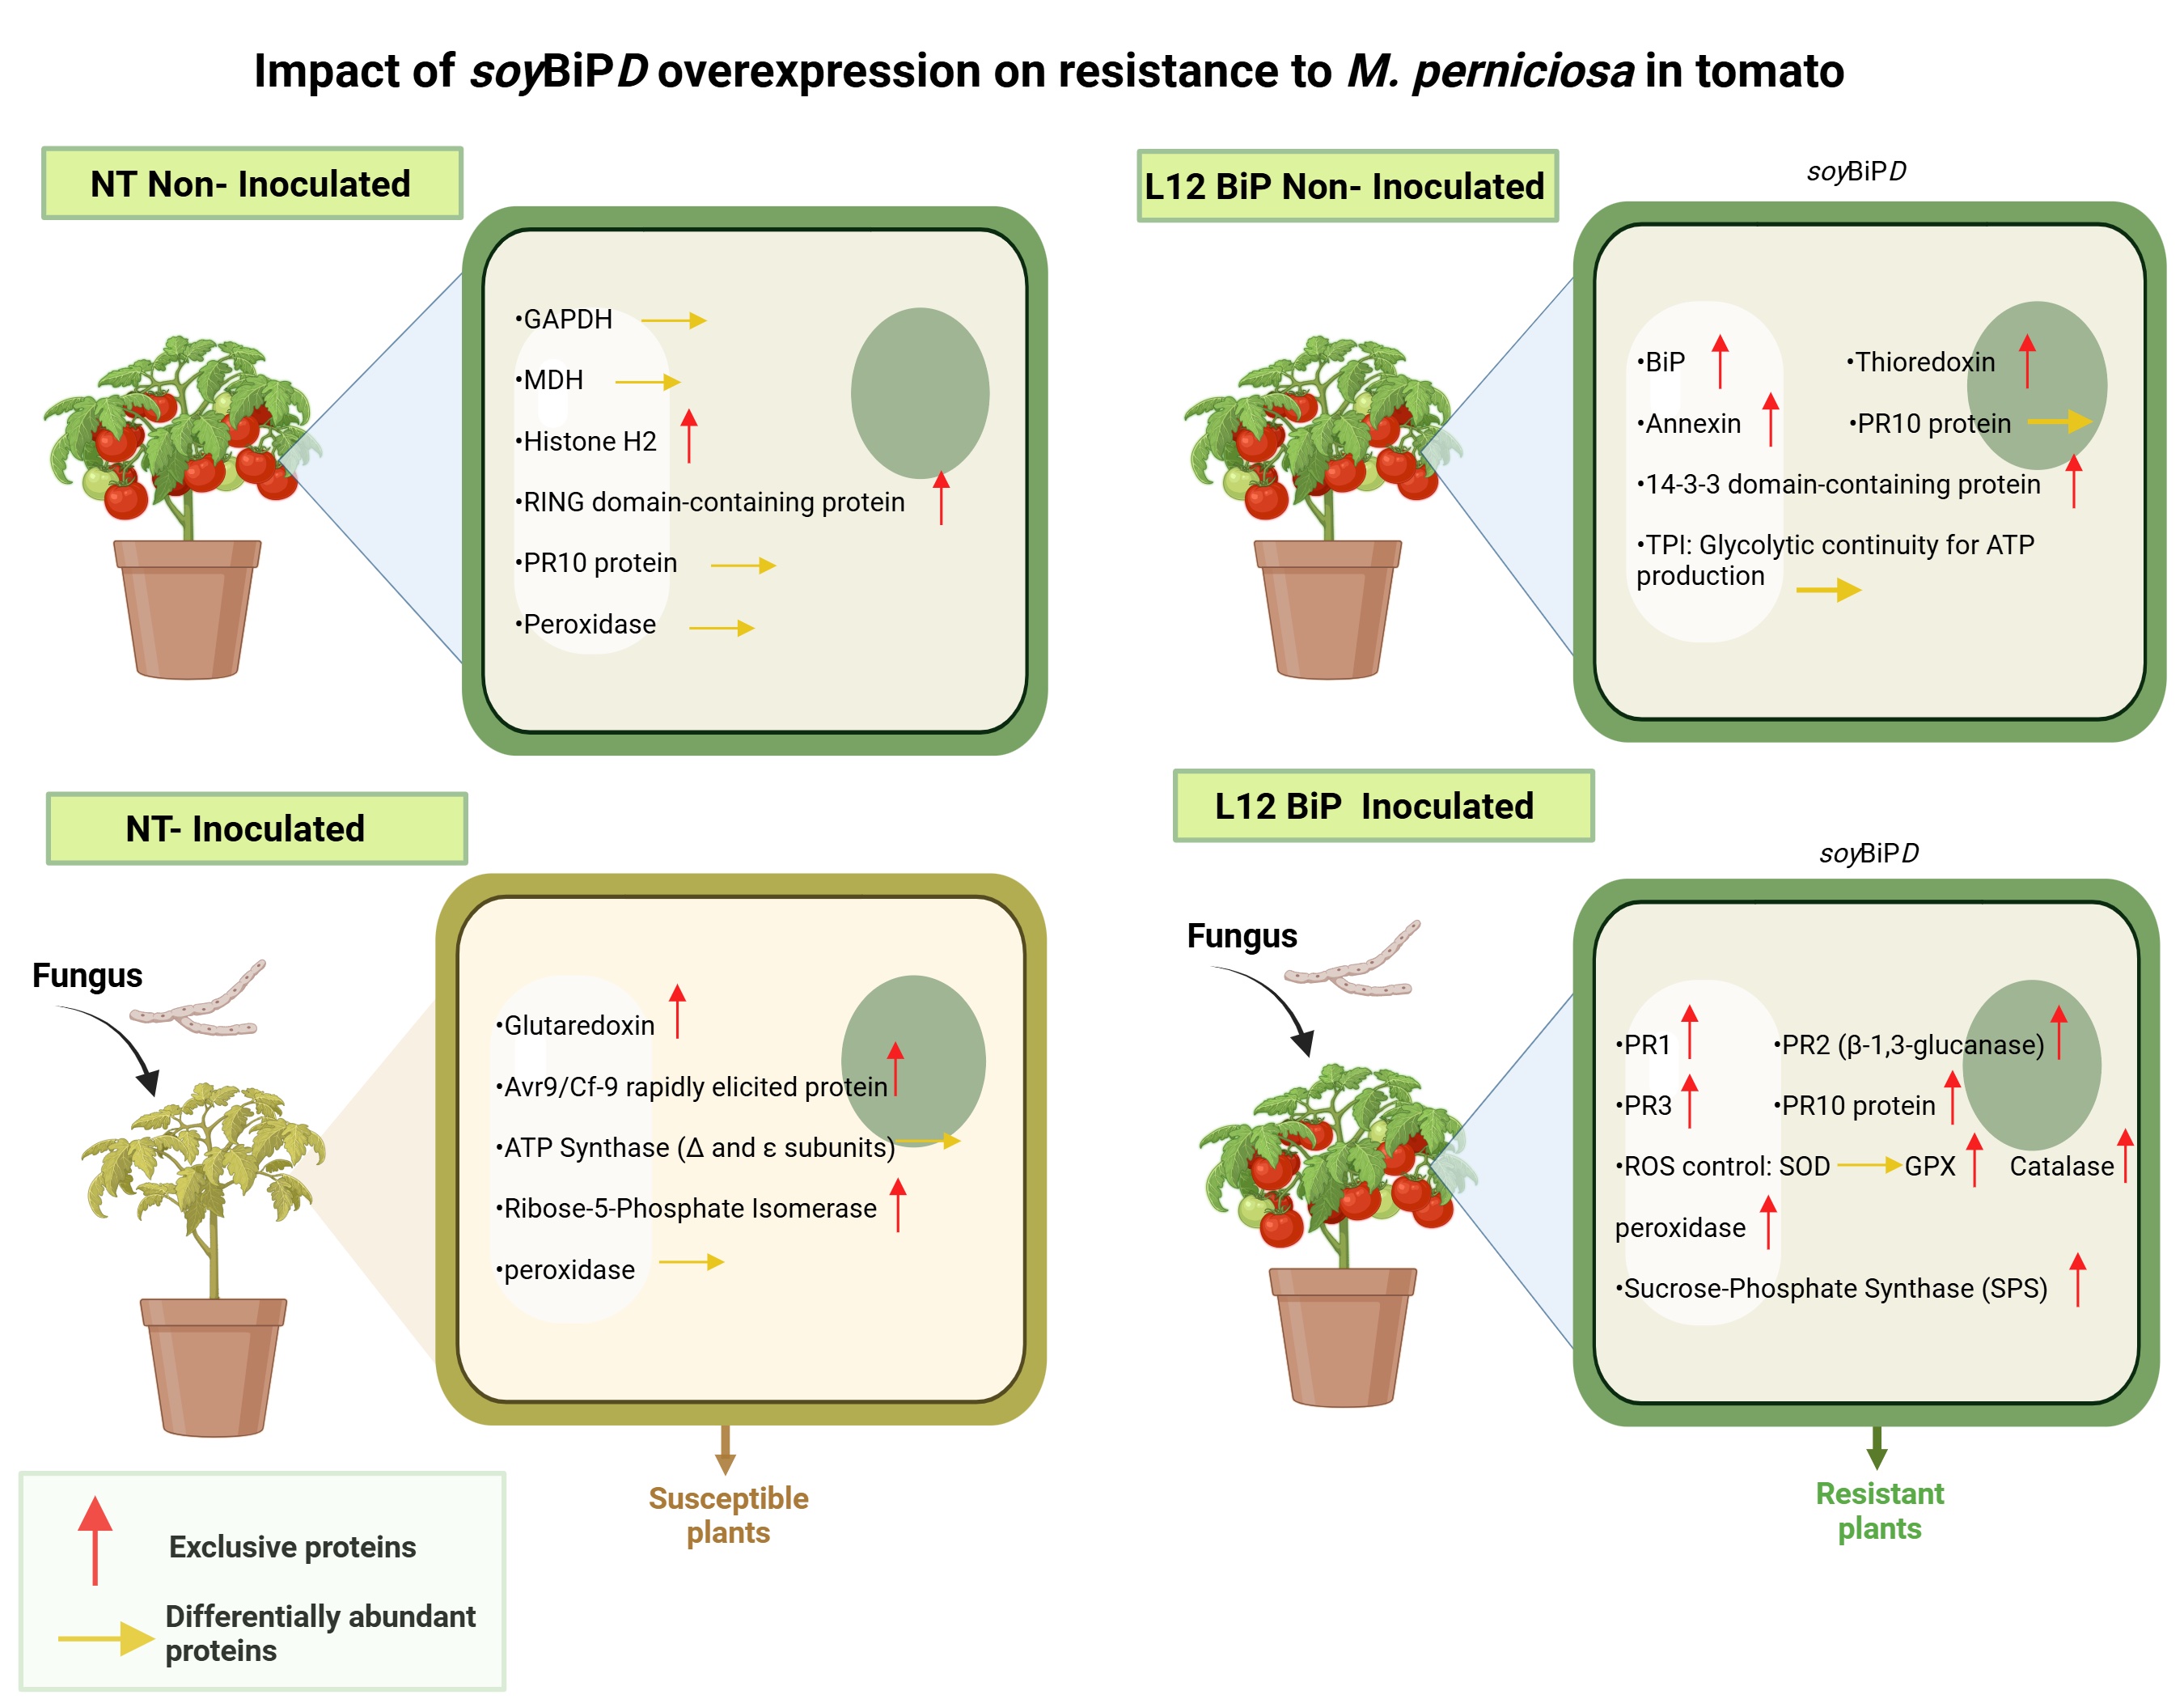
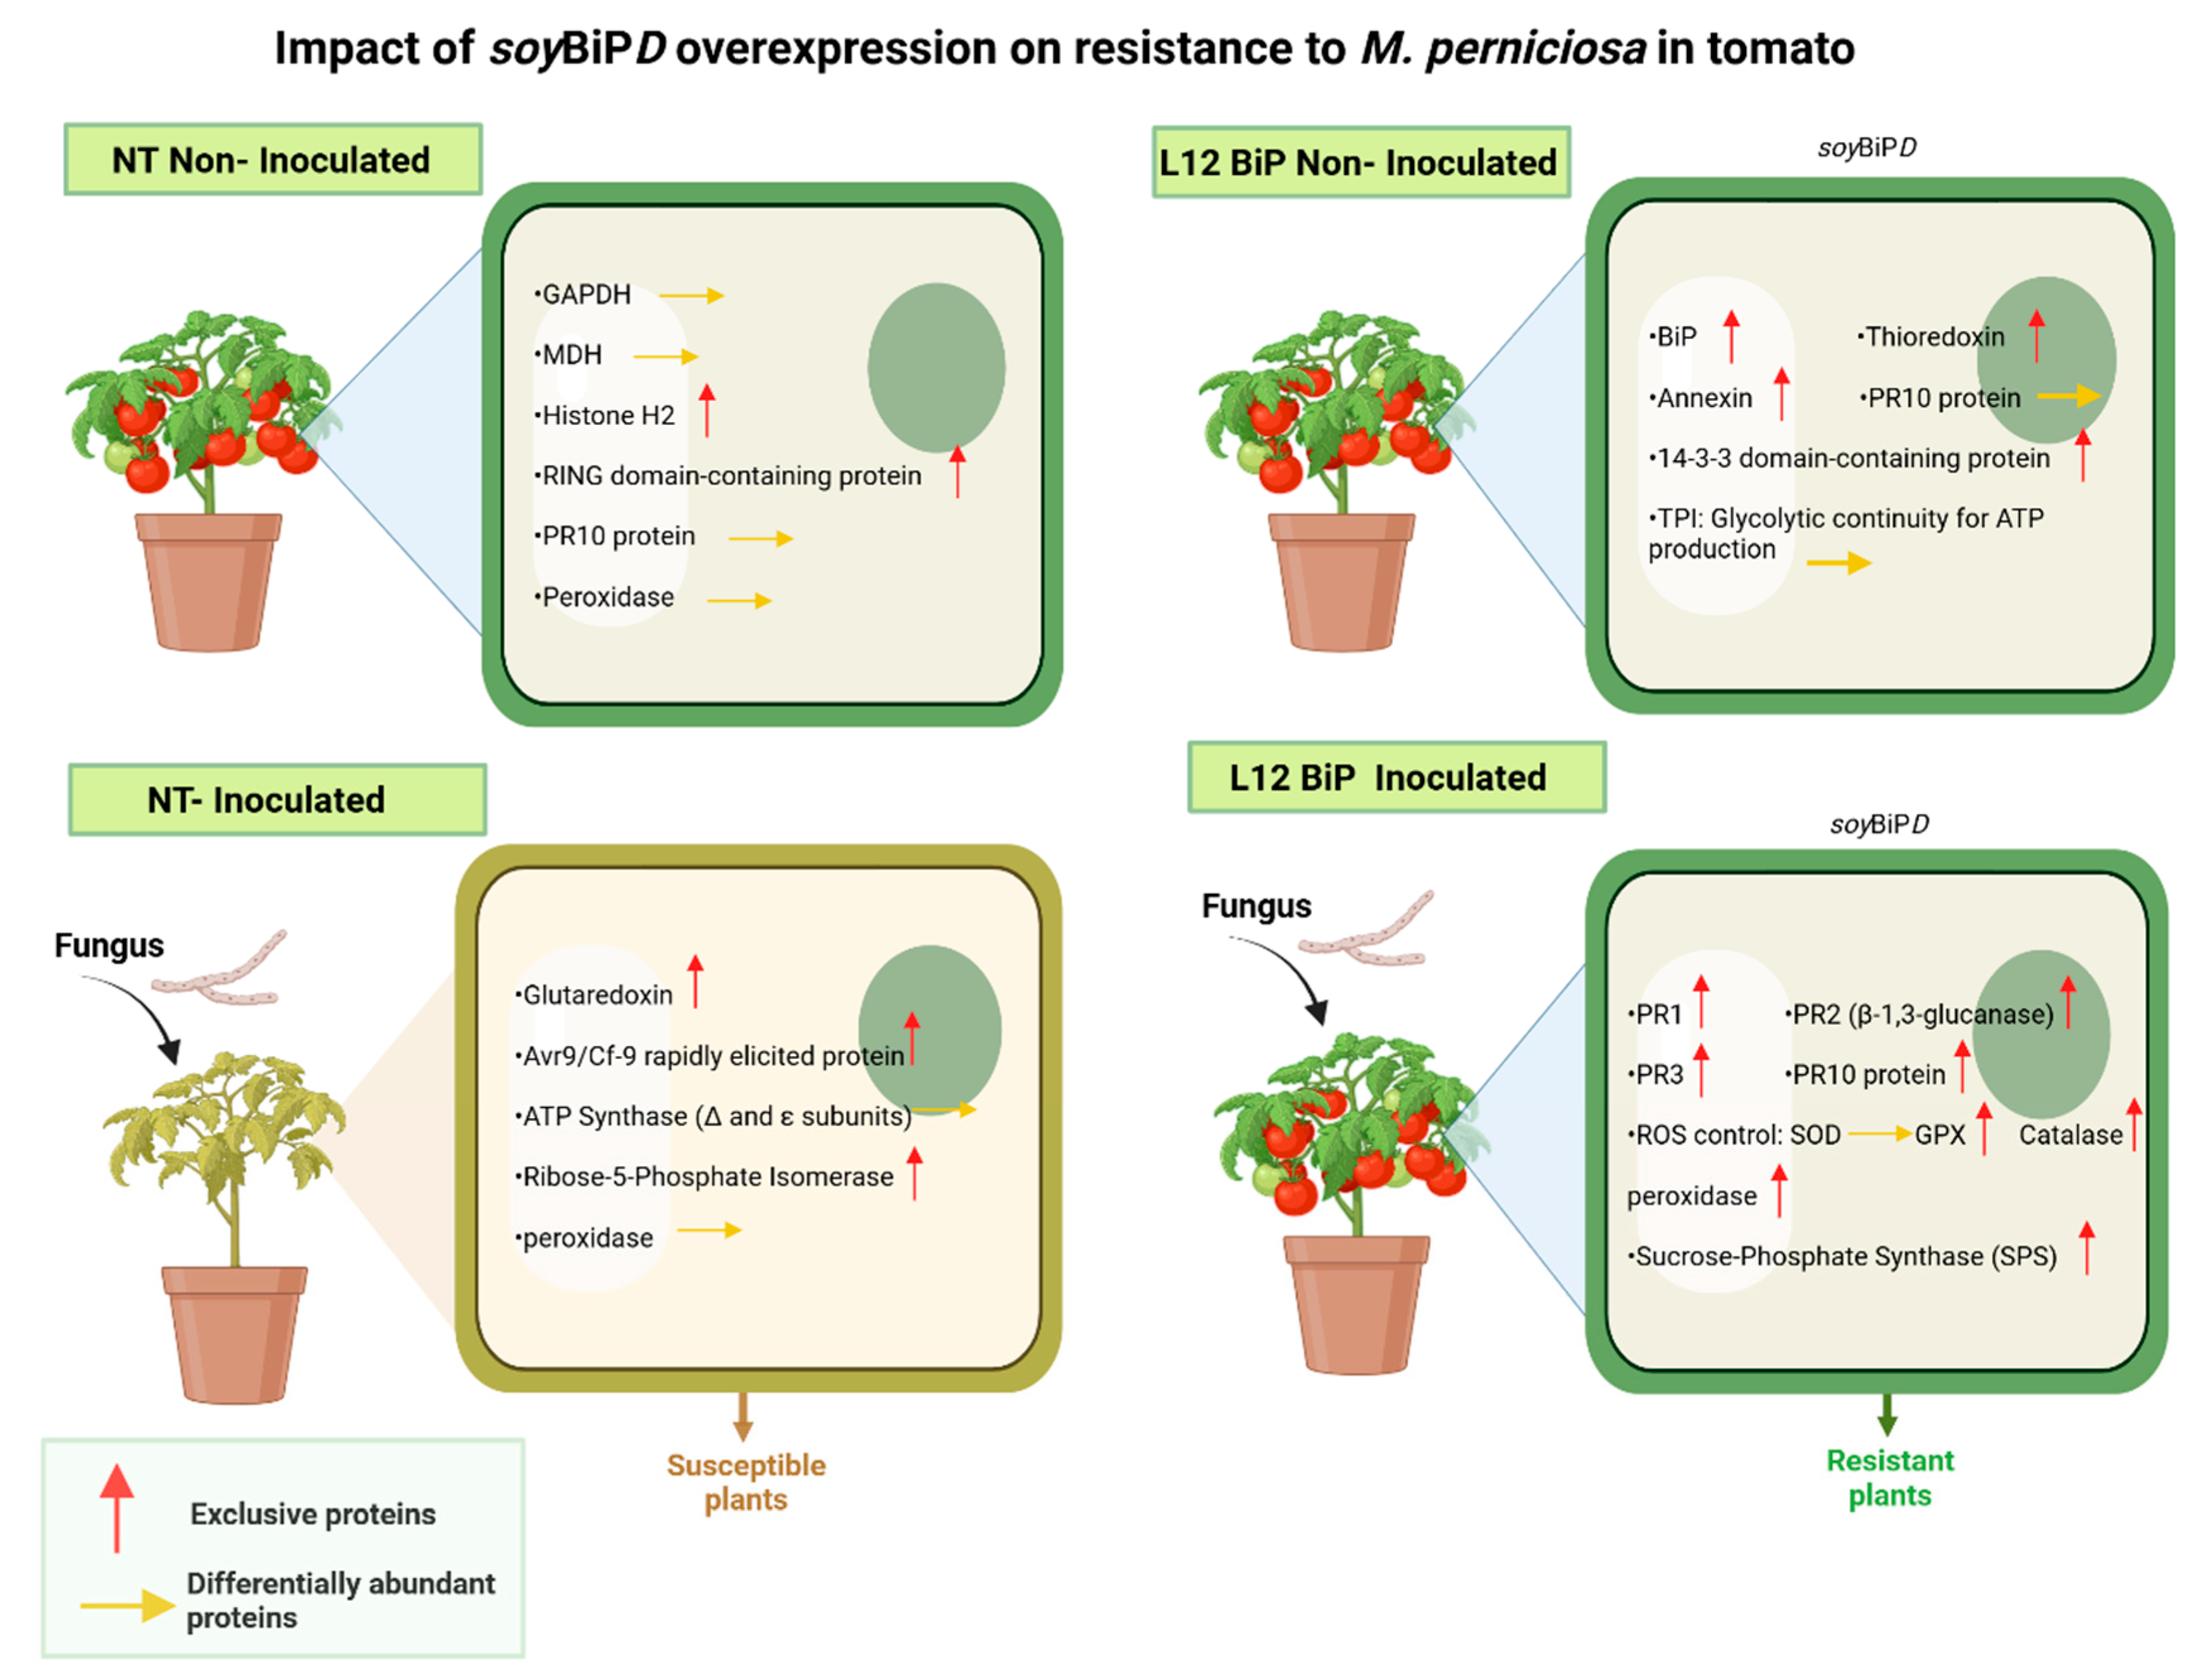
Figure 10.
Biological model of the impact of SoyBiPD gene overexpression on the proteome of tomato (S. lycopersicum) under non-inoculated and M. perniciosa-inoculated conditions. NT (non-transformed) and transgenic lines (L12 BiP), with and without inoculation with Moniliophthora perniciosa. (NT without inoculation) General condition: Basal activity focused on basic metabolic functioning. (L12BiP without inoculation) General condition: Enhanced pre-established defense with metabolic and redox readiness, providing greater initial response capacity. (NT inoculated) General condition: Dependence on photosynthetic processes with limited oxidative and local defensive responses. (L12BiP inoculated) General condition: Robust systemic response integrated with the activation of multiple defense mechanisms, offering greater efficiency in combating the pathogen and protecting plant tissues.
4. Materials and Methods
4.1. Obtaining Transgenic Plants with soyBiPD Gene
Tomato plants (S. lycopersicum cv. Micro-Tom) was transformed, via Agrobacterium tumefaciens), with a cDNA sequence from the soyBiPD gene (GenBank accession number AF031241) [33]. Expression is controlled by the CaMV35S promoter and an enhancer of the alfalfa mosaic virus (AMV) sequence, followed by the terminator sequence of the nopaline synthase (nos) (supplementary Figure 1). Molecular diagnosis of the transgenes was carried out by polymerase chain reaction (PCR) using specific primers for the nptII gene (neomycin phosphotransferase) (supplementary Figure 2).
4.2. Plant Inoculation with M. perniciosa
Seeds from BiP-transgenic plants (lineage L2, L4, L9, L10 and L12), as well as untransformed plants (NT), were germinated directly in pots containing commercial Plantmax®. Twenty days after germination, the leaves were reduced to 1/3 of their size and the apical meristems of the seedlings were inoculated with 20 µl of M. perniciosa basidiospore suspension (containing 5x10⁵ spores/mL of the inoculum with in vitro spore germination >80%). Basideospores were previously produced from M. perniciosa isolated from Solanum stipulaceum (Caiçara), obtained at CEPLAC/CEPEC, Bahia, Brazil. Seven replicates of each transgenic lineage and not transgenic plants (NT) were inoculated with the spores and the same number of plants were inoculated with ágar: water to serve as control. Plants were kept in a humid chamber (relative humidity >80% and temperature around 25°C± 1°C). After 48h the plants were transferred to a greenhouse where they remained until the end of the experiment. Plant samples for enzymatic and proteomic assays were collected at 15 (for hydrogen peroxide analyses), 45 (mass spectrometry analyses) and 45 days (western blot and enzymatic analyses) after inoculation. The experimental design was entirely randomized.
4.3. Proteomic Analysis
4.3.1. Total Protein Extraction for Mass Spectrometry Analysis
Total proteins were extracted [77] (with modifications) from three biological replicates of freeze-dried S. lycopersicum tomato leaves, both from untransformed plants (NT) and from the L12 transgenic lineage, under control conditions (inoculated with agar:water) and 45 days after inoculation with M. perniciosa basidiospores. The choice of lineage L12 was based on a previous study in which this lineage presented the highest accumulation of BiP and no witches’ broom disease symptom after M. perniciosa inoculation (Suplement material Figure 3). Protein extraction started with the maceration of 0.8g of the plant material in liquid nitrogen containing polyvinylpyrrolidone (PVP). Sequential washes were carried out followed by centrifugation at 10,000G for 15 minutes at 4°C for each stage: three washes with 100% acetone, followed by three washes with 80% acetone, two washes with TCA (trichloroacetic acid) in acetone and two washes with TCA in water. The tissue was then re-suspended in 1 mL of extraction buffer containing 500 mM Tris-HCl, 100 mM KCl and 2% (w/v) β-mercaptoethanol. Homogenization was carried out in a vortex for 15 minutes. 1 mL of phenol was added to the samples which were homogenized in a vortex for 10 minutes, followed by centrifugation at 10,000 g for 15 minutes at 4°C. The supernatant was carefully transferred to a new tube and the procedure was repeated for a second clean-up with phenol. To precipitate the proteins, the tubes containing the supernatant were added to five times the volume of ammonium acetate with methanol and incubated at -20°C overnight. The proteins were recovered by centrifugation at 10,000 g for 15 minutes at 4°C and re-suspended in 400 µL of 8M urea for subsequent analysis. Protein quantification was carried out using the 2-D Quant Kit according to the manufacturer's instructions (GE Healthcare), and different concentrations of bovine serum albumin (BSA) were used as a standard to generate a standard curve for quantifying the samples. 40 μg of each sample was resolved in SDS-gel (Sodium Dodecyl Sulfate - Polyacrylamide Gel Electrophoresis) using a electrophoresis mini cubes (HOEFER) with 8 × 10 cm gels containing 12.5% acrylamide (LAEMMLI, 1970). Protein profile were visualized after gel staining with 0.08% colloidal Comassie (NEUHOFF et al., 1988) (Supplementary Figure 2).
4.3.2. Gel-Free Mass Spectrometry Analysis
The peptides from the untransformed plant samples (NT) and the transgenic lineage (L12), both non-inoculated and inoculated with M. perniciosa, were digested with Tripsin and desalted using C18 resin tips (100 µL; Thermofisher®). The peptides were eluted with 50 µL of a solution containing 75% acetonitrile, 25% water and 0.1% formic acid, optimized to ensure maximum recovery and solubility of the peptides.
The peptides were separated on an Agilent 1290 Infinity II HPLC system equipped with a C18 reverse phase column (AdvanceBio Peptide Mapping 2.1 x 250 mm; Agilent) maintained at 55°C. A 20-minute elution gradient was applied using mobile phases A (H2O and 0.1% formic acid) and B (acetonitrile and 0.1% formic acid), with the following proportions of phase B: 5% to 35% (1-10 minutes), 35% to 70% (11-14 minutes), 70% to 100% (15-18 minutes) and 100% (18-20 minutes), followed by a 5-minute column stabilization period. The samples were injected in triplicate to ensure reproducibility of the results.
Mass spectrometry analysis was carried out on an Agilent 6545 LC/QTOF spectrometer operating in Auto MS/MS acquisition mode with selection of up to 10 precursors per cycle. The precursor selection criteria were: detection limit of 1,000, 10,000 counts/spectrum, purity restricted to 100%, purity cut-off at 30%, isotopic model for peptides and charge preference for 2, 3, >3 and unknown charge. The collision energy was adjusted according to the formula (slope)*(m/z)/100 + Offset, with slope and Offset values ranging from 3.1 to 5 and from -4.8 to 10, respectively, depending on the charge of the precursor. The instrument parameters were: ionization gas temperature at 325°C, gas flow at 13 L/min, capillary voltage at 4,000 V and skimmer voltage at 56 V. Collision-induced dissociation (CID) was carried out with nitrogen gas. System control and parameter configuration were carried out using Agilent MassHunter Acquisition software.
4.3.3. Identifying Peptides in Protein Banks
The mass spectra obtained were processed in triplicate for peptide identification using Spectrum Mill software (Rev B.06.00.203 SP1; Agilent). The spectra were extracted using the following parameters: MS noise threshold of 10 counts, fixed carbamidomethylation modification, precursor mass range of 200 to 6000 Da, retention time tolerance of ± 60 seconds and m/z tolerance of ± 1.4. The precursor charge was determined automatically. After extracting the MS/MS spectra, a search was carried out in UniProt's S. lycopersicum database (https://www.uniprot.org). The parameters for comparing the MS/MS spectra were: maximum number of missed cleavages of 4; fixed modification of carbamidomethylation (C); variable modifications of oxidized methionine (M), pyrrolidonecarboxylic acid (N-terminal Q), deamidation (N), phosphorylation of serine (S), threonine (T) and tyrosine (Y); minimum combined peak intensity of 10%; and precursor mass tolerance of ± 10 ppm. The search results were validated and filtered, selecting only peptides with a false discovery rate (FDR) of less than 1%. The final results were exported in protein-protein comparison format, in the MPP APR file.
Statistical analysis to identify proteins with differential abundance was carried out using Mass Profiler Professional 15.1 software (MPP; Agilent). The abundance of each protein was estimated by the median abundance of its identified peptides. For each treatment, a comparative experiment was carried out, where the data from the triplicates of control group were contrasted with the triplicates of the respective treated group. Initially, the proteins were filtered based on the frequency of their peptides, retaining only those identified in 100% of the triplicates in at least one of the conditions (control or treatment). The statistical significance of the difference in abundance between the groups was assessed using the unpaired T-test, with asymptotic calculation of p-value and correction for multiple tests using Benjamini-Hochberg method. Proteins were considered to be differentially expressed when they had a p-value of less than 0.05 and a fold-change greater than 1.5 (in module). A comparative analysis was carried out between the treatments to identify unique proteins with differential abundance. The comparisons included NT samples not inoculated with the fungus versus non-inoculated L12 BiP samples, and inoculated NT samples versus inoculated L12 BiP samples. The results were visualized using principal component analysis (PCA), a Venn diagram and a heat map, generated automatically in MPP. For the PCA and Venn diagram, all identified proteins were considered. Only proteins that met the criteria for statistical significance (p-value < 0.05 and |fold-change| > 1.5) were included in the heat map. The parameters used to construct the heat map were: normalized intensity values, Euclidean metric distance and Ward's linkage method.
4.3.5. Interaction Networks
The protein interaction networks were built using STRING 12.0 software (http://www.string-db.org). The following parameters were applied: reference organism S. lycopersicum; sources of interaction evidence: co-expression, experiments, databases and co-occurrence; maximum limit of 50 interactions per protein; and confidence level of 0.7. The subgraphs generated were combined using the Cytoscape 3.10.2 software (http://www.cytoscape.org) [78] and the network fusion tool to generate the final networks. The analysis of gene clustering by gene ontology was carried out using the BiNGO (Biological Network Gene Ontology) plugin for Cytoscape, available at http://www.cytoscape.org [79]. The degree of functional enrichment for each cluster and ontology category was assessed quantitatively (p-value) using a hypergeometric distribution. A correction test for multiple comparisons was applied using the false discovery rate (FDR) algorithm, implemented in the BiNGO software. Categories of significantly enriched biological processes (p < 0.05 after correction by FDR) were identified and reported.
4.4. Western Blot
To validate the data obtained by mass spectrometry, immunodetection tests were carried out. In addition to L12 lineage, L2 and L9 transgenic lineage were also used. 40 μg of leaf protein isolated from NT and the transgenic lineages, both under control conditions and 45 days after M. perniciosa inoculation, were separated in a 12,5% SDS-polyacrylamide gel, using a pre-colored molecular weight marker (Kaleidoscope, Bio-Rad) as a reference. The proteins were transferred to nitrocellulose membranes (Bio-Rad) in transfer buffer (25 mM Tris, 0.2 M glycine, 10% methanol) for 1 hour and 20 minutes at 250 mA. Transfer efficiency was checked by staining membrane with Ponceau, followed by washing with Tris-buffered saline (TBS; 20 mM Tris, 150 mM NaCl, pH 7.4). Membranes were blocked with a solution of 10% skimmed milk in TBS containing 0.05% Tween-20 (TBS-T) for 12 hours at room temperature. The membrane was then incubated with the specific primary antibodies for the proteins of interest: BiP (anti-BiP), catalase (anti-CAT), PR2 (anti-PR2) or Chitinase PR3 (anti-PR3), for 1 hour under agitation. After washing with TBS-T, the membrane was incubated with secondary antibody conjugated to alkaline phosphatase (rabbit anti-IgG) for 1 hour at room temperature. The signal was detected using the substrate solution BCIP/NBT (5-bromo-4-chloro-3-indolyl phosphate/nitro blue tetrazolium) in Tris buffer pH 9.5, until the bands were visualized. The accumulation of referred proteins was further quantified from the membrane images using Gel Quant Net 1.8.2 software.
4.5. Determination of H2O2 on Plants
5 Leaf discs from NT and transgenic lineages (L2, L9 and L12), inoculated or not with M. perniciosa, were isolated from the third fully expanded leaf, 15 days after inoculation, and were subjected to histochemical staining with DAB-HCl (3,3'-diaminobenzidine) [80]. The leaf disks were photographed under a stereoscopic microscope (Leica EZ4) at 4x magnification. The intensity of the brown color, resulting from the reaction of DAB with H2O2, was considered indicative of the hydrogen peroxide content present in the tissue. As a negative control, leaf disks were infiltrated with a solution of water and HCl at pH 3.8 and subjected to the same washing and fixing procedure. The quantification of hydrogen peroxide (H2O2) was performed using a colorimetric assay with potassium iodide (KI), adapted [81]. Extracts were prepared from a pool of lyophilized tomato leaves, comprising five biological replicates from non-transformed plants (NT) and transgenic lines (L2, L9, and L12), under both control conditions and after inoculation with M. perniciosa. The colorimetric reaction was performed with 475 µL of KI and 100 µL of 100 mM potassium phosphate buffer (pH 7.5) were mixed with 25 µL of H2O2 sample or standard. Tha absorbance was measured at 390 nm using a microplate spectrophotometer (Spectramax Paradigm, Molecular Devices) with the SoftMax Pro 6.3 software. Data were subjected to analysis of variance (ANOVA), and treatment means were compared using Tukey's test at a 5% significance level (p < 0.05).
4.6. Enzymatic Activities
4.6.1. Preparation of Enzymatic Extracts
Enzyme extracts were prepared from freeze-dried Micro-Tom tomato leaves, using a pool of 5 biological replicates of control plants (NT) and transgenic lineages (L2, L9 and L12), both under control conditions and 45 days after stress with M. perniciosa. 40 micrograms of freeze-dried leaf were macerated in liquid nitrogen in the presence of polyvinylpyrrolidone (PVP). 800 µL of the extraction buffer (variable according to each enzyme) was added and samples were homogenized by sonication with a probe ultrasonicator (Gex 130, 130 W) at an amplitude of 70%, in cycles of 5 seconds of pulse and 10 seconds of break. The samples were then centrifuged at 13,400 rpm for 10 minutes at 4 °C. The supernatant (crude extract) was used immediately in the enzymatic assays and analyzed on a microplate spectrophotometer (Espectramax Paradigm, Molecular Devices) using SoftMax Pro 6.3 software.
4.6.2. Guaiacol Peroxidase (GPX)
GPX activity was assessed spectrophotometrically, following the method described by [82]. 140 µL of the mix solution (130 µL of 50 mM sodium phosphate buffer with pH 6.0 and 10 µL of crude enzyme extract) and 140 µL of the reaction buffer solution (125 µL of 40 mM guaiacol, 50 µL of 0.06% H2O2 and 10 µL of phosphate buffer 50 mM sodium, pH 6.0, made up to 25 mL with distilled water). The absorbance was measured in quadruplicate at 470 nm, at 25°C, for 3 minutes, with readings every 30 seconds. The consumption of guaiacol, which reflects the activity of GPX, was calculated using the linear regression equation y = 0.01890 + 1284x, obtained from a standard curve of peroxidase (POD) with guaiacol. The results were expressed in mmol h-1 g-1 of dry matter (DM).
4.6.3. Superoxide Dismutase (SOD)
SOD activity was determined spectrophotometrically, following the method described by [83] (with modifications). The mix was made with 50 mM potassium phosphate buffer, pH 7.8, containing 1 mM EDTA and 130 mM methionine). Then, 50 µL of the crude enzyme extract was added to the microplate. The reaction was initiated by adding 20 µL of 750 mM Nitrobluetetrazolium (NBT) and 20 µL of 1 mM riboflavin. The absorbance was measured in quadruplicate at 560 nm at 25°C. The first reading was taken after 5 minutes of incubation in the dark, followed by additional readings at 10, 15 and 20 minutes of incubation under 20W fluorescent light. SOD activity was expressed as the amount of enzyme required to inhibit 50% of the photochemically induced NBT reduction. Each sample was analyzed in quadruplicate.
4.6.4. β-1,3-. Glucanase
The activity of β-1,3-glucanase was determined spectrophotometrically, adapting the method described by [84]. 400 µL of 50 mM sodium acetate buffer (pH 5.0), 200 µL of enzyme extract and 200 µL of CM-Curdlan-RBB substrate were added. The resulting mix was incubated at 37°C in a water bath for 2 hours. The reaction was stopped by adding 200 µL of 2N HCl, followed by cooling in an ice bath for 10 minutes. The absorbance of the supernatant was measured in triplicate at 600 nm in a spectrophotometer. The activity of β-1,3-glucanase was expressed in units per milligram of protein (U/mg), where one unit corresponds to the amount of enzyme that releases 1 µmol of glucose equivalent per minute, under the assay conditions. A standard curve was constructed with glucose to quantify the reducing sugars released in the reaction.
4.6.5. Experimental Design and Statistical Analysis
The experiment was conducted in a completely randomized design. The data was submitted to analysis of variance (ANOVA), and the means of treatments were compared using Tukey test at 5% significance level (p < 0.05).
5. Conclusions
In this study we report that overexpression of the soyBiPD gene in tomatoes (Solanum lycopersicum) conferred greater resistance to the pathogen Moniliophthora perniciosa. While the NT plants succumbed to the infection, showing severe symptoms that culminated in complete death, the transgenic lines L9, L10 and L12 remained asymptomatic throughout the experiment. This difference is strongly associated with the greater accumulation of BiP, which contributed to cellular homeostasis, reorganizing damaged proteins and modulating defense pathways. Proteomic analyses showed that, even under normal conditions, overexpression of BiP gave the transgenic plants a pre-activated state of defense, preparing them to respond more efficiently to future stresses. In response to inoculation, the transgenic plants showed a prioritization in the production of defense proteins such as PR2, PR3 and PR10. Another highlight was the superior efficiency of the L12 BiP plants in managing the accumulation of ROS, which is essential for preventing oxidative damage and maintaining the redox balance. Antioxidant proteins such as peroxidases and PRX, together with the activities of SOD, GPX and catalase, showed a more robust antioxidant system in the transgenic plants. In contrast, the NT plants showed high levels of hydrogen peroxide, indicating less efficiency in controlling ROS. These results demonstrate the biotechnological potential of this gene for the development of more disease resistant crops. The combination of enhanced basal defense, adjusted metabolic responses and efficient antioxidant systems demonstrate that transgenic plants are a promising strategy for tackling biotic challenges in species of agricultural interest, such as cocoa, broadening the prospects for sustainable management against devastating pathogens.
Supplementary Materials
The following supporting information can be downloaded at the website of this paper posted on Preprints.org.
Author Contributions
All authors contributed to the conception and design of the study. GA: Data curation, Formal analysis, Investigation, Methodology, Writing. GS: Investigation, Methodology, Writing. IO: Investigation, Methodology. AK: Investigation, Methodology. KG: Investigation, Methodology, Writing. CP: Investigation, Methodology, Supervision, Writing. FA: Conceptualization, Funding acquisition, Project administration, Resources, Supervision, Visualization, Writing.
Acknowledgments
This study was supported by Fundação de Amparo à Pesquisa da Bahia (FAPESB), Coordenação de Aperfeiçoamento de Pessoal de Nível Superior (CAPES) and Conselho Nacional de Desenvolvimento Cientifico e Tecnológico (CNPq). Authors thanks the Universidade Estadual de Santa Cruz (UESC) and Centro de Pesquisa do Cacau (CEPLAC) for providing the infrastructure
Conflicts of Interest
All authors of this manuscript declare that none of them have any specific conflict of interest.
References
- Teixeira PJPL, Thomazella DP de T, Pereira GAG. Time for Chocolate: Current Understanding and New Perspectives on Cacao Witches’ Broom Disease Research. Vol. 11, PLoS Pathogens. 2015. [CrossRef]
- Guirlanda CP, da Silva GG, Takahashi JA. Cocoa honey: Agro-industrial waste or underutilized cocoa by-product? Vol. 4, Future Foods. 2021.
- ICCO International Cocoa Organization (ICCO). Available online: https://www.icco.org/ (accessed on 18 June 2024).
- Ifuku K, Nagao R. Evolution and Function of the Extrinsic Subunits of Photosystem II. In 2021.
- Evans HC. Pleomorphism in Crinipellis perniciosa, causal agent of witches’ broom disease of cocoa. Transactions of the British Mycological Society. 1980;74(3).
- Purdy LH, Schmidt RA. Status of cacao witches’ broom: Biology, epidemiology, and management. Vol. 34, Annual Review of Phytopathology. 1996.
- Aime MC, Phillips-Mora W. The causal agents of witches’ broom and frosty pod rot of cacao (chocolate, Theobroma cacao) form a new lineage of Marasmiaceae. Mycologia. 2005;97(5).
- Zugaib M, Almeida DSM de, de Santana MR, Macêdo Ferreira M, Santana JO, Mangabeira PAO, et al. Pre-infection Mechanisms on the Phylloplane: The First Biochemical Battlefield Between the Cacao Tree and Witches’ Broom Pathogen. Vol. 4, Frontiers in Agronomy. 2022. [CrossRef]
- Teixeira PJPL, de Toledo Thomazella DP, Reis O, Prado PFV do, Rio MCS do, Fiorin GL, et al. High-Resolution transcript profiling of the atypical biotrophic interaction between theobroma cacao and the fungal pathogen moniliophthora perniciosa. Plant Cell. 2014;26(11).
- Costa JL, Paschoal D, da Silva EM, Silva JS, do Carmo RM, Carrera E, et al. Moniliophthora perniciosa, the causal agent of witches’ broom disease of cacao, interferes with cytokinin metabolism during infection of Micro-Tom tomato and promotes symptom development. New Phytologist. 2021;231(1).
- Cubillos G. Model of cultural control of the cacao frosty pod rot disease (Moniliophthora roreri (CIF & Par) Evans et al.)1. Horticulture International Journal. 2023;7(1). [CrossRef]
- de Oliveira Ceita G, Macêdo JNA, Santos TB, Alemanno L, da Silva Gesteira A, Micheli F, et al. Involvement of calcium oxalate degradation during programmed cell death in Theobroma cacao tissues triggered by the hemibiotrophic fungus Moniliophthora perniciosa. Plant Science. 2007;173(2). [CrossRef]
- Pereira Menezes Reis S, de Andrade Silva EM, Peres Gramacho K, Freitas Sena K, da Costa Silva D, Lima Aragão FJ, et al. Transgenic tomato expressing an oxalate decarboxylase gene from Flammulina sp. shows increased survival to Moniliophthora perniciosa. Scientia Horticulturae. 2022;299.
- de Souza JT, Bailey BA, Pomella AWV, Erbe EF, Murphy CA, Bae H, et al. Colonization of cacao seedlings by Trichoderma stromaticum, a mycoparasite of the witches’ broom pathogen, and its influence on plant growth and resistance. Biological Control. 2008;46(1).
- Alves da Silva NJ, Menezes Reis SP, Diorato VS, Rocha JSA, Barbosa CS, Ciampi-Guillardi M, et al. A molecular diagnostic for Moniliophthora perniciosa, the causal agent of witches’ broom disease of cacao, that differentiates it from its sister taxon Moniliophthora roreri. Crop Protection. 2022;158.
- Jain D, Khurana JP. Role of pathogenesis-related (PR) proteins in plant defense mechanism. In: Molecular Aspects of Plant-Pathogen Interaction. 2018.
- Mondego JMC, de Toledo Thomazella DP, Teixeira PJPL, Pereira GAG. Genomics, transcriptomics, and beyond: The fifteen years of cacao’s witches’ broom disease genome project. In: Cacao Diseases: A History of Old Enemies and New Encounters. 2016.
- do Carmo Santos ML, dos Santos Lopes N, Ferreira MM, Amaral GV, Santos AS, Dias CV, et al. Proteomics analysis reveals three potential cacao target that interacts with Moniliophthora perniciosa NEP during witches broom disease. Physiological and Molecular Plant Pathology. 2023;124. [CrossRef]
- Boston RS, Viitanen P v., Vierling E. Molecular chaperones and protein folding in plants. Plant Molecular Biology. 1996;32(1–2). [CrossRef]
- Hetz C, Zhang K, Kaufman RJ. Mechanisms, regulation and functions of the unfolded protein response. Vol. 21, Nature Reviews Molecular Cell Biology. 2020. [CrossRef]
- Pedrazzini E, Vitale A. The binding protein (BiP) and the synthesis of secretory proteins. Vol. 34, Plant Physiology and Biochemistry. 1996.
- Galili G, Sengupta-Gopalan C, Ceriotti A. The endoplasmic reticulum of plant cells and its role in protein maturation and biogenesis of oil bodies. Plant Molecular Biology. 1998;38(1–2). [CrossRef]
- Wiseman RL, Mesgarzadeh JS, Hendershot LM. Reshaping endoplasmic reticulum quality control through the unfolded protein response. Vol. 82, Molecular Cell. 2022. [CrossRef]
- Gething MJ. Role and regulation of the ER chaperone BiP. Seminars in Cell and Developmental Biology. 1999;10(5). [CrossRef]
- Pobre KFR, Poet GJ, Hendershot LM. The endoplasmic reticulum (ER) chaperone BiP is a master regulator of ER functions: Getting by with a little help from ERdj friends. Vol. 294, Journal of Biological Chemistry. 2019. [CrossRef]
- Denecke J. Soluble endoplasmic reticulum resident proteins and their function in protein synthesis and transport. Vol. 34, Plant Physiology and Biochemistry. 1996.
- Mogk A, Bukau B, Kampinga HH. Cellular Handling of Protein Aggregates by Disaggregation Machines. Vol. 69, Molecular Cell. 2018. [CrossRef]
- Saibil H. Chaperone machines for protein folding, unfolding and disaggregation. Vol. 14, Nature Reviews Molecular Cell Biology. 2013. [CrossRef]
- Manghwar H, Li J. Endoplasmic Reticulum Stress and Unfolded Protein Response Signaling in Plants. Vol. 23, International Journal of Molecular Sciences. 2022.
- Park CJ, Seo YS. Heat shock proteins: A review of the molecular chaperones for plant immunity. Vol. 31, Plant Pathology Journal. 2015. [CrossRef]
- Kalinski A, Rowley DL, Loer DS, Foley C, Buta G, Herman EM. Binding-protein expression is subject to temporal, developmental and stress-induced regulation in terminally differentiated soybean organs. Planta. 1995;195(4).
- Liebrand TWH, Kombrink A, Zhang Z, Sklenar J, Jones AME, Robatzek S, et al. Chaperones of the endoplasmic reticulum are required for Ve1-mediated resistance to Verticillium. Molecular Plant Pathology. 2014;15(1).
- Alvim FC, Carolino SMB, Cascardo JCM, Nunes CC, Martinez CA, Otoni WC, et al. Enhanced accumulation of BiP in transgenic plants confers tolerance to water stress. Plant Physiology. 2001;126(3).
- Cascardo JCM, Almeida RS, Buzeli RAA, Carolino SMB, Otoni WC, Fontes EPB. The phosphorylation state and expression of soybean BiP isoforms are differentially regulated following abiotic stresses. Journal of Biological Chemistry. 2000;275(19). [CrossRef]
- Valente MAS, Faria JAQA, Soares-Ramos JRL, Reis PAB, Pinheiro GL, Piovesan ND, et al. The ER luminal binding protein (BiP) mediates an increase in drought tolerance in soybean and delays drought-induced leaf senescence in soybean and tobacco. Journal of Experimental Botany. 2009;60(2). [CrossRef]
- Reis PAA, Rosado GL, Silva LAC, Oliveira LC, Oliveira LB, Costa MDL, et al. The binding protein BiP attenuates stress-induced cell death in soybean via modulation of the N-RICH protein-mediated signaling pathway. Plant Physiology. 2011;157(4).
- Coutinho FS, dos Santos DS, Lima LL, Vital CE, Santos LA, Pimenta MR, et al. Mechanism of the drought tolerance of a transgenic soybean overexpressing the molecular chaperone BiP. Physiology and Molecular Biology of Plants. 2019;25(2).
- Park CJ, Park JM. Endoplasmic reticulum plays a critical role in integrating signals generated by both biotic and abiotic stress in plants. Vol. 10, Frontiers in Plant Science. 2019. [CrossRef]
- Moon JY, Lee JH, Oh CS, Kang HG, Park JM. Endoplasmic reticulum stress responses function in the HRT-mediated hypersensitive response in nicotiana benthamiana. Molecular Plant Pathology. 2016;17(9). [CrossRef]
- Rodrigues JM, Coutinho FS, dos Santos DS, Vital CE, Ramos JRLS, Reis PB, et al. BiP-overexpressing soybean plants display accelerated hypersensitivity response (HR) affecting the SA-dependent sphingolipid and flavonoid pathways. Phytochemistry. 2021;185.
- Wang S, Xie K, Xu G, Zhou H, Guo Q, Wu J, et al. Plant G proteins interact with endoplasmic reticulum luminal protein receptors to regulate endoplasmic reticulum retrieval. Journal of Integrative Plant Biology. 2018;60(7). [CrossRef]
- Santos AS, Mora-Ocampo IY, de Novais DPS, Aguiar ERGR, Pirovani CP. State of the Art of the Molecular Biology of the Interaction between Cocoa and Witches’ Broom Disease: A Systematic Review. Vol. 24, International Journal of Molecular Sciences. 2023. [CrossRef]
- Tossounian MA, Zhang B, Gout I. The writers, readers, and erasers in redox regulation of GAPDH. Vol. 9, Antioxidants. 2020.
- Liszka A, Schimpf R, Zaruma KIC, Buhr A, Seidel T, Walter S, et al. Three cytosolic NAD-malate dehydrogenase isoforms of Arabidopsis thaliana: On the crossroad between energy fluxes and redox signaling. Biochemical Journal. 2020;477(19).
- Bacheva A v., Gotmanova NN, Belogurov AA, Kudriaeva AA. Control of Genome through Variative Nature of Histone-Modifying Ubiquitin Ligases. Vol. 86, Biochemistry (Moscow). 2021.
- Oberdoerffer P, Miller KM. Histone H2A variants: Diversifying chromatin to ensure genome integrity. Vol. 135, Seminars in Cell and Developmental Biology. 2023.
- Li W, Wang H, Xu Q, Zhang L, Wang Y, Yu Y, et al. The cytosolic isoform of triosephosphate isomerase, ZmTPI4, is required for kernel development and starch synthesis in maize (Zea mays L.). Crop Journal. 2024;12(2). [CrossRef]
- Sheikh AH, Zacharia I, Pardal AJ, Dominguez-Ferreras A, Sueldo DJ, Kim JG, et al. Dynamic changes of the Prf/Pto tomato resistance complex following effector recognition. Nature Communications. 2023;14(1). [CrossRef]
- Leborgne-Castel N, Jelitto-Van Dooren EPWM, Crofts AJ, Denecke J. Overexpression of BiP in tobacco alleviates endoplasmic reticulum stress. Plant Cell. 1999;11(3).
- Pincus D, Chevalier MW, Aragón T, van Anken E, Vidal SE, El-Samad H, et al. BiP binding to the ER-stress sensor Ire1 tunes the homeostatic behavior of the unfolded protein response. PLoS Biology. 2010;8(7).
- Williams B, Verchot J, Dickman MB. When supply does not meet demand-ER stress and plant programmed cell death. Vol. 5, Frontiers in Plant Science. 2014. [CrossRef]
- de Camargos LF, Fraga OT, Oliveira CC, da Silva JCF, Fontes EPB, Reis PAB. Development and cell death domain-containing asparagine-rich protein (DCD/NRP): an essential protein in plant development and stress responses. Theoretical and Experimental Plant Physiology. 2019;31(1).
- Melo EP, Konno T, Farace I, Awadelkareem MA, Skov LR, Teodoro F, et al. Stress-induced protein disaggregation in the endoplasmic reticulum catalysed by BiP. Nature Communications. 2022;13(1). [CrossRef]
- Carvalho HH, Brustolini OJB, Pimenta MR, Mendes GC, Gouveia BC, Silva PA, et al. The molecular chaperone binding protein BiP prevents leaf dehydration-induced cellular homeostasis disruption. PLoS ONE. 2014;9(1).
- Yamamoto H, Cheuk A, Shearman J, Nixon PJ, Meier T, Shikanai T. Impact of engineering the ATP synthase rotor ring on photosynthesis in tobacco chloroplasts. Plant Physiology. 2023;192(2). [CrossRef]
- Ifuku K, Nagao R. Evolution and Function of the Extrinsic Subunits of Photosystem II. In 2021.
- Jiao, Yun, Jianhong Zhang, and Cunde Pan. Integrated physiological, proteomic, and metabolomic analyses of pecan cultivar ‘Pawnee’adaptation to salt stress. Scientific Reports 12.1 (2022): 1841.
- Bhattacharjee, P., Wang, D., Anderson, D., Buckler, J. N., de Geus, E., Yan, F.,Sadler, A. J. (2024). The immune response to RNA suppresses nucleic acid synthesis by limiting ribose 5-phosphate. The EMBO journal, 43(13), 2636-2660.
- Cao P, Ren Y, Liu X, Zhang T, Zhang P, Xiao L, et al. Purine nucleotide biosynthetic gene GARS controls early chloroplast development in rice (Oryza sativa L.). Plant Cell Reports. 2019;38(2). [CrossRef]
- Bagnato L, Tosato E, Gurrieri L, Trost P, Forlani G, Sparla F. Arabidopsis thaliana Sucrose Phosphate Synthase A2 Affects Carbon Partitioning and Drought Response. Biology. 2023;12(5).
- Niazi R, Parveen G, Noman M, Mukhtar N, Hadayat N, Sami A, et al. Comparative expression analysis of sucrose phosphate synthase gene family in a low and high sucrose Pakistani sugarcane cultivars. PeerJ. 2023;11.
- Kawagoe S, Nakagawa H, Kumeta H, Ishimori K, Saio T. Structural insight into proline cis/trans isomerization of unfolded proteins catalyzed by the trigger factor chaperone. Journal of Biological Chemistry. 2018;293(39). [CrossRef]
- Mhlongo MI, Piater LA, Madala NE, Labuschagne N, Dubery IA. The chemistry of plant–microbe interactions in the rhizosphere and the potential for metabolomics to reveal signaling related to defense priming and induced systemic resistance. Vol. 9, Frontiers in Plant Science. 2018.
- dos Santos C, Franco OL. Pathogenesis-Related Proteins (PRs) with Enzyme Activity Activating Plant Defense Responses. Vol. 12, Plants. 2023. [CrossRef]
- Biswas K, Adhikari S, Tarafdar A, Kumar R, Saha S, Ghosh P. Reactive Oxygen Species and Antioxidant Defence Systems in Plants: Role and Crosstalk Under Biotic Stress. In: Sustainable Agriculture in the Era of Climate Change. 2020.
- Divekar PA, Rani V, Majumder S, Karkute SG, Molla KA, Pandey KK, et al. Protease Inhibitors: An Induced Plant Defense Mechanism Against Herbivores. Journal of Plant Growth Regulation. 2023;42(10). [CrossRef]
- da Silva LF, Dias C v., Cidade LC, Mendes JS, Pirovani CP, Alvim FC, et al. Expression of an oxalate decarboxylase impairs the necrotic effect induced by Nep1-like protein (NLP) of Moniliophthora perniciosa in transgenic tobacco. Molecular Plant-Microbe Interactions. 2011;24(7).
- Dias CV, Mendes JS, dos Santos AC, Pirovani CP, da Silva Gesteira A, Micheli F, et al. Hydrogen peroxide formation in cacao tissues infected by the hemibiotrophic fungus Moniliophthora perniciosa. Plant Physiology and Biochemistry. 2011;49(8).
- dos Santos EC, Pirovani CP, Correa SC, Micheli F, Gramacho KP. The pathogen Moniliophthora perniciosa promotes differential proteomic modulation of cacao genotypes with contrasting resistance to witcheś broom disease. BMC Plant Biology. 2020;20(1).
- Waheed A, Haxim Y, Islam W, Kahar G, Liu X, Zhang D. Role of pathogen’s effectors in understanding host-pathogen interaction. Vol. 1869, Biochimica et Biophysica Acta - Molecular Cell Research. 2022.
- de Oliveira IB, Moura IM, Santana JO, Gramacho KP, Santos Alves S dos, Ferreira MM, et al. Cocoa Apoplastome Contains Defense Proteins Against Pathogens. Phytopathology. 2024;114(2). [CrossRef]
- Menezes SP, Santos JL, Cardoso THS, Pirovani CP, Micheli F, Noronha FSM, et al. Evaluation of the allergenicity potential of TcPR-10 protein from Theobroma cacao. PLoS ONE. 2012;7(6).
- Darwiche R, el Atab O, Cottier S, Schneiter R. The function of yeast CAP family proteins in lipid export, mating, and pathogen defense. Vol. 592, FEBS Letters. 2018. [CrossRef]
- Javed, T., Wang, W., Sun, T., Shen, L., Feng, X., Huang, J., & Zhang, S. (2024). Pathogenesis-Related 1 (PR1) Protein Family Genes Involved in Sugarcane Responses to Ustilago scitaminea Stress. International Journal of Molecular Sciences, 25(12), 6463.
- Zribi I, Ghorbel M, Brini F. Pathogenesis Related Proteins (PRs): From Cellular Mechanisms to Plant Defense. Current Protein & Peptide Science. 2021;22(5).
- Pungartnik C, da Silva AC, de Melo SA, Gramacho KP, Cascardo JCDM, Brendel M, et al. High-affinity copper transport and Snq2 export permease of Saccharomyces cerevisiae modulate cytotoxicity of PR-10 from Theobroma cacao. Molecular Plant-Microbe Interactions. 2009;22(1). [CrossRef]
- Belouah I, Bénard C, Denton A, Blein-Nicolas M, Balliau T, Teyssier E, et al. Transcriptomic and proteomic data in developing tomato fruit. Data in Brief. 2020;28.
- Shannon P, Markiel A, Ozier O, Baliga NS, Wang JT, Ramage D, et al. Cytoscape: A software Environment for integrated models of biomolecular interaction networks. Genome Research. 2003;13(11).
- Maere S, Heymans K, Kuiper M. BiNGO: A Cytoscape plugin to assess overrepresentation of Gene Ontology categories in Biological Networks. Bioinformatics. 2005;21(16). [CrossRef]
- Ahammed GJ, Gao CJ, Ogweno JO, Zhou YH, Xia XJ, Mao WH, et al. Brassinosteroids induce plant tolerance against phenanthrene by enhancing degradation and detoxification in Solanum lycopersicum L. Ecotoxicology and Environmental Safety. 2012;80.
- Junglee S, Urban L, Sallanon H, Lopez-Lauri F. Optimized Assay for Hydrogen Peroxide Determination in Plant Tissue Using Potassium Iodide. American Journal of Analytical Chemistry. 2014;05(11).
- Rehem BC, Almeida AAF, Santos IC, Gomes FP, Pirovani CP, Mangabeira PAO, et al. Photosynthesis, chloroplast ultrastructure, chemical composition and oxidative stress in Theobroma cacao hybrids with the lethal gene Luteus-Pa mutant. Photosynthetica. 2011;49(1).
- Giannopolitis CN, Ries SK. Superoxide Dismutases: II. Purification and Quantitative Relationship with Water-soluble Protein in Seedlings. Plant physiology. 1977;59(2).
- Ulhoa CJ, Peberdy JF. Regulation of chitinase synthesis in trichoderma harzianum. Journal of General Microbiology. 1991;137(9).
Figure 1.
Witches’ broom symptoms in Solanum lycopersicum plants inoculated with Moniliophthora perniciosa. Inoculated NT plants (not transformed) exhibit typical infection symptoms, such as hyperplasia and overgrowth (red arrows). In contrast, BiP-transgenic plants (BiP L12), when inoculated, developed no visual disease symptoms throughout the observation period. Plants Not-inoculated (NT and BiP-trangenic) maintain a healthy phenotype throughout the experiment. Pictures representative of 7 biological replicas; 15, 30 and 45 days after inoculation.
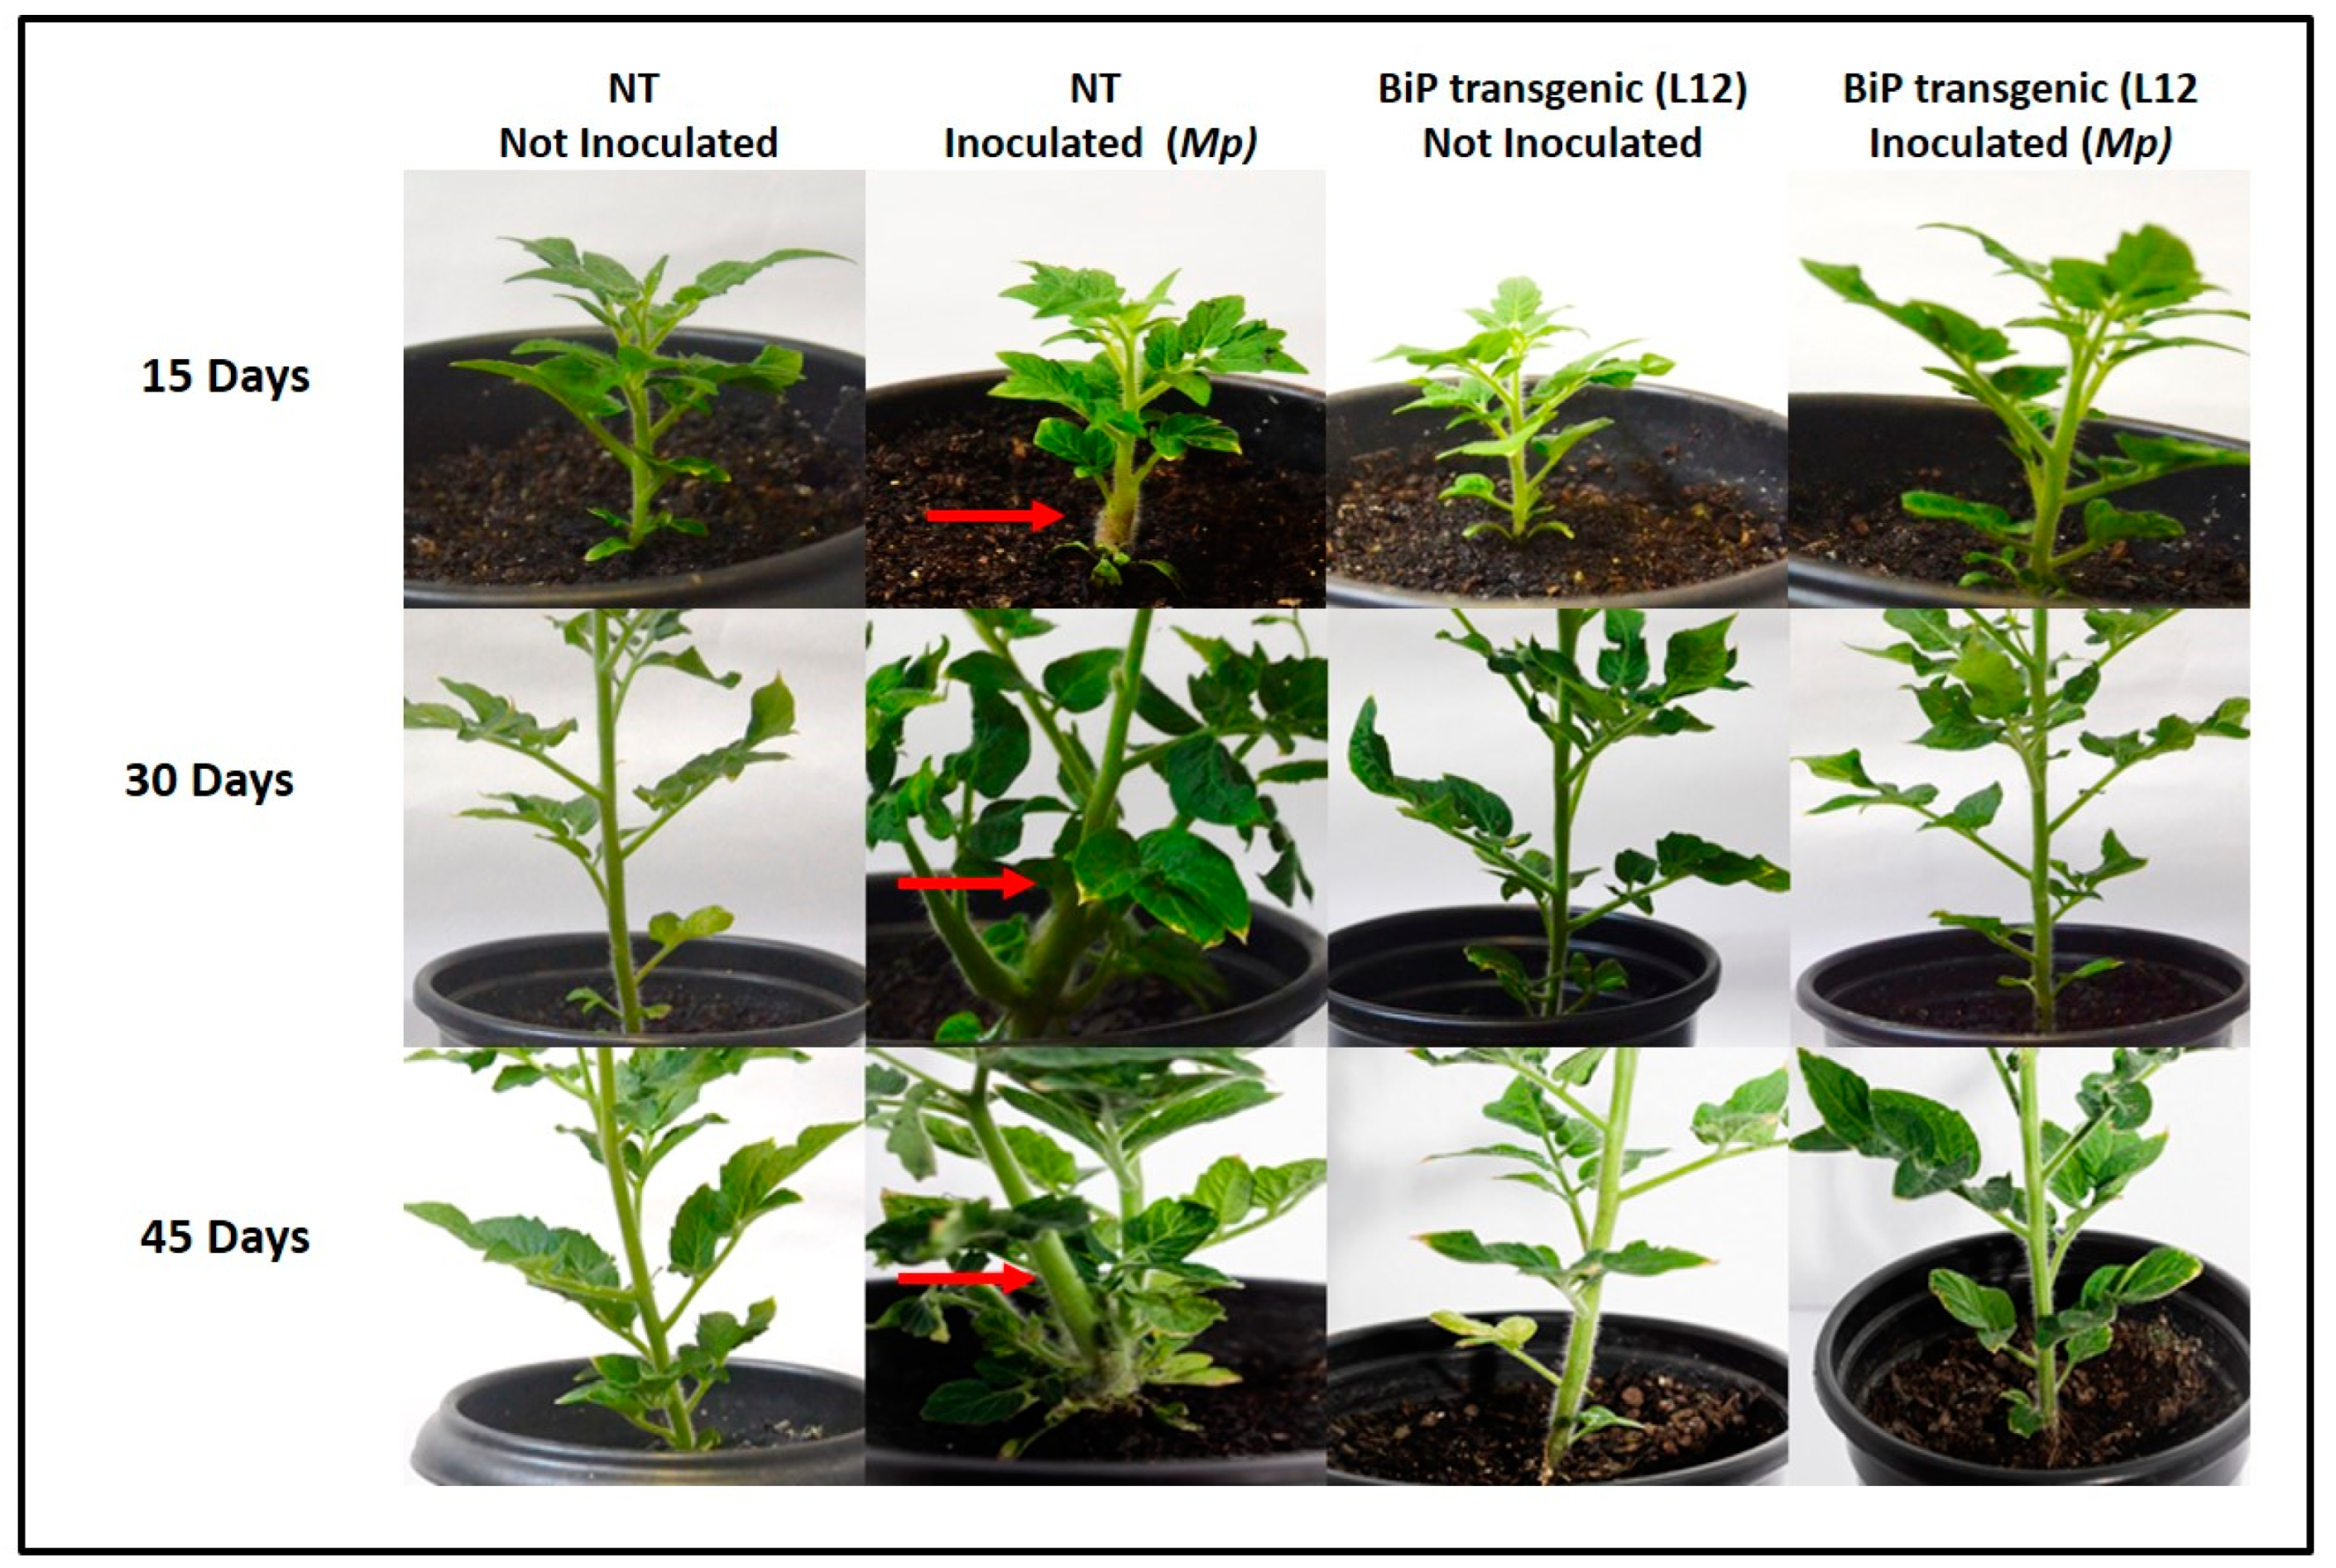
Figure 2.
Protein identification NT- Not- Inoculated versus L12 BiP-transgenic Not- Inoculated treatment (p-value < 0.05 and |fold-change| > 1.5) - (A) Heatmap of Solanum lycopersicum leaf protein abundance (log 10). Indicated by the scale in the figure: proteins (rows) and treatments (columns). The dendrogram shows proteins grouped according to the Euclidean distance. (B) Molecular function and Biological process. (NT) plant Not-transformed (L12 BiP) plant lineage overexpressing BiP.
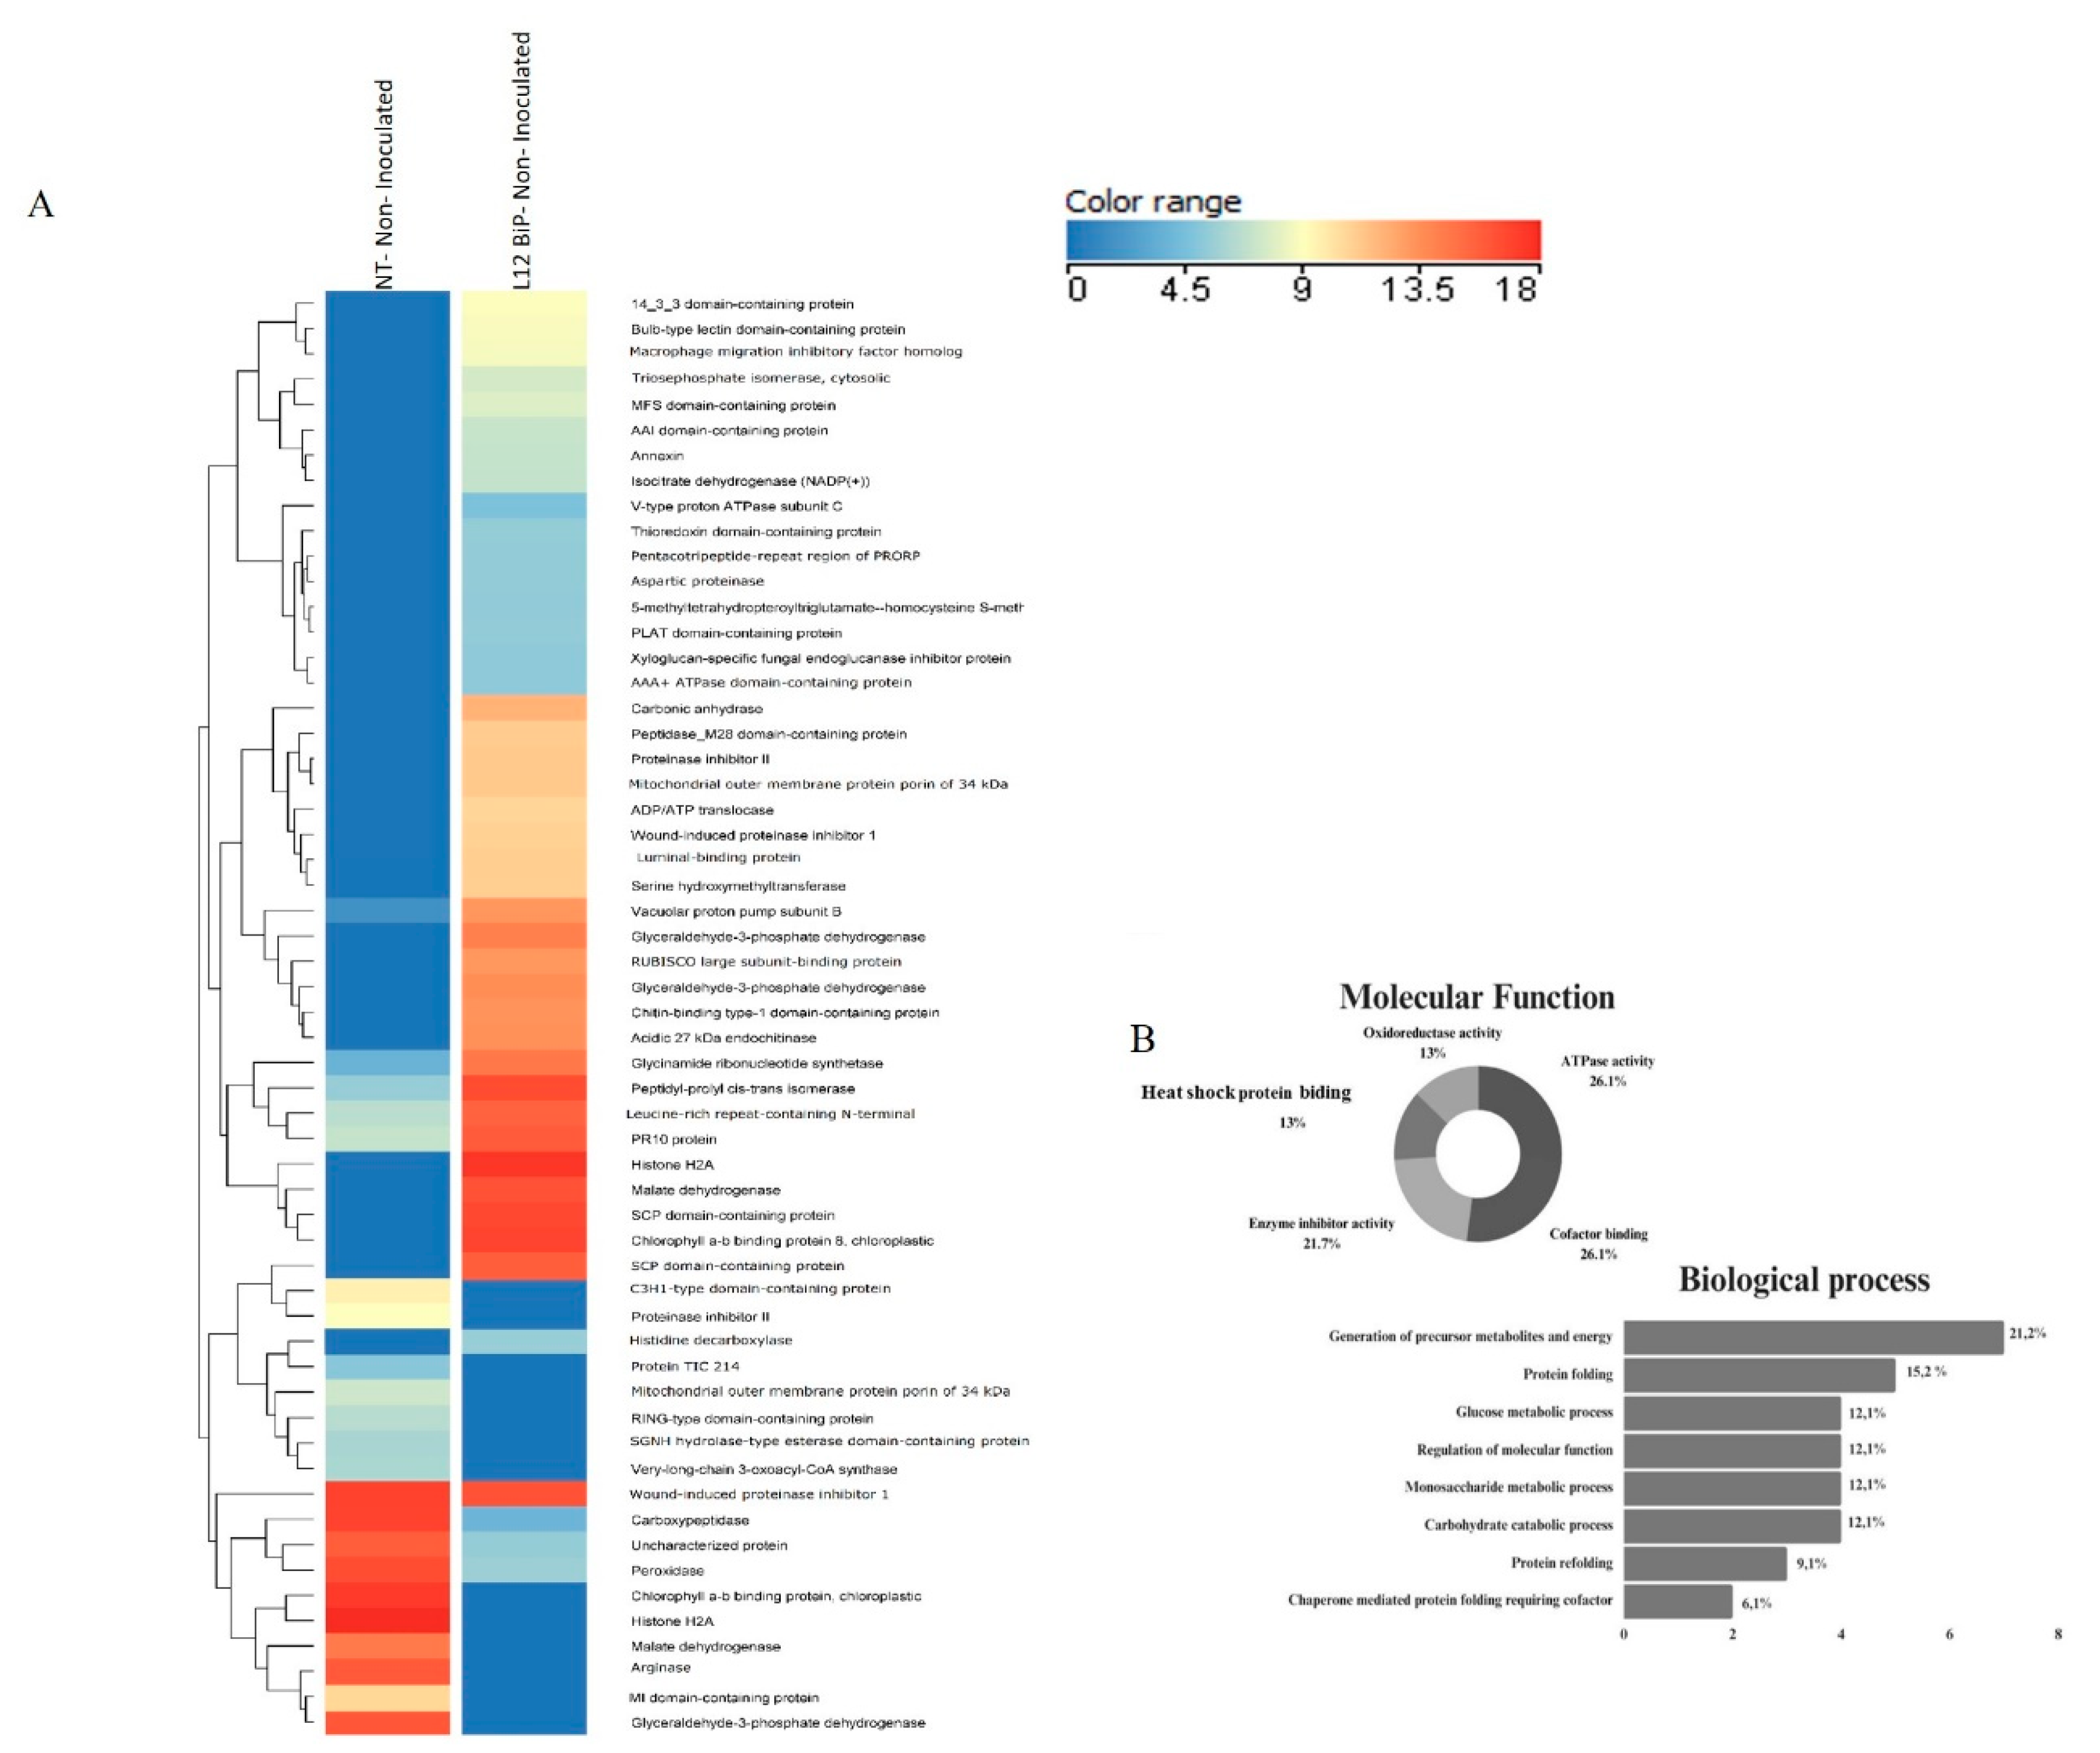
Figure 3.
Protein identification NT- Inoculated versus L12 BiP-transgenic Inoculated treatment (p-value < 0.05 and |fold-change| > 1.5) - (A) Heatmap of Solanum lycopersicum leaf protein abundance (log 10). Indicated by the scale in the figure: proteins (rows) and treatments (columns). The dendrogram shows proteins grouped according to the Euclidean distance. (B) Molecular function and Biological process. (NT) plant Not-transformed (L12 BiP) plant lineage overexpressing BiP.
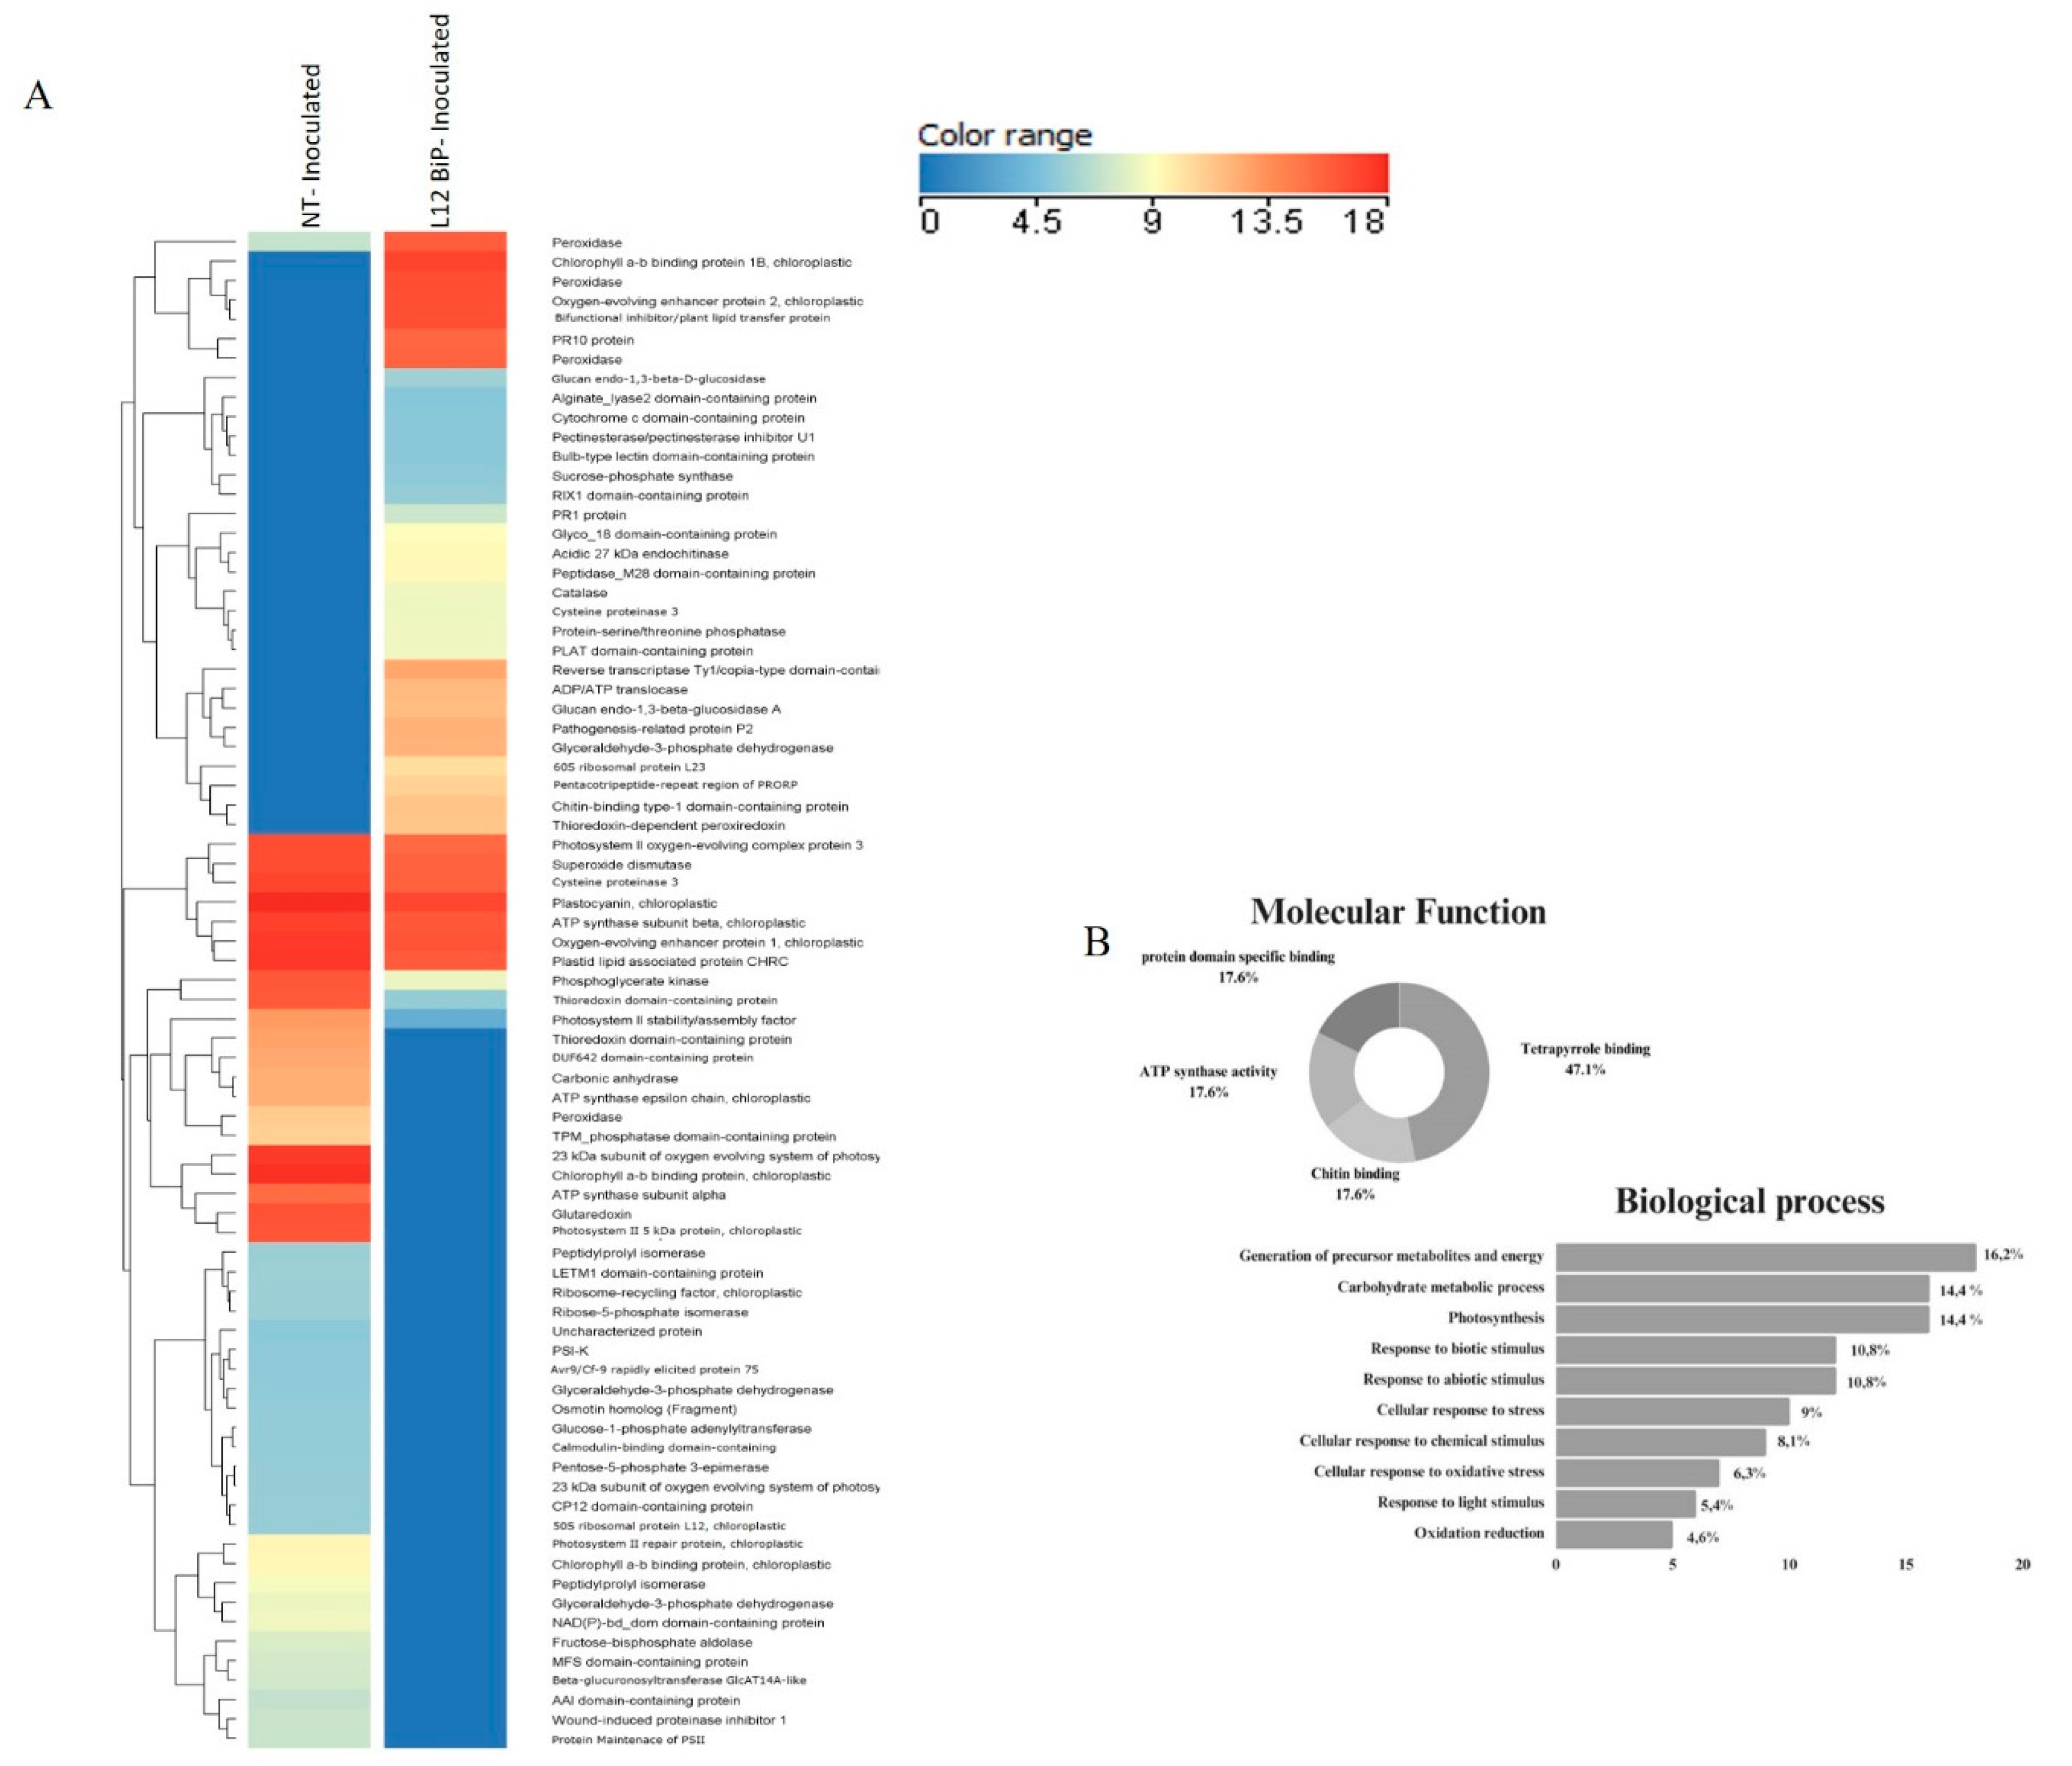
Figure 4.
Abundance of identified proteins involved in defense and stress response. (A) NT Not- Inoculated versus L12 BiP not- Inoculated. (B) NT Inoculated treatment versus L12 BiP Inoculated with M. perniciosa. (NT) plant Not-transformed (L12 BiP) plant lineage overexpressing BiP.
Figure 4.
Abundance of identified proteins involved in defense and stress response. (A) NT Not- Inoculated versus L12 BiP not- Inoculated. (B) NT Inoculated treatment versus L12 BiP Inoculated with M. perniciosa. (NT) plant Not-transformed (L12 BiP) plant lineage overexpressing BiP.
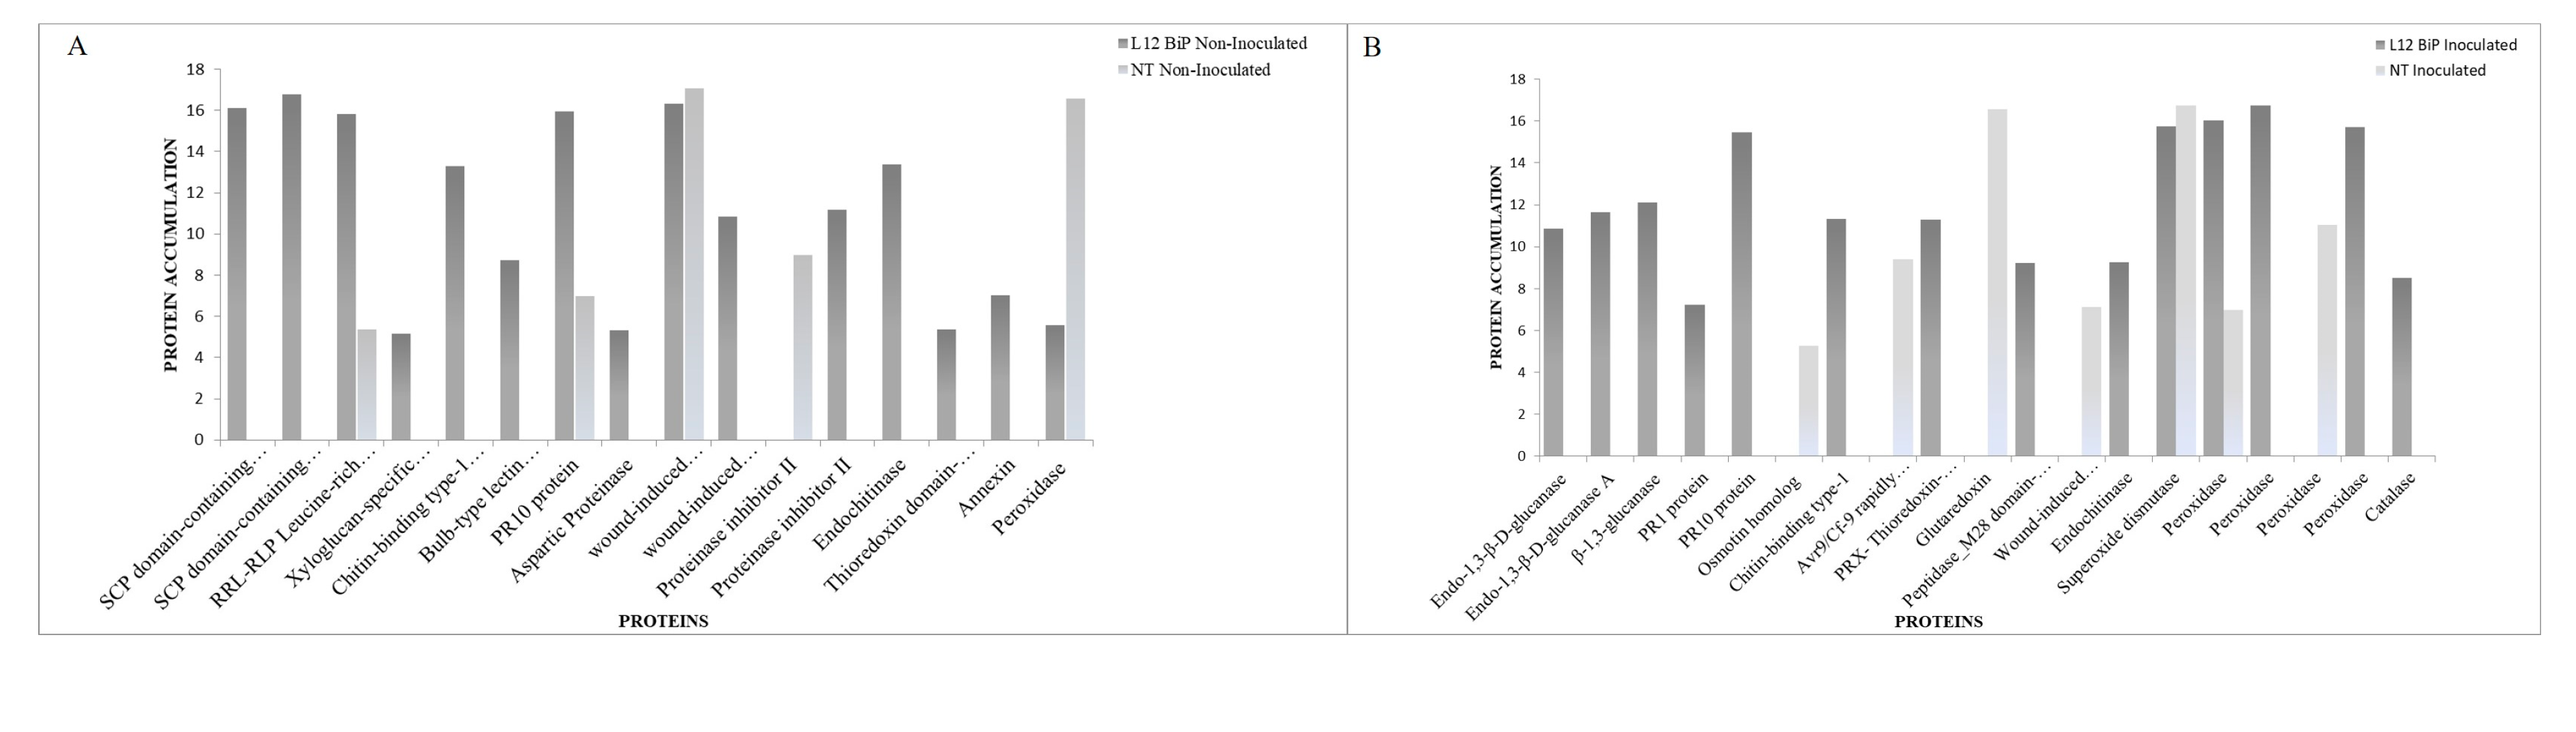
Figure 5.
Protein/protein interaction network identified in Solanum lycopersicum. Uninoculated NT treatment versus uninoculated L12 BiP. (CL1- CL 21) Clusters; (NT) non-transformed plant; (L12 BiP) transgenic line. The betweenness value is represented by the fill color of the nodes, where the lighter color represents the lowest value and the darker color the highest value. The node degree parameter is represented by the edge width of the nodes, where nodes with a thinner edge have a lower node degree and nodes with a wider edge have a higher node degree value.
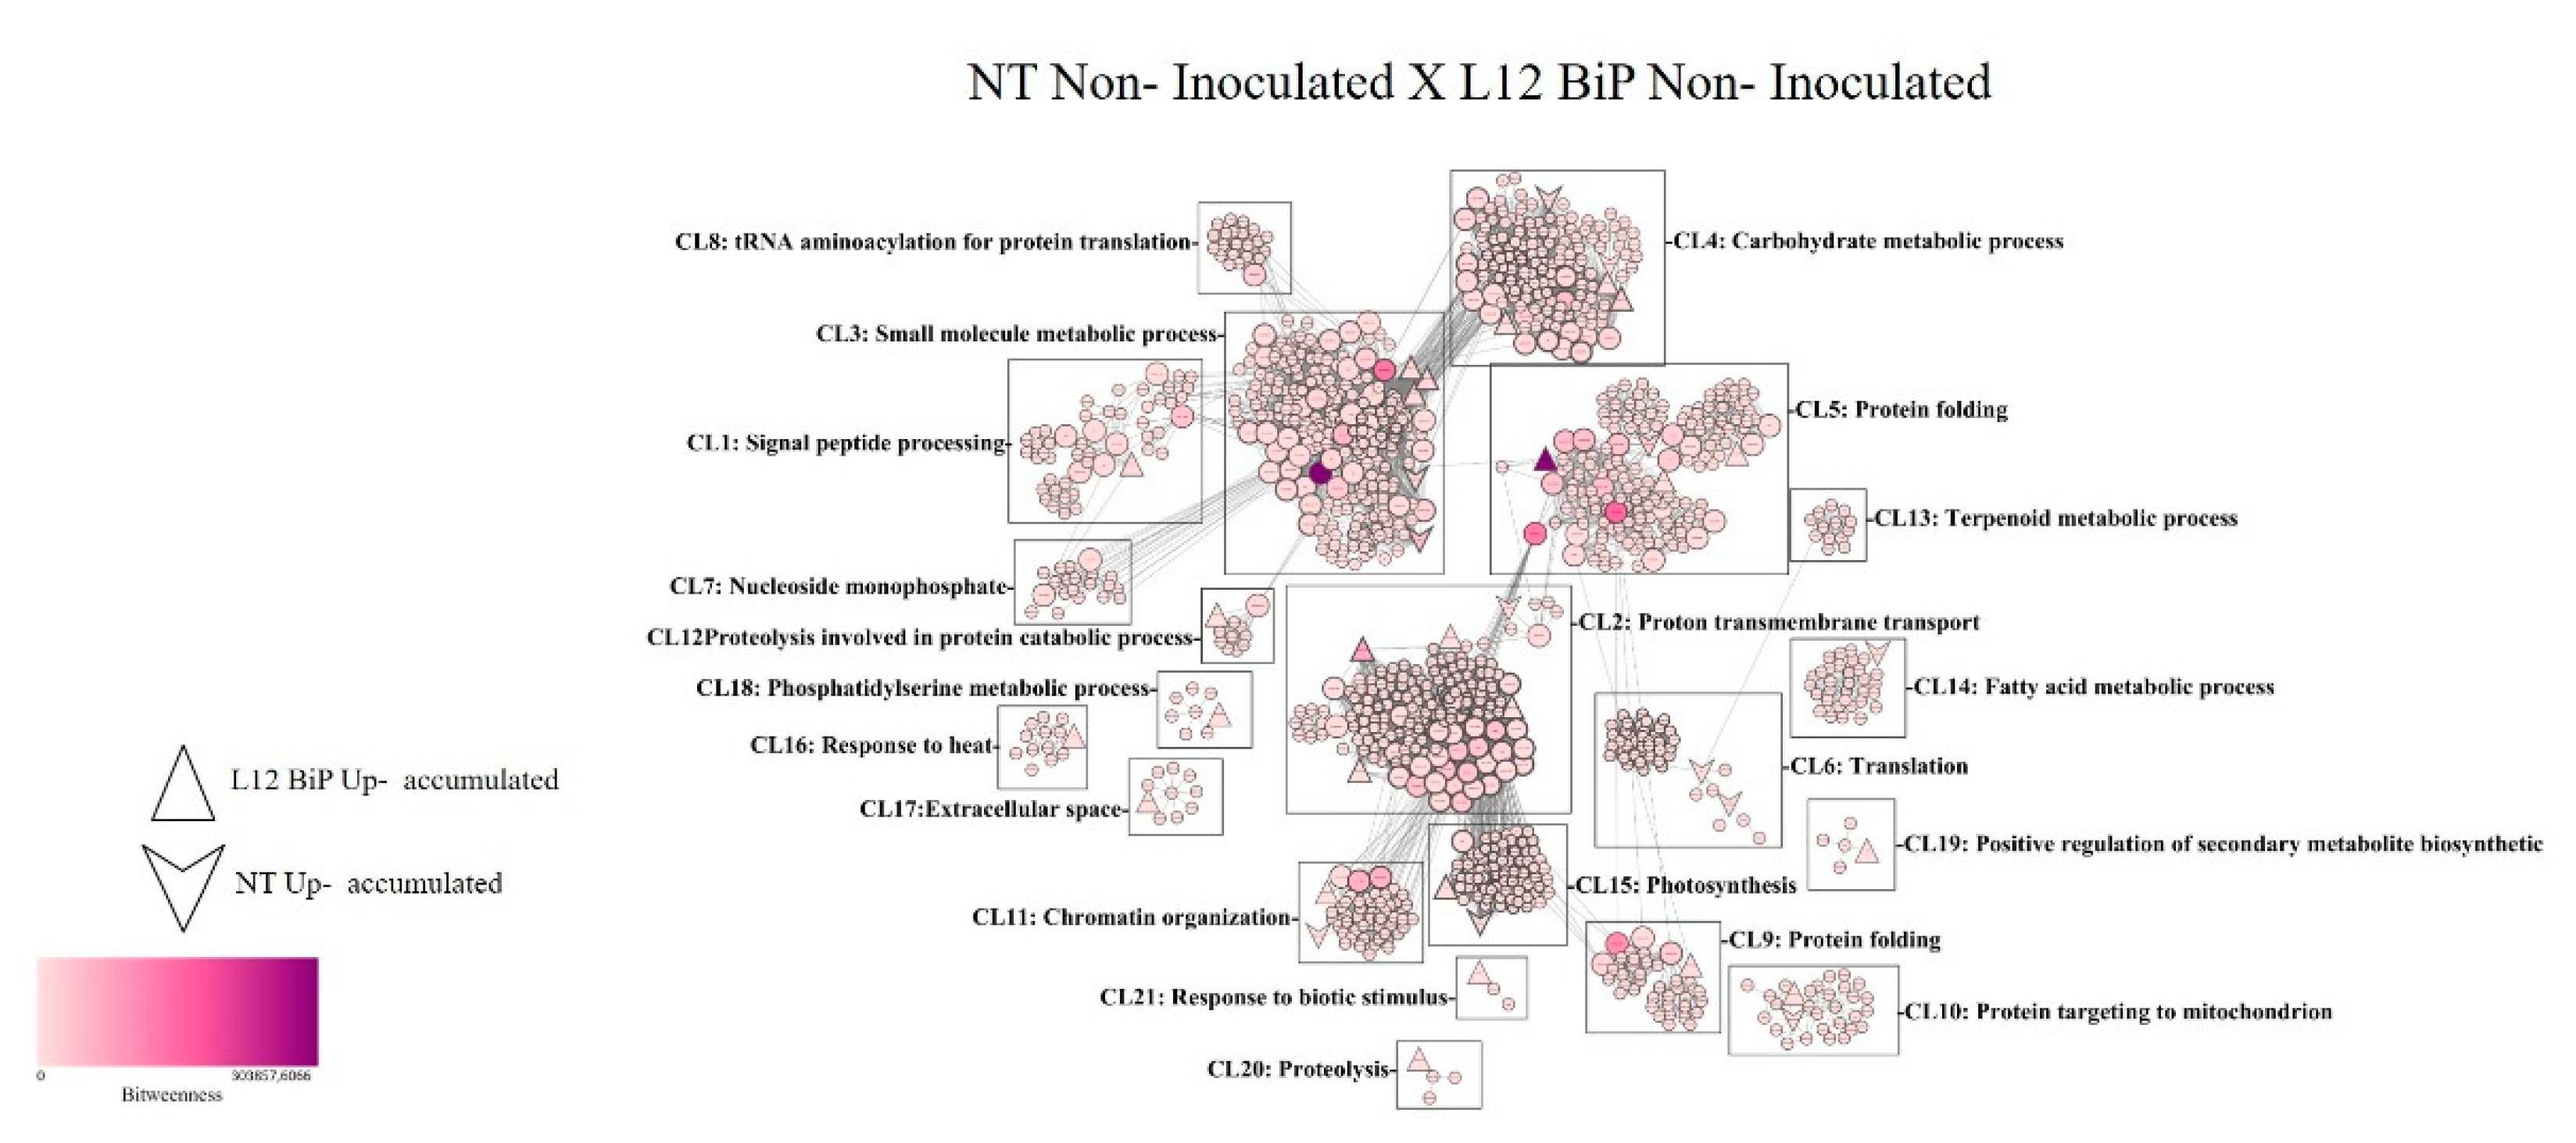
Figure 6.
Protein/protein interaction network identified from Solanum lycopersicum. treatment NT Inoculated versus L12 BiP Inoculated. (CL1- CL24) Clusters; (NT) not-transformed plant; (L12 BiP) transgenic lineage. The betweenness value is represented by the fill color of the nodes, where the lighter color represents the lowest value and the darker color the highest value. The node degree parameter is represented by the edge width of the nodes, where nodes with a thinner edge have a lower node degree and nodes with a wider edge have a higher node degree value.
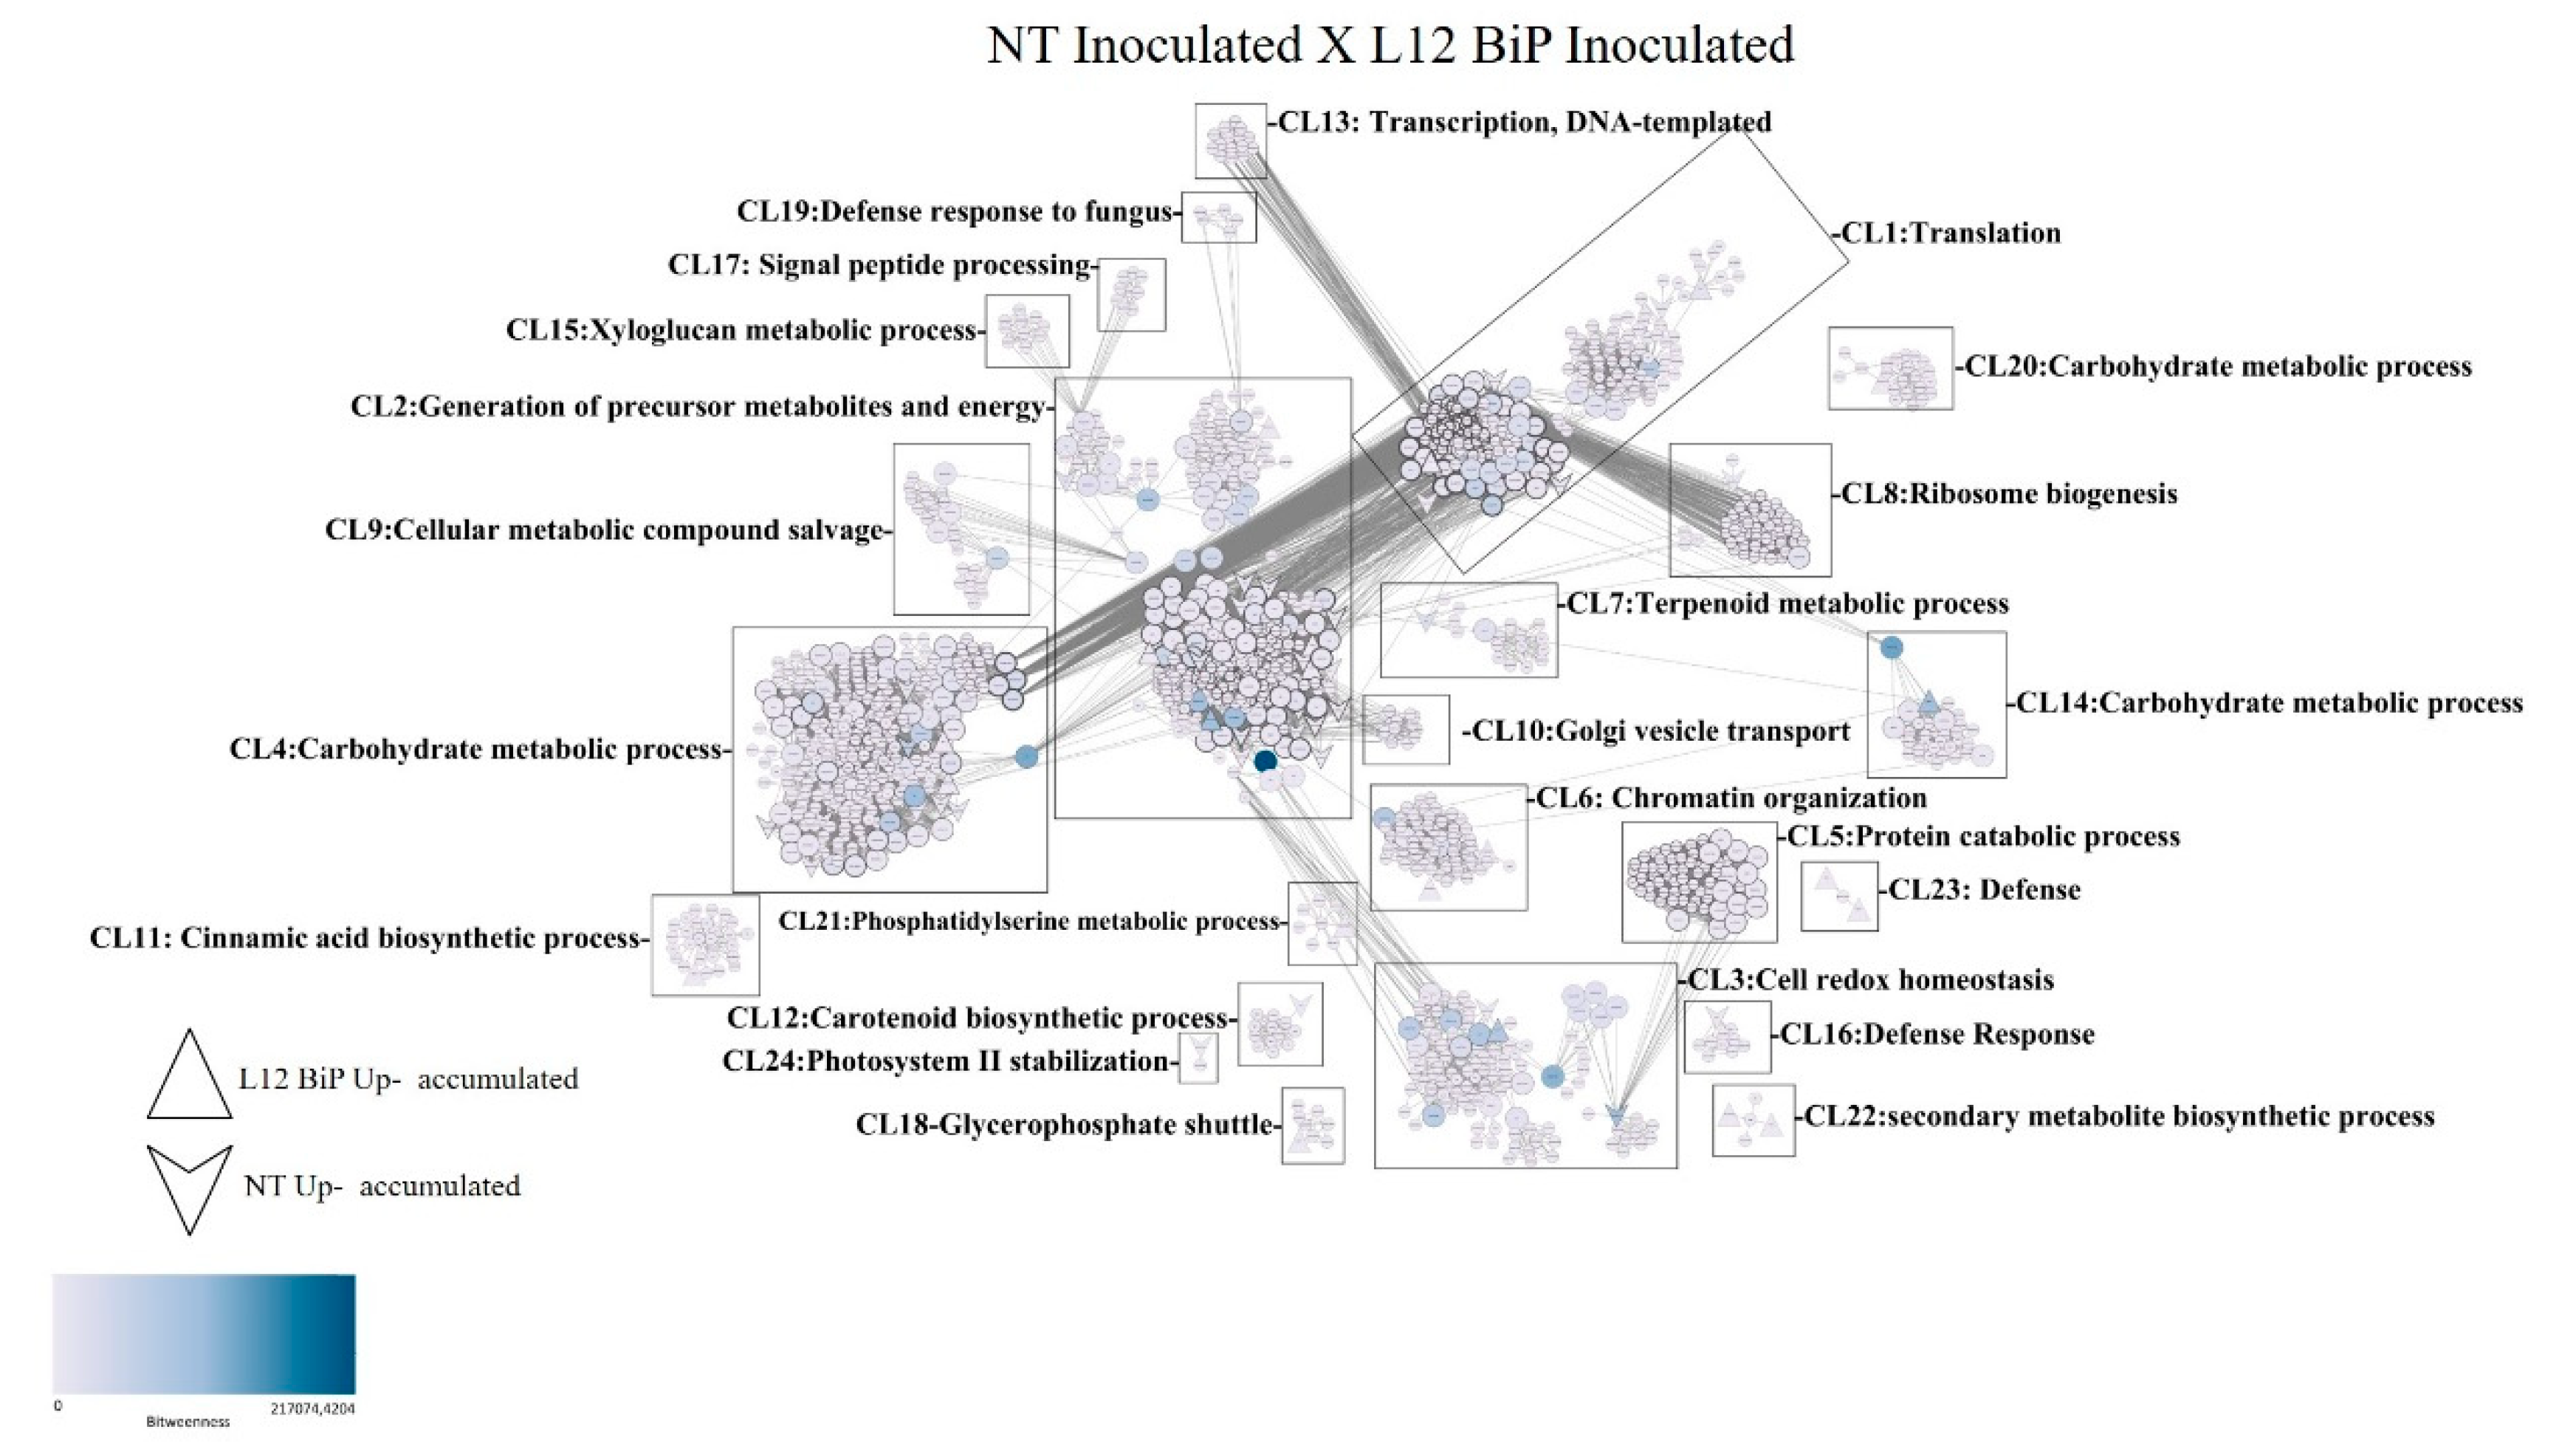
Figure 7.
Protein Immunodetection. (A) anti-BiP, (B) anti-Catalase, (C) anti-PR2 and (D) anti-PR3 in not-transformed (NT) and BiP-transgenic Solanum lycopersicum lineages (L2, L9 and L12), Not- inoculated and inoculated (NT I, L2 I, L9 I and L12 I) with M. perniciosa. (kDa) corresponds to themolecular mass; (1) protein accumulation; (2) Mirror gel;(3) Quantification of protein accumulation of the samples estimated through the Gel Quant.NET v1.8 program.
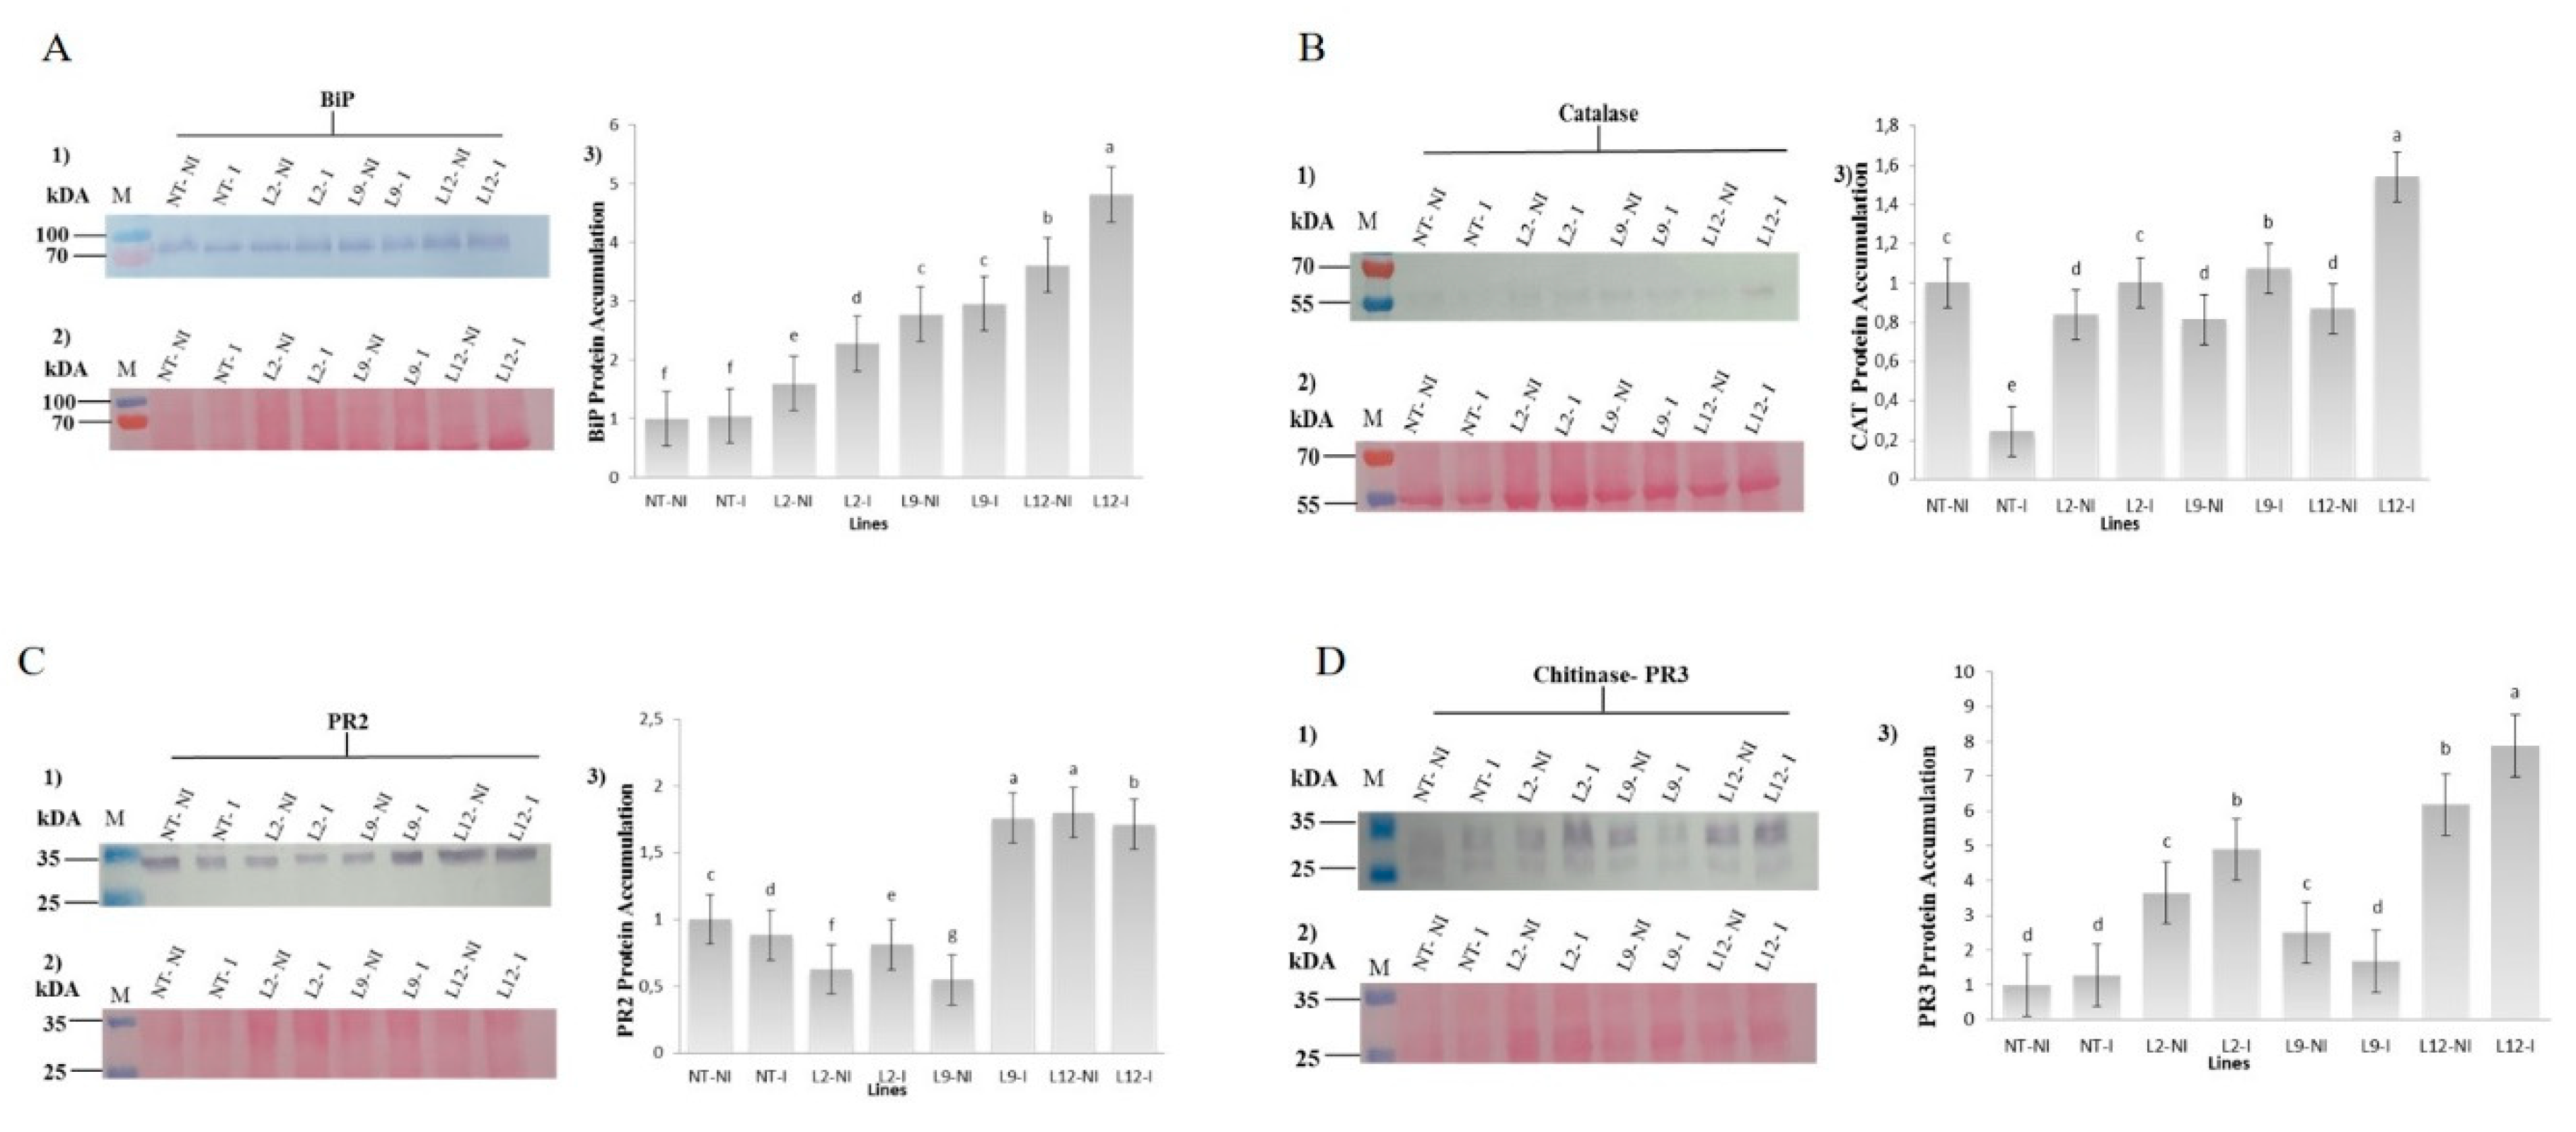
Figure 8.
Analysis of H₂O₂ production and peroxide activity in S. lycopersicum leaves. NT (not-transformed) and BiP-transgenic lineages (L2, L9, and L12), with or without inoculation with Moniliophthora perniciosa. (A) Quantification of H₂O₂ (mmol/g) in leaves of different tomato lines, with or without inoculation. Bars represent the mean ± standard error, and letters indicate significant differences between treatments (p < 0.05). (B) Images of leaves treated with DAB (3,3'-diaminobenzidine), showing peroxide staining in response to inoculation with M. perniciosa (inoculated) and the control (not-inoculated). The leaves were treated with either H₂O or DAB as indicated.
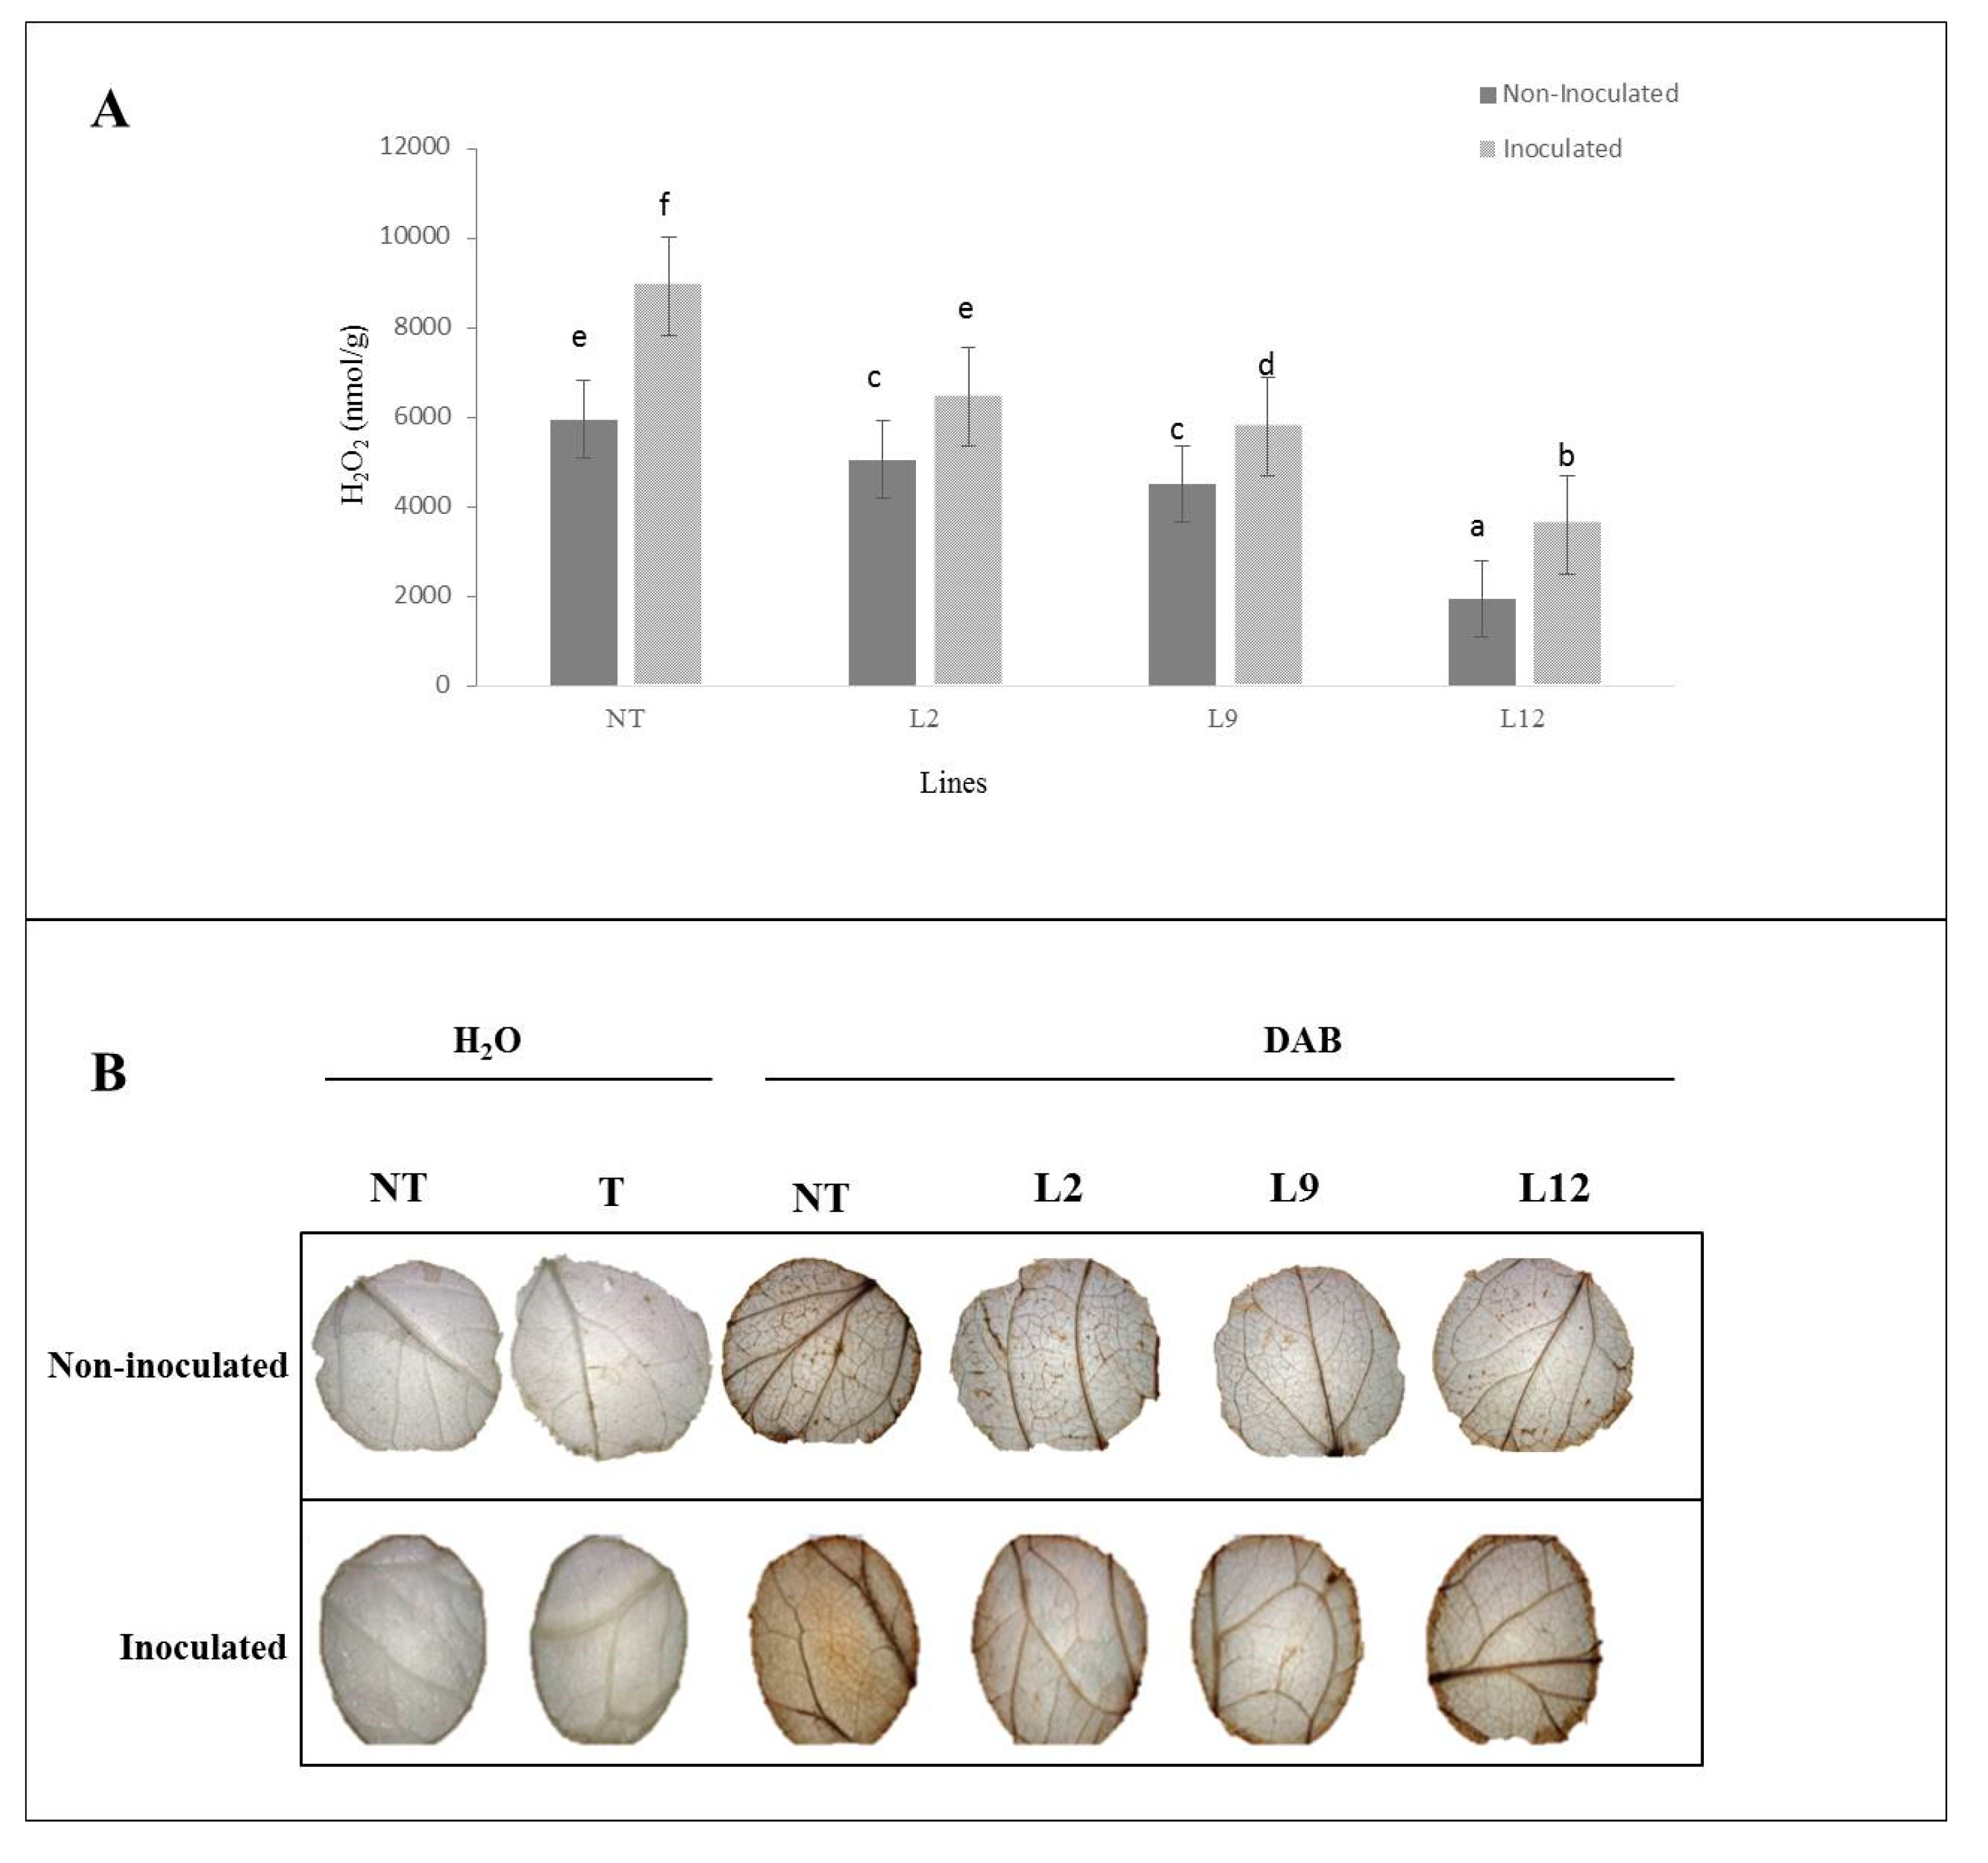
Figure 9.
Enzymatic activity analysis in S. lycopersicum leaves. NT (not-transformed) and transgenic lineages (L2, L9, and L12), with or without inoculation with Moniliophthora perniciosa. (A) Superoxide dismutase (SOD) activity (UA at 1 mM) in different tomato lines, with or without inoculation. Bars represent the mean ± standard error, and letters indicate significant differences between treatments (p < 0.05). (B) Guaiacol peroxidase (GPX) activity (nmol glutathione·g⁻¹·min⁻¹·MF) in the same lines, with or without inoculation. (C) β-1,3-glucanase activity (µmol glucose/g MS) in leaves of the different lines, with or without inoculation.
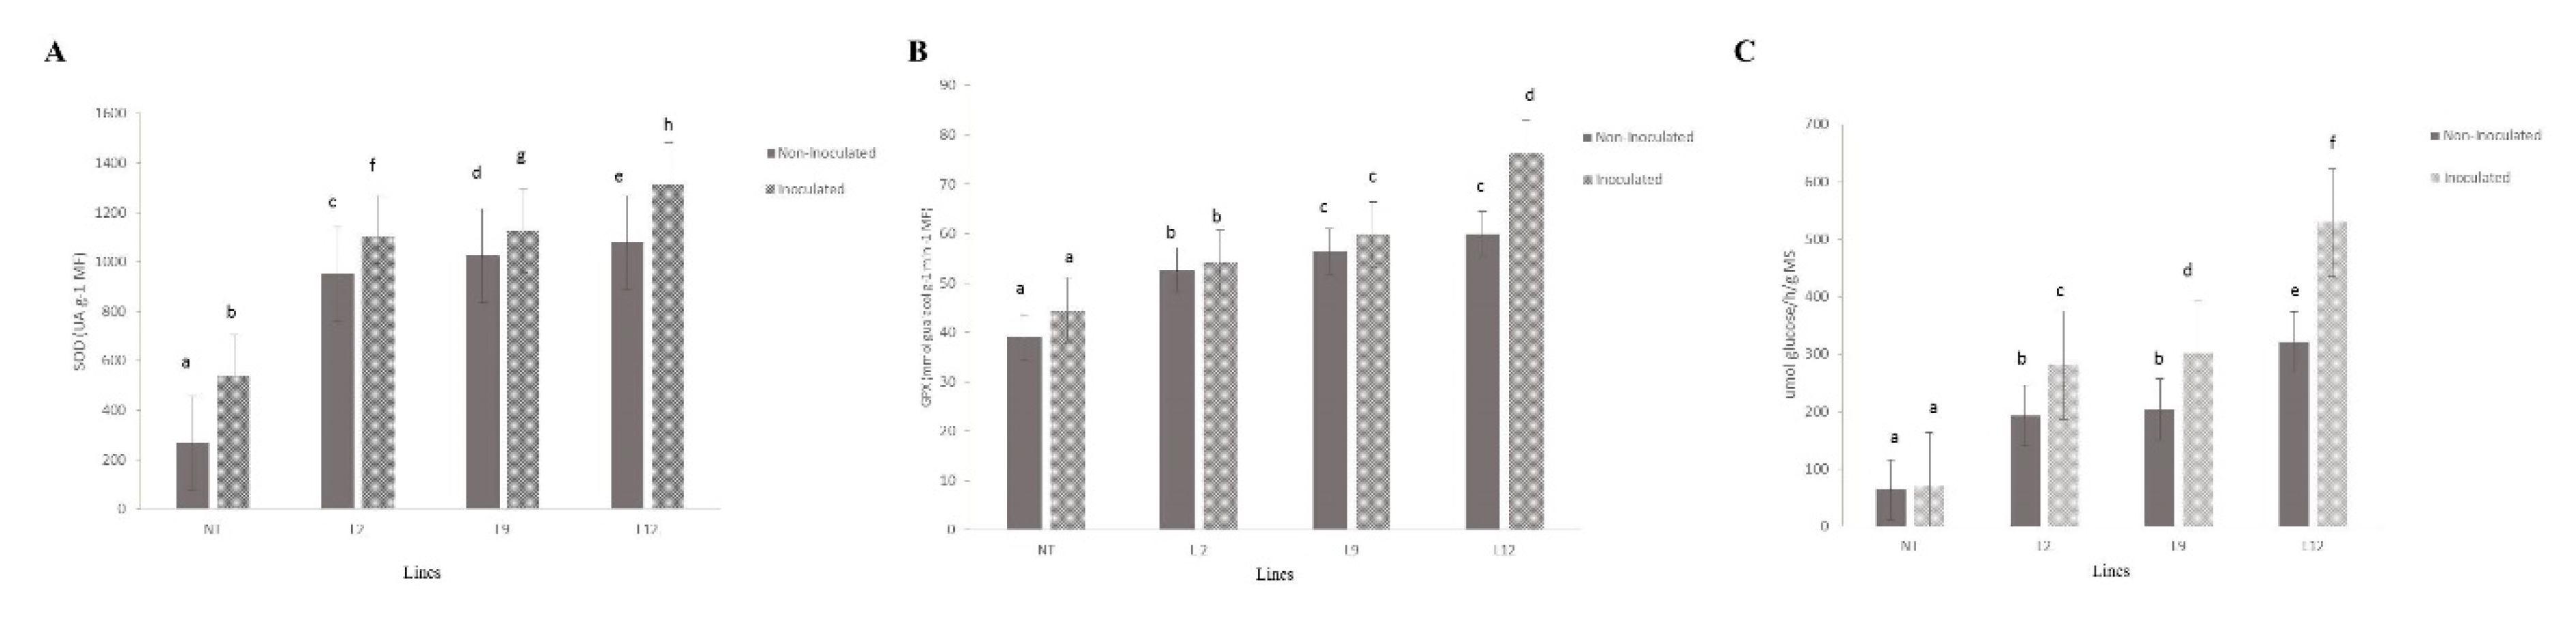
Disclaimer/Publisher’s Note: The statements, opinions and data contained in all publications are solely those of the individual author(s) and contributor(s) and not of MDPI and/or the editor(s). MDPI and/or the editor(s) disclaim responsibility for any injury to people or property resulting from any ideas, methods, instructions or products referred to in the content. |
© 2025 by the authors. Licensee MDPI, Basel, Switzerland. This article is an open access article distributed under the terms and conditions of the Creative Commons Attribution (CC BY) license (http://creativecommons.org/licenses/by/4.0/).
Copyright: This open access article is published under a Creative Commons CC BY 4.0 license, which permit the free download, distribution, and reuse, provided that the author and preprint are cited in any reuse.


