
Submitted:
30 December 2024
Posted:
02 January 2025
You are already at the latest version
Abstract
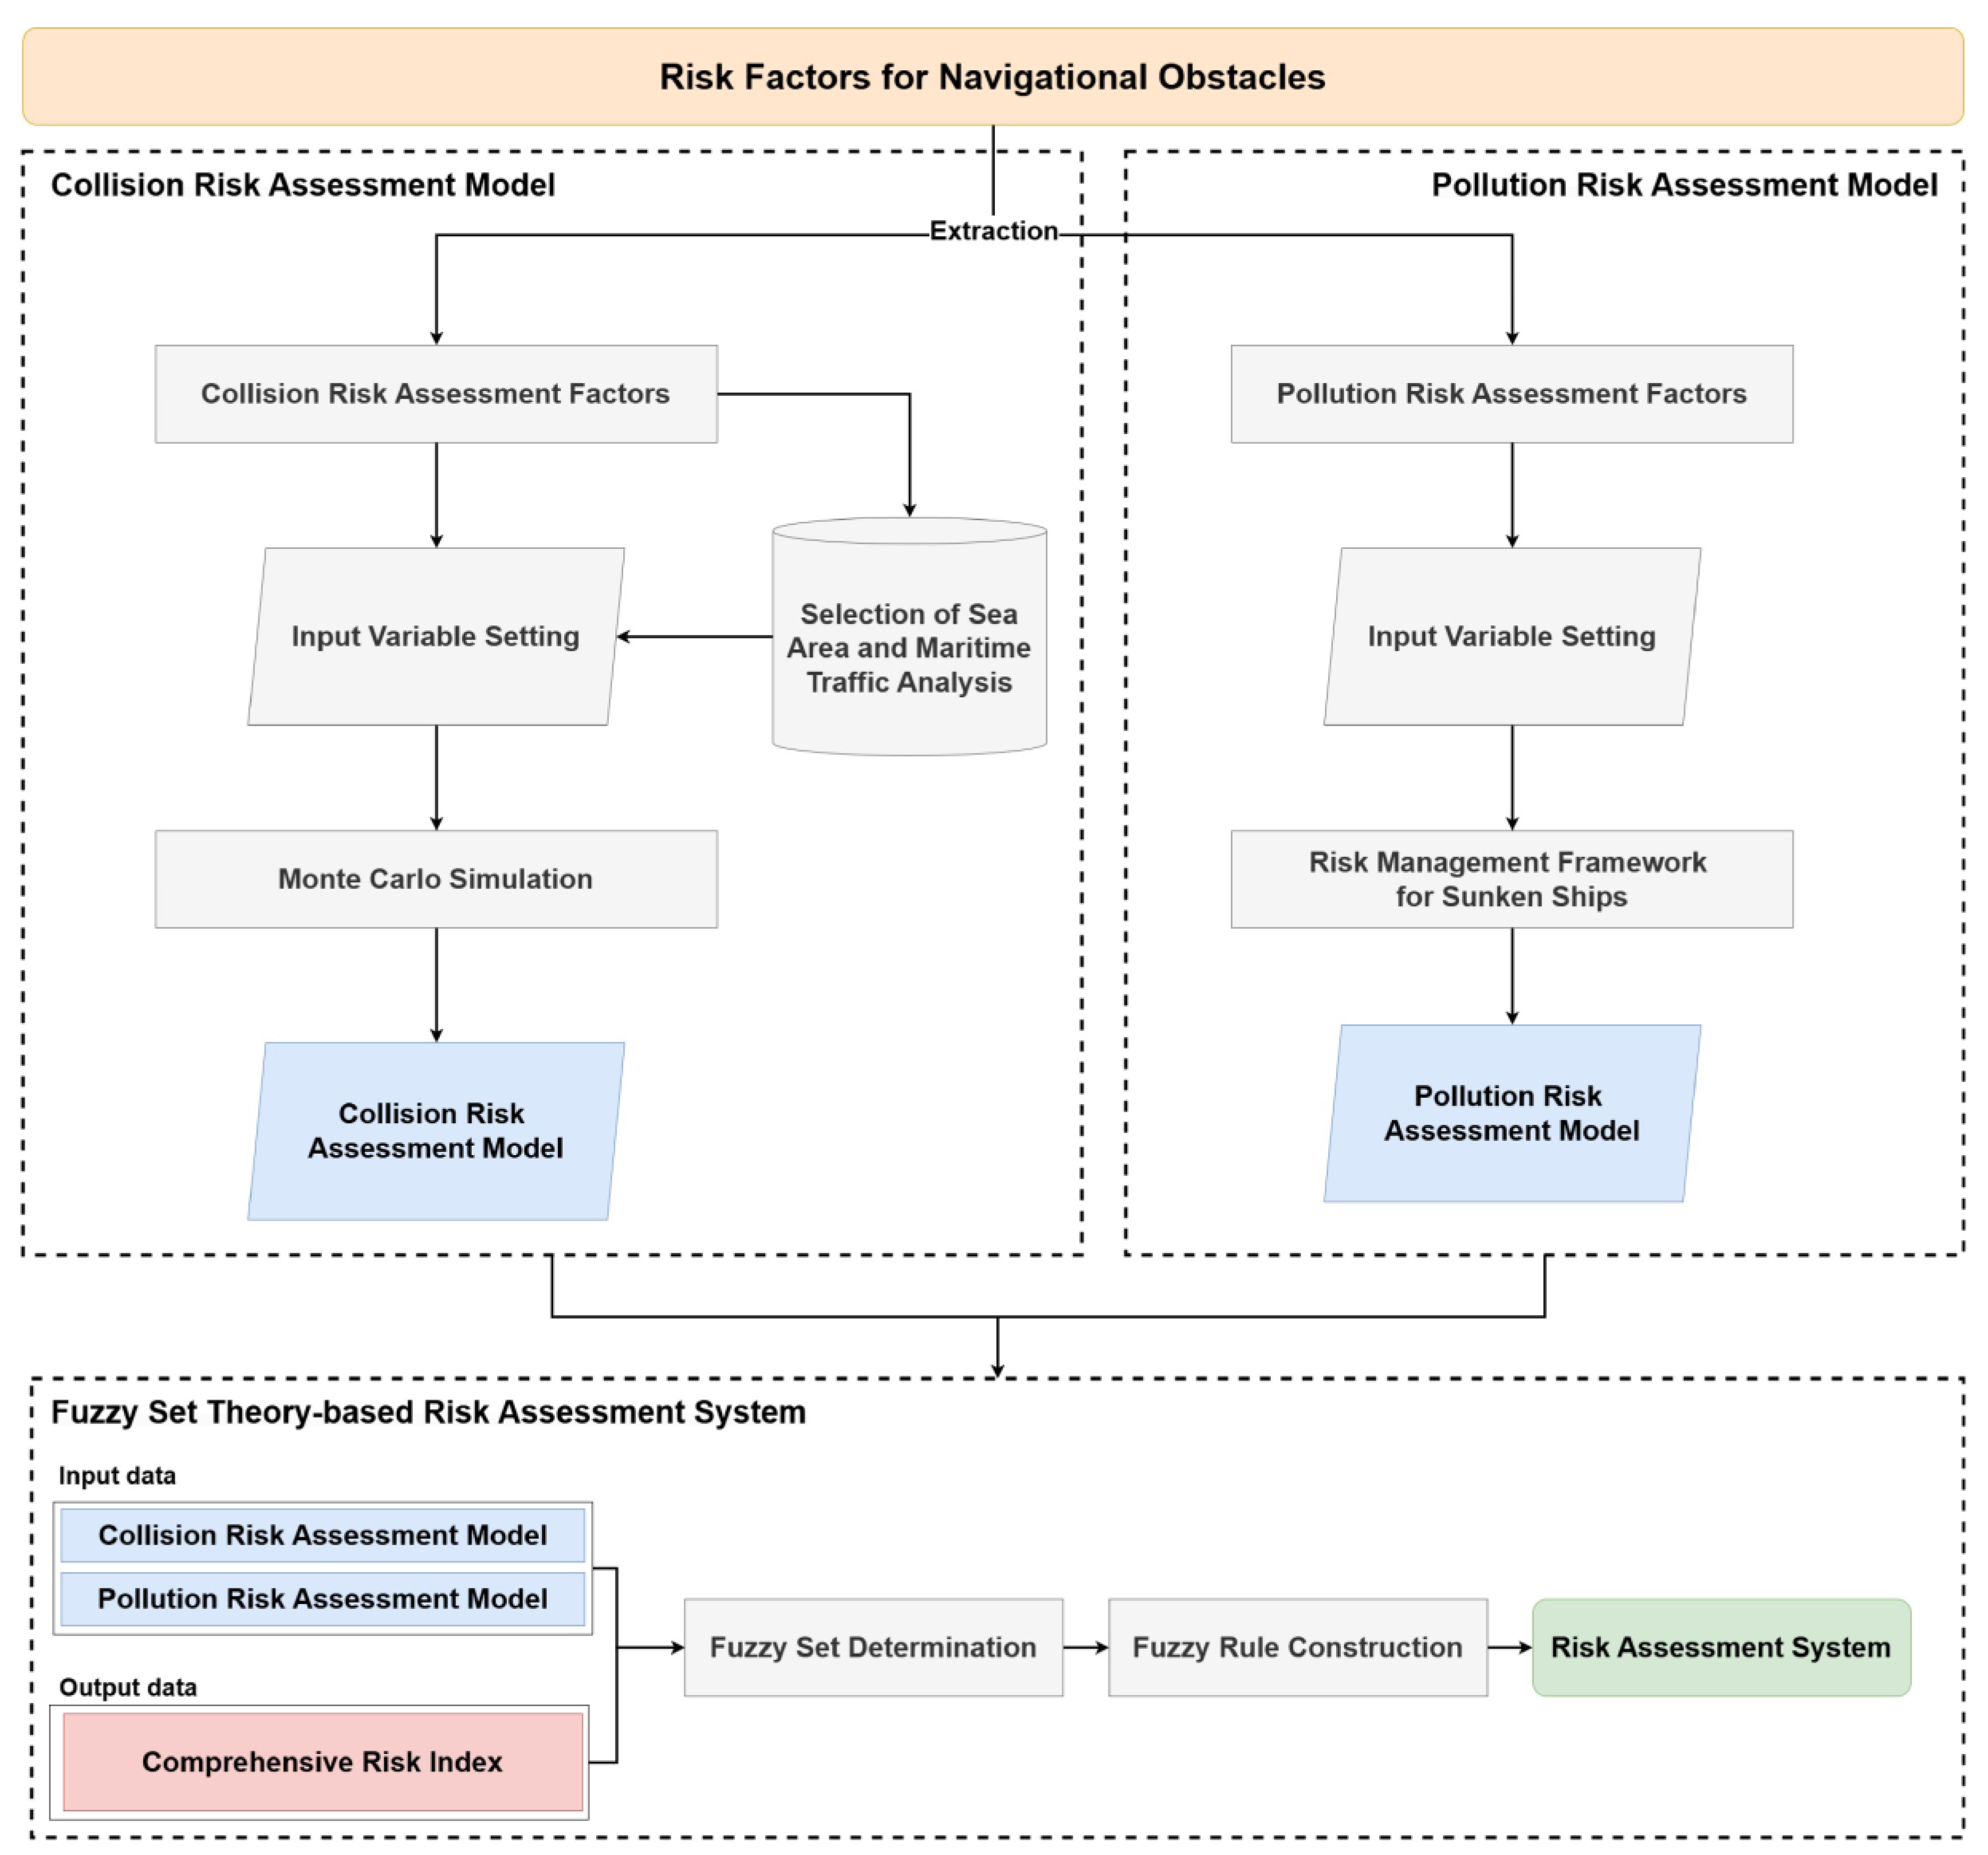
Navigational obstacles can impede safe vessel operation and cause secondary accidents, neces-sitating their rapid removal. To conduct these removal operations efficiently, it is necessary to comprehensively assess the effects of obstacles on both collision and pollution risks. However, comprehensive risk assessments that simultaneously consider both collision and pollution risks are lacking. In this study, a navigational obstacle risk assessment system based on the fuzzy set theory was developed to support the rapid removal of obstacles. The system comprises three main components: (i) a collision risk assessment model utilizing Monte Carlo simulation, (ii) a pollution risk assessment model employing a hazard management structure for sinking vessels, and (iii) a fuzzy set-based evaluation system that integrates risk indices derived from these models to infer the comprehensive risk. The results of the simulation-based case study confirm that the developed system provides reliable risk assessment by comprehensively considering both the collision and pollution risks. The system is sensitive to changes in the risk levels and effectively reflects the realistic conditions, thereby overcoming the limitations of existing research. This demonstrates its potential as a valuable tool for decision making for rapid removal of navigational obstacles.
Keywords:
1. Introduction
2. Theoretical Background
2.1. Determinants of Navigational Obstacle Hazards
2.2. Hazard Management Structure for Sunken Ships
- Article 47.2 of the Enforcement Rules of the Marine Environment Management Act (Risk Assessment, etc.).
- Article 47.3 of the Enforcement Rules of the Marine Environment Management Act (Implementation of Risk Reduction Measures).
- Article 47.4 of the Enforcement Rules of the Marine Environment Management Act (Calculation and Imposition of Costs for Implementation of Risk Reduction Measures).
- Article 47.5 of the Enforcement Rules of the Marine Environment Management Act (Management of Information on Sunken Ships).
- Sunken Ship Management Regulations (Decree of the Ministry of Oceans and Fisheries).
3. Fuzzy Set Theory-Based Risk Assessment System for Navigational Obstacles
3.1. Development Of Framework for Risk Assessment System
3.2. Risk Factors for Navigational Obstacles
- Types of major floating debris and whether they can be detected by radar or the naked eye.
- Maximum, minimum, and average sizes of the major floating debris.
- Types of floating debris collected at the study site.
- Mobility of debris influenced by the current and weather conditions.
- Major collection sites, debris generation sites, and vessel traffic in and around these areas.
- Disposal procedures and recording methods after debris collection.
3.3. Collision Risk Assessment Model
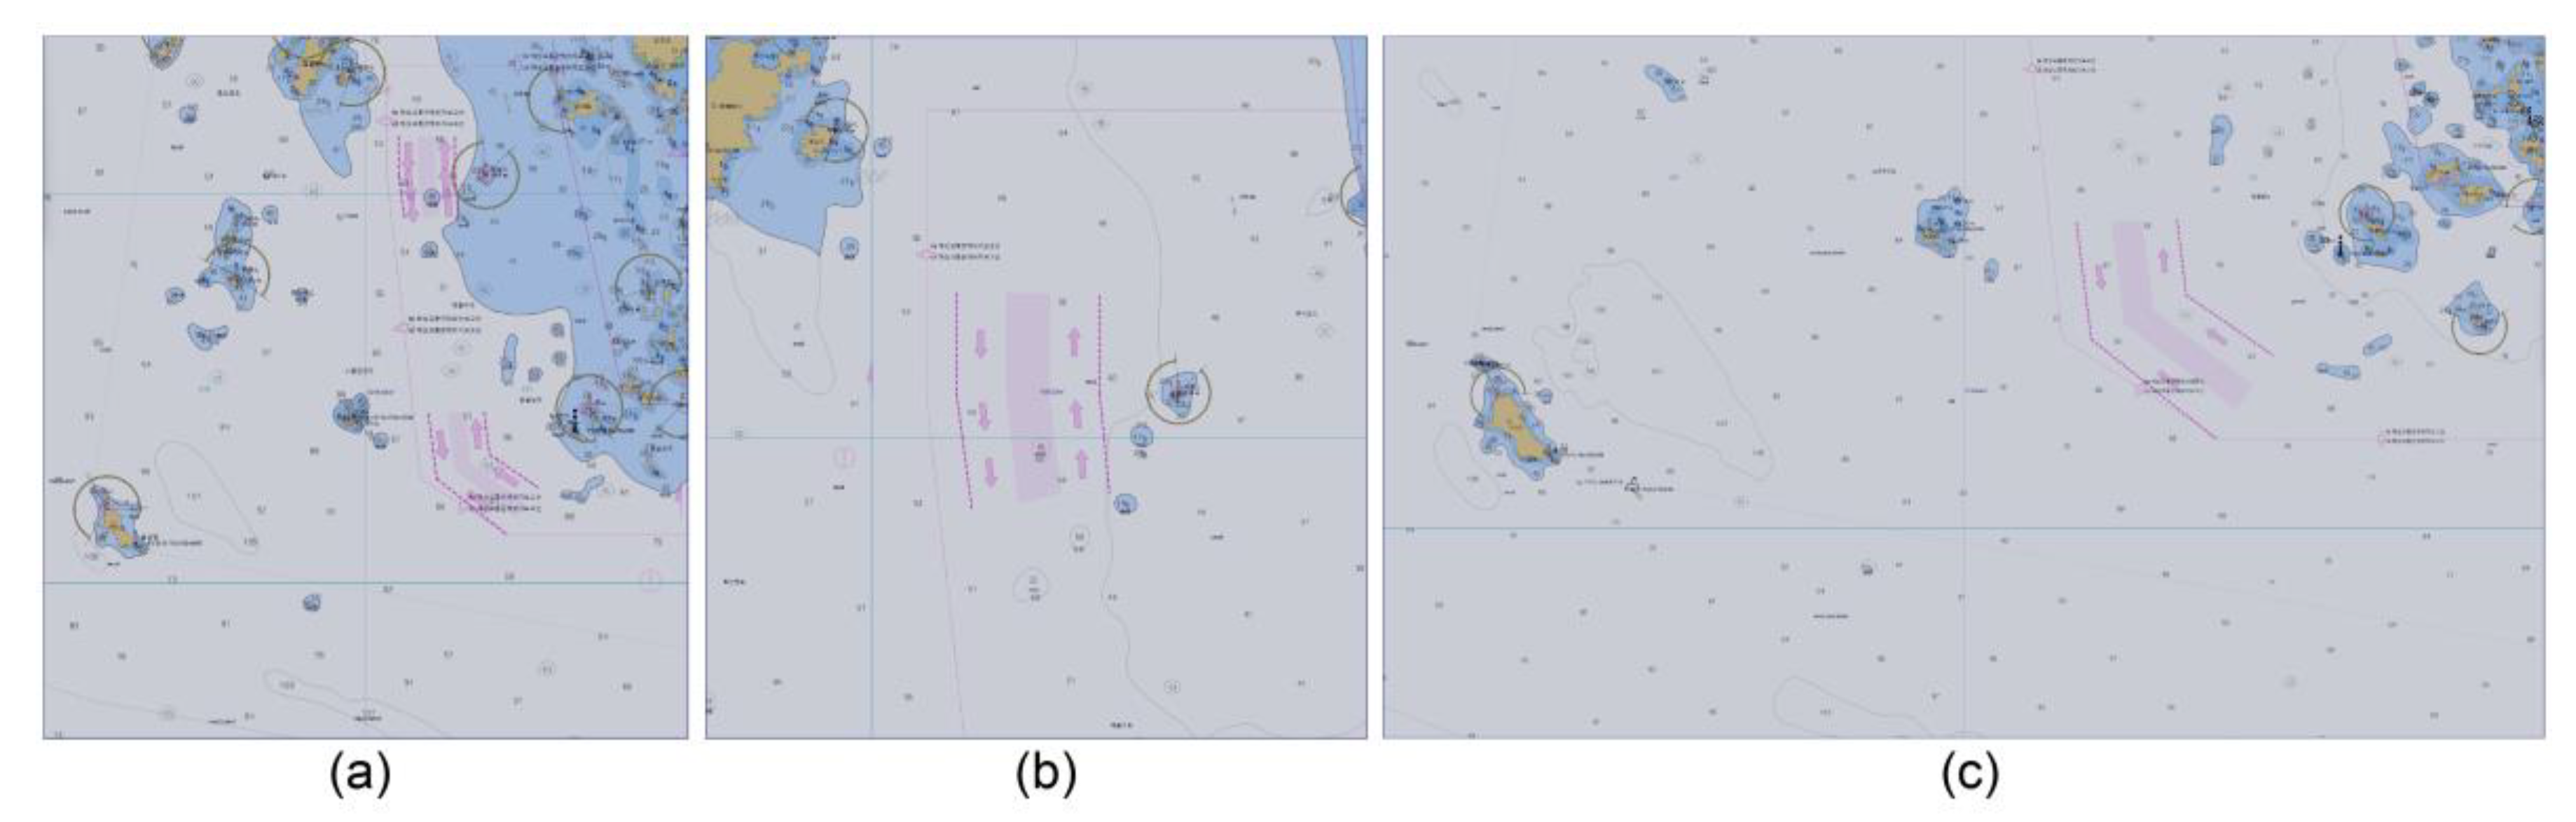
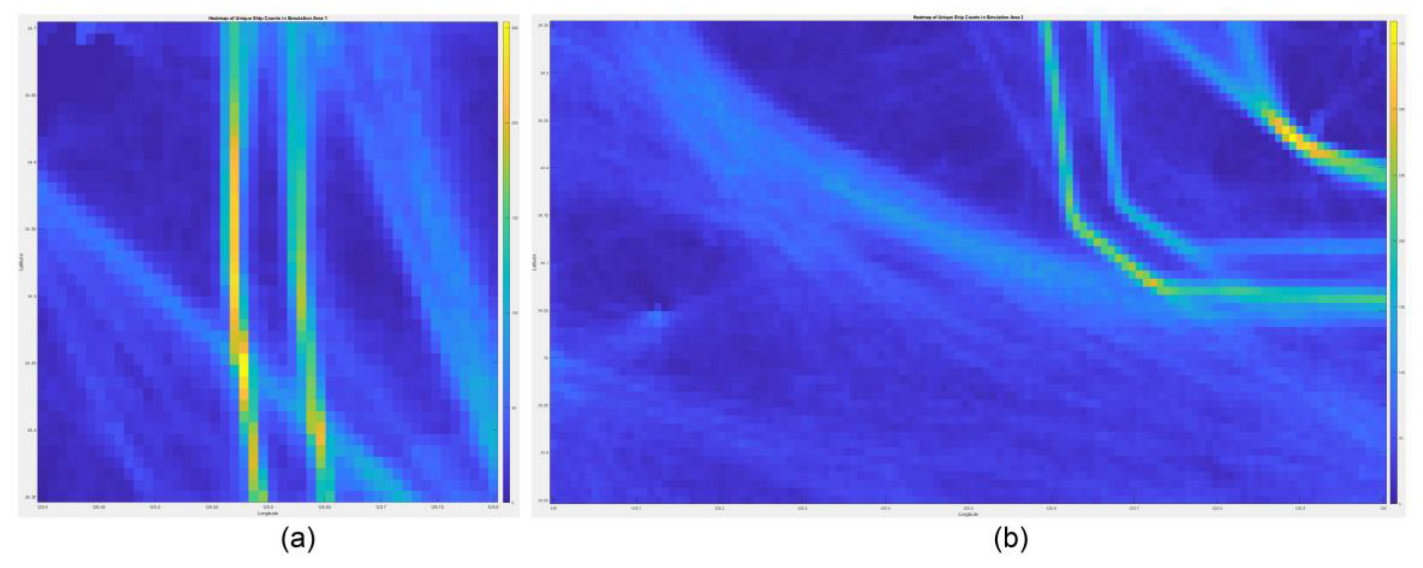
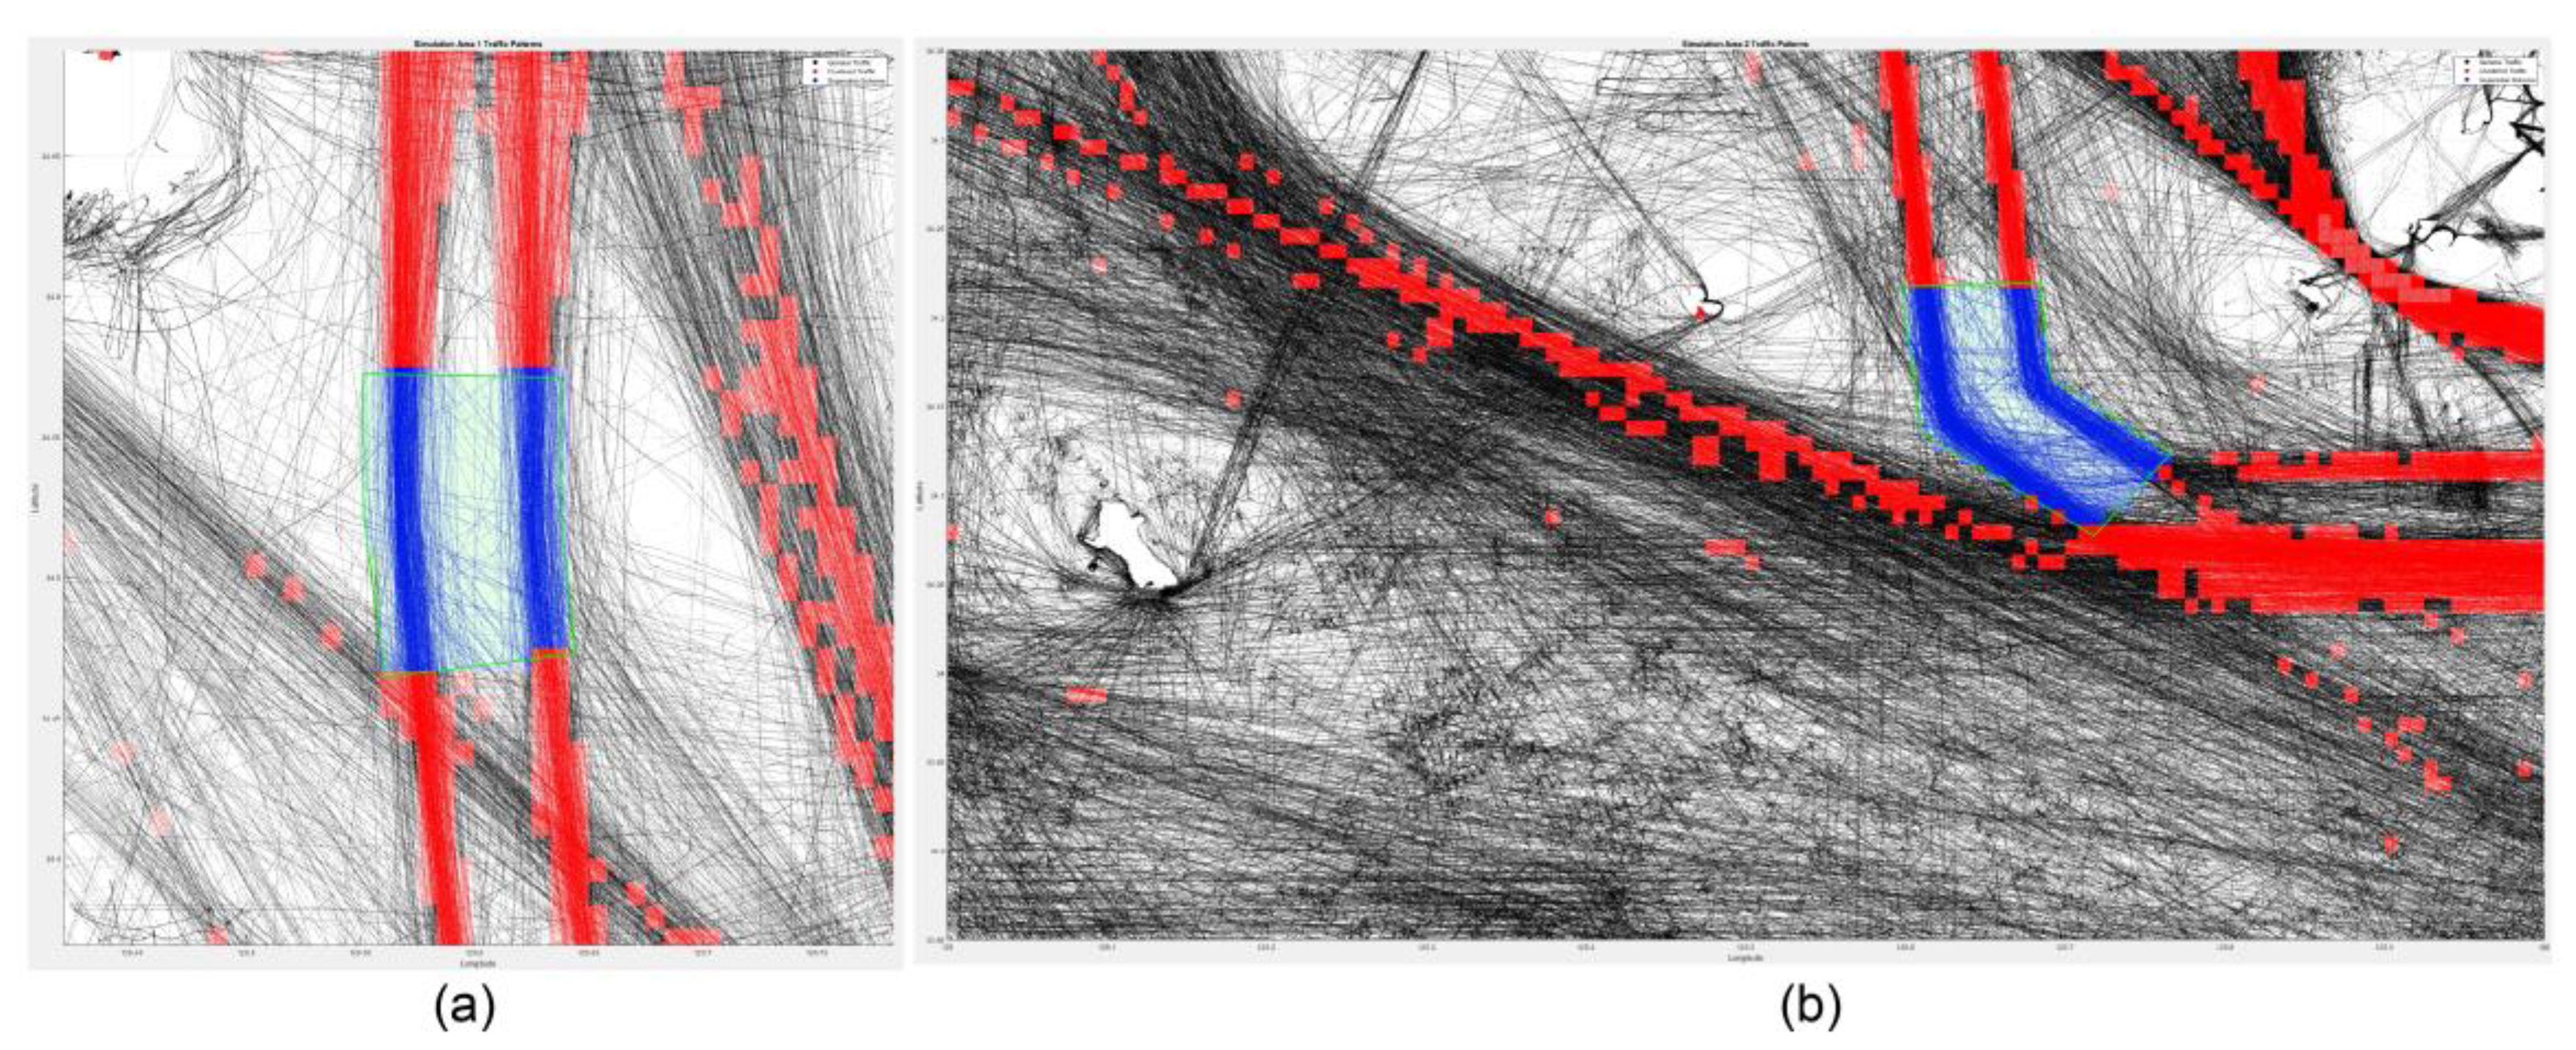
3.3.1. Selection of Simulation Waters and Analysis of Ship Traffic
3.3.2. Calculation of Collision Probability
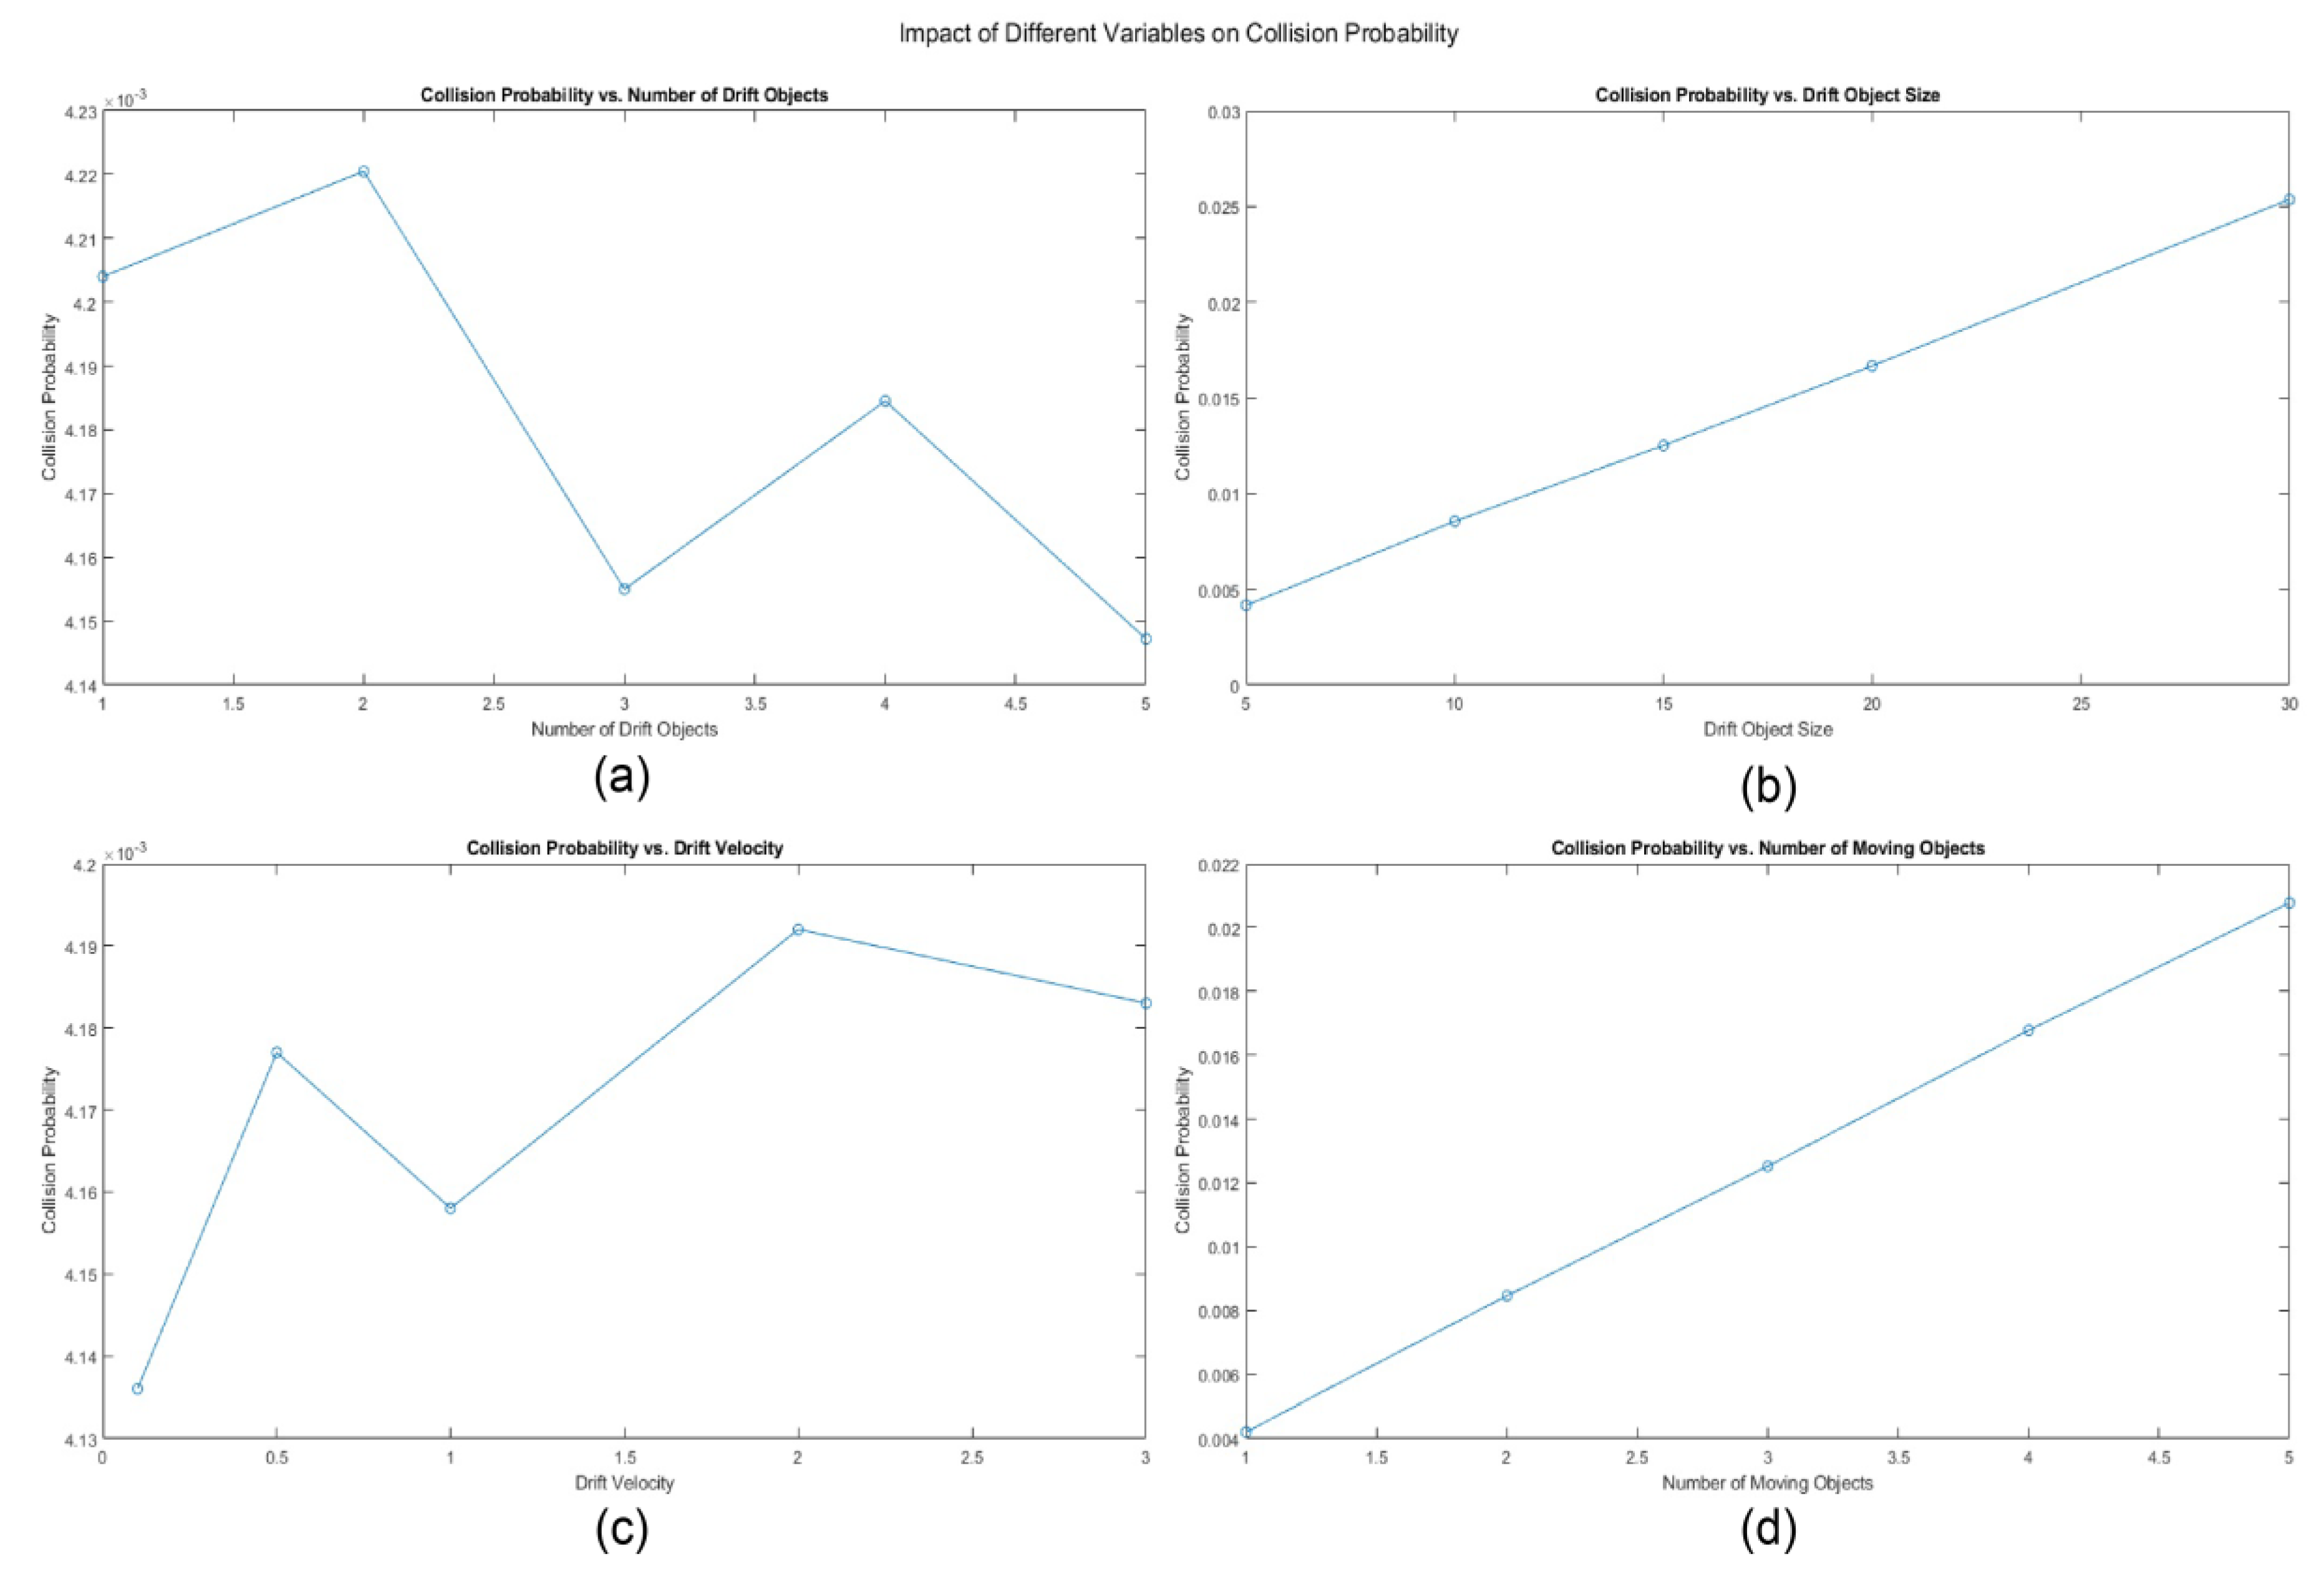
3.3.3. Monte Carlo Simulation Results
3.4. Pollution Risk Assessment Model
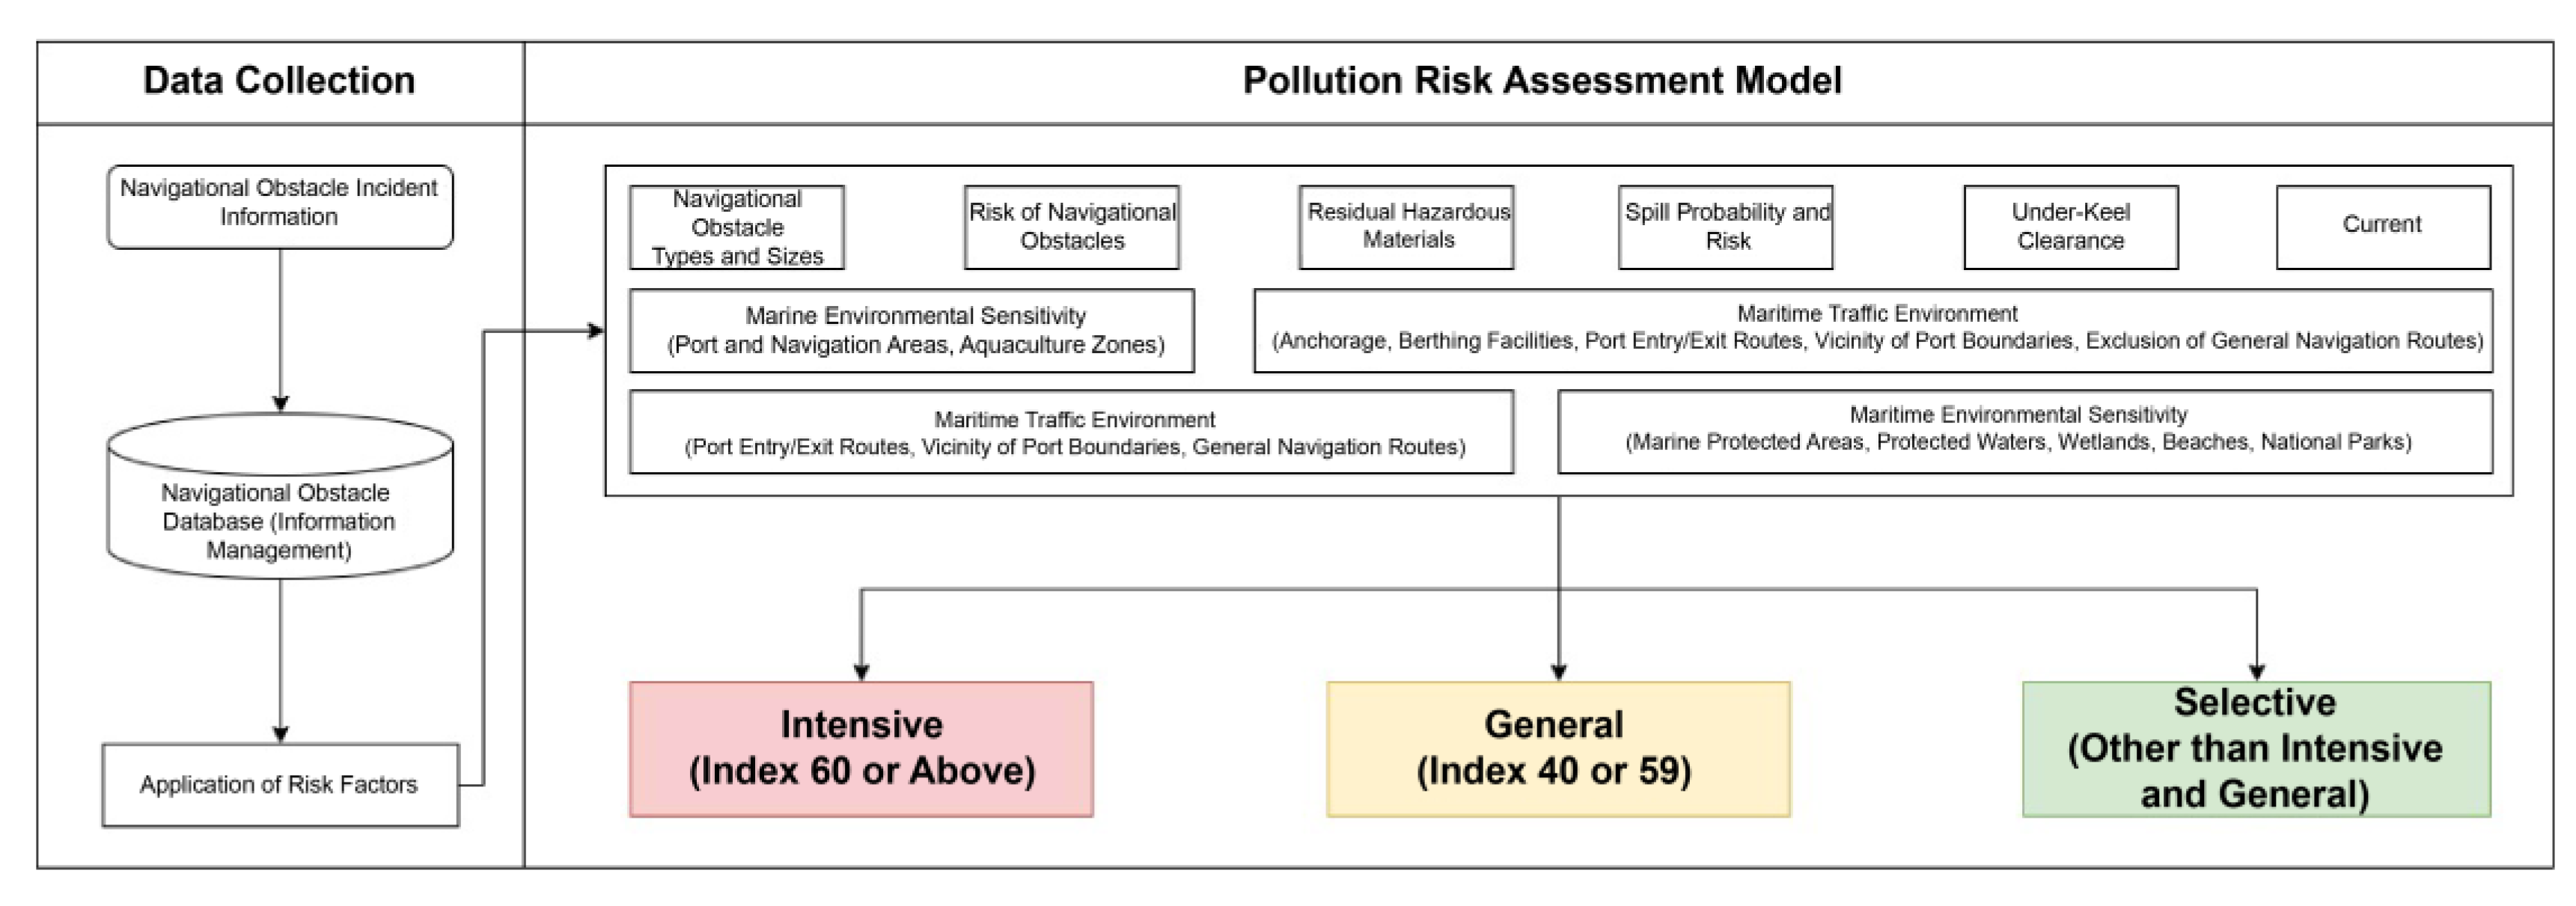
3.4.1. Determination Process of Pollution Risk Assessment Index
3.4.2. Pollution Risk Assessment Model
- Red (Intensive) if the combined index is more than 60 points,
- Yellow (General) if it is between 40 and 60 points,
- Green (Selective) if it is less than 40 points.
3.5. System Development
3.5.1. Development Process
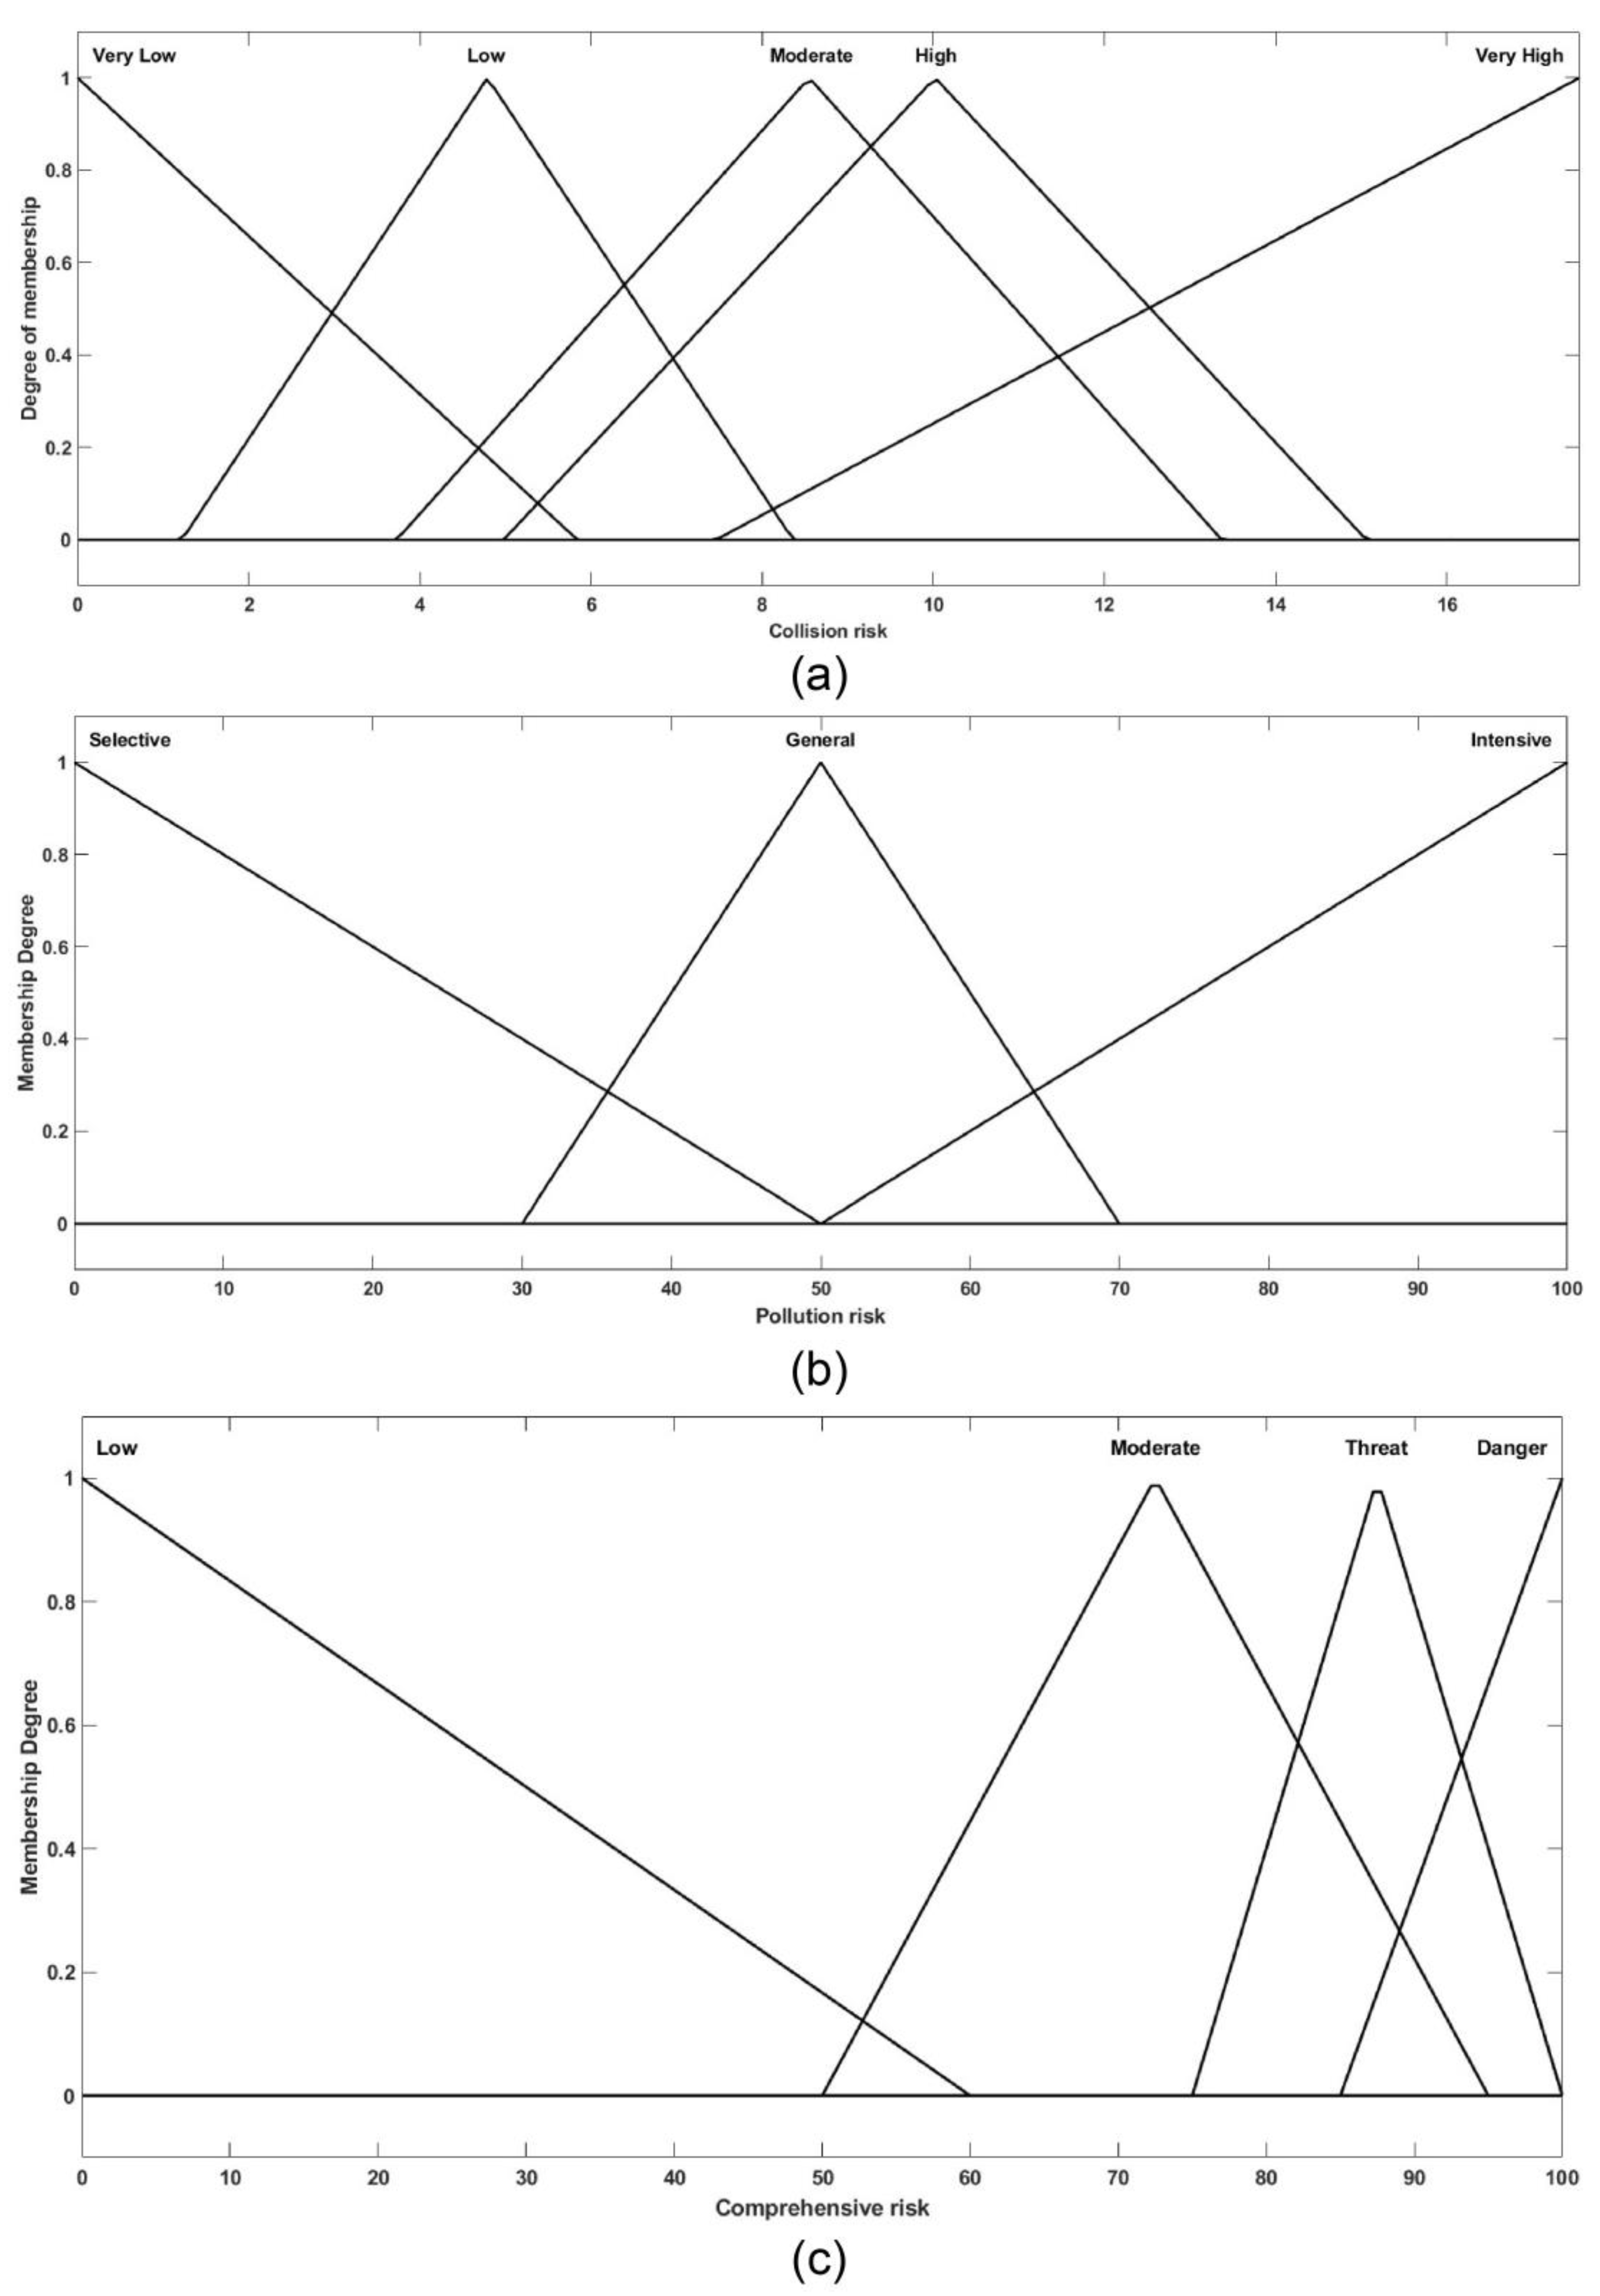
3.5.2. Determination of Fuzzy Set
- Low: Accident risk is less than 50%.
- Moderate (yellow): Accident risk is greater than 50% and less than 85%.
- Threat: Accident risk is greater than 85% but less than 95%.
- Danger (red): Risk of accident is at least 95%.
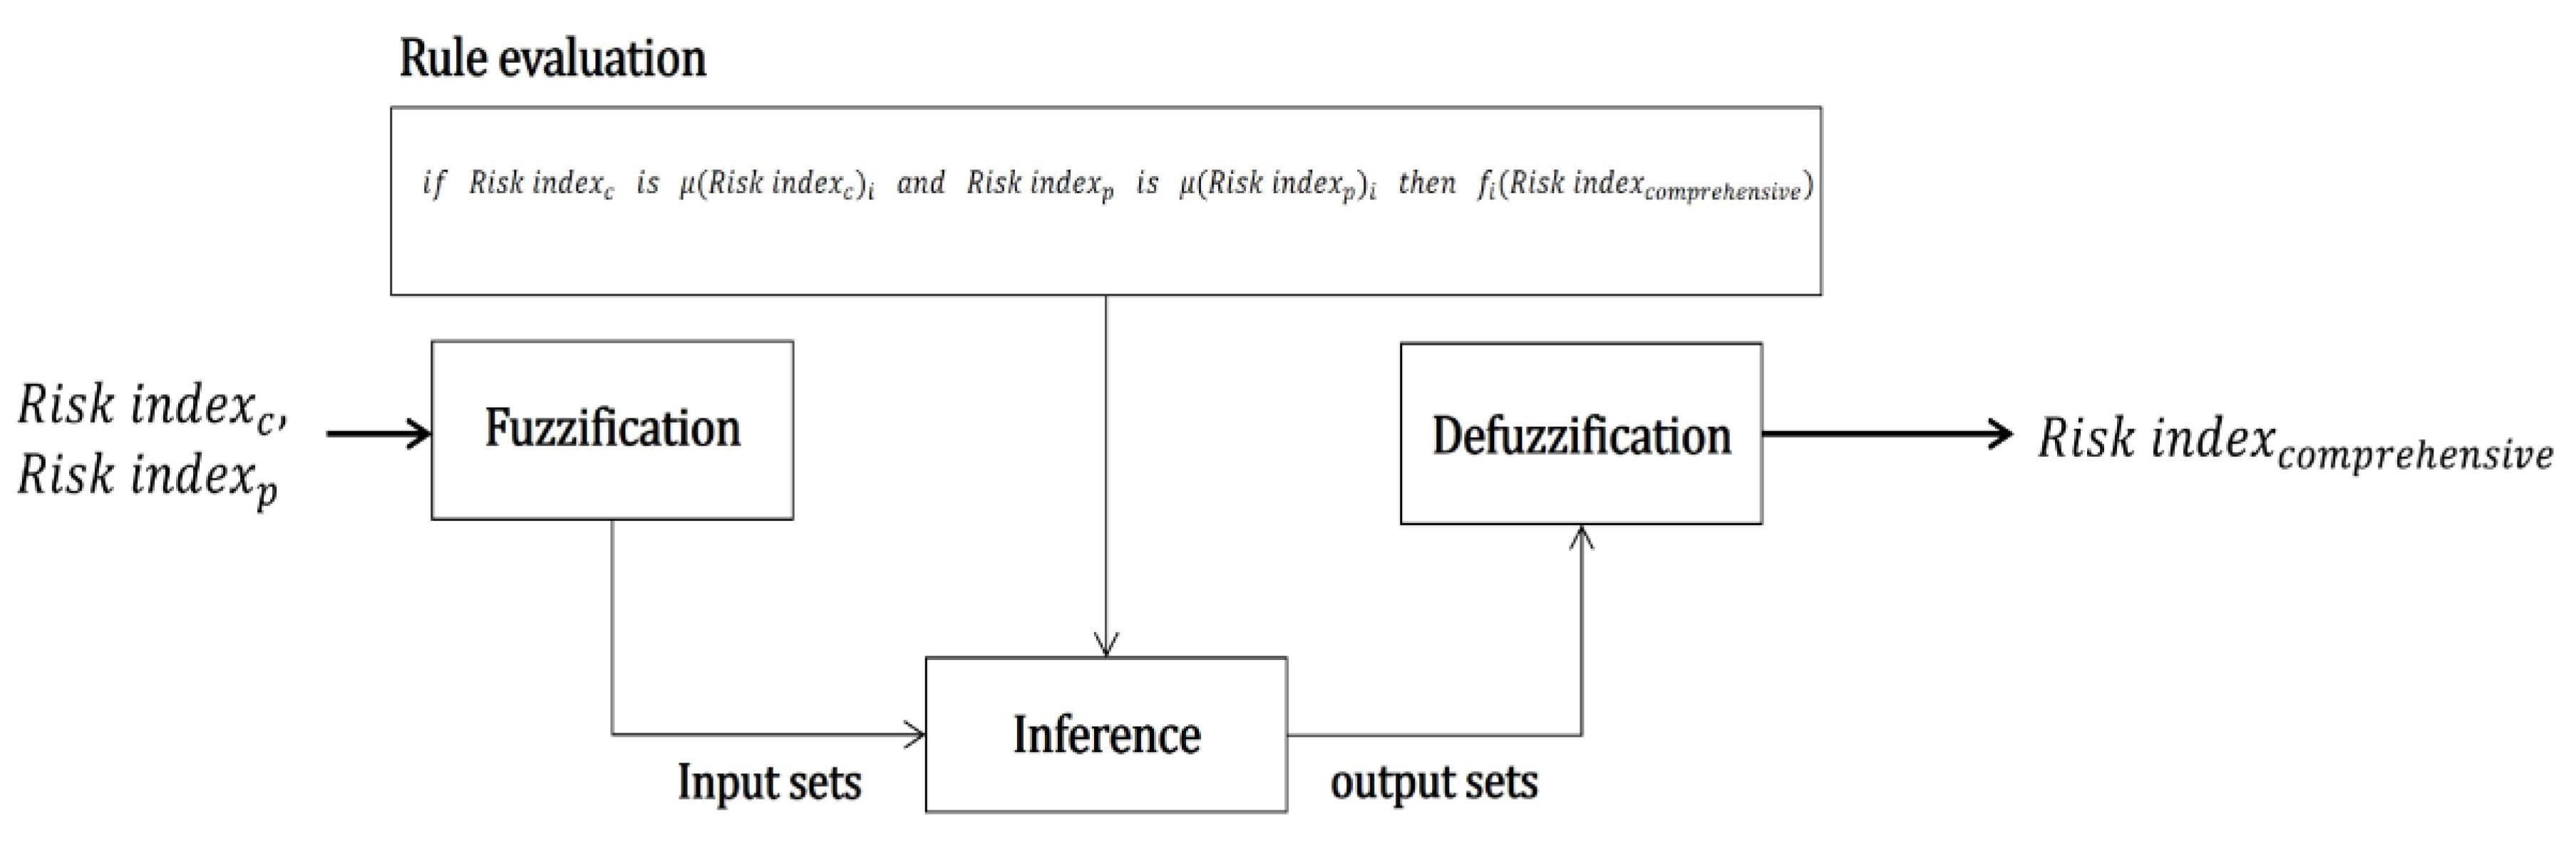
3.5.3. Fuzzy Rule Composition
3.5.4. Risk Assessment System
4. Case Study
4.1. Numerical Simulation Results
4.1.1. Micro-Level Results
4.1.2. Macro-Level Results
4.2. Discussion
5. Conclusions
Author Contributions
Funding
Data Availability Statement
Acknowledgments
Conflicts of Interest
Appendix A
- 1)
- Ship Types
| Ship type | Oil tanker, Hazardous material carrier |
General cargo ship | Tugboats and work vessels, Fishing vessels | Barges and other vessels | Unknown |
| Assessment index | 5 | 4 | 3 | 2 | 1 |
- 2)
- Ship Size
| Gross tonnage | 10,000 tons or more | 5,000 to less than 10,000 tons | 3,000 to less than 5,000 tons | 1,000 to less than 3,000 tons | 500 to less than 1,000 tons | 100 to less than 500 tons | Less than 100 tons |
| Assessment index | 5 | 4.5 | 4 | 3 | 2 | 1.5 | 1 |
- 3)
- Residual Hazardous Materials
| Residual quantity Hazardous materials |
1,000 ㎘ or more | 500 to less than 1,000 ㎘ | 100 to less than 500 ㎘ | 50 to less than 100 ㎘ | 10 to less than 50 ㎘ | Less than 10 ㎘ | None | |
| Oil | 24° API or below [Heavy fuel oil (HFO)] | 40 | 35 | 20 | 15 | 10 | 5 | 0 |
| 24° to 34° API [Intermediate fuel oil (IFO)] | 32 | 28 | 16 | 12 | 8 | 4 | 0 | |
| 34° to 44° API [Marine diesel oil (MFO)] | 16 | 14 | 8 | 6 | 4 | 2 | 0 | |
| 44° API or above [Marine gas oil (MGO)] | 8 | 7 | 4 | 3 | 2 | 1 | 0 | |
| Hazardous liquid substances | X | 40 | 35 | 20 | 15 | 10 | 5 | 0 |
| Y | 32 | 28 | 16 | 12 | 8 | 4 | 0 | |
| Z | 16 | 14 | 8 | 6 | 4 | 2 | 0 | |
| Other substances | 8 | 7 | 4 | 3 | 2 | 1 | 0 | |
| Radioactive materials | 40 | 0 | ||||||
- 4)
- Under-Keel Clearance
| Under-keel clearance | Less than 15 m | 15 m to less than 20 m | 20 m to less than 25 m | 25 m to less than 30 m | 30 m or more |
| Assessment index | 5 | 4 | 3 | 2 | 1 |
- 5)
- Marine Environmental Sensitivity
| Distance from shoreline or sensitive area | Less than 1 nautical mile | 1 to less than 5 nautical miles | 5 to less than 12 nautical miles | 12 to less than 25 nautical miles | 25 nautical miles or more |
| Assessment index | 15 | 10 | 7 | 4 | 1 |
- 6)
- Spill Probability
- (a)
- Age of Ship Before the Incident
| Ship age | 20 years or more | 10 to less than 20 years | 5 to less than 10 years | Less than 5 years |
| Assessment index | 4 | 3 | 2 | 1 |
- (b) Elapsed time since the incident
| Elapsed time | 25 years or more | 20 to less than 25 years | 15 to less than 20 years | 10 to less than 15 years | 5 to less than 10 years | Less than 5 years |
| Assessment index | 6 | 5 | 4 | 3 | 2 | 1 |
- 7)
- Maritime Traffic Environment
| Traffic environment | Port entry/ Exit routes |
Vicinity of port boundaries | Anchorage | General navigation routes | Others |
| Assessment index | 10 | 8 | 6 | 4 | 2 |
- 8)
- Hull risk
| Hull risk (Accident type) | Sinking due to hull damage from external forces (e.g., fire, explosion, collision, grounding, etc.) | Sinking without hull damage (e.g., flooding, capsizing, etc.) |
| Assessment index | 5 | 1 |
- 9)
- Currents
| Current speed | Above 2 knots | 1 to less than 2 knots | Below 1 knot |
| Assessment index | 5 | 3 | 1 |
References
- Maritime Traffic Safety Act. Available online: https://law.go.kr/LSW//lsInfoP.do?lsId=014483&ancYnChk=0#0000 (accessed on 11 Nov. 2024).
- Marine accident statistics 2023. Available online: https://www.kmst.go.kr/web/board.do?menuIdx=135 (accessed on 11 Nov. 2024).
- Takehama, S. Estimation of damage to fishing vessels caused by marine debris, based on insurance statistics. In Proceeding of the Second International Conference on Marine Debris, Honolulu, Hawaii, 2-7 April 1989. [Google Scholar]
- Nash, A.D. Impacts of marine debris on subsistence fishermen an exploratory study. Mar. Pollut. Bull. 1992, 24, 150–156. [Google Scholar] [CrossRef]
- Cho, D.O. Challenges to marine debris management in Korea. Coast. Manag. 2005, 33, 89–409. [Google Scholar] [CrossRef]
- Byard, R.W. Commercial fishing industry deaths – forensic issues. J. Forensic Leg. Med. 2013, 20, 129–132. [Google Scholar] [CrossRef]
- Maritime Traffic Safety Act. Available online: https://www.law.go.kr/%EB%B2%95%EB%A0%B9/%ED%95%B4%EC%83%81%EA%B5%90%ED%86%B5%EC%95%88%EC%A0%84%EB%B2%95 (accessed on 11 Nov. 2024).
- Lincoln, S.; Andrews, B.; Birchenough, S.N.R.; Chowdhury, P.; Engelhard, G.H.; Harrod, O.; Pinnegar, J.K.; Townhill, B.L. Marine litter and climate change: inextricably connected threats to the world’s oceans. Sci. Total Environ. 2022, 837, 155709. [Google Scholar] [CrossRef] [PubMed]
- Haarr, M.L.; Falk-Andersson, J.; Fabres, J. Global marine litter research 2015–2020: geographical and methodological trends. Sci. Total Environ. 2022, 820, 153162. [Google Scholar] [CrossRef]
- González-Fernández, D.; Hanke, G. Floating marine macro litter in the Black Sea: toward baselines for large scale assessment. Environ. Pollut. 2020, 309, 119816. [Google Scholar] [CrossRef]
- Chiu, C.C.; Liao, C.P.; Kuo, T.C.; Huang, H.W. Using citizen science to investigate the spatial-temporal distribution of floating marine litter in the waters around Taiwan. Mar. Pollut. Bull. 2020, 157, 111301. [Google Scholar] [CrossRef] [PubMed]
- Pogojeva, M.; Zhdanov, I.; Berezina, A.; Lapenkov, A.; Kosmach, D.; Osadchiev, A.; Hanke, G.; Semiletov, I.; Yakushev, E. Distribution of floating marine macro-litter in relation to oceanographic characteristics in the Russian Arctic Seas. Mar. Pollut. Bull. 2021, 166, 112201. [Google Scholar] [CrossRef]
- Sá, S.; Bastos-Santos, J. Floating marine litter and their risks to cetaceans off Portugal. Mar. Pollut. Bull. 2021, 170, 112603. [Google Scholar] [CrossRef] [PubMed]
- Ruiz, I.; Burgoa, I.; Santos, M.; Basurko, O.C.; García-Barón, I.; Louzao, M.; Beldarrain, B.; Kukul, D.; Valle, C.; Uriarte, A.; et al. First assessment of floating marine litter abundance and distribution in the Bay of Biscay from an integrated ecosystem survey. Mar. Pollut. Bull. 2022, 174, 113266. [Google Scholar] [CrossRef] [PubMed]
- Andrés, M.; Delpey, M.; Ruiz, I.; Declerck, A.; Sarrade, C.; Bergeron, P.; Basurko, O.C. Measuring and comparing solutions for floating marine litter removal: lessons learned in the south-east coast of the Bay of Biscay from an economic perspective. Mar. Policy 2021, 127, 104450. [Google Scholar] [CrossRef]
- Topouzelis, K.; Papageorgiou, D.; Suaria, G.; Aliani, S. Floating marine litter detection algorithms and techniques using optical remote sensing data: a review. Mar. Pollut. Bull. 2021, 170, 112675. [Google Scholar] [CrossRef]
- Garcia-Garin, O.; Monleón-Getino, T.; López-Brosa, P.; Borrell, A.; Aguilar, A.; Borja-Robalino, R.; Cardona, L.; Vighi, M. Automatic detection and quantification of floating marine macro-litter in aerial images: introducing a novel deep learning approach connected to a web application in R. Environ. Pollut. 2021, 273, 116490. [Google Scholar] [CrossRef] [PubMed]
- Hong, S.; Lee, J.; Lim, S. Navigational threats by derelict fishing gear to navy ships in the Korean seas. Mar. Pollut. Bull. 2017, 119, 100–105. [Google Scholar] [CrossRef] [PubMed]
- NOAA. Risk Assessment for Potentially Polluting Wrecks in U.S. Waters. Silver Spring, MD: National Oceanic and Atmospheric Administration, 2013.
- Alcaro, L. The DEEPP project, PPSWs within the Mediterranean cetacean sanctuary. Europe First Adriatic Oil Spill Conf. 2010. [Google Scholar]
- Alcaro, L. , et al. DEEPP Project Development of European Guidelines for Potentially Polluting Shipwrecks. Rome: EU DG Environment, Civil Protection Unit, 2007.
- Zadeh, L.A. The concept of a linguistic variable and its application to approximate reasoning-I. Inf. Sci. 1975, 8, 199–249. [Google Scholar] [CrossRef]
- Ohn, S.W.; Namgung, H. Interval type-2 fuzzy inference system based on closest point of approach for collision avoidance between ships. Appl. Sci. 2020, 10. [Google Scholar] [CrossRef]
- Namgung, H.; Kim, J.S. Collision risk inference system for maritime autonomous surface ships using COLREGs rules compliant collision avoidance. IEEE Access 2021, 9, 7823–7835. [Google Scholar] [CrossRef]
- Namgung, H.; Jeong, J.-S.; Kim, J.-S.; Kim, K.-I. Inference model of collision risk index based on artificial neural network using ship near-collision data. J. Phys. Conf. Ser. 2019, 1357, 012044. [Google Scholar] [CrossRef]
- Namgung, H.; Ohn, S.-W. Fuzzy inference and sequence model-based collision risk prediction system for stand-on vessel. Sensors (Basel) 2022, 22. [Google Scholar] [CrossRef] [PubMed]
- Zhen, R.; Lv, P.; Shi, Z.; Chen, G. A novel fuzzy multi-factor navigational risk assessment method for ship route optimization in coastal offshore wind farm waters. Ocean Coast. Manag. 2023, 232, 106428. [Google Scholar] [CrossRef]
- Shi, Z.; Zhen, R.; Liu, J. Fuzzy logic-based modeling method for regional multi-ship collision risk assessment considering impacts of ship crossing angle and navigational environment. Ocean Eng. 2022, 259, 111847. [Google Scholar] [CrossRef]
- Enforcement Rules of the Maritime Traffic Safety Act. Available online: https://www.law.go.kr/lsInfoP.do?lsiSeq=260107&efYd=20240726#0000 (accessed on 11 Nov. 2024).
- Enforcement Rules of the Marine Environment Management Act. Available online: https://law.go.kr/%EB%B2%95%EB%A0%B9/%ED%95%B4%EC%96%91%ED%99%98%EA%B2%BD%EA%B4%80%EB%A6%AC%EB%B2%95%EC%8B%9C%ED%96%89%EA%B7%9C%EC%B9%99 (accessed on 11 Nov. 2024).
- Maritime Traffic Safety Information System. Available online: https://mtis.komsa.or.kr/traffic/focst/acdntRisk (accessed on 11 Nov. 2024).
- Ester, M.; Kriegel, H.-P.; Sander, J.; Xu, X. A density-based algorithm for discovering clusters in large spatial databases with noise. In Proceedings of the 2nd International Conference on Knowledge Discovery and Data Mining (KDD’96), Portland, OR, USA, 2–4 Aug. 1996. [Google Scholar]
- Namgung, H.; Kim, J.-S. Regional collision risk prediction system at a collision area considering spatial pattern. J. Mar. Sci. Eng. 2021, 9. [Google Scholar] [CrossRef]
- Banack, H.R.; Hayes-Larson, E.; Mayeda, E.R. Monte Carlo simulation approaches for quantitative bias analysis: A tutorial. Epidemiol. Rev. 2022, 43, 106–117. [Google Scholar] [CrossRef]
- Namgung, H.; Kim, J.-S. Vessel trajectory analysis in designated harbor route considering the influence of external forces. J. Mar. Sci. Eng. 2020, 8, 860. [Google Scholar] [CrossRef]
- Current status of ships sinking at the Korea maritime environment corporation. Available online: https://www.data.go.kr/data/15004149/fileData.do?recommendDataYn=Y (accessed on 11 Nov. 2024).


| Number | Assessment factor | Assessment index |
|---|---|---|
| 1 | Ship type | 5 |
| 2 | Ship size | 5 |
| 3 | Residual hazardous materials | 40 |
| 4 | Under-keel clearance | 5 |
| 5 | Marine environmental sensitivity | 15 |
| 6 | Spill probability | 10 |
| 7 | Maritime Traffic Environment | 10 |
| 8 | Hull Risk | 5 |
| 9 | Currents | 5 |
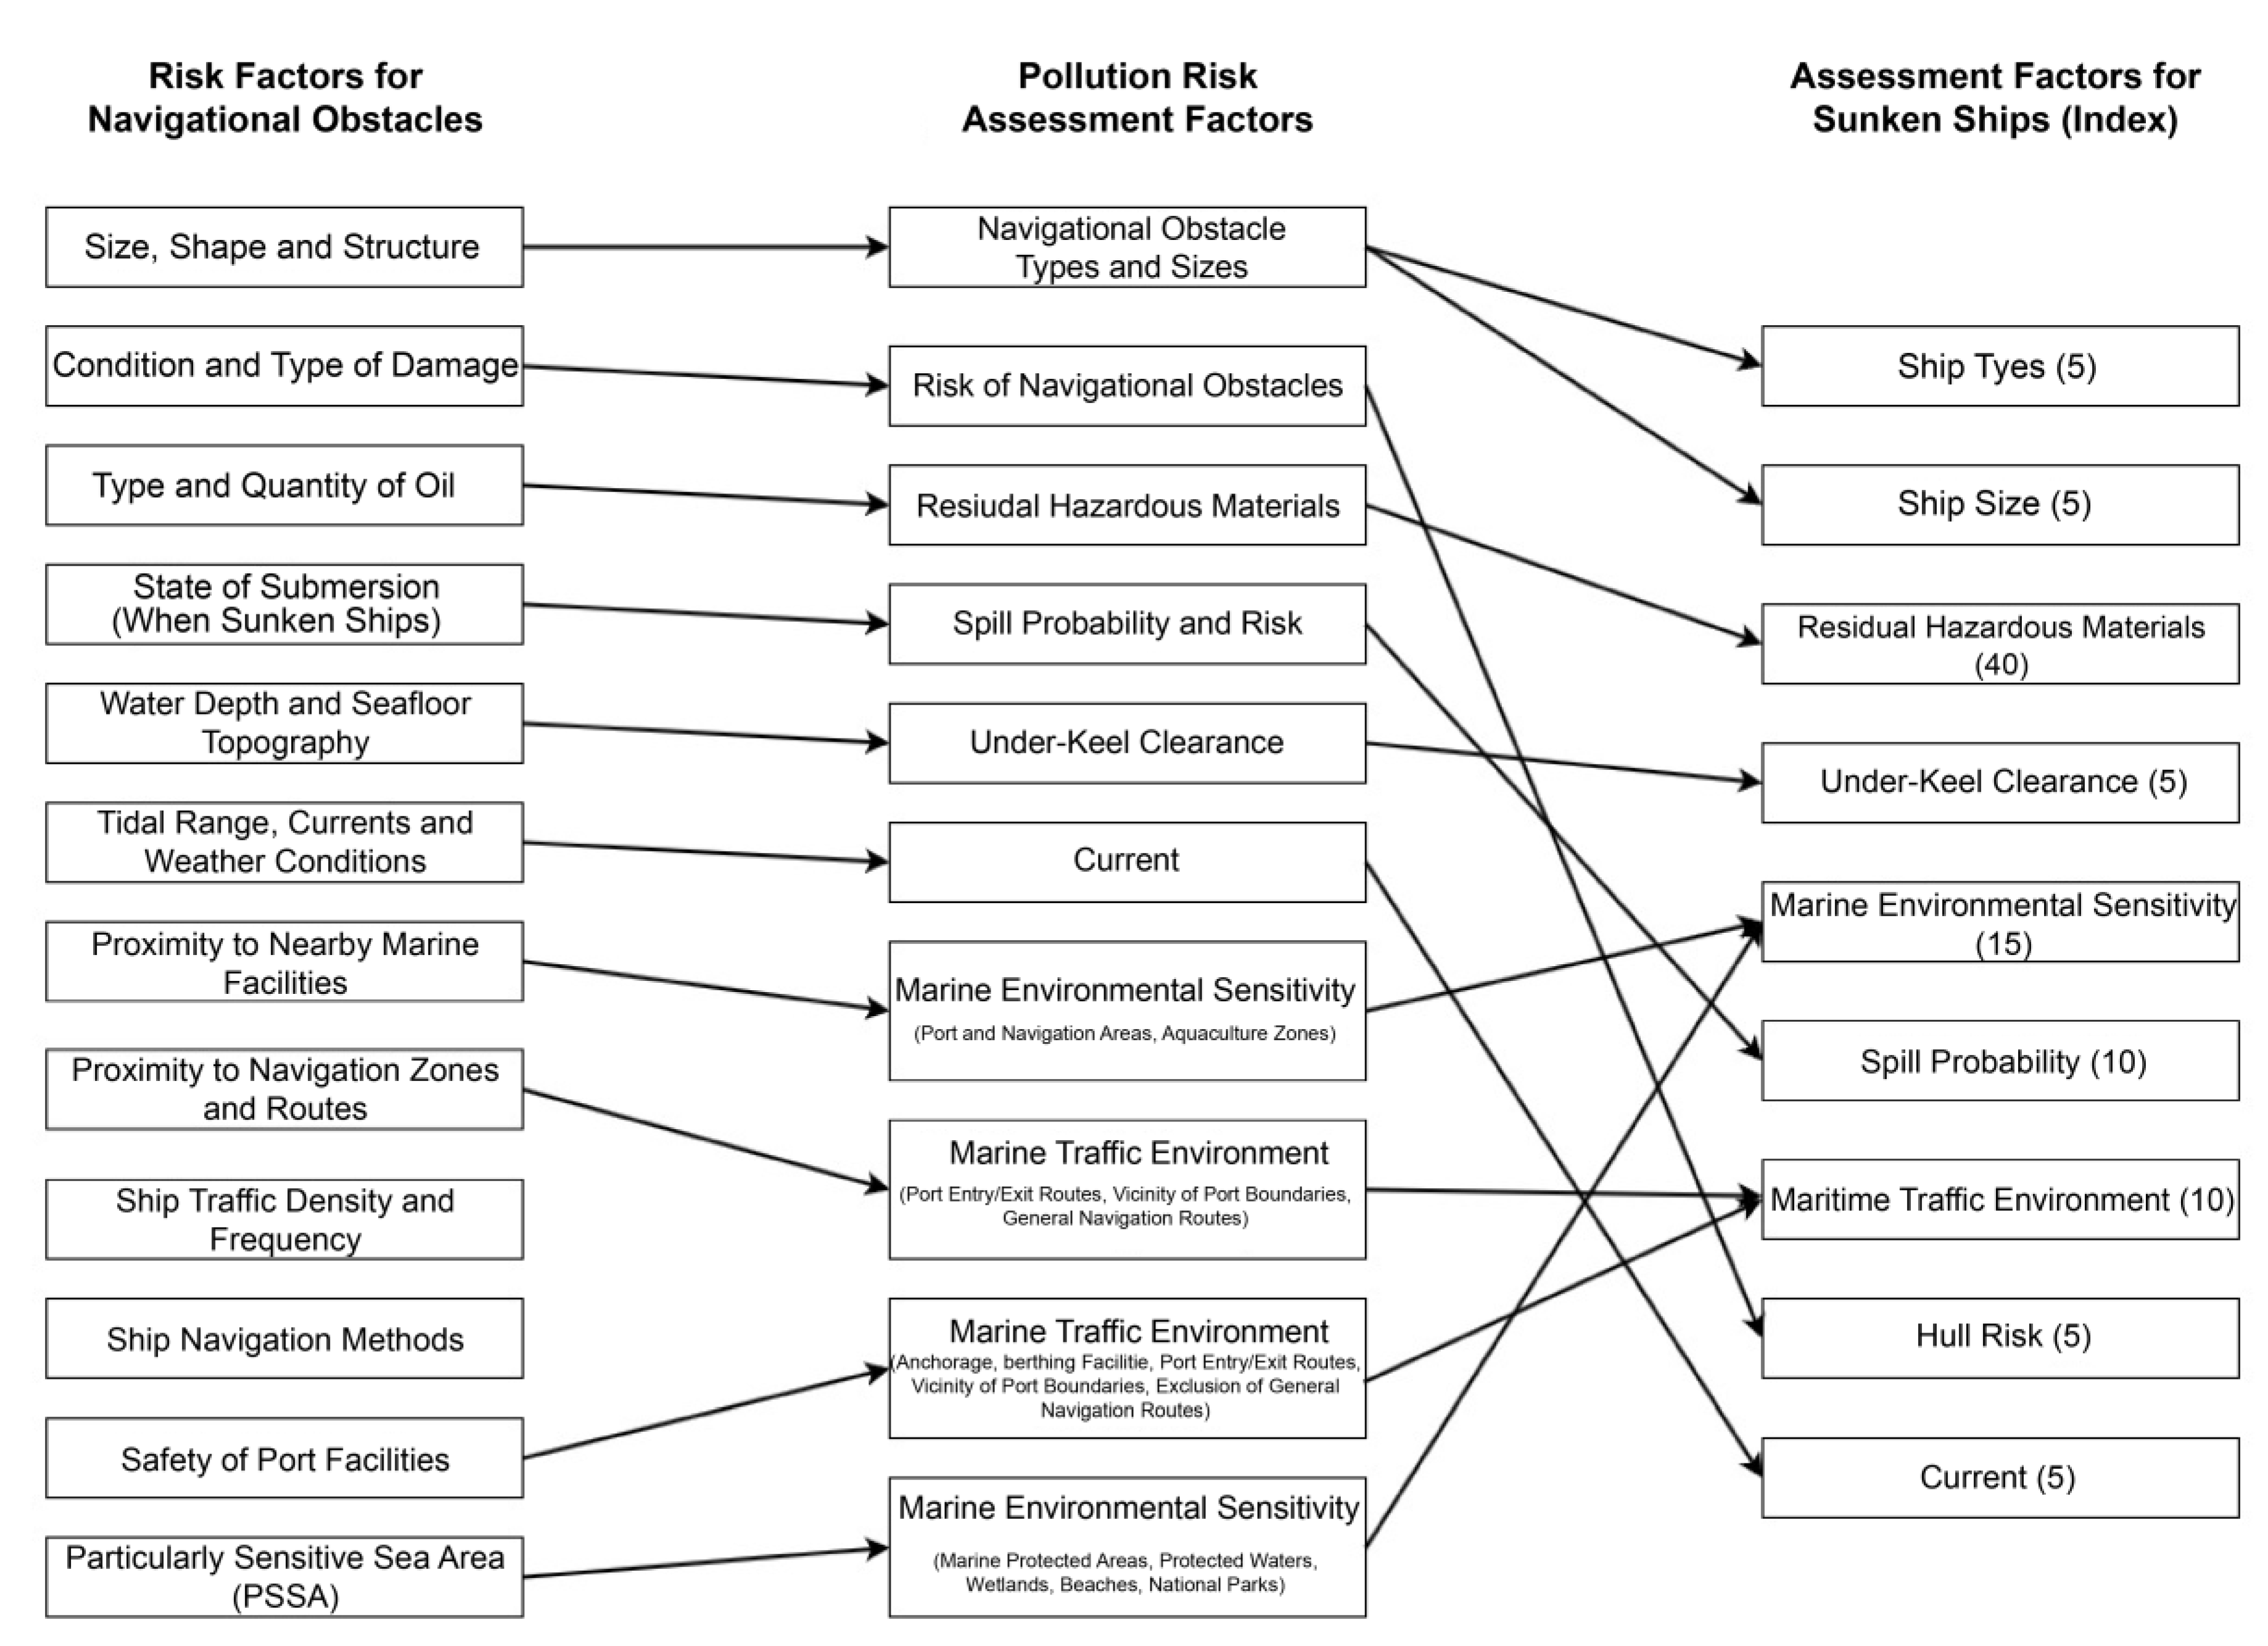
| Number | Risk Factor for Navigational Obstacles | Collision Risk Assessment Factor |
Pollution Risk Assessment Factor |
|---|---|---|---|
| 1 | Size, shape, and structure | Obstacle size and quantity | Navigational obstacle type and size |
| 2 | Condition and type of damage | Not applicable | Risk of navigational obstacles |
| 3 | Type and quantity of oil | Not applicable | Residual hazardous materials |
| 4 | State of submersion (for sunken ships) |
Not applicable | Spill probability and risk |
| 5 | Water depth and seafloor topography | Not applicable | Under-keel clearance |
| 6 | Tidal range, currents, and weather conditions | Current direction and force | Current |
| 7 | Proximity to nearby marine facilities | Not applicable | Marine environmental sensitivity (Port and navigation areas, Aquaculture zones) |
| 8 | Proximity to navigation zones and routes | Weighting based on proximity to or presence within a traffic scheme or grid | Maritime traffic environment (Port entry/exit routes, Vicinity of port boundaries, General navigation routes) |
| 9 | Ship traffic density and frequency | Number of navigating ships | Not applicable |
| 10 | Ship navigation methods | Weighting based on presence of specific traffic patterns within a grid |
Not applicable |
| 11 | Safety of port facilities | Not applicable | Maritime traffic environment (Anchorage, berthing facilities, Port entry/exit routes, Vicinity of port boundaries, Exclusion of general navigation routes) |
| 12 | Particularly sensitive sea area (PSSA) | Not applicable | Marine environmental sensitivity (Marine protected areas, Protected waters, Wetlands, Beaches, National parks) |
| Results of Ship Traffic Pattern Analysis | Area 1 | Area 2 | |
|---|---|---|---|
| Traffic volume | Number of separated cells | 16 | 22 |
| Number of ships in separated cells | 590 | 672 | |
| Avg. number of ships per separated cell | 36.88 | 30.55 | |
| Number of clustered cells | 61 | 105 | |
| Number of ships in clustered cells | 994 | 1,712 | |
| Avg. number of ships per clustered cell | 16.30 | 16.39 | |
| Number of other types of cells | 146 | 673 | |
| Number of ships in other types of cells | 855 | 2,234 | |
| Avg. number of ships per other type of cell | 5.86 | 3.32 | |
| Normalized traffic volume | Normalized number of ships per separate cell | 6 | 9 |
| Normalized number of ships per clustered cell | 3 | 5 | |
| Normalized number of ships per other type of cell | 1 | 1 | |
| Risk Level | Range | |
|---|---|---|
| Level 1 (Green) | Very low | Collision probability within the bottom 5% of the overall range |
| Level 2 (Green) | Low | Collision probability in the 5th to 25th percentile range |
| Level 3 (Yellow) | Medium | Collision probability in the 25th to 75th percentile range |
| Level 4 (Red) | High | Collision probability in the 75th to 95th percentile range |
| Level 5 (Red) | Very High | Collision probability within the top 5% |
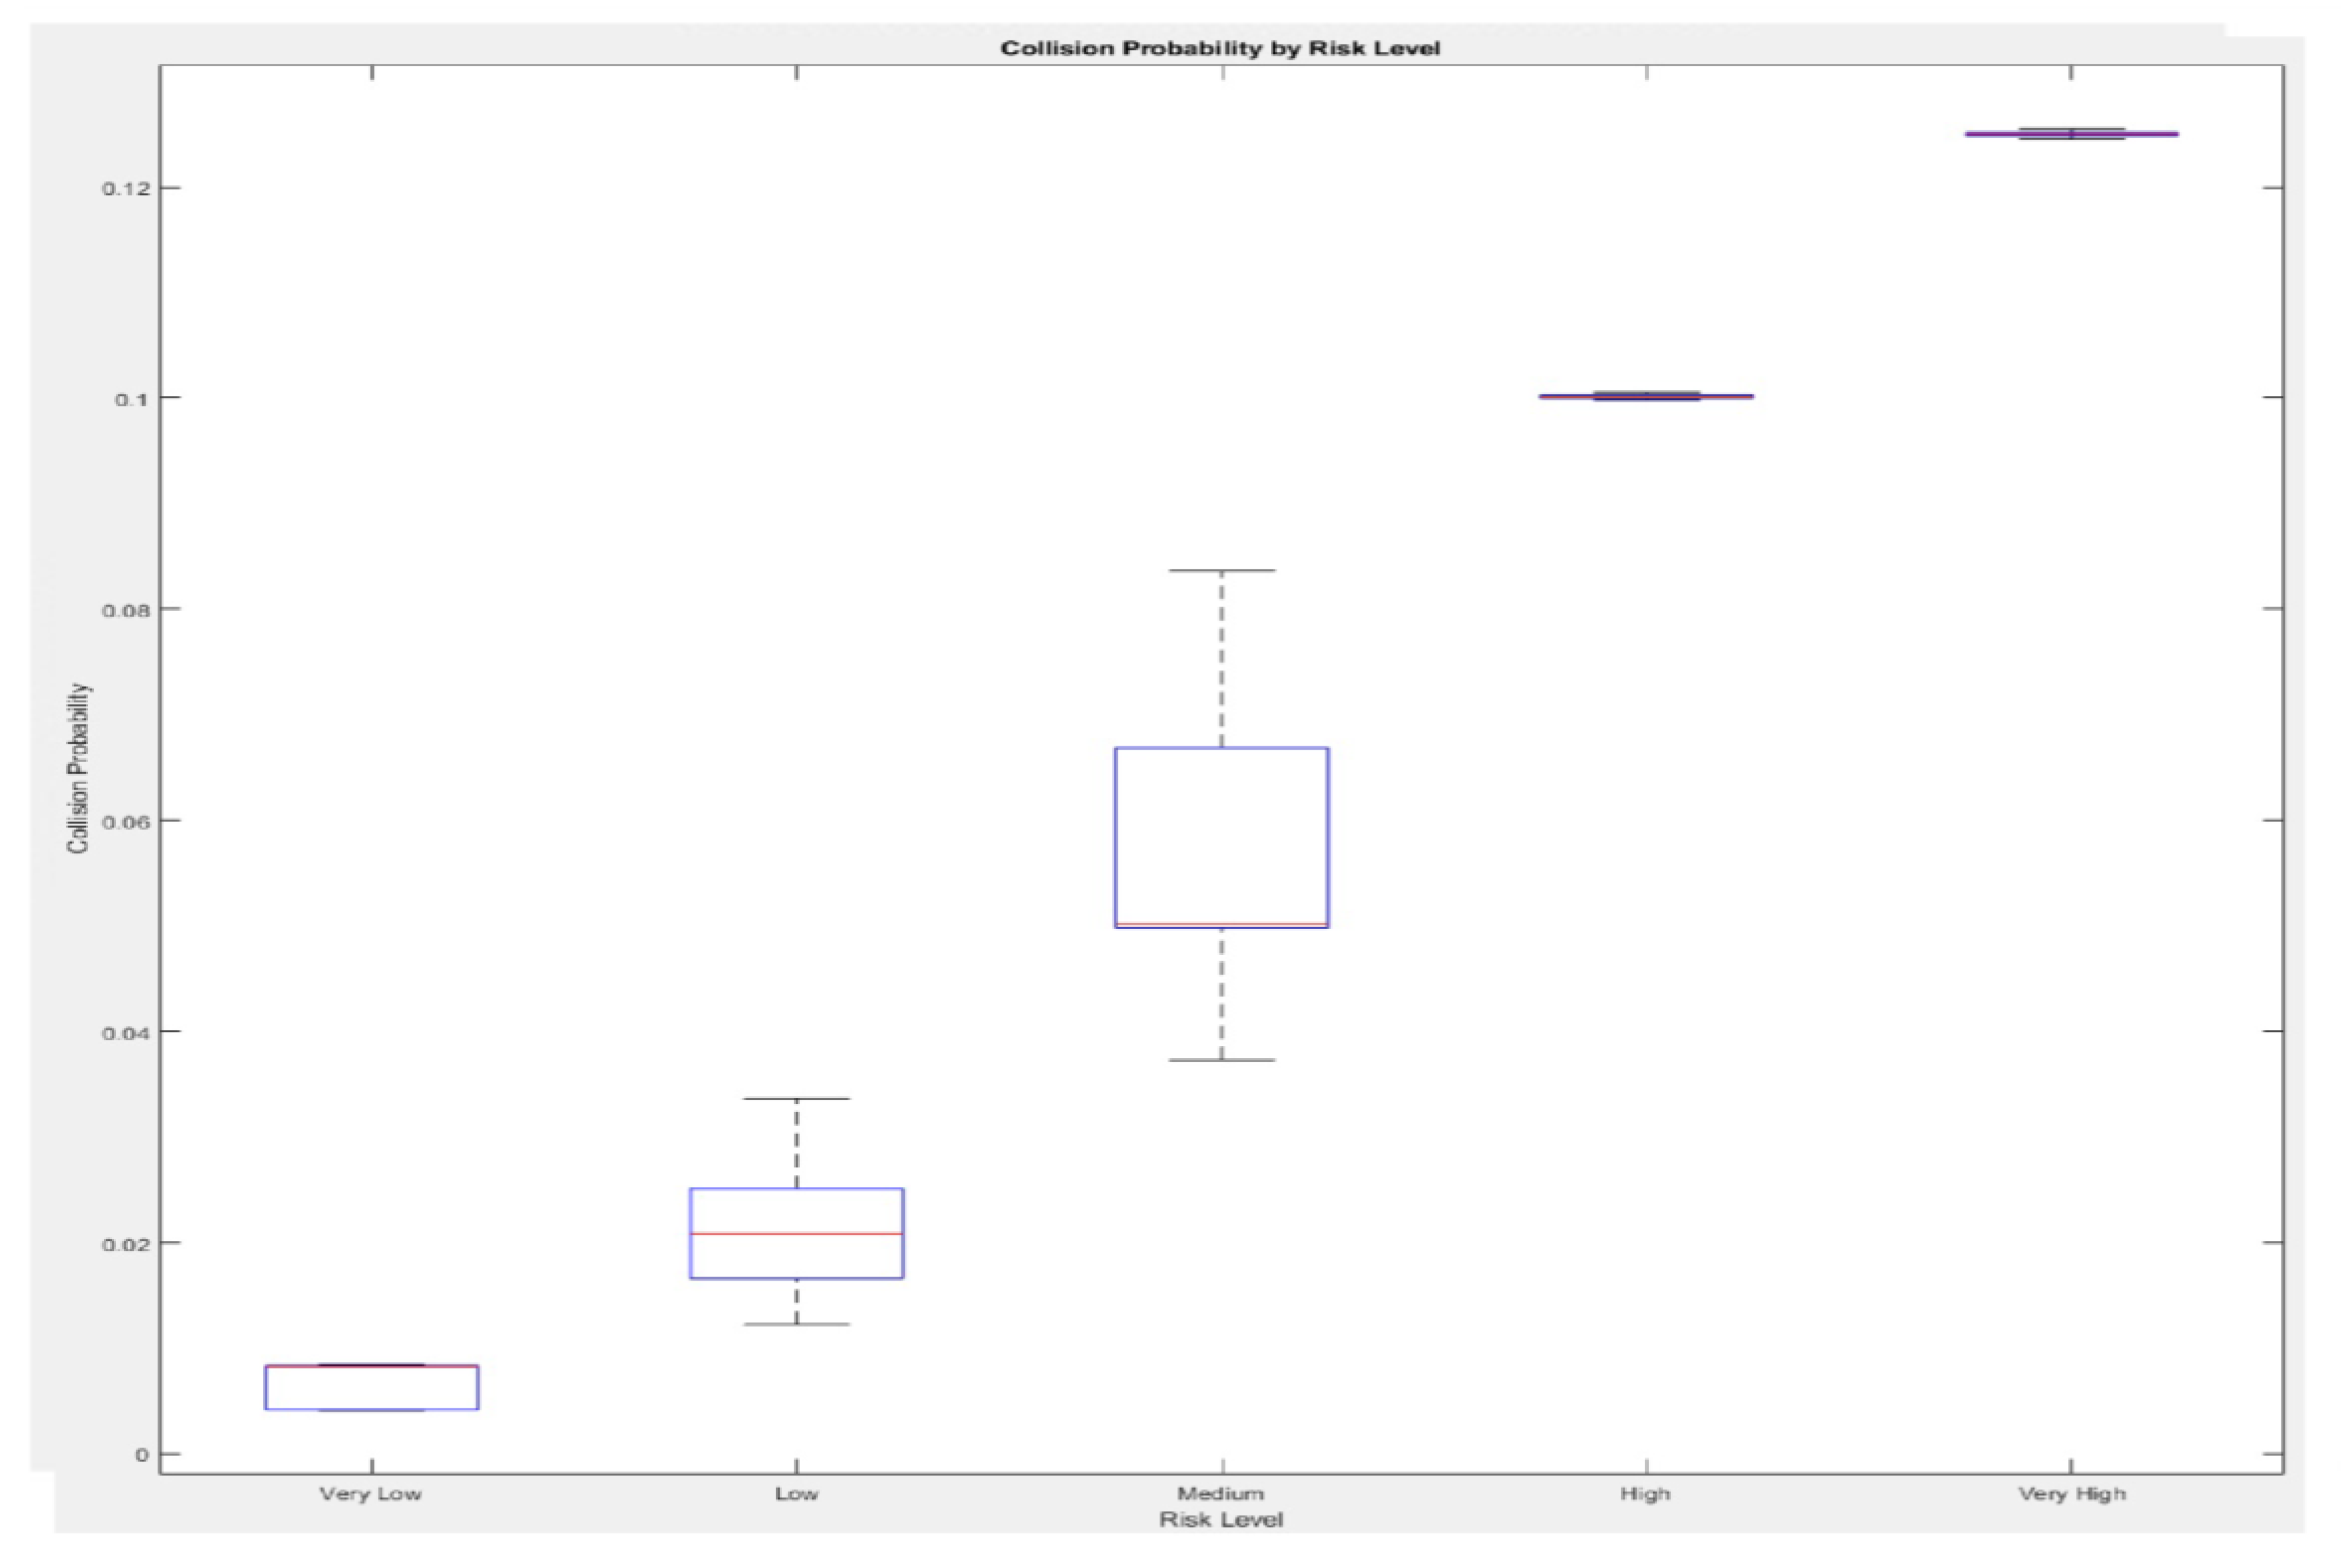
| Risk Level | Min. Probability | Max. Probability |
|---|---|---|
| Very low | 0.0041 | 0.0084 |
| Low | 0.0122 | 0.0336 |
| Medium | 0.0373 | 0.0837 |
| High Very High |
0.0998 0.1246 |
0.1006 0.1255 |
| Input 1 | Input 2 | Input 3 |
|---|---|---|
| Name='Collision risk' Range=[0 41.27] NumMFs=5 MF1='Very Low':'trianglemf',[0 0 12.11] MF2='Low':'trianglemf',[0 9.19 18.38] MF3='Moderate':'trianglemf',[4.36 17.63 30.9] MF4='High':'trianglemf',[14.91 24.98 35.05] MF5='Very High':'trianglemf',[21.17 41.28 41.28] |
Name='Pollution risk' Range=[0 100] NumMFs=3 MF1='Selective':'trianglemf',[0 0 50] MF2='General':'trianglemf', [30,50,70] MF3='Intensive':'trianglemf',[50 100 100] |
Name='Comprehensive risk' Range=[0 100] NumMFs=4 MF1='Low':'trianglemf',[0 0 60] MF2='Moderate':'trianglemf',[50 72.5 95] MF3='Threat':'trianglemf',[75 87.5 100] MF4='Danger':'trianglemf',[85 100 100] |
| Rule | |
|---|---|
| If Collision risk is Very Low and Pollution risk is Selective, then Comprehensive risk is Low | |
| If Collision risk is Very Low and Pollution risk is Selective, then Comprehensive risk is Moderate | |
| If Collision risk is Very Low and Pollution risk is General, then Comprehensive risk is Moderate | |
| If Collision risk is Very Low and Pollution risk is Intensive, then Comprehensive risk is Threat | |
| If Collision risk is Very Low and Pollution risk is Intensive, then Comprehensive risk is Danger | |
| If Collision risk is Low and Pollution risk is Selective, then Comprehensive risk is Low | |
| If Collision risk is Low and Pollution risk is Selective, then Comprehensive risk is Moderate | |
| If Collision risk is Low and Pollution risk is General, then Comprehensive risk is Moderate | |
| If Collision risk is Low and Pollution risk is Intensive, then Comprehensive risk is Threat | |
| If Collision risk is Low and Pollution risk is Intensive, then Comprehensive risk is Danger | |
| If Collision risk is Moderate and Pollution risk is Selective, then Comprehensive risk is Moderate | |
| If Collision risk is Moderate and Pollution risk is General, then Comprehensive risk is Moderate | |
| If Collision risk is Moderate and Pollution risk is General, then Comprehensive risk is Threat | |
| If Collision risk is Moderate and Pollution risk is Intensive, then Comprehensive risk is Threat | |
| If Collision risk is Moderate and Pollution risk is Intensive, then Comprehensive risk is Danger | |
| If Collision risk is High and Pollution risk is Selective, then Comprehensive risk is Threat | |
| If Collision risk is High and Pollution risk is Selective, then Comprehensive risk is Danger | |
| If Collision risk is High and Pollution risk is General, then Comprehensive risk is Threat | |
| If Collision risk is High and Pollution risk is General, then Comprehensive risk is Danger | |
| If Collision risk is High and Pollution risk is Intensive, then Comprehensive risk is Threat | |
| If Collision risk is High and Pollution risk is Intensive, then Comprehensive risk is Danger | |
| If Collision risk is Very High and Pollution risk is Selective, then Comprehensive risk is Threat | |
| If Collision risk is Very High and Pollution risk is General, then Comprehensive risk is Threat | |
| If Collision risk is Very High and Pollution risk is Intensive, then Comprehensive risk is Danger |
| Collision Risk Assessment Factors | Collected Data |
|---|---|
| Tidal range, currents, and weather conditions | Current: 0.2 knot |
| Proximity to navigation zones and routes | 36 nautical miles from Seongsan Port, Jeju Island |
| Ship traffic density and frequency | Maximum of two vessels per hour within the grid at the drifting location |
| Ship navigation methods | Not applicable |
| Pollution Risk Assessment Factor | Collected Data |
|---|---|
| Navigational obstacle Type and size |
Fishing boat 68.9 tonnage |
| Risk of navigational obstacles | Not applicable |
| Residual hazardous materials | Oil: Estimated to be less than 10 kL of MFO Hazardous liquid substances: Not applicable Radioactive materials: Not applicable |
| Spill probability and risk | Age of ship before the incident: Unknown Elapsed time since the incident: less than 1 year |
| Under-keel clearance | Above 30 m |
| Current | 0.2 knot |
| Marine environmental sensitivity | 36 nautical miles from Seongsan Port, Jeju Island |
| Maritime traffic environment | General navigation routes |
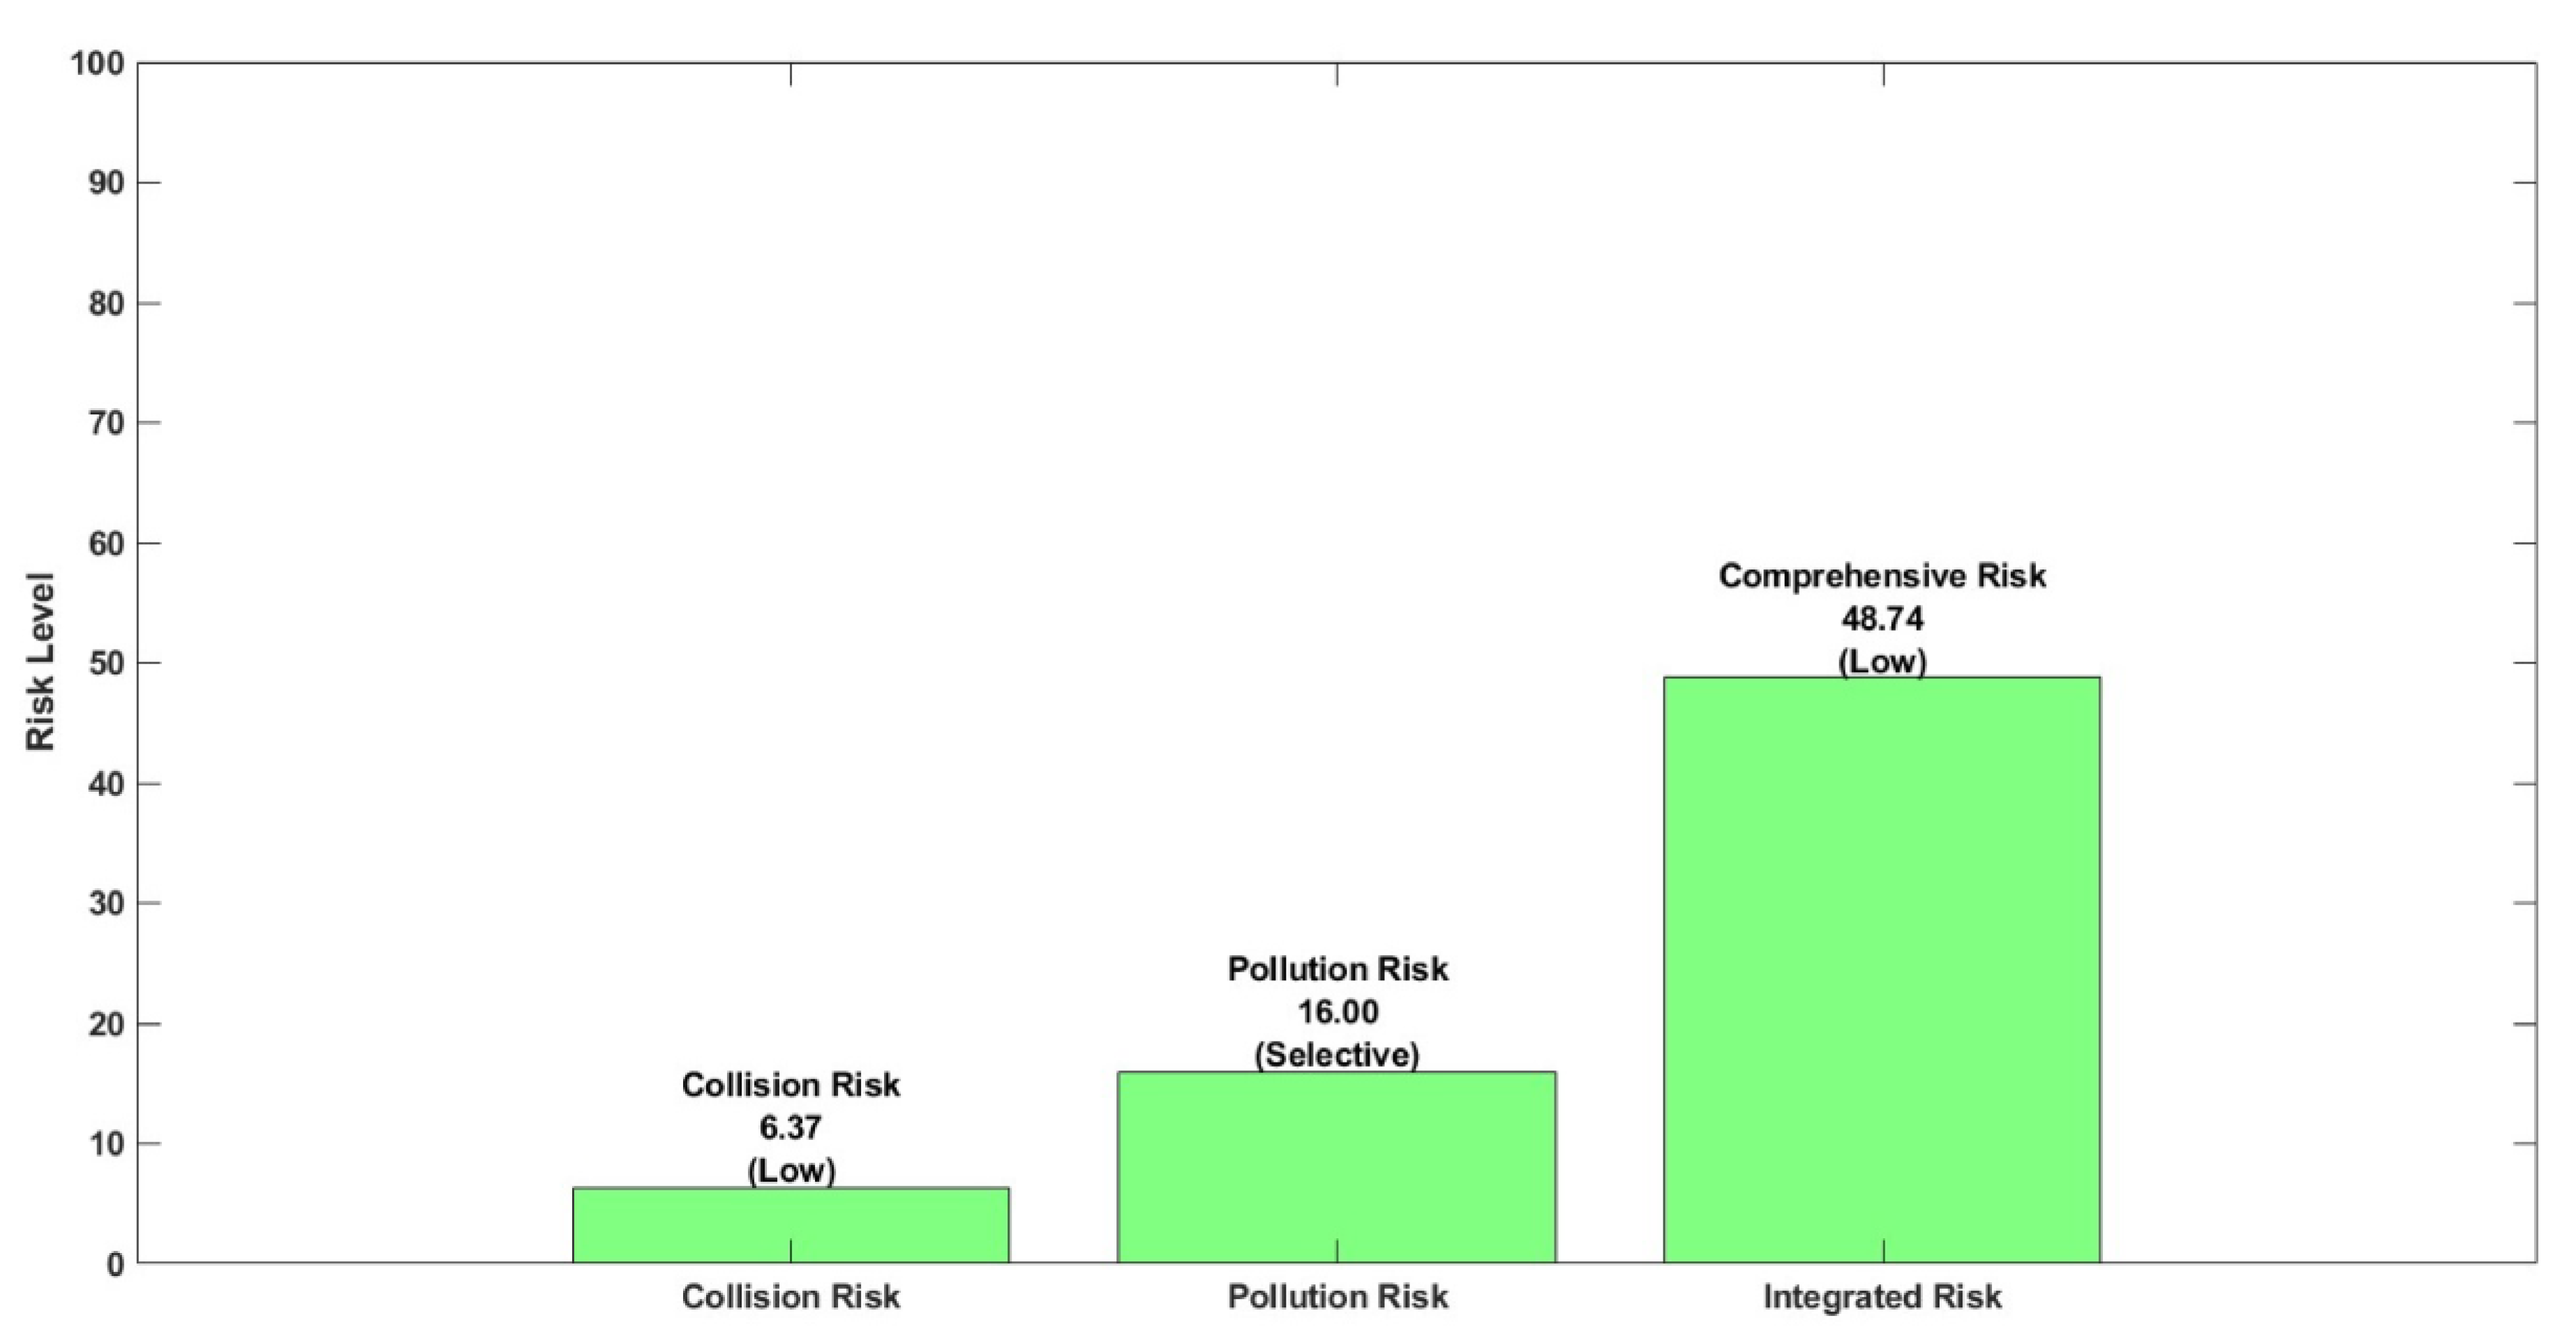
| Input Variables | Input Data | Collision Risk | |
|---|---|---|---|
| Number of navigational obstacles | One obstacle | Risk index: 6.37% Risk level: Low |
|
| Size of navigational obstacle | Size, shape, and structure | Approximately 30.41 m | |
| Velocity of navigational obstacle | Tidal range, current, and weather conditions | 0.2 knot | |
| Moving object | Ship traffic density and frequency | Two vessels | |
| Input Variables | Index | Pollution Risk | |
|---|---|---|---|
| Type | Fishing boat | 3 | Risk index 16% Risk level: selective |
| Size | 68.9 ton | 1 | |
| Risk of navigational obstacles | Not applicable | 0 | |
| Residual hazardous materials | Oil: Estimated to be less than 10 kL of MFO Hazardous liquid substances: Not applicable Radioactive materials: Not applicable |
4 | |
| Spill probability and risk | Age of ship before the incident: Unknown Elapsed time since the incident: less than 1 year |
1 | |
| Under-keel clearance | Above 30 m | 1 | |
| Current | 0.2 knot | 1 | |
| Marine environmental sensitivity | 36 nautical miles from Seongsan Port, Jeju Island | 1 | |
| Maritime traffic environment | General navigation routes | 4 | |
Disclaimer/Publisher’s Note: The statements, opinions and data contained in all publications are solely those of the individual author(s) and contributor(s) and not of MDPI and/or the editor(s). MDPI and/or the editor(s) disclaim responsibility for any injury to people or property resulting from any ideas, methods, instructions or products referred to in the content. |
© 2025 by the authors. Licensee MDPI, Basel, Switzerland. This article is an open access article distributed under the terms and conditions of the Creative Commons Attribution (CC BY) license (http://creativecommons.org/licenses/by/4.0/).


