Submitted:
30 December 2024
Posted:
31 December 2024
You are already at the latest version
Abstract
The human manual order-picking process in the warehouse is still the leading method despite increasing automation. This manual process is supported by indicating and receipt systems to reduce the order-picking time and the number of errors. Many studies in the literature compare the Pick-by-Light system with the Pick-by-Paper and other systems, and it is more challenging to study the Pick-by-Point system.
This paper presents the results of laboratory comparative studies of the most straightforward Pick-by-Paper system with Pick-by-Light and Pick-by-Point systems supported by receipt systems. In the case of the Pick-by-Light system, the receipt system is a button on the module that the picker presses to confirm the pick-up of an item. In the case of Pick-by-Point, the receipt system is a wrist scanner that the picker uses to confirm the pick-up of an item. A total of 71 people participated in the study. Participants completed five orders with five items per system. Comparisons were made of the time it took to pick the orders with the support of these systems, the number of errors made, ergonomics and the speed of adaptation for new employees without experience. A person with nine years of experience in the picking process took part in the study, whose order-picking times were compared with those of the others. In the study, the Pick-by-Light system proved to be the fastest regarding order-picking and the adaptation of new employees. On the other hand, the Pick-by-Point system was the most error-proof.
Keywords:
order-picking
; Pick-by-Light
; Pick-by-Paper
; Pick-by-Point
; efficency
1. Introduction
The picking process is an essential part of the more extensive process, which is the logistics of goods from the warehouse to the customer or parts and raw materials from the warehouse to the production line. The efficiency of this system is affected by factors such as the arrangement of items in the warehouse space and the path of pass of the warehouse worker, among others. Methods for optimizing these factors are described by M. Garbacz et al. [7,8]. An extensive survey of publications from several angles and, in particular, methods for determining the paths of a worker’s pass to pick an order was conducted by A. Setayesh et al. [11]. Another broad review of publications issued between 2007 and 2022 in the field of order-picking systems, including 269 publications, was compiled by G. Casella et al. [4] and Ch. Glock et al. [9]. The development of robotics and control has had a significant impact on the introduction of systems without human involvement to eliminate errors that he may make [3]. However, man still plays a vital role in picking, assisted by information systems.
The first system that supported humans in the picking process was using a piece of paper. Such a document has a list of items, their quantity and sometimes even the location of where these items are. Today, this method is often called Pick-by-Paper. The correctness of picking by this method depended on the accuracy of the worker as well as the orderliness of the warehouse and the preparation of the paper document. To eliminate errors and facilitate employees’ work, light effects were introduced to guide them to the correct location. Modules with lights also began to be equipped with buttons to receipt that an article had been picked from the indicated location. This system is now called Pick-by-Light.
Several publications can be found in the literature in which the results of comparative studies of the systems mentioned above are presented. For example, Ch. Stockinger et al. [13] presents the results of a comparative study of Pick-by-Light and Pick-by-Paper systems conducted on a sample of 31 people. The average age of the subjects was 30. The study tested the participants’ situational awareness and blood pressure after the order was collected. In contrast, in a publication by A. Baechler et al. [2], the authors tested Pick-by-Paper, Pick-by-Light, Pick-by-Display and Pick-by-Projection systems. One of the goals of this research was to test the speed of the picking process using the systems above. Twenty-four people (sixteen men and eight women) between the ages of 20 and 54 participated in the research. Among the participants, 4 had a technical or academic background. The system that allowed the fastest order-picking was the Pick-by-Light system. The errors made were also studied. There was no significant difference here, but the fewest errors were made with the Pick-by-Light and Pick-by-Projection systems. Pick-by-Paper and Pick-by-Light methods were also studied by G. Anhong et al. [1]. The authors studied order-picking using four methods: Pick-by-Paper, Pick-by-Light, Pick-by-CMD and Pick-by-HUD. The first method is traditional picking with a piece of paper, the locations of the items to be picked, and the quantities specified on it. In the second method, luminous modules indicate where the article should be picked up from. The publication’s authors do not mention the receipt of the article to be taken. The third method is placing a display on the cart with the positions of the articles displayed. Also, no receipt was written about it. The last method is to display information on a display mounted on the head of the employee. Eight students participated in the study. The study was divided into a training part and an actual part. The results showed that the slowest method was the traditional method using paper. It was followed by the Pick-by-Light method. The authors also studied the evaluation of comfort and ease of learning the method, as well as the number of errors made. The Pick-by-Paper method fared worst in each criterion. In contrast, ease of learning for the Pick-by-Light method was rated at the same level as the Pick-by-HUD and Pick-by-CMD methods. For the comfort of use, the Pick-by-Light method was rated second along with the Pick-by-HUD method. According to participants, Pick-by-CMD was the most comfortable method. The Pick-by-Light method, however, fared the worst in terms of errors made. The traditional paper method proved to be more accurate. An example of a comparative study of the traditional paper-based system with the Pick-by-Light system, however, in a manufacturing process is presented by J. Trojanowska et al. [15]. The publication presents the results of a study of a specific extruder assembly process — the Pick-by-Light system aimed to reduce part-picking errors and shorten the process time. A 7% to 35% reduction in process time for individual workers and a 35% decrease in picking errors were achieved.
The emergence of augmented reality glasses has also been tried in the picking process. A comparative study of systems such as Pick-by-HUD, which involves using Google Glass glasses to display information on their lenses, with the Pick-by-Light system was conducted by Wu Xiaolong et al. [18]. In terms of speed, the Pick-by-HUD system proved superior. In contrast, the study showed less susceptibility to errors made with the Pick-by-Light method. The methods studied did not have a receipt system. Other results of a research of a system using glasses conducted by K.A. Weaver [16]. This research compared a system using Sony glasses with the Pick-by-Paper method in two variants (text and graphic) and the Pick-by-Voice system, which involves voice messaging to the employee. Twelve people participated in the study. This research indicates that picking time was shorter with the use of glasses, while the voice system proved to be the slowest.
The above studies did not use order receipt systems. A study that uses receipt with a scanner placed on a glove was conducted by C.S. Murauer as part of her doctoral dissertation [10]. However, the author does not compare the confirmation system with any other. Instead, she uses different variants of the information displayed in augmented reality glasses for indicating. A comparison of receipt systems without indicating systems can be found in C. Scheuermann et al. [12]. The authors compare a traditional handheld scanner with a glove-mounted wrist scanner in two variants: on one hand and two hands. The results of these studies indicate that picking time is shorter with the wrist scanner. P. Fager also compared the receipt systems; the results were published in [5]. The publication compares a push-button receipt system on a Pick-by-Light module attached to a rack shelf, a bracelet with a wrist RFID reader, a wrist barcode scanner and a voice. Four people with no picking experience participated in this research. As a result of this research, button confirmation on the module proved to be the fastest system. There were 167 incorrect picks recorded out of a total of 1 million. A study of picking using pointing and confirmation systems was conducted by Ch. Thomas et al. in the publication [14]. They compared the Pick-by-Paper system with receipt by a hand scanner, Pick-by-Light with a button, Pick-by Paper without receipt, and Pick-by-HUD with an RFID scanner. In addition to studying the duration of the process, the authors also studied the number of errors made. In the study, each 12 participants completed 10 tasks with each method. Pick-by-Paper with scanner proved to be the slowest system. The Pick-by-Light and Pick-by-HUD systems had very similar times. Regarding errors, the Pick-by-Light and Pick-by-HUD systems each yielded 30 incorrect retrievals. Pick-by-Paper with scanner yielded 59. In contrast, picking with Pick-by-Paper without receipt yielded 161 errors.
The publications mentioned here present studies of indicating systems and receipt systems. Often, the studies are one of two. The studies mainly boil down to an analysis of the duration of the process and the number of errors made by the participants. The speed of adaptation of new employees to a particular system and its ergonomics is also an essential aspect of the picking process. This is also the purpose of the research, the results of which are presented in this article. Even though research on the effectiveness of systems supporting the manual picking process has been carried out for many years, the publication by J. Trojanowska et al. [15] shows the continuing relevance of this issue and the wide possibilities of application.
2. Method
2.1. Objectives
The purpose of the research was to compare selected systems used in the picking process specifically in three aspects:
- •
- Comparison of systems in terms of speed of order-picking and errors made by employees. The speed of order-picking is the leading indicator examined when comparing systems. Similarly, the number of errors made, i.e. picking the wrong items or items from the wrong location.
- •
- Speed of adaptation of people without experience to the selected systems. This is very important in the e-commerce industry because the most significant quantities of goods flow out of warehouses on the occasion of Santa Claus or Christmas, for example, when customers shop for gifts. There are periods in warehouses when there is a much lower load, and then there is no need to keep excess employees involved in the picking process. During peak periods, new employees who do not have much time to gain experience are often hired, so systems are sought that will be easily assimilated by inexperienced workers and will reduce errors made.
- •
- Evaluation of the ergonomics of the tested systems by survey participants. This indicator is essential in addition to the above because of the impact on employee well-being, which can further affect time and incorrect pick-ups.
2.2. Used Concepts
In the article, the authors use terms that mean:
- •
-
System – a set of tools to support picking (collecting orders in a warehouse).
- •
- Pick-by-Paper – order-picking using a paper-based document,
- •
- Pick-by-Light – order-picking supported by light modules placed on racks, receipt by button on module. The system worked in step-by-step mode, i.e. only one location was indicated at a time.
- •
- Pick-by-Point – order-picking supported by rotating light, receipt by wrist scanner.
- •
- Pass – picking of an order. Pass means collecting one order of five items in a different location. There were five orders to collect within one system, i.e. five passes. The same orders in the same order were processed using three systems.
- •
- Time – the time it takes to collect an order. In the research, this was the time from crossing the starting line to reaching the finish line.
- •
- Error – pick up an item from the wrong location.
2.3. Description of the Method
The research method used to conduct the study was as follows:
- •
- Six months earlier, a pilot study was carried out with three people to eliminate errors in the research method. The result of this study was a reduction in the number of orders to be picked from 7 to 5. The main limitation was the time available for the research. A single group of students participated in the research during their class, which lasted 100 minutes.
- •
- Initially, training was given to groups of 10-18 people on the warehouse layout, aisle direction and shelf labelling. Each group was trained individually. The training took place before each system was tested.
- •
- One system tested on one day. (In the case of part-time students Pick-by-Paper on the first day, Pick-by-Light and Pick-by-Point on the second day.) This was due to the smaller size of the groups and therefore more time available.
- •
- Each person picked five orders one by one as part of the research of a particular system.
- •
- Each order contained five items of one item each, unique to other orders. This means unique locations in each order. Each order had items from both the left and right racks. The list of orders and the order in which the locations were indicated was organised in a forward mode, meaning that the participant was moving forward all the time. There was no indicating backwards.
- •
- The same orders were tested in the same order in each system.
- •
- Participants were not allowed to peek at others during the order-picking and thus could not learn by looking.
- •
- Incorrect pick-ups were counted. The sum of errors made by a given participant within a given system, i.e. all five passes, was counted. A member of the research staff counted the data.
- •
- Four people were involved in handling the research. They did not pick orders in the research because they watched the participants.
Ergonomics survey
- •
- Ergonomics surveys were carried out using short questionnaires.
- •
- System-specific questionnaires were completed by participants immediately after completing the five orders to gather participant feedback.
- •
- Comparison questionnaires after completion of all systems. The questionnaire was completed second after the questionnaire for the system currently under test.
2.4. Warehouse Infrastructure
The testing place – a warehouse, where the tests were carried out, was the laboratory (Figure 1), which was equipped with four zones, two on each side of the laboratory (Figure 1). Two zones, A and B, were on the left side of the laboratory, and two, C and D, were on the right (Figure 2). All zones were equipped with the devices used in the tested systems. The participant picked the order by walking clockwise first on the left side of the laboratory and returning on the right side.
Items and the cart
Participants had to pick balls (Figure 3). Each item was one ball.
Only one ball had to be picked from each location and placed in the cart basket (Figure 3). The attendant emptied the cart basket after five orders had been completed by the participant and put it back in the bins on the shelves.
2.5. Tested Systems
2.5.1. Pick-by-Paper
The Pick-by-Paper order-picking method, where balls were picked from the designated locations as shown in Figure 4, was uniformly followed by all participants. Each participant received the corresponding document before each pass, ensuring that the orders were consistently completed in the same sequence.
2.5.2. Pick-by-Light
In the Pick-by-Light system, the indicating devices were the lights on the modules (Figure 5), which in all zones were located above the container. The item pick receipt system was a button on the module next to the light. The participant in the research should receipt the pick-up after taking the item from the container and placing it in the cart basket. If the item pick-up is receipt with the button on the wrong module, the lamp on the module at the correct location starts flashing and turns red. This indication of an incorrect pick-up is essential when the receipt is done using, for example, an infrared curtain because the receipt button is located a few centimetres away from the indication lamp.
2.5.3. Pick-by-Point
The main component of the Pick-by-Point system is a lamp (Figure 6) suspended from the top of the warehouse. The task of the lamp is to indicate with a beam of light the location on the shelf from which the participant should pick up the item. As with the previous two systems, the lamp also shows the exact locations in the same order according to the documents, an example of which is Figure 4.
The second component of this system used for receipts is a wrist scanner (Figure 7). Each location had a unique barcode. The premise was that the participant should first pick up the item, after which they could only scan the barcode. If the wrong code was scanned, the lamp changed its light colour from green to red. Once the scanner read the correct code, the lamp illuminated the following location.
3. Results
71 participants (43 full-time and 28 part-time students) participated in the Pick-by-Light and Pick-by-Point system researches. In contrast, 28 participants (part-time students) participated in the Pick-by-Paper system research. Participants were numbered to identify themselves and enable the measurements’ results to be analysed in relation to individual participant performance. Due to the identification of the participants, it was possible to carry out tests of the Pick-by-Light and Pick-by-Point systems for paired data. Also, these types of tests could have been carried out to compare times in individual passes.
Shapiro-Wilk tests were performed for each pass of each system. As a result of the tests, with only for pass 4 in Pick-by-Light and pass 5 in Pick-by-Point, there were no grounds to reject the hypothesis . In the remaining cases, the value of p-value was significantly smaller than . As a result, comparative tests were performed using the Wilcoxon or Mann-Whitney U test.
3.1. Analysis of Order-Picking Times
The analysis of order-picking times was carried out using box plots, where participants’ times were marked with black points. The red point distinguishes the order-picking time of the person with experience. On the other hand, the value of this time is given in an oval with a red border. Numerical values with a black border indicate the characteristic points of the box plot, i.e., median, and quartiles, and whiskers. In addition, statistical tests were performed.
Time – pass →Pick-by-Paper.
In the results of the tests carried out for the Pick-by-Paper system (Figure 8), it can be seen with each successive pass that the median picking time of the participants decreases and that the range of times achieved narrows. The Wilcoxon test showed a statistically insignificant difference between passes 3 and 4. The hypothesis was rejected in the remaining cases with . The person with experience achieved some of the shortest times in each pass.
Time – pass →Pick-by-Light
The results for the Pick-by-Light system (Figure 9), with significantly shorter times than the Pick-by-Paper system. In the following passes, there is a reduction in the median time obtained by the participants. The Wilcoxon one-sided and the two-sided test for the following passes showed that the difference is statistically significant. In the case of the person with the experience, rapid adaptation to the system and stable performance in the following passes can be observed.
Time – pass →Pick-by-Point
The Wilcoxon test conducted for consecutive passes of both one-sided and two-sided does not give grounds to reject the hypothesis for passes 4 and 5. This may suggest that participants only needed four passes to adapt to this system (Figure 10). A person with experience can be inferred to have adopted after only three passes.
All systems combined
A summary of all the times obtained by the participants (Figure 11) shows a concentration of shorter times for the Pick-by-Light system compared to the other two systems. Many outliers can be seen in the Pick-by-Paper system. This only confirms that the participants had problems finding the location read from the paper document.
Summary of systems by pass
A comparison of the tested systems by pass (Figure ) confirms that participants with the Pick-by-Light system obtained shorter order-picking times than the other two systems. The Mann-Whitney U test did not warrant rejection of the hypothesis for passages 2 and 5 when comparing the Pick-by-Paper and Pick-by-Point systems. However, in the other passes, the Mann-Whitney U test results revealed a statistically significant difference, providing strong evidence for the efficiency of the Pick-by-Light system.
3.2. Analysis of Time Differences Between Passes
Time differences between passes
This indicator was calculated for each participant individually so that the time obtained in pass 2 was subtracted from the time in pass 1, 3 from 2, and so on. The last box (Figure 13) is a picture of the median of the four differences for each participant individually. This indicator is intended to represent the overall trend of participant adaptation in order-picking with the help of the individual systems. A negative value, in the context of our research, indicates reductions in times in successive passes.
In both Figure 13 and Figure 14, it can be seen by narrowing the range of times obtained that the participants as a group are adopting the systems used. Outliers occurring in several cases signified the cart tipping over on the turn while heading from zone B to zone C and needing to be lifted or difficulty finding the location in the upper left corner of zone C.
3.3. Analysis of Incorrect Pick-Ups
Incorrect pick-ups
During the test, we recorded instances of incorrect pick-ups. The Pick-by-Paper system had 48 errors, the Pick-by-Light system had 41 errors, and the Pick-by-Point system had 21 errors (Table 1). It’s worth noting that the majority of errors in the Pick-by-Light system were due to a common assumption among participants, leading to errors mainly in zones A and B.
Errors were converted to their percentage occurrence about all pick-ups within the research of a given system and are summarised in Table 2. For the Pick-by-Paper system, 28 people participated by completing 5 pick-ups in each of 5 orders (1). For the other systems, it was 71 people (2).
Another indicator is the average number of errors per participant (abb. P, – participants), as presented in Table 3. The calculations were performed according to (3) and (4). This indicator shows that the Pick-by-Paper system averages 1.71 errors per participant, a high value.
Summarising the total number of errors during the test, the Pick-by-Point system proved the most resilient. This system did not allow passing to the following location after scanning the wrong barcode, but in such a case, the error was recorded.
Time by number of errors made –Pick-by-Paper
During the research, the sum of errors made by a given participant in all passes within a given system was counted. Figure 15, Figure 16 and Figure 17 shows the participant times obtained in each pass with a breakdown of the number of errors made. The graph in Figure 15 shows the times obtained by one participant in each pass with four errors. This graph indicates that the participant lost much time during the first and second orders. In the others, he speeded up. However, deducing from the information collected during which passes he made mistakes is impossible.
The Pick-by-Paper system was the only tested system that did not have an element of receipt of the pick-up of the item and possible verification of correctness as in the case of Pick-by-Point. With the help of this system, two people made 7 errors, and two made 5 errors. During the test, participants with this system were unaware they were making errors. They were not informed of this by the person counting the errors. From Figure 15, it can be deduced, as indicated by the times obtained, that the people who made 7 errors were not in a hurry. They had difficulty finding the location indicated on the document (Figure 4).
Time by number of errors made–Pick-by-Light
In the case of the Pick-by-Point system, those making the most errors 4, 5 and 7 were in a hurry to complete the order (Figure 16). These participants prioritised a short order-picking time.
Time by number of errors made –Pick-by-Point
During order-picking with the Pick-by-Point system, one person made 3 and one made 5 errors (Figure 17). Two people made two errors each. In this method, the participants’ problem was adapting to the wrist scanner and placing barcodes on the shelves.
3.4. Survey Results
Participant evaluations for the tested systems.
After picking the 5 orders, participants could give their impressions in an ongoing survey. From the responses received (Table 4), 27 out of 53 for Pick-by-Light and 24 out of 51 for Pick-by-Point could quickly see the location indicated by the system, which is a promising start. Moreover, for 31 people, both systems were easy to follow, indicating a high potential for usability. 13 and 12 responded that the systems were convenient. However, it’s important to note that there were also people for whom the systems were tiring and cumbersome.
Comments submitted to the systemPick-by-Point
The participants could also express their perceptions in a loose statement on two questions (Table 5). 29 people reported problems with the scanning. Despite being able to type in any statement, participants’ comments were very similar. The problem was that the scanner had to be placed right from the barcode. If the scanner was too close or far away, the receipt failed, and the system did not indicate the new location. The scanner receipt problem also had an impact on order-picking times.
Comparative survey –indicating systems
As with the previous survey, participants were not obliged to respond but encouraged to do so; hence, not all were completed. Participants were very divided in the comparison survey (Table 6). 29 out of 62 participants found the Pick-by-Light indicating method the most intuitive and fastest to learn. On the other hand, 32 participants identified the Pick-by-Point system as the most intuitive and 31 as the quickest to learn. Interestingly, some participants found both systems to be tiring.
Comparative survey –receipt systems
For the survey on receipt systems, 39 out of 62 participants (62.9%) indicated the convenience of the proglove system i.e. using a wrist scanner (Table 7). The others favoured the button system on the Pick-by-Light module.
4. Conclusions
Three systems were examined to support the manual picking process, i.e. Pick-by-Paper, Pick-by-Light and Pick-by-Point. In addition to the first system, the other two were supplemented by a receipt system. In the case of the first, was based on a button on the module, while the second used a wrist-based barcode scanner. Each system had its strengths and weaknesses, directly impacting the indicators studied. The stated aims of the study were to examine order-picking time, speed of participant adaptation to the systems, number of errors made and participant opinion of the systems.
- •
- Pick-by-Light proved to be the fastest in order-picking and employee adaptation (learning) system according to measurements, while Pick-by-Point was the most resistant to errors made.
- •
- The impact on the number of incorrect pick-ups in the Pick-by-Light system was the difficulty for participants to remember that the container is under the indicating module and not above it. This was particularly the case in zones A and B, i.e. the initial order-picking phase. In this system configuration, where the receipt is via a button on the module. The system for indicating incorrect pick-up of an item, i.e. flashing a light, is not practical. The system would require item identification, e.g. using a barcode directly on the item, an infrared curtain or an RFID system with a tag on each item.
- •
- The order-picking time with the Pick-by-Point system was influenced by the time of participant adaptation to the wrist scanner. Many participants expressed this in the survey, indicating difficulties with the scanner reading the code.
- •
- The person with experience 9 years of working in the picking process did not make any mistake. In addition, the person quickly adapted to the respective system after only three orders. In her professional work, this person worked mainly with the Pick-by-Voice system.
- •
- Participants found it difficult to locate in the upper left corner of the high rack in zone C (Figure 18). In particular, during the Pick-by-Light implementation. They did not notice the light on.
- •
- In future studies, it would be helpful to count the number of participants’ incorrect pick-ups for each pass rather than as the sum of all passes within a given system. Such an approach could show the relationship between participant order-picking speed and the number of errors made within a given system.
- •
- The results of the surveys indicate the importance of introducing more specific training to sensitise new employees to prevalent mistakes and the locations of common mistakes.
References
- Anhong, G., Raghu Sh., Xie X., Ismail S., Luo X., Simoneau J., Gilliland S., Baumann H., Southern C., Starner T., A comparison of order-picking assisted by head-up display (HUD), cart-mounted display (CMD), light, and paper pick list, Proceedings of the 2014 ACM International Symposium on Wearable Computers, ISWC ’14, Association for Computing Machinery, 2014, 71–-78, . [CrossRef]
- Baechler, A.; Baechler, L.; Autenrieth, S.; Kurtz, P.; Hoerz, T.; Heidenreich, T.; Kruell, G. A Comparative Study of an Assistance System for Manual Order Picking – Called Pick-by-Projection – with the Guiding Systems Pick-by-Paper, Pick-by-Light and Pick-by-Display. 2016 49th Hawaii International Conference on System Sciences (HICSS) 2016, 523–531, https://ieeexplore.ieee.org/document/7427248.
- Boysen, N. de Koster, R. Weidinger F. Warehousing in the e-commerce era: A survey. European Journal of Operational Research 2019, 277, 396–411. https://www.sciencedirect.com/science/article/pii/S0377221718307185.
- Casella, G., Volpi, A., Montanari, R., Tebaldi, L., Bottani, E. Trends in order picking: a 2007–2022 review of the literature. roduction & Manufacturing Research, 2023, 11(1). [CrossRef]
- Fager, P. Kit preparation for mixed-model assembly: efficiency impact of confirmation methods, Industrial Management & Data Systems, 119 (3), 2018, https://www.emerald.com/insight/content/doi/10.1108/imds-07-2018-0287/full/html.
- Funk, M., Shirazi A.S., Mayer S., Lischke L., Schmidt A. Pick from here! an interactive mobile cart using in-situ projection for order picking, Proceedings of the 2015 ACM International Joint Conference on Pervasive and Ubiquitous Computing, Association for Computing Machinery, New York, NY, USA, 2015, 601–609, . [CrossRef]
- Garbacz, M., M. Łopuszyński. Optymalizacja procesu kompletacji w magazynie (cz. 1). Logistyka 2015, 628–636.
- Garbacz, M., M. Łopuszyński. Optymalizacja procesu kompletacji w magazynie (cz. 2). Logistyka 2015, 637–647.
- Glock, C. H., Grosse E. H., Neumann W. P., Feldman A. Assistive devices for manual materials handling in warehouses: a systematic literature review. International Journal of Production Research, 59 (11), 2020, 3446–3469,. [CrossRef]
- Murauer, C.S. Full shift usage of smart glasses in order picking processes considering a methodical approach of continuous user involvement. Phd Thesis, Technische Universität Berlin, Berlin, 2019.
- Setayesh, A. Grosse, E. Glock, Ch. Neumann, W.P. Determining the source of human-system errors in manual order picking with respect to human factors. International Journal of Production Research 2022, 60 (20), 6350–6372. [CrossRef]
- Scheuermann, C., Heinz F., and Bruegge B., Verclas S. Real-Time Support During a Logistic Process Using Smart Gloves. In Smart SysTech 2017; European Conference on Smart Objects, Systems and Technologies; VDE: Munich, Germany, 2017; pp. 1–8.
- Stockinger, C., T. Steinebach, D. Petrat, R. Bruns, and I. Zöller. I. The Effect of Pick-by-Light-Systems on Situation Awareness in Order Picking Activitie. Procedia Manufacturing 2020, 96–101. https://www.sciencedirect.com/science/article/pii/S2351978920311203.
- Thomas, Ch., Heinz F., Panagiotopoulos T., Kotipalli P., Haynes M., Starner Th. RF-pick: comparing order picking using a HUD with wearable RFID verification to traditional pick methods. In Proceedings of the 2018 ACM International Symposium on Wearable Computers; Association for Computing Machinery: Singapore, Singapore, 2018; pp. 168–175.
- Trojanowska, J.; Husár, J.; Hrehova, S.; Knapčíková, L. Poka Yoke in Smart Production Systems with Pick-to-Light Implementation to Increase Efficiency. Appl. Sci. 2023, 13, 11715. [CrossRef]
- Weaver, K. A. Baumann, H. Starner, T. Iben, H. Lawo, M. An empirical task analysis of warehouse order picking using head-mounted displays Proceedings of the SIGCHI Conference on Human Factors in Computing Systems, Association for Computing Machinery, 2010, 10, 1695-–1704. [CrossRef]
- Wróbel, A., Zbadyński M. Effeciency of selected methods of compleition process on the basis of Luca Logistic Solution systems, Proceedings of Forum Studentów Transportu i Logistyki Journal of TransLogistics, 4 (14), Wrocław, 2018, https://journaloftranslogistics.pwr.edu.pl/Issue–2018,13290.
- Wu, X. Haynes, M. Zhang, Y. Jiang, Z. Shen, Z. Guo, A. Starner, T. Gilliland, S. Comparing order picking assisted by head-up display versus Pick-by-Light with explicit pick confirmation. Proceedings of the 2015 ACM International Symposium on Wearable Computers 2015, 133–136. [CrossRef]
Figure 1.
The testing laboratory layout and its photo.
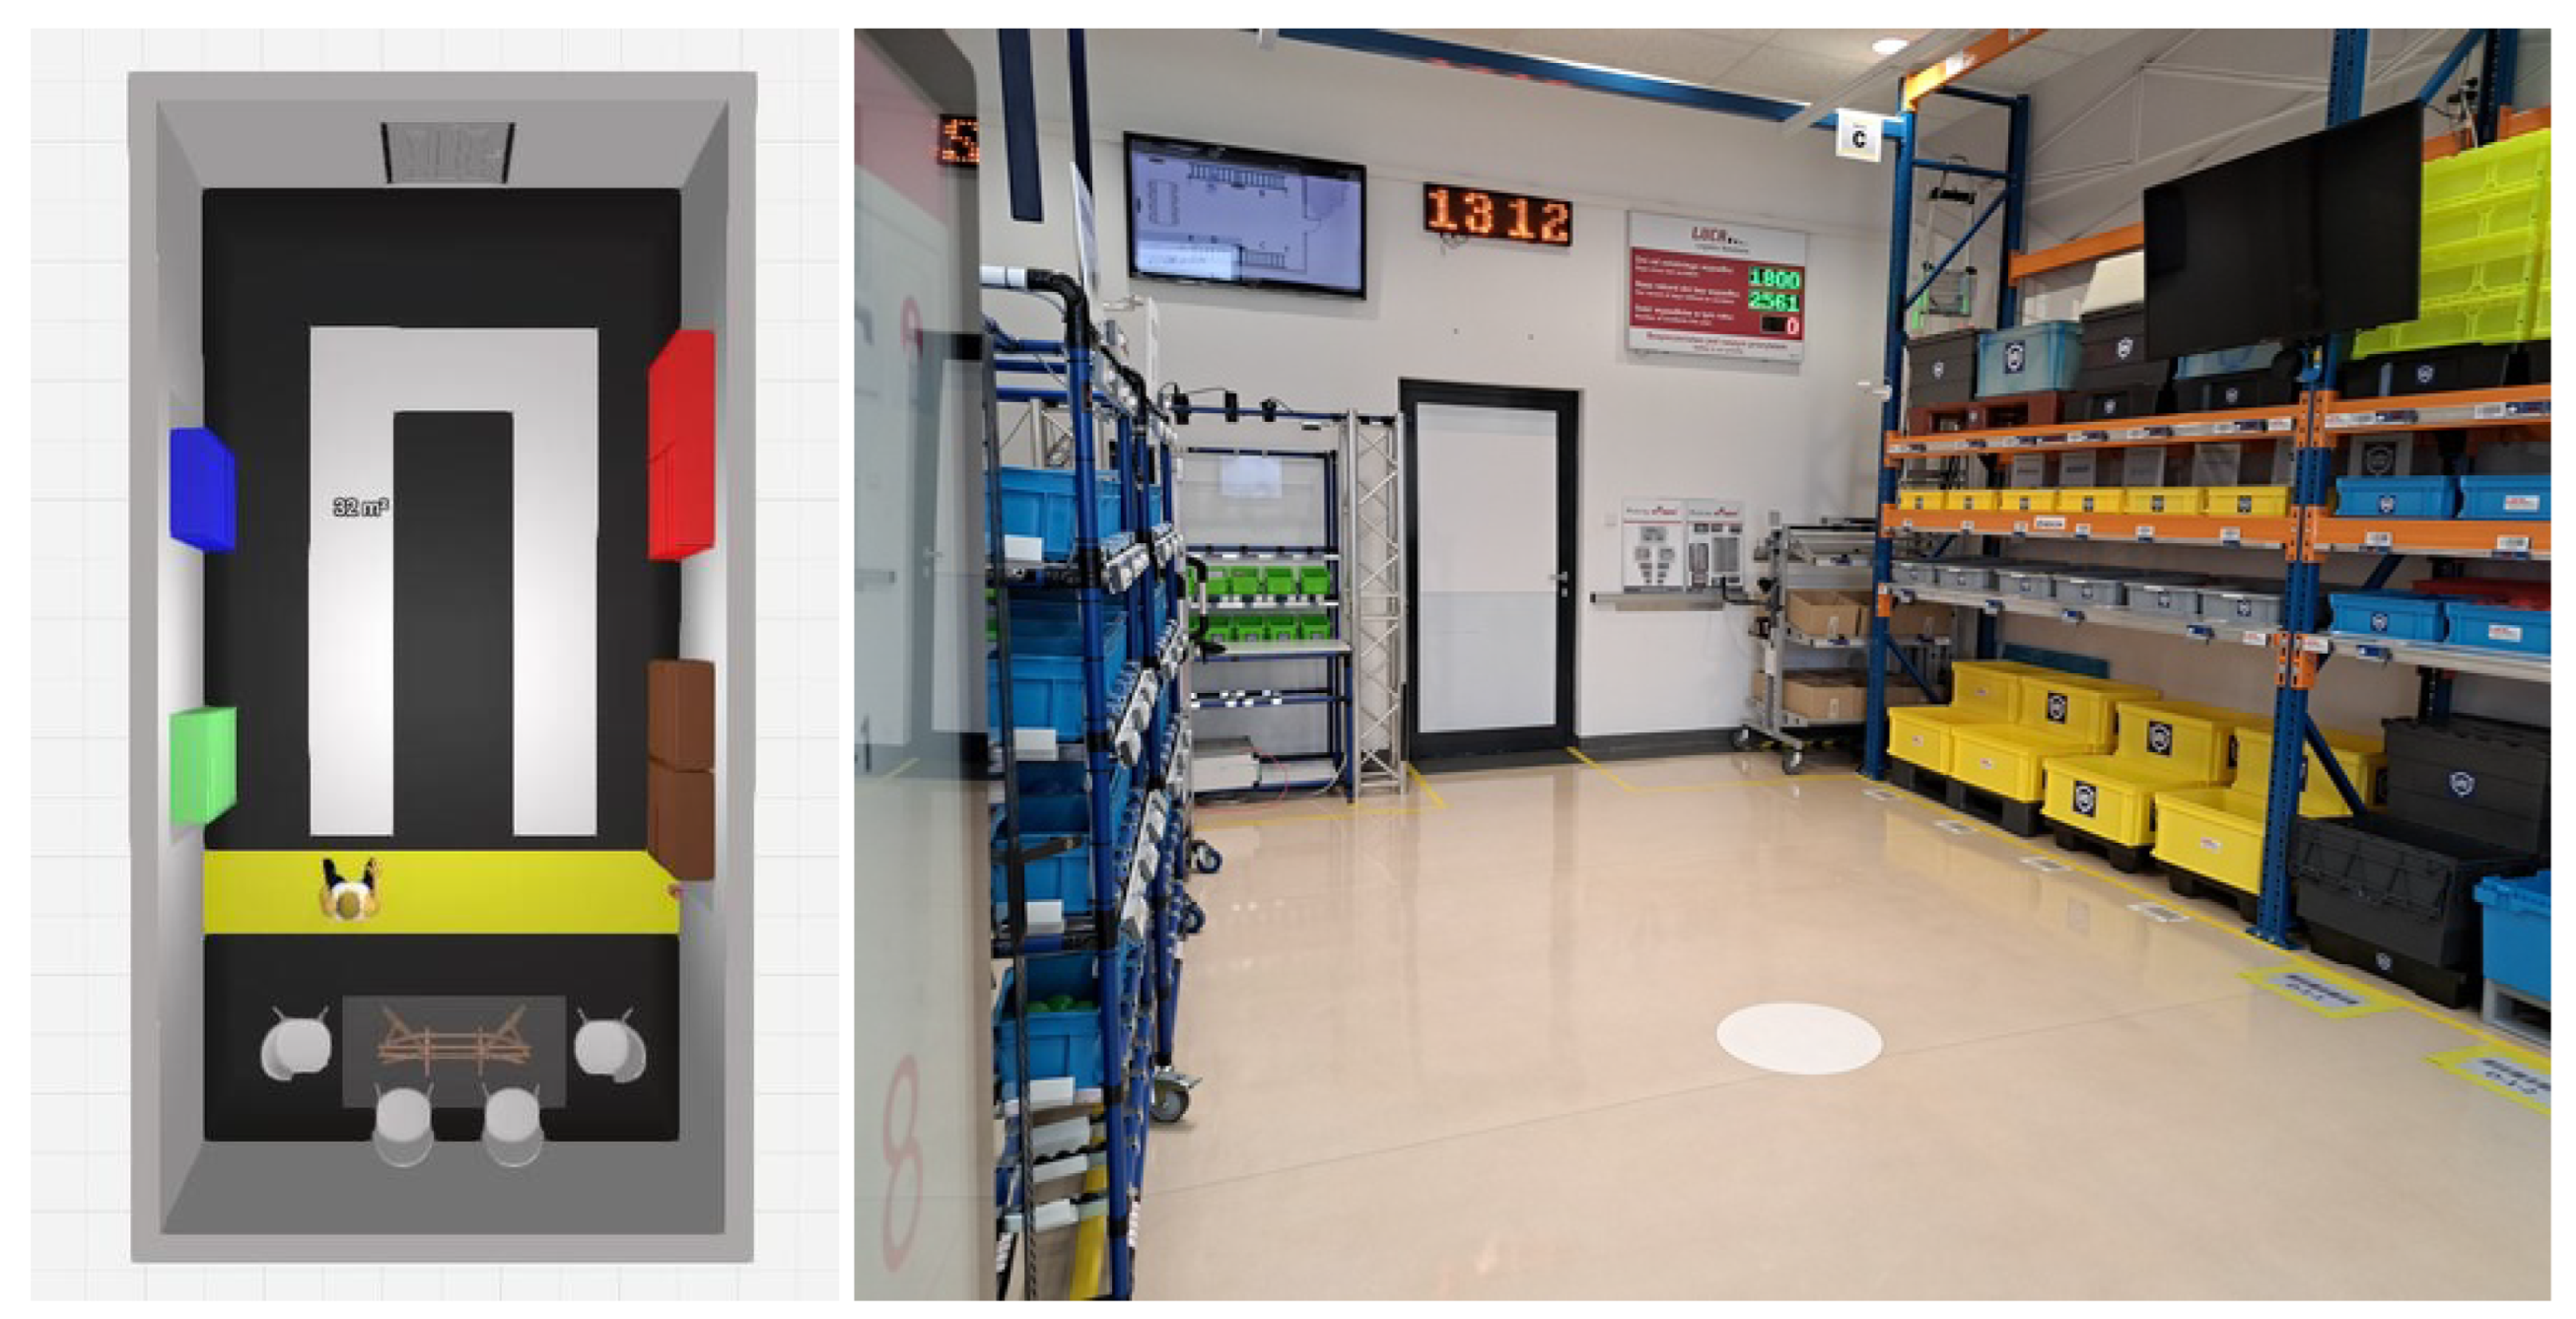
Figure 2.
The shelves on the left used for testing ( zones A and B) and the shelving on the right of the laboratory (zones C and D).
Figure 2.
The shelves on the left used for testing ( zones A and B) and the shelving on the right of the laboratory (zones C and D).
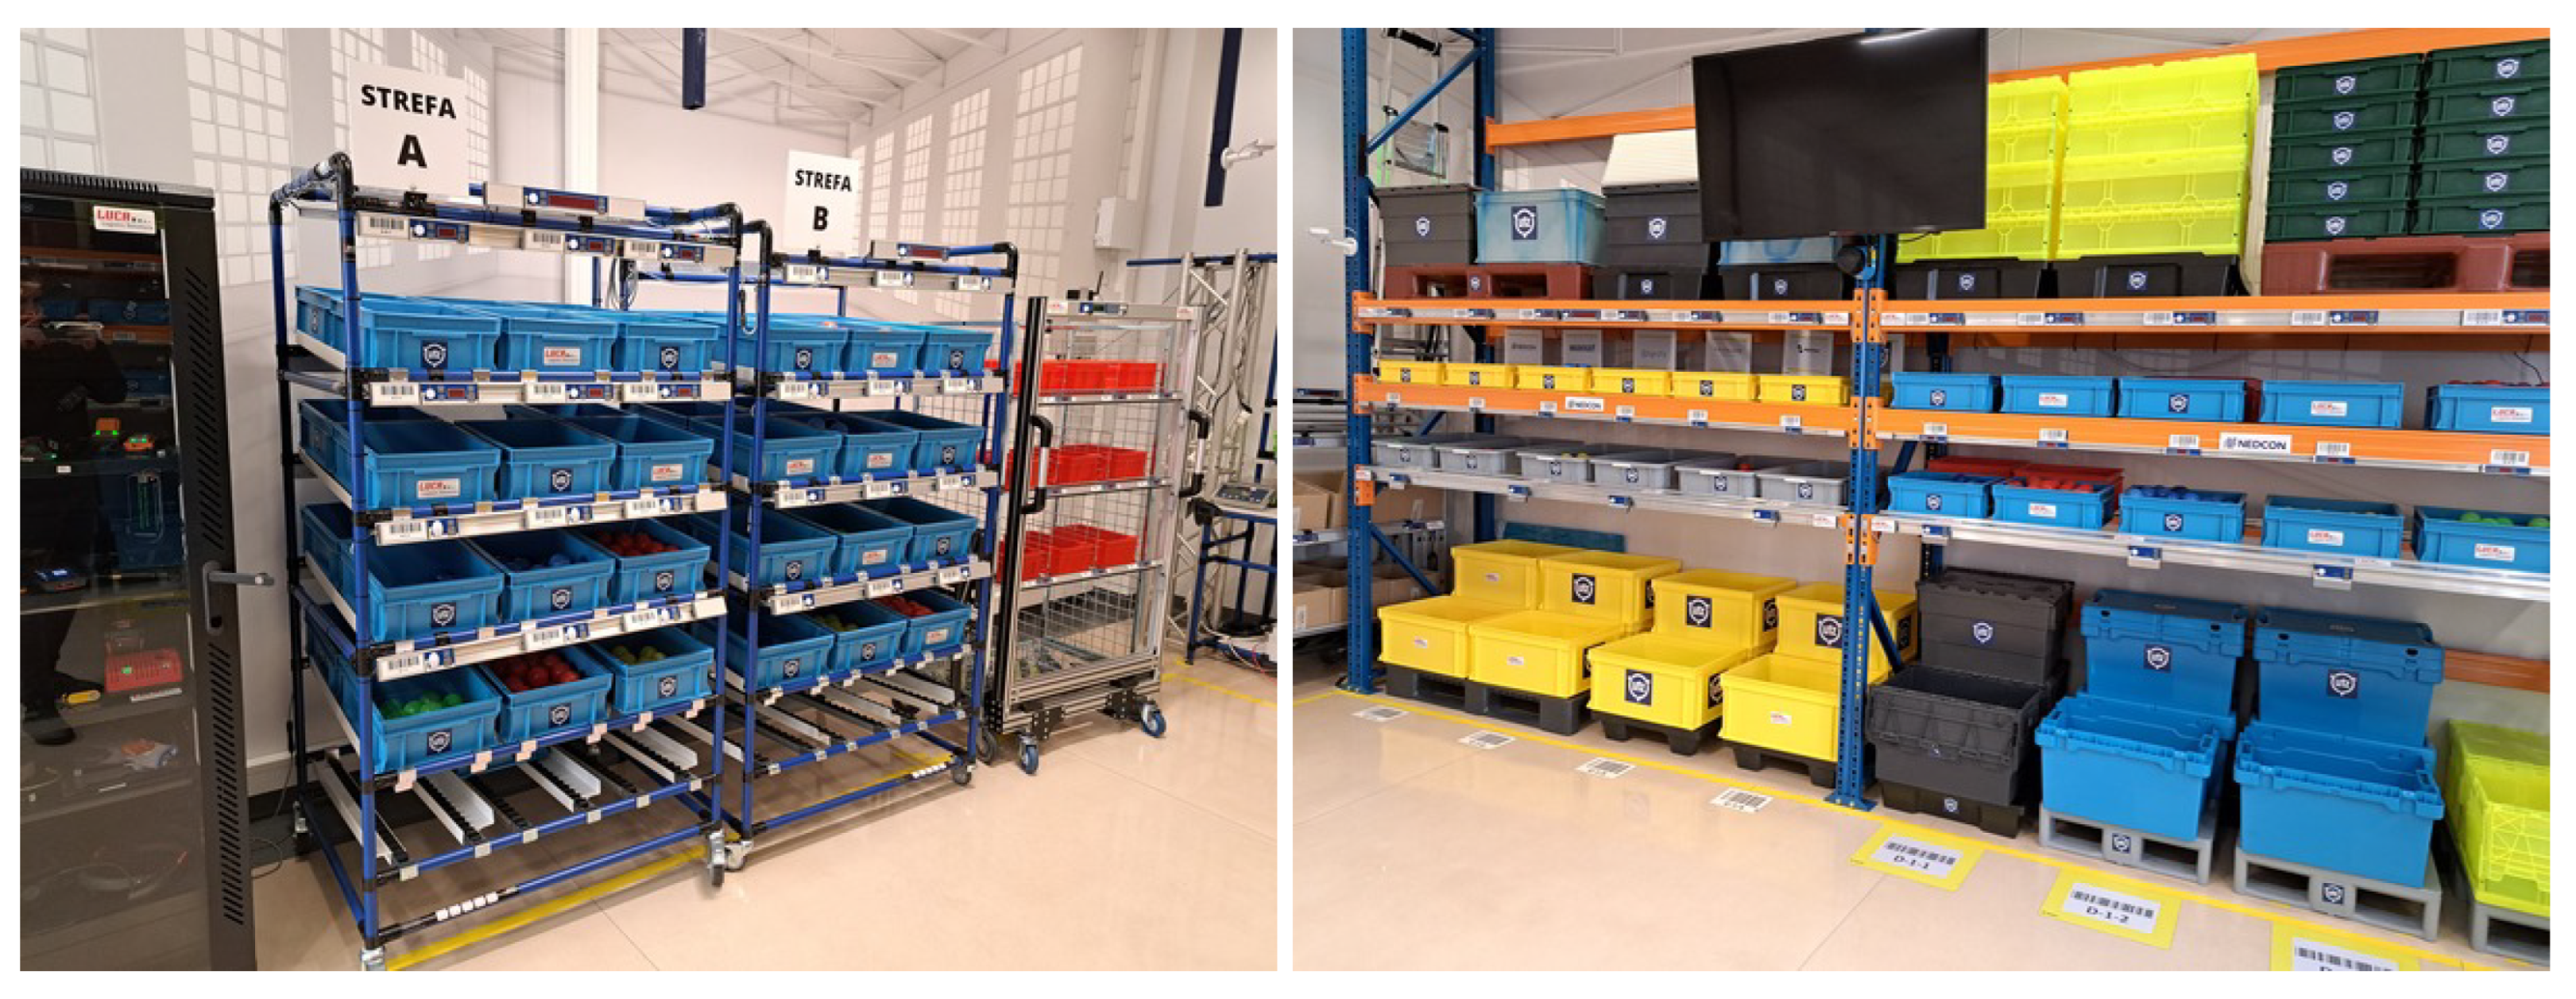
Figure 3.
The balls that were in the bins and the cart to collect them.
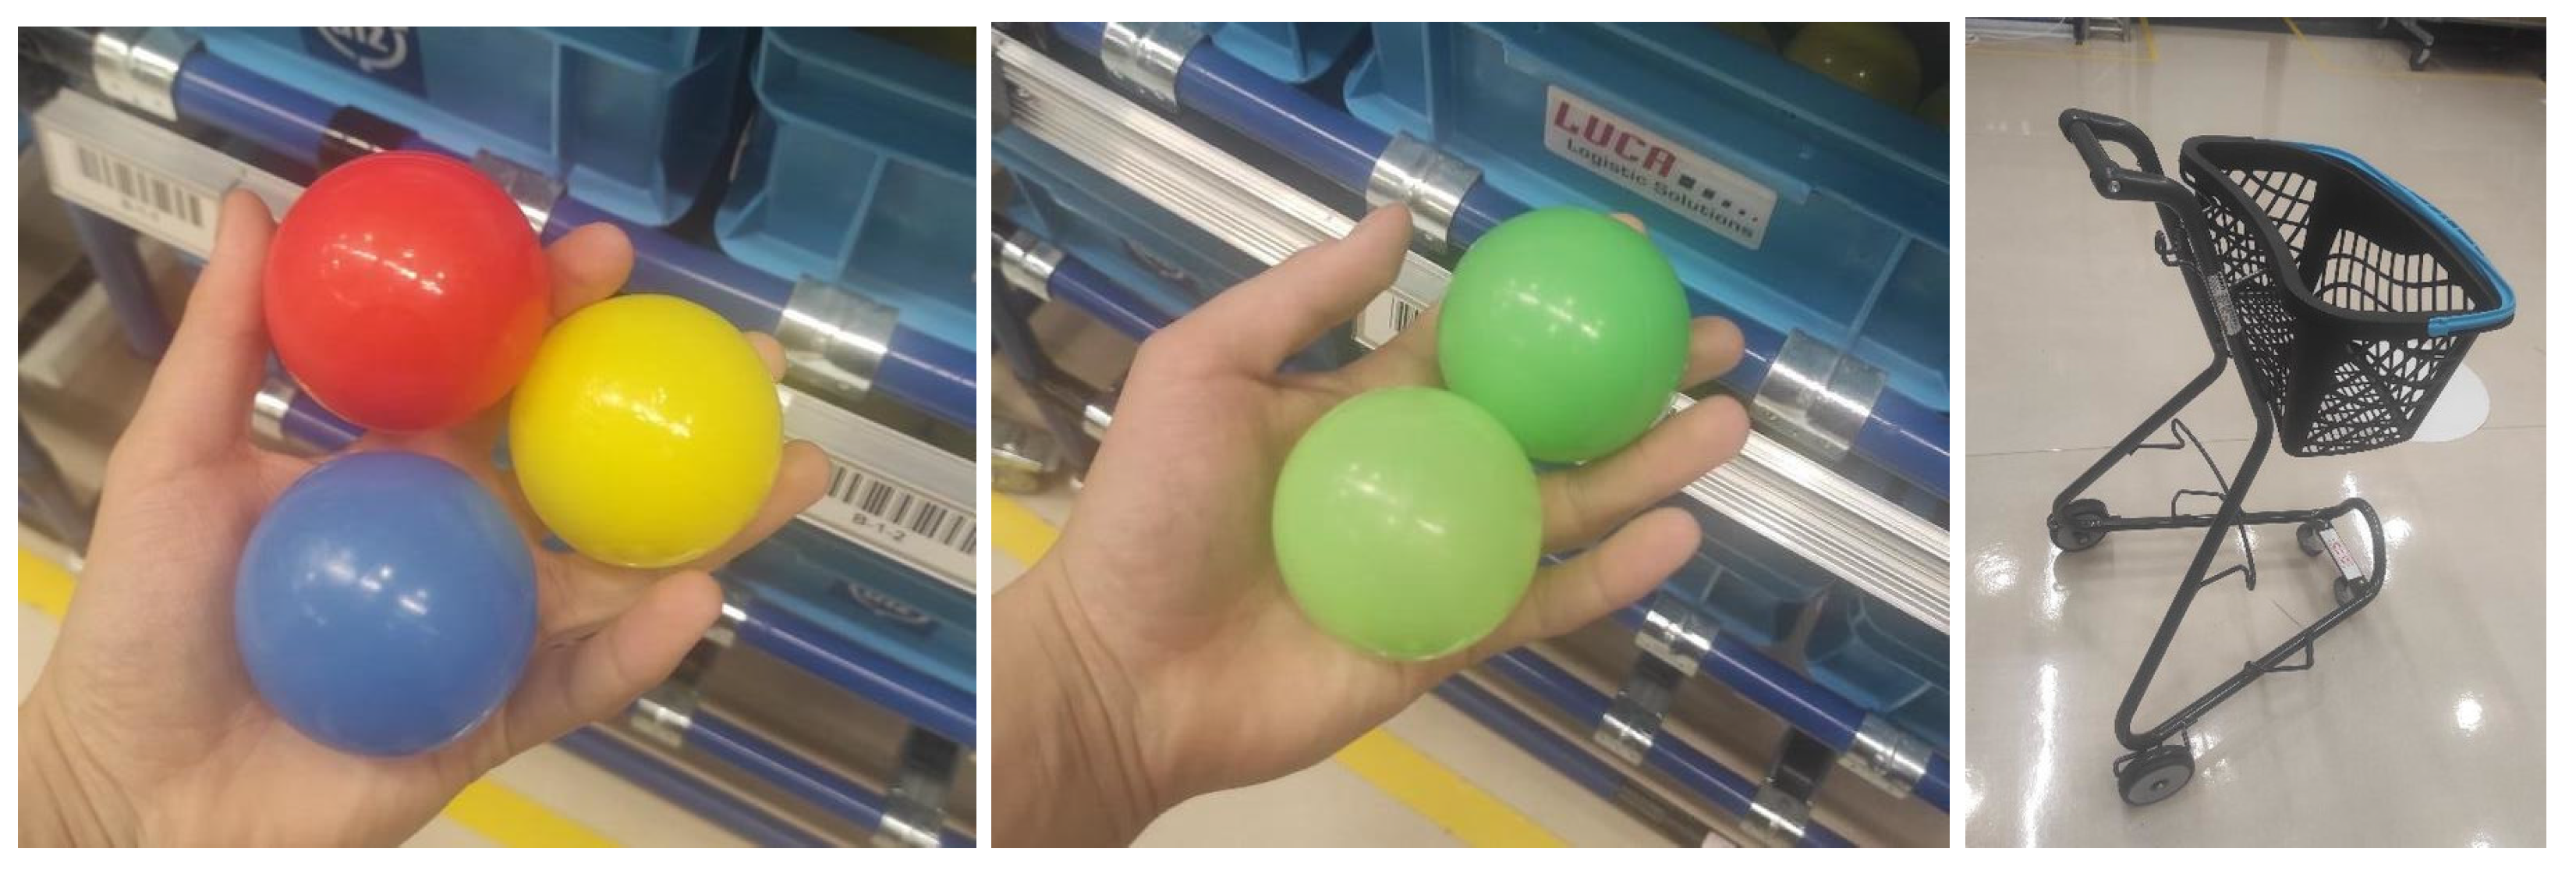
Figure 4.
One of the five documents used in the Pick-by-Paper method.
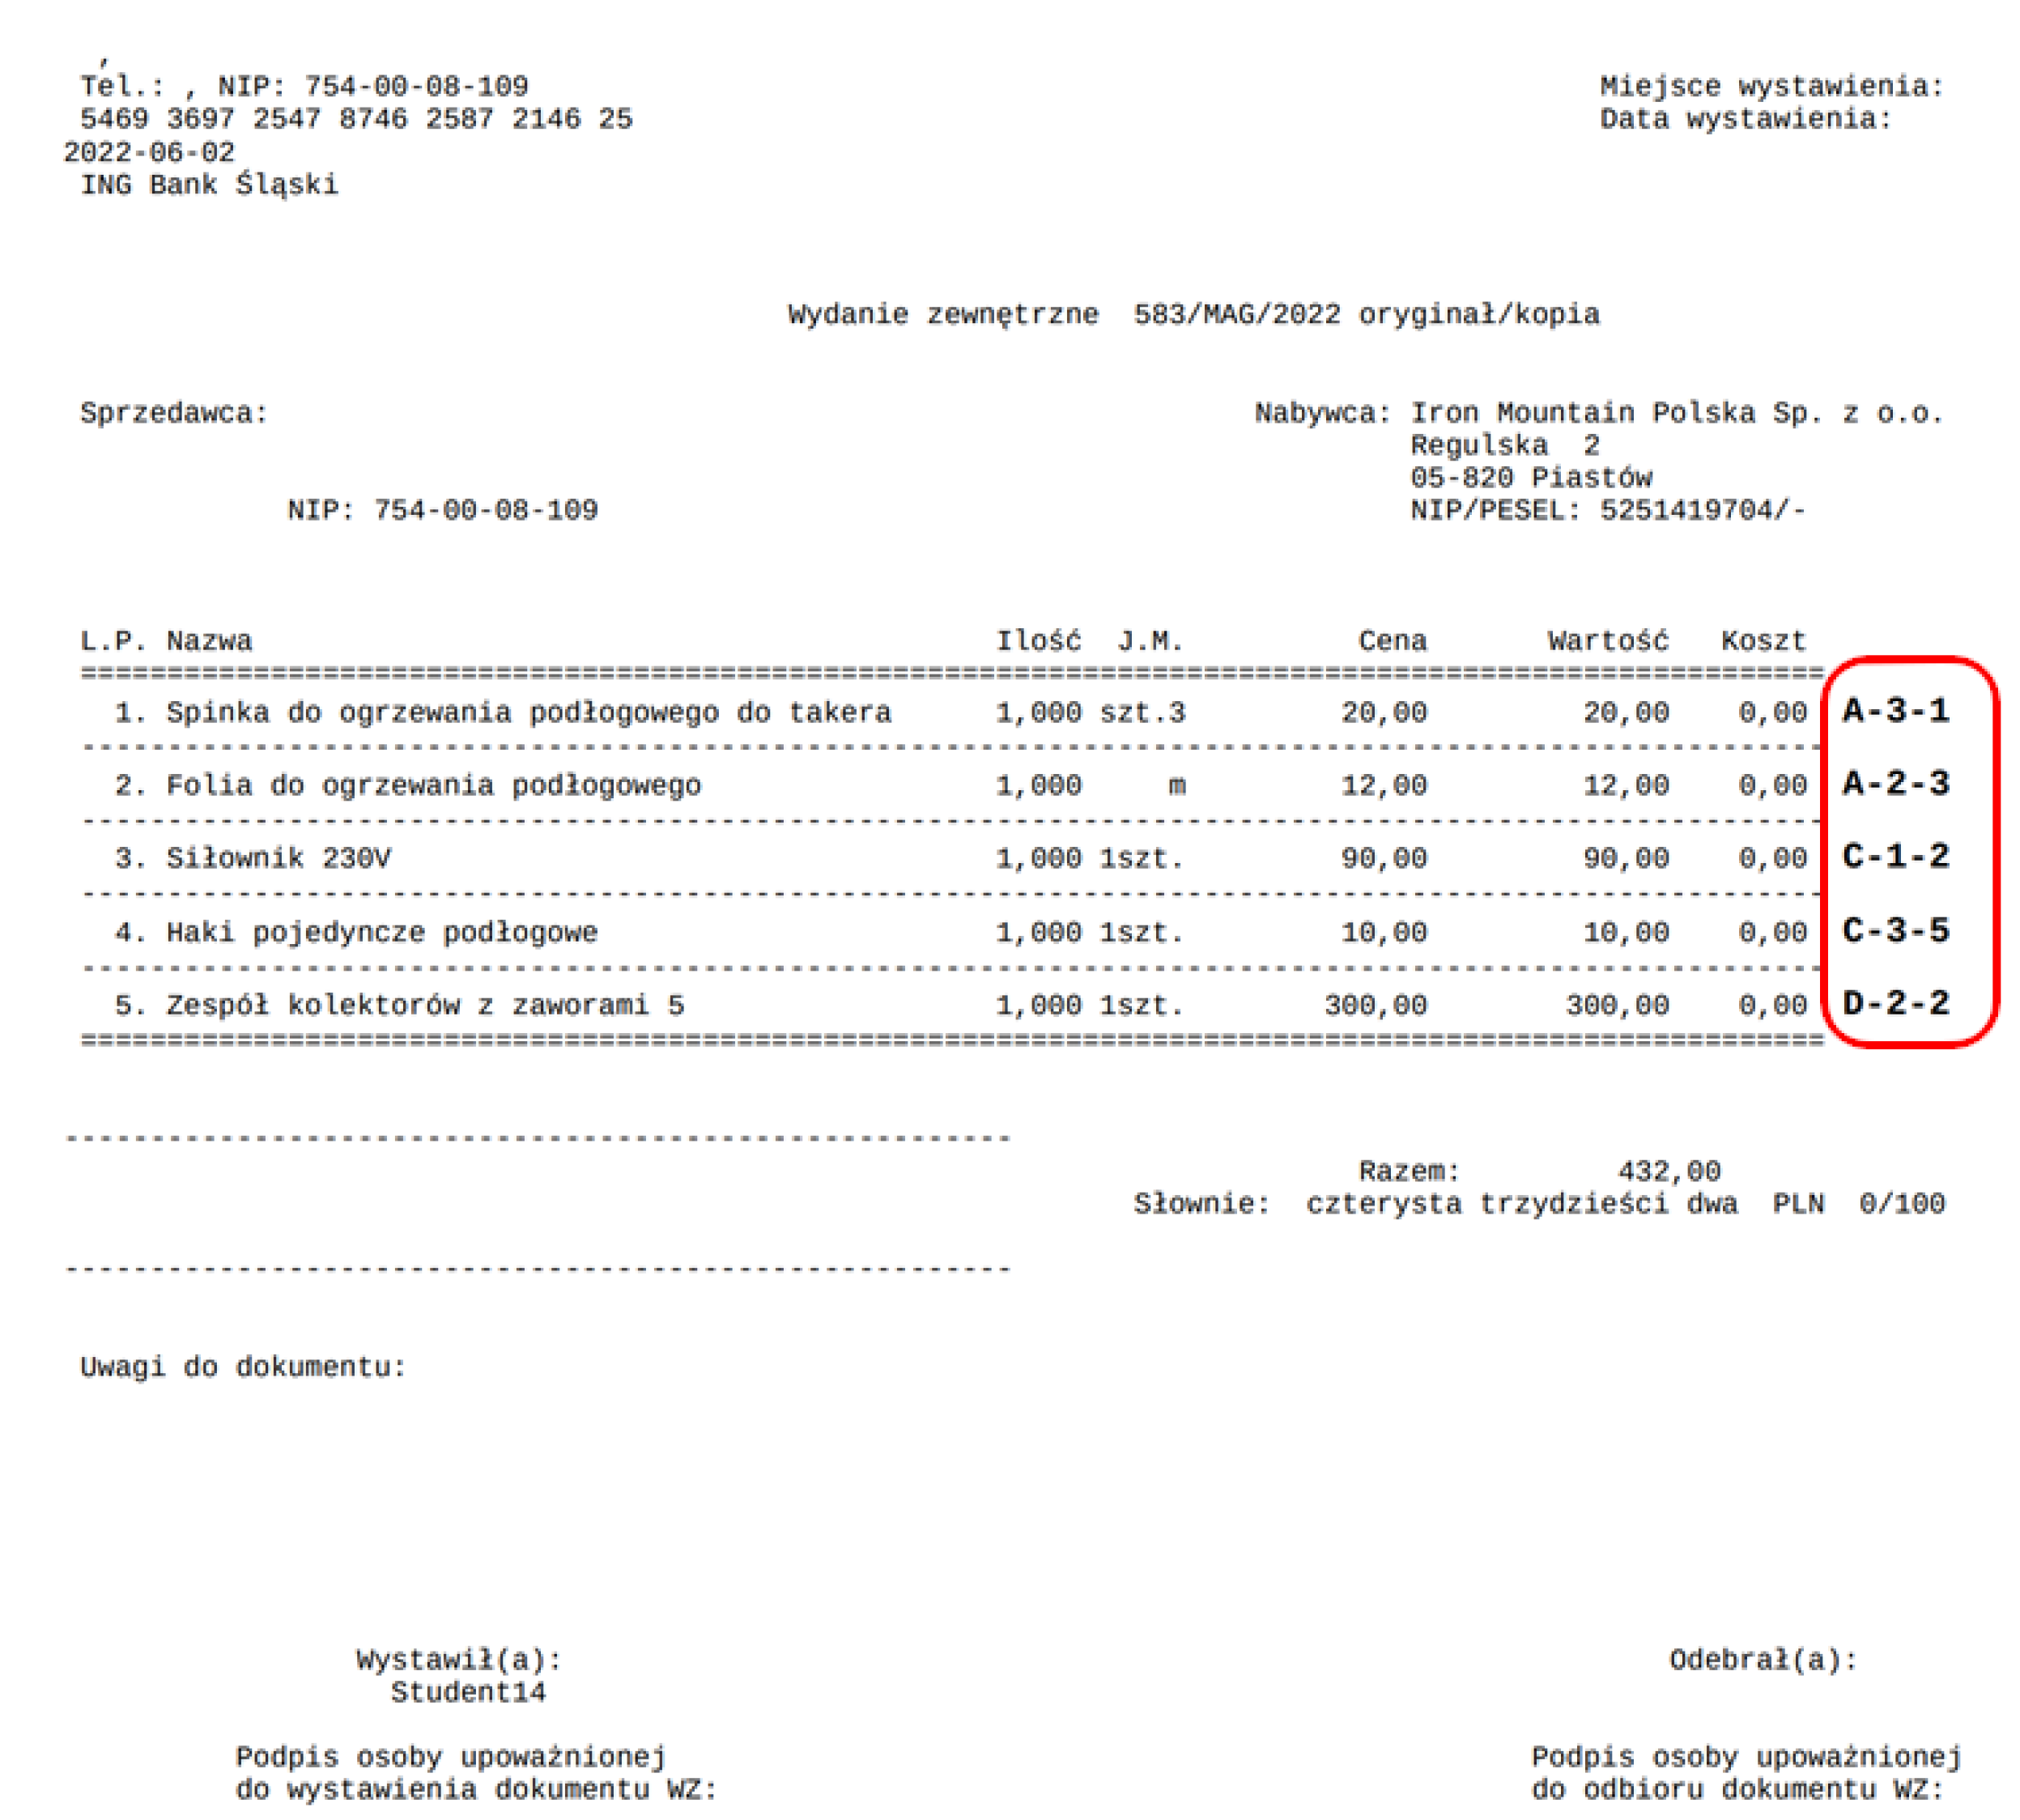
Figure 5.
Pick-by-Light system modules with one or more buttons.
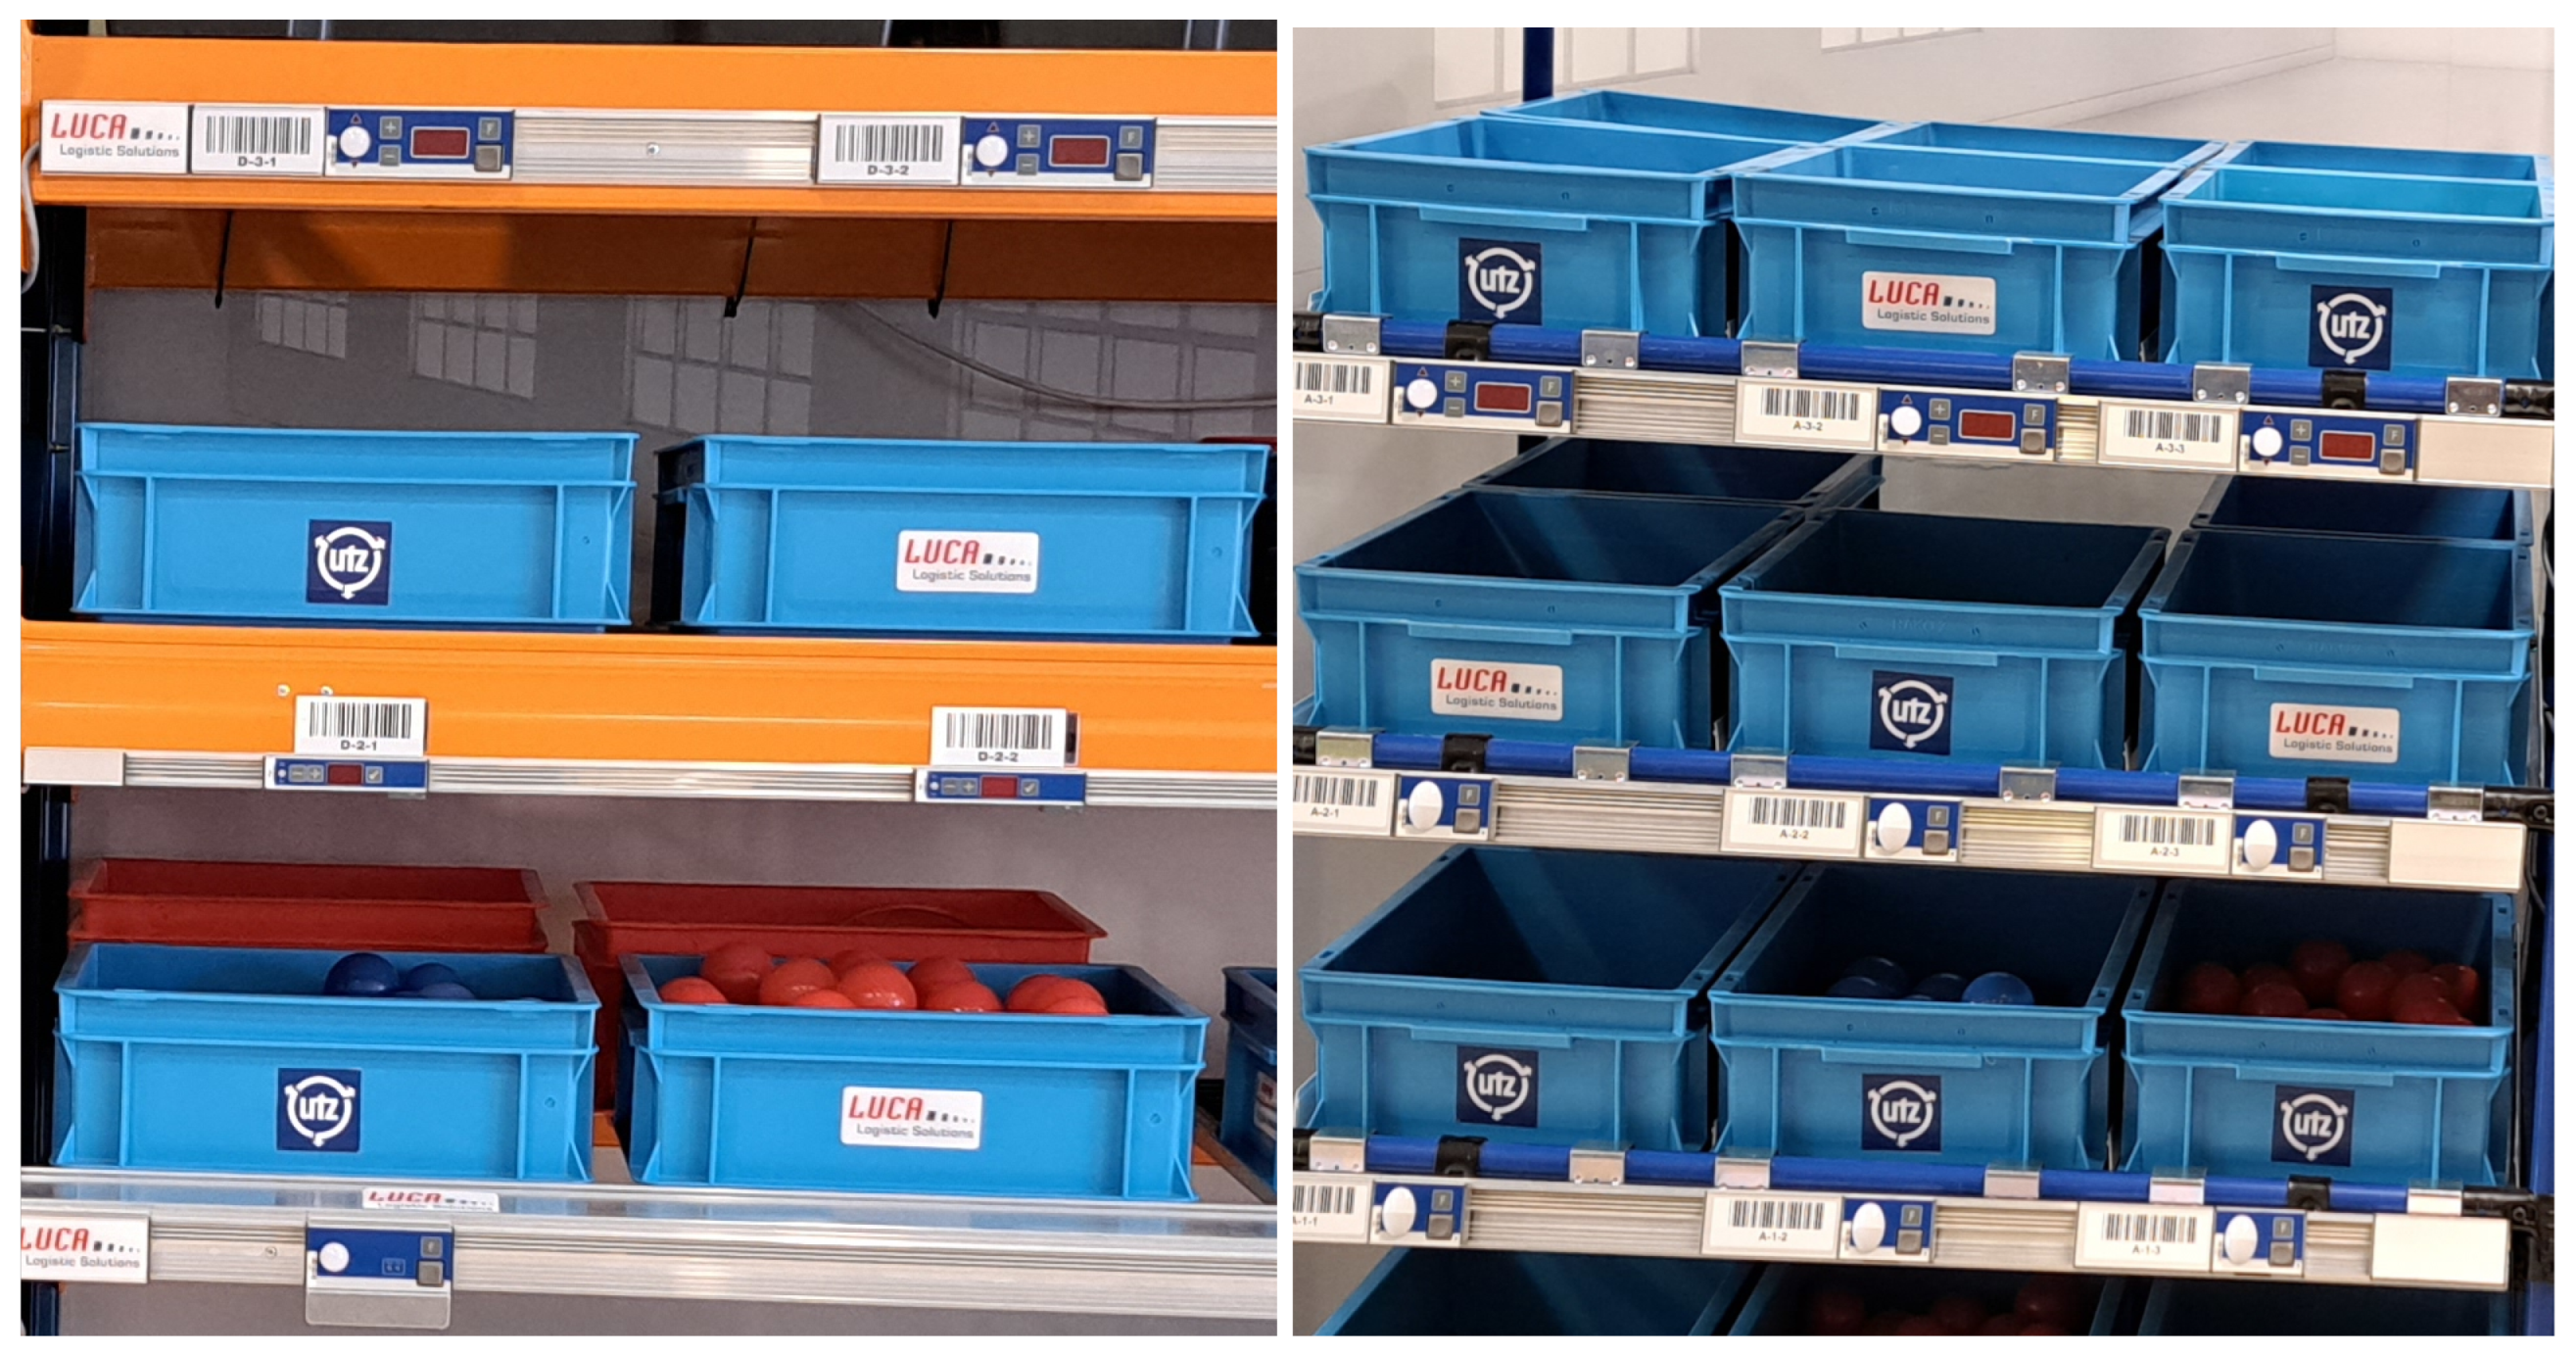
Figure 6.
Pick-by-Point location indicator lamp.
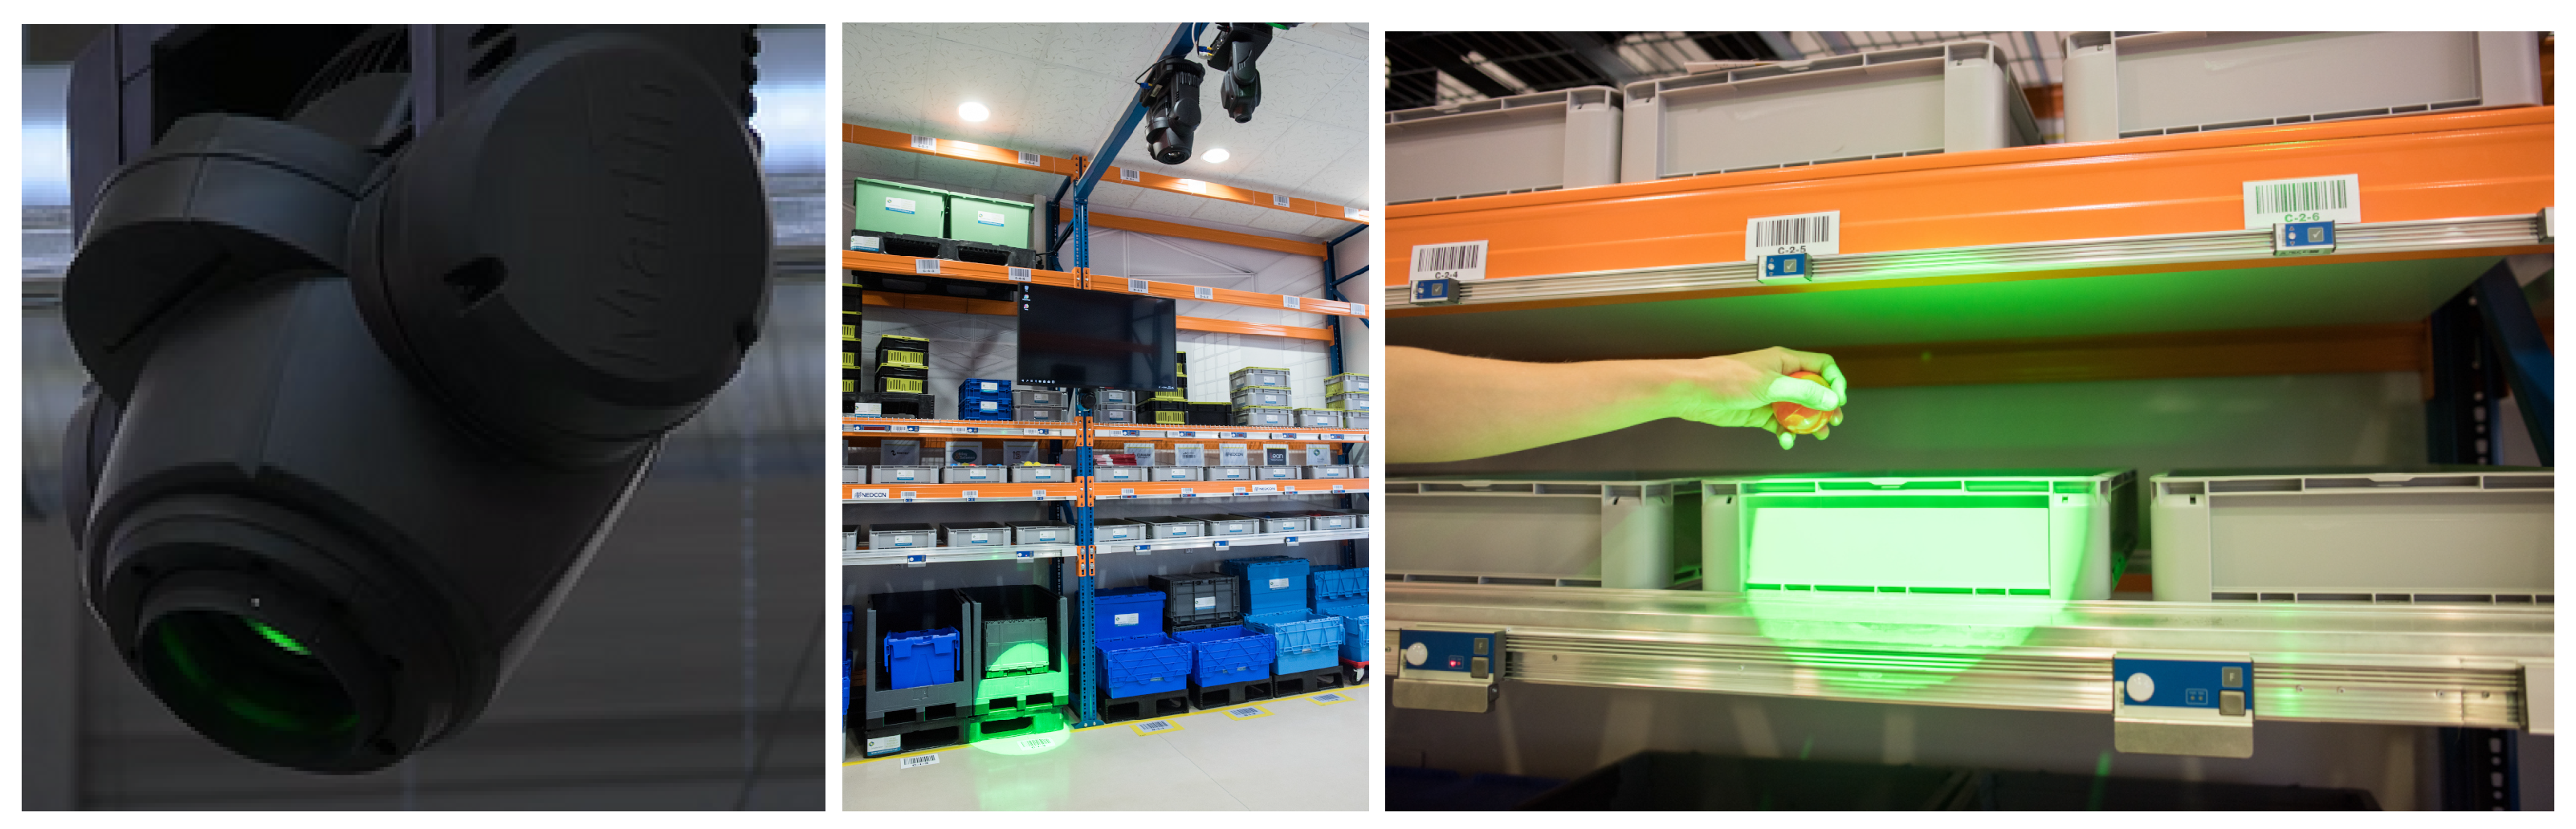
Figure 7.
Wrist scanner for Pick-by-Point receipt.
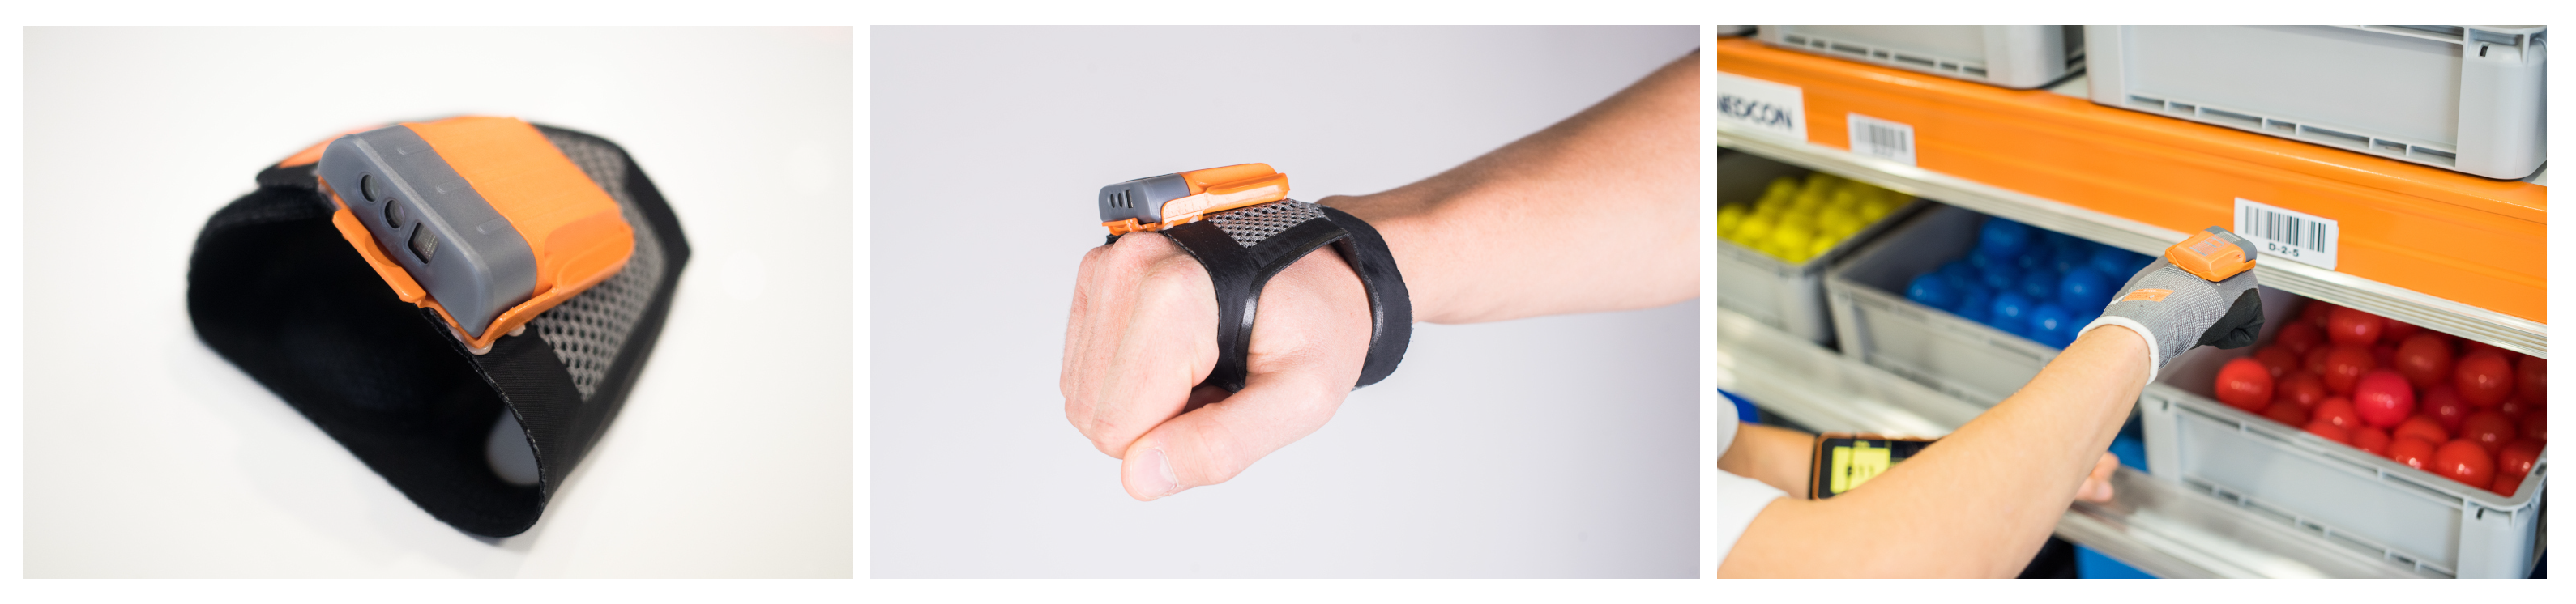
Figure 8.
The participants achieved order-picking times with the Pick-by-Paper system, emphasising the person with experience.
Figure 8.
The participants achieved order-picking times with the Pick-by-Paper system, emphasising the person with experience.
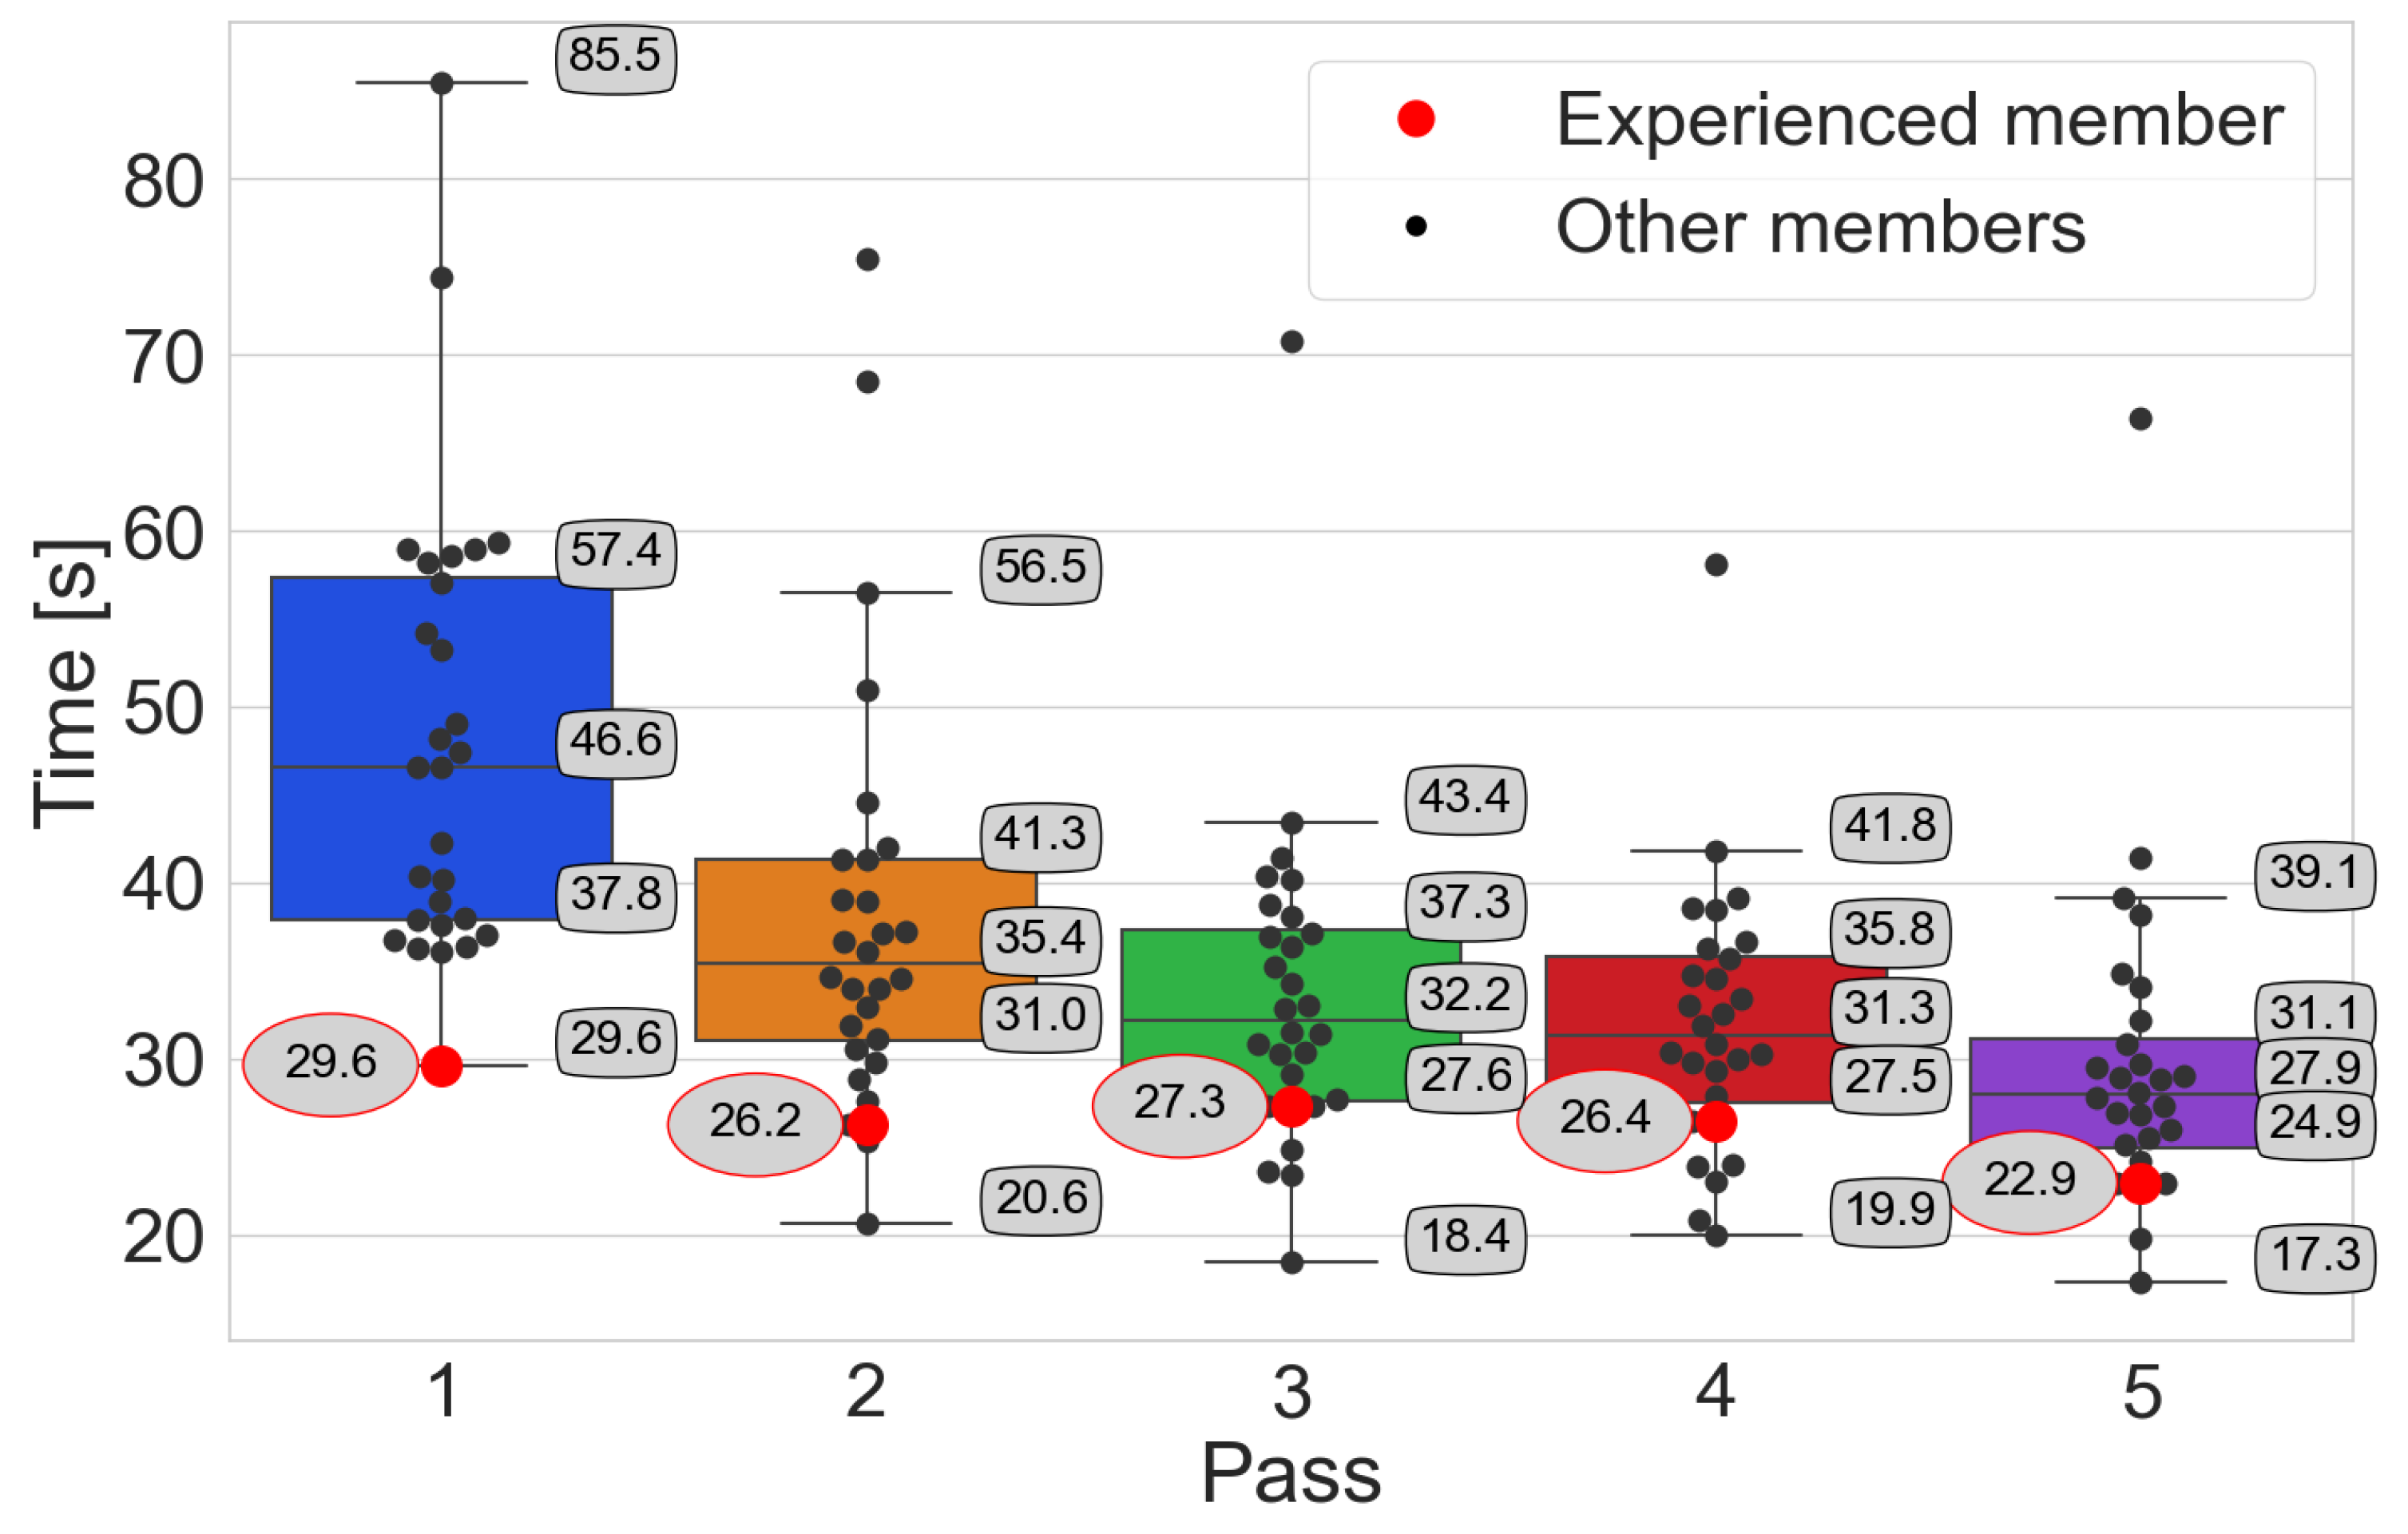
Figure 9.
The participants achieved order-picking times with the Pick-by-Light system, emphasising the person with experience.
Figure 9.
The participants achieved order-picking times with the Pick-by-Light system, emphasising the person with experience.
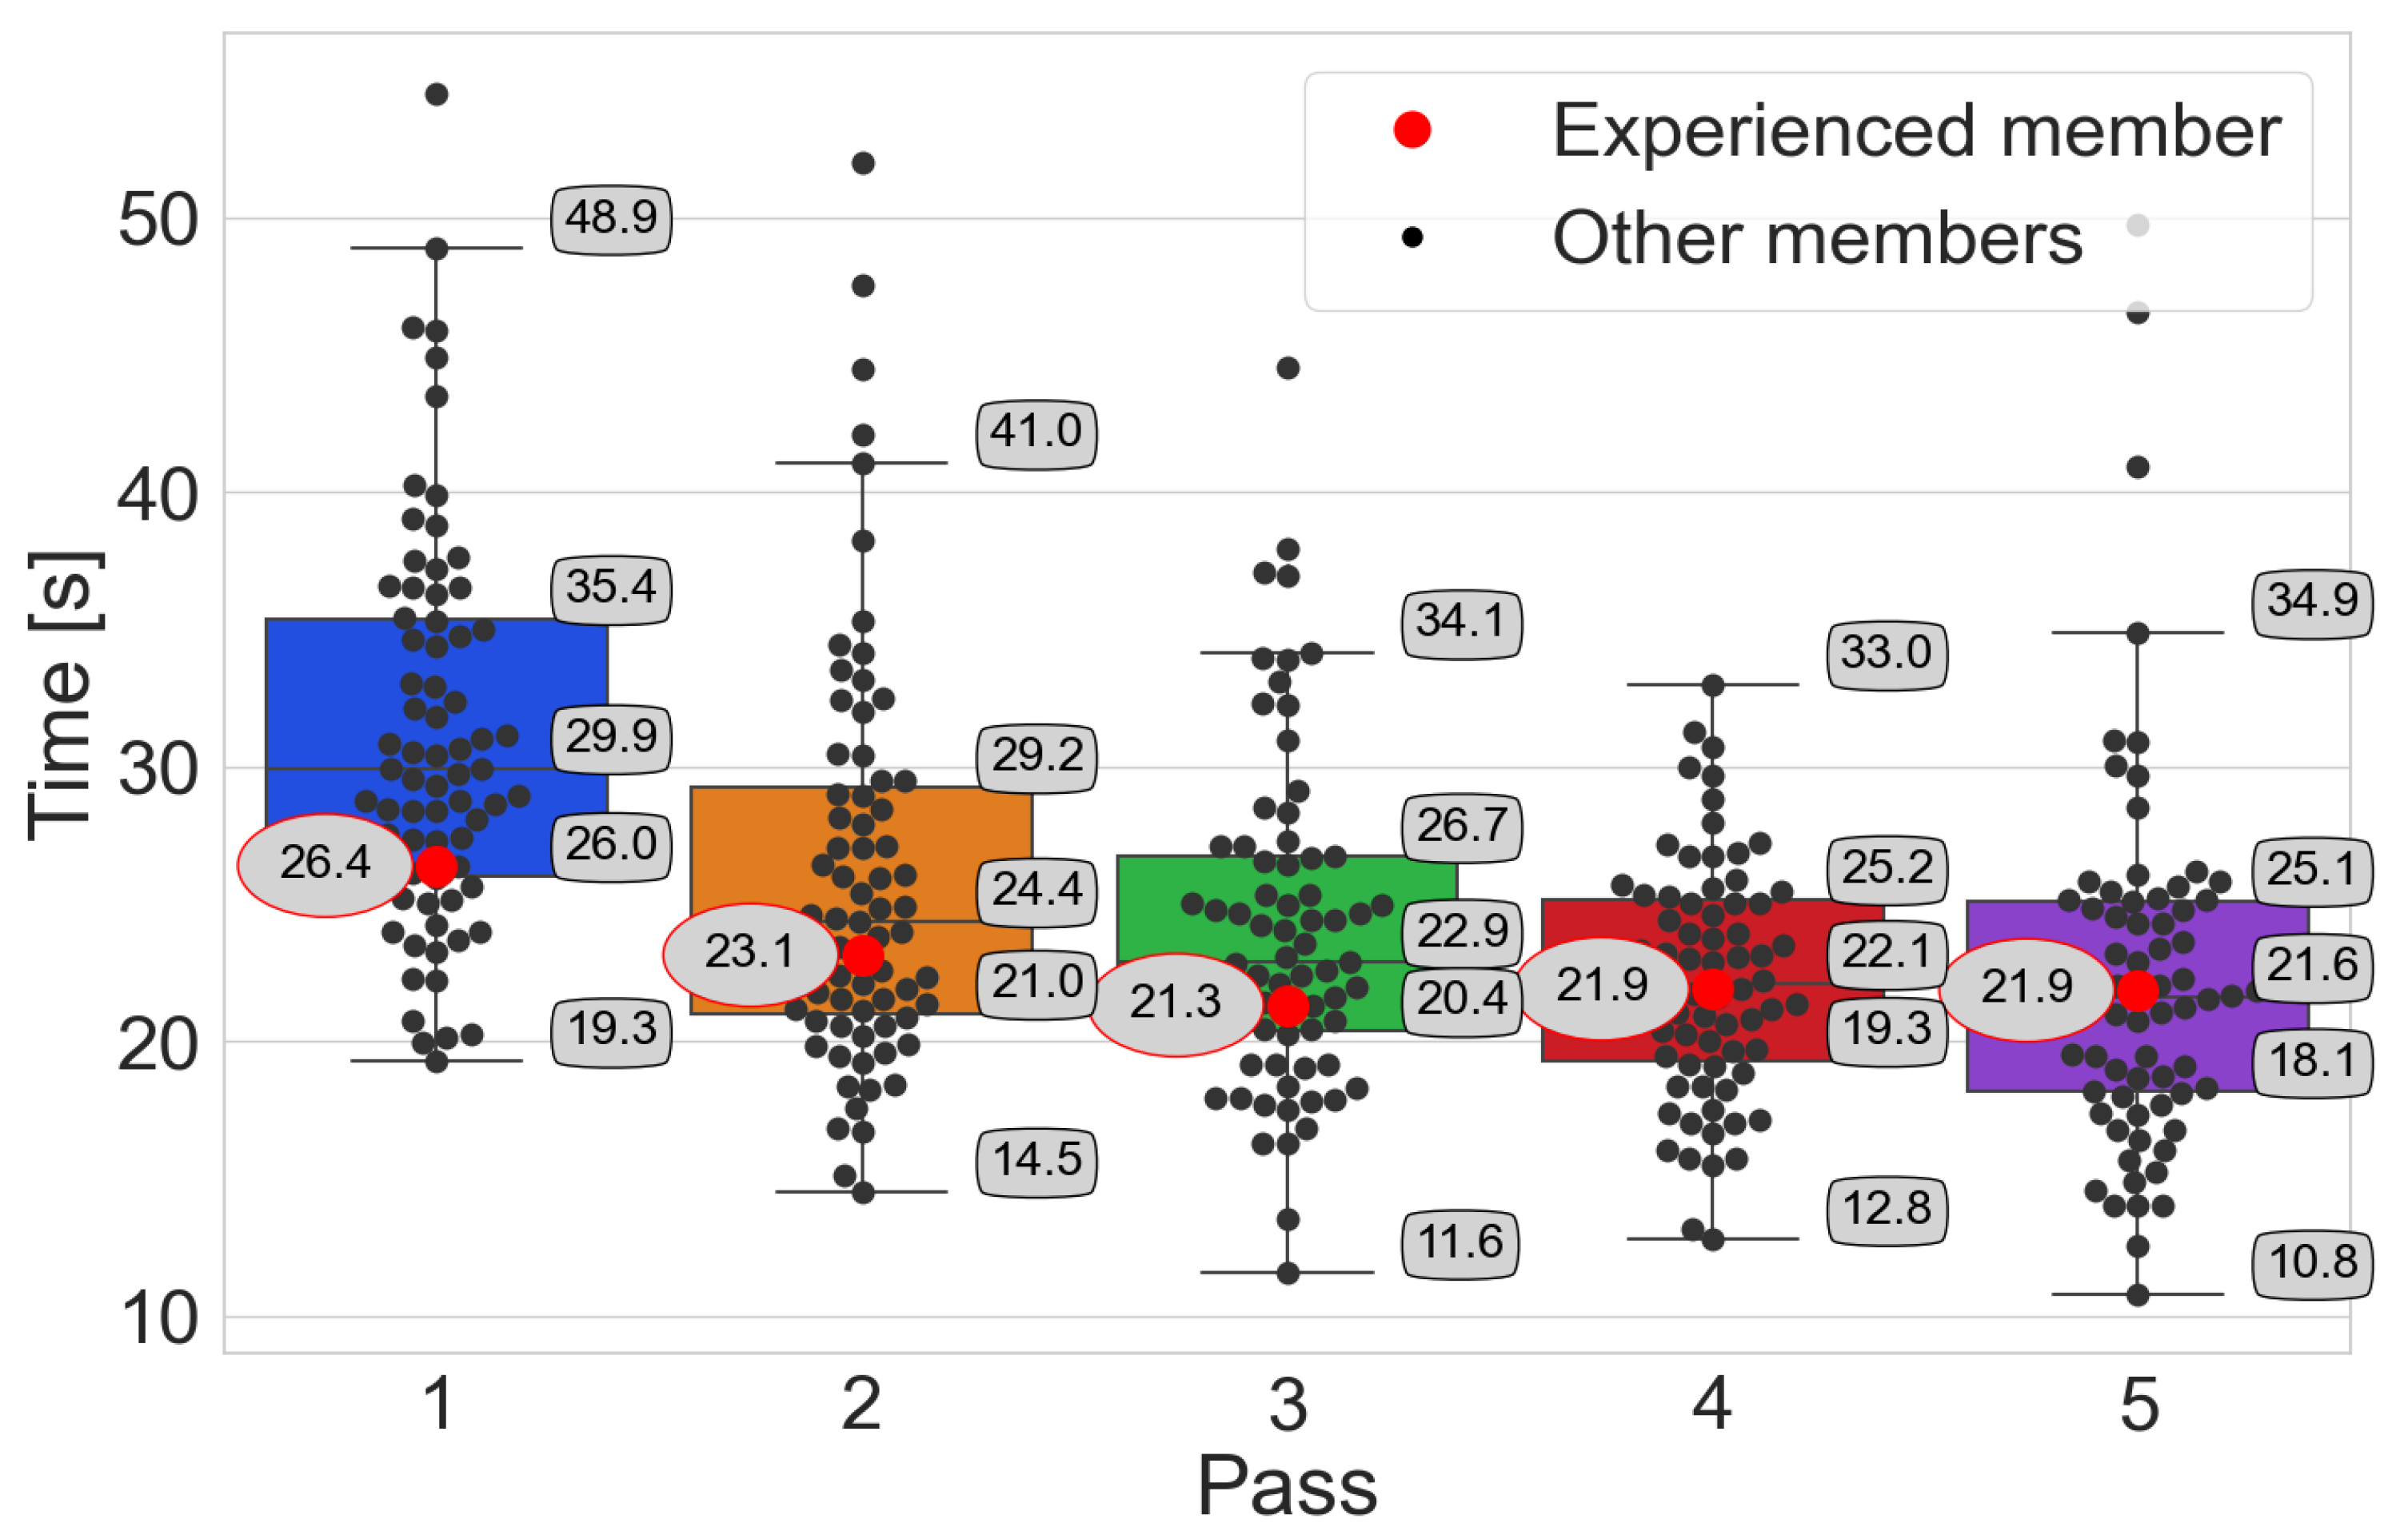
Figure 10.
The participants achieved order-picking times with the Pick-by-Point system, emphasising the person with experience.
Figure 10.
The participants achieved order-picking times with the Pick-by-Point system, emphasising the person with experience.
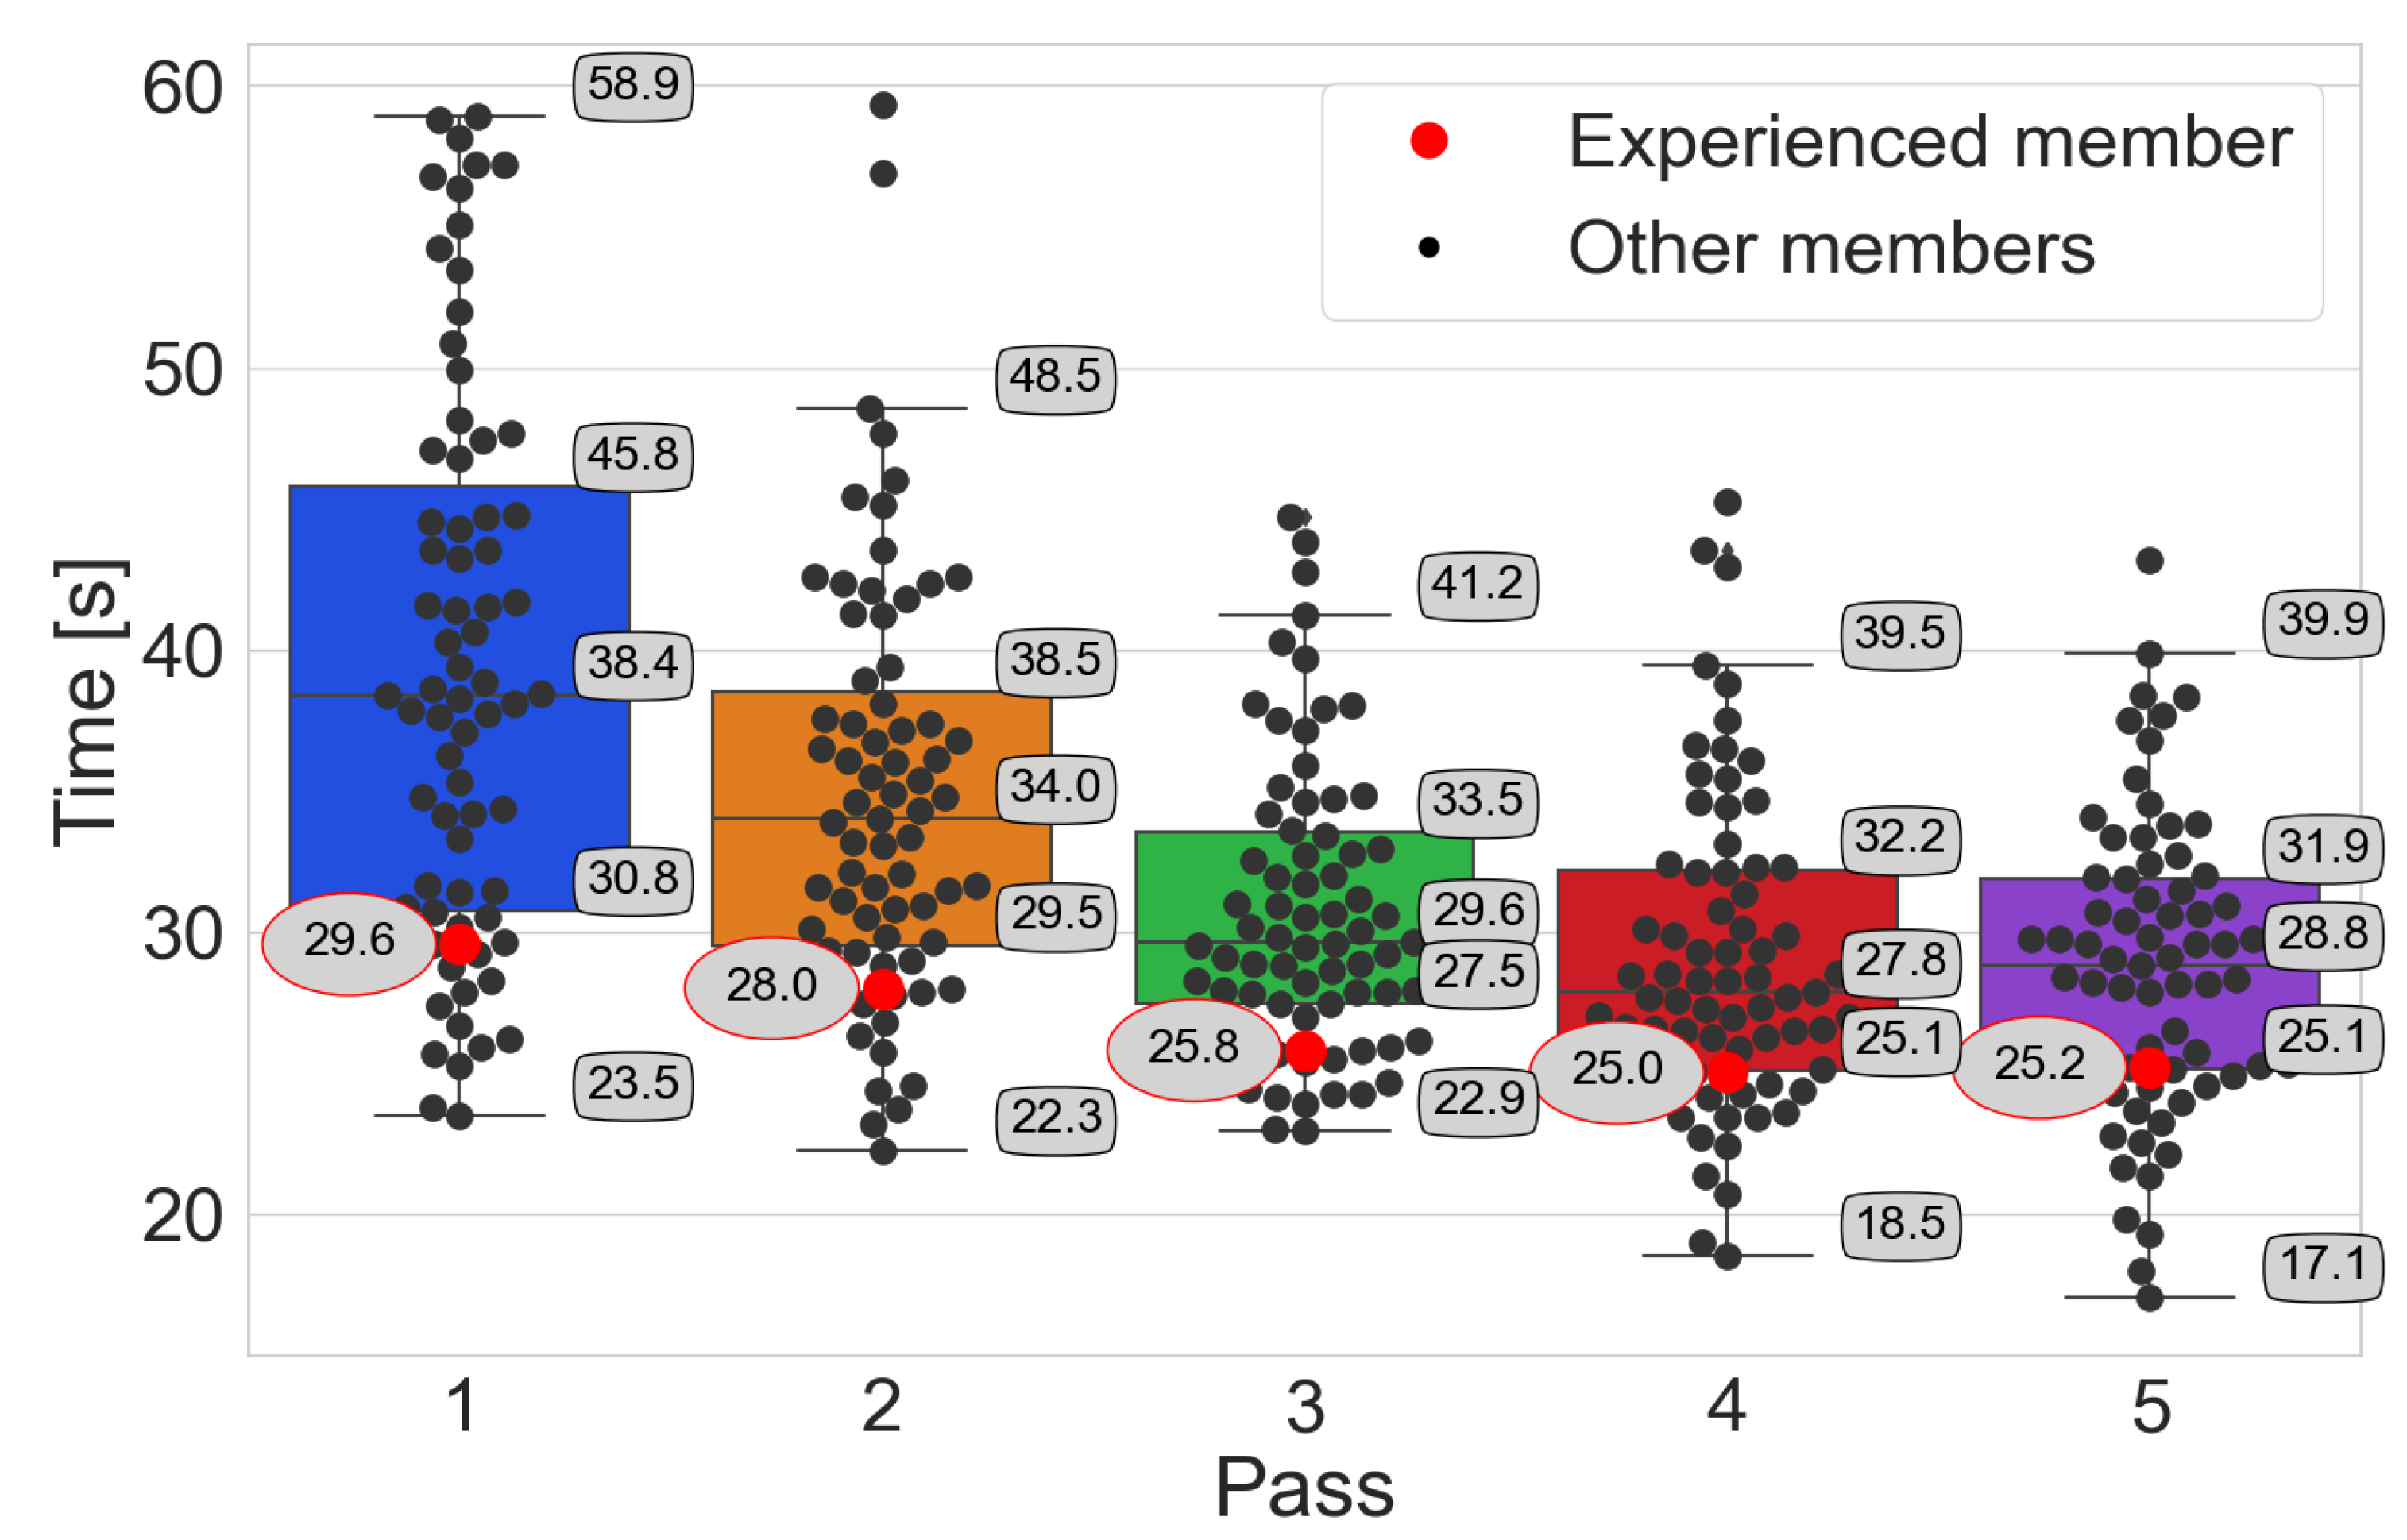
Figure 11.
Summary of all times in the following passes, distinguishing between the different systems.
Figure 11.
Summary of all times in the following passes, distinguishing between the different systems.
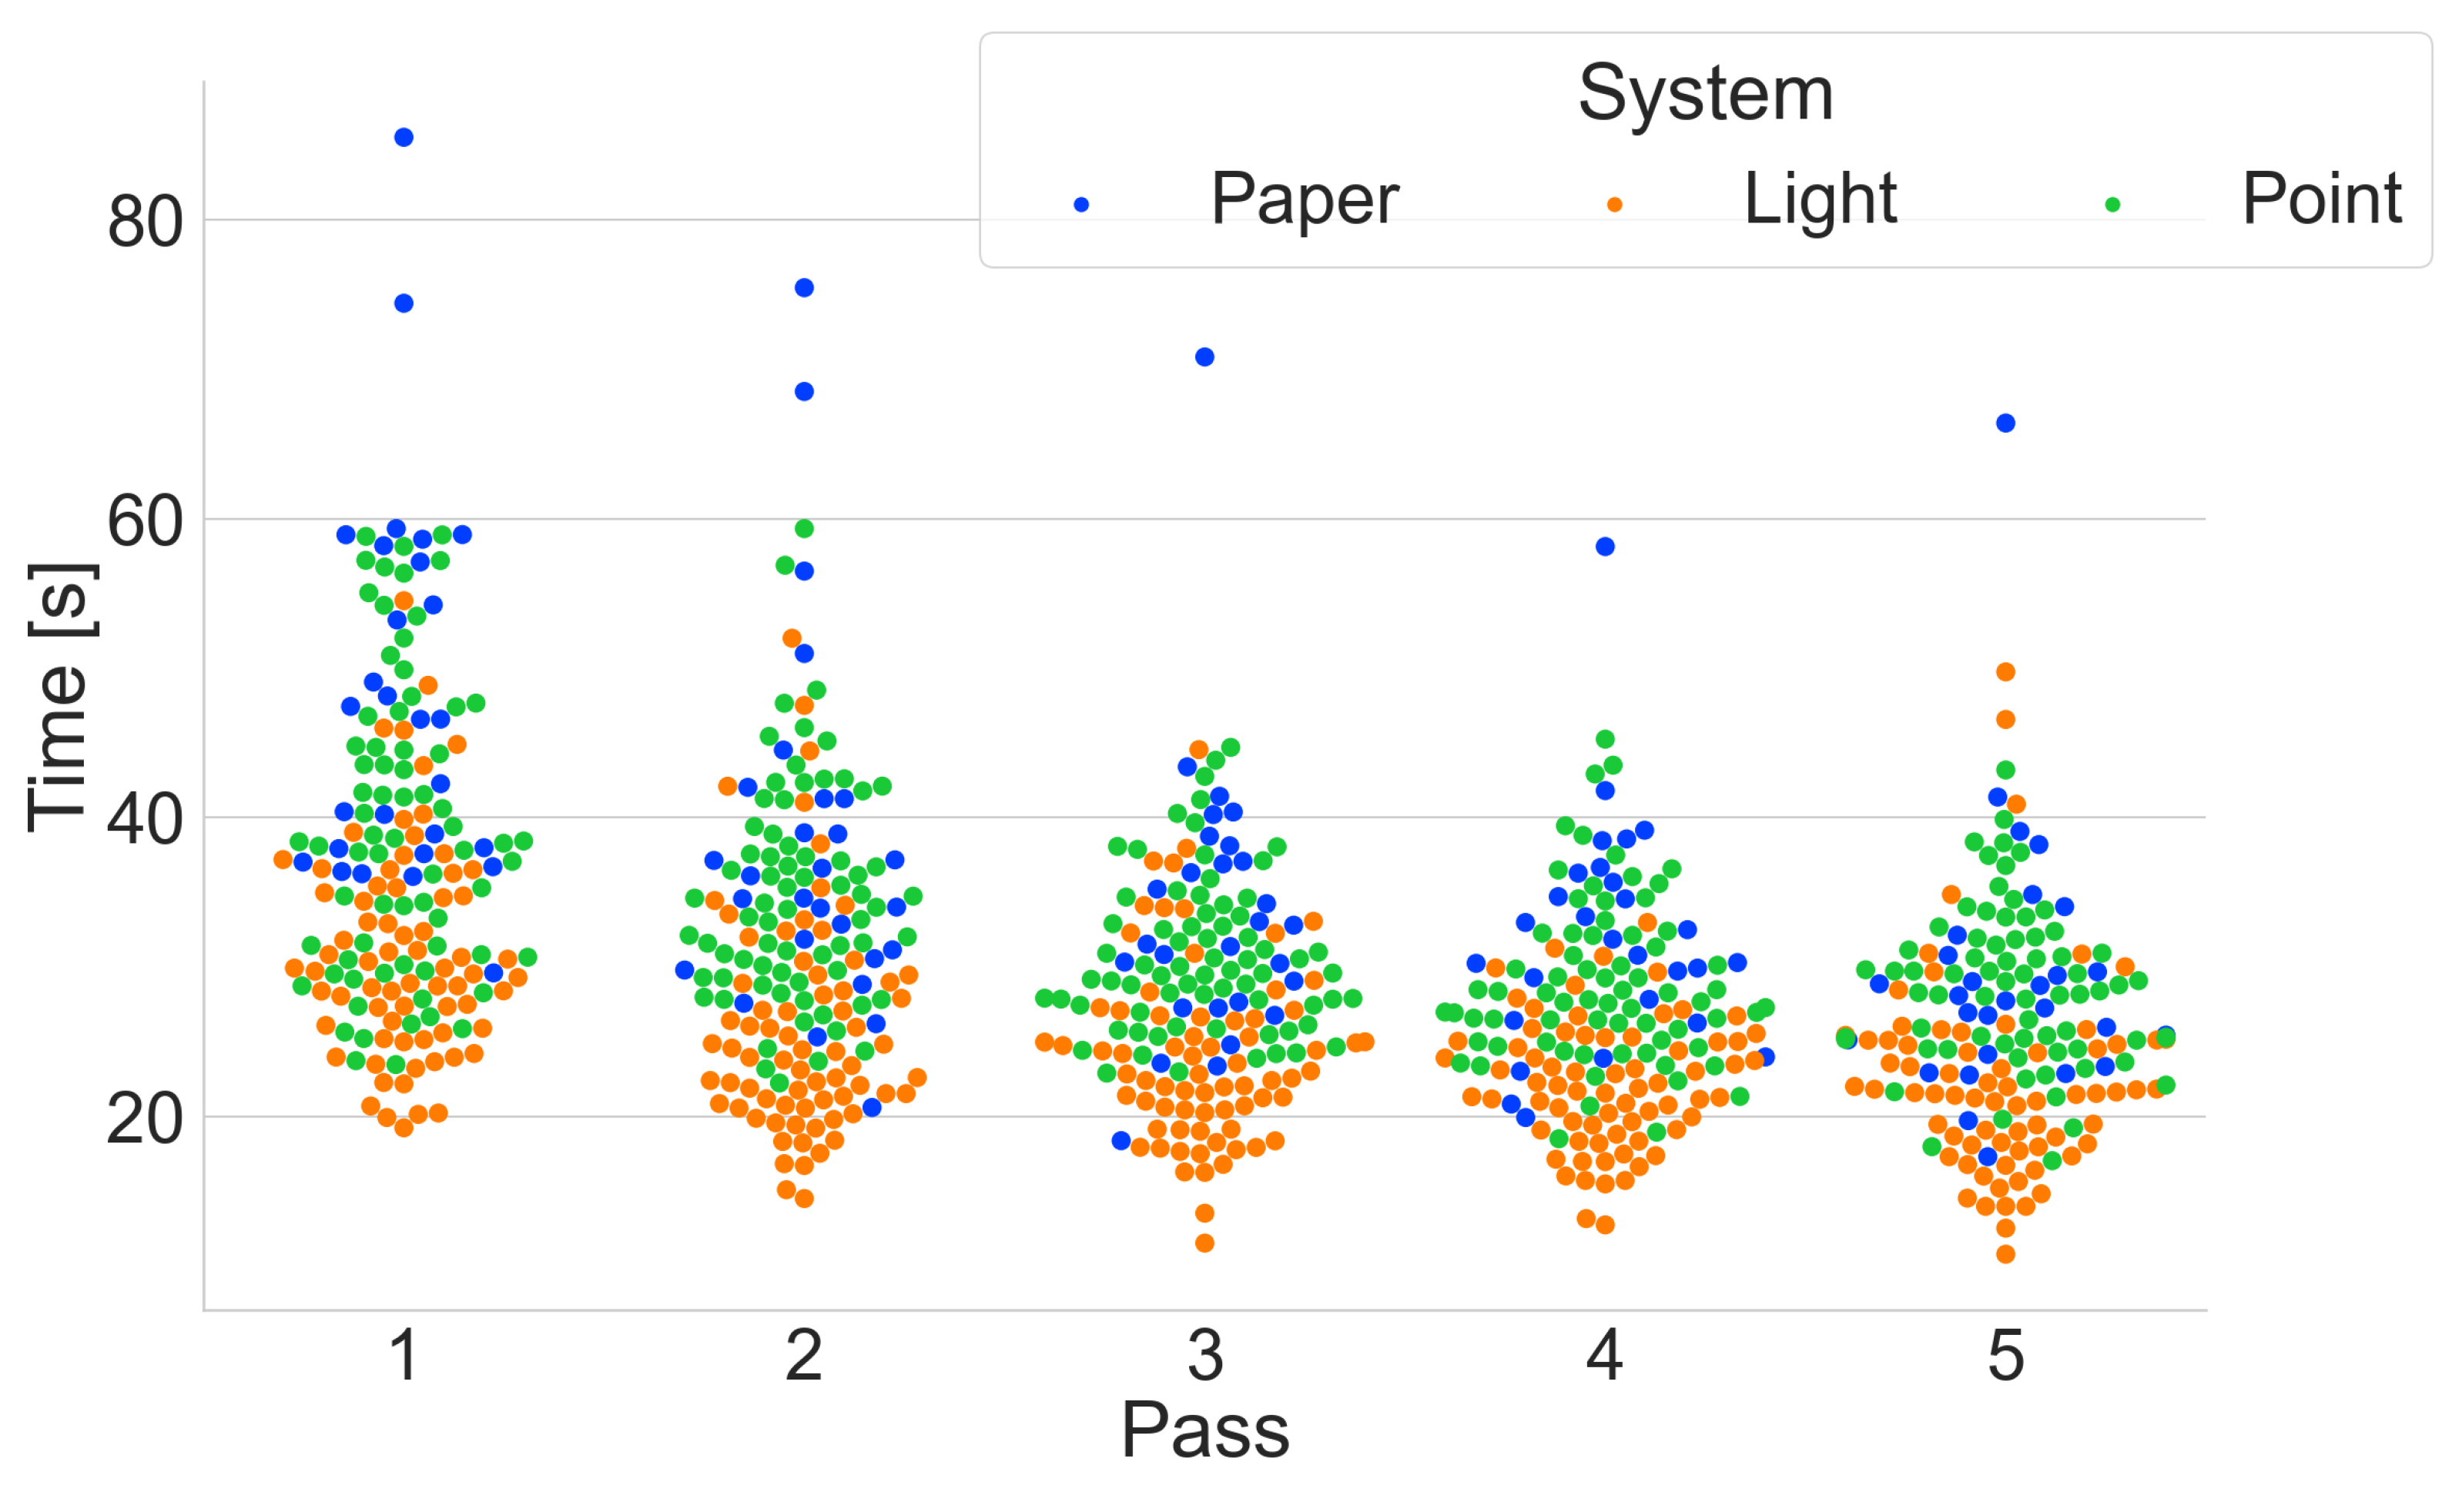
Figure 12.
Comparison of the tested systems by pass.
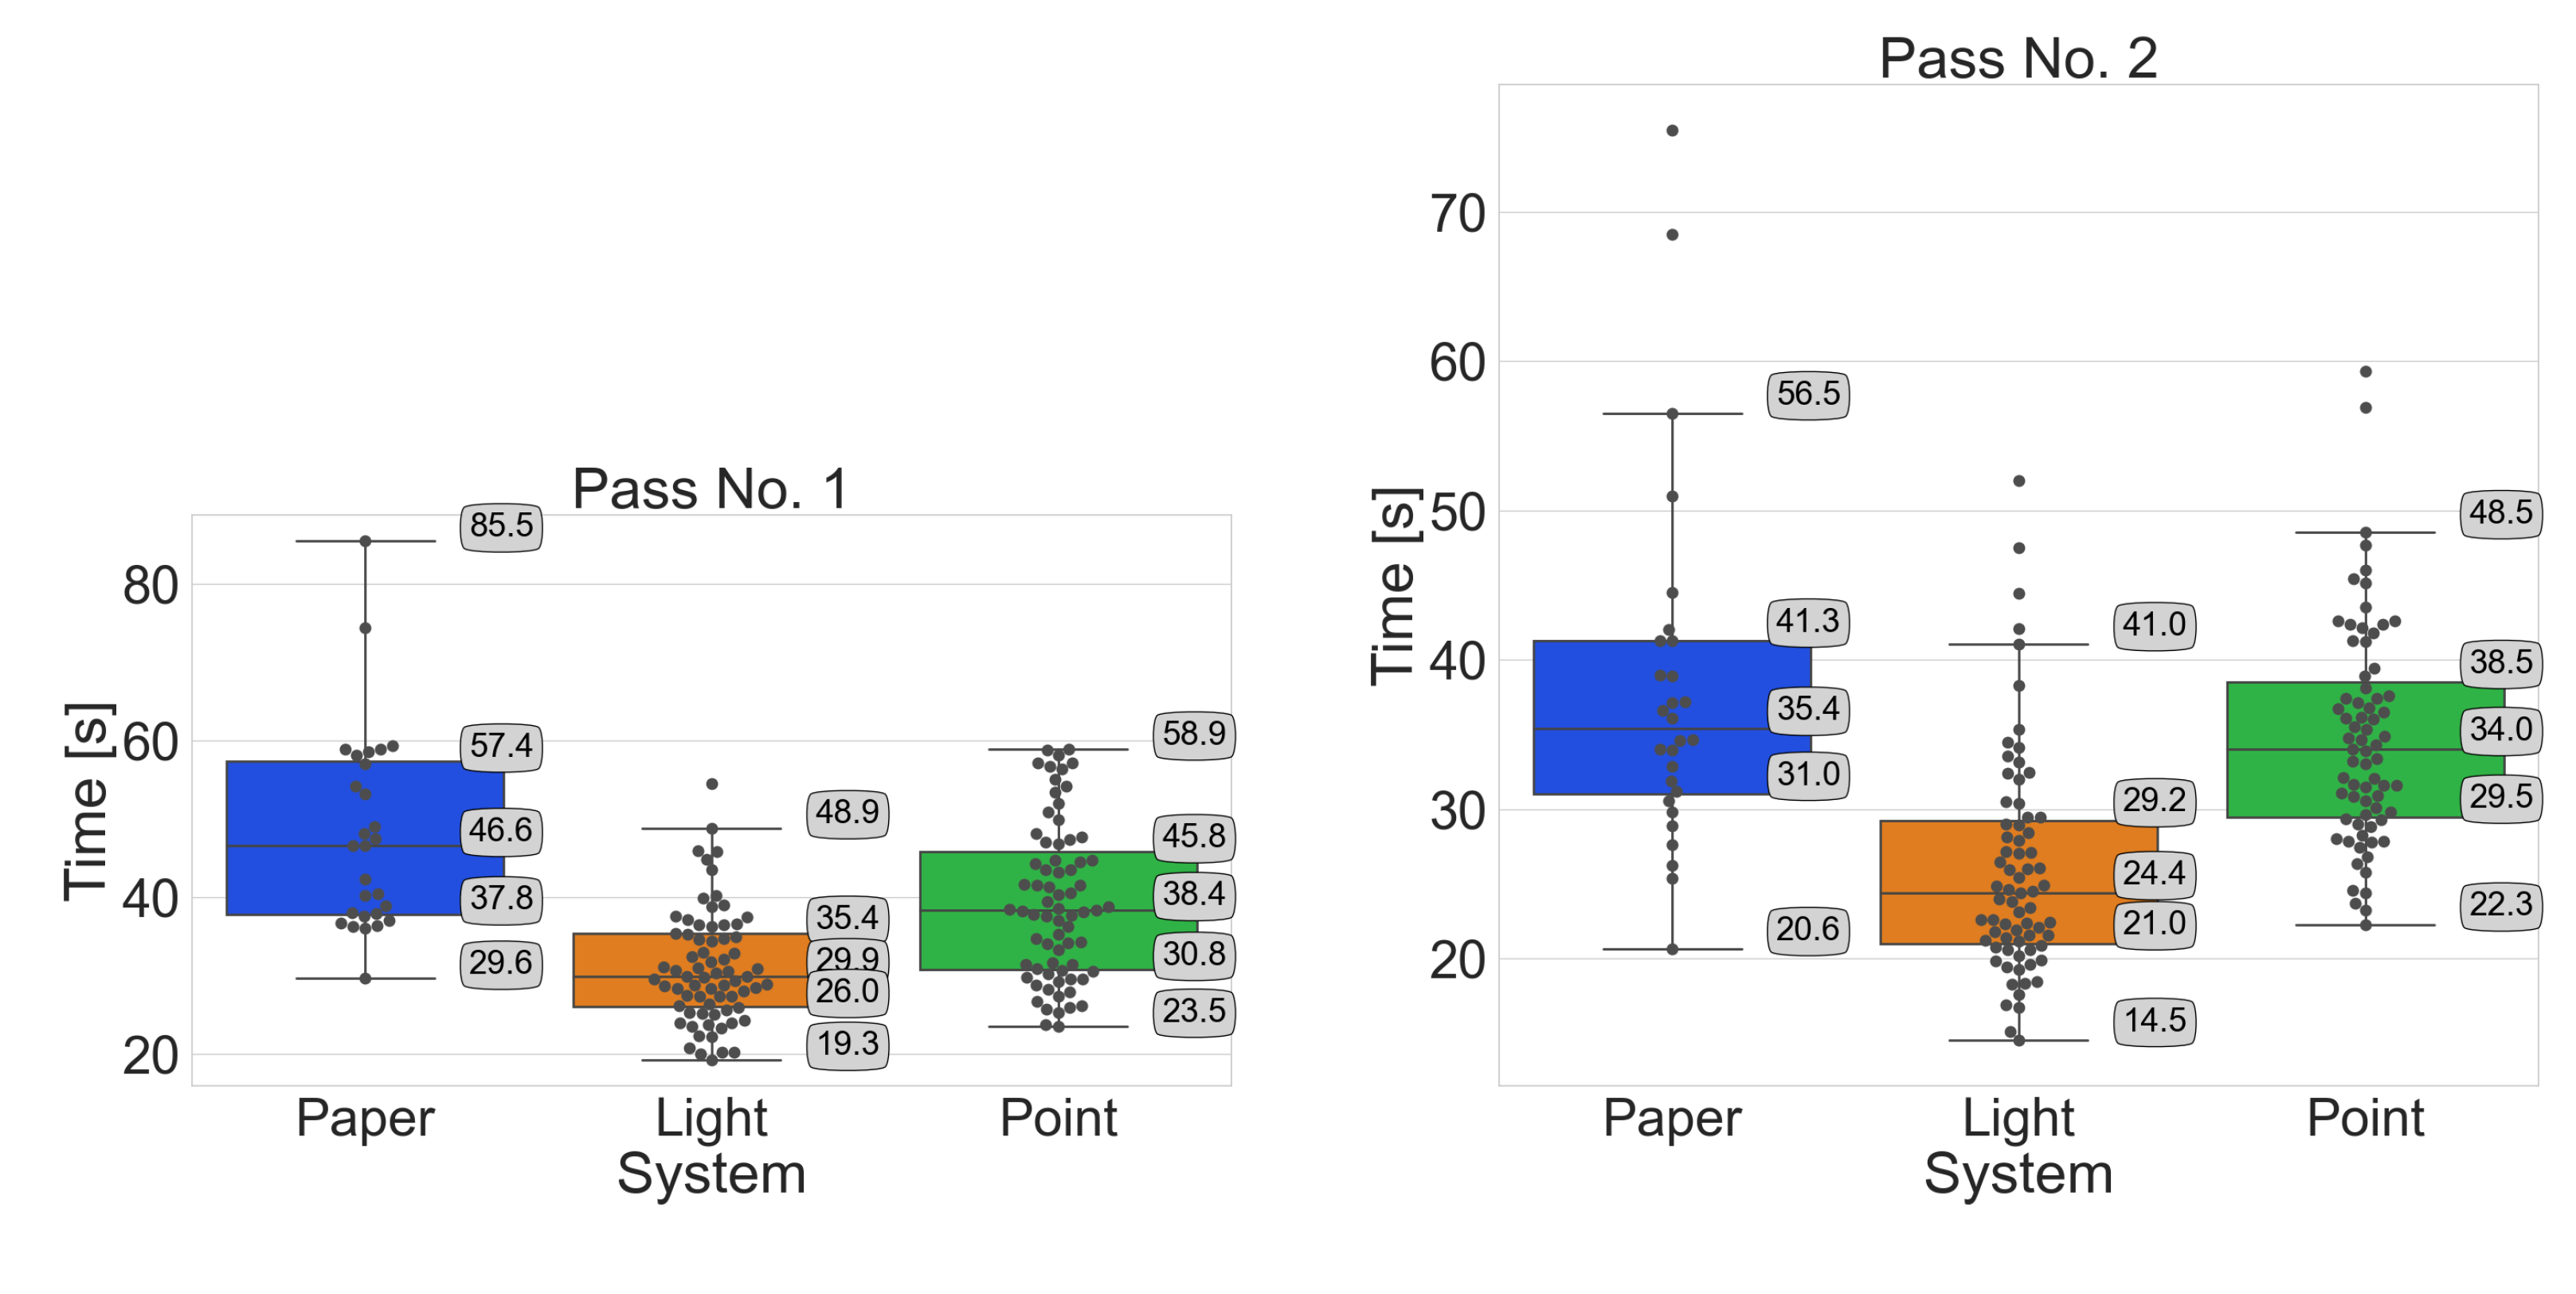
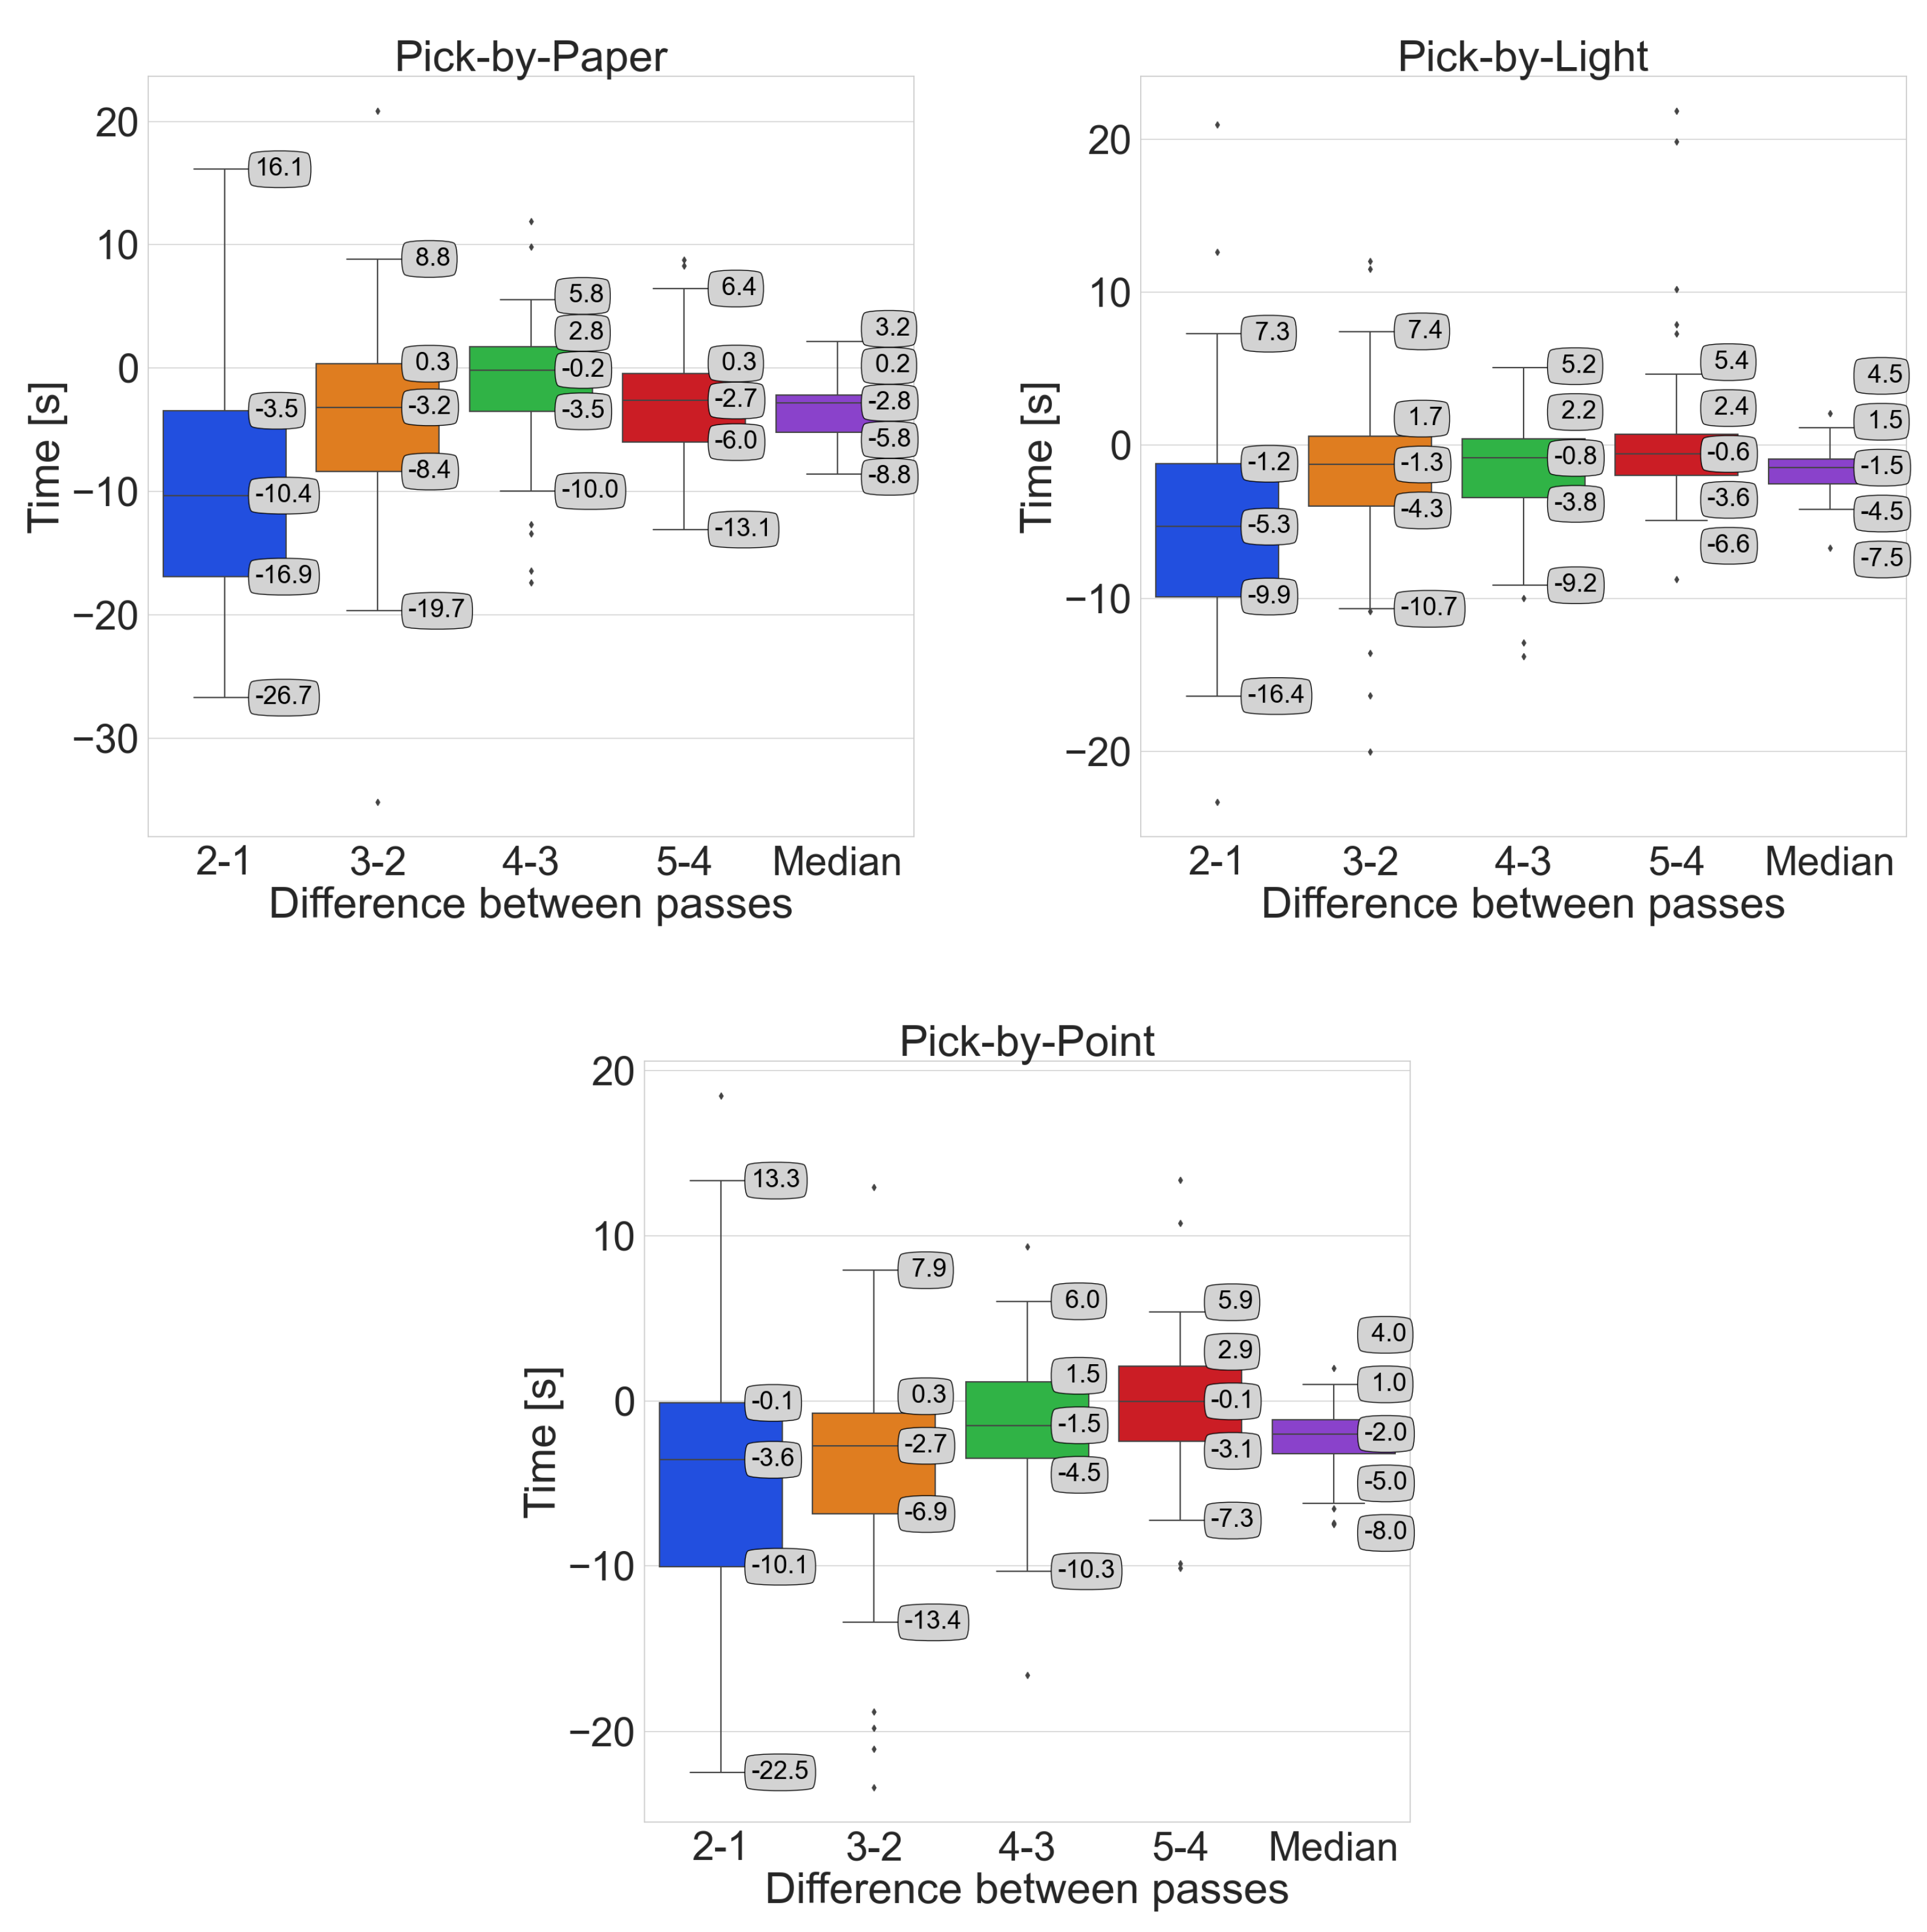
Figure 13.
Comparison of the time differences between passes by system.
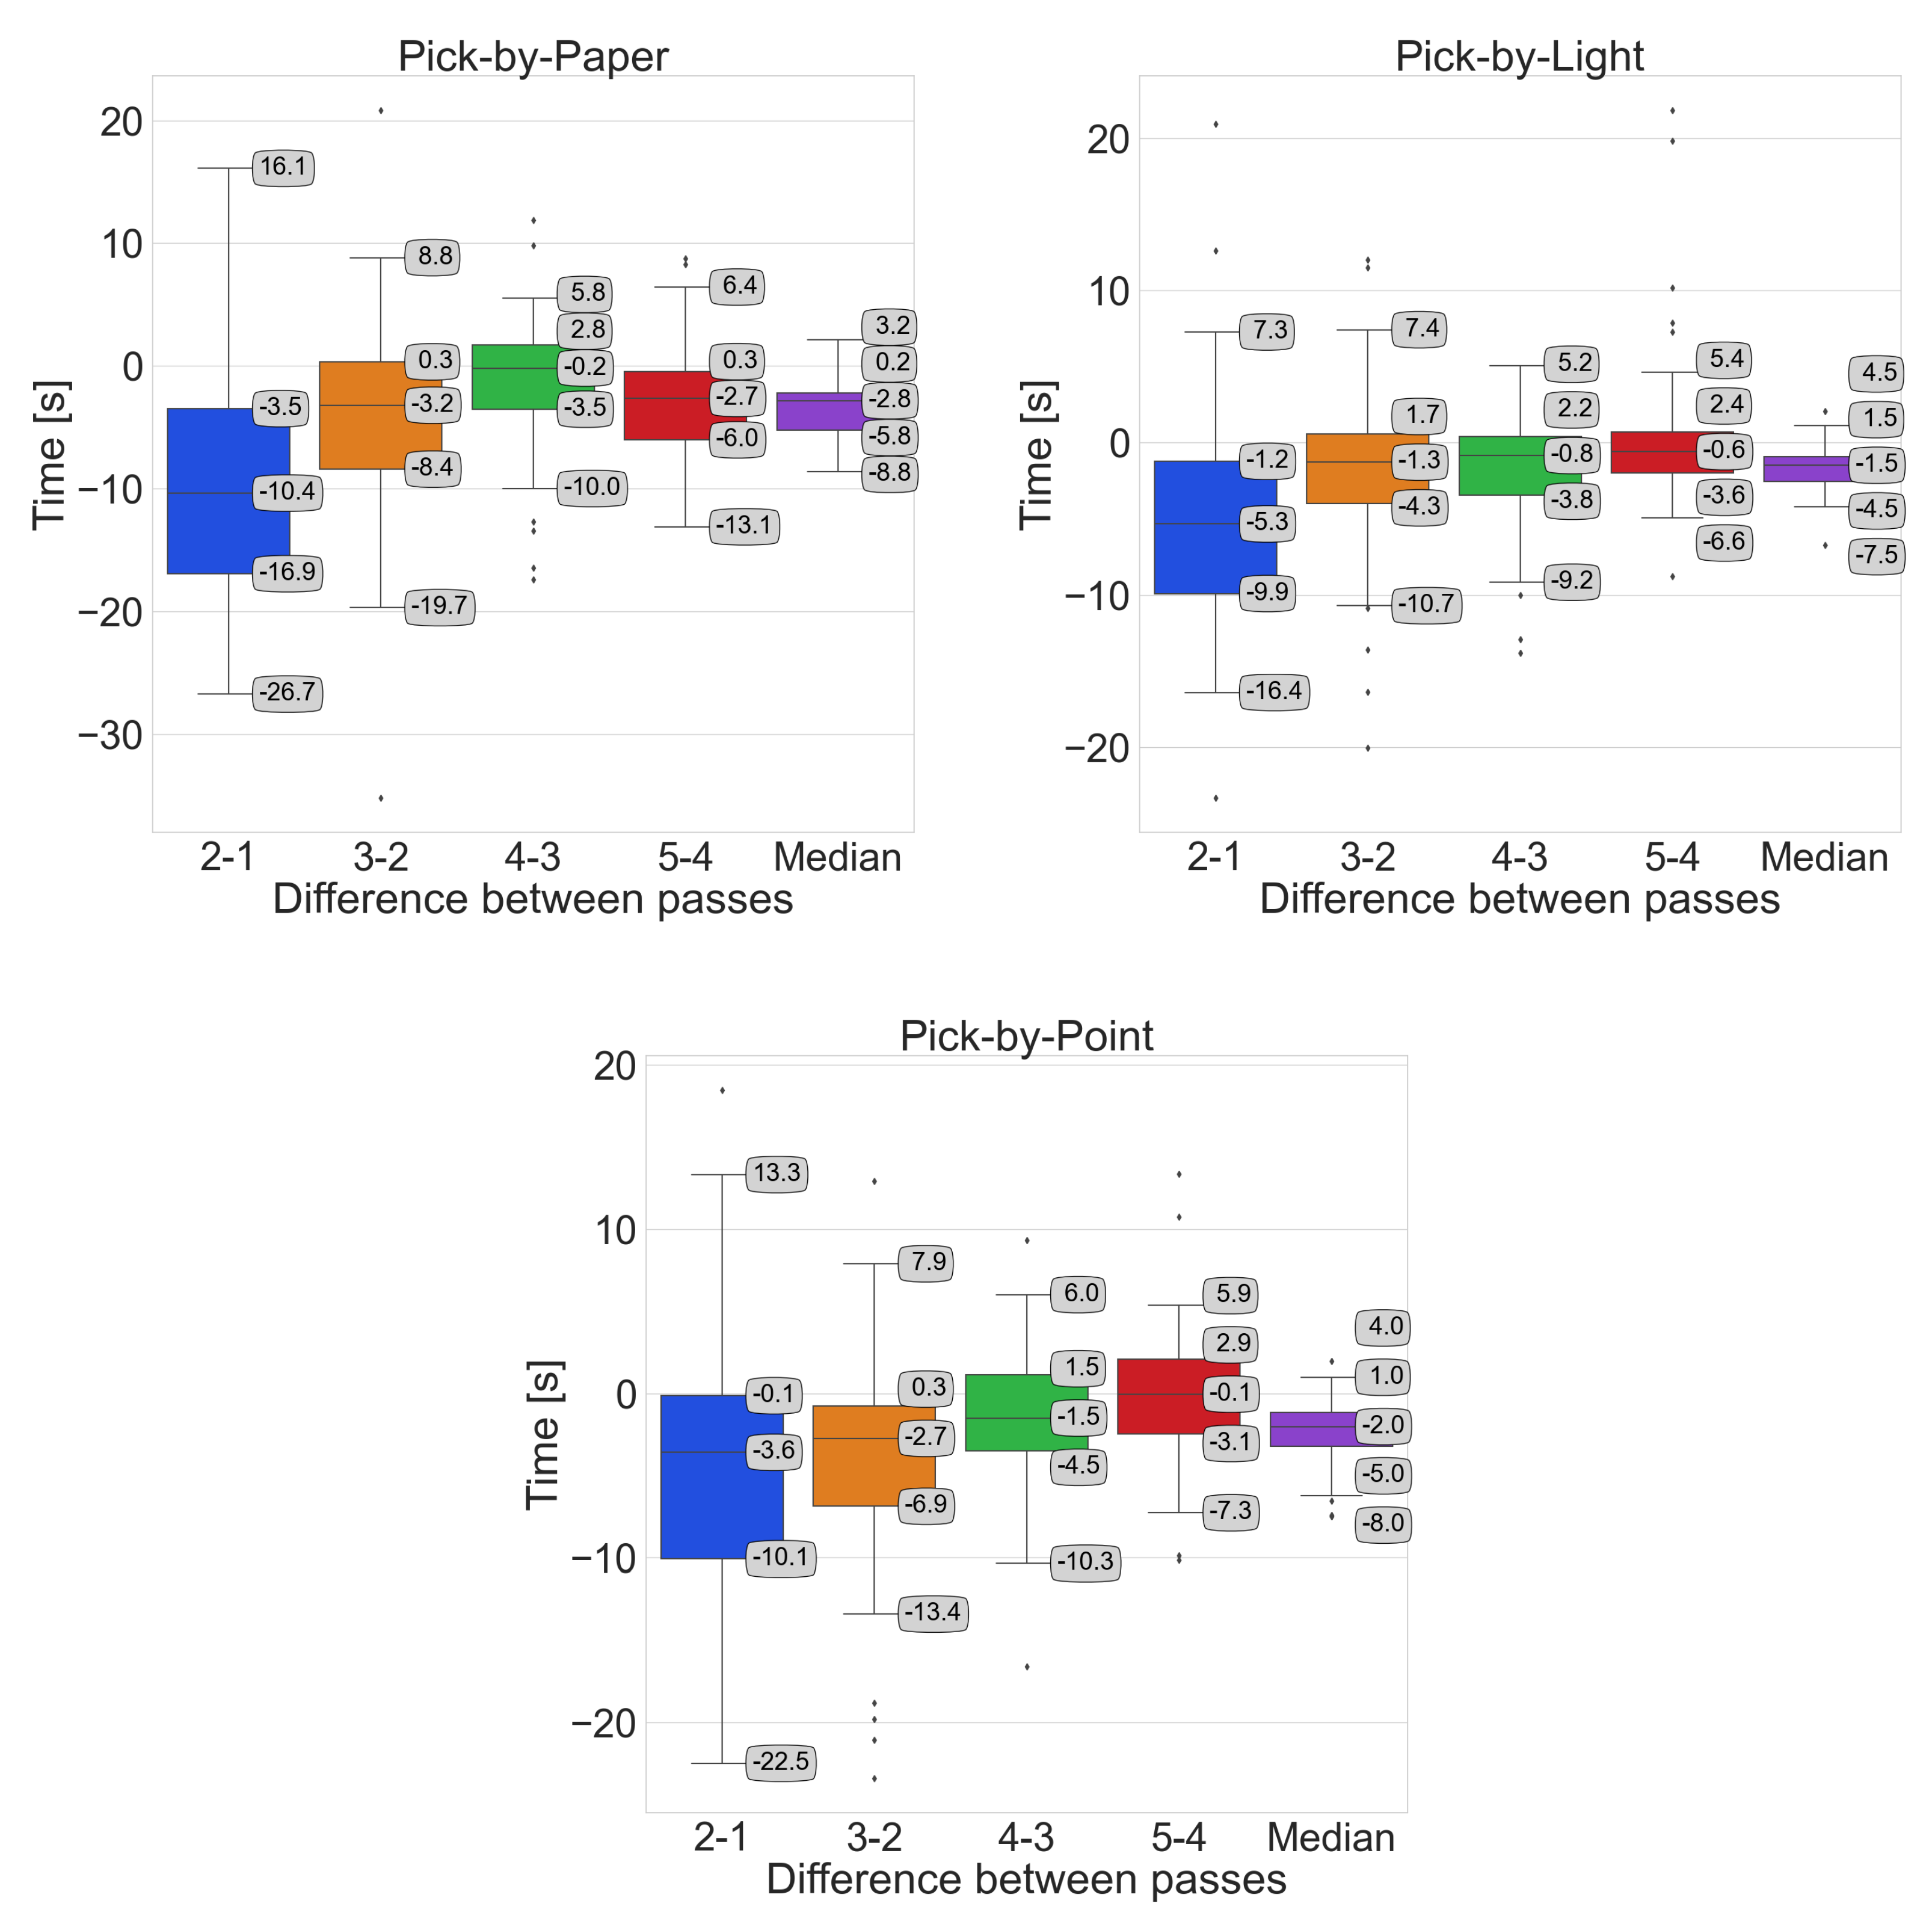
Figure 14.
Comparison of time differences between successive passes in the overall summary.
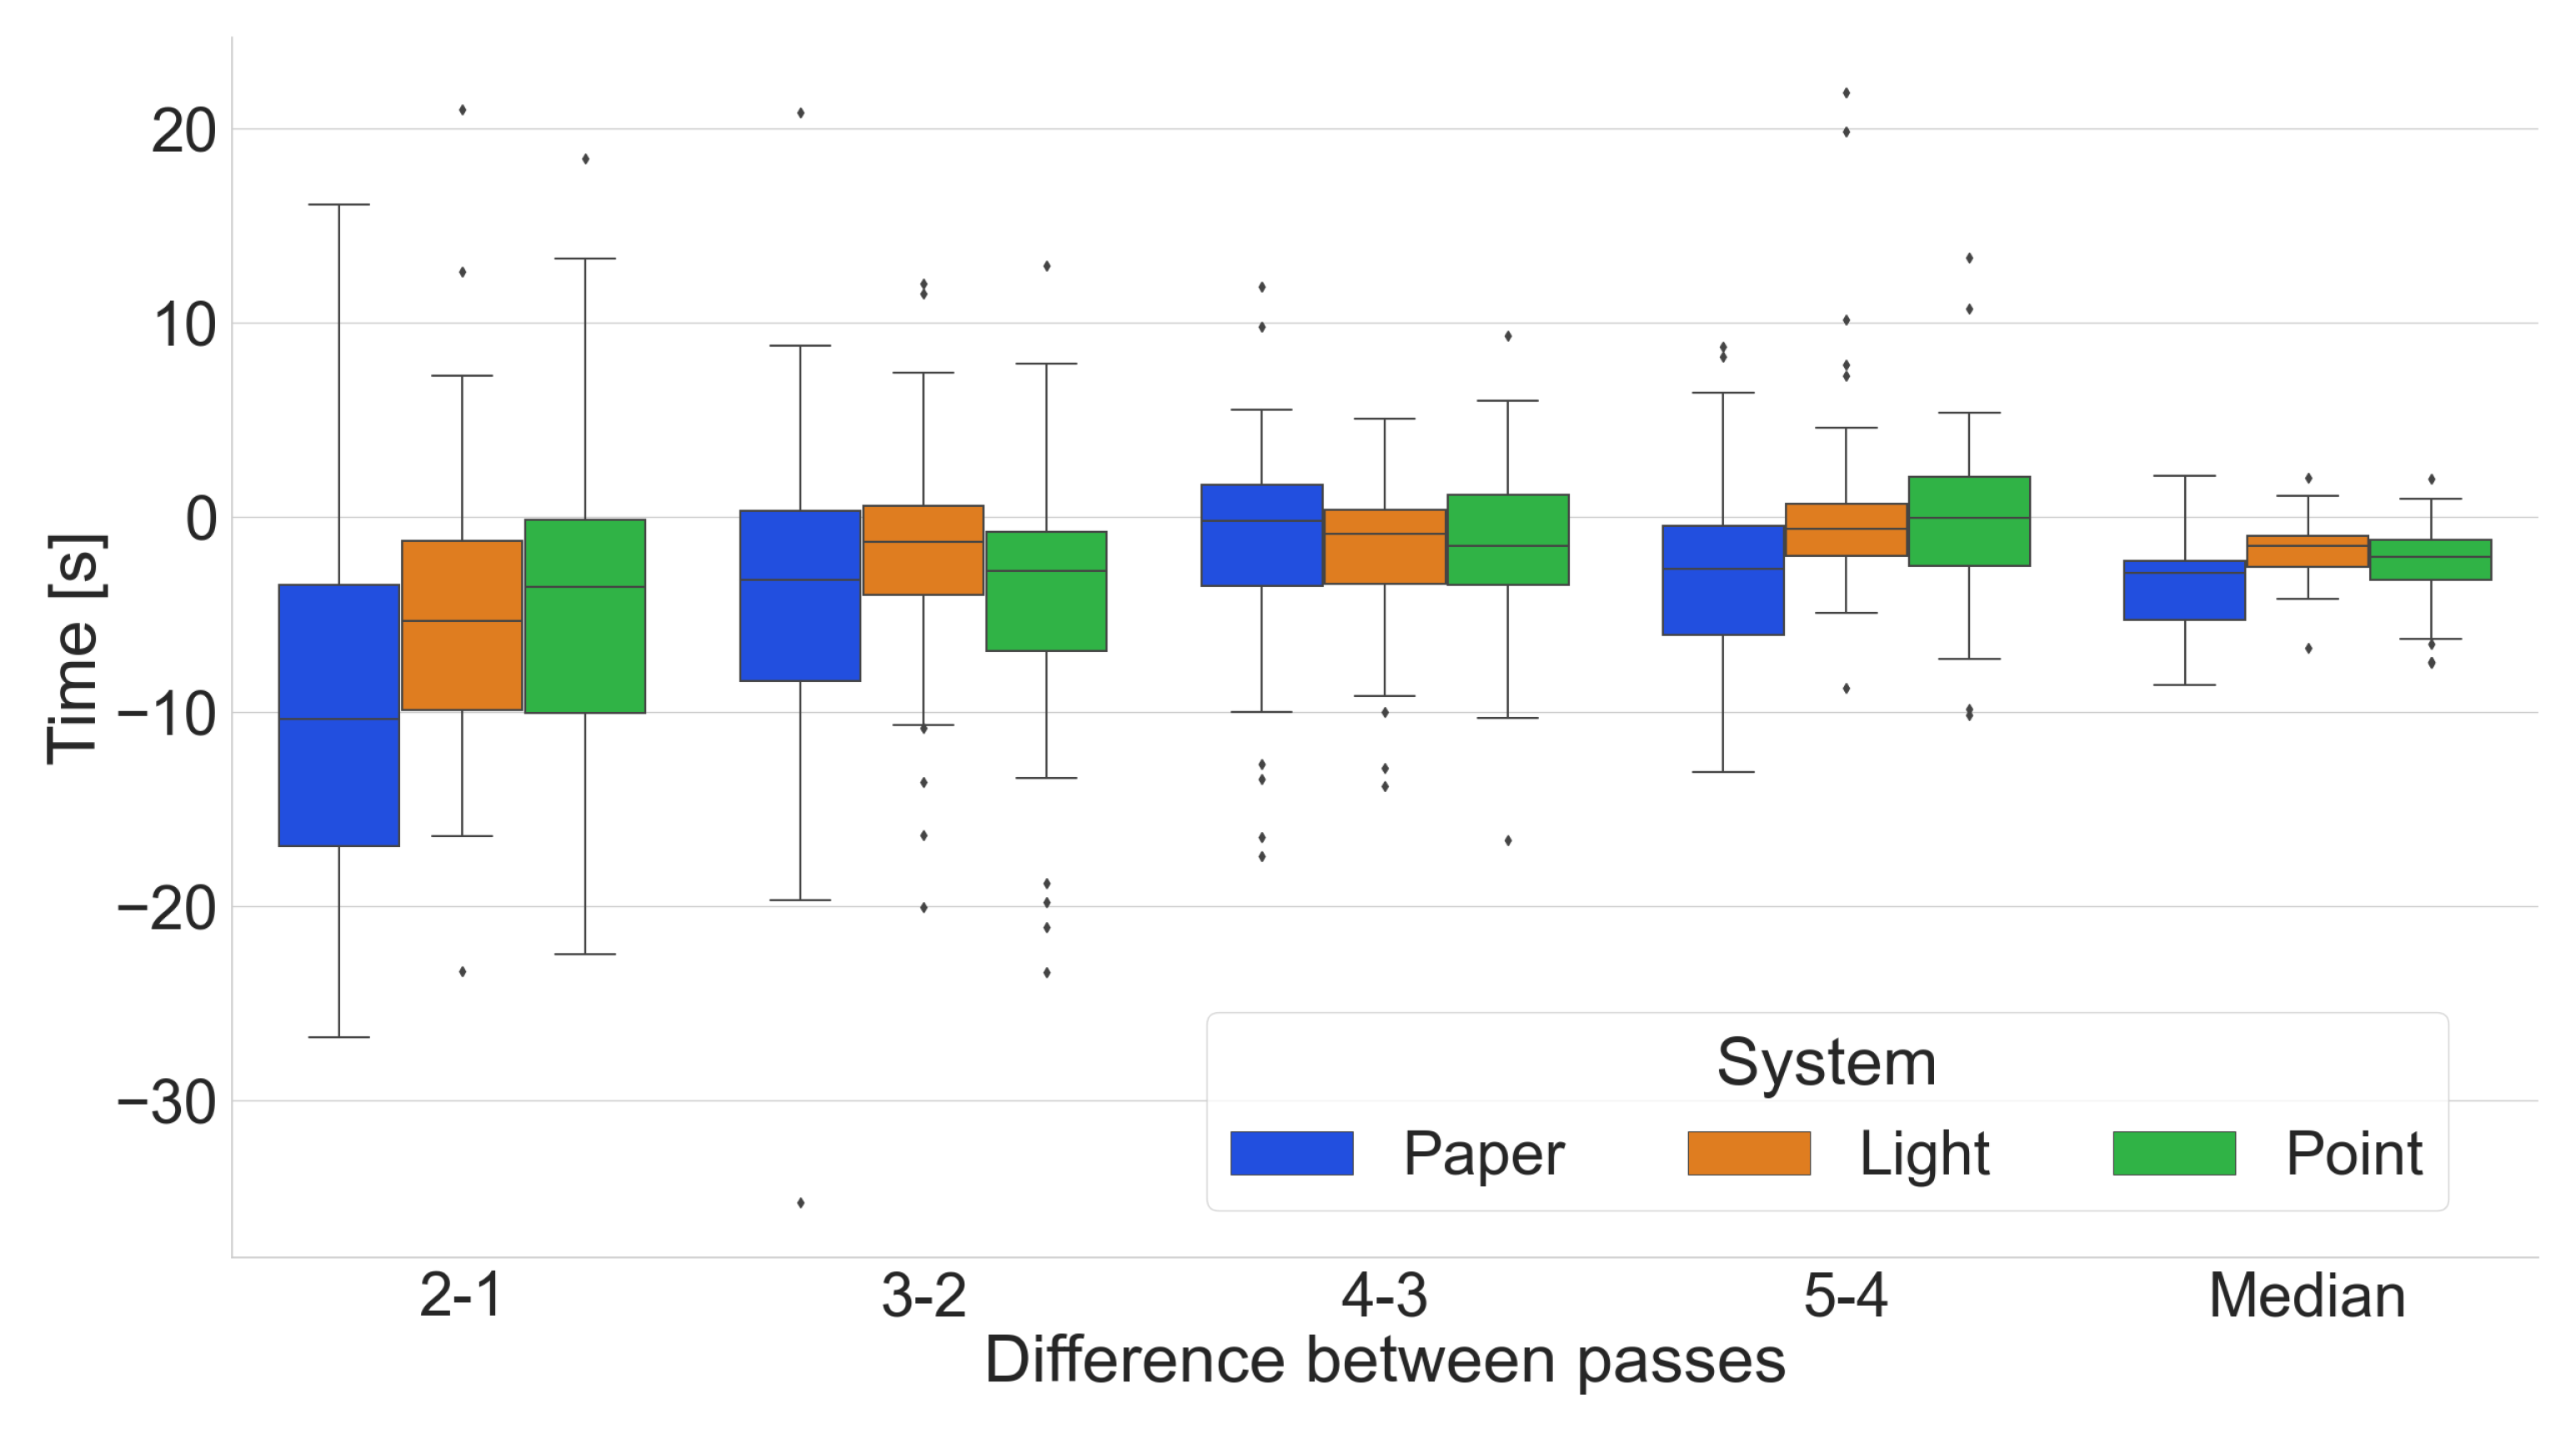
Figure 15.
Order-picking time per pass broken down by number of errors made using the Pick-by-Paper system.
Figure 15.
Order-picking time per pass broken down by number of errors made using the Pick-by-Paper system.
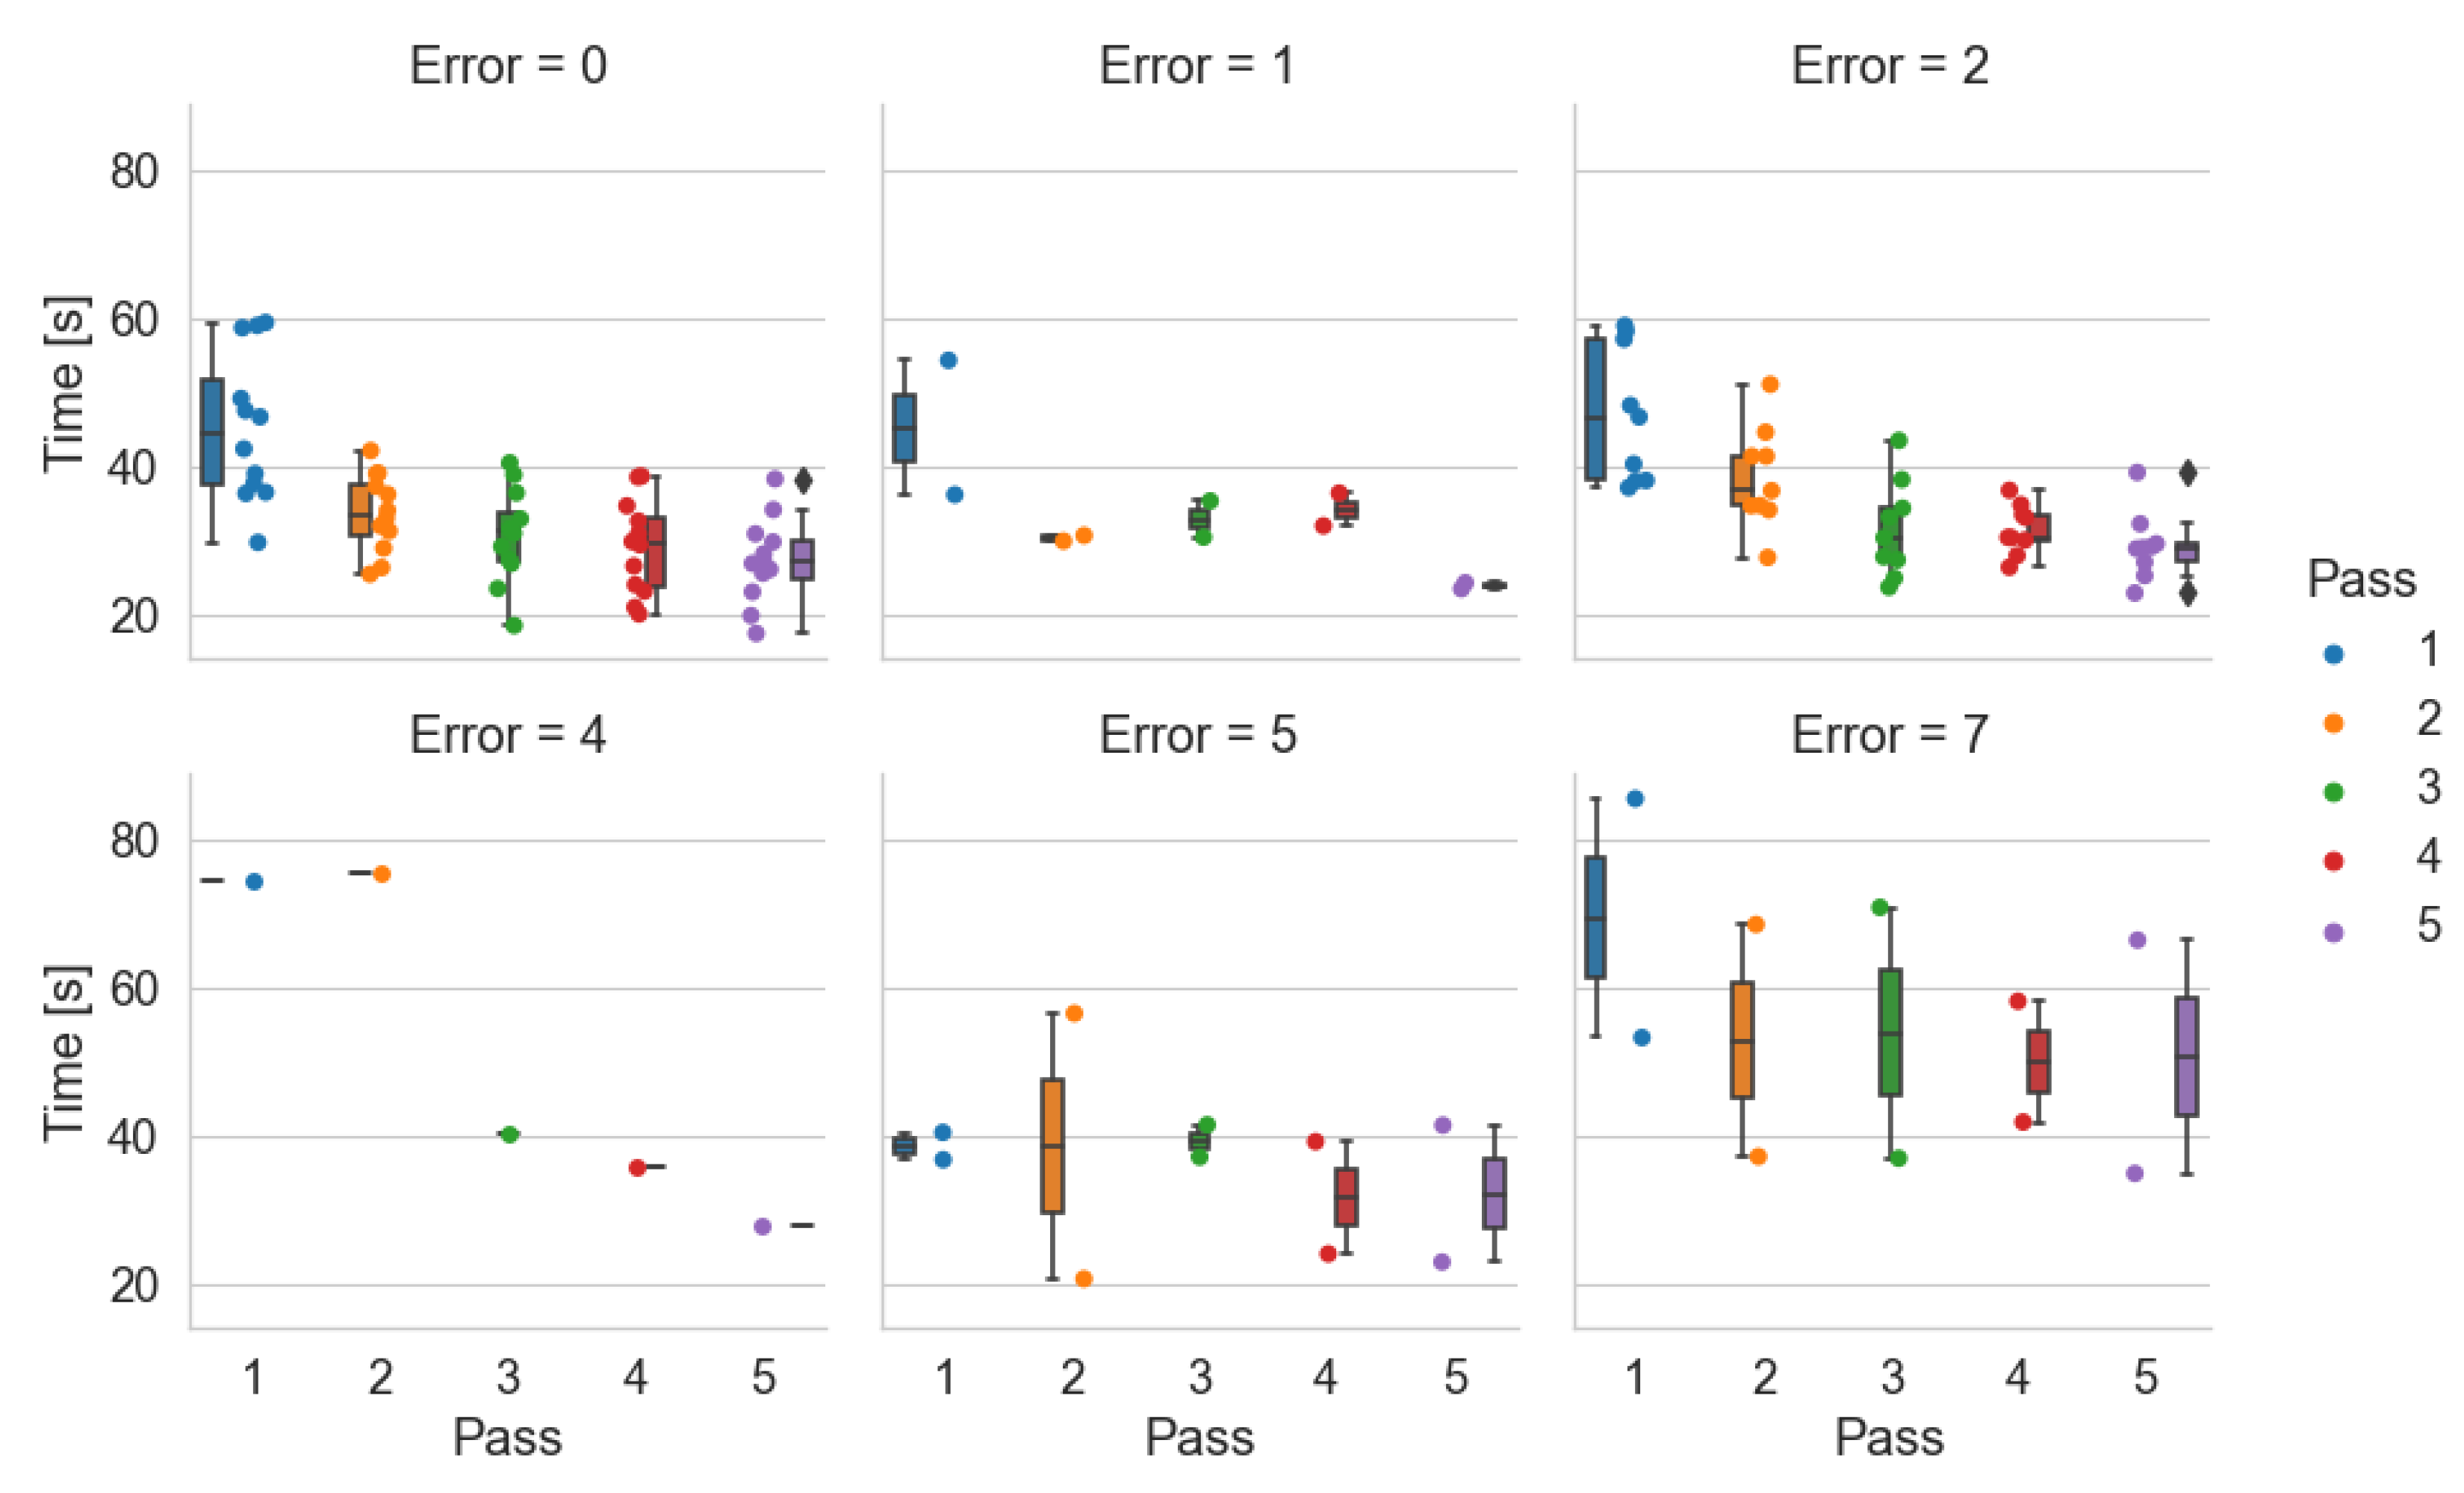
Figure 16.
Order-picking time per pass broken down by number of errors made using the Pick-by-Light system.
Figure 16.
Order-picking time per pass broken down by number of errors made using the Pick-by-Light system.
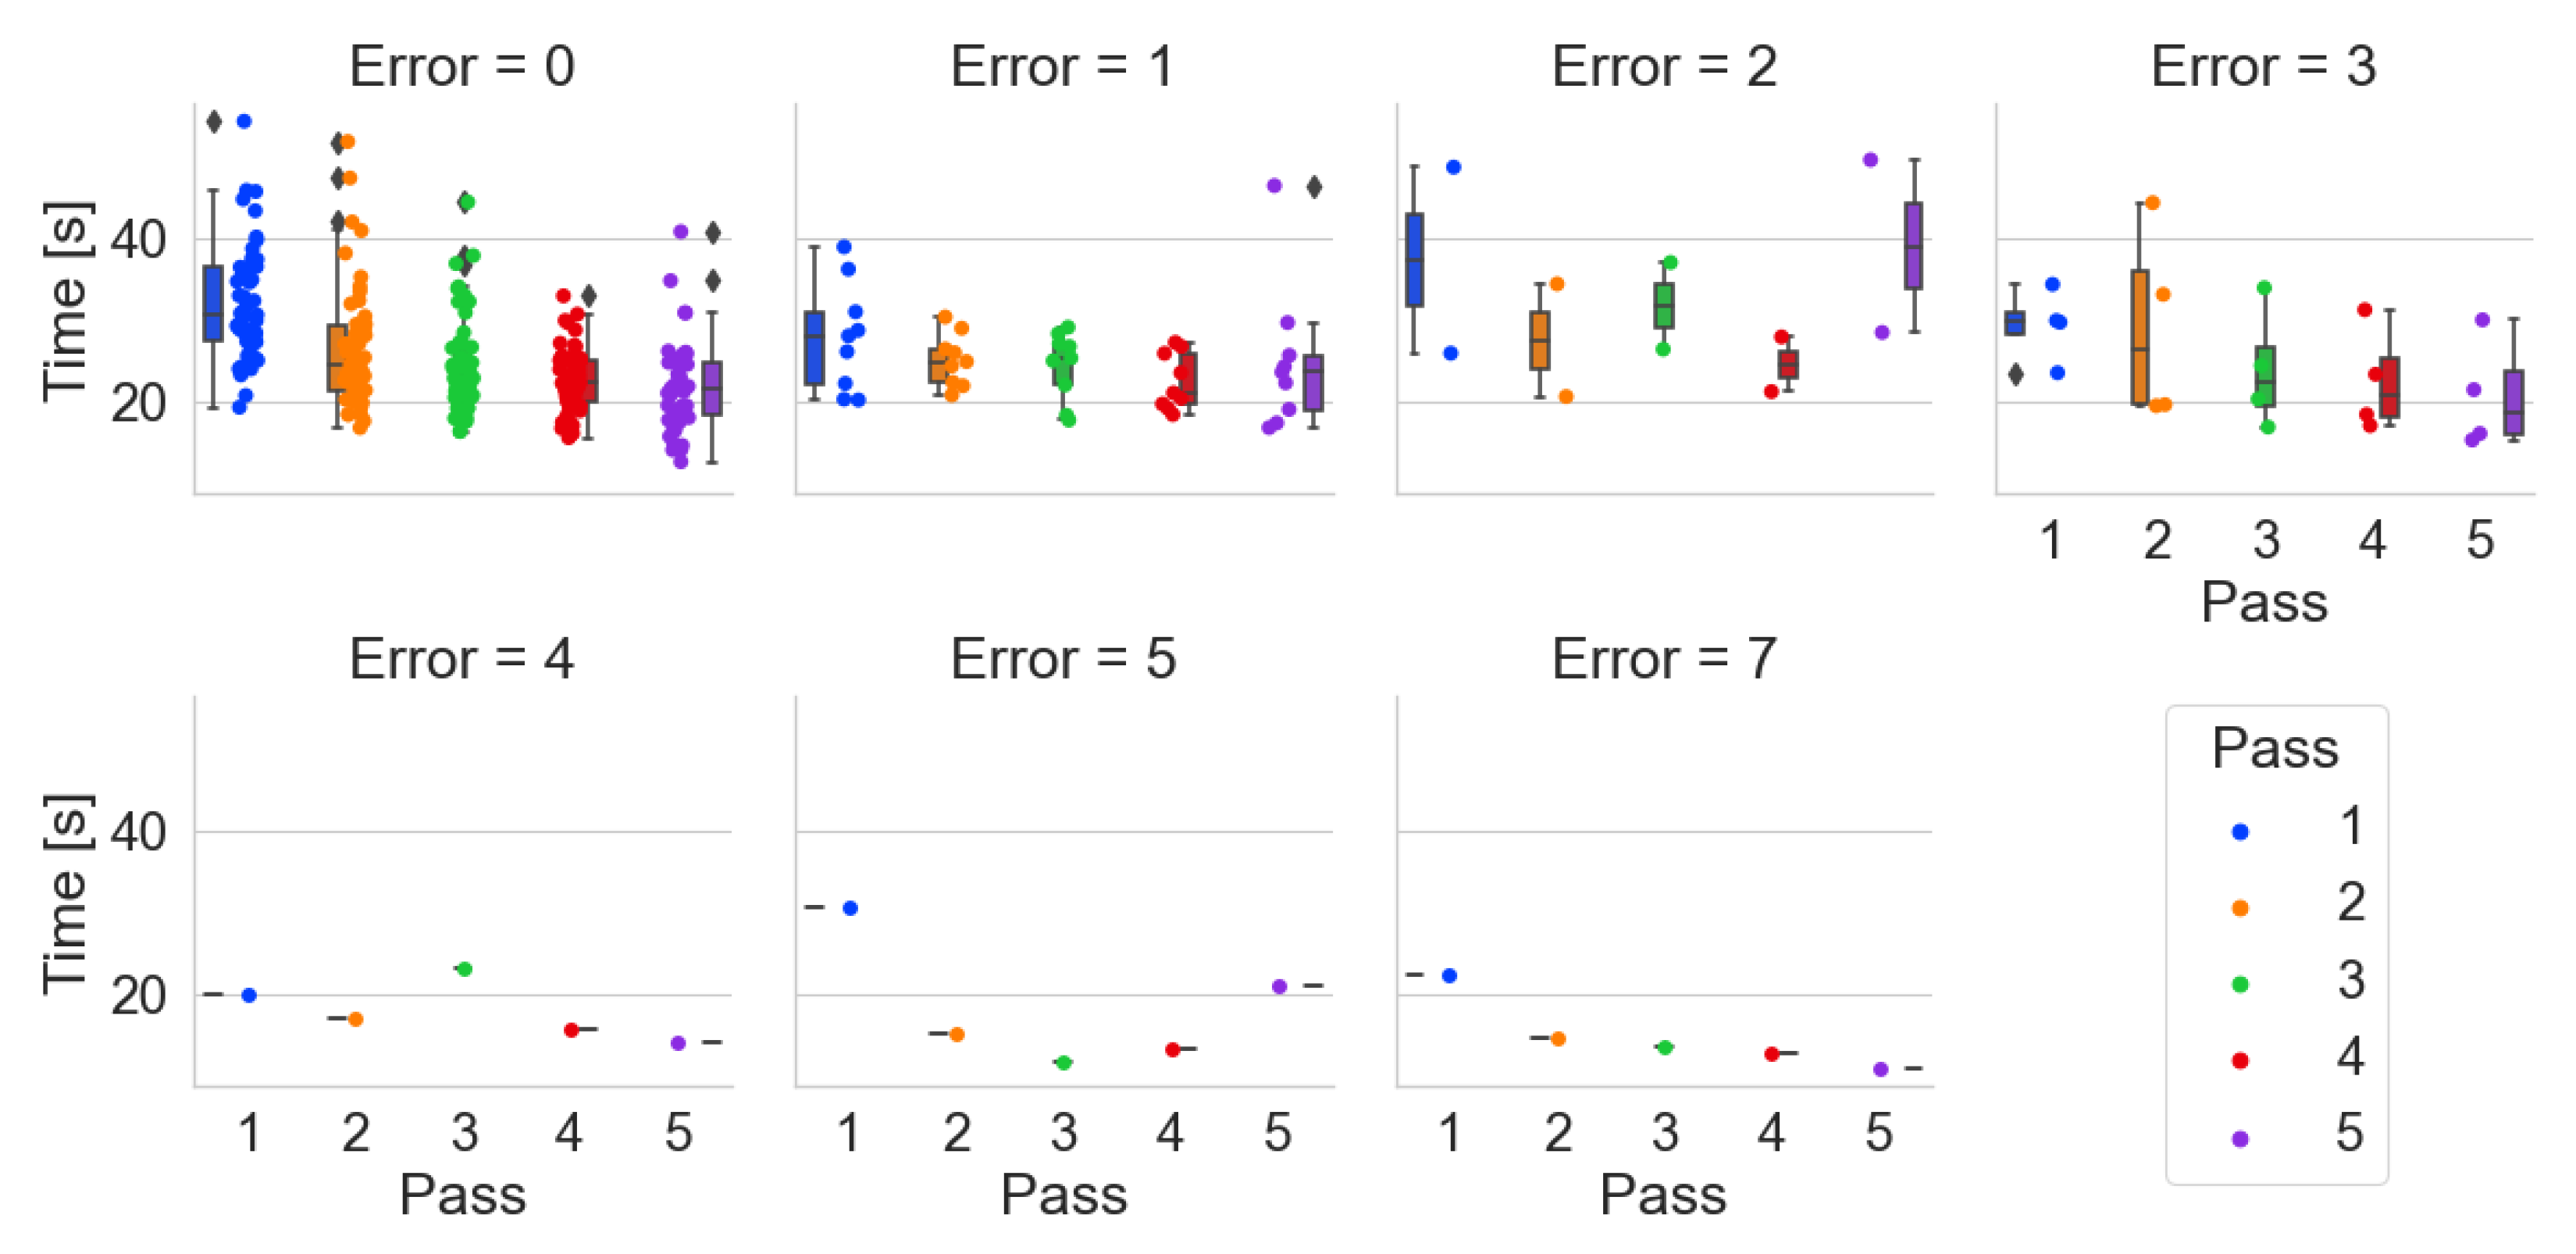
Figure 17.
Order-picking time per pass broken down by number of errors made using the Pick-by-Point system.
Figure 17.
Order-picking time per pass broken down by number of errors made using the Pick-by-Point system.
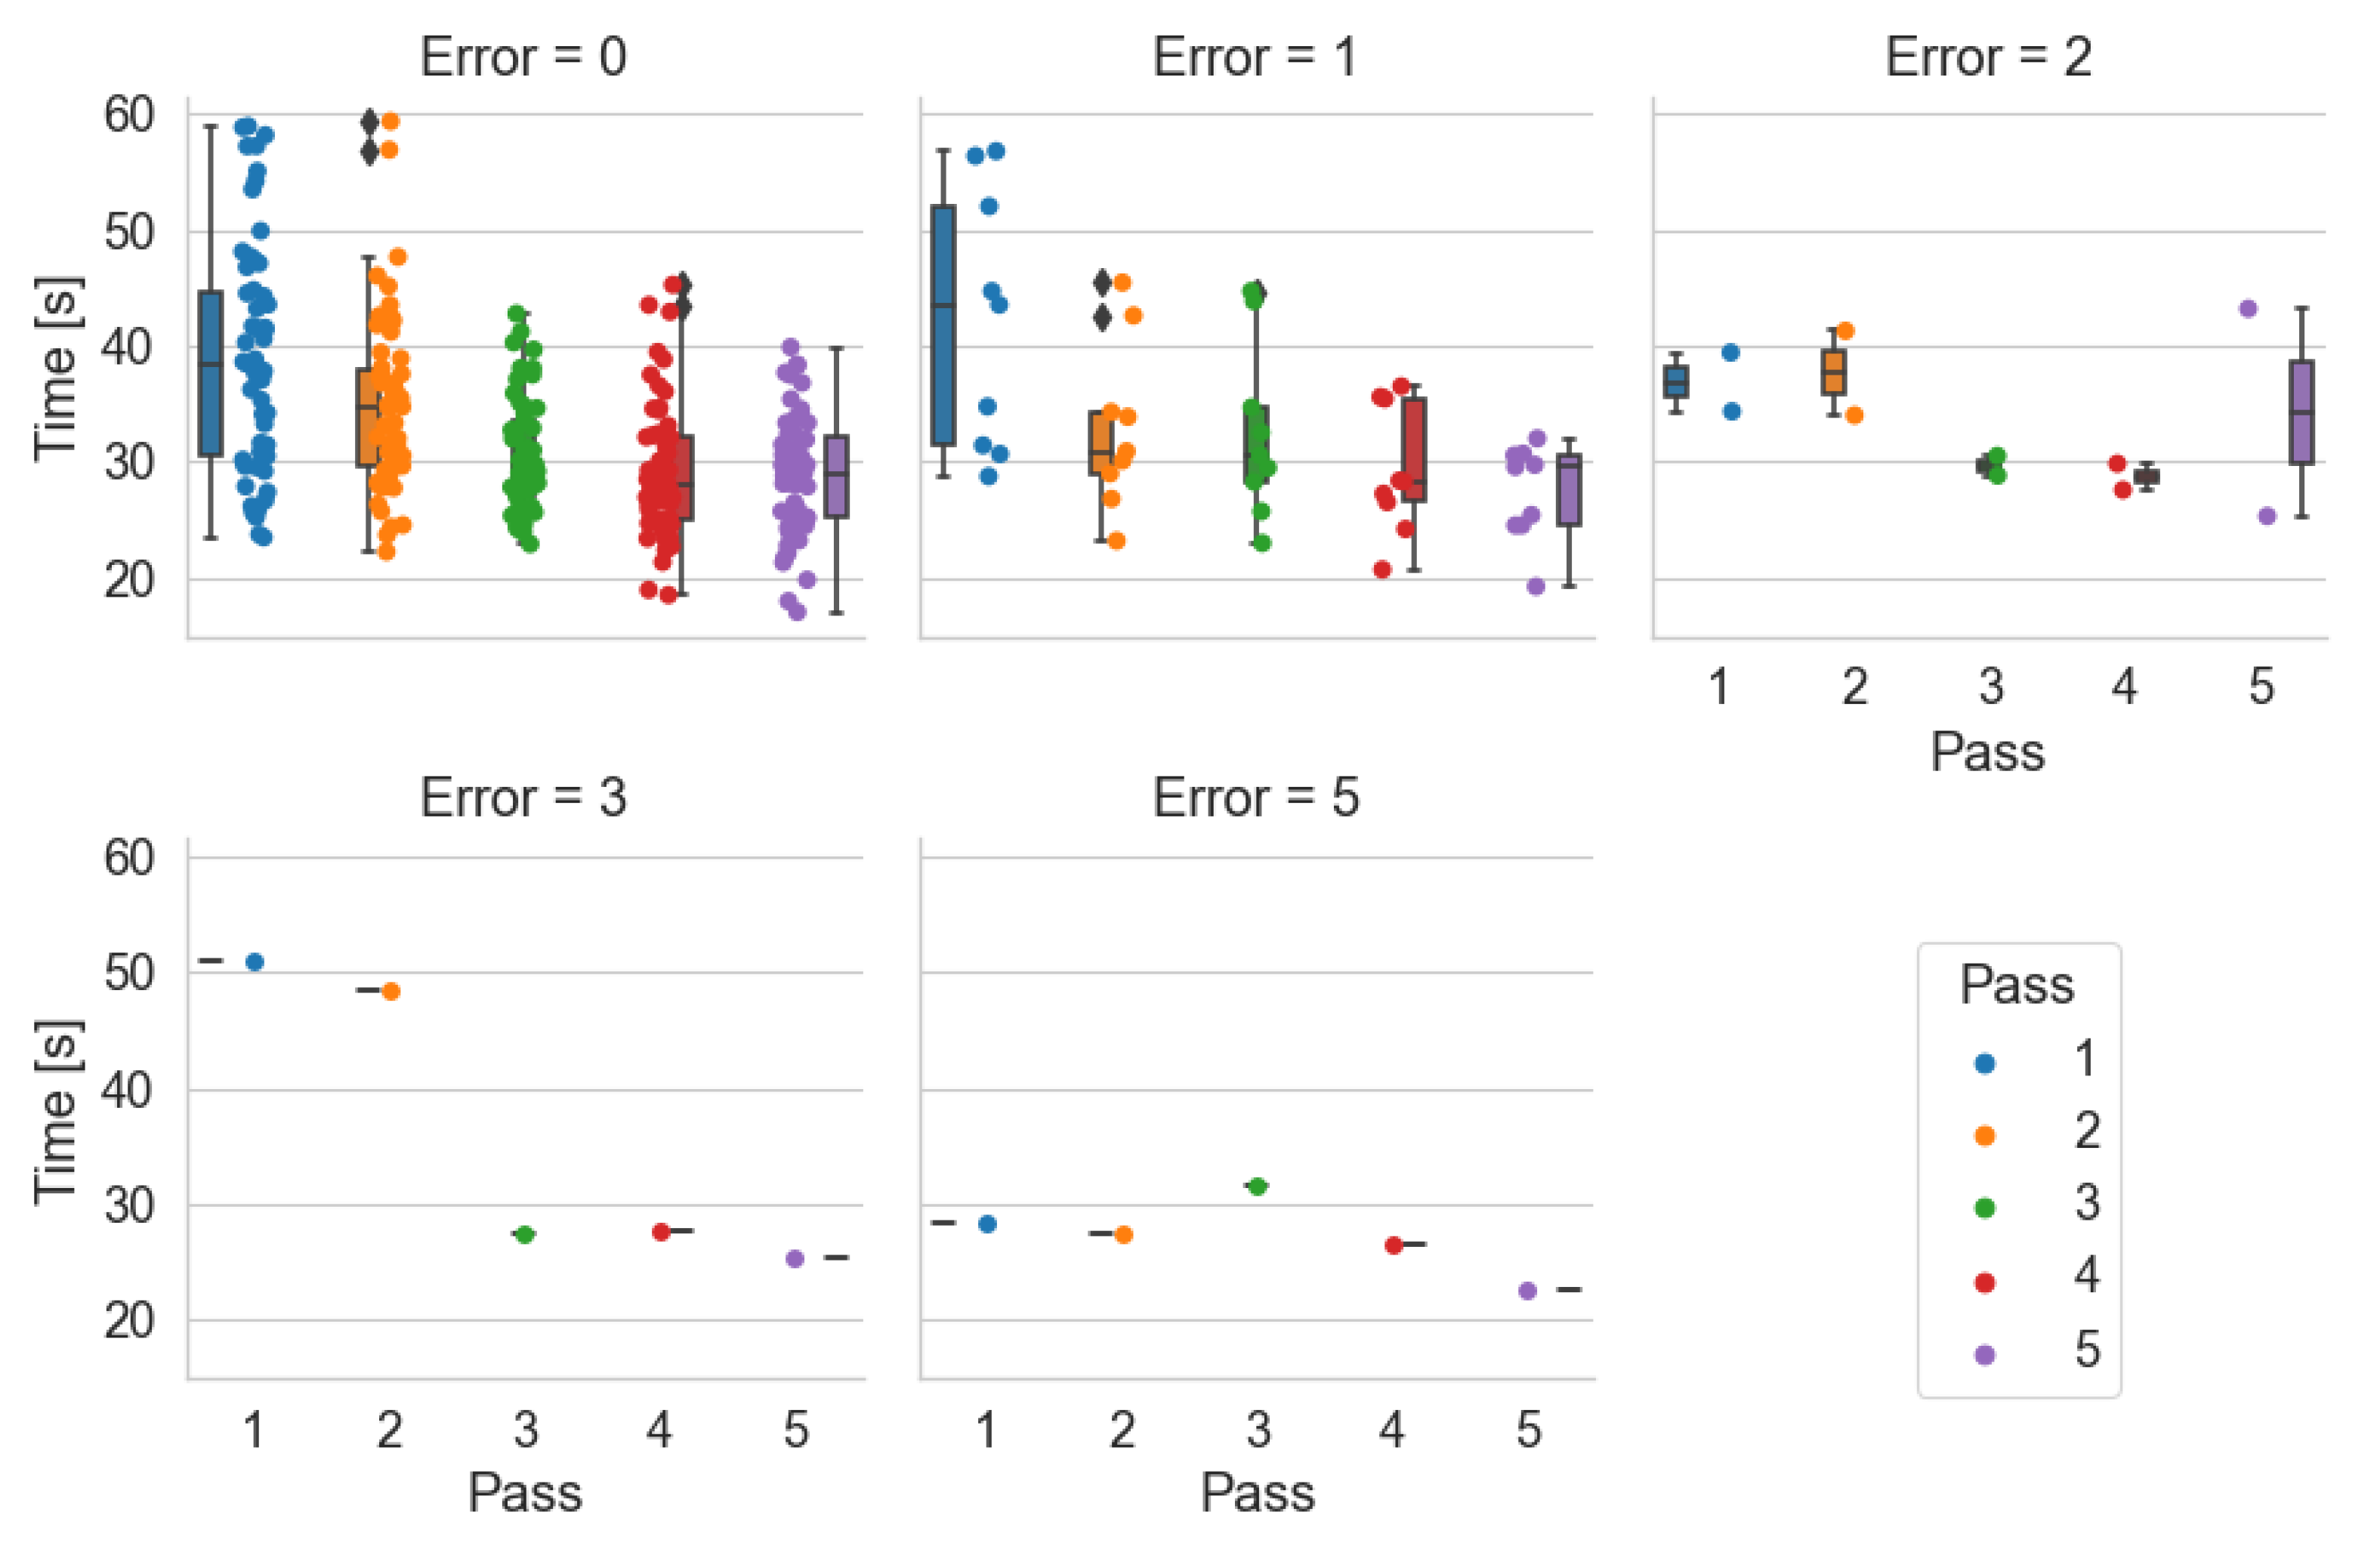
Figure 18.
A location difficult for participants to see.
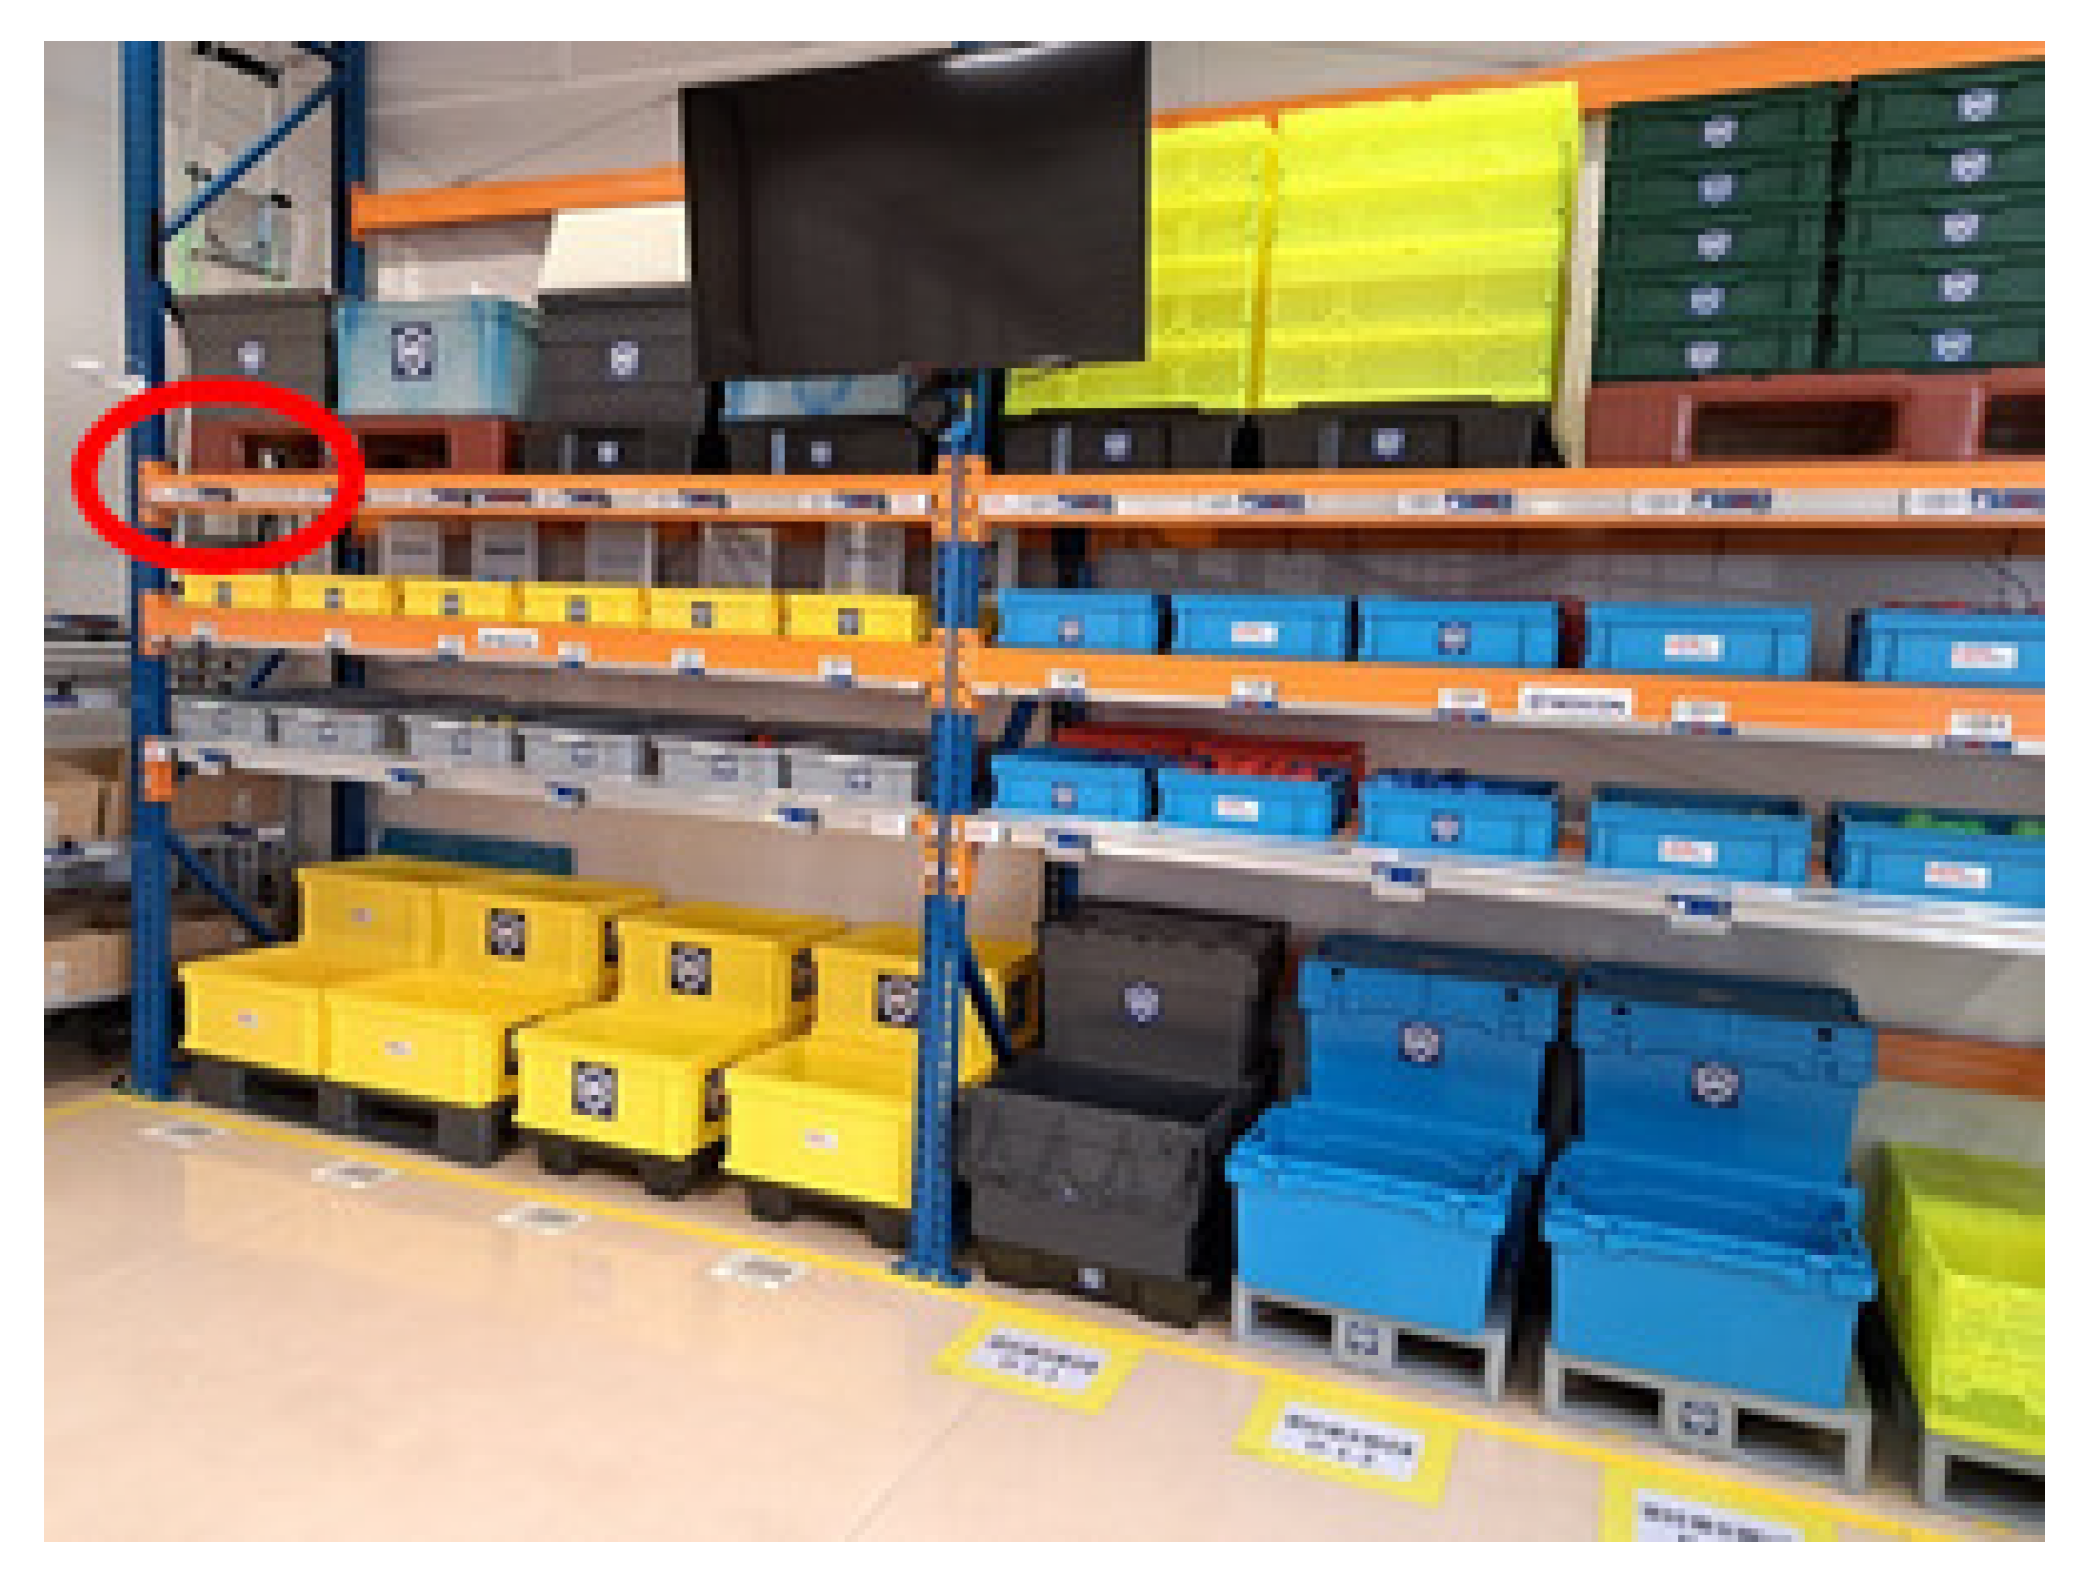

Table 1.
Number of total incorrect pick-ups by system.
| System | No. of participants | No. of errors |
|---|---|---|
| Pick-by-Paper | 28 | 48 |
| Pick-by-Light | 71 | 41 |
| Pick-by-Point | 71 | 21 |
Table 2.
Percentage of incorrect pick-ups in relation to all pick-ups.
| System | Errors |
|---|---|
| Pick-by-Paper | 6,86% |
| Pick-by-Light | 2,31% |
| Pick-by-Point | 1,18% |
Table 3.
Number of incorrect pick-ups per participant.
| System | Errors/P |
|---|---|
| Pick-by-Paper | 1,71 |
| Pick-by-Light | 0,58 |
| Pick-by-Point | 0,30 |
Table 4.
Survey results for systems Pick-by-Light and Pick-by-Point.
| 1. Locations indicated by the system | Light | Point |
|---|---|---|
| a) I had to look, think for a while | 10 | 8 |
| b) I was able to see right away | 27 | 24 |
| c) it got easier with every step | 16 | 16 |
| d) a difficult start | 0 | 3 |
| 2.The tested system appears to be in the long term | ||
| a) cumbersome | 3 | 5 |
| b) tiring | 6 | 2 |
| c) easy to learn | 31 | 31 |
| d) comfortable, compatible with my aptitude | 13 | 12 |
Table 5.
Loose answers to two questions
| 1. Reasons for discomfort in the system: | |
|---|---|
| accuracy of receipts (proglove) | 10 |
| inadequate fit of the scanner in the hand | 3 |
| right-hand scanner | 2 |
| 2. In my opinion, the disadvantage of the tested system is: | |
| accuracy of receipts (proglove) | 17 |
| receipt method | 2 |
| fatigue of one hand | 1 |
Table 6.
The results of the comparative survey of indicating systems
| 1. In my opinion the most intuitive system of indicating is: | |
|---|---|
| Pick-by-Light | 48,6% (29 z 62) |
| Pick-by-Point | 51,4% (32 z 62) |
| Pick-by-Paper | (1 z 25) |
| 2. In my opinion the most tiresome system of indicating seems to be: | |
| Pick-by-Light | 36,7% (22 z 60) |
| Pick-by-Point | 35,0% (21 z 60) |
| Pick-by-Paper | (17 z 25) |
| 3. In my opinion the quickest learned system of indicating seems to be: | |
| Pick-by-Light | 46,8% (29 z 62) |
| Pick-by-Point | 50,0% (31 z 62) |
| Pick-by-Paper | (2 z 25) |
Table 7.
The results of the comparative survey of receipt systems.
| 1. In my opinion the most comfortable receipt system is: | |
|---|---|
| button on the module | 37,1% (23 z 62) |
| Proglove | 62,9% (39 z 62) |
| 2. In my opinion the most cumbersome receipt system seems to be: | |
| button on the module | 62,9% (39 z 62) |
| Proglove | 37,1% (23 z 62) |
| 3. In my opinion the quickest learned receipt system seems to be: | |
| button on the module | 38,7% (24 z 62) |
| Proglove | 61,3% (38 z 62) |
Disclaimer/Publisher’s Note: The statements, opinions and data contained in all publications are solely those of the individual author(s) and contributor(s) and not of MDPI and/or the editor(s). MDPI and/or the editor(s) disclaim responsibility for any injury to people or property resulting from any ideas, methods, instructions or products referred to in the content. |
© 2024 by the authors. Licensee MDPI, Basel, Switzerland. This article is an open access article distributed under the terms and conditions of the Creative Commons Attribution (CC BY) license (http://creativecommons.org/licenses/by/4.0/).
Copyright: This open access article is published under a Creative Commons CC BY 4.0 license, which permit the free download, distribution, and reuse, provided that the author and preprint are cited in any reuse.


