

Submitted:
30 December 2024
Posted:
31 December 2024
You are already at the latest version
Abstract
Drivers' behavior is one of the most important causes of road accidents, which can be affected by various individual differences such as driving knowledge, information processing, demographic variables and personality. This research tries to accurately understand this phenomenon among public transportation drivers. The case studied in this research is the drivers of public transportation of goods and passengers in Tehran. The research method is survey and questionnaire. The data was collected through individual interviews with 200 truck drivers, 200 taxi drivers, 100 city bus drivers and 60 suburban bus drivers. In the questionnaire, six main factors were examined, including: 1- driving patiently, 2- relaxing while driving, 3- tending to fatigue, 4- identifying risks, 5- anxious driving, and 6- excitement seeking. The mentioned parameters were extracted as driver's behavior and the effect of demographic and personality variables on them was investigated. Pearson and Spearman correlation tests were also used to test the hypotheses. The results of this research show that the variables of age, level of education, ownership of the vehicle are related to the behavior of the driver, and there is a significant relationship between the personality variables and the behavior of drivers. These different aspects of personality and behavior explain the differences of drivers in risk-taking and the frequency of accidents.
Keywords:
personality characteristics (age and education)-demographic
; drivers' behavior
; public transportation
; Tehran city
Introduction
Nowadays, injuries caused by traffic accidents have caused physical health and public comfort to be endangered, so it has attracted the attention of people and officials. And solving it requires an all-out effort for effective and sustainable prevention. Based on this, it is necessary to try to reduce driving accidents by developing and applying traffic safety. Traffic safety is a field that has wide and complex dimensions and requires various knowledge and experiences depending on the relevant fields. This multidimensional variety of sciences is divided into three subcategories: human factors, environmental factors, and road and vehicle factors. The significant amount of accidents in Iran is related to the human factor and especially the driver's behavior. The driver's behavior is known as the main cause of accidents in most of the traffic accidents in Iran and the world. It also causes irreparable damage to people and society [1].
In recent years, psychologists have tried to identify driving behavior because it causes many injuries and costs in accidents. Because applied psychologists have a more correct understanding and classification of all types of human behavior, they can identify which behavior involuntarily caused the driver to make an error and which one causes the violation. It seems that these two forms of abnormality have different psychological causes and methods of correction [2].
In developed countries, 1 to 2.5 people per 10,000 vehicles and in developing countries 3 to 15 people die in driving accidents, this index has been reported for Iran as 29 people. Also, various studies in the last 20 years show a clear relationship between sleep disorders and accidents [3].
Several studies show that the human factor is responsible for 85-90% of road accidents. For this reason, many studies have focused on the relationship between human factors and road accidents. Experts say that driving with anger is an important factor in road accidents [4].
Also, psychological research shows that driver stress is the result of a negative cognitive evaluation of driving conditions, which is influenced by the driver's personality traits, experiences, skills, reaction time and psychological interpretation of the events of social interactions and the physical environment. Which is different for each driver. [5].
In another article, the accidents involving young drivers have been investigated and the effect of the time of obtaining a license and the amount of driving experience on the behavior of young drivers. And it has shown that there is a relationship between accidents and the time of obtaining a certificate. In this study, the accidents of drivers between 17 and 21 years old who obtained their license between 2006 and 2009 were examined. And the time of obtaining the certificate was categorized into 24-month groups and the number of accidents was calculated in each group [6].
The results show that there were more accidents in the first months of obtaining a certificate for people aged 17. Drivers who obtained a license at an older age showed a lower rate of accidents in the first months of driving. Therefore, drivers who had more driving experience had fewer accidents. Finally, regardless of the driver's driving experience and age, the risk rate of teenage drivers' accidents has increased dramatically during the period of transition from a temporary license to a permanent license [6].
In another study, they investigated the dangerous behavior of elderly drivers in high-risk accidents. The authors of this article have tried to identify dangerous behaviors in this type of accidents. In this study, the National Road Traffic Safety Organization in the United States has collected the data of 5470 car accidents that were reported by the police between 2005 and 2007 and emergency operations were conducted for them. In this data, there were 620 crashes involving 647 drivers age 70 or older.
Driving errors of elderly drivers were compared with drivers aged 35 to 54 years. According to the results obtained from this research, driving errors were the main cause of 92% of the accidents of elderly drivers. Among them, the most common errors are as follows: 1- Inadequate visibility was found with 33% and failure to recognize the distance to the front car or the speed of other vehicles. 2- Vision error and failure to recognize the distance with the car in front were 22 and 3%, respectively, in middle-aged drivers. 3- About 66% of vision errors and 22% of not recognizing time intervals in elderly drivers were when turning left at intersections. Errors of not recognizing the time interval and speed of other vehicles and lack of sufficient visibility were more common among elderly female drivers than middle-aged female drivers, while the prevalence of this error was not significantly related between elderly and middle-aged male drivers. These errors included 51% of the errors of elderly female drivers and 31% of elderly male drivers [7].
In Spain, in 1914, two psychotechnic laboratories were established in Barcelona in order to investigate the behavior of drivers. This was the third center in the world. The purpose of establishing these laboratories was to supervise the selection of truck and train drivers, and to organize training programs related to them. In this center, the attention of the researchers was to evaluate motor-psychological skills and sensory abilities through the analysis of the driver's behavior, such as distance recognition, visual and auditory perception, quick reaction and the ability to focus and maintain attention, etc.
In other study, they investigated the factors affecting the severity of accidents and how these factors affect it in the converging and diverging interference areas of freeways, taking into account driver characteristics, geometric design components, and weather and traffic rate. In this research, accident data were extracted from Ohio state police reports. They used the generalized ordinal logit model to determine the contribution of factors affecting the severity of injuries. The results of this research showed that in truck-related accidents, increasing the number of freeway lanes and ramps in converging areas, speed and alcohol consumption can increase the severity of injuries. In addition, in divergent areas, accidents caused by illegal speed and alcohol increase the possibility of injuries leading to surgery and death. [8]
In traffic psychology, there is no single and complete framework for theories, and each of the theories has focused on a specific topic and analyzed a part of the driver's duties. In this case, many specialized patterns such as perceptual, attentional, cognitive, social, motivational, etc. patterns have emerged as determinants of emotional factors of mobility and driving behavior, and each point of view can be a starting point in understanding the psychological dimensions of driver. [9]
Human errors have been investigated as a field of research in the 1970s. Most of the past human learnings have been obtained through mistakes and learning from them. [10]
Farz and Altman found that students who were allowed to make mistakes performed better compared to those who were not given the opportunity to make mistakes. Riesen pointed out that learning by mistake in the control room of a chemical or nuclear plant, as in educational experiences, may have unacceptable consequences. In this way, according to the complexity of work activities (such as driving), humans may be forced to shorten their learning periods. To improve experiential learning opportunities, including making mistakes and learning from them, efforts such as using simulators have been made. Of the 100 marine accidents Wagner and Groeneweg examined, only four were not due to human error; Most of them were usually more than one or two mistakes. so, he found that most human errors are related to diagnosis (information acquisition) and decision making (information processing) [11].
In China, it was reported that there were 58,022 fatalities due to the traffic accidents, with a road traffic death rate of 18.2 per 100,000 [12], which makes road traffic accidents a serious social problem in China. By 2018, China had 565,933 public transport vehicles in operation As an important part of the modern public transportation system, bus plays a vital role in improving urban road infrastructure construction. However, the working environment for bus drivers is fraught with adverse conditions [14] and studies on bus drivers are less extensive than those on truck drivers and private car drivers. In fact, bus drivers have a more complicated driving environment and higher levels of work stress than other types of drivers [15,16]. In addition, the complexity of urban road conditions and continuity of entering and exiting stations require bus drivers to operate more frequently, and the large size and long body of the bus also puts forward higher requirements on drivers’ driving skills. Exposed to noise, microclimate, vibration and difficult ergonomic conditions, bus drivers always work long hours and have inadequate and/or irregular breaks All these factors place city bus drivers at increased risk for traffic accidents. Traffic accidents are events that occur when several etiological factors operate synergistically, and most traffic accidents occurred mainly because of risky behaviors performed by road users, especially drivers
Methodology
This study is a descriptive study in which appropriate tools should be used to describe, analyze and investigate the current situation. After determining the goal that was mentioned in the previous parts of this study, a suitable and up-to-date questionnaire is used to find out the personality-influenced behaviors of public transportation drivers. The statistical population was all the drivers of public transportation (trucks and trailers) and passenger buses (inside and outside the city, taxi) and the accessible population was also drivers who commuted in Kashan city with the same characteristics.
It is noteworthy that the existence of statistics alone is not enough, but the number of statistical samples is also very important. Examining the entire statistical population will have very accurate results, but for two reasons, it is not logical to examine the entire statistical population because it requires a lot of time and it is very expensive to conduct this amount of statistics; Therefore, it is logical to limit the number of logical samples and specify them, taking into account the accuracy and correctness necessary for statistics.
There are different criteria to determine the number of necessary samples; one of the criteria is the use of KMO and Bartlett's sphericity test in factor analysis, which can be used to determine the appropriateness of the data. Also, in statistics, equation (1) is used to estimate the required number of samples:
Where in :
N: the size of the statistical population;
n: sample volume
Z: the normal variable value of the standard unit, which is 164 at the 90% confidence level.
P: The value of the trait ratio in the society. If it is not available, it can be considered as 0.5 based on Cochran's opinion. In this case, the variance value reaches its maximum value.
q: The percentage of people who lack that attribute in the society
D: The permissible error value, which is usually considered 0.05. In case the size of the statistical population is not known, equation 1 becomes equation 2:
In this study, since the size of the statistical population of trucks and trailers is not known, equation 2 is used.

Table 1.
Required sample size.
| COLLECTED | n | N | EQUATION | TARGET GROUP |
| 74 | 72 | 98 | (1-4) | SUBURBAN BUS DRIVERS |
| 104 | 102 | 165 | (1-4) | City BUS DRIVERS |
| 227 | 222 | 1250 | (1-4) | TAXI DRIVERS AND RIDE-HAILING |
| 273 | 267 | ∞ | (1-4) | Truck AND TRAILER DRIVERS |
| 678 | TOTAL NUMBER OF DRIVERS | |||
Due to the fact that some of the questionnaires are incompletely filled or missing, more are selected for distribution. In the following, the questionnaire that was used for this research is taken from a research that was conducted in England on city bus drivers, which in Radmard's study [27], this questionnaire was translated and using the Driver Stress Questionnaire (DSI) and the questionnaire Six parts have been prepared and evaluated to examine individual risk and the effect of personal variables on the driving behavior of suburban bus drivers.
In the present article, according to the target population, which was the drivers of the public road transport fleet (cargo and passenger), changes were made in the mentioned questionnaire and it was used.
The driver's behavior refers to the set of reactions that the driver shows in response to different situations. These reactions are summarized in six distinctive characteristics, which are the tendency to fatigue, danger identification, calm driving, patient driving, anxious driving, and thrill seeking.
In order to be able to examine and compare these six characteristics in the sample, by using a questionnaire and scoring people based on a Likert scale, a score is given to people for each characteristic. The questionnaire questions are such that the driver is asked to specify the repetition rate of the described situations. Answering is done in a range from 1 (always) to 6 (never).
Since the questions were asked both positively and negatively, and the criteria of the spectrum was such that whoever gets a higher score in a factor has a better situation, in some questions we needed reverse scoring 1 (never) up to 6 (always).
These questions were compiled in six sections.
- -
- The first part: It is related to fatigue while driving. The questions in this part include five questions.
- -
- The second part: is related to the identification of risks along the route, which includes five questions.
- -
- In the third part: five questions were also asked, which were related to calmness while driving and before and after it.
- -
- The fourth part: contains 7 questions related to patient driving.
- -
- The fifth part and the sixth part are related to anxiety and excitement while driving, and each part contains four questions.
In the other part of the questionnaire, demographic and social characteristics such as age, level of education, year of obtaining driver's license, year of employment and the number of accidents in recent years are asked from all the drivers. In order to collect the required information, the questions raised in the questionnaire were asked from the drivers in different time periods and places according to the target group.
Among the problems in collecting information was the lack of a suitable testing environment because most of the drivers answered the questions next to the vehicles they were responsible for driving, which factors such as noise, the lack of a table or a suitable subordinate prevented them from doing so. The drivers were concentrating on answering the questions.
Preliminary analysis of collected data
In this section, descriptive findings about the research sample are presented first. After that, research hypotheses and final data analysis have been discussed.
Demographic and personal characteristics
Tables 2–4 shows the classification of the personal characteristics and demographics of the studied drivers by target group and according to frequency and frequency percentage.
Table 2.
Frequency and frequency percentage of participants according to demographic and personal variables.
Table 2.
Frequency and frequency percentage of participants according to demographic and personal variables.
| TRUCK & TRAILER | TAXI | INNER CITY BUS | SUBURBAN BUS | PARAMETER | |||||
| Percent | Number | Percent | Number | Percent | Number | Percent | Number | ||
| 17.9 | 49 | 15.4 | 35 | 23.1 | 24 | 21.6 | 16 | AGE | |
| 33 | 90 | 28.2 | 64 | 51 | 53 | 32.4 | 24 | 34-43 | |
| 29.7 | 81 | 31.7 | 72 | 13.5 | 14 | 27 | 20 | 44-53 | |
| 19.4 | 53 | 24.7 | 56 | 12.5 | 13 | 18.9 | 14 | ||
| 11 | 30 | 10.6 | 24 | 0 | 0 | 16.2 | 12 | Single | MARITAL STATUS |
| 89.0 | 243 | 89.4 | 203 | 100 | 104 | 83.8 | 62 | married | |
| 4.4 | 12 | 4.8 | 11 | 0 | 0 | 4.1 | 3 | Illiterate | EDUCATION |
| 31.1 | 85 | 30.4 | 69 | 19.2 | 20 | 23 | 17 | Elementary | |
| 30.4 | 83 | 38.3 | 87 | 46.2 | 48 | 32.4 | 24 | High school | |
| 29.3 | 80 | 21.6 | 49 | 27.9 | 29 | 35.1 | 26 | College | |
| 4.8 | 13 | 4.4 | 10 | 6.7 | 7 | 5.4 | 4 | university | |
| 30 | 82 | 32.2 | 73 | 29.8 | 31 | 35.1 | 26 | A | BLOOD TYPE |
| 26.7 | 73 | 23.8 | 54 | 25 | 26 | 24.3 | 18 | B | |
| 18.3 | 50 | 21.6 | 49 | 21.2 | 22 | 17.6 | 13 | AB | |
| 24.5 | 67 | 22.5 | 51 | 23.1 | 24 | 23 | 17 | O | |
| 74 | 202 | 71.4 | 162 | 75 | 78 | 77 | 57 | no | ADDICTION |
| 26 | 71 | 28.6 | 65 | 25 | 26 | 23 | 17 | yes | |
| 46.5 | 127 | 55.7 | 13 | 100 | 104 | 75.7 | 56 | no | OWNERSHIP |
| 53.5 | 146 | 94.3 | 214 | 0 | 0 | 24.3 | 18 | yes | |
| 28.9 | 79 | 41 | 93 | 51 | 53 | 32.4 | 24 | 1-8 | DRIVING EXPERIENCE ( YEAR) |
| 29.3 | 80 | 37 | 84 | 31.7 | 33 | 27 | 20 | 9-17 | |
| 27.5 | 75 | 18.5 | 42 | 14.4 | 15 | 28.4 | 21 | 18-25 | |
| 11 | 30 | 2.6 | 6 | 2.9 | 3 | 9.5 | 7 | 25-33 | |
| 3.3 | 9 | 0.9 | 2 | 0 | 0 | 2.7 | 2 | ||
Factor analysis and determining the main factors of each scale
In order to use the answered questions as well as the possibility of interpreting the results and scores of each questionnaire test, the categorized questions and the main factors of the scale of each questionnaire should be determined first. Before conducting the factor analysis, the tests introduced in the previous chapter were used to understand the suitability of the data for factor analysis.
Table 3 shows the results of KMO index and Bartlett's test on questionnaire data. According to the KMO index (more than 0.6) and sig in Bartlett's test (less than 0.01), the number of analysis samples is sufficient, and factor analysis is a suitable method to identify the structure of the scales used.
Table 4 shows the eigenvalues and variance of all factors. As can be seen, the initial eigenvalues for each of the factors are estimated in the form of the sum of explained variance. The explained variance is in terms of percentage of total variance and cumulative percentage. According to the contents of the previous chapter, the eigenvalue of each factor is a proportion of the total variance of the variables that is explained by that factor. The eigenvalue can be calculated through the sum of the squared factor loadings of all the variables in that factor.
Therefore, the eigenvalues show the exploratory importance of the factors in relation to the variables. If this value is low for a factor, it means that that factor had a small role in explaining the variance of the variables. The column of the sum of squares of factor loadings extracted in rotated state shows the set of factor values extracted after rotation.
Reliability
Reliability, for which words such as reliability, stability and trust are also used, is one of the characteristics of questionnaire measurement tools. By checking the reliability of the questionnaire, we can be sure that if the measured parameters are measured with the same means and conditions by asking different people, the same results will be obtained; Therefore, the reliability of all variables is determined separately by determining Cronbach's alpha coefficient according to Table 5 in the software.
Uses of the topic and the results obtained
In this part, the relationship between personal variables and driving behavior is investigated and interpreted according to the average scores obtained by people in different groups. In all graphs, the vertical axis shows the average score. The range of numbers in this axis is 0 to 6. Pearson and Spearman tests were also used to determine the existence of significant correlation between personal variables and driving behaviors.
Age factor
Pearson correlation test was used to investigate whether there is a relationship between the age variable and driving behavior.
The results of the correlation test according to Table 7 showed that the relationship between the age variable and four factors of fatigue, relaxation in driving, patient driving and excitement seeking is significant at the level of p ≤0.01. Age or fatigue factor has an inverse significant relationship. This means that as the age of people increases, the scores obtained in the fatigue factor decrease, drivers show more fatigue. This can be seen in Figure 1. Also, Figure 2 shows the relationship between the age and the scores obtained from the fatigue factor of four groups of drivers, separately from the target group.
Age is a determining factor for people's ability to perform tasks properly. As the age increases, the human's physical (sight, hearing, etc.) and mental ability deteriorates, and the person's ability to react to situations decreases significantly. On the other hand, the level of resistance of a person in hard working conditions decreases, the feeling of fatigue increases and the probability of accidents increases. As can be seen in Figure (4-2), with the increase in the scores obtained in the factors of relaxation in driving, patient driving and thrill seeking increase. Also, Figure 3, Figure 4, Figure 5, Figure 6 and Figure 7 show the relationship between age and the average scores obtained in the three mentioned factors by target group.
In the present study, the younger age group showed more stress than the middle-aged and elderly drivers. The reason for this is probably the greater responsibility of young drivers in this period of life in terms of economic and financial issues, which has forced young drivers to work more than their physical and mental capacity.
Feelings of anger affect everyone, but this sudden excitement creates more problems while driving. At the same time as the age increases, some physiological and psychological changes also occur, which affect the way of driving. In Parker and Lajonen's research on aggressive driving values and the effect of age, it was found that aggressive driving was much more in men at younger ages, which is in line with the present study.
Younger drivers have less patience in driving due to less experience, as well as more excitement. In his study, Berg showed that young drivers accept a higher degree of risk while driving due to high risk-taking and optimistic judgment and overestimation of their driving ability. Therefore, they are more prone to accidents and make more mistakes while driving.
As can be seen in figures (4-2) and (4-7), with increasing age, the scores in the risk identification factor fluctuate with a similar trend. This means that in the age group of less than 44 years, the behavior becomes more favorable with increasing age, so that the age group of 44-53 years has obtained the highest scores, and then in the group of over 53 years, the scores decrease again. In the correlation analysis, no significant relationship was found between age and risk identification factor. Regarding the identification of risks in which the scores increase up to the age group of 44-53, then decrease, it seems that due to the increase in driving experience, people do not see the need to be more careful about identifying risks. At first, driving is a controlled behavior, but then over time and with the acquisition of skills, it becomes an automatic behavior and continues without the need for conscious attention; But an accident is always a new stimulus and requires vigilance.
In examining the correlation between age and distracted driving, no significant relationship was found. In Figure 8-4, it can be seen that in the group of inner-city bus drivers, scores decrease significantly with increasing age, but no significant trend can be seen in other groups. Examining the driver's age variable in the current research shows that the older people become, the better their behavior becomes, and these findings are consistent with similar researches. Also, among older drivers, the percentage of unintentional errors, both dangerous and non-dangerous, is much higher, which has caused active accidents.
Educational status and type of driving
For further investigation, Pearson's correlation test was used to examine the relationship between educational status and driving behavior.
The results of the correlation test according to Table 9 showed that the relationship between the educational status variable and the four factors of fatigue, relaxation in driving, patient driving and excitement seeking is significant at p ≤ 0.01 level.
Educational status has a significant direct relationship with the fatigue factor. This means that as people's education increases, the scores obtained in the fatigue factor increase, which means that educated drivers behave more favorably in this factor.
This can be seen in Figure 8. Also, Figure 9 shows the relationship between the educational status and the scores obtained from the fatigue factor of four groups of drivers, separated by the target group.
Perhaps the high scores obtained in people with higher education can be explained by placing these people in younger age groups.
As shown in Figure 11, with increasing education, drivers have shown less relaxation and more stress. Regarding educated job seekers, the higher education level is done with a view to a better working future, as well as an effort to enter the labor market more easily and reliably. When people graduate from university, their psychological pressure increases. Because despite the time and effort they have spent on education, they have not achieved the desired result and have been forced to choose a job that does not require high education. Also, the economic conditions are such that many educated drivers have to work 2-3 shifts, which causes them mental problems. Figure 12 shows more relaxation of drivers with lower education level.
In the study of aggressive driving, it is observed that drivers with higher education showed more anger. In similar studies, there was a significant direct relationship between the level of education and the amount of errors and committing illegal acts. Also, young male drivers with high and medium education levels are more risky than other people. In the study of Amadar et al., it was also shown that safe driving does not increase with the increase in education level, and the results of this research are in line with the results of the present study. It may be possible to explain the high intention of unsafe driving in people with university education to the placement of these people in younger age groups [19].
Also, in Figure 13, Figure 14 and Figure 15, the relationship between educational status and other factors can be seen based on the comparison of the average obtained in each factor, which do not show a significant trend.
Past studies show that the education factor can be considered as an effective factor on driving behavior and accidents. Haas and Randmo stated that people with a higher level of education have less risk reduction potential than people with less education, that is, people with higher education are more likely to take risks.
Conclusions
Due to the huge human and financial losses caused by motor vehicle accidents in the communities, researchers are continuously looking for ways to gain a better understanding of the factors affecting the probability and severity of accidents. Various factors such as road conditions, driver characteristics, types of vehicles, environmental conditions, etc., can affect the severity of an accident, which is determined by the amount of financial and life losses.
The results of a detailed analysis of the relationship between the severity of accidents and the factors affecting them, based on the data recorded from previous accidents, can provide very useful information for policies to increase driving safety.
This research was conducted with the aim of knowing the personality and behavioral variables that can affect the risk-taking of professional drivers and the occurrence of accidents, that is, behaviors that have bitter consequences for both the driver and others.
The results of this research show that personality characteristics are behind drivers' motivations to accept risk on the road and are largely related to the driving behavior that the driver chooses, and high-risk personality variables are related to accidents and collisions through driving behavior.
This research shows that various demographic factors (variables of age, level of education, vehicle ownership) and personality have an effect on driving behaviors, and on the other hand, these behaviors can also affect the risk-taking of drivers and the occurrence of accidents.
From the results of this research, it can be inferred that the risk potential of professional drivers with younger age and less experience is higher for involvement in possible accidents. Also, single people, smokers and drivers with higher education are more likely to commit violations and get involved in accidents.
On the other hand, it can be seen that drivers with a history of accidents have obtained lower scores in all the investigated behavioral factors; therefore, it can be claimed that among professional drivers, some of the mentioned personality and behavioral characteristics can be an indicator for possible accidents of the driver. This index can be used as a tool in assessing the risk potential of professional drivers.
Also, driving behaviors are important from a practical and practical point of view, they should be evaluated and classified under a theoretical framework. Since the drivers of public transport vehicles have more responsibility than other drivers, for this purpose psychological evaluation, evaluation of traffic knowledge and individual capabilities, driving skills and measuring the level of obedience to traffic rules in applicants for driving public transport vehicles And the passenger is of special importance before obtaining the certificate. By carrying out the above-mentioned evaluations, it is possible to ensure the applicant's ability to drive as well as his driving behavior.
Investigations show that the criteria considered for granting the license of heavy vehicles in the country do not have the necessary efficiency compared to the leading countries in the matter of transportation safety.
In contrast to other developed countries, they have established the criteria for issuing licenses and licenses to drive heavy vehicles in such a way that only people who have the minimum necessary qualifications in various aspects can be license holders.
References
- World Health Organization, 2019. Global action plan on physical activity 2018-2030: more active people for a healthier world. World Health Organization.
- Ye, F., and D. Lord. 2014. Comparing three commonly used crash severity models on sample size requirements: multinomial logit, ordered probit and mixed logit models. Analytic methods in accident research 1:72–85.
- Downey, L. A., et al. (2013). "The effects of cannabis and alcohol on simulated driving: Influences of dose and experience." Accident Analysis & Prevention 50(0): 879-886. Drivers. Personality and Individual Diffrences, 2002; 33: 1251-1263.
- Holland, C. and V. Rathod (2013). "Influence of personal mobile phone ringing and usual intention to answer on driver error." Accident Analysis & Prevention 50(0): 793-800.
- Hennessy, D. (2011). Chapter 12 - Social, Personality, and Affective Constructs in Driving_Handbook of Traffic Psychology. E. P. Bryan. San Diego, Academic Press: 149-163.
- Curry, A.E., Pfeiffer, M.R., Durbin, D.R. and Elliott, M.R., 2015. Young driver crash rates by licensing age, driving experience, and license phase. Accident Analysis & Prevention, 80, pp.243-250.
- Cicchino, J.B. and McCartt, A.T., 2015. Critical older driver errors in a national sample of serious US crashes. Accident Analysis & Prevention, 80, pp.211-219.
- part B: methodological, 50, pp.74-89.
- Mergia, W.Y., Eustace, D., Chimba, D. and Qumsiyeh, M., 2013. Exploring factors contributing to injury severity at freeway merging and diverging locations in Ohio. Accident Analysis & Prevention, 55, pp.202-210.
- Herrero Fernández, D. (2011). "Psychometric adaptation of the Driving Anger Expression Inventory in a Spanish sample: Differences by age and gender." Transportation Research Part F: Traffic Psychology and Behaviour 14(4): 324-329.
- González-Iglesias, B., et al. (2012). "Driving anger and traffic violations: Gender differences." Transportation Research Part F: Traffic Psychology and Behaviour 15(4): 404-412.
- Groot, S., et al. (2012). "The effect of tire grip on learning driving skill and driving style: A driving simulator study." Transportation Research Part F: Traffic Psychology and Behaviour 15(4): 413426.
- WHO, Global status report on road safety World Health 2018. Geneva. 2018. Web resource [Accessed on 2020-05-19].
- N.B.o. Statistics, China Statistical Yearbook, 2019. http://data.stats.gov.cn/easyqu ery.htm?cn=C01&zb=A0B07&sj=2019.2019.
- L. Montoro, et al., Work environment, stress, and driving anger: a structural equation model for predicting traffic sanctions of public transport drivers, Int. J. Environ. Res. Public Health 15 (3) (2018).
- ] M. Bergomi, et al., Work-related stress and role of personality in a sample of Italian bus drivers, Work 57 (3) (2017) 433–440.
- W.T. Wu, et al., Professional Driver’s job stress and 8-year risk of cardiovascular disease: the taiwan bus driver cohort study, Epidemiology 30 (1) (2019) S39–S47. Suppl.
- A. Anund, et al., An on-road study of sleepiness in split shifts among city bus drivers, Accid. Anal. Prev. 114 (2018) 71–76.
- S.A. Useche, et al., Trait driving anger and driving styles among Colombian professional drivers, Heliyon 5 (8) (2019) e02259.
- Amado S, Koyuncu M, Kacaroglu G. (2004). Evaluation of Factors affecting safe driving:Demographic factors, Experience, Personality and Psycho-Technical Turk pisikoloji Dergisi; 19[53]:45-47.
Figure 1.
The relationship between age and six factors.
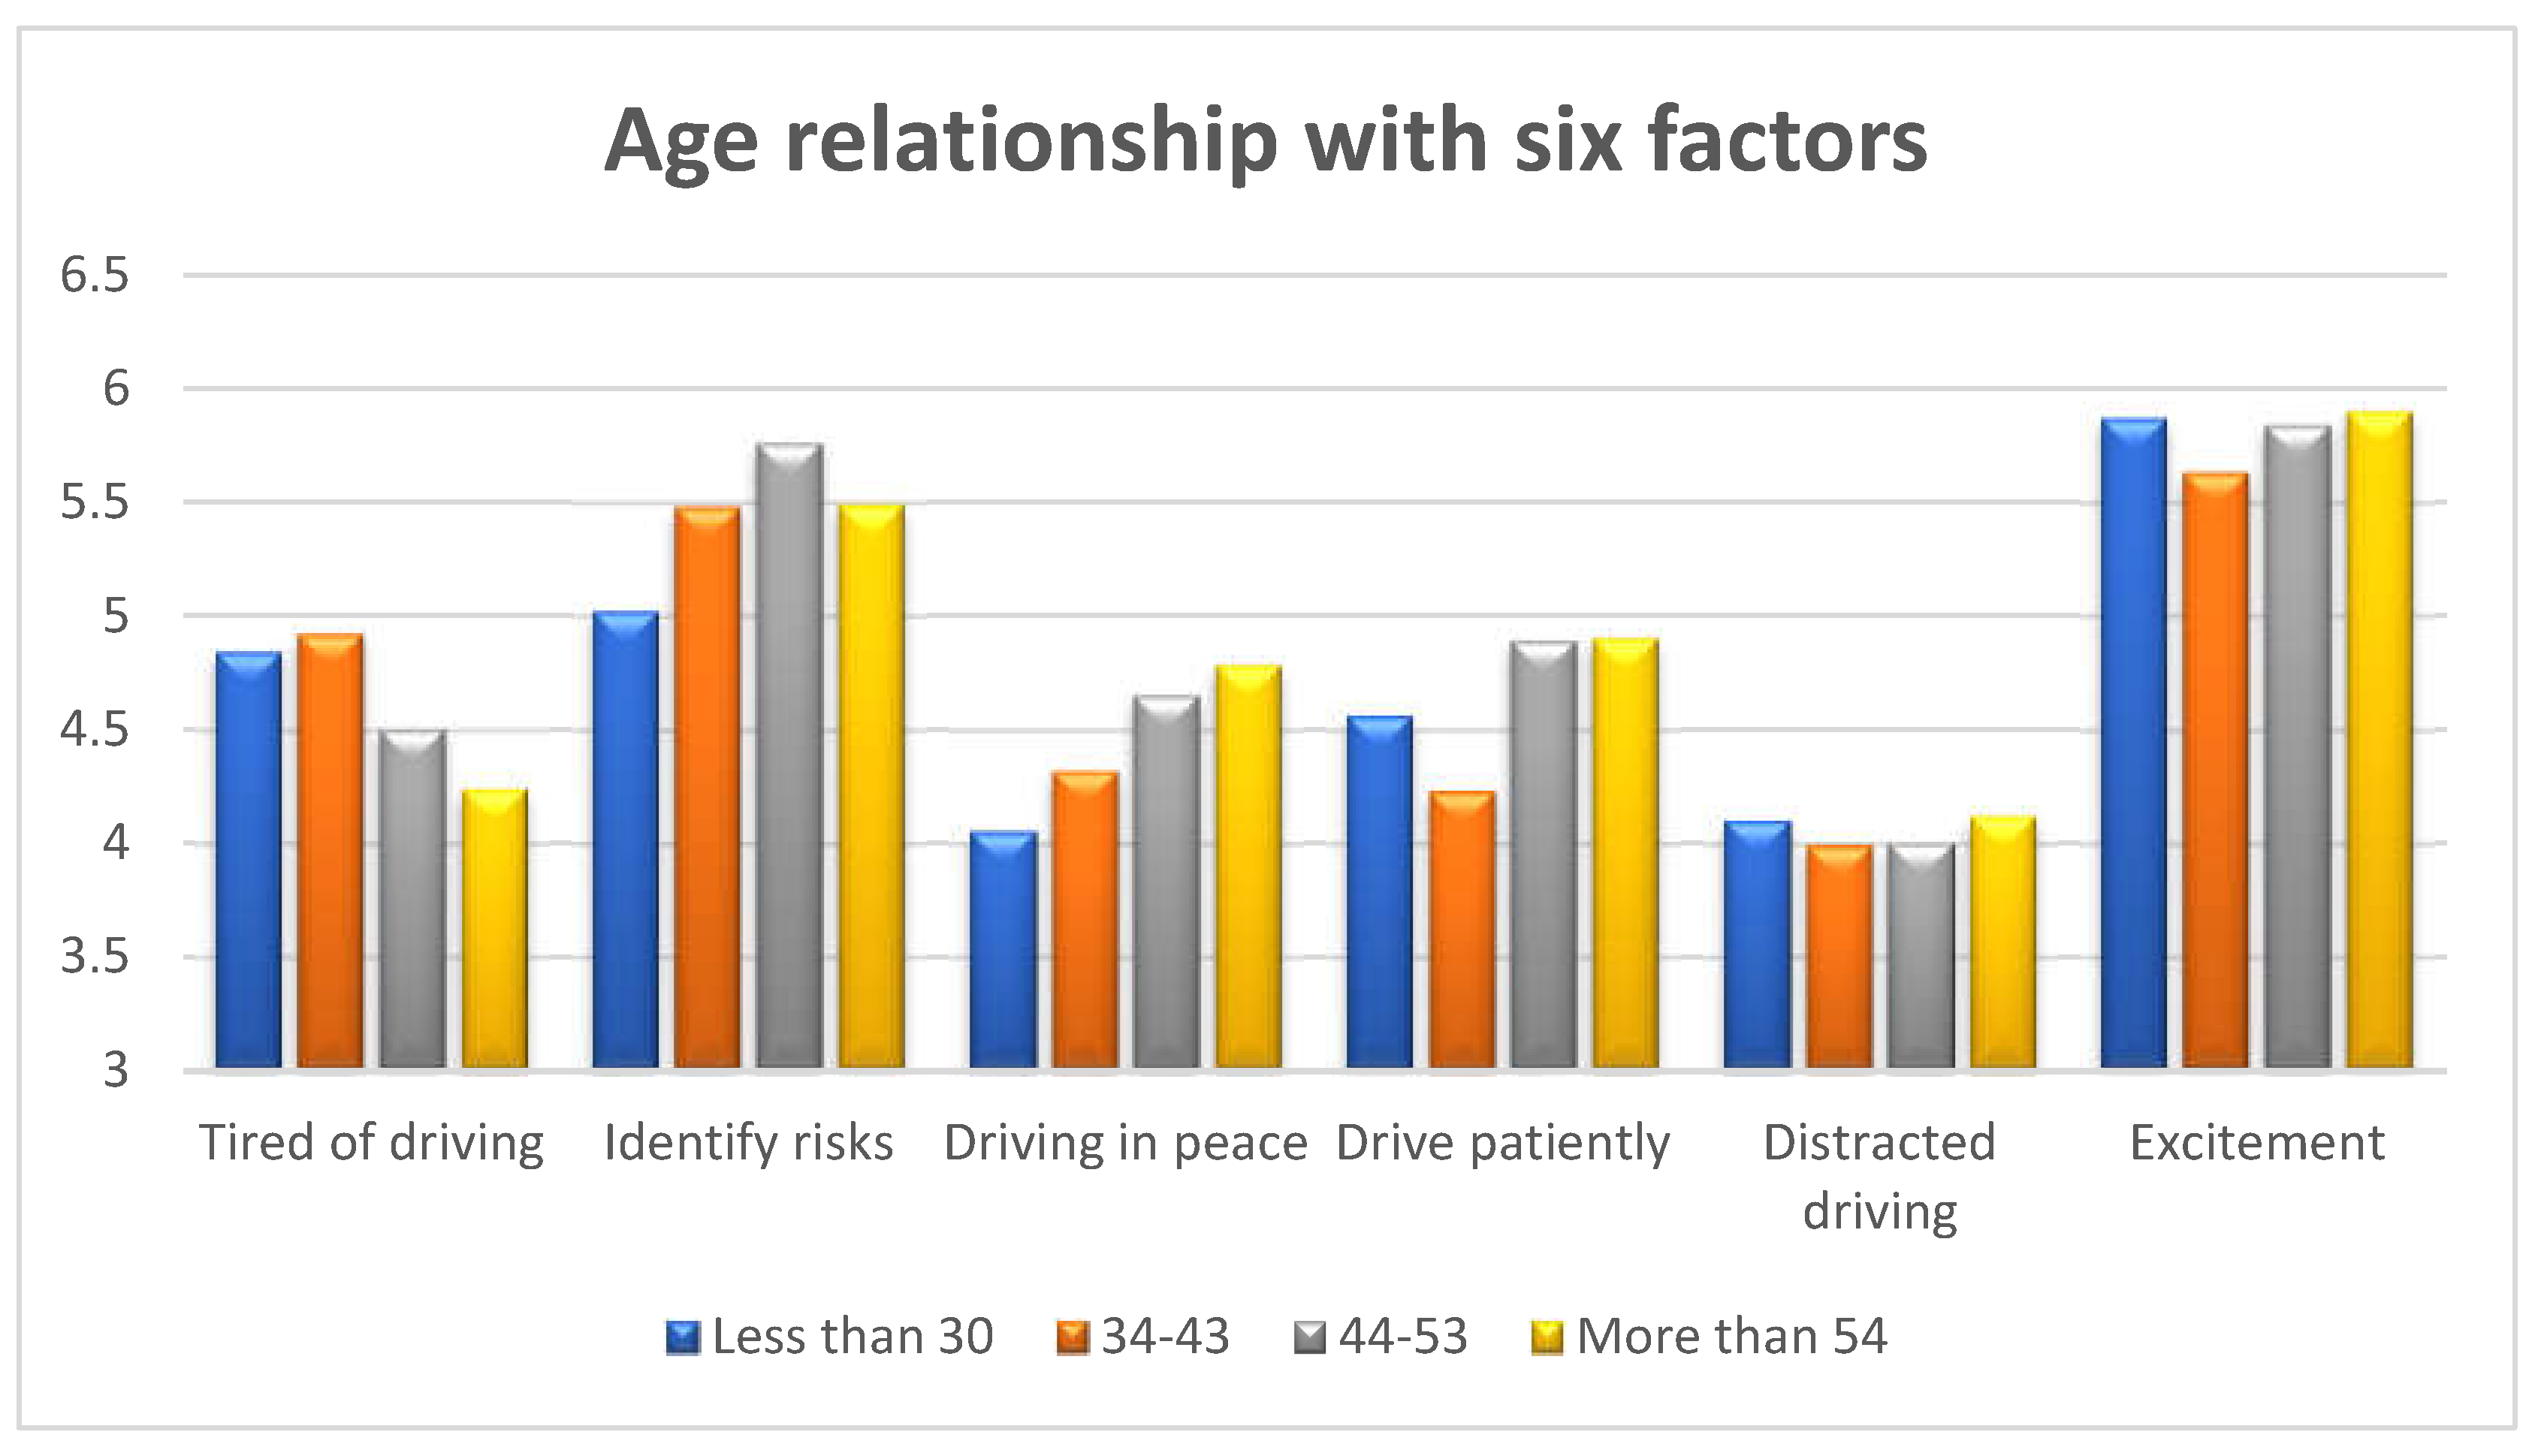
Figure 2.
The relationship between age and fatigue factor by driver group.
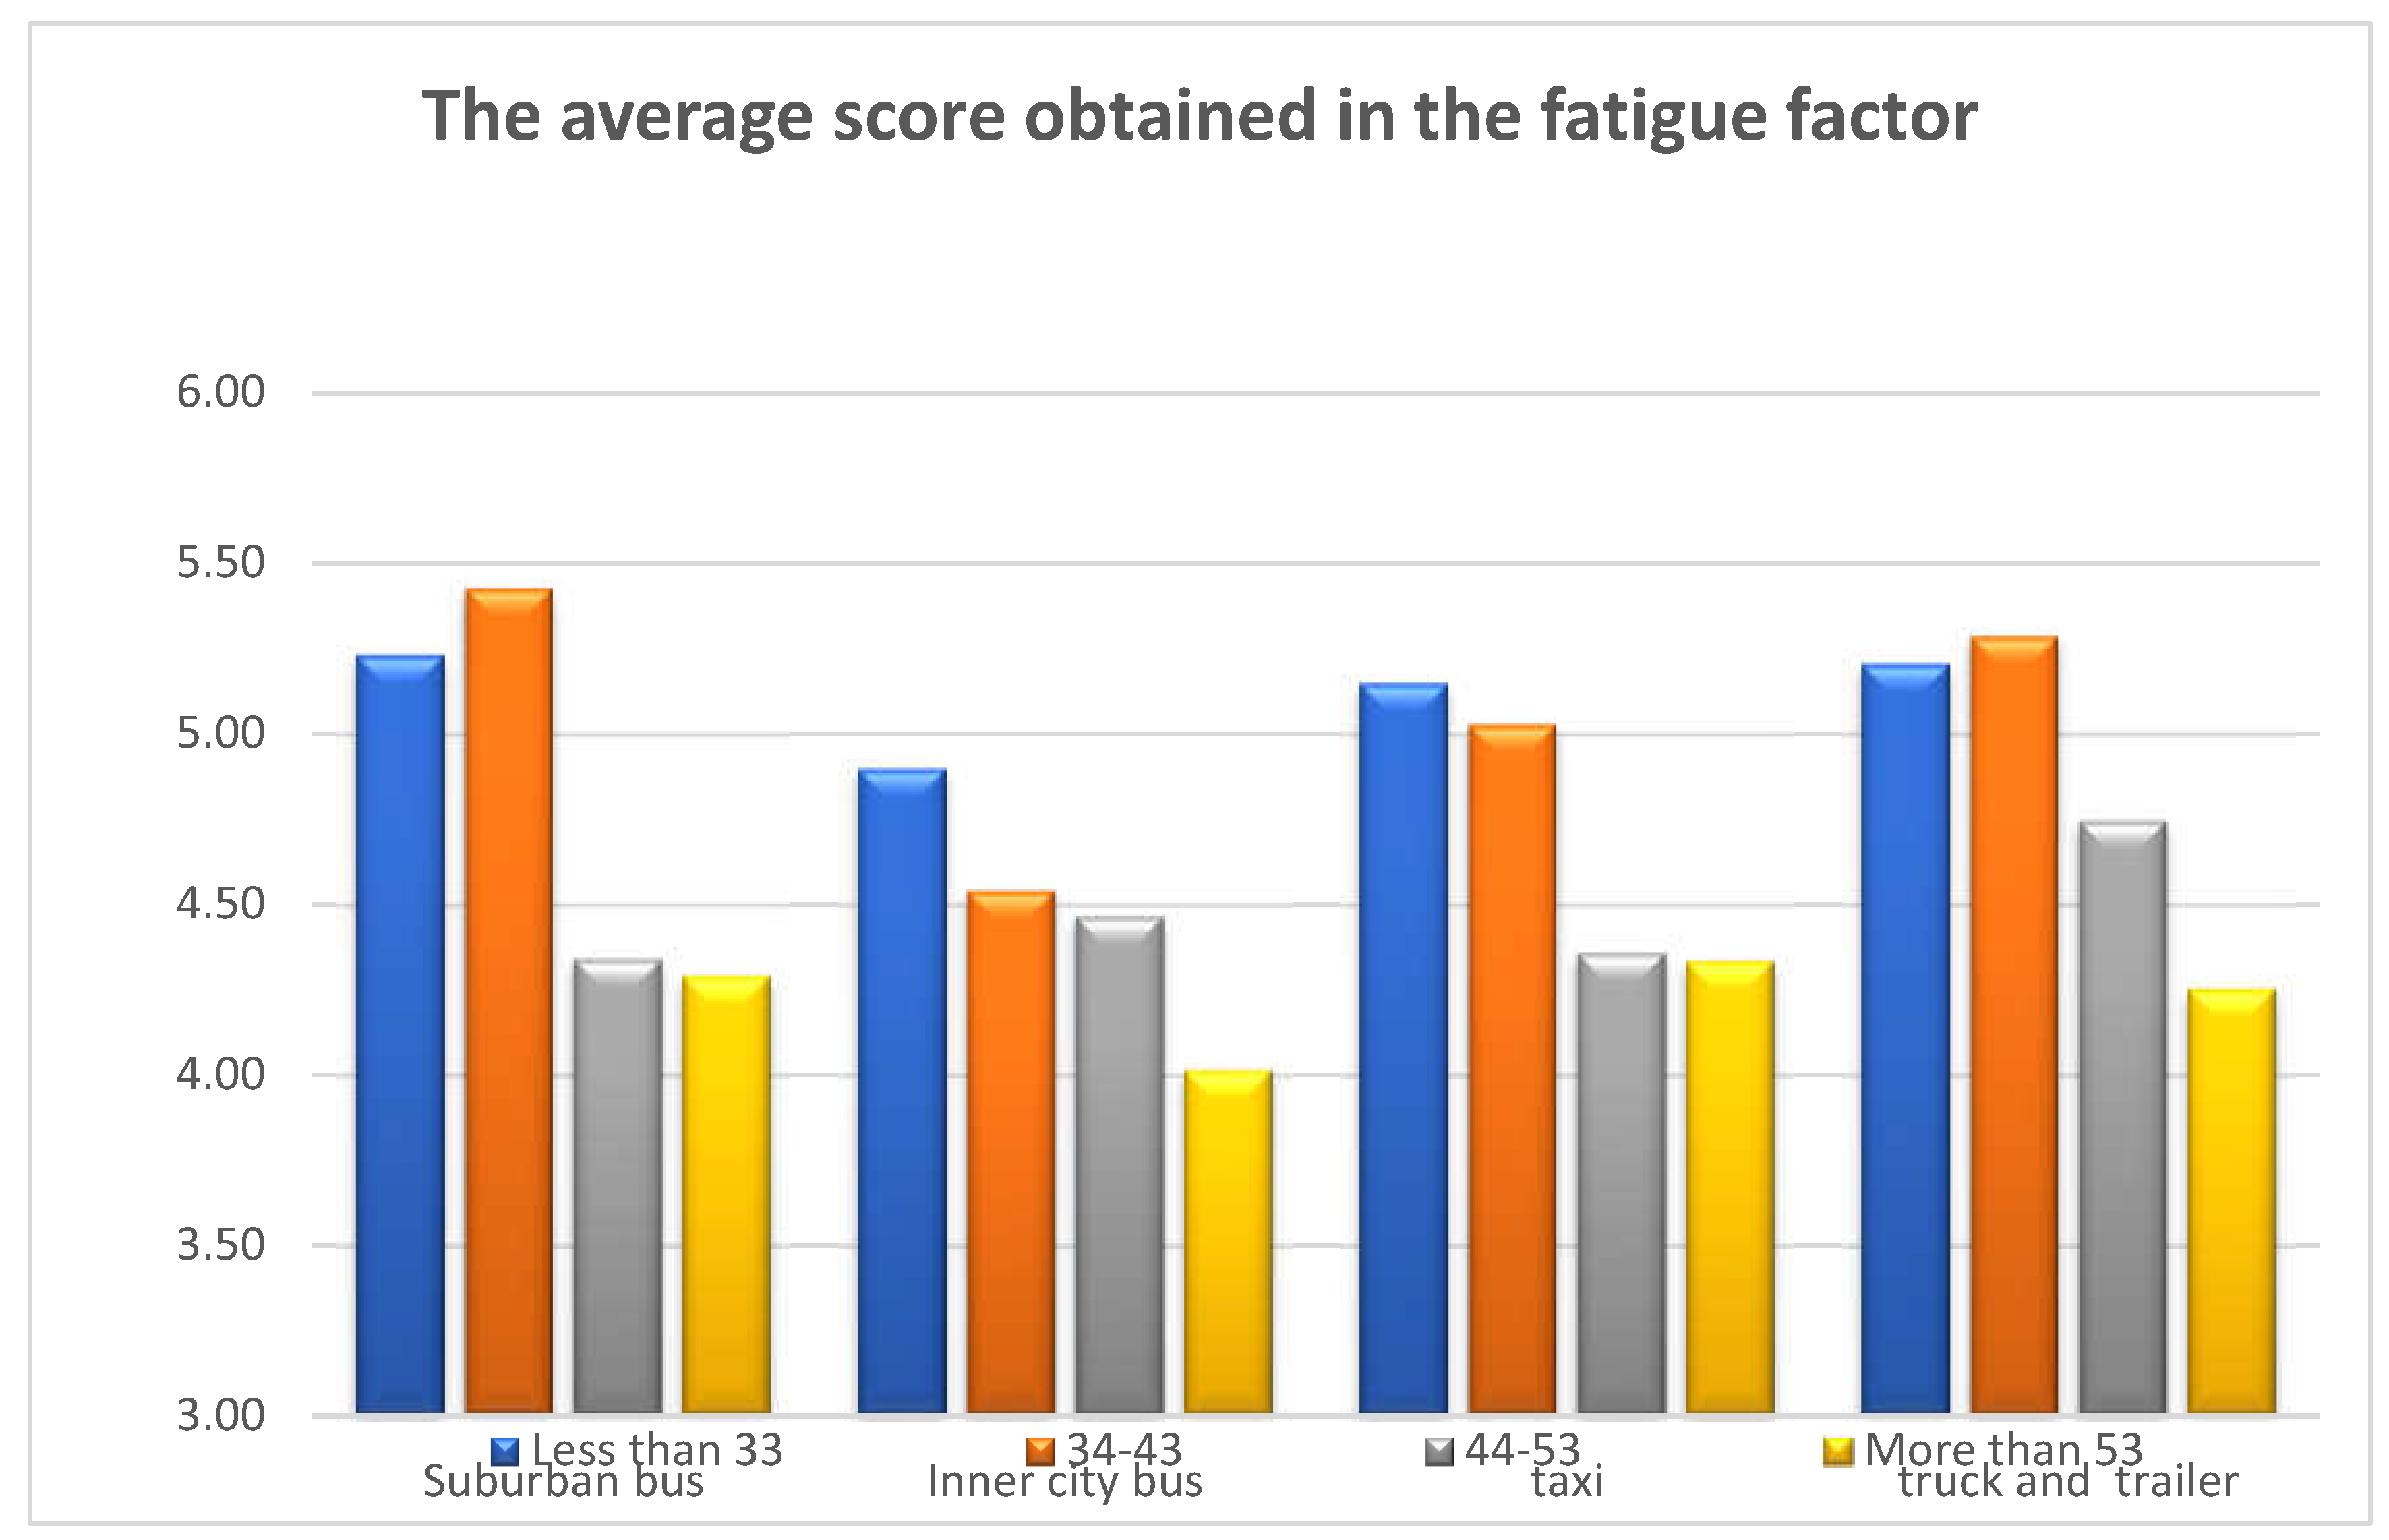
Figure 3.
The relationship between age and relaxation factor in driving by driver group.
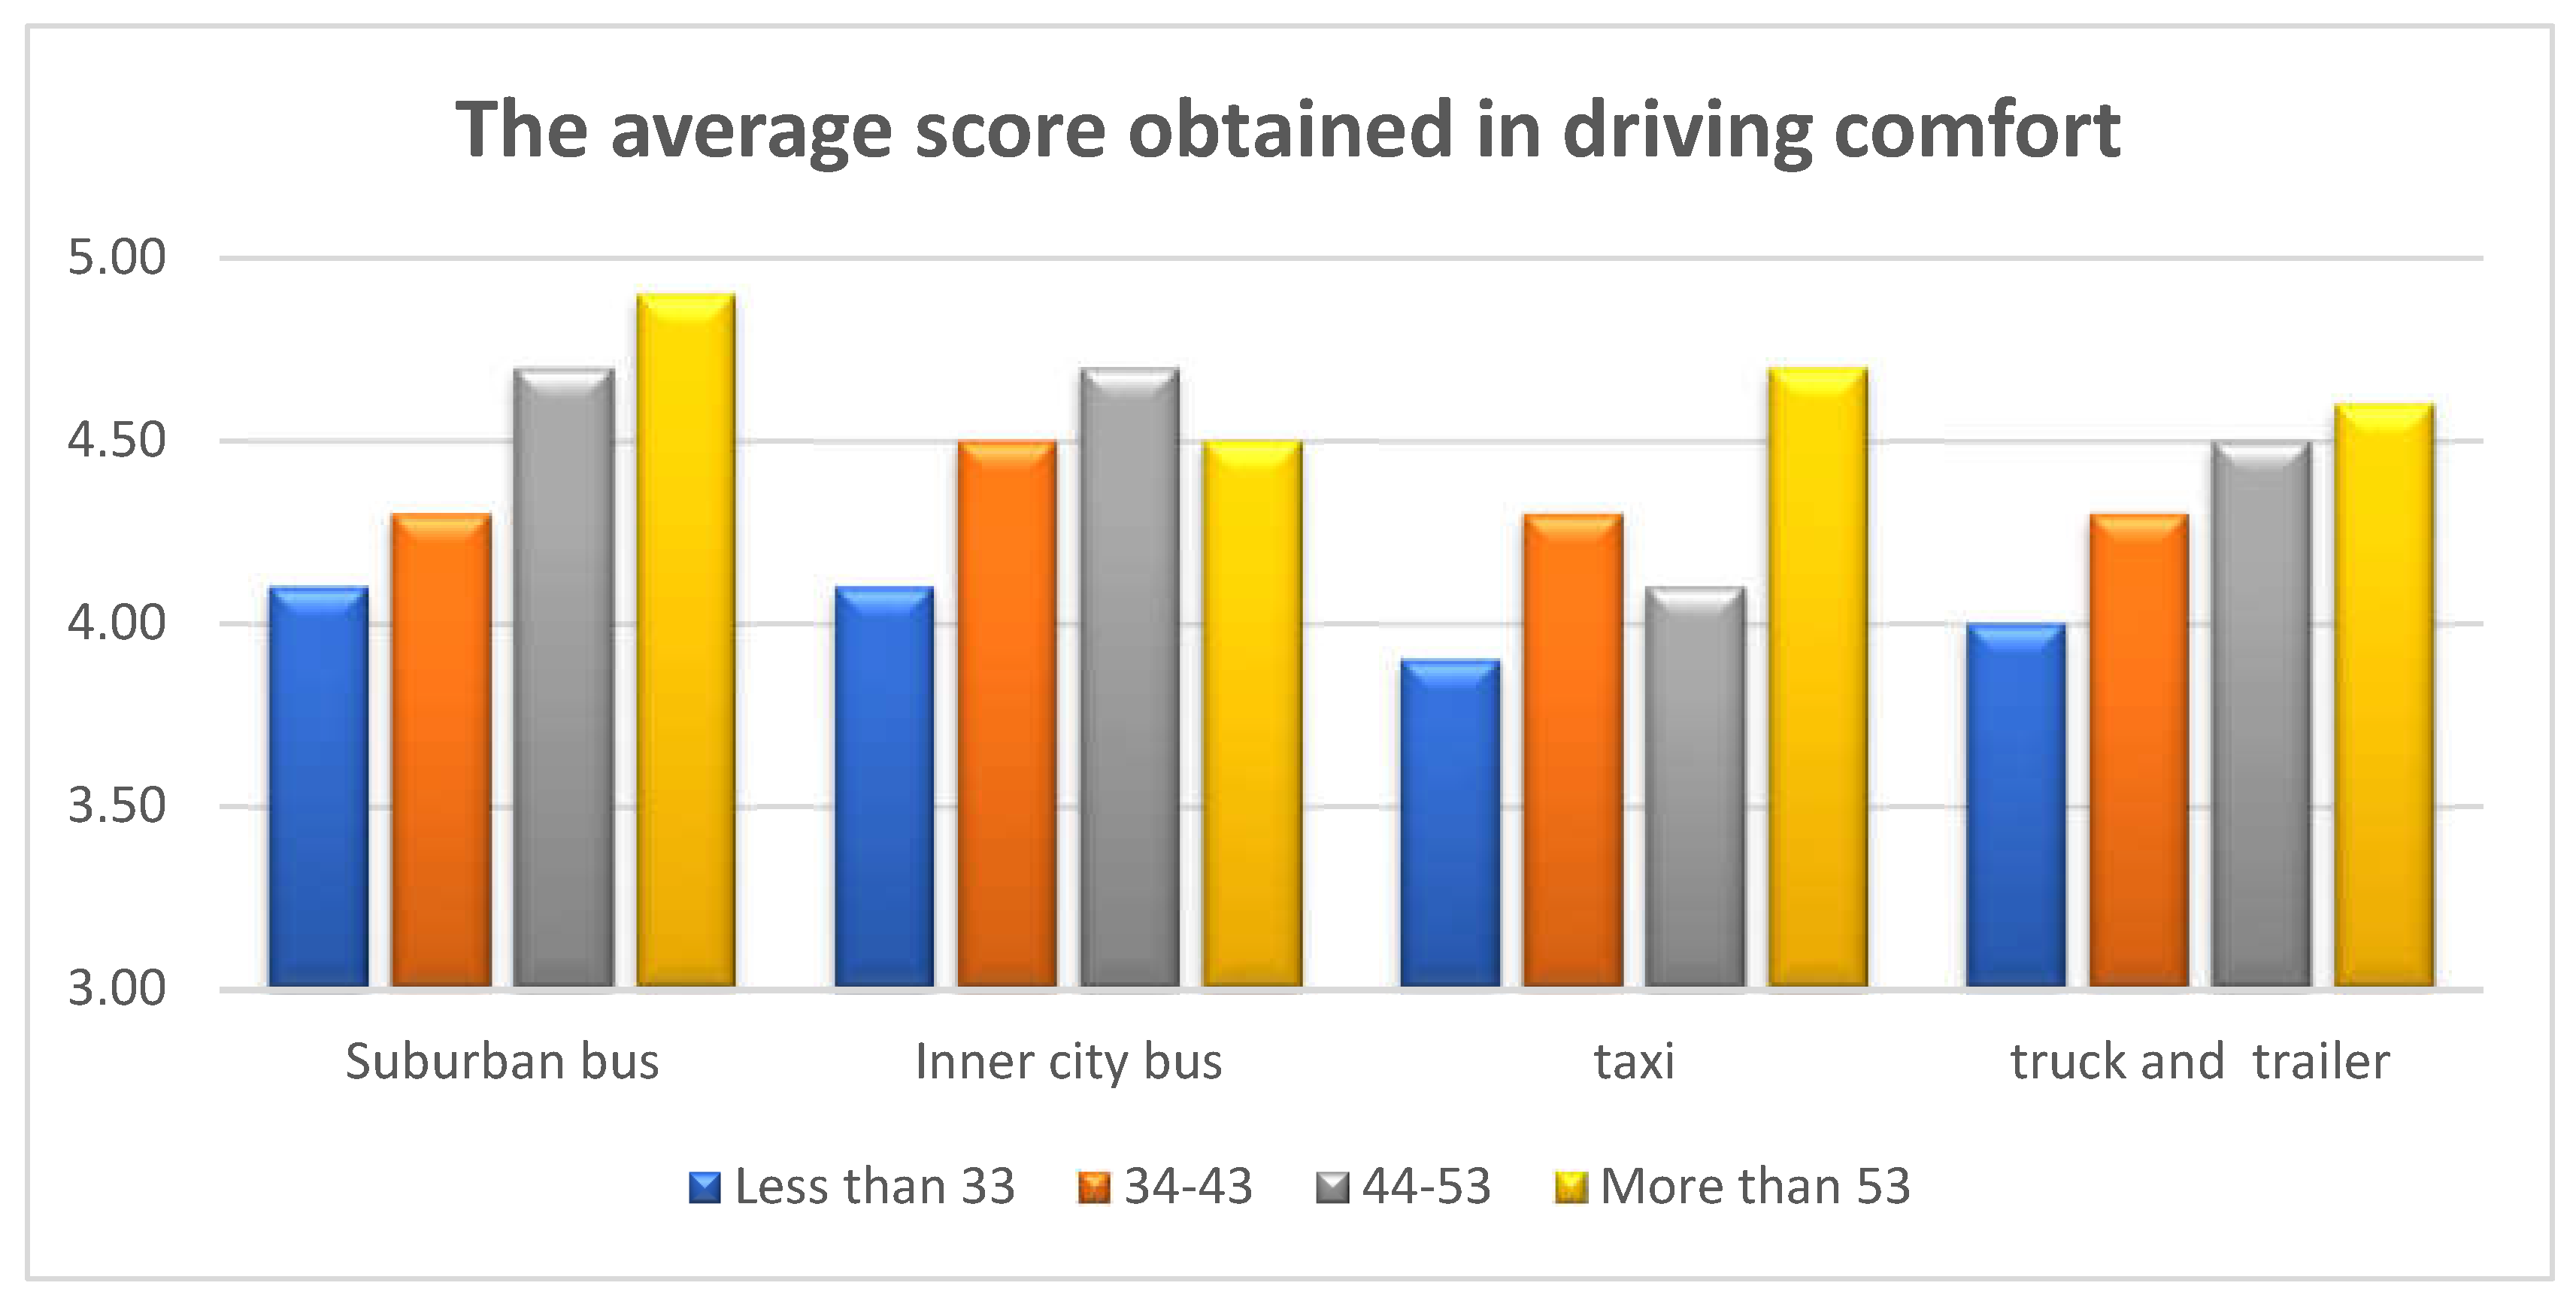
Figure 4.
The relationship between age and patient driving factor by driver group.
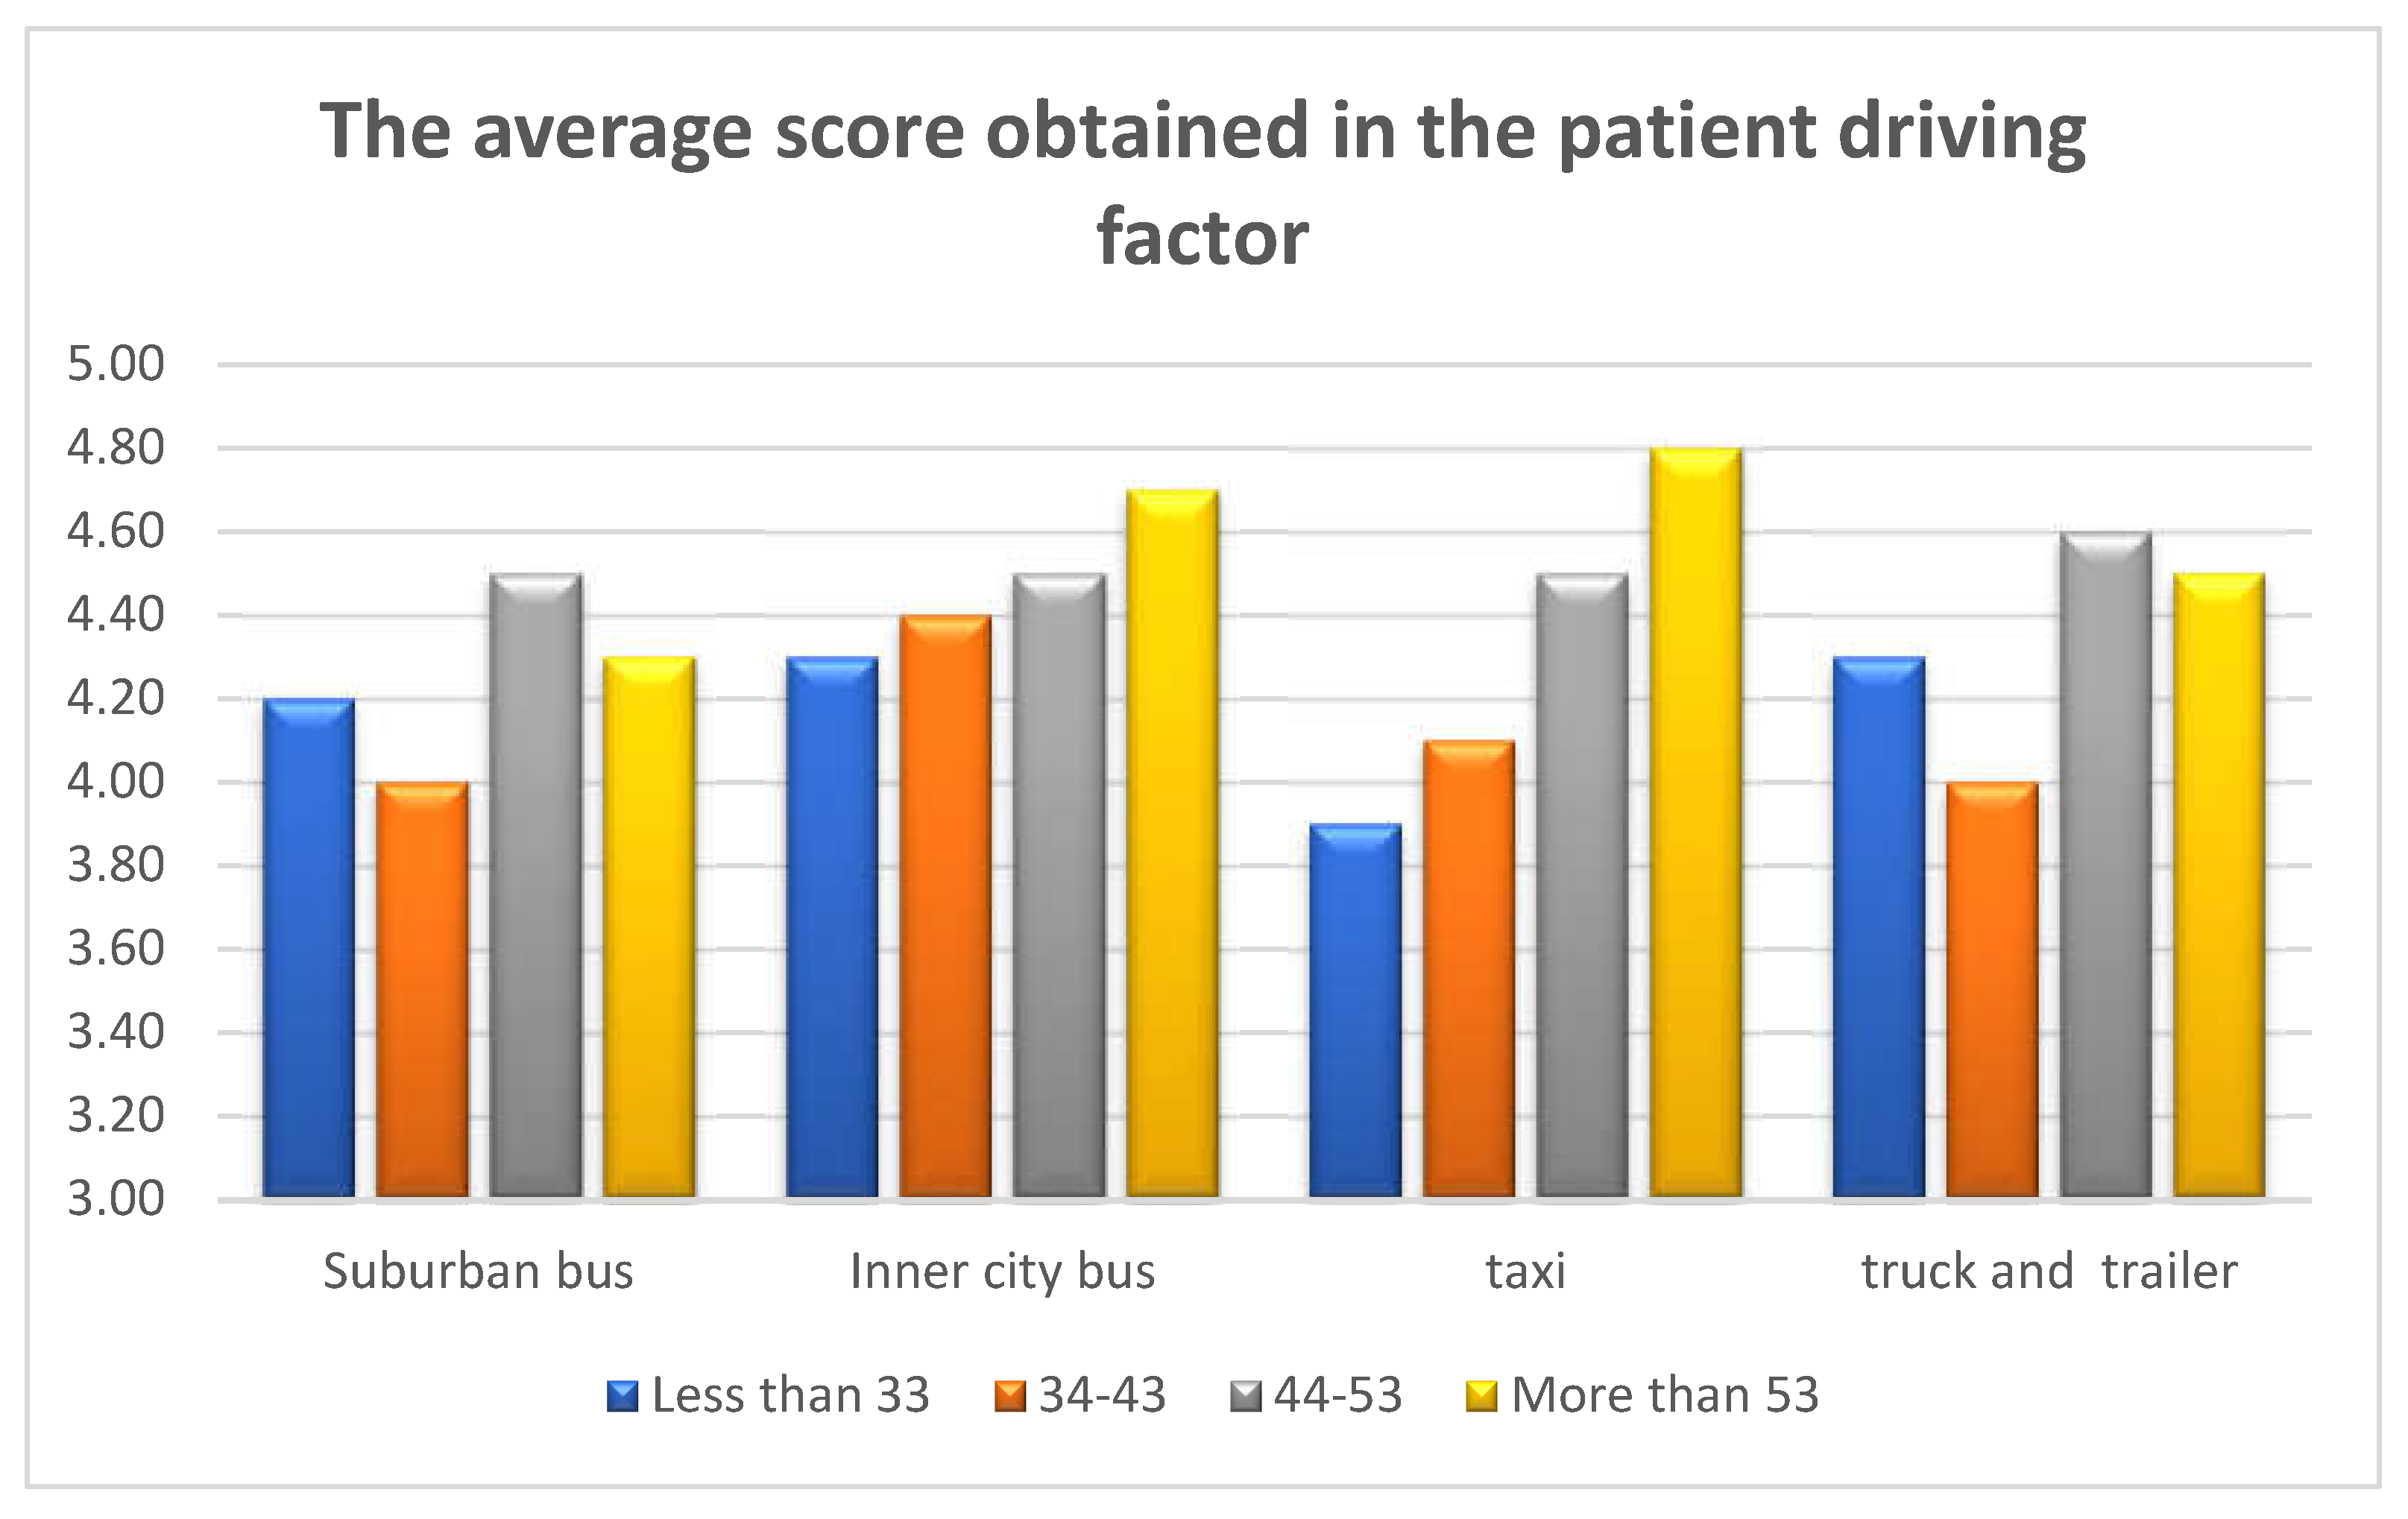
Figure 5.
The relationship between age and sensation seeking factor by driver group.
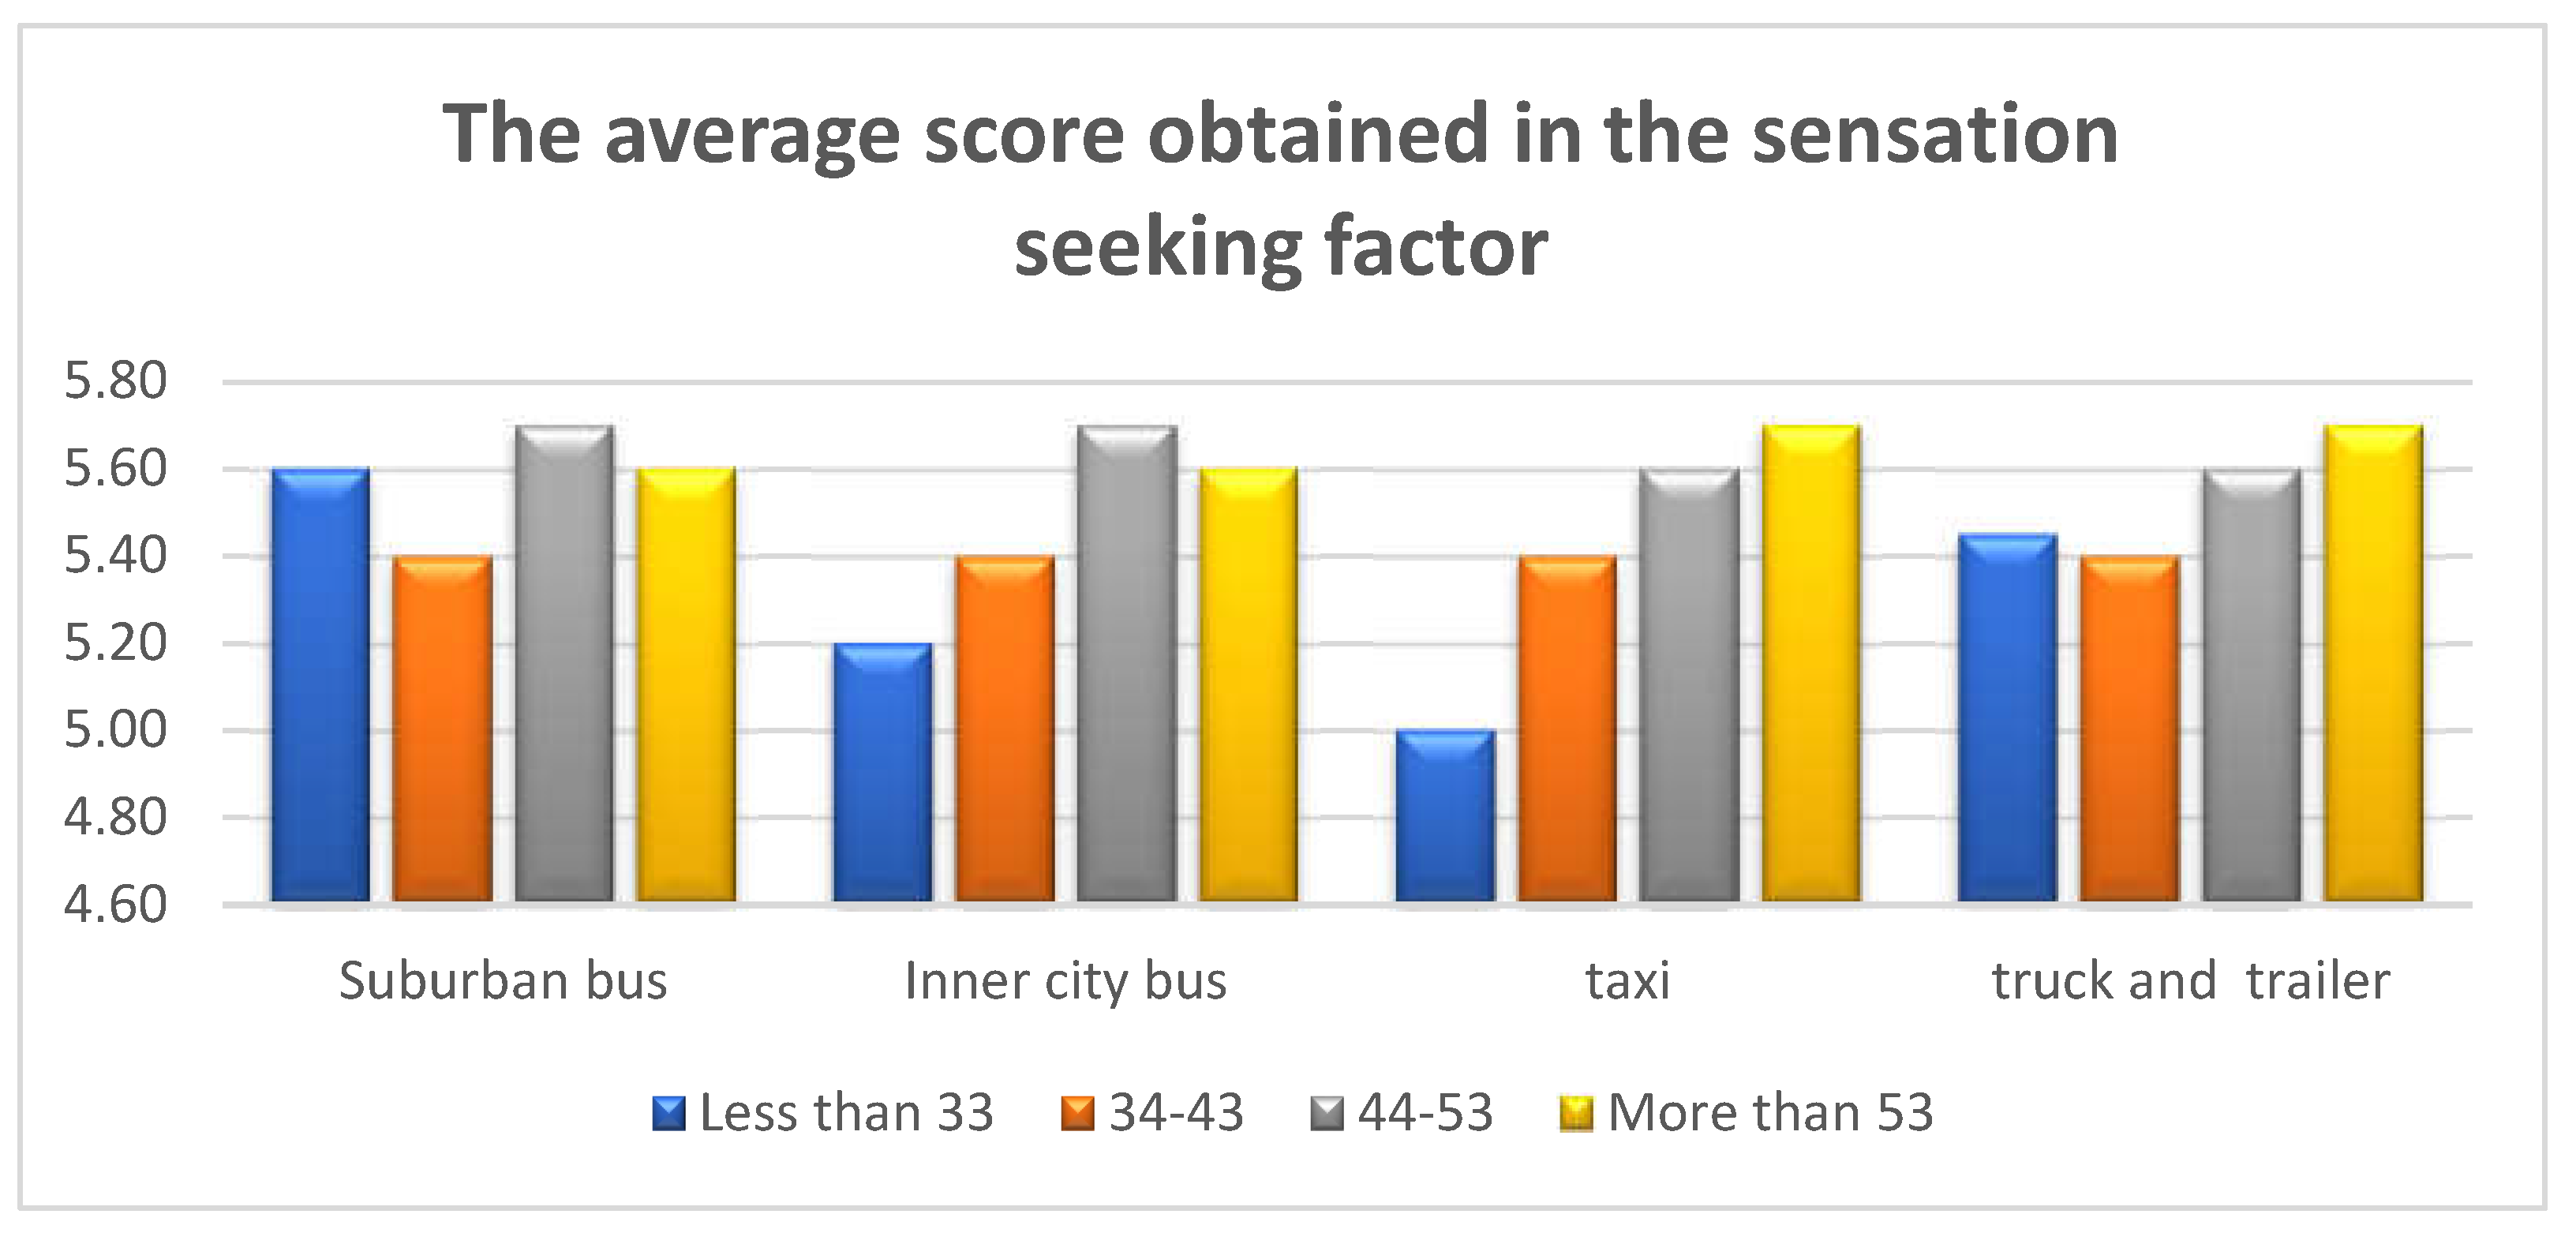
Figure 6.
The relationship between age and risk identification factor by driver group.
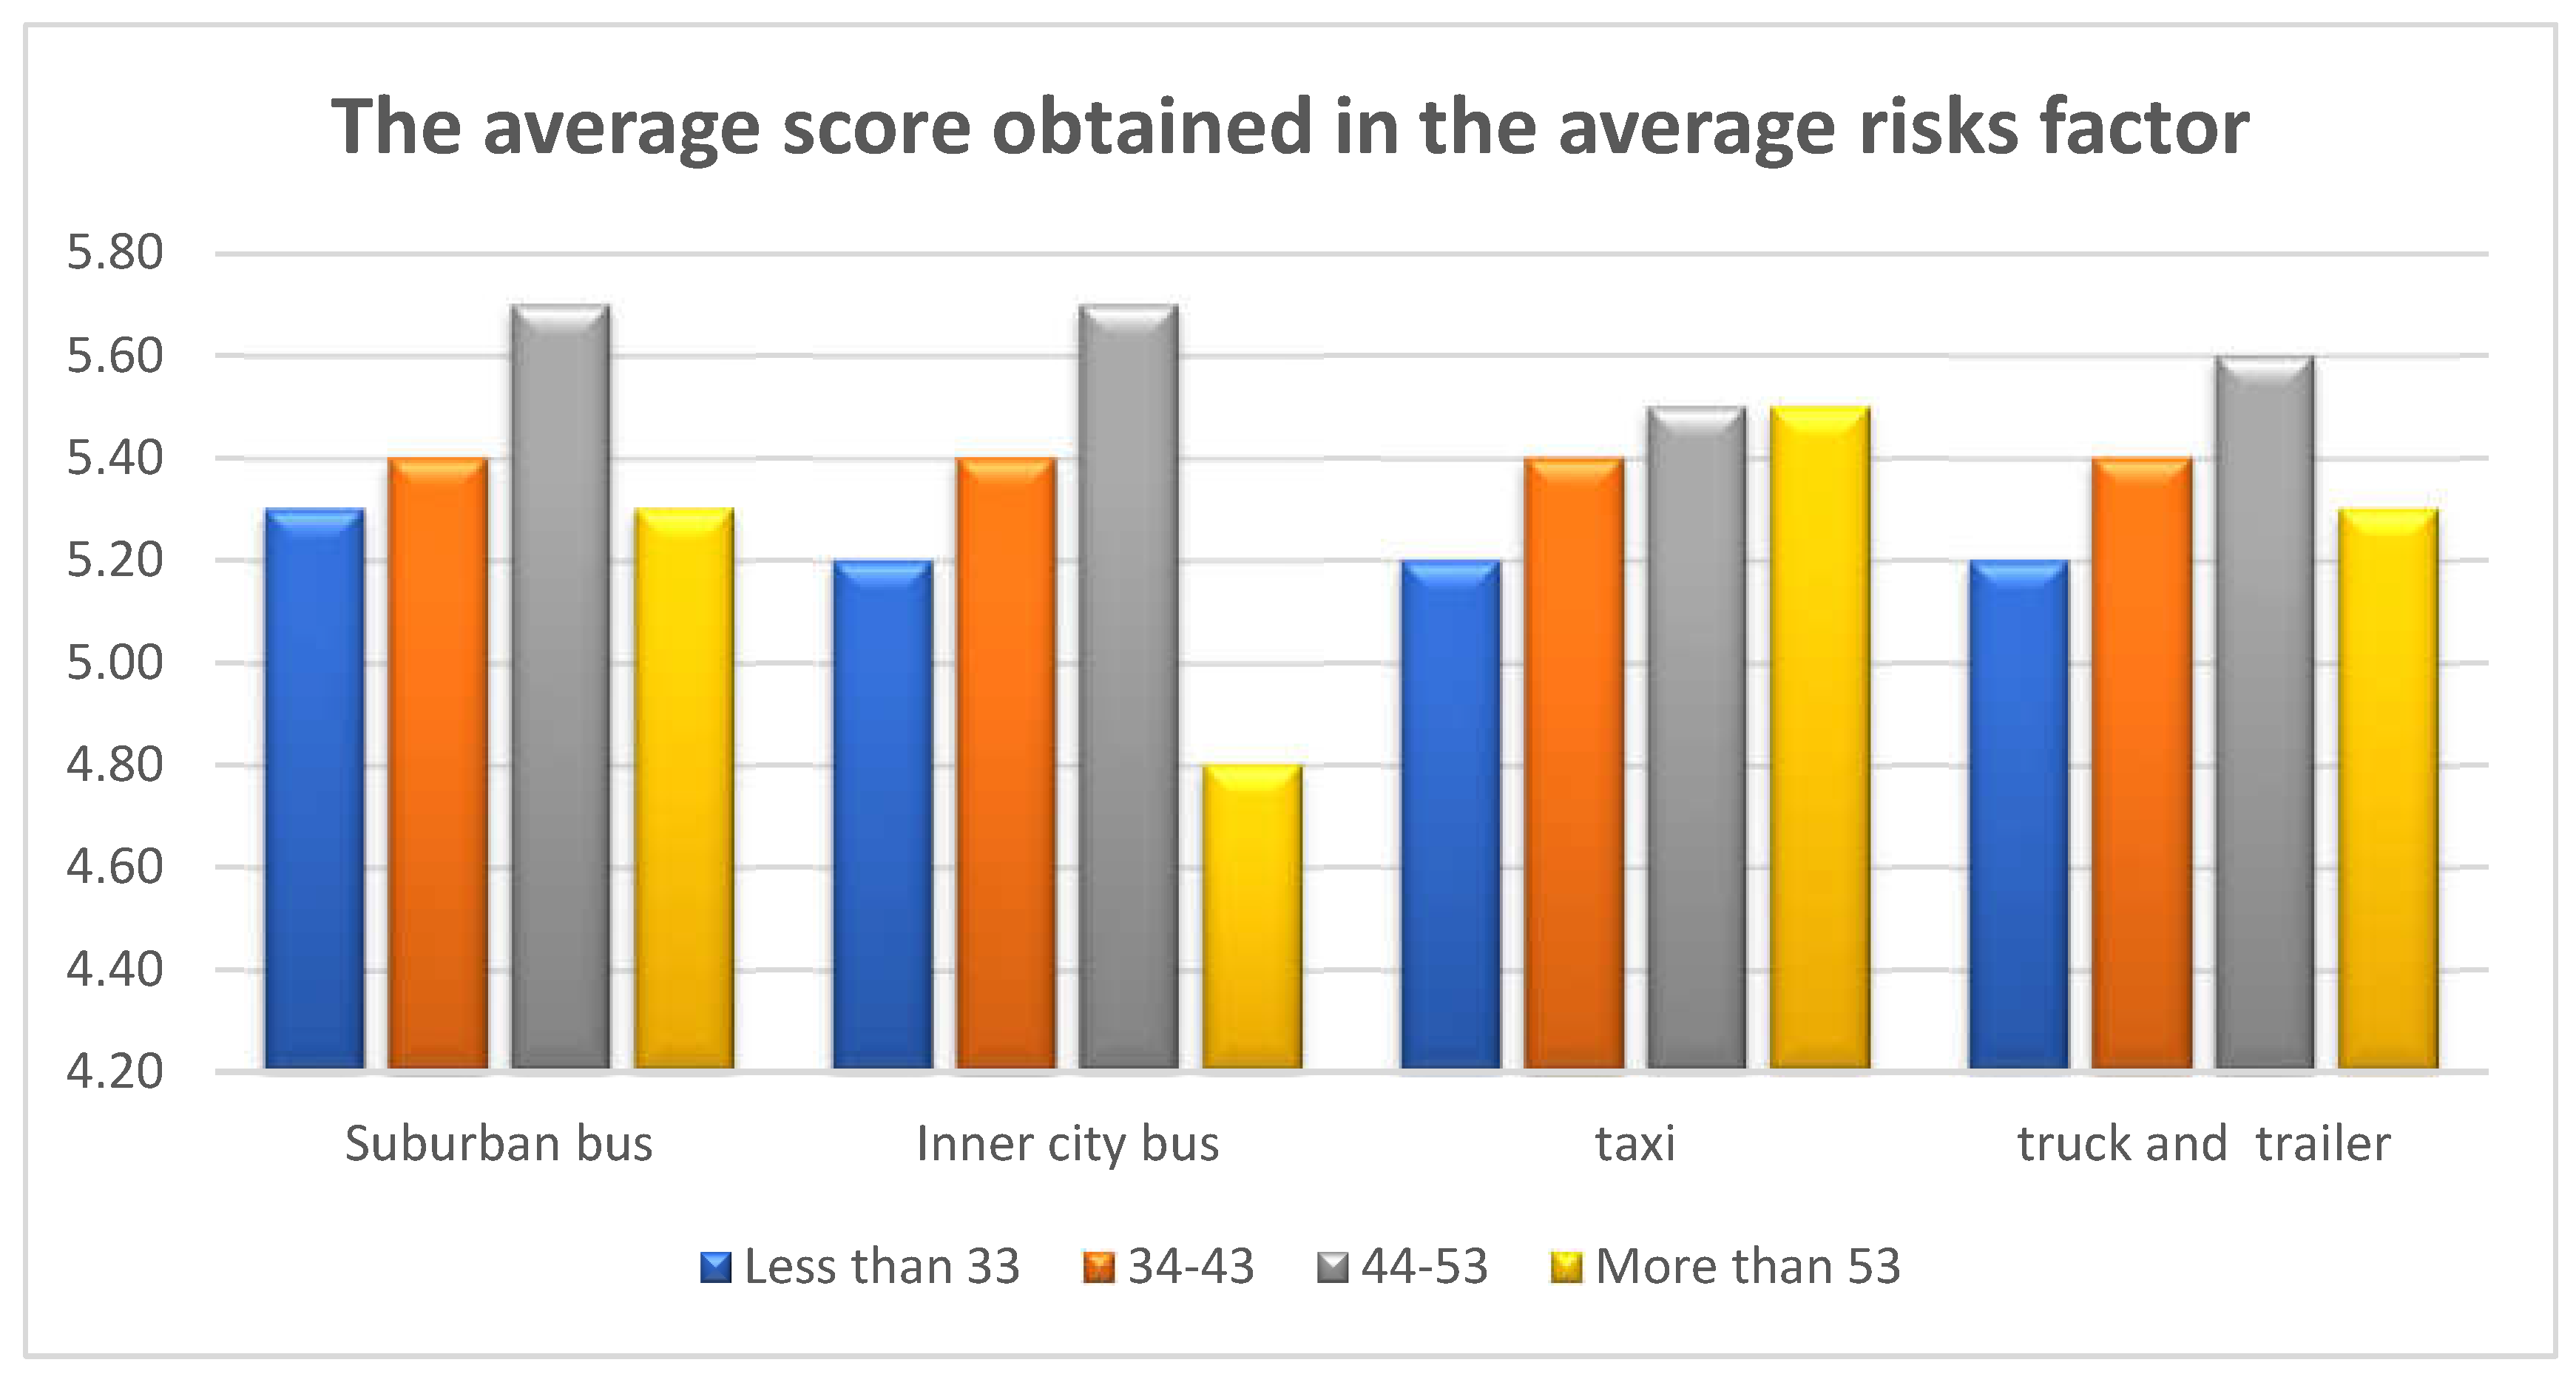
Figure 7.
The relationship between age and the factor of distracted driving by driver group.
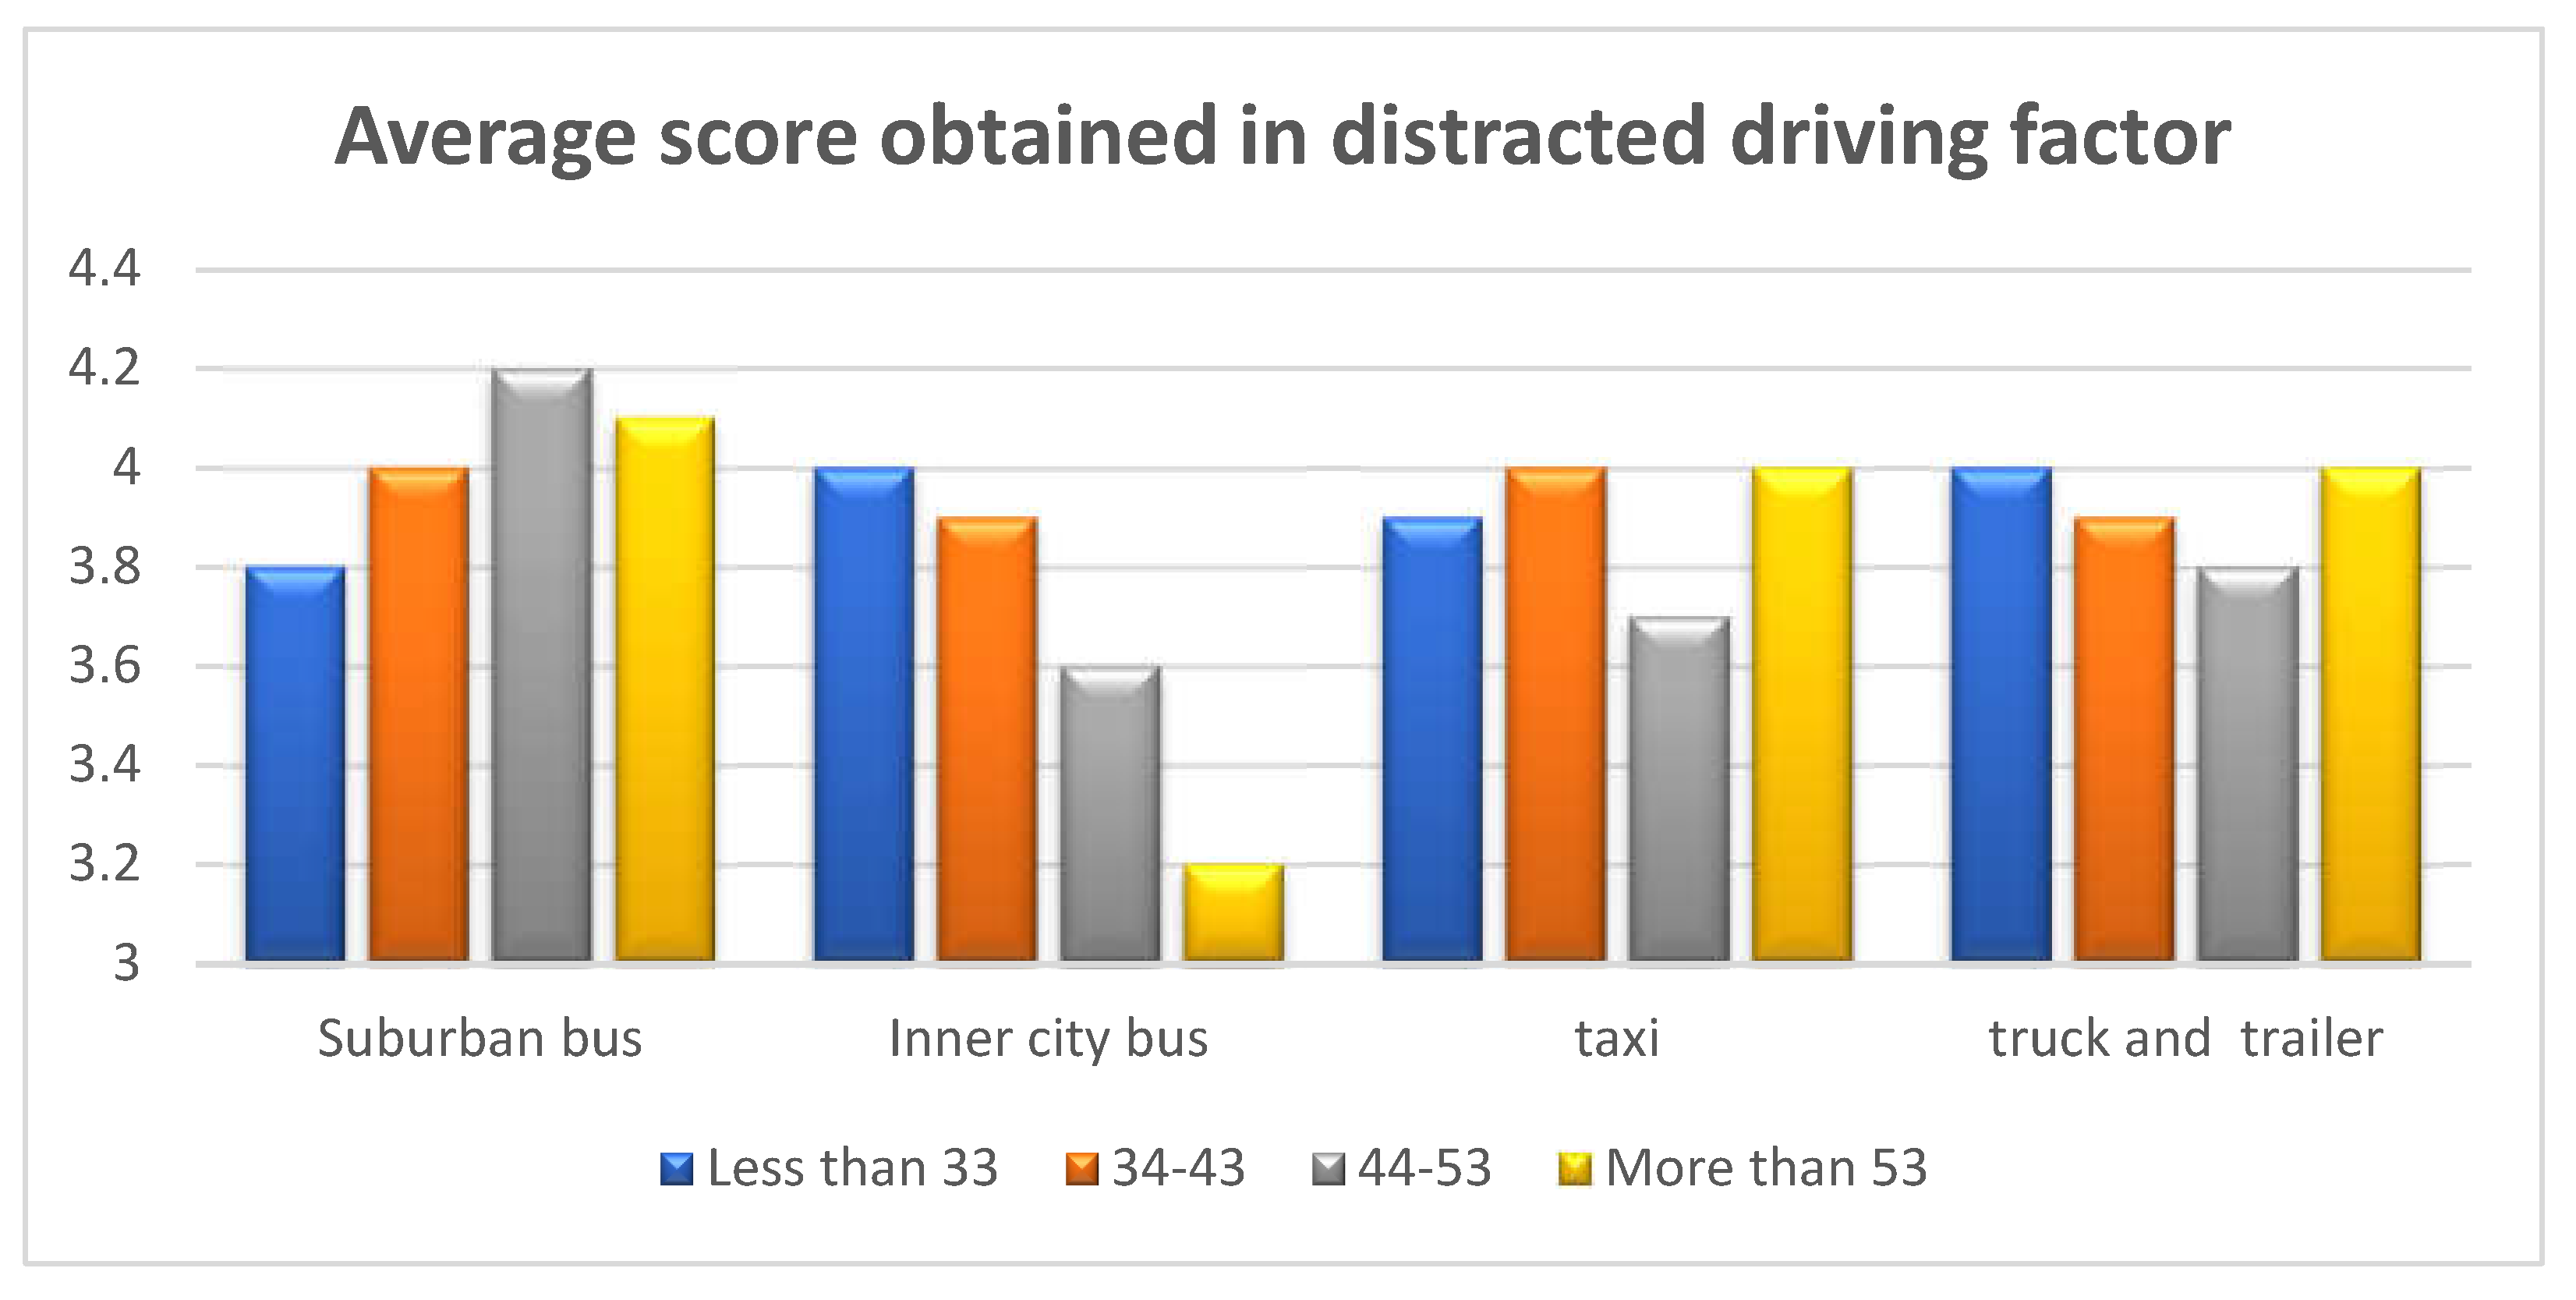
Figure 8.
The average score obtained in six factors.

Figure 9.
The relationship between education and six factors.
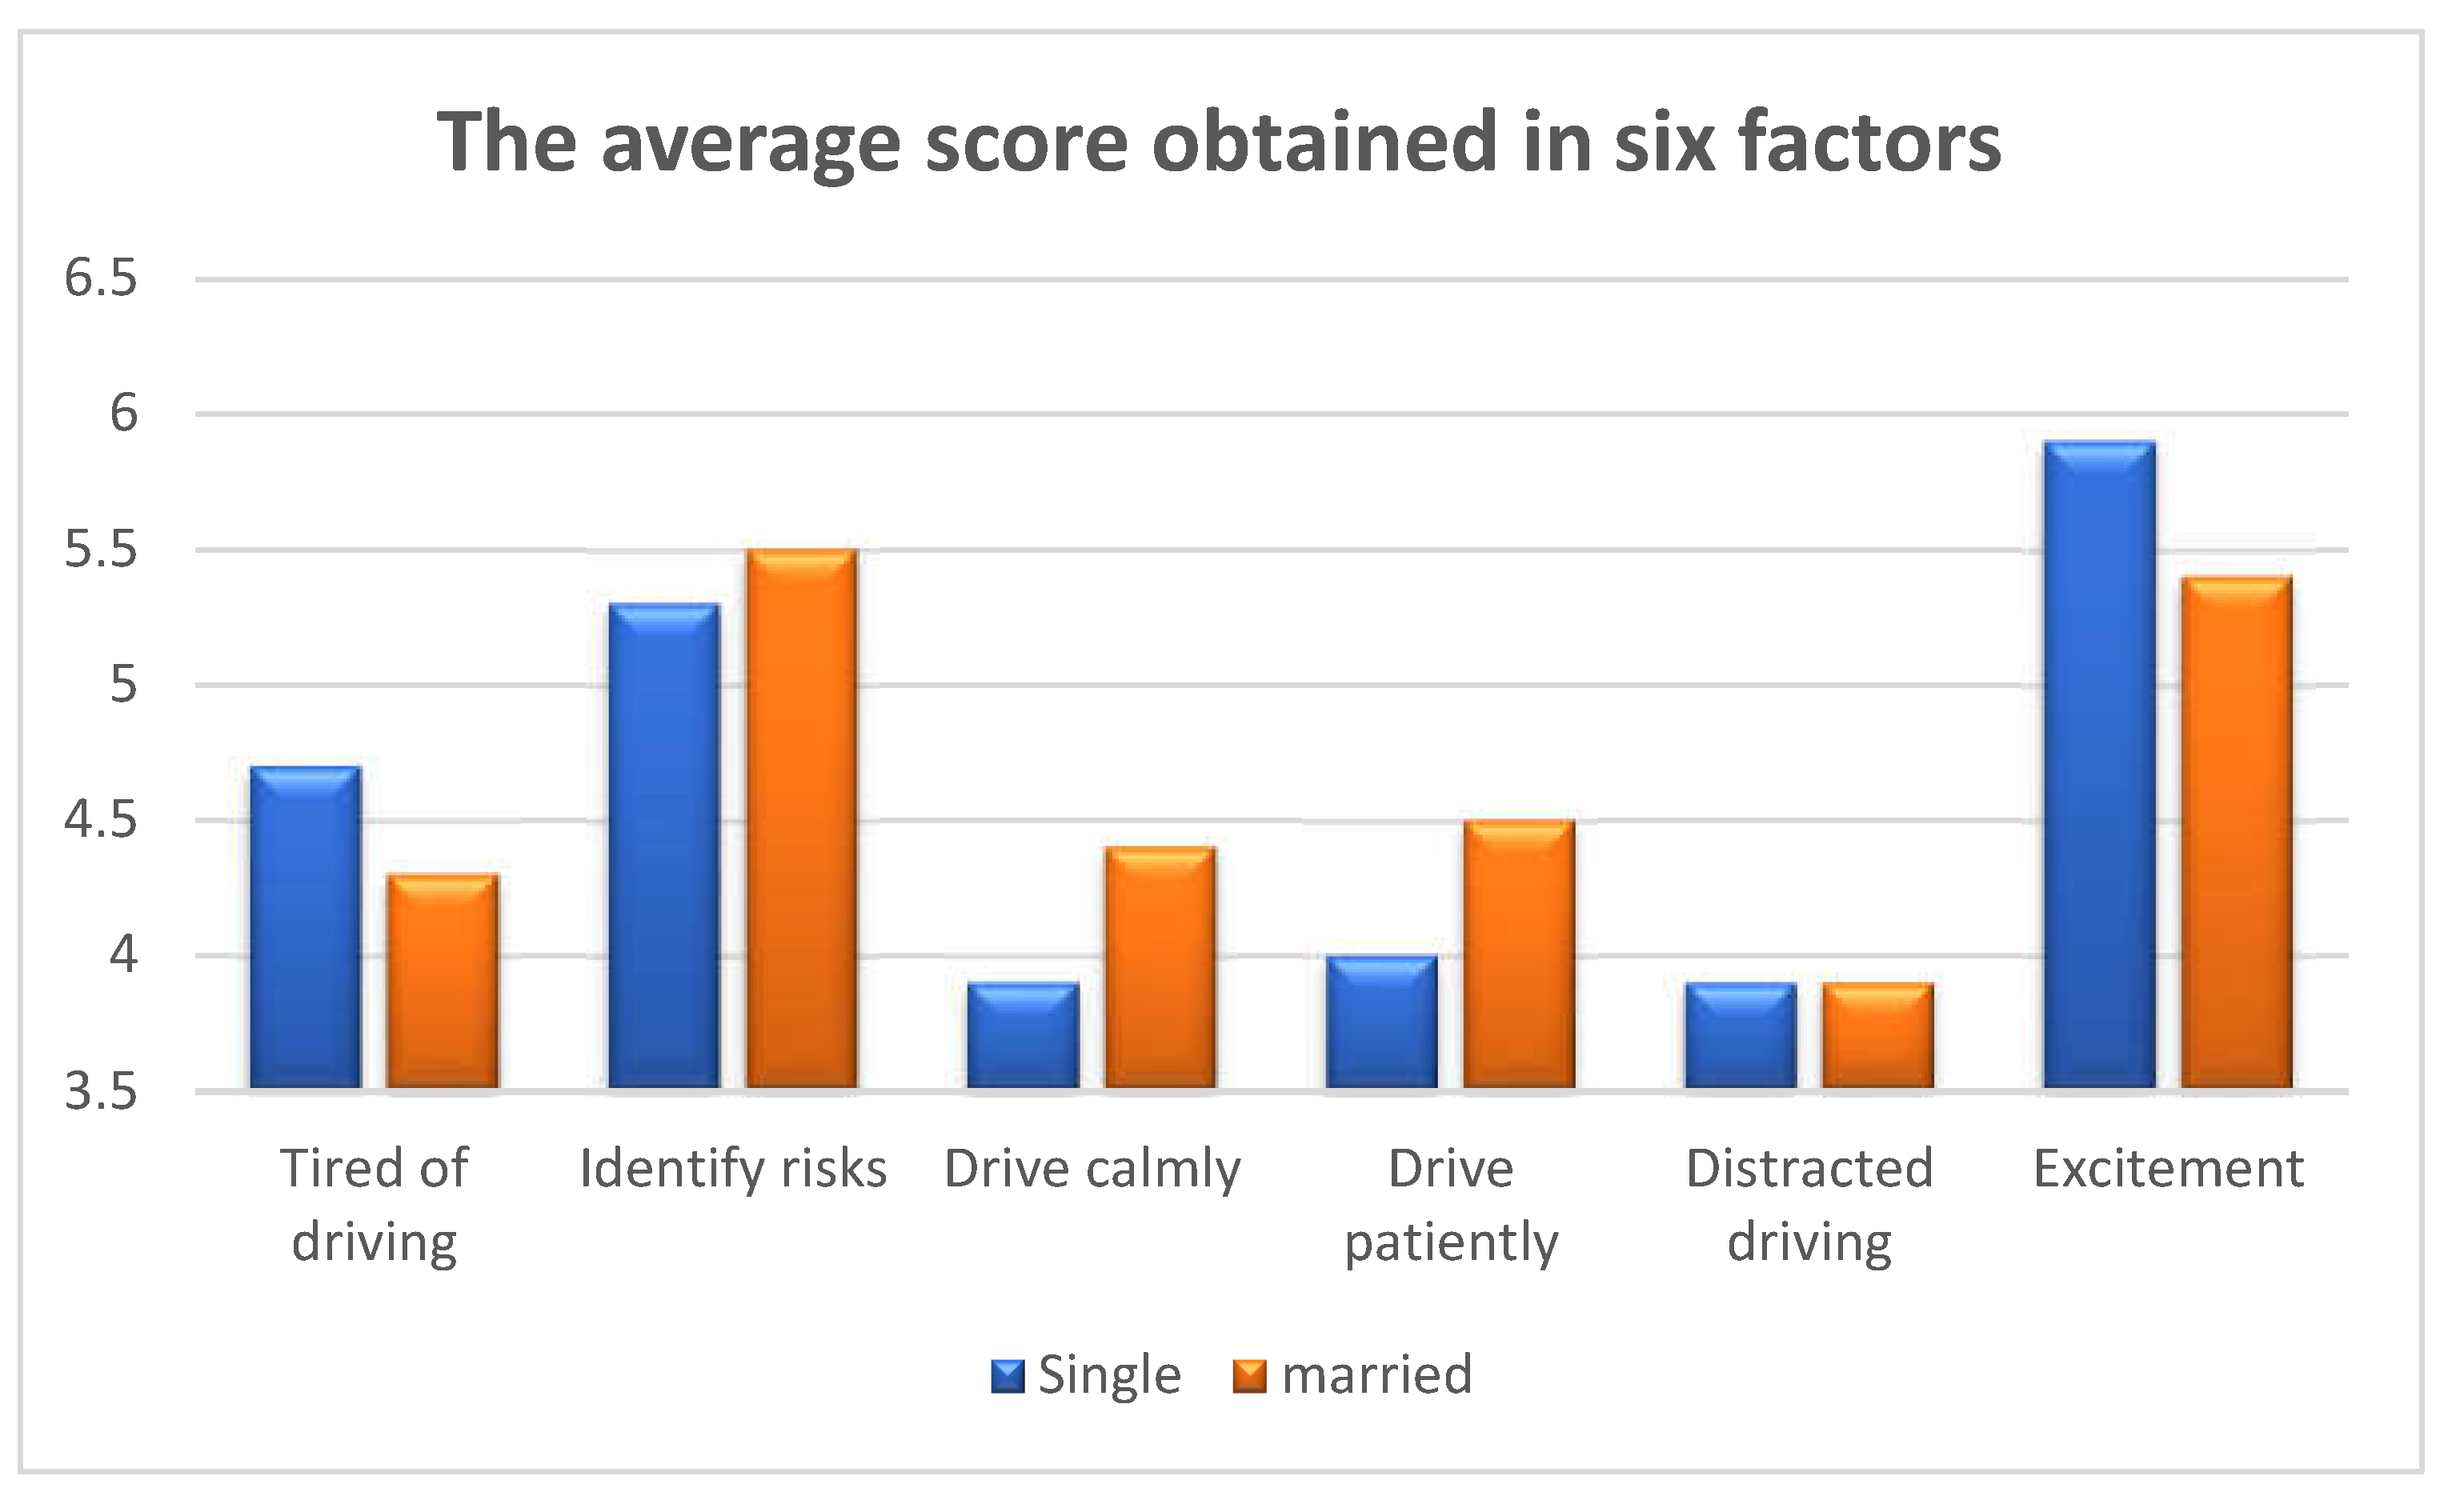
Figure 10.
The relationship between education status and fatigue factor by driver group.
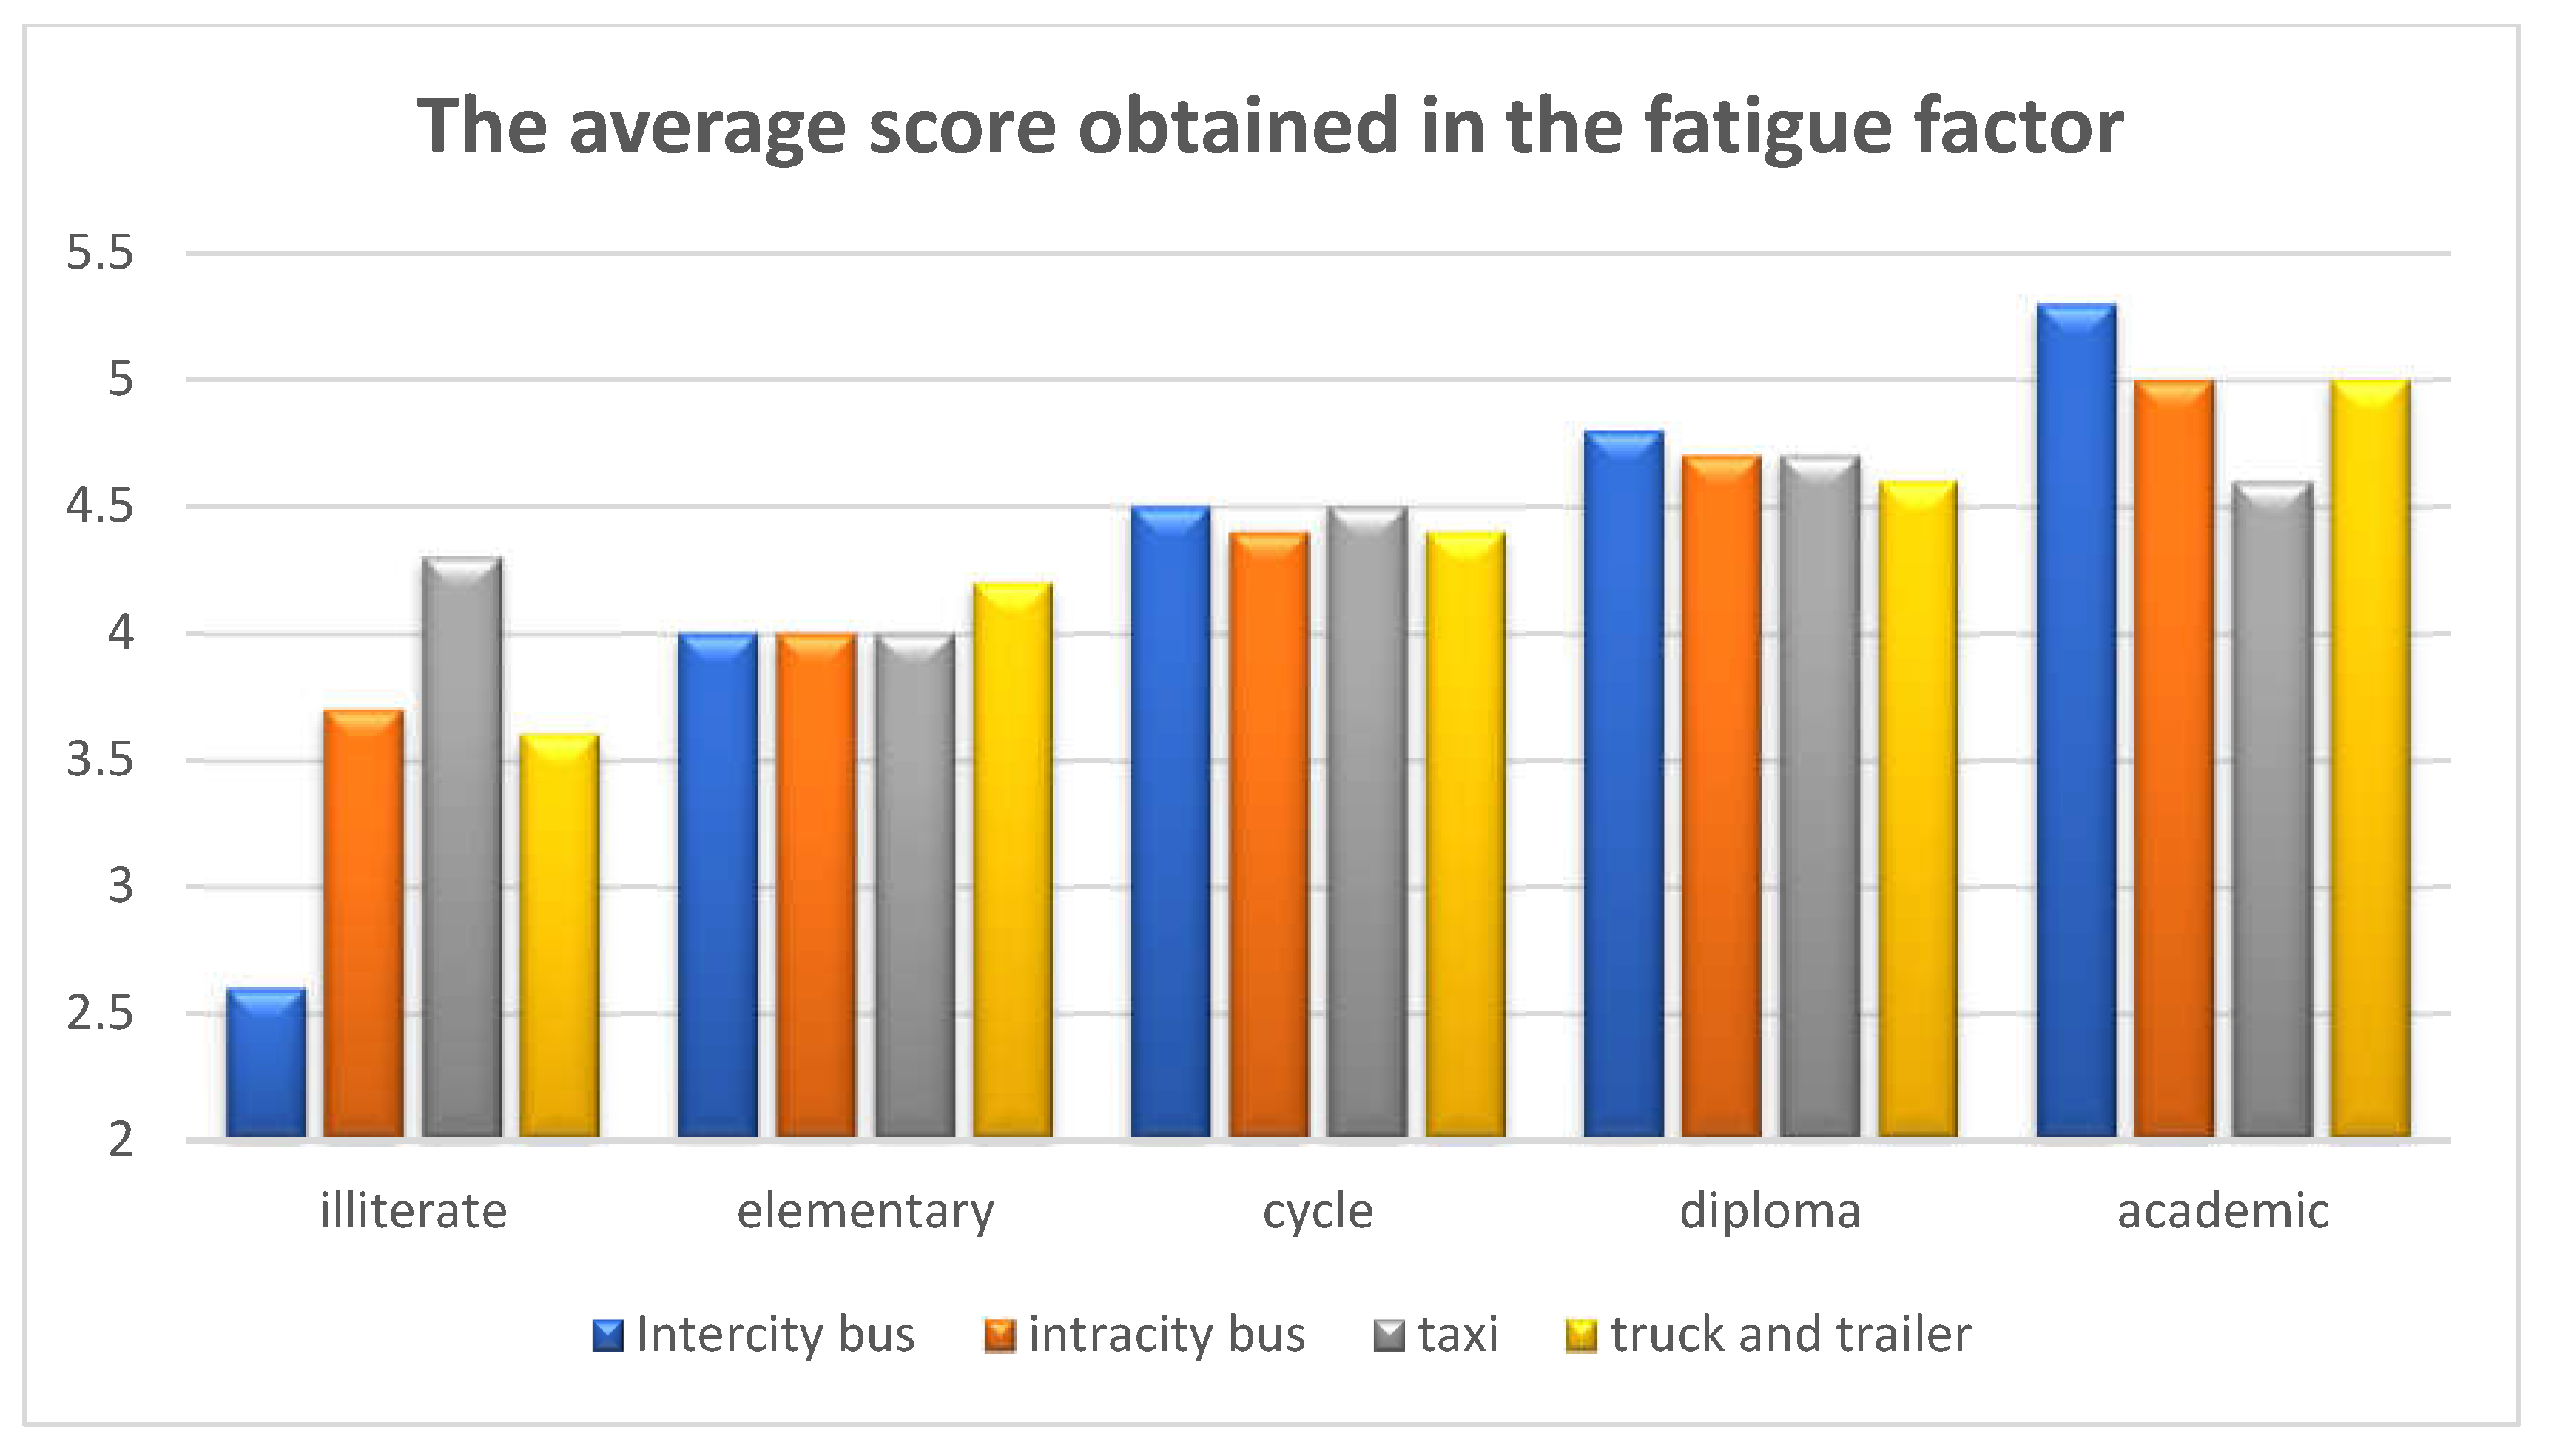
Figure 11.
The relationship between education status and relaxation factor by driver group.
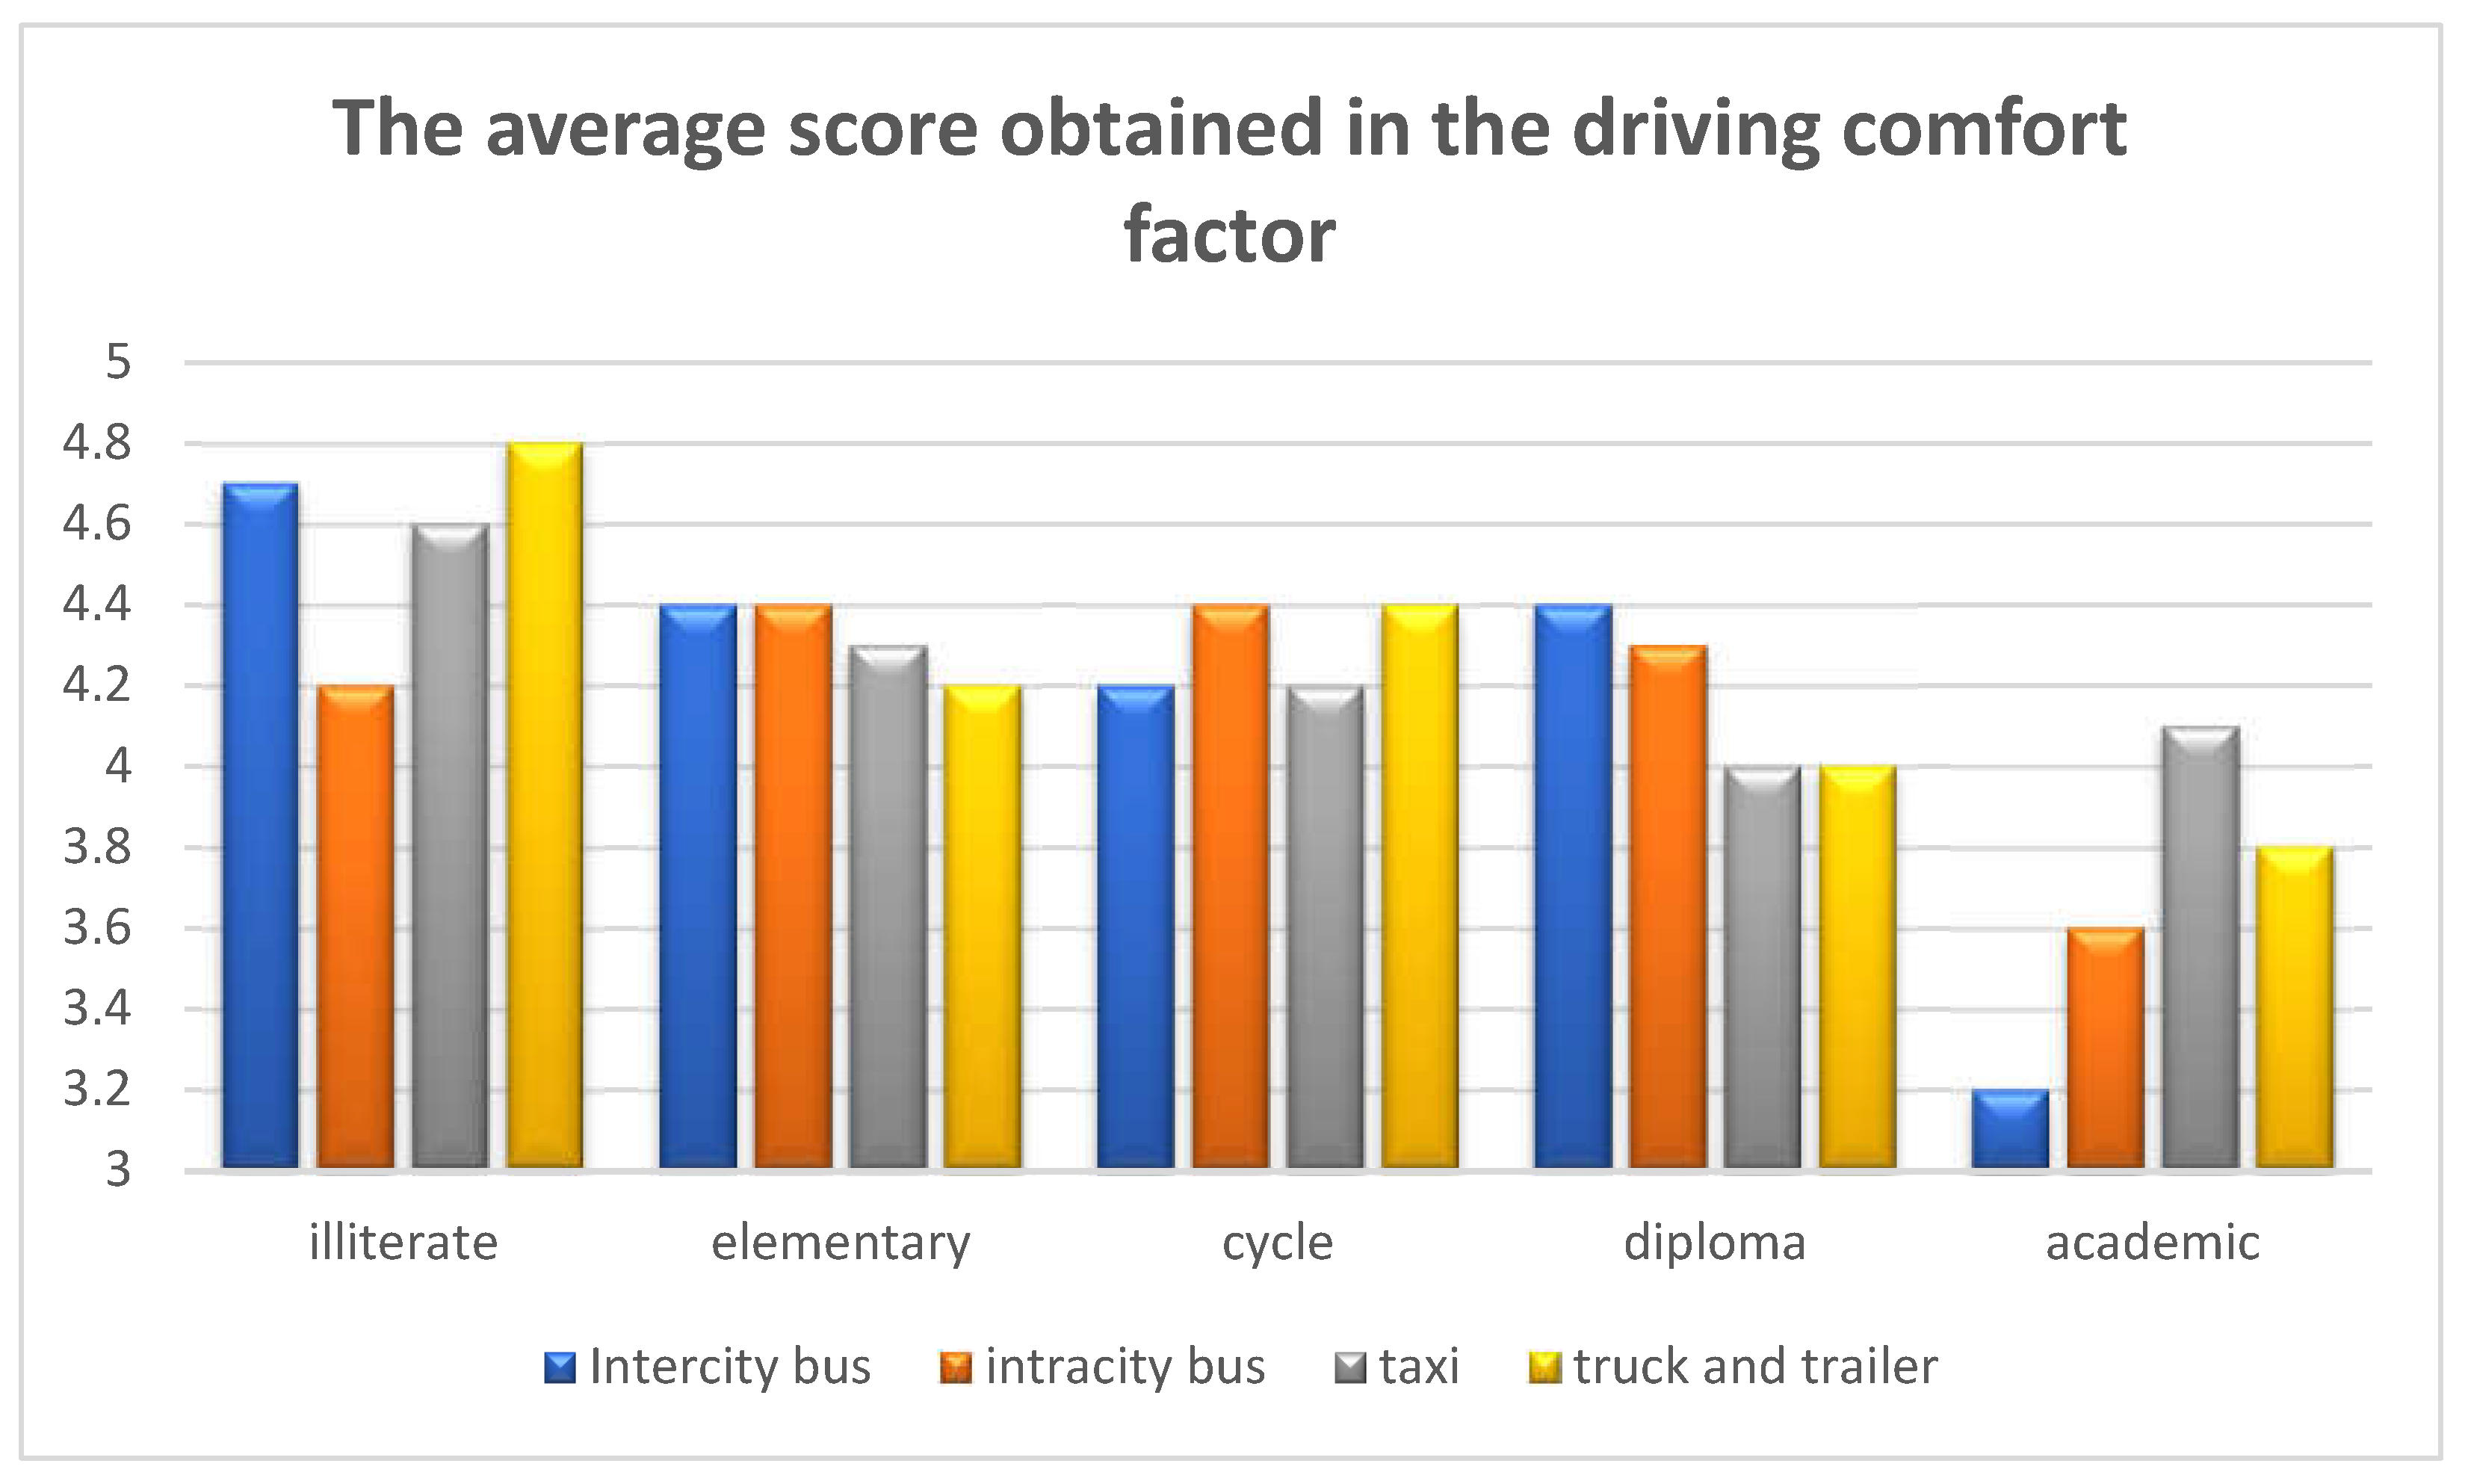
Figure 12.
The relationship between education status and patient driving factor by driver group.
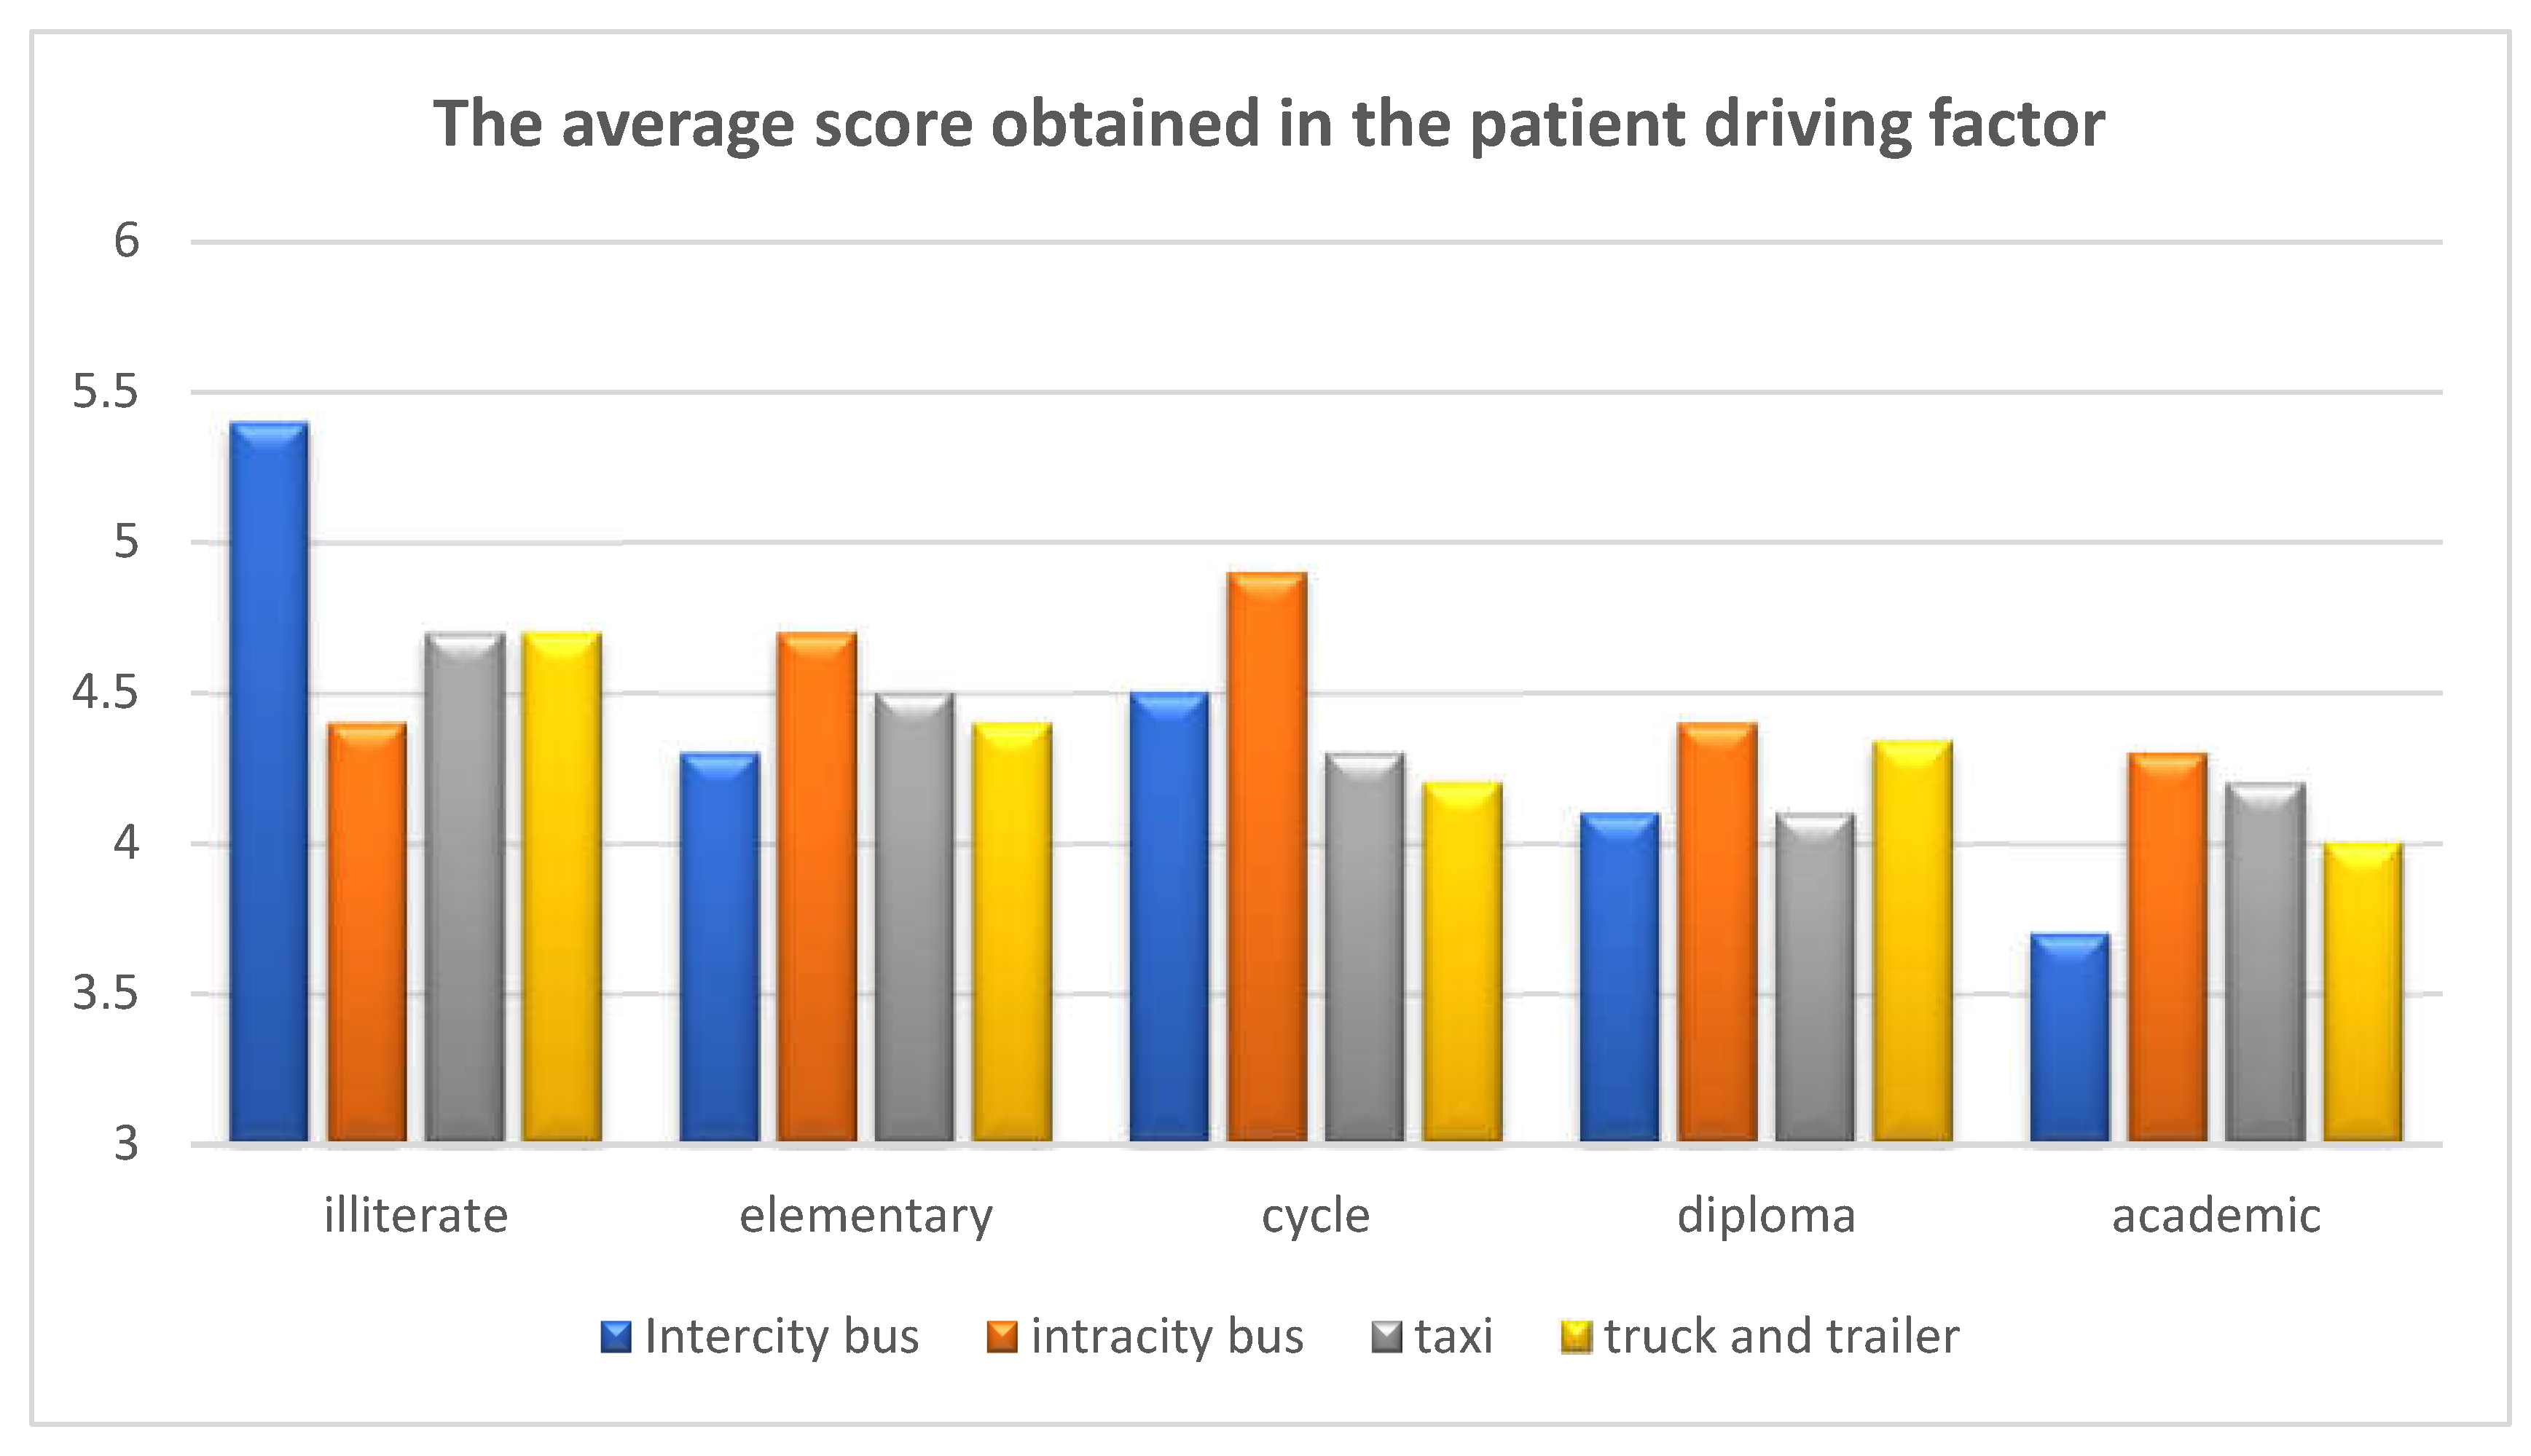
Figure 13.
The relationship between education status and excitement seeking by the group of drivers.
Figure 13.
The relationship between education status and excitement seeking by the group of drivers.
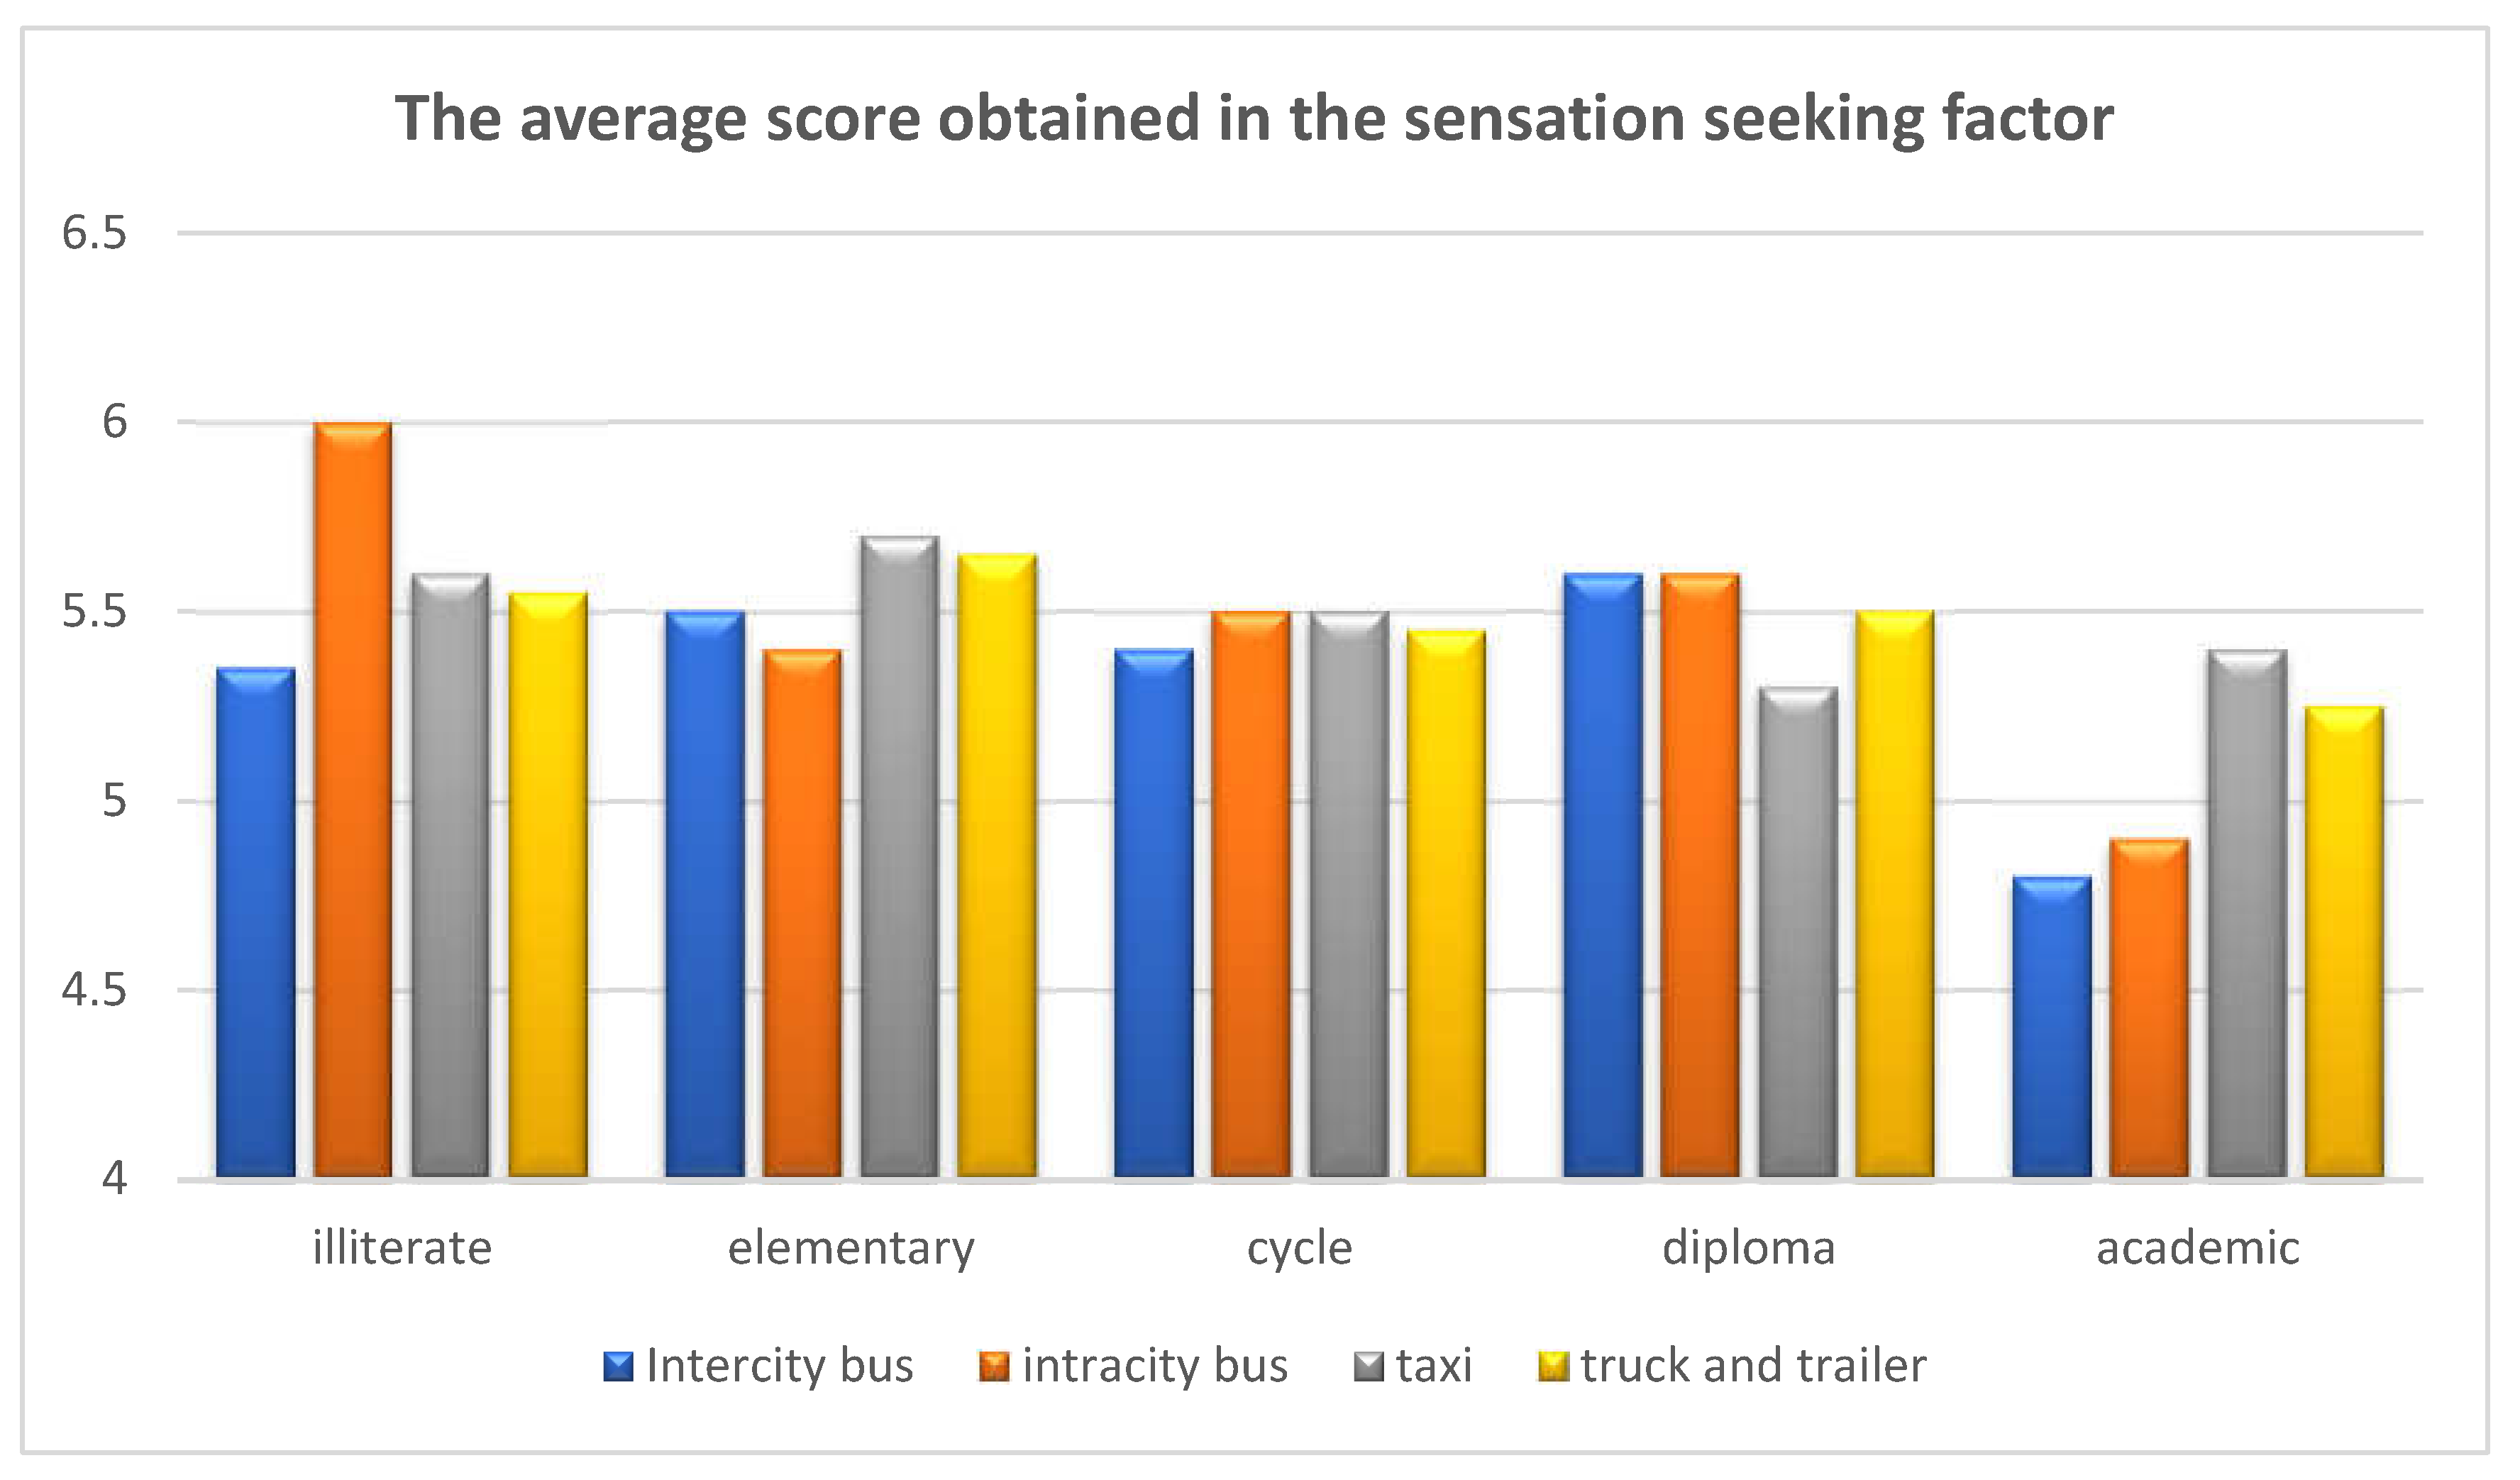
Figure 14.
The relationship between education status and risk identification factor by driver group.
Figure 14.
The relationship between education status and risk identification factor by driver group.
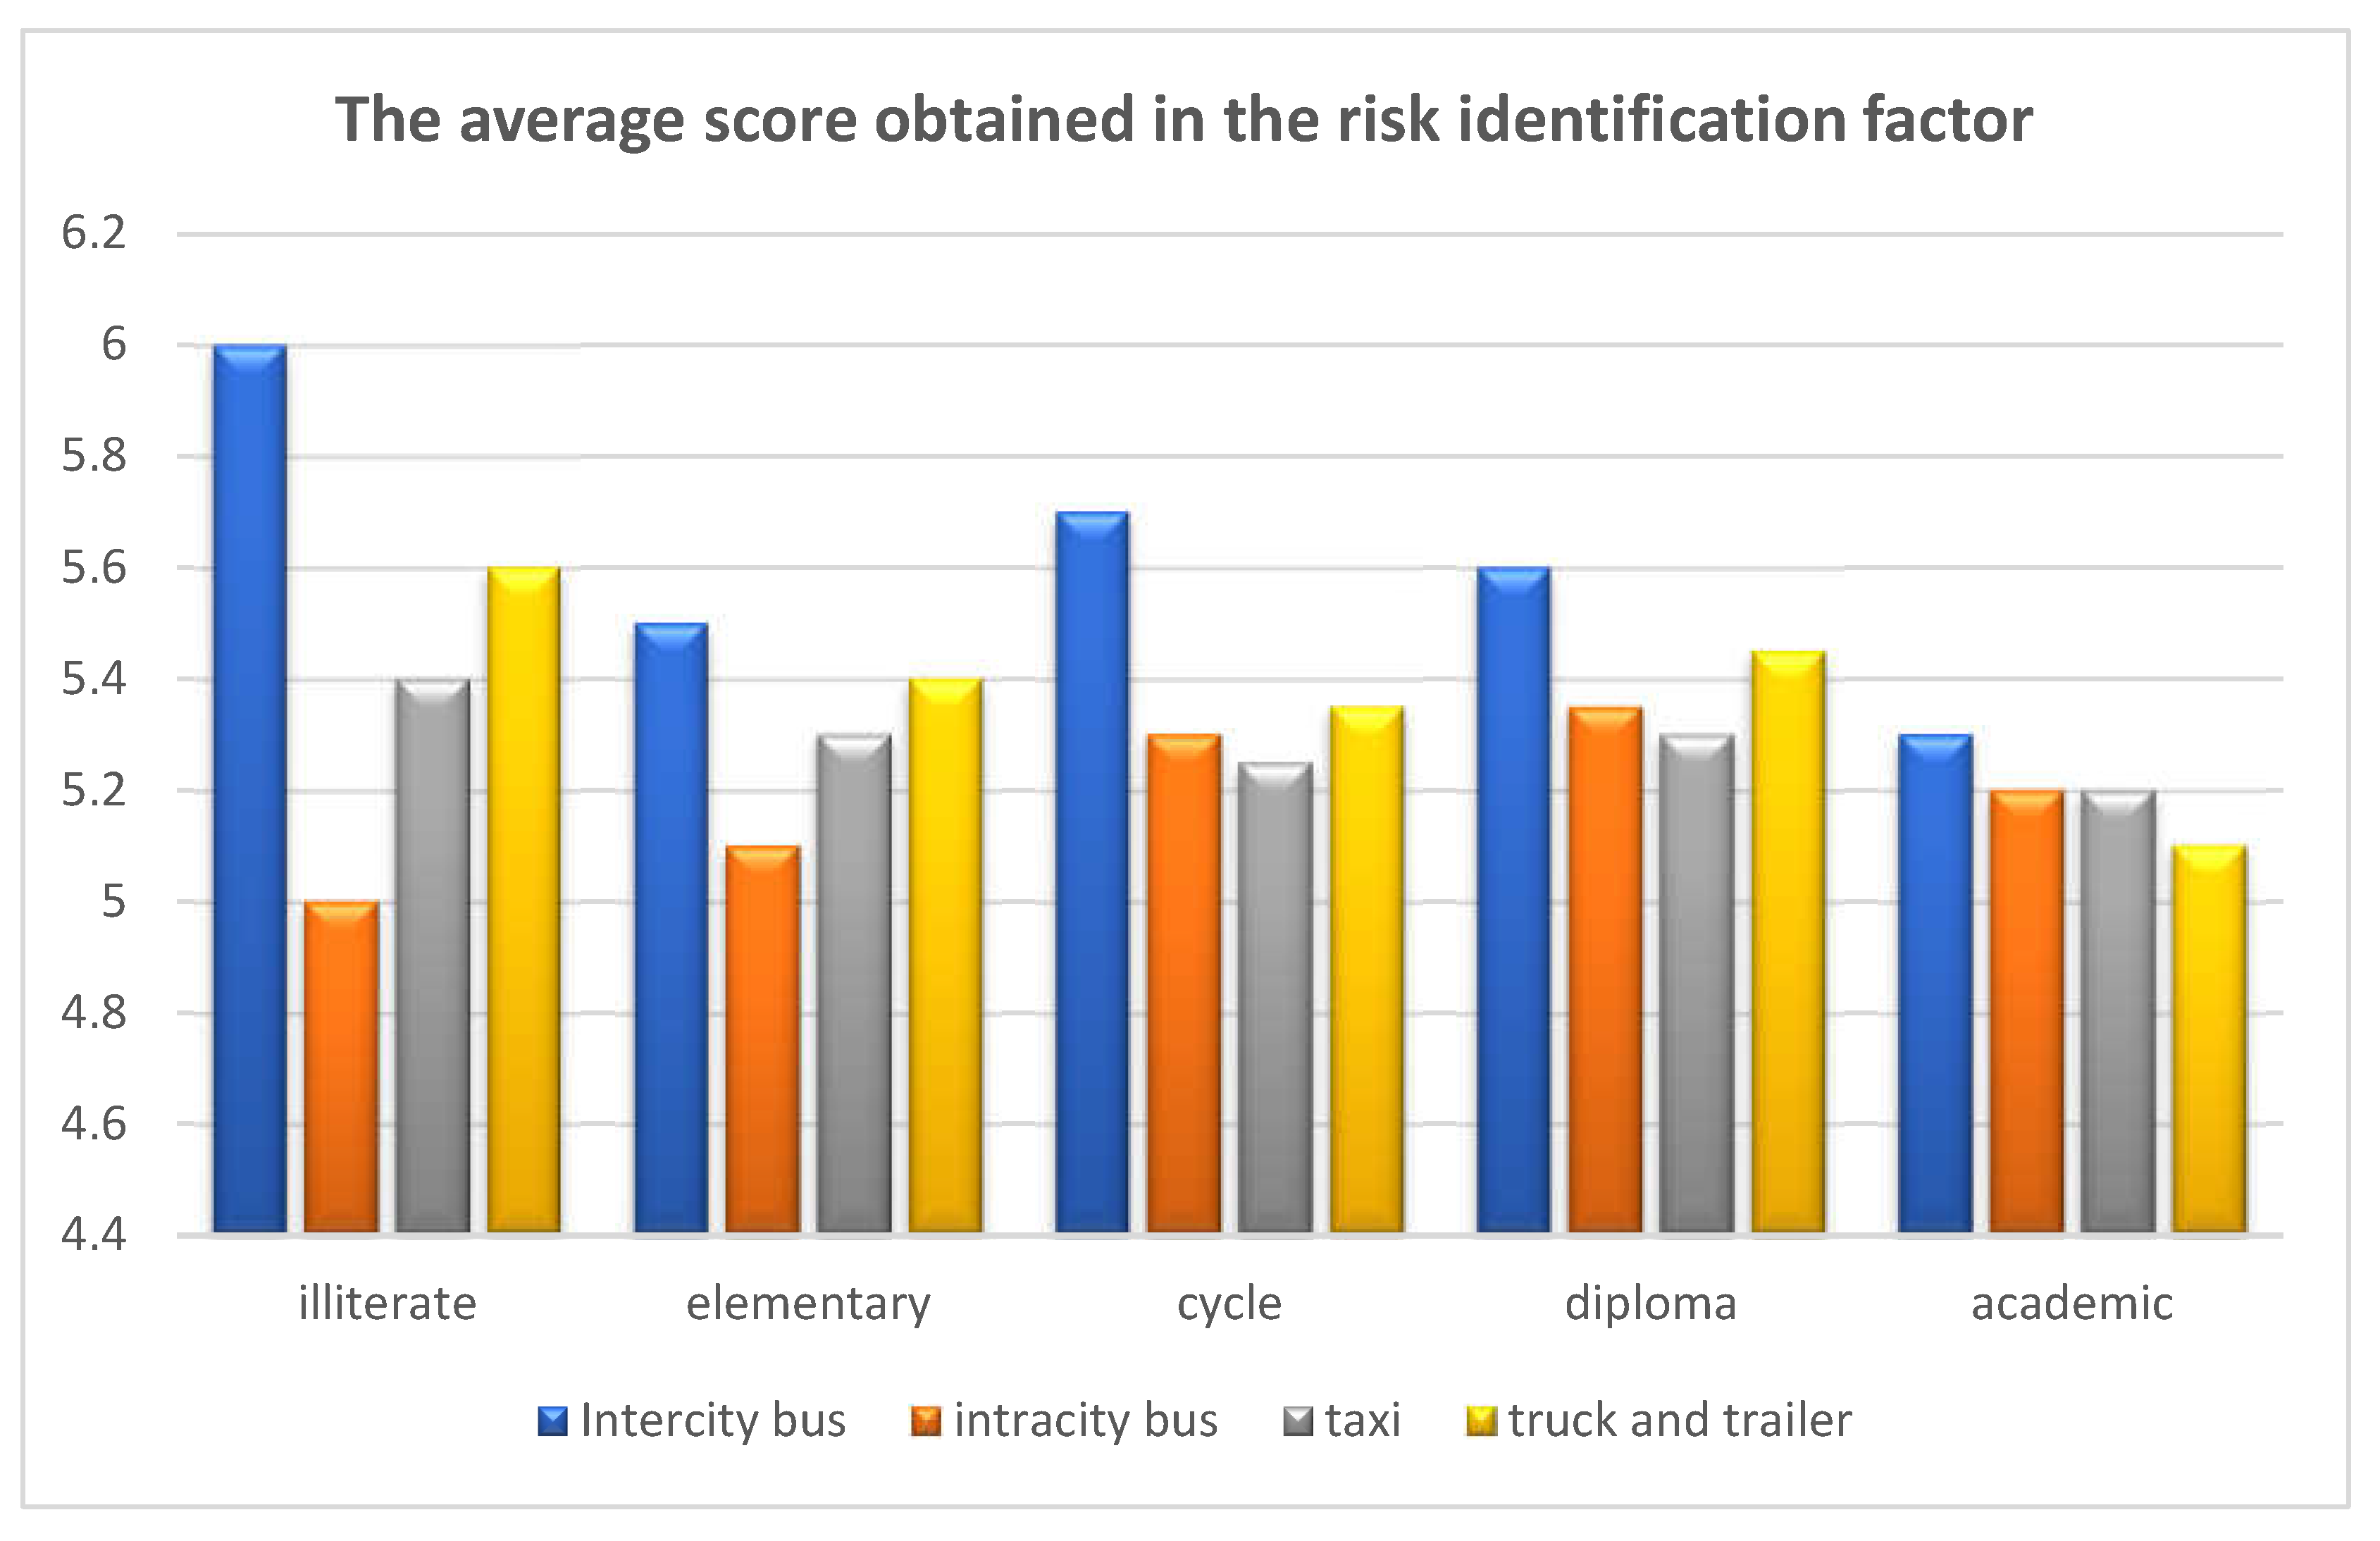
Figure 15.
The relationship between education status and anxiety factor by driver group.
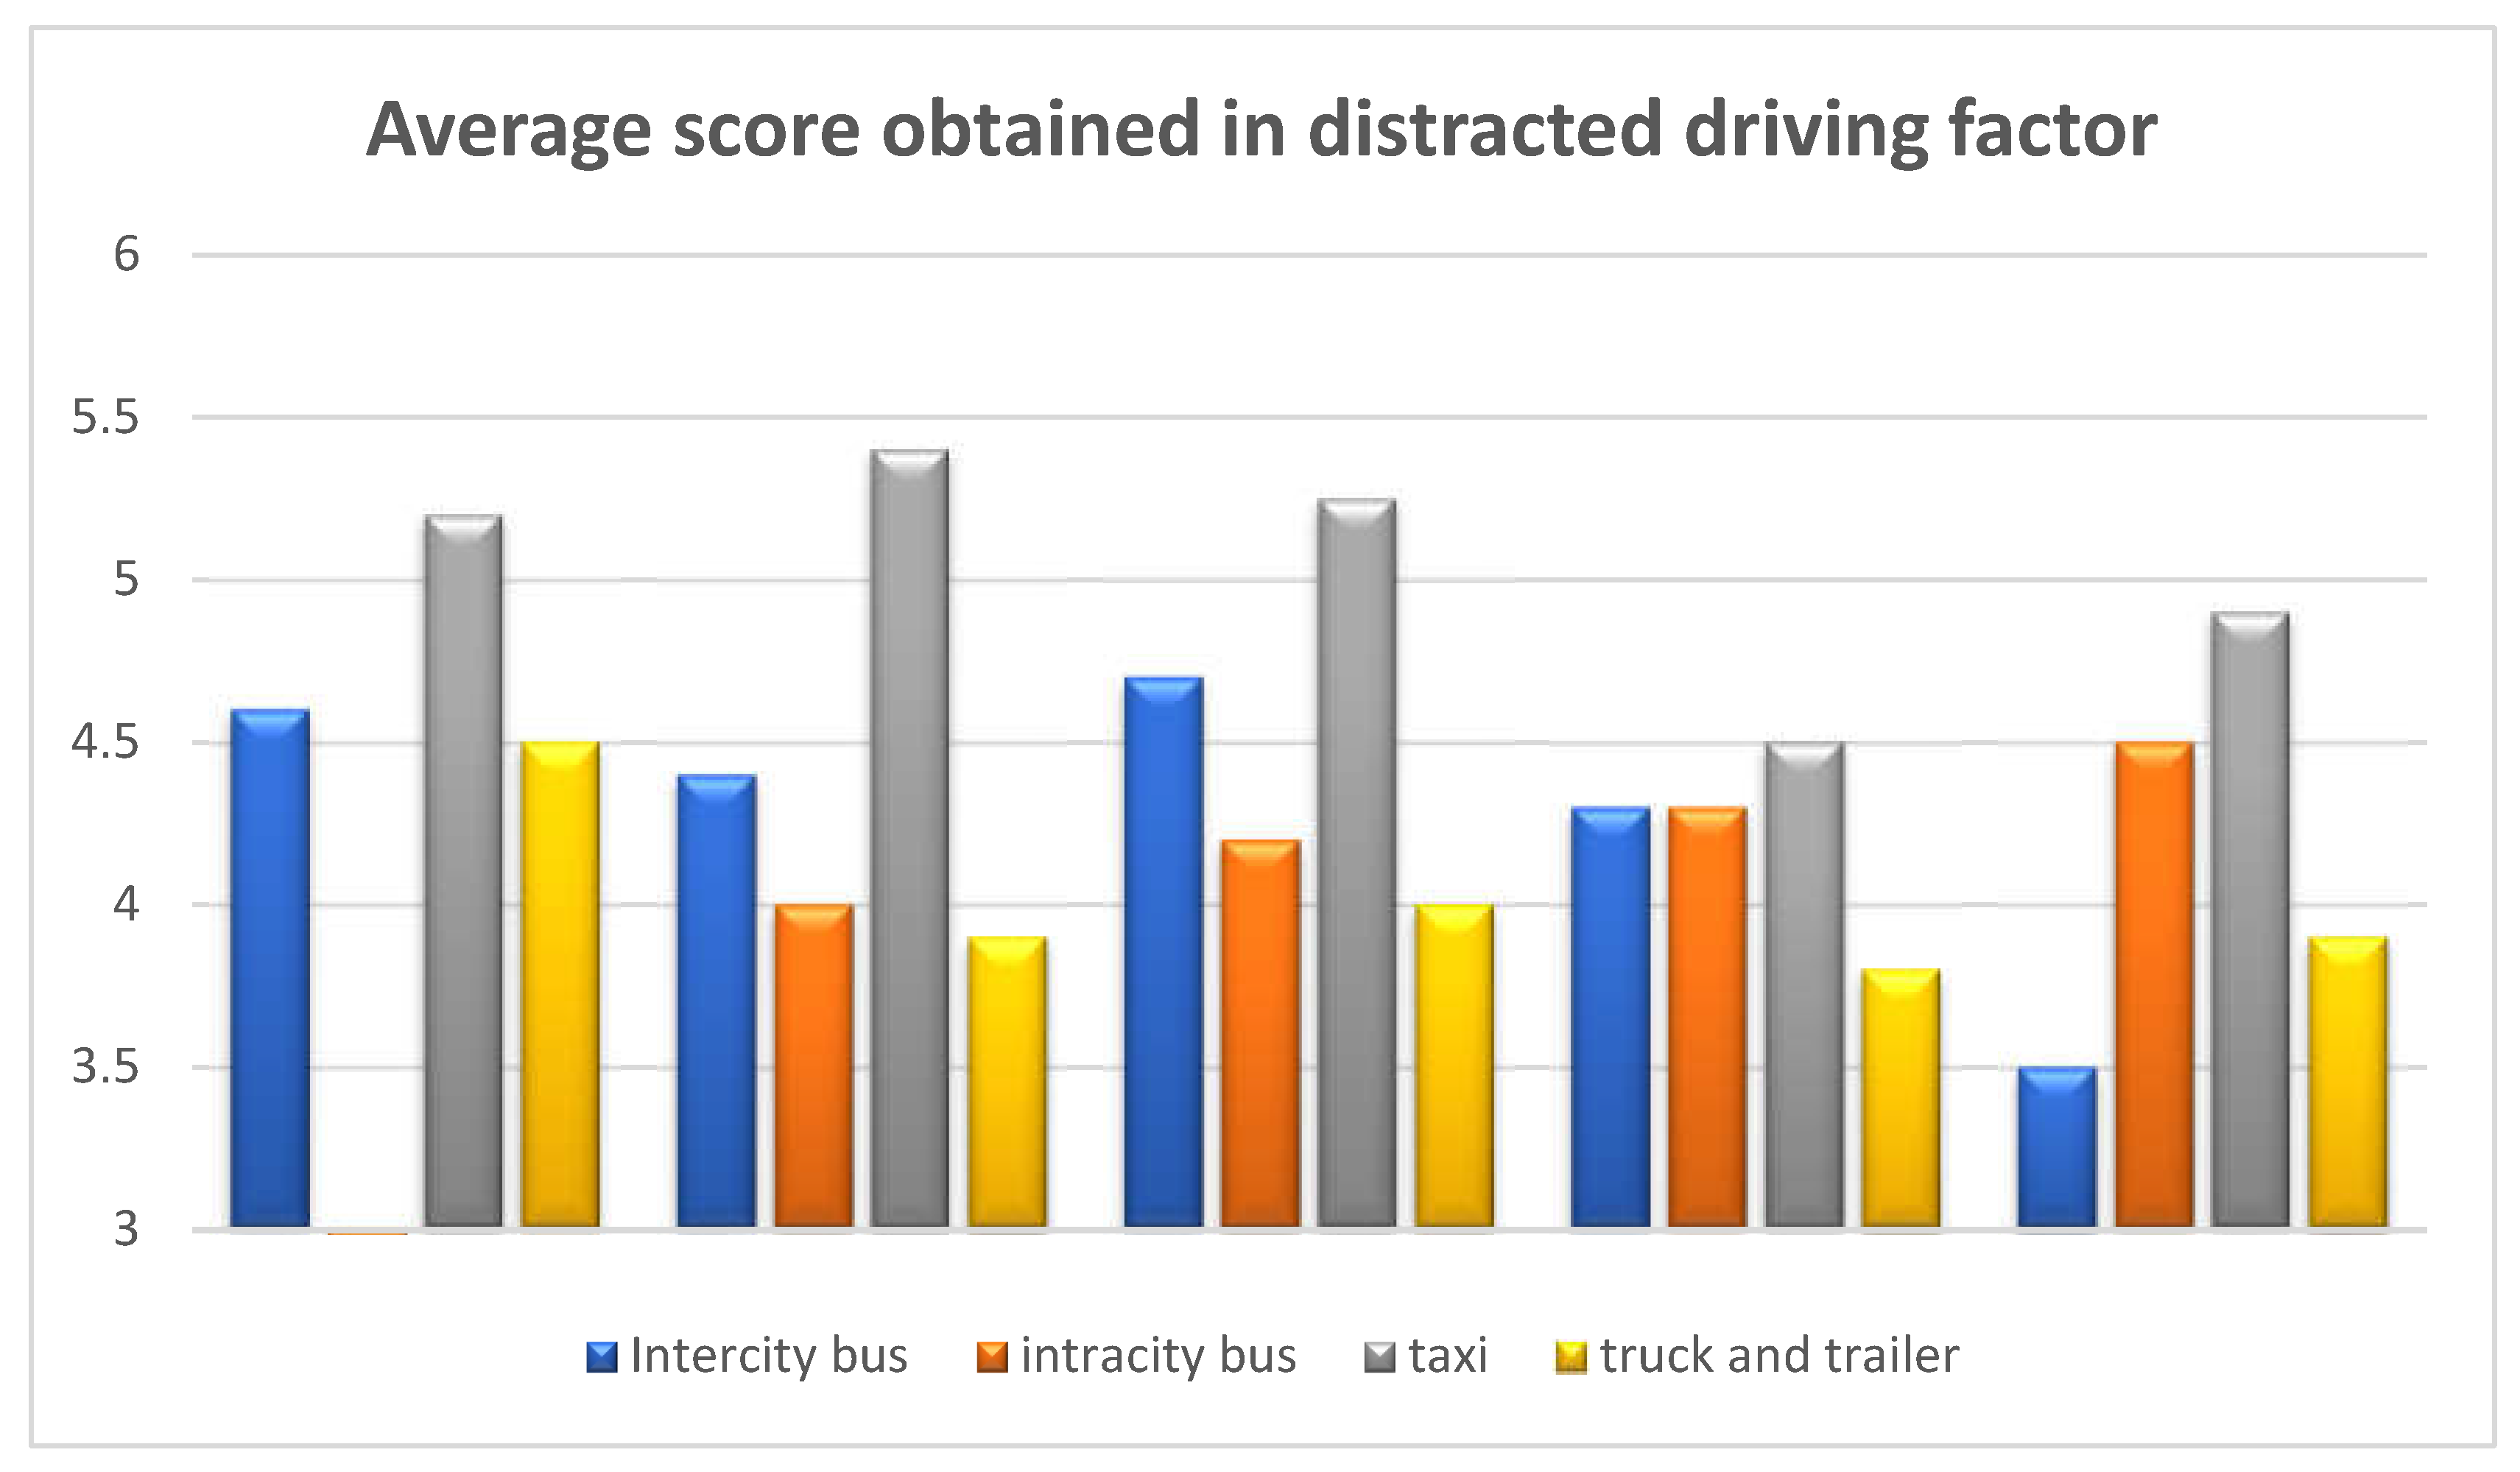
Table 3.
Data adequacy test results.
| KMO | Bartlett's Test of Sphericity | target group | |
| 0.67 | 780.209 | work square | Suburban bus |
| 0 | meaningful | ||
| 0.638 | 1146.715 | work square | Inner city bus |
| 0 | meaningful | ||
| 0.751 | 2106.146 | work square | Taxi |
| 0 | meaningful | ||
| 0.745 | 2659.508 | work square | Trucks and trailers |
| 0 | meaningful | ||
| 0.745 | 5893.079 | work square | Information of all groups |
| 0 | meaningful | ||
Table 4.
extracted factors of all groups.
| THE SUM OF THE SQUARES OF THE FACTOR LOADS EXTRACTED AND ROTATED | THE SUM OF THE SQUARES OF THE EXTRACTED FACTOR LOADINGS | INITIAL EIGENVALUES | NO. | ||||||
| Cumulative variance | Percentage of variance | total | Cumulative variance | Percentage of variance | total | Cumulative variance | Percentage of variance | total | |
|
10.939 20.899 29.996 38.894 45.827 52.019 56.082 |
10.938 9.989 9.098 8.921 6.993 6.154 4.064 |
3.289 2.995 2.739 2.68 2.093 1.865 1.219 |
14.449 23.433 32.486 39.888 46.289 52.403 56.085 |
14.449 9.993 9.083 7.39 6.42 6.132 3.679 |
4.033 2.996 2.732 2.215 1.931 1.833 1.109 |
13.439 23.423 32.497 39.879 46.29 52.42 56.078 59.188 62.145 64.959 67.631 70.139 72.499 74.787 77.032 79.118 81.099 82.929 84.745 86.467 88.168 89.796 91.26 92.698 94.12 95.43 96.698 97.899 99.069 100 |
13.44 9.986 9.084 7.385 6.42 6.125 3.686 3.11 2.977 2.82 2.669 2.516 2.369 2.299 2.258 2.088 1.989 1.836 1.81 1.739 1.698 1.63 1.467 1.439 1.418 1.308 1.289 1.208 1.167 0.948 |
4.055 2.866 2.735 2.229 1.93 1.842 1.11 0.955 0.893 0.849 0.81 0.763 0.715 0.694 0.684 0.632 0.596 0.555 0.547 0.529 0.519 0.498 0.445 0.472 0.439 0.398 0.394 0.371 0.349 |
1 2 3 4 5 6 7 8 9 10 11 12 13 14 15 16 17 18 19 20 21 22 23 24 25 26 27 28 29 30 |
Table 5.
reliability of the questionnaire and extracted factors.
| Cronbach's alpha coefficients | Factor | Number | ||||
| Trucks and trailers | Taxi | Inner city bus | Suburban bus | All groups | ||
| 0.709 | 0.683 | 0.728 | 0.722 | 0.706 | 30 | All questions |
| 0.711 | 0.685 | 0.733 | 0.722 | 0.708 | 29 | All constructor variables |
| 0.822 | 0.848 | 0.691 | 0.689 | 0.802 | 7 | Drive patiently |
| 0.819 | 0.846 | 0.812 | 0.76 | 0.82 | 5 | Peace of mind in driving |
| 0.756 | 0.794 | 0.777 | 0.803 | 0.777 | 5 | fatigue |
| 0.738 | 0.698 | 0.816 | 0.801 | 0.746 | 5 | Identify risks |
| 0.697 | 0.68 | 0.695 | 0.513 | 0.669 | 4 | Anxiety while driving |
| 0.582 | 0.516 | 0.563 | 0.514 | 0.564 | 3 | Excitement |
Table 6.
Correlation coefficient between personal variables and different factors.
| AGE | EDUCATION | VEHICLE OWNERSHIP | |
| -0.303** | 0.246** | -0.78* | SIGNIFICANT PEARSON COEFFICIENT F |
| 0.000 | 0.000 | 0.043 | |
| 0.78- | |||
| 0.048 | -0.24 | 0.025 | SIGNIFICANT PEARSON COEFFICIENT H |
| 0.21 | 0.528 | 0.511 | |
| 0.203** | -0.108** | 0.029 | SIGNIFICANT PEARSON COEFFICIENT R |
| 0.000 | 0.005 | 0.45 | |
| 0.183** | -1.24** | 0.07 | SIGNIFICANT PEARSON COEFFICIENT P |
| 0.000 | 0.001 | 0.07 | |
| -0.18 | 0.034 | -0.39 | SIGNIFICANT PEARSON COEFFICIENT A |
| 0.646 | 0.381 | 0.309 | |
| 0.198** | -0.126** | 0.126** | The SIGNIFICANT PEARSON COEFFICIENT of the TOTAL NUMBER of T |
| 0 | 0.001 | 0.001 | |
| 678 | 678 | 678 |
Disclaimer/Publisher’s Note: The statements, opinions and data contained in all publications are solely those of the individual author(s) and contributor(s) and not of MDPI and/or the editor(s). MDPI and/or the editor(s) disclaim responsibility for any injury to people or property resulting from any ideas, methods, instructions or products referred to in the content. |
© 2024 by the authors. Licensee MDPI, Basel, Switzerland. This article is an open access article distributed under the terms and conditions of the Creative Commons Attribution (CC BY) license (http://creativecommons.org/licenses/by/4.0/).
Copyright: This open access article is published under a Creative Commons CC BY 4.0 license, which permit the free download, distribution, and reuse, provided that the author and preprint are cited in any reuse.


