
Submitted:
29 December 2024
Posted:
31 December 2024
You are already at the latest version
Abstract
We present a novel framework that utilizes explainable Graph Neural Net- works (GNNs) to analyze diffusion processes in complex networks. Our ap- proach begins with the simulation of compartmental models, such as SIR (Susceptible-Infected-Recovered) or SEIR (Susceptible-Exposed-Infected-Recovered), using graph algorithms to model the spread of phenomena throughout the network. These simulations capture the dynamic behaviour of diffusion pro- cesses and provide a foundation for deeper analysis. The next step involves employing GNNs to learn and predict the intricate patterns of diffusion, fo- cusing on identifying crucial nodes that significantly influence the process. We integrate explainability methods into the GNNs to enhance interpretabil- ity, allowing for a clear understanding of the factors that drive the model’s predictions. This combination of graph-based simulation and explainable GNNs offers a powerful toolkit for uncovering key insights into network dif- fusion processes; it has potential applications in epidemiology, information spread, and network resilience analysis.
Keywords:
Explainability
; Graph Neural Networks
MSC: 0000; 1111
1. Introduction
Predicting and controlling the behavior of complex systems is a significant challenge for decision support, especially when relying on computational resources. Computational models and infrastructures provide powerful tools for describing and simulating various systems, bridging theoretical concepts with practical applications.
The study of diffusion processes within networked systems is fundamental to many research domains. These processes are essential for understanding diverse phenomena, such as the spread of information on digital social platforms and the transmission of diseases in biological populations [1,2]. In technological contexts, diffusion analysis is critical for understanding the dynamics of innovation dissemination and identifying potential points of systemic failure [3]. Similarly, ecological networks benefit from diffusion studies, which provide insights into species interactions and ecosystem stability [4,5].
Simulations play a pivotal role in understanding such systems by replicating their dynamic behavior through a small set of critical variables. They also enable predictions about how changes in external parameters might influence the system. This combination of reproducing current dynamics and forecasting outcomes makes simulations an invaluable tool for analyzing and managing complex systems [1,3,6,7].
Our current research investigates the spread of diseases using various theoretical approaches, including time-series forecasting, agent-based modelling, and compartmental models. While compartmental models are widely used, they often fail to incorporate the structure of contact patterns. The COVID-19 pandemic has highlighted the importance of considering contact networks as a fundamental aspect of disease diffusion [3,8]. To address this gap, we focus on contact-based models that combine the diffusion dynamics of Susceptible-Infectious-Recovered (SIR) frameworks with network theory, tailoring diffusion processes to reflect real-world contact patterns [1,3,9,10,11,12,13,14,15,16].
Despite the existence of various methods for simulating diffusion processes, a significant gap remains in terms of tools that are both accessible and user-friendly for researchers without extensive computational expertise. Platforms like NDLib [17] offer web-based simulation capabilities but often lack advanced features such as embedding and node classification, which are essential for deeper analysis.
To overcome these limitations, we have developed ExDiff a novel framework for simulating and analyzing network diffusion processes. The framework uses compartimental models and explainable graph neural networks to model and simulate spreading dynamics across diverse network structures and scenarios.
NemeSys enables users to simulate the spread of information, diseases, or other phenomena across network nodes. This capability is vital for understanding diffusion dynamics in complex systems—such as social and biological networks—and designing strategies to amplify or suppress diffusion based on specific application requirements. Beyond simulation, the platform incorporates advanced machine learning techniques, leveraging Graph Neural Networks (GNNs) [18,19,20]. These models facilitate detailed node analysis through embedding and classification, providing insights into the roles and influence of nodes within the diffusion process. This approach helps identify the most influential or vulnerable nodes in the network, offering actionable insights for applications such as epidemiology, viral marketing, and information dissemination.
By integrating simulation with GNN-based analysis, ExDiff provides a powerful and user-friendly tool for studying and managing diffusion phenomena in complex systems. This combination of features positions ExDiff as a valuable resource for researchers and practitioners across various disciplines, enabling them to predict, analyze, and control diffusion processes with greater precision and efficiency.
Graph Neural Networks (GNNs) [21] have emerged as transformative tools for analyzing and modelling graph-structured data, owing to their ability to propagate and aggregate information across graph nodes iteratively. By leveraging message-passing mechanisms, GNNs enable the capture of both local and global patterns within complex network structures, making them invaluable for tasks ranging from node classification to link prediction.
Graph Convolutional Networks (GCNs) [22] extend the concept of convolution, traditionally applied to grid-like data (e.g., images), to graph-structured data. Through an iterative aggregation process, GCNs combine the features of neighbouring nodes to create node embeddings that reflect individual attributes and the surrounding graph structure. Despite their efficacy across various applications, the performance of GCNs on our specific task was suboptimal. This limitation is primarily attributed to over-smoothing, a phenomenon where node representations become indistinguishable after multiple aggregation layers.
To overcome the limitations of GCNs we use using a novel variant, k-GCN [23]. This model builds upon the foundational principles of GCNs while introducing explicit constraints on the receptive field to restrict it to k-hop neighbourhoods. By limiting the aggregation process to a defined neighbourhood radius, k-GCN mitigates over-smoothing and ensures that the learned representations remain localized. This design preserves the distinctiveness of node features and enhances the model’s transparency, making it easier to understand the influence of specific graph components on predictions [24].
The architecture of k-GCN is depicted in Figure 1, which illustrates its key components and the role of the k-hop neighbourhood constraint in maintaining localized representations.
Explainability is a critical requirement for GNN-based models , especially in applications demanding transparency in decision-making processes. To enhance the interpretability of k-GCN, we incorporate advanced explainability techniques using Captum [25], a PyTorch-based library. Captum provides tools such as saliency maps [26,27] and integrated gradients [28], which allow us to identify the most influential features and structural components of the graph.
Saliency maps compute the gradient of the model’s output concerning its input features, enabling the identification of critical nodes and edges that significantly impact predictions. This method highlights regions of the graph most relevant to the model’s decisions. On the other hand, integrated gradients quantify the cumulative effect of changes in input features along a path from a baseline to the actual input, providing a more comprehensive explanation of the model’s output. Together, these techniques allow us to dissect the decision-making process of k-GCN, offering insights into which aspects of the graph structure or node features contribute most substantially to the outcomes.
By integrating explainability methods, k-GCN delivers robust performance and ensures that its predictions are interpretable, fostering greater trust and usability in real-world applications. This combination of strong predictive capabilities and enhanced transparency makes k-GCN a powerful tool for analyzing graph-structured data in various domains.
2. Related Work
Frameworks based on graph theory and network science are widely used to analyze diffusion processes in various contexts, including the spread of ideas in social networks, the dynamics of transportation systems, and the transmission of infectious diseases. The COVID-19 pandemic has provided a unique opportunity for researchers to investigate real-world diffusion processes, thanks to the availability of extensive empirical data. This abundance of information has spurred advancements in modeling techniques and strategies aimed at mitigating disease spread.
Plazas et al. [29] utilized a multiplex network approach combined with the Susceptible-Infected-Recovered (SIR) model [30] to represent the complex web of human interactions across multiple layers, including households, workplaces, and social connections. This framework was crucial in simulating the progression of an epidemic, allowing researchers to evaluate the effectiveness of various lockdown strategies in controlling the outbreak. Moreover, the model included economic considerations, offering a balanced view of public health measures and their socioeconomic impacts.
In a similar vein, temporal networks that incorporate time into network analysis have been integrated with the SIR model to gain a better understanding of infection propagation dynamics. This approach is particularly effective in capturing the temporal variability of human interactions, similar to applications of multiplex networks [7,31]. For example, Humphries et al. [32] employed a temporal network modeled as a dynamic multiplex structure with evolving edges to study epidemic spread. Their research identified critical thresholds within the SIR parameters and temporal matrices that determine the conditions under which epidemics can be effectively controlled versus those that lead to uncontrolled outbreaks.
Beyond epidemiology, diffusion is also relevant to the spread of information in networks, with a significant emphasis on identifying and understanding super-spreaders. These highly connected nodes play a vital role in accelerating the dissemination of content, whether beneficial or harmful. Researchers have investigated strategies to either leverage or suppress these nodes in order to enhance the spread of useful information or mitigate the transmission of harmful entities, such as viruses, pathogens, misinformation, or rumors [33]. Such studies highlight the importance of understanding network topology and dynamics to develop effective intervention strategies across various domains.
Overall, integrating multiplex and temporal network frameworks with diffusion models like the SIR provides powerful tools for analyzing complex systems. These methods enhance our understanding of the interplay between network structure, temporal dynamics, and diffusion processes, paving the way for actionable insights in public health, communication, and infrastructure resilience.
3. Software Architecture
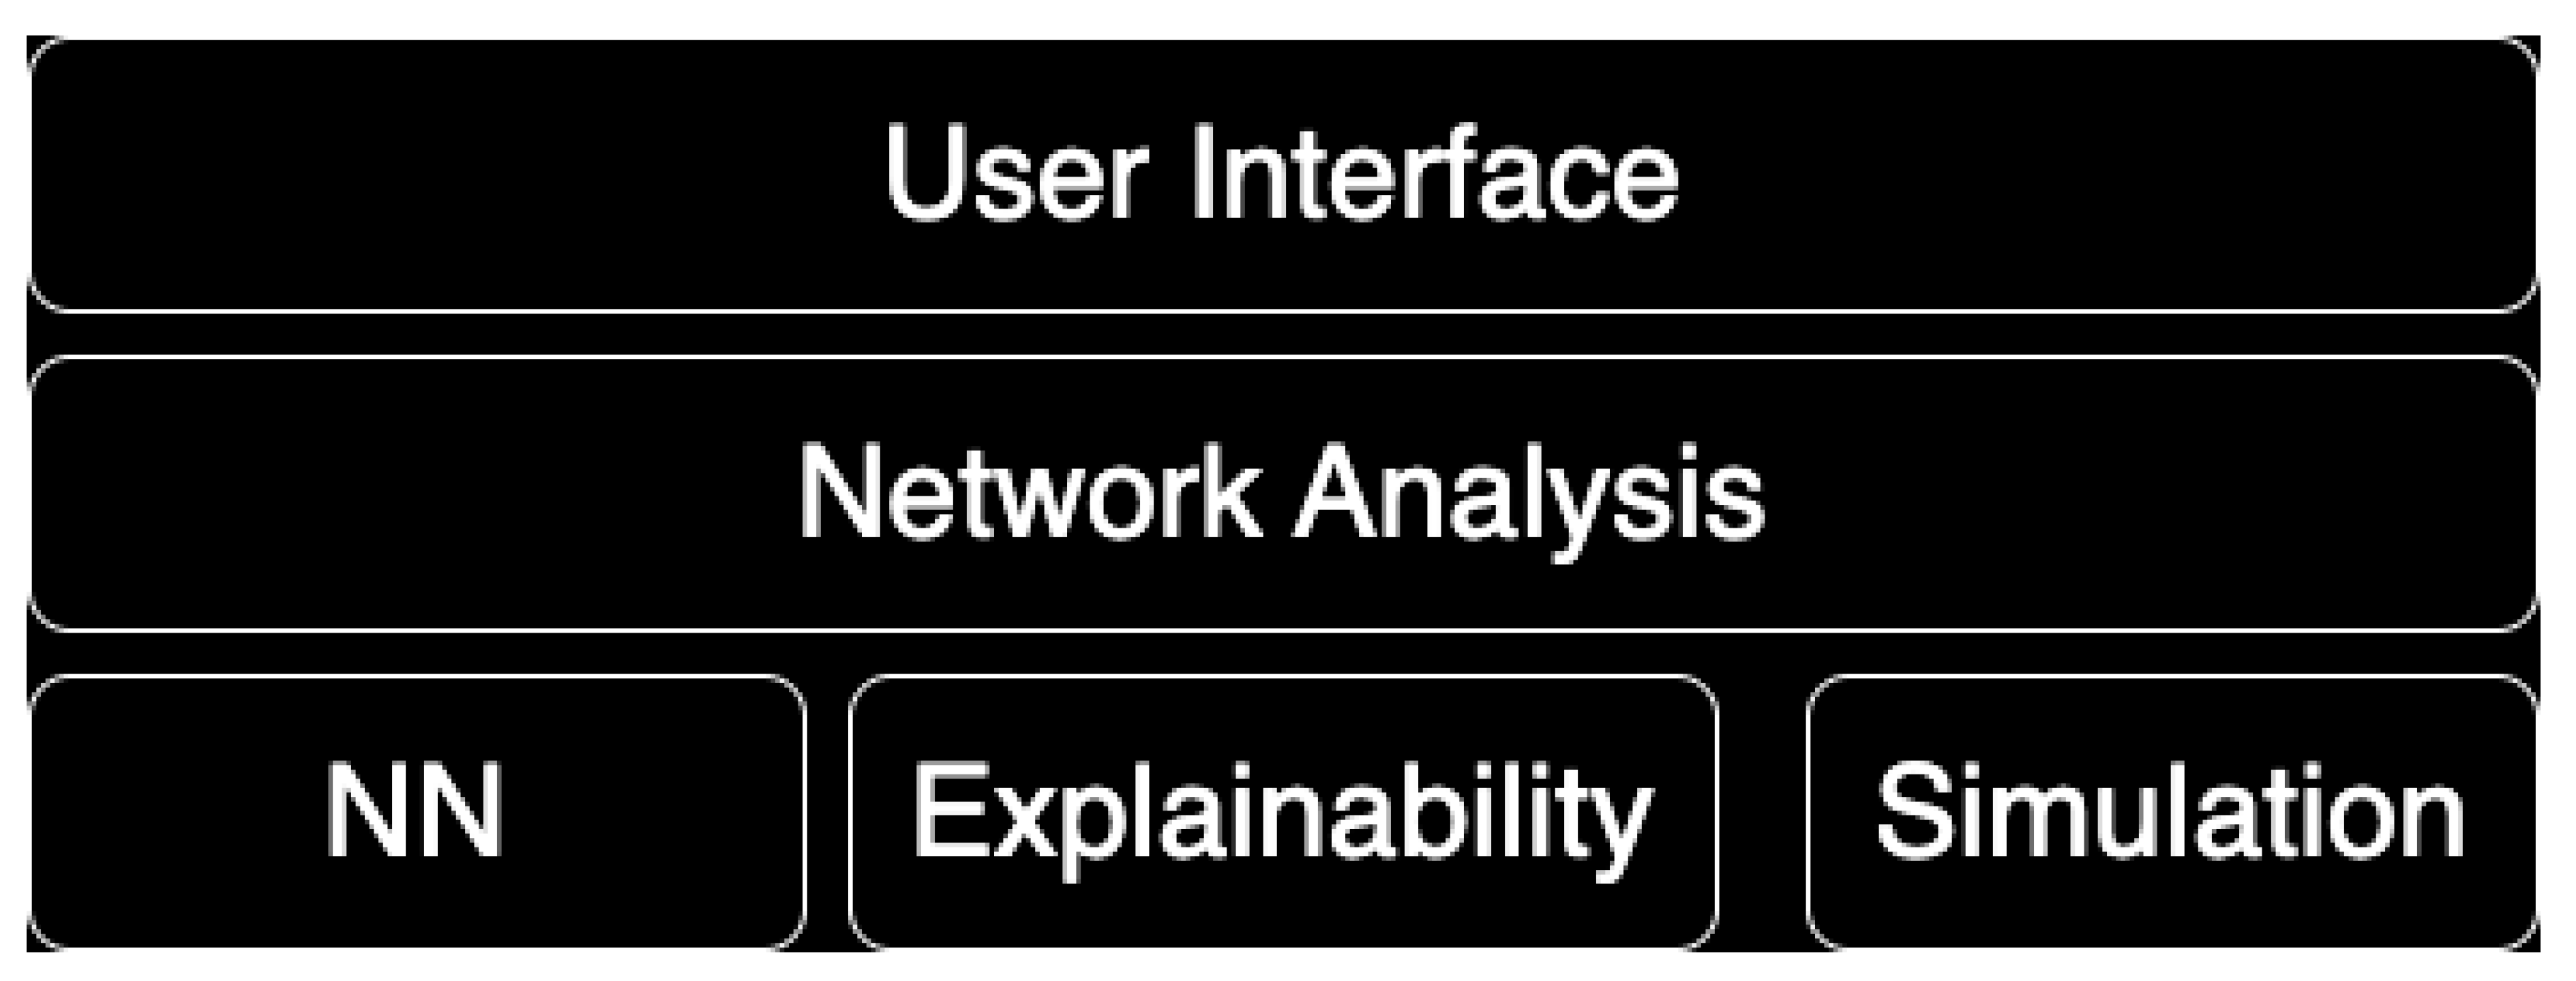
The system architecture, depicted in Figure 2 consists of multiple modules that work together to provide a comprehensive framework for network analysis, neural networks, explainability, and simulation.
The User Interface (UI) serves as the main interaction layer for users. It is implemented in Python, taking advantage of its simplicity and extensive library support for GUI development and data visualization. Key frameworks and libraries that may be utilized include Tkinter or PyQt for building interactive desktop applications, and Flask or Django for web-based interfaces. For data visualization, Matplotlib or Plotly can be employed to create graphical outputs. The UI allows users to input data into the system, visualize network graphs and results, configure parameters for neural networks and simulations, and display outputs and analysis results related to explainability.
The Network Analysis module is built using NetworkX, a Python library designed for creating, manipulating, and studying complex networks. The capabilities of NetworkX utilized include creating and manipulating graphs (both directed and undirected, as well as multigraphs), computing network metrics (like degree centrality, betweenness centrality, and clustering coefficients), implementing pathfinding algorithms (such as Dijkstra’s and Bellman-Ford), and visualizing network structures. This module serves as the foundation for understanding network properties, structuring data, and preparing inputs for the neural network (NN) module.
The NN module uses state-of-the-art frameworks like PyTorch for constructing and training deep learning models. It also employs PyTorch Geometric for handling graph neural networks (GNNs) and graph-based data structures, GraphSAGE for inductive learning on large graphs with feature aggregation from node neighborhoods, and PyGoD for graph-based anomaly detection, which helps in identifying outliers and unusual patterns within networks. The capabilities of this module include node and edge classification tasks, link prediction, anomaly detection for network structures, and training and evaluation pipelines.
The Explainability module is built using Captum, a tool designed to ensure the interpretability of deep learning models within PyTorch. Features in this module include Integrated Gradients, which explain model predictions based on feature importance; Saliency Maps, which highlight the parts of the input graph that contribute most to predictions; and Layer-wise Relevance Propagation (LRP), which provides insights into neuron activations. It also offers visualizations and textual explanations for user-friendly interpretation. This module is essential for ensuring transparency and trust in model predictions, particularly in fields that require explainable AI.
The Simulation module leverages Menczner’s simulation class, designed to create dynamic and adaptive simulations of network behaviors and interactions. Key features of this module include simulating node and edge dynamics over time, testing hypotheses about network evolution, evaluating model performance under dynamic conditions, and stress-testing the system by modeling changes in network topology. This module aids in validating models and understanding behaviors under different scenarios.
The integration workflow begins with data input, where users can upload or generate data via the UI. NetworkX processes the data and prepares graph structures during preprocessing. The neural networks implemented in PyTorch and PyTorch Geometric then analyze the network data. Captum generates insights into model behavior through explainability techniques. Dynamic scenarios are tested using Menczner’s Simulation Class. Finally, results are visualized and interpreted via the UI. This modular architecture combines advanced tools and frameworks, enabling robust network analysis, deep learning, and explainability. It offers flexibility, scalability, and interpretability for a wide range of applications in networked data systems.
References
- Guzzi, P.H.; Petrizzelli, F.; Mazza, T. Disease spreading modeling and analysis: A survey. Briefings in Bioinformatics 2022, 23, bbac230. [Google Scholar]
- Guzzi, P.H.; Di Paola, L.; Giuliani, A.; Veltri, P. PCN-Miner: An open-source extensible tool for the Analysis of Protein Contact Networks. Bioinformatics 2022, 38, 4235–4237. [Google Scholar] [CrossRef] [PubMed]
- Petrizzelli, F.; Guzzi, P.H.; Mazza, T. Beyond COVID-19 Pandemic: Topology-aware optimization of vaccination strategy for minimizing virus spreading. Computational and Structural Biotechnology Journal 2022. [Google Scholar] [CrossRef] [PubMed]
- De Domenico, M.; Granell, C.; Porter, M.A.; Arenas, A. The physics of spreading processes in multilayer networks. Nature Physics 2016, 12, 901–906. [Google Scholar] [CrossRef]
- Abenavoli, L.; Luigiano, C.; Guzzi, P.; Milic, N.; Morace, C.; Stelitano, L.; Consolo, P.; Miraglia, S.; Fagoonee, S.; Virgilio, C.; et al. Serum adipokine levels in overweight patients and their relationship with non-alcoholic fatty liver disease. Panminerva medica 2014, 56, 189–193. [Google Scholar] [PubMed]
- Humphreys, P. Computational models. Philosophy of science 2002, 69, S1–S11. [Google Scholar] [CrossRef]
- Milano, M.; Guzzi, P.H.; Tymofieva, O.; Xu, D.; Hess, C.; Veltri, P.; Cannataro, M. An extensive assessment of network alignment algorithms for comparison of brain connectomes. BMC bioinformatics 2017, 18, 31–45. [Google Scholar] [CrossRef]
- Guzzi, P.H.; Milenković, T. Survey of local and global biological network alignment: the need to reconcile the two sides of the same coin. Briefings in bioinformatics 2018, 19, 472–481. [Google Scholar] [CrossRef] [PubMed]
- Alguliyev, R.; Aliguliyev, R.; Yusifov, F. Graph modelling for tracking the COVID-19 pandemic spread. Infectious Disease Modelling 2021, 6, 112–122. [Google Scholar] [CrossRef]
- Bryant, P.; Elofsson, A. Modelling the dispersion of SARS-CoV-2 on a dynamic network graph. medRxiv 2020. [Google Scholar]
- Karaivanov, A. A social network model of COVID-19. Plos one 2020, 15, e0240878. [Google Scholar] [CrossRef] [PubMed]
- Chow, K.; Sarkar, A.; Elhesha, R.; Cinaglia, P.; Ay, A.; Kahveci, T. ANCA: Alignment-Based Network Construction Algorithm. IEEE/ACM Trans Comput Biol Bioinform 2021, 18, 512–524. [Google Scholar] [CrossRef] [PubMed]
- Zaplotnik, Ž.; Gavrić, A.; Medic, L. Simulation of the COVID-19 epidemic on the social network of Slovenia: Estimating the intrinsic forecast uncertainty. PloS one 2020, 15, e0238090. [Google Scholar] [CrossRef]
- Das, J.K.; Roy, S.; Guzzi, P.H. Analyzing host-viral interactome of sars-cov-2 for identifying vulnerable host proteins during covid-19 pathogenesis. Infection, Genetics and Evolution 2021, 104921. [Google Scholar] [CrossRef]
- Patil, R.; Dave, R.; Patel, H.; Shah, V.M.; Chakrabarti, D.; Bhatia, U. Assessing the interplay between travel patterns and SARS-CoV-2 outbreak in realistic urban setting. Applied Network Science 2021, 6, 1–19. [Google Scholar] [CrossRef] [PubMed]
- Nassa, G.; Tarallo, R.; Guzzi, P.H.; Ferraro, L.; Cirillo, F.; Ravo, M.; Nola, E.; Baumann, M.; Nyman, T.A.; Cannataro, M.; et al. Comparative analysis of nuclear estrogen receptor alpha and beta interactomes in breast cancer cells. Molecular BioSystems 2011, 7, 667–676. [Google Scholar] [CrossRef] [PubMed]
- Rossetti, G.; Milli, L.; Rinzivillo, S. NDlib: a python library to model and analyze diffusion processes over complex networks. In Proceedings of the Companion Proceedings of the The Web Conference 2018, 2018, pp. 183–186.
- Leskovec, J.; Lang, K.J.; Mahoney, M. Empirical comparison of algorithms for network community detection. In Proceedings of the Proceedings of the 19th international conference on World wide web. ACM, 2010, pp. 631–640.
- Guzzi, P.H.; Zitnik, M. Editorial Deep Learning and Graph Embeddings for Network Biology. IEEE/ACM Transactions on Computational Biology and Bioinformatics 2022, 19, 653–654. [Google Scholar]
- Cho, Y.R.; Mina, M.; Lu, Y.; Kwon, N.; Guzzi, P.H. M-finder: Uncovering functionally associated proteins from interactome data integrated with go annotations. Proteome science 2013, 11, 1–12. [Google Scholar] [CrossRef]
- Scarselli, F.; Gori, M.; Tsoi, A.C.; Hagenbuchner, M.; Monfardini, G. The Graph Neural Network Model. IEEE Transactions on Neural Networks 2009, 20, 61–80. [Google Scholar] [CrossRef] [PubMed]
- Kipf, T.N.; Welling, M. Semi-Supervised Classification with Graph Convolutional Networks. In Proceedings of the International Conference on Learning Representations, 2017.
- Defilippo, A.; Giorgi, F.M.; Veltri, P.; Guzzi, P.H. Understanding complex systems through differential causal networks. Scientific Reports 2024, 14, 27431. [Google Scholar] [CrossRef] [PubMed]
- Ghorbani, A.; Rostami, M.; Guzzi, P.H. AI-enabled pipeline for virus detection, validation, and SNP discovery from next-generation sequencing data. Frontiers in Genetics 2024, 15, 1492752. [Google Scholar] [CrossRef] [PubMed]
- Kokhlikyan, N.; Miglani, V.; Martin, M.; Wang, E.; Alsallakh, B.; Reynolds, J.; Melnikov, A.; Kliushkina, N.; Araya, C.; Yan, S.; et al. Captum: A unified and generic model interpretability library for PyTorch. arXiv 2020, arXiv:cs.LG/2009.07896. [Google Scholar]
- Simonyan, K.; Vedaldi, A.; Zisserman, A. Deep Inside Convolutional Networks: Visualising Image Classification Models and Saliency Maps. In Proceedings of the ICLR (Workshop Poster), 2014.
- Defilippo, A.; Veltri, P.; Lió, P.; Guzzi, P.H. Leveraging graph neural networks for supporting automatic triage of patients. Scientific Reports 2024, 14, 12548. [Google Scholar] [CrossRef] [PubMed]
- Sundararajan, M.; Taly, A.; Yan, Q. Axiomatic Attribution for Deep Networks. In Proceedings of the International Conference on Machine Learning, 2017.
- Plazas, A.; Malvestio, I.; Starnini, M.; Díaz-Guilera, A. Modeling partial lockdowns in multiplex networks using partition strategies. Applied network science 2021, 6, 1–15. [Google Scholar] [CrossRef] [PubMed]
- Boccaletti, S.; Bianconi, G.; Criado, R.; Del Genio, C.I.; Gómez-Gardenes, J.; Romance, M.; Sendina-Nadal, I.; Wang, Z.; Zanin, M. The structure and dynamics of multilayer networks. Physics reports 2014, 544, 1–122. [Google Scholar] [CrossRef]
- Colizza, V.; Pastor-Satorras, R.; Vespignani, A. Reaction–diffusion processes and metapopulation models in heterogeneous networks. Nature Physics 2007, 3, 276–282. [Google Scholar] [CrossRef]
- Humphries, R.; Mulchrone, K.; Tratalos, J.; More, S.J.; Hövel, P. A systematic framework of modelling epidemics on temporal networks. Applied Network Science 2021, 6, 1–19. [Google Scholar] [CrossRef]
- Menczer, F.; Fortunato, S.; Davis, C.A. A first course in network science; Cambridge University Press, 2020. [Google Scholar]
Figure 1.
Overview of the k-GCN model architecture.
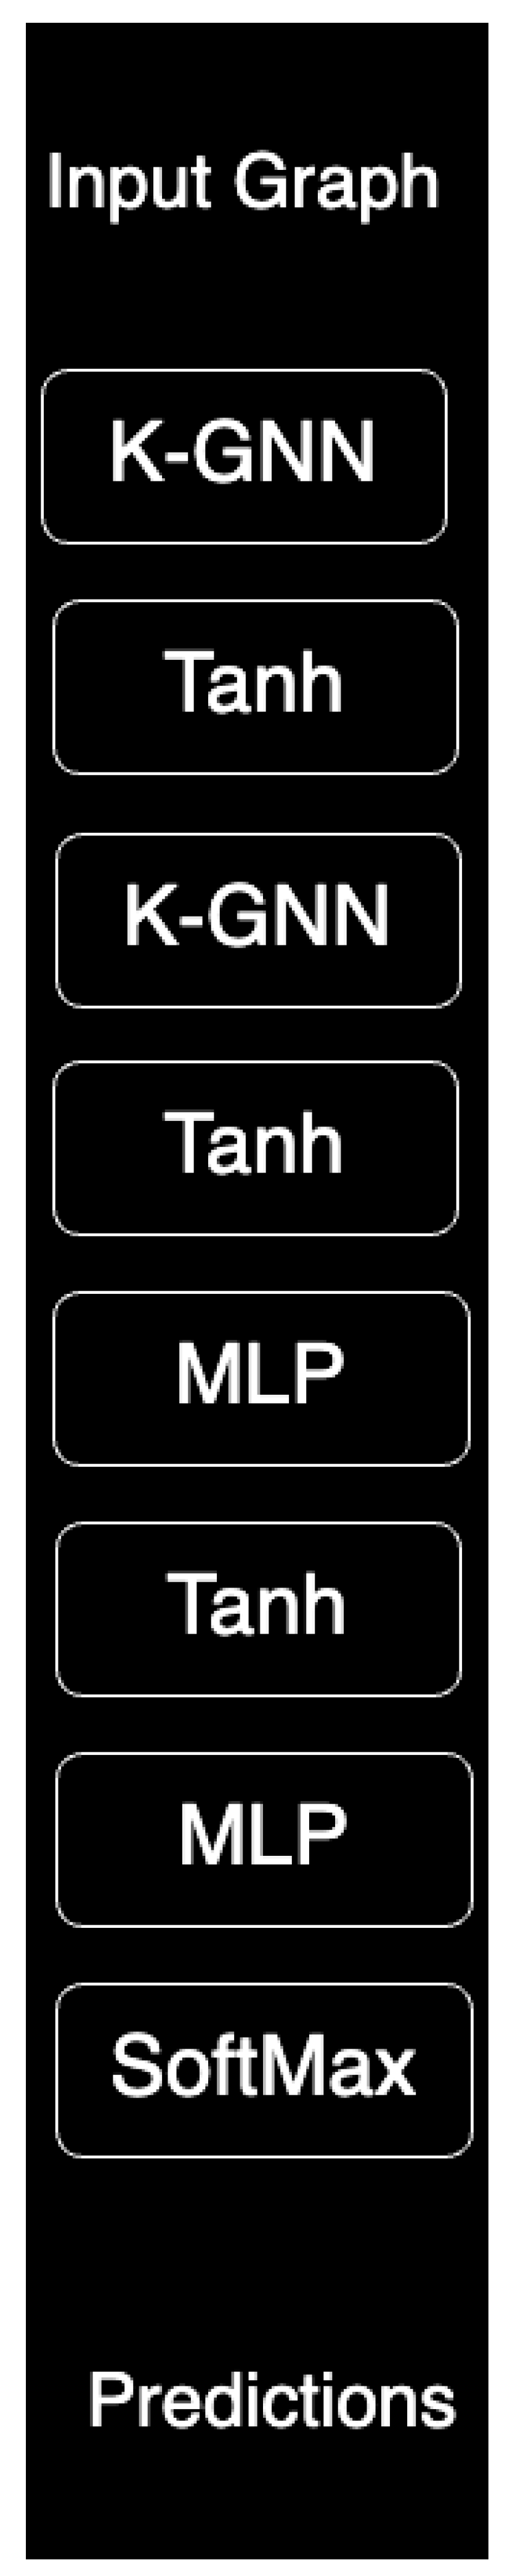
Figure 2.
Software Architecture
Disclaimer/Publisher’s Note: The statements, opinions and data contained in all publications are solely those of the individual author(s) and contributor(s) and not of MDPI and/or the editor(s). MDPI and/or the editor(s) disclaim responsibility for any injury to people or property resulting from any ideas, methods, instructions or products referred to in the content. |
© 2024 by the authors. Licensee MDPI, Basel, Switzerland. This article is an open access article distributed under the terms and conditions of the Creative Commons Attribution (CC BY) license (http://creativecommons.org/licenses/by/4.0/).
Copyright: This open access article is published under a Creative Commons CC BY 4.0 license, which permit the free download, distribution, and reuse, provided that the author and preprint are cited in any reuse.


