
Submitted:
30 December 2024
Posted:
30 December 2024
You are already at the latest version
Abstract
The study of honey in Iași County reveals its ecological, economic and health importance, emphasizing its unique properties, role in biodiversity and value in promoting sustainable beekeeping and regional identity. This study aimed to investigate the characteristics of honey from Iasi County, Romania, analyzing 27 samples collected in 2020 and 2021. The samples include: tilia (8 raw, 7 commercial), acacia (2 raw, 2 commercial), rapeseed (3 raw), sunflower (3 raw) and lavender (2 raw) honey. Analyses were carried out under Romanian/EU standards, assessing parameters such as: color, electrical con-ductivity, moisture, total soluble solids (TSS), acidity (free, lactone, total), pH, hydroxymethyl-furfural (HMF), ash and mineral composition (Na, K, Ca, Mg, Cu, Zn, Mn, Fe). The results revealed significant differences between raw and commercial honeys. Notably, in commercial tilia honey, higher values were found for color (38.58 mm Pfund vs. 24.14 mm Pfund), total acidity (25.93 meq·kg⁻¹ vs. 17.36 meq·kg⁻¹), and HMF levels (8.84 mg·kg⁻¹ vs. 3.68 mg·kg⁻¹). Conversely, water insoluble solids (0.08 % vs. 0.15 %) and ash content (0.21 % vs. 0.30 %) were lower in commercial samples. Potassium was the most abundant mineral detected, while copper and zinc levels were the lowest. Significant correlations were observed between several parameters, including ash with electrical conductivity and HMF with acidity. This study underscores the impact of processing on honey quality and highlights the importance of understanding honey composition for consumers and producers alike.
Keywords:
honey
; physico-chemical parameters
; HMF
; minerals
; raw
; commercial
; quality
1. Introduction
Honey, a natural product made by bees from the nectar of flowers, is known for its health benefits, nutritional value, and unique flavors. In Romania, honey has great cultural and agricultural importance. The diverse types of honey produced in the region reflect not only the country’s rich floral biodiversity, unique local climate and a long-standing beekeeping traditions but also reflect the profound and harmonious connection between nature and human [1,2].
The floral origin of honey is a key determinant of its unique properties and quality. A thorough understanding of its botanical source requires an integrated approach, combining melissopalynological, sensorial, and physicochemical analyses. When combined, these methods give a clear and reliable understanding of the honey's origin and authenticity. Melissopalynological analysis is particularly important because it identifies pollen types about the geographical and environmental origin of the honey. The analysis of pollen through melissopalynology is crucial for understanding how the characteristics of honey are linked to the specific regional biodiversity where it originates [3,4].
Scientific interest in honey characterization and quality assessment has increased due to the need to ensure both authenticity and health benefits of honey consumed by the public. The composition of honey is influenced by the botanical origin of the nectar, the bee species, geographic landforms, soil characteristics, potential environmental contaminants, beekeeping practices and honey processing methods. As a result, honey differs in its physicochemical properties, which significantly influence its quality, purity and suitability for commercial use [2,5,6].
The quality of honey is evaluated by means of physico-chemical parameters such as color, moisture content, specific gravity and total soluble solids, which are key indicators of its composition and the standards of its production [7,8,9].
Factors such as free acidity, lactone content, total acidity, pH, ash content and electrical conductivity are essential for the assessment of honey purity, authenticity and environmental influences [10,11,12].
Honey’s color varies according to its nectar source, offering important information about its botanical origin; excess of moisture content in the honey can cause fermentation, leading to a significant reduction in the product’s shelf life; the level of acidity affects tastes and preservation of honey [13,14,15]. pH influences its stability and flavor profile, while ash content and electrical conductivity reflects the mineral content and are used to differentiate floral origins of honey; hydroxymethylfurfural (HMF) is an indicator of honey quality and freshness [16,17,18].
The mineral elements present in honey, such as potassium (K), sodium (Na), calcium (Ca), magnesium (Mg), manganese (Mn), copper (Cu), iron (Fe) and zinc (Zn), contribute significantly to its nutritional and health-promoting properties [15,19,20].
Their concentrations, which reflect the environmental and geographic characteristics of the region, are influenced by the botanical source of the nectar and the soil composition [21,22]. In addition, these elements provide valuable insights into environmental conditions, acting as bioindicators of pollution and ecological health [23,24].
To ensure quality and authenticity, European regulations specify minimum pollen content limits for monofloral honey characterization. Melissopalynological analysis is commonly used to identify the botanical origin, pollen types and other characteristics of honey samples. According to European Union Council Directive 2001/110/EC, honey must meet specific physicochemical criteria to be deemed compliant; these include some limits of: water-insoluble solids: ≤0.1% (≤0.5% for pressed honey), moisture content: ≤20%, free acidity: ≤50 meq/kg, electrical conductivity: ≤0.8 mS/cm for nectar honeys (one of exceptions is tilia honey - can exceed this threshold) [25].
Despite its widespread use, knowledge regarding the chemical composition of raw and commercial honey remains crucial for ensuring its quality, authenticity, and safety for consumers.
The differences in composition between raw and commercially processed honey, especially regarding nutrient retention or loss, underline the importance of conducting thorough scientific analysis. The variation in chemical properties offers insights into the honey's origins, production processes as well as its preservation potential during storage [26].
Understanding the chemical composition and physicochemical properties of honey is essential for maintaining quality standards in the honey industry. The analysis of moisture, color, pH, total soluble solids, acidity, ash content, electrical conductivity, HMF and mineral elements provides valuable data for assessing honey's quality and ensuring that it meets both commercial and regulatory standards [27,28]. This article provides a comprehensive analysis of the diversity found in Romanian raw and commercial honey, focusing on its chemical composition. By evaluating the key physicochemical parameters, the study highlights the importance of understanding honey’s chemical composition to ensure consumer safety and protect the integrity of the honey market. The findings demonstrate the significant impact of processing methods on honey quality, emphasizing the need for both consumers and producers to understand honey's composition to make informed choices and maintain product authenticity.
2. Materials and Methods
2.1. Honey test samples
Raw and commercial 27 honey samples of Apis mellifera were collected from Iasi county, a north-easthen region of Romania, during 2020 and 2021 (Figure 1). The sample set comprised various types of honey: Tilia (T) with 8 samples of raw honey (T-R) and 7 samples of commercial honey (T-C), Acacia (A) with 2 samples of raw honey (A-R) and 2 samples of commercial honey (A-C), Rapeseed (R) with 3 raw honey samples (A-R), Sunflower (SF) with 3 raw honey samples (SF-R) and Lavender (L) with 2 raw honey samples (L-R).
Raw (R) honey samples are from artisanal beekeepers (T1, T3, T4, T5, T6, T9, T12, T15, A17, A19, R20, R21, R22, SF23, SF24, SF25, L26, L27). All commercial (C) honey samples were purchased from Iasi stores (T2, T7, T8, T10, T11, T13, T14, A16, A18). In Table 1 is presented the list of sample codes, harvest locations and years. The samples were stored in airtight glass containers in a dark environment, with the temperature maintained between 20°C and 25°C, until the chemical analyses were carried out.
2.2. Melissopalynological Analysis
The botanical origin of the 27 investigated monofloral honey samples was identified through the melissopalynological method proposed by Louvreaux. et al. (1978) [29], with some modifications to the sample dissolution process and to the centrifugation step (optimizing the time and speed) for improved pollen separation. Ten grams of the sample were dissolved in 20 mL of distilled water at 40-45 °C and mix thoroughly to dissolve the sugar crystals. The solution was centrifuged twice at 3500 rpm for 30 minutes. The supernatant liquid was removed and a solution of 5‰ sulfuric acid (Merck KGaA, Darmstadt, Germany) was added to the sediment and then centrifuged twice at the same time and speed using a UNIVERSAL 320 HETTICH centrifuge (Hettich GMBH, Tuttlingen, Germany). The sediment was placed on a glass slide in two separate drops and covered with lamella. The samples were examined by counting minimum 800 pollen grains with an optical microscope (Optika Microscopes Italy, Ponteranica, Italy) under a light microscope with a 40× and 100× objective lens [30,31].
2.3. Pfund value and color
The mm Pfund of honey samples were spectrophotometrically measured using the Shimadzu UV-1700 Pharma Spec instrument (manufacturer: Shimadzu Corporation, Analytical Instruments Division, Kyoto, Japan). A 50% (w/v) honey aqueous solution of honey sample was centrifuged at 3200 rpm for 5 minutes at UNIVERSAL 320 HETTICH centrifuge (Hettich GMBH – Tuttlingen, Germany) and measured at 635 nm wavelength. The obtained absorbance values were converted to mm Pfund using a mathematical formula [17]. Each value obtained in mm Pfund is associated with a specific color, the mm Pfund scale ranging from water white (0 mm Pfund) color to dark amber (140 mm Pfund) color.
2.4. Water Insoluble Solids (WIS)
Ten grams of honey sample weighed on the PI-214 DENVER analytical balance (Denver Instrument GMBH – Gottingen, Germany) were dissolved in distilled water and filtered through pre-weighed filter paper, washing several times. The sample was then dried in an ESAC 100 oven at 105 °C (SC Electronic April Aparatura Electronica Speciala S.R.L -Cluj-Napoca, Romania). The content of water insoluble solids (WIS) was calculated by subtracting the weight of the filter paper from weight of the filter paper with the insoluble solids, result expressed as a percentage. [31].
2.5. Moisture (M), Total Soluble Solids (TSS), Specific Gravity (SG)
Moisture (M) content in honey was determined using refractive index (RI) measurements using an ABBÉ Kruss AR 2008 refractometer (Kruss Scientific GMBH, Hamburg, Germany). Honey samples were gently heated to a temperature around 45 °C to ensure that all the crystals have dissolved. The temperature of the honey samples was established using Heidolph EKT Hei-Con temperature sensor (Heidolph Scientific Products GmbH, Schwabach, Germany) and the refractive index was corrected by adding 0.00023 for every 1 °C over 20 °C. Knowing the corrected refractive index, the moisture content was determined using the IR-M conversion table, expressed as a percentage [31].
The total soluble solids (TSS), which represent the total soluble sugars, expressed in degrees Brix (1 °Brix corresponding to 1% sugar at 20 °C) were determined using a refractive index-to-Brix conversion table at 20 °C [32].
The specific gravity was determined using the gravimetric method with a pycnometer, the obtained values were reported in g/cm3 [33].
2.6. pH, Free Acidity (FA), Lactonic Acidity (LA) and Total Acidity (TA)
The pH values of honey solutions were measured by dissolving 10 g of honey in 75 mL of distilled water. The measurements were performed using the MULTI 3320 multiparameter (WTW GMBH, Weilheim, Germany) [33]. To assess the free acidity, the honey solutions were titrated with 0.05N NaOH (Chemical Company, Romania) solution to a pH of 8.5. The lactonic acidity was determined by immediately adding 10 mL 0.05N NaOH and titrated with 0.05N HCl (Merck KGaA, Darmstadt, Germany) solution to 8.3 pH value. The total acidity of the honey samples was calculated by summing the free and lactonic acidity values, with the results expressed in meq kg−1 [34].
2.7. Ash and Electrical conductivity (EC)
The ash content of the honey was determined in two steps: burning and calcination in a furnace (Nabertherm B180, Nabertherm GMBH, Lilienthal, Germany); the ash content was expressed in g/100 g [31].
Electrical conductivity was measured using a MULTI 3320 multiparameter instrument (WTW GMBH, Weilheim, Germany) in a 20% solution of the sample (based on dry weight) prepared with ultrapure water (Barnstead EASY PURE II, Thermo Fisher Scientific Co. Ltd., Iowa, USA). The result was reported in mS·cm⁻¹ [33].
2.8. Hydroxymethylfurfural (HMF)
The spectrophotometric method described by White was used to quantify the hydroxymethylfurfural (HMF) content in honey. Five grams of honey were dissolved in 25 mL of distilled water and transferred into a 50 mL volumetric flask. A volume of 0.5 mL each of each Carrez solution I and Carrez solution II (Merck KGaA, Darmstadt, Germany) was added to the honey solution. and the final volume was adjusted to a volume of 50 mL with distilled water. The resulting solution was filtered through filter paper. The first 10 mL of the filtrate were eliminated and the next 5 mL of each aliquots of the filtered solution were transferred into two separate test tubes. One test tube was filled with distilled water up to the mark to prepare the sample solution, while the other was filled with 5 mL of 0.2% sodium bisulfite solution (Acros Organics, Geel, Belgium) to prepare the reference solution. The absorbance of both solutions was measured at wavelengths of 284 nm and 336 nm using a Shimadzu UV-1700 Pharma Spec spectrophotometer (Shimadzu Corporation, Analytical Instruments Division, Kyoto, Japan). The HMF concentration in the honey samples was then calculated using a specific formula and expressed in mg·kg−1 [35].
2.9. Mineral elements
For analysis, the honey samples were dissolved in deionized water produced by Milli-Q Integral Ultrapure Water-Type 1 at 18.2 MW × cm-1 (Merck, Darmstadt, Germany) at 65 °C. The obtained solutions were subsequently mineralized (Milestone START D Microwave Digestion System (Sorisole, Italy). All analytical-grade chemicals and reagents were sourced from reputable suppliers (Merck and Sigma Aldrich, Darmstadt, Germany) to ensure precision and reliability. A high-purity ICP Multi-Element Standard Solution (Merck, Darmstadt, Germany) was utilized for constructing calibration curves.
The concentrations of mineral elements in honey samples were determined by inductively coupled plasma mass spectrometry (ICP-MS) (iCAP Q ICP-MS, Thermo Fisher Scientific, Waltham, MA, USA). Standard solution for calibration were prepared by dilution from a ICP Multi-Element Standard Solution (Merck, Darmstadt, Germany).
All operations, steps and procedures for determining the elements were carried out in accordance with those described by Bora et al. (2024), including extraction conditions, instrumental analyses (calibration and operating parameters), quality control measures and analytical performance parameters [19].
2.10. Statistical analyses
The results were statistically processed using the software package STATISTICA 12.0 (StatSoft Inc). Possible significant correlations between the investigated parameters were tested by using Pearson’s correlation coefficient. Factor analysis (FA, Varimax normalized) was applied to obtain additional information on the contributions of the investigated parameters.
3. Results
3.1. Melissopalynological Analysis
Melissopalynological analysis confirmed the botanical origin of all the studied samples, honey samples reported by the beekeepers as well as honey samples collected from stores.
All honey samples were classified as monofloral based on the predominant pollen type observed. The most abundant plant families detected in the examined honey samples are presented in Figure 2.
3.2. Pfund value, Color, Water Insoluble Solids (WIS), Moisture (M), Total Soluble Solids (TSS), Specific Gravity (SG)
Table 2 presents the analysis results of the monofloral honey samples, detailing key parameters such as water insoluble solids (WIS), moisture (M), total soluble solids (TSS) and specific gravity (SG).
3.3. pH, Free Acidity (FA), Lactonic Acidity (LA), Total Acidity (TA), Ash, Electrical conductivity (EC) and Hydroxymethylfurfural (HMF)
Table 3 presents the results of important physicochemical parameters-pH, free acidity (FA), lactonic acidity (LA), total acidity (TA), ash, electrical conductivity (EC) and hydroxymethylfurfural (HMF) - analyzed in five types of honey.
3.4. Mineral elements (Na, K, Ca, Mg, Cu, Zn, Mn and Fe)
Table 4 presents the mineral content of eight elements (Na, K, Ca, Mg, Cu, Zn, Mn and Fe) determined in the five types of studied honey samples: tilia, acacia, rapeseed, sunflower and lavender.
3.5. Correlation and Multivariate statistical analysis
The Pearson correlation coefficients, commonly used to measure the degree of association between specific data sets, were calculated to determine the correlations between the analyzed parameters of raw tilia honey samples sourced directly from beekeepers (Table 5).
Table 6 illustrates the identified correlations between the physical and chemical parameters investigated specifically for commercial tilia honey samples. Table 7 presents the results of the ANOVA test, which was performed to evaluate the differences between raw and commercial honey samples.
In Table 8, Pearson correlation coefficients are calculated to determine the relationships between the parameters of the five types of honey studied.
Table 9 and Table 10 summarize the results of factor analysis (FA): Table 9 presenting the factor loadings (Varimax narmalized) and the explained variance (%) for the extracted principal components, where marked loadings exceed 0.700 and Table 10 providing the factor scores (Varimax normalized) for the extracted factors.
4. Discussion
4.1. Melissopalynological Analysis
Honey produced by Apis mellifera L. often reflects the botanical sources from which nectar and pollen are predominantly collected, resulting distinct types of monofloral honey. Each type is characterized by unique aroma and flavor profiles as well as specific pollen signatures, as described by Louveaux et al. (1978) [29]. To define monofloral honey, minimum pollen content thresholds have been standardized internationally, ensuring these honeys retain their distinctive physical, chemical and therapeutic properties.
Melissopalynological analysis categorizes pollen frequencies into four classes for identifying honey's botanical origins with precision: predominant pollen (PP) >45%, secondary pollen (SP) 15–45%, important minor pollen (IMP) 3–15%, and minor pollen (MP) <3% [10,36].
The minimum pollen percentage required to classify monofloral honeys varies among European countries, for example: Acacia honey (Robinia pseudoacacia) (Italy - 15%, Germany - 20%, Croatia - 20%, Serbia - 20%, Romania - 25%), Tilia (Tilia spp.) (Germany - 20%, Croatia - 25%, Serbia - 25%, Romania - 30%), Sunflower (Helianthus annuus) (Romania - 40%, Greece – 20%, Germany – 50%, Serbia – 40%), Rapeseed (Brassica napus) (Croatia - 60%, Germany - 80%), Lavender (Lavandula spp.) (Germany - 15%, Croatia - 10%, Serbia - 25%, Romania - 30%) [37,38,39]. In Latvia, the minimum pollen percentages needed to classify monofloral honeys are 70% for rapeseed (Brassica napus), 17% for lime (Tilia spp.), and 17% for lavender (Lavandula spp.). For other monofloral honeys, at least 45% of pollen from the same plant species is required, in accordance with national legislation [40].
The melissopalynological analysis conducted on the 27 honey samples confirmed their monofloral origin and revealed the presence of a diverse range of plant species. The examination not only validated the primary floral source but also emphasized the secondary pollen contributions, offering a deeper understanding of the botanical diversity within the foraging areas of the bees. Furthermore, the findings align with the requirements of Romanian legislation and similar international regulations, ensuring the authenticity and labeling accuracy of monofloral honey [38]. Figure 2 illustrates the distribution of the most abundant plant families identified in the analyzed honey samples, providing an overview of the dominant botanical sources. In honey samples were identified various pollen families: Apiaceae in 24 samples (<1%-5%), Asteraceae in all samples (2%-75%), Boraginaceae in 10 samples (<1%-11%), Brassicaceae in 25 samples (2%-74%), Cyperaceae in 7 samples (<1%-2%), Fabaceae in 27 samples (4%-43%), Fagaceae in 14 samples (<1%-10%), Lamiaceae in 26 samples (<1%-42%), Malvaceae in 21 samples (<1%-70%), Plantagigaceae in12 samples (<1%-3%), Poaceae in 18 samples (<1%-6%), Rosaceae in 22 samples (<1%-16%) and Salicaceae in 23 samples (<1%-7%).
Predominant pollen of Tilia sp. was found between of 49% and 70% in raw tilia honey samples and between of 45% and 66% in commercial tilia honey samples, Iasi county being known like Tilia county because of the tilia forests. In commercial acacia honey samples, the predominant pollen (Robinia sp.) accounted for 35% and 37%, which were lower compared to the percentages found in raw acacia honey samples, of 42% and 43%. All acacia honey samples have minimum pollen percentage required to classify monofloral honeys. Brassica sp. was dominant pollen in all rapeseed honey samples (70%-74%). The amount of Asteraceae (Helianthus sp.) in sunflower honey was found in the range 69%-75%. In the two lavender honey samples, the highest pollen percentage was from the Laminaceae family (Lavandula sp.) of 39% and 42% respectively, both below the established threshold of 45%. The honey is still considered monofloral lavender honey because certain plant species, like Lavandula spp., Citrus spp., Rosmarinus officinalis and Arbutus unedo, are known to be underrepresented in honey even when they are dominant nectar sources. Lavandula spp. honey can be classified as monofloral with as little as 15% pollen content due to its unique floral characteristics [21].
Lavender honey and tilia honey display significant variation in pollen composition across different regions due to environmental and floral diversity factors. In Portugal, lavender honey has been studied: Estevinho et al. (2016) reported Lavandula spp. pollen levels ranging between 33.17% and 36.27% and Anjos et al. (2021) found of 15% to 59% of pollen range, reflecting variability across regions [41,42]. In Turkey, lavender honey from the Isparta region showed even greater variation in pollen content, ranging from as low as 4% to as high as 76%. Specific studies found levels between 46% and 53% [7], 41.85% [43], and of 4% to 8% in studied samples [44].
tilia honey also exhibits regional differences in pollen composition. In Turkey, pollen levels typically range from 45% to 47%, although monofloral classification is possible even with lower levels. For example, Silici and Ülgen (2019) found tilia honey to be monofloral with pollen levels of 41.43% [43]. In Poland, tilia honey shows pollen concentrations between 20.4% and 41.4%, influenced by regional floral diversity [12]. In Hungary, tilia honey contains 45.89% Tilia sp. pollen, aligning more closely with higher thresholds for monofloral classification [45] but in the Czech Republic had a significantly lower pollen content of 22.8% [46]. In comparison to other studies, the pollen percentages for tilia honeys in some regions are lower than those found in our analyzed samples.
Robinia honey, also known as acacia honey, exhibits variability in pollen levels across different regions. In Turkey, pollen levels were found to range between 45% and 54% [7]. In Hungary, Robinia pseudoacacia pollen contributed 45.27% in acacia honey [45]. However, lower levels were observed in the Czech Republic, with an average pollen content of only 12.7% [46]. Other types of honey also show notable differences in pollen composition. In Hungary, sunflower honey contained 47.44% Helianthus annuus pollen [45], lower content compared to the content obtained in our samples. Rapeseed honey from the Czech Republic had a significantly higher pollen content, averaging 79.5% [46] and Brassica napus in the examined rapeseed Poland honeys ranged from 47.6% to 94.3% [47].
Accurately identifying honey's botanical origin is crucial for quality control and market authentication. In monofloral honey samples, overrepresented pollen types, such as Brassica napus (>60%), contrast with underrepresented types like Tilia sp. (1–56%), Robinia sp. (7–60%) and Lavandula sp. (1–42%) [48]. Pollen analysis, combined with sensory evaluation, physicochemical analysis and plant compound quantification, ensures accurate classification of honey. This process also connects the floral composition of honey with its nutritional value and potential therapeutic benefits [30].
4.2. Pfund value and color
Color greatly influences the perception of honey quality. Some people prefer light-colored honey, while others prefer dark-colored honey. These preferences may have a significant impact on the product's price, sometimes outweighing the importance of its composition and therapeutic quality [5]. The variation in honey color is influenced by factors including phenolic compounds, carotenoids, sugars, minerals, pollen, water content, floral source, geographical origin, and processing conditions [2,49].
In our study, the color of raw tilia honey ranged from 4.25 to 39.17 mm Pfund, while commercial honey exhibited a darker range of 12.94 to 55.48 mm Pfund (Table 2). This increased darkness in commercial honey may not solely result from climatic, geographical, or floral factors but could also be influenced by heating during processing, the technological steps involved, or extended storage durations.
The floral origin of tilia and specific processing conditions contribute to the darker color observed in some regions, resulting in tilia honey colors covering almost the entire Pfund scale. Other studies in Romania reported color ranges of 23.1–41.8 mm Pfund [2,10,49]. In Republic of Moldova, similar values of 22.00–38.00 mm Pfund were recorded [14], aligning with our findings. Notably, tilia honey from Hungary stands out for its darker color, with a broad range of 38.27–139.48 mm Pfund, approaching the upper limit of the Pfund scale [50].
The color of acacia honey varies widely according to the region and harvesting time, often measured in Pfund scale values. In Romania, this study found raw samples with lighter negative values (-0.06 to 0.14 mm Pfund) and commercial honey ranging from -0.77 to 0.01 mm Pfund. Other studies in Romania reported values such as 0.1–0.2 mm Pfund [2], 12.84 mm Pfund [10], and 11.00–45.00 mm Pfund [49].
Studies on acacia honey conducted in other countries have shown a large variation in color, as follows: in Hungary, Bodor et al. observed exceptionally light values of -7.26 mm Pfund, falling outside the typical Pfund range to 20.92 mm Pfund [50], in Serbia, Srećković et al. reported values averaging -4.30 ± 3.70 mm Pfund [51]. In Poland, studies showed a range of 0.1–49.8 mm Pfund [48] and -5.7 mm Pfund [52]. In the Czech Republic, Pospiech et al. (2021) anul found darker acacia honey with a Pfund value of 47.4 mm [46] and in Croatia, Flanjak et al. (2016) reported a range of 1.00–8.00 mm Pfund [9]. These differences in color reflect regional and processing variations in acacia honey.
In our study, the color of rapeseed honey ranged from 48.09 to 59.25 mm Pfund. In Romania, previous studies reported values between 45.2 and 73.7 mm Pfund [2], Pauliuc et al. (2022) observing a lower value of 36.14 mm Pfund [10] and in their study , Ratiu et al. (2020) noted a higher value of rapeseed honey of 94.13 mm Pfund [17].
In various studies from European countries, color range of rapeseed honey has been reported from as low as 2.08 mm Pfund to as high as 138.56 mm Pfund. In the Czech Republic, Pospiech et al. (2021) recorded a value of 73.3 mm Pfund [46]. The study from Poland found a range from 33.8 mm to 114.07 mm Pfund [17,48,52]. The rapeseed honey harvested from Hungury was characterized by a wide color variation, ranging from 2.08 mm to 138.56 mm Pfund [50].
Sunflower honey varies in color from white yellow to light amber, influenced by its origin, sunflower variety and processing methods. In our study, Romanian sunflower honey showed a color range of 11.64–13.07 mm Pfund, other findings reporting 15.5–53.9 mm Pfund [2], 33.66 mm Pfund [10] and 79.00–83.00 mm Pfund [49]. In Republic of Moldova, Chirsanova et al. (2021) a range of 39.00–41.00 mm Pfund [14]. Hungarian sunflower honey displayed much higher values, from 96.3 mm Pfund up to 198.91 mm Pfund, exceeding the typical Pfund scale [50]. Sunflower Polish honey samples ranged from 62.07–114.44 mm Pfund [17]; Portuguese sunflower honey was darker, with a value of 97.60 mm Pfund [53] and in Spain, the range of the sunflower honey color was 38–72 mm Pfund [54]. These variations highlight the influence of geographical origin and local factors on the color of sunflower honey.
The color of lavender honey samples ranged from 16.08 to 17.39 mm Pfund. In Romania, Pauliuc et al. (2022) reported a darker value of 63.86 mm Pfund [10]. Other studies highlight significant variations in lavender honey color across different regions. In Turkey, the color ranged from 25 mm Pfund to 35 mm Pfund [55]. Portuguese lavender honey showed values between 39.4 mm Pfund and 49.4 mm Pfund [53], while Moroccan samples exhibited a much wider range, from 71 mm Pfund to 150 mm Pfund [56].
4.3. Water Insoluble Solids (WIS), Moisture (M), Total Soluble Solids (TSS), Specific Gravity (SG)
Water-insoluble solids (WIS) in honey consist of various impurities such as bee body parts, plant remnants, pollen grains, wax fragments, even dust particles. [57]. All these impurities can influence the clarity of honey, a parameter valued by consumer’s acceptance. According to established honey quality standards, the permissible WIS content is limited to 0.1% for commercial-grade honey and up to 0.5% for unprocessed raw honey. [25,38]. In this case, the water-insoluble solids (WIS) content in honey samples varied across different floral sources and processing levels. For raw honey, the WIS content ranged from 0.073%–0.193% in tilia honey, 0.123–0.153% in rapeseed honey, 0.150%–0.233% in sunflower honey and 0.143%–0.160% in lavender honey. In raw acacia honey we obtained lower WIS values, between of 0.043% to 0.060%. For commercial honey, WIS content ranged from 0.043%–0.113% in tilia honey and 0.087%–0.103% in acacia honey. When comparing raw and commercial, raw honey samples generally contained higher WIS values than commercial honey samples. In this research, commercial acacia honey samples contained higher WIS values of 0.103% than raw acacia honey samples. According to established quality legislation all raw honey samples remained within the legal limit for unprocessed honey, certain commercial honey samples, such as tilia and acacia, occasionally approached or slightly exceeded the 0.1% threshold. Studies made on the blossom honey samples, from the Czech Republic market showed a content of water-insoluble solids under 0.1% (0.002%-0.070%) [58]
The processes through which honey undergoes to meet commercial standards can influence its quality both positively and negatively. For example, the filtration process used to clarify honey can positively affect its clarity and shelf-life, but it may also negatively impact its nutritional and therapeutic properties by removing beneficial components such as pollen [59].
The moisture content of honey is a critical parameter affecting its quality, stability and shelf-life. An increase in the water content of honey can initiate fermentation, leading to the degradation of the product. This process not only compromises the honey's quality but also results in undesirable changes to its sensorial, nutritional and physicochemical properties [60].
In this investigation, the moisture content of tilia honey ranged from 16.77% to 19.68%, with a slightly higher value observed in commercial honey compared to raw honey, aligning with the maximum allowable limit of 20% set by honey quality legislation (Table 2). Comparisons with data from other studies reveal variations based on geographic and climatic conditions, thus, in Romania, in Romania, the moisture content of tilia honey ranges from 14.50% to 18.80% [23,61,62]. Lower moisture content values of 14.62% and of 16.75% have been recorded in the studies conducted by Vijan et al. (2023) and Pauliuc et al. (2022) respectively [10,63]. In the Republic of Moldova, values were slightly higher, ranging from 18.70% to 19.89% [14]. Studies in Serbia reported moisture levels between 15.9–17.3% [64], 16.00–19.09% [18], and 15.8–17.1% [11]. In Poland, the reported values were 15.9–19.0% [12] and 19.05–20.50% [26]. Research from Turkey indicated a moisture content of 19.80% [7], while in the Czech Republic, it was 16.2% [46]; in Croatia, the moisture content of tilia honey ranged from 15.9–20.0% [9]. Importantly, all measured values in our study comply with the legal threshold of 20%, ensuring the quality and safety of the tilia honey analyzed.
The moisture content of acacia honey ranged from 18.21% to 20.01%, the maximum value registered at commercial honey, the maximum limit set by honey quality legislation (Table 2).
In Romania, the moisture content of acacia honey ranges from 15.40% to 18.60% [61,62], while other studies reported higher values, up to 22.8% % [23], surpassing the maximum limit established by legislation. Lower moisture content values of 15.96% and of 14.36% have been recorded in the studies conducted by Vijan et al. (2023) and Pauliuc et al. (2022) respectively [10,63].
Researches from countries such as Serbia (13.63-19.01%) [11,18,64], Czech Republic, Croatia and Germany (14.6-19.9%) [9,46,65]. shows that the moisture content of acacia honey generally falls below the 20% limit, indicating consistent compliance with quality standards in these regions. Can et al. (2015) reported a moisture content value for Turkish honey exceeding 20.80%, which surpasses the maximum limit established by legislation [7].
The moisture content of rapeseed honey in this study ranged from 17.51% to 19.89% (Table 2). All research conducted in Romania [10,61,63], as well as in other European countries, reported moisture content values below the 20% limit, ranging from 14.41% to 19.89% [11,46,64].
The sunflower honey samples analyzed in this study exhibited moisture levels close to the legislative limit of 20%, ranging from 19.60% to 19.96%. The moisture content of honey samples analyzed across various European countries generally ranged from 14.6% to 19.3%, with the exception of rapeseed honey from Spain, which recorded a maximum value of 21.2% [11,53,54,64].
For lavender honey, the moisture content was found to range from 18.20 % to 19.31%, values that ensure long-term quality (Table 2). Studies carried out on honey from Serbia, Spain, Portugal and Morocco obtained values ranged between 14.53% to 19.40% [8,11,53,56]; In Saudi Arabia and Turkey moisture content values in lavender honey were found from 15.5.% to 17.17% [44,55,65,67].
Values exceeding the maximum limit established by legislation, which could lead to adverse effects on the product, were recorded at 20.80% and at 25.2%; these values were reported by Can et al. for lavender honey from Turkey and by Juan-Borrás et al. (2015) for lavender honey from Spain [7,54].
Generally, total soluble solids (most of them consist of sugar) content is 80% or higher. According to USDA, honey above 80°Brix (<20% water) is qualitative and more stable during storage as moisture declines with increasing total soluble solids [32]. This classification is especially related to the additional insurance of water content (TSS is inversely related to water and to safety during storage for a longer period). Honey research in this study found TSS ranging from 78.57% in sunflower honey to 81.73% in raw tilia honey (Table 2).
The specific gravity of honey is inversely proportional to its humidity: the denser the honey, the less moisture it contains. This parameter is important to know if honey is fake and is of practical importance to monitor honey stock. The minimum average value of the specific gravity of 1.418 g/cm3 was found in the samples of sunflower honey and the maximum average value of 1.429 g/cm3 in the samples of raw tilia honey (Table 2).
4.5. pH, Free Acidity (FA), Lactonic Acidity (LA) and Total Acidity (TA)
Usually, the pH of honey is between 3.5 and 5.5. Between 3.93 and 4.69 were the pH average values of the analyzed honey samples (Table 3). Concentration of organic acids lowers honey pH, giving it acidic character. Results in the same range were found by other investigators, for example: the pH value of the Romanian honey has been reported to vary between 3.65 and 5.36 [2,10,23,62,63,66].
Honey's free acidity refers to its natural organic acids, which influence pH and taste, while lactone acidity represents bound acids that can release more acid when hydrolyzed. Total acidity is the sum of both and reflects the total acidity of the honey. Since high acidity may indicate fermentation or spoilage, these parameters are important in assessing the freshness, quality and safety of honey [1,62,66]. In order, to prevent degradation processes in honey, European legislation has a maximum recommendation for free acidity of 50 meq·kg-1 [25].
Analyzing of the 27 tested honey samples indicated that that the free acidity values are under the maximum recommended for free acidity of 50 meq·kg-1: raw tilia honey samples (5.05-19.61 meq·kg-1) had lower acidity than commercial tilia honey samples (12.74-25.00 meq·kg-1), probably due to processing. Acacia honey, with raw (10.19-10.58 meq·kg-1) slightly higher than commercial (6.37-7.93 meq·kg-1) is the least acidic and most stable. Rapeseed honey has moderate acidity (8.33-14.42 meq·kg-1), while sunflower honey acidity is consistently higher (14.95-17.89 meq·kg-1). Lavender honey has a moderate range of acidity, which varies from 10.82 to 12.38 meq kg-¹ (Table 3). Raw honey generally has a wider and more natural acidity range, while processing tends to make it more uniform.
Studies on the same types of honey have shown that acacia honey has the lowest free acidity (in Romania 3.86–25.40 meq·kg-1 [1,2,10,61,62,63], in other countries 5.46–24.62 meq·kg-1 [11,17,46,64]), while sunflower honey has the highest (in Romania 14.40–50.10 meq·kg-1 [61,62,63,66], in other countries 21.00–45.75 meq·kg-1) [11,17,53,64]. Higher free acidity values were also found in tilia honey (in Romania 3.40–38.60 meq·kg-1, in other countries 7.30–45.60 meq·kg-1) and rapeseed honey (in Romania 5.25–46.60 meq·kg-1 ) [2,10,61,63], in other countries 12.80–36.75 meq·kg-1) [17,46,64]. Regarding free acidity, values obtained for lavender honey from Serbia, Spain, Portugal, Morocco, and Turkey (14.40–38.90 meq·kg-1) were higher compared to those found in our research [8,11,41,53,55,56].
Sunflower honey samples have lower average values of 6.49 meq·kg-1 of lactonic acid and 22.91 meq·kg-1 of total acidity, comparable to previous studies such as Chiş and Purcărea (2015) who reported lactones of 9.98 meq·kg-1 and total acidity of 32.25 meq·kg-1 in sunflower honey from Bihor County, Romania [66]. Similarly, Acquarone et al. observed lactones of 1.80 meq·kg-1 and total acidity of 29.3 meq·kg-1 in sunflower honey from different geographical origins [13]. Aazaza et al. (2013) measured lactones and total acidity in sunflower honey from Portugal and reported values of 13.83 meq·kg-1 and 39.33 meq·kg-1, respectively [53]. These results illustrate the variability in the physicochemical characteristics of sunflower honey in different regions.
4.6. Ash and Electrical conductivity (EC)
Characteristics used to distinguish blossom honey from honeydew honey are ash and its positively correlated conductivity. The ash content reflects the macro- and micro-elements in honey; due to factors such as atmospheric conditions, soil mineral content, plant physiology and influenced by the composition of the collected nectar, ash content varies. Electrical conductivity of honey depends on ashes and acidity, since increased levels of ion, organic acid and protein increase conductivity [5,11,60].
In this report, the ash values content in honey samples were various: for raw honey, the ash content ranged from 0.091%–0.401% in tilia honey, 0.054–0.084% in rapeseed honey, 0.070%–0.235% in sunflower honey and 0.079%–0.083% in lavender honey. In raw acacia honey we obtained lower ash content values, between 0.044% and 0.053%. For commercial honey, ash content ranged from 0.156%–0.322% in tilia honey and 0.034%–0.037% in acacia honey (Table 3). Processing methods such as filtration and pasteurization, which remove impurities such as pollen and wax, are the reason that commercial honey has a lower ash content than raw honey. These impurities contribute to the ash content, so their removal results in a lower value in commercial honey.
Ash content in honey varies by region and flower origin, therefore, the researchers published the following data: for tilia honey, the ash content ranges between 0.11-0.20% in Romania, 0.21-0.50% [2,61,63] in Republic of Moldova and 0.23-0.46% [14] and in Serbia [64]. Acacia honey shows values from 0.07 to 0.19% in Romania from 0.02 to 0.09% [2,62,63] and in Serbia [64]. Rapeseed honey has an ash content of 0.09% in Romania and 0.05-0.14% in Serbia [63,64]. Sunflower honey ranges from 0.11-0.50% [62,63,66]. in Romania and 0.15-0.29% in Serbia [64]. The ash content obtained by Aazza et al. ranges from 0.11 to 0.18% in lavender honey from Portugal [53].
The average electrical conductivity (EC) values of the raw honey samples under investigation were: 0.667 mS·cm-1 for tilia, 0.187 mS·cm-1 for rapeseed, 0.360 mS·cm-1 for sunflower and 0.219 mS·cm-1 for lavender. The raw acacia honey had a lower average EC of 0.167 mS·cm-1, while the commercial honey had an EC of 0.494 mS·cm-1 for the tilia honey and 0.141 mS·cm-1 for the acacia honey (Table 3). Electrical conductivity, strongly correlated with ash content, was easily measured and integrated into updated honey quality standards. Current legislation sets a maximum limit of 0.8 mS·cm-1 for blossom honey. However, higher EC values, often exceeding this limit, may be found in certain types of honey, including tilia honey (Tilia spp.) [25].
In our study, four samples of raw tilia honey exceeded the maximum permissible value of 0.8 mS·cm-1, with values ranging from 0.817 to 0.841 mS·cm-1. The average EC for raw tilia honey was higher (0.667 mS·cm-1) compared to the average EC of 0.494 mS·cm-1 for commercial tilia honey samples.
Other studies conducted in Romanian highlight as honey from different regions reported lower EC values compared to our findings, with a maximum of 0.437 mS·cm-1 for tilia honey [2,10,23,63] and 0.268 mS·cm-1 for acacia honey [23,63,66]. Electrical conductivity values obtained from rapeseed and sunflower honeys, fall within the same range as those observed in our study [10,23,63,66].
Studies carried out on honey from other countries (Serbia, Croatia, Poland, Czech Republic, Portugal, Spain, Turkey) to determine electrical conductivity have shown values similar to those obtained in our study. Specifically, for tilia honey, the EC values ranged from 0.23 to 0.81 mS·cm-1 [7,8,11,12], for acacia honey from 0.08 to 0.60 mS·cm-1, for rapeseed honey from 0.05 mS·cm-1 to 0.28 mS·cm-1 [17,18,44,46] and for sunflower honey from 0.23 mS·cm-1 to 0.46 mS·cm-1 [53,55,64,67]. For lavender honey from Morocco, Chakir et al. (2016) reported higher EC values ranging from 0.319 mS·cm-1 to 0.547 mS·cm-1 [56].
4.7. Hydroxymethylfurfural (HMF)
Hydroxymethylfurfural (HMF) is a significant indicator of thermal processing and the degradation state of honey, reflecting its freshness and quality. High HMF levels, caused by heating or prolonged storage, can reduce honey's nutritional value and safety. The European Union has set a maximum limit of 40 mg·kg-1 to ensure honey quality [11,25,38]. The HMF content in fresh honey is typically around 10 mg·kg-1 [11]. Chiș and Purcărea (2015) demonstrated that heating honey increases its HMF (5-hydroxymethylfurfural) content. They found that heating tilia honey at 70°C for up to 12 hours did not exceed the European limit of 40 mg·kg-1. However, the HMF content increased significantly from 1.041 mg·kg-1 after one hour to 1301.116 mg·kg-1 after 24 hours [66]. In our analysis, the HMF levels in the studied honey samples were below the legal limit with values situated between of 1.26 mg·kg-1 at sunflower honey and of 14.72 mg·kg-1 at commercial tilia honey. However, commercial tilia and acacia honeys had higher values of 8.84 mg·kg-1 and of 5.12 mg·kg-1, respectively, compared to values of 3.68 mg·kg-1 and of 3.78 mg·kg-1 in raw honey (Table 3).
Analysis of honey from various countries has shown a wide range of HMF values. In Spain, HMF values ranged from <0.5 to 37.4 mg·kg-1 [8,54]; in Serbia, from 0.77 to 28.20 mg·kg-1 [11,18]; in Poland from 0.50 to 23.23 mg·kg-1 [12,26]; in the Czech Republic, HMF values fall within the 1.7-2.5 mg·kg-1range [46]; in Portugal, from 0.60 to 12.80 mg·kg-1 [53]; in Croatia, values are found between 0.00 and 2.40 mg·kg-1 [9]; in Turkey values are found to range from 2.51 to 12.56 mg·kg-1 [7,55]. In a sample of acacia honey from Germany, a low HMF value of 6.08 mg·kg-1 was reported [65].
Lower HMF values generally indicate better preservation and quality, while higher values suggest possible degradation due to excessive heat exposure or improper storage. Proper handling and storage practices are crucial to preserving honey quality and minimizing HMF formation.
4.8. Mineral elements (Na, K, Ca, Mg, Cu, Zn, Mn and Fe)
The mineral composition of honey varies based on its floral source, reflecting the unique characteristics of the plants from which bees collect nectar. Rich in essential minerals such as potassium with the highest content in honey, calcium, magnesium, sodium, phosphorus, iron, manganese, zinc, cooper and other mineral elements, honey offers both nutritional benefits and distinctive flavor and color profiles [19].
Some mineral elements found in honey play an important role in several biochemical processes. Potassium and sodium in honey act as electrolytes, supporting fluid balance, heart and muscle function, kidney health, blood pressure regulation, and nerve activity. Calcium is essential for bone health, fracture healing, preventing osteoporosis and proper musculoskeletal, nervous and cardiac function. Along with phosphorus, it is responsible for the reduction of the cariogenic potential of honey. Magnesium is essential for muscle contraction, neuronal signaling, bone support, and antioxidant enzyme activity. It also mitigates aging and related disorders [22,68].
The four mineral elements, Na, K, Ca and Mg, were found in all analyzed honey samples. The average sodium content ranged from 1.68 mg·kg-1 to 38.29 mg·kg-1, with the lowest values observed in sunflower honey samples and the highest in commercial acacia honey samples. Potassium content varied between 34.11 mg·kg-1 in commercial acacia honey samples and 1256.88 mg·kg-1 in rapeseed honey samples. Potassium is known to be present in higher quantities compared to other elements. In this study, the average potassium content was lower than sodium in commercial acacia honey samples. The highest calcium content was found in raw tilia honey samples at 114.83 mg·kg-1, while the lowest, of 12.67 mg·kg-1, was recorded in raw acacia honey samples. The average magnesium values ranged from 2.04 mg·kg-1 to 30.36 mg·kg-1, with the maximum content observed in lavender honey. In the samples analyzed in our research, K was the predominant element, followed by Ca, Na and Mg (Table 4).
The mineral element content (Na, K, Ca, and Mg) reported in various studies is summarized in Table 11.
Studies on the four mineral elements (Na, K, Ca, Mg) in the same type of honey from various countries reveal significant environmental differences, as reflected in the broad range of concentrations. In Romania, the recorded ranges were Na (3.02–47.70 mg·kg-1), K (45.35–1284.66 mg·kg-1), Ca (17.69–213.28 mg·kg-1) and Mg (2.17–84.45 mg·kg-1) [19,23]. In Latvia, the intervals were Na (5.10–7.00 mg·kg-1), K (320–1100 mg·kg-1), Ca (28–39 mg·kg-1) and Mg (13.50–13.80 mg·kg-1) [69].
In Serbia, Hungary, Slovenia and Poland, the concentrations of these elements fall within the following intervals: Na (2.06–160.04 mg·kg-1), K (46.35–2284.44 mg·kg-1), Ca (4.31–245.8 mg·kg-1) and Mg (3.12–72.31 mg·kg-1) [18,20,45,64,70,71]. The concentrations of these four elements in honey samples from Bulgaria and Portugal align with those reported in Serbia (Table 11) [53,72].
Additionally, lavender honey analyzed by Kolaily et al. (2023) exhibited particularly high concentrations of sodium (3551 mg·kg-1) and potassium (5117 mg·kg-1) [67].
Honey contains a variety of minerals, which is why it is often referred to as a complete food and a natural healing product. The other four mineral elements quantitatively evaluated from the five types of honey studied are copper, zinc, manganese, and iron. These trace elements are essential for various biological functions and are required by the body in small amounts [22,68].
Due to their low concentrations, these trace elements were undetectable in some honey samples, with concentration levels below the detection limit. Specifically, copper was not detected in seven tilia honey samples, including two commercial honey samples and in the two lavender honey samples. Zinc was undetectable in four tilia and three acacia honey samples, while manganese was quantifiable in four tilia honey samples, two rapeseed honey samples and one sunflower honey sample.
The results of the quantification of these elements show their heterogeneous distribution in the samples, reflecting the differences in environmental conditions and floral sources. Sunflower honey had the highest average copper concentration of 0.61 mg·kg-1, while lavender honey had the highest zinc concentration (1.14 mg·kg-1). The mean concentration of manganese varied between 0.74 mg·kg-1 and 3.38 mg·kg-1. In lavender honey, the highest concentration of iron was found at 111.01 mg·kg-1, while the lowest average concentration was observed in sunflower honey, with a value of 3.91 mg·kg-1.
In the samples analyzed in our research, iron had the highest average concentration among the four trace elements, followed by manganese, zinc and copper (Table 4).
The trace minerals concentration (Cu, Zn, Mn, Fe) recorded from various studies is summarized in Table 12.
As shown by the wide range of concentrations, studies of the four trace minerals in the same type of honey from different countries reveal significant environmental differences (Table 12).
In Romania, the reported ranges for trace elements were: Cu (LoQ–2.40 mg·kg-1), Zn (LoQ –4.80 mg·kg-1), Mn (LoQ –7.17 mg·kg-1) and Fe (LoQ –75.91 mg·kg-1) [19,23]. In Latvia, the intervals were: Mn (0.29-0.37 mg·kg-1), Fe (<0.075–1.40 mg·kg-1) and of <0.075 mg·kg-1 for Cu [69].
In Serbia, Hungary, Slovenia, Poland and Bulgaria, the concentrations of these elements are within the following ranges: Cu (LoQ –257.30 mg·kg-1), Zn (LoQ –7.59 mg·kg-1), Mn (0.08–4.72 mg·kg-1) and Fe (<0.005–154.39 mg·kg-1) [18,20,45,53,64,70,71,72] (Table 12). The iron concentration in Turkish lavender honey was found to be 3.57 mg·kg-1, as reported by Kolayli et al. (2023) [67].
4.9. Correlations Between the Investigated Variables
Performing a Pearson correlation between honey parameters is essential to determine the strength and direction of relationships between variables. It provides valuable insights into how environmental factors and compositional attributes interact to influence the physicochemical and mineral properties of honey.
In Table 5 are presented the Pearson coefficients for the correlation between raw tilia honey parameters. One can observe very strong correlations between moisture and total soluble solids (r=-1.00***) and specific gravity (r=-1.00***); total soluble solids with specific gravity (r=-1.00***); pH and free acidity (r=0.94***); total acidity with pH (r=-0.86**), with free acidity (r=0.85**), with cooper (r=0.81**) and zinc (r=0.77*); ash content with pH (r=0.77*); electrical conductivity with pH (r=0.81*), total acidity (r=-0.76*) and with ash (r=0.99***); calcium with sodium (r=0.73*); zinc with cooper (r=0.97***) and with iron (r=0.74*); free acidity with manganese (r=-0.75*); iron with HMF (r=0.81*).
In raw tilia honey, strong positive or negative correlations were observed between several parameters, with Pearson coefficients ranging from 0.50 to 0.70 (0.50 ≤ r ≤ 0.70). Thus, correlations were noticed between: mm Pfund with ash, electrical conductivity and magnesium; WIS with ash, electrical conductivity and calcium; potasium with moisture, TSS and specific gravity; pH with cooper and manganese; free acidity with ash and electrical conductivity; HMF with cooper and zinc; lactone acidity with zinc and iron, calcium with manganese and cooper with iron.
In Table 6 are presented the Pearson coefficients for the correlation between commercial tilia honey parameters. We observe very strong and strong correlation between mm Pfund with seven parameters: WIS (r=-0.55), pH (r=-0.85*), FA (r=0.86*), LA (r=0.58), TA (r=0.81*), HMF (r=0.51), K (r=-0.56), Cu (r=-0.66), Fe (r=-0.51), ash with moisture (r=-0.53), TSS (r=0.54) and specific gravity (r=0.53). Free, lactone and total acidity are correlated with several parameters (HMF, Na, K, Cu, Zn). Higher levels of HMF, often resulting from prolonged storage or heating, can contribute to increased acidity, minerals such as Na and K can influence the pH and buffer capacity of honey, indirectly affecting its acidity. It is noteworthy other important correlations: ash with electrical conductivity (r=0.90**); calcium and magnesium (r=-0.81*); cooper with zinc (r=0.85*); and iron with cooper (r=0.78*); and zinc (r=0.92**).
Table 7 presented ANOVA test for the differences between raw and commercial honeys. The differences between raw and commercial honey are evident in parameters such as the mm Pfund scale, water insoluble solids and hydroxymethylfurfural. Reflecting its natural, unprocessed state, raw honey tends to have a more varied color profile on the mm Pfund scale. It also contributes to its thicker consistency by containing higher levels of water-insoluble solids. In contrast, commercial honey is often subjected to filtration and heating treatment, which results in lower WIS and higher HMF levels, as HMF increases with heat and storage, indicating a potential for degradation. These factors illustrate the differences in quality and processing between raw and commercial honey.
Table 8 presents the Pearson coefficients for the correlations between all the parameters of the studied honey samples. Connections are observed between the mm Pfund scale, moisture, total soluble solids, acidity, ash content, and electrical conductivity and more other. Furthermore, a lot of correlations were found between the mineral elements and other parameters, as well as among between the mineral elements.
The correlations between the analyzed parameters show that honey has an interrelated composition. Changes in one factor are related to changes in others, reflecting its overall quality and characteristics.
Table 9 summarizes the results of factor analysis. In Table 10 the scores of the extracted factors are given.
Factor analysis gives an overview of all the data set and indicates the contributions from the determined quality parameters. Seven factors were selected with eigenvalues higher than 1.00, that explain about 90% of the total variance. The loadings and corresponding eigenvalues and variances are presented in Table 9.
Factor 1 is characterized by moisture, total soluble solids and specific gravity as parameters with significant loadings, and can be attributed to some fundamental stability characteristics of the product. The corresponding scores (Table 10) indicate that this factor does not highlight a particular honey type, but all the main contributing honeys are raw. Significant contributions are given by tilia (T3, T5, T9) and rapeseed (R21) and moderate contributions from tilia (T12), rapeseed (R22), acacia (A19) and sunflower (SF23, SF25).
The second factor, Factor 2, explains 18.73% of variance and reflects the acidity, including free and total acidity as dominant parameters. The scores for this factor highlight the tilia samples.
Factor 3 with high loadings of WIS has the main contributions from acacia and rapeseed honeys.
K and color are interestingly grouped in Factor 4, explaining about 13% of the variance, with main contribution from rapeseed honeys.
Factor 5 includes as dominant parameters pH, ash, electrical conductivity, Mg and Cu, defining a mineral factor, with dominant contributions from tilia T3 and T4 honeys. Factor 6 indicates the contribution of Fe from the lavender honey samples. In Factor 7 only the lactone acidity has a significant loading, given mainly by tilia honeys.
5. Conclusions
The diversity of mono- and polyfloral honeys is due to the overlapping flowering periods of different plants. Melissopalynological analysis is important to confirm floral origin, maintain quality and discover the health benefits of specific plants.
This analysis helps to identify the main nectar sources used by the bees and verifies the botanical origin of the honey. The wide variety of pollen types shows how environmental factors and plant diversity positively affect the composition of honey.
All parameters tested were within legal limits, indicating that both raw and commercial honey are of good quality. Although there are significant differences between certain quality parameters, such as color, water insoluble solids and hydroxymethylfurfural, the honey quality proves that beekeepers and honey processors in the region have improved production methods.
Differences in mineral concentrations in honey reflect both plant diversity and the surrounding environment, including water, air, and soil. The composition of the environment is reflected in raw honey, proving that bees are reliable bioindicators of environmental health.
The investigated quality parameters and the relationships between them indicate a good environmental quality, valuable natural resources and appropriate honey processing techniques in the region.
Author Contributions
Conceptualization, A.A., O.R.R. and V.S.; methodology, A.A., O.R.R., F.D.B., V.S.; software, A.A., F.D.B., S.M.C.M.; validation, A.A., O.R.R., F.D.B., V.S. and S.M.C.M.; formal analysis, A.A., O.R.R., F.D.B., S.M.C.M.; investigation, A.A., O.R.R., V.S., E.C.N., I.S.B.; resources, A.A., O.R.R., V.S., E.C.N., I.S.B.; data curation, A.A., O.R.R., V.S., S.M.C.M.; writing—original draft preparation, A.A., O.R.R., V.S., S.M.C.M., E.C.N., I.S.B.; writing—review and editing, A.A., O.R.R., V.S., S.M.C.M.; visualization, A.A., O.R.R., I.S.B.; supervision, A.A., O.R.R., V.S.; project administration, A.A., O.R.R., V.S. All authors have read and agreed to the published version of the manuscript.
Funding
This research received no external funding.
Institutional Review Board Statement
Not applicable.
Conflicts of Interest
The authors declare no conflicts of interest.
References
- Pauliuc, D.; Dranca, F.; Oroian, M. Antioxidant Activity, Total Phenolic Content, Individual Phenolics and Physicochemical Parameters Suitability for Romanian Honey Authentication. Foods 2020, 9, 306. [Google Scholar] [CrossRef] [PubMed]
- Pop, I.M.; Simeanu, D.; Cucu-Man, S.-M.; Pui, A.; Albu, A. Quality Profile of Several Monofloral Romanian Honeys. Agriculture 2023, 13, 75. [Google Scholar] [CrossRef]
- Dobre, I.; Alexe, P.; Escuredo, O.; Seijo, C.M. Palynological evaluation of selected honeys from Romania. Grana 2013, 52, 113–121. [Google Scholar] [CrossRef]
- Persano Oddo, L.; Piro, R. Main European Unifloral Honeys: Descriptive Sheets. Apidologie 2004, 35, S38–S81. [Google Scholar] [CrossRef]
- da Silva, P.M.; Gauche, C.; Gonzaga, L.V.; Costa, A.C.O.; Fett, R. Honey: Chemical composition, stability and authenticity. Food Chem. 2016, 196, 309–323. [Google Scholar] [CrossRef] [PubMed]
- Tarapoulouzi, M.; Mironescu, M.; Drouza, C.; Mironescu, I.D.; Agriopoulou, S. Insight into the Recent Application of Chemometrics in Quality Analysis and Characterization of Bee Honey during Processing and Storage. Foods 2023, 12, 473. [Google Scholar] [CrossRef]
- Can, Z.; Yildiz, O.; Sahin, H.; Akyuz Turumtay, E.; Silici, S.; Kolayli, S. An Investigation of Turkish Honeys: Their Physico-Chemical Properties, Antioxidant Capacities and Phenolic Profiles. Food Chem. 2015, 180, 133–141. [Google Scholar] [CrossRef]
- Castro-Vázquez, L.; León-Ruiz, V.; Alañón, M. E.; Pérez-Coello, M. S.; González-Porto, A. V. Floral Origin Markers for Authenticating Lavandin Honey (Lavandula angustifolia × latifolia): Discrimination from Lavender Honey (Lavandula latifolia). Food Control 2014, 37, 362–370. [Google Scholar] [CrossRef]
- Flanjak, I.; Kenjerić, D.; Bubalo, D.; Primorac, L. Characterisation of Selected Croatian Honey Types Based on the Combination of Antioxidant Capacity, Quality Parameters, and Chemometrics. Eur. Food Res. Technol. 2016, 242, 467–475. [Google Scholar] [CrossRef]
- Pauliuc, D.; Dranca, F.; Ropciuc, S.; Oroian, M. Advanced Characterization of Monofloral Honeys from Romania. Agriculture 2022, 12, 526. [Google Scholar] [CrossRef]
- Sakač, M.; Jovanov, P.; Marić, A.; Četojević-Simin, D.; Novaković, A.; Plavšić, D.; Škrobot, D.; Kovač, R. Antioxidative, Antibacterial and Antiproliferative Properties of Honey Types from the Western Balkans. Antioxidants 2022, 11, 1120. [Google Scholar] [CrossRef]
- Waś, E.; Rybak-Chmielewska, H.; Szczęsna, T.; Kachaniuk, K.; Teper, D. Characteristics of Polish unifloral honeys. II. Lime honey (Tilia spp.). J. Apic. Sci. 2011, 55, 1–8. [Google Scholar]
- Acquarone, C.; Buera, P.; Elizalde, B. Pattern of pH and Electrical Conductivity upon Honey Dilution as a Complementary Tool for Discriminating Geographical Origin of Honeys. Food Chem. 2007, 101. [Google Scholar] [CrossRef]
- Chirsanova, A.; Capcanari, T.; Boistean, A. Quality Assessment of Honey in Three Different Geographical Areas from Republic of Moldova. Food Nutr. Sci. 2021, 12, 962–977. [Google Scholar] [CrossRef]
- Mărgăoan, R.; Topal, E.; Balkanska, R.; Yücel, B.; Oravecz, T.; Cornea-Cipcigan, M.; Vodnar, D.C. Monofloral Honeys as a Potential Source of Natural Antioxidants, Minerals and Medicine. Antioxidants 2021, 10, 1023. [Google Scholar] [CrossRef]
- Milosavljević, S.; Jadranin, M.; Mladenović, M.; Tešević, V.; Menković, N.; Mutavdžić, D.; Krstić, G. Physicochemical Parameters As Indicators of the Authenticity of Monofloral Honey from the Territory of the Republic of Serbia. Maced. J. Chem. Chem. Eng. 2021, 40, 57–67. [Google Scholar] [CrossRef]
- Ratiu, I.A.; Al-Suod, H.; Bukowska, M.; Ligor, M.; Buszewski, B. Correlation study of honey regarding their physicochemical properties and sugars and cyclitols content. Molecules 2020, 25, 34. [Google Scholar] [CrossRef]
- Spirić, D.; Ćirić, J.; Đorđević, V.; Nikolić, D.; Janković, S.; Nikolić, A.; Petrović, Z.; Katanić, N.; Teodorović, V. Toxic and Essential Element Concentrations in Different Honey Types. Int. J. Environ. Anal. Chem. 2019, 99(12), 1032–1046. [Google Scholar] [CrossRef]
- Bora, F.D.; Andrecan, A.F.; Călugăr, A.; Bunea, C.I.; Popescu, M.; Petrescu-Mag, I.V.; Bunea, A. Comprehensive Elemental Profiling of Romanian Honey: Exploring Regional Variance, Honey Types, and Analyzed Metals for Sustainable Apicultural and Environ-mental Practices. Foods 2024, 13, 1253. [Google Scholar] [CrossRef]
- Pavlin, A.; Kočar, D.; Imperl, J.; Kolar, M.; Marolt, G.; Petrova, P. Honey Origin Authentication via Mineral Profiling Combined with Chemometric Approaches. Foods 2023, 12, 2826. [Google Scholar] [CrossRef]
- Soares, S.; Amaral, J.S.; Oliveira, M.B.P.; Mafra, I. A comprehensive review on the main honey authentication issues: Production and origin. Compr. Rev. Food Sci. Food Saf. 2017, 16, 1072–1100. [Google Scholar] [CrossRef] [PubMed]
- Solayman, M.; Islam, M.A.; Paul, S.; Ali, Y.; Khalil, M.I.; Alam, N.; Gan, S.H. Physicochemical properties, minerals, trace elements, and heavy metals in honey of different origins: A comprehensive review. Compr. Rev. Food Sci. Food Saf. 2016, 15, 219–233. [Google Scholar] [CrossRef] [PubMed]
- Stihi, C.; Chelarescu, E.D.; Duliu, O.G.; Toma, L.G. Characterization of Romanian honey using physico-chemical parameters and the elemental content determined by analytical techniques. Rom. Rep. Phys. 2016, 68, 362–369. [Google Scholar]
- Tudoreanu, L.; Codreanu, M. D.; Crivineanu, V.; Goran, G. V. The Quality of Romanian Honey Varieties - Mineral Content and Textural Properties. Bull. USAMV 2012, 69, 1–7. [Google Scholar] [CrossRef] [PubMed]
- European Commission. Council Directive 2001/110/CE concerning honey. Off. J. Eur.Comm. 2002, L10, 47–52. [Google Scholar]
- Miłek, M.; Bocian, A.; Kleczynśka, E.; Sowa, P.; Dżugan, M. The Comparison of Physicochemical Parameters, Antioxidant Activity and Proteins for the Raw Local Polish Honeys and Imported Honey Blends. Molecules 2021, 26, 2423. [Google Scholar] [CrossRef] [PubMed]
- Raweh, H.S.A.; Badjah-Hadj-Ahmed, A.Y.; Iqbal, J.; Alqarni, A.S. Physicochemical Composition of Local and Imported Honeys Associated with Quality Standards. Foods 2023, 12, 2181. [Google Scholar] [CrossRef] [PubMed]
- Rysha, A.; Kastrati, G.; Biber, L.; Sadiku, V.; Rysha, A.; Zogaj, F.; Kabashi-Kastrati, E. Evaluating the Physicochemical Properties of Some Kosovo’s and Imported Honey Samples. Appl. Sci. 2022, 12, 629. [Google Scholar] [CrossRef]
- Louveaux, J.; Maurizio, A.; Vorwohl, G. Methods of Melissopalynology. Bee World 1978, 59, 139–157. [Google Scholar] [CrossRef]
- Von Der Ohe, W.; Persano Oddo, L.; Piana, M.L.; Morlot, M.; Martin, P. Harmonized Methods of Melissopalynology. Apidol-ogie 2004, 35, S18–S25. [Google Scholar] [CrossRef]
- SR (Romanian Standard) 784-3:2009: Honey bee. Part 3: Analytical methods. Available online: https://e-standard.eu/en/standard/174480 (accessed on 16 April 2018).
- USDA. Extracted Honey Grading Manual, United States Department of Agriculture. Standards for Honey Grading; USDA: Washing-ton, DC, USA, 1985; Available online: https://www.ams.usda.gov/sites/default/files/media/Extracted_Honey_Inspection_Instructions%5B1%5D.pdf (accessed on 10 December 2018).
- Bogdanov, S. 2009: Harmonized Methods of the International Honey Commission. Available online: https://www.ihc-platform. net/ihcmethods2009.pdf (accessed on 30 May 2018).
- White, J.W. Determination of Acidity, Nitrogen, and Ash in Honey. Journal of Association of Official Agricultural Chemists 1962, 459, 548–551. [Google Scholar] [CrossRef]
- White, J.W., Jr. Spectrophotometric method for hydroxymethylfurfural in honey. AOAC 1979, 62, 509–514. [Google Scholar] [CrossRef]
- Bobiș, O.; Mărghitaș, L.A.; Dezmirean, D.S.; Bărnuțiu, L.I.; Mărgăoan, R.; Bogdan Gher-man, B.; Bonta, V. The Importance of Melissopalynology in Addition to Physical-chemical Analysis on Botanical Authenticity Testing of Monofloral Honey. Bull. UASVM Anim. Sci. Biotechnol. 2013, 70, 24–30. [Google Scholar]
- Thrasyvoulou, A.; Tananaki, C.; Goras, G.; Karazafiris, E.; Dimou, M.; Liolios, V.; Kanelis, D.; Gounari, S. Legislation of Honey Criteria and Standards. J. Apic. Res. 2018, 57, 88–96. [Google Scholar] [CrossRef]
- SR (Romanian Standard) 784-2:2009 Honey bee. Part 2: Quality Requirements at Sale. Available online: https://e-standard.eu/en/standard/174481 (accessed on 16 April 2018).
- Tedesco, R.; Scalabrin, E.; Malagnini, V.; Strojnik, L.; Ogrinc, N.; Capodaglio, G. Character-ization of Botanical Origin of Italian Honey by Carbohydrate Composition and Volatile Organic Compounds (VOCs). Foods 2022, 11, 2441. [Google Scholar] [CrossRef] [PubMed]
- Requirements for Food Quality Schemes, Procedures for the Implementation, Operation, Monitoring, and Control Thereof. Annex 7. 2014. Available online: https://likumi.lv/ta/en/en/id/268347-requirements-for-food-quality-schemes-procedures-for-theimplementation-operation-monitoring-and-control-thereof (accessed on 9 December 2024).
- Estevinho, L.M.; Chambó, E.D.; Pereira, A.P.R.; Carvalho, C.A.L.d.; Toledo, V.d.A.A.d. Characterization of Lavandula spp. honey using multivariate techniques. PLoS ONE 2016, 11. [Google Scholar] [CrossRef] [PubMed]
- Anjos, O.; Guiné, R. P. F.; Santos, A. J. A.; Paula, V. B.; Pereira, H.; Estevinho, L. M. Evaluation of FT-Raman and FTIR-ATR Spectroscopy for the Quality Evaluation of Lavandula spp. Honey. Open Agric. 2018, 3, 47–56. [Google Scholar] [CrossRef]
- Silici, S.; Ülgen, N. Bioactive Properties of Blossom and Honeydew Honeys. Mellifera 2019, 19, 36–47. [Google Scholar]
- Kolaylı, S.; Can, Z.; Kara, Y.; Özkök, A.; Ozmert Ergin, S.; Kemal, M.; Demir Kanbur, E. Physicochemical Characteristics, Phenolic Components, and Antioxidant Capacities of Lavender Honey (Lavandula spp.) from Isparta Region of Türkiye. Chem. Biodivers. 2024, 21. [Google Scholar] [CrossRef] [PubMed]
- Bodó, A.; Radványi, L.; K˝oszegi, T.; Csepregi, R.; Nagy, D.U.; Farkas, Á.; Kocsis, M. Quality Evaluation of Light- and Dark-Colored Hungarian Honeys, Focusing on Botanical Origin, Antioxidant Capacity and Mineral Content. Molecules 2021, 26, 2825. [Google Scholar] [CrossRef] [PubMed]
- Pospiech, M.; Javůrková, Z.; Hrabec, P.; Cížková, H.; Titěra, D.; Štarha, P.; Ljasovská, S.; Kružík, V.; Podskalská, T.; Bednář, J.; et al. Physico-Chemical and Melissopalynological Characterization of Czech Honey. Appl. Sci. 2021, 11, 4989. [Google Scholar] [CrossRef]
- Stawiarz, E. Pollen Spectrum of Rapeseed Honey from the Sandomierska Upland Area. J. Apic. Sci. 2008, 52, 83–91. [Google Scholar]
- Puścion-Jakubik, A.; Bielecka, J.; Grabia, M.; Markiewicz-Żukowska, R.; Soroczyńska, J.; Teper, D.; Socha, K. Comparative Analysis of Antioxidant Properties of Honey from Poland, Italy, and Spain Based on the Declarations of Producers and Their Results of Melissopalinological Analysis. Nutrients 2022, 14, 2694. [Google Scholar] [CrossRef] [PubMed]
- Al, M.L.; Daniel, D.; Moise, A.; Bobis, O.; Laslo, L.; Bogdanov, S. Physico-chemical and bioactive properties of different floral origin honeys from Romania. Food Chem. 2009, 112, 863–867. [Google Scholar] [CrossRef]
- Bodor, Z.; Benedek, C.; Urbin, A.; Szabó, A.; Sipos, L. Color of Honey: Can We Trust the Pfund Scale? – An Alternative Graphical Tool Covering the Whole Visible Spectra. LWT - Food Sci. Technol. 2021, 149, 111872. [Google Scholar] [CrossRef]
- Srećković, N. Z.; Mihailović, V. B.; Katanić Stanković, J. S. Physico-Chemical, Antioxidant and Antimicrobial Properties of Three Different Types of Honey from Central Serbia. Kragujevac J. Sci. 2019, 41, 53–68. [Google Scholar] [CrossRef]
- Majewska, E.; Drużyńska, B.; Derewiaka, D.; Ciecierska, M.; Pakosz, P. Comparison of Antioxidant Properties and Color of Selected Polish Honeys and Manuka Honey. Foods 2024, 13, 2666. [Google Scholar] [CrossRef]
- Aazza, S.; Lyoussi, B.; Antunes, D.; Miguel, M.G. Physicochemical Characterization and Antioxidant Activity of Commercial Portuguese Honeys. J. Food Sci. 2013, 78, 1159–1165. [Google Scholar] [CrossRef]
- Juan-Borrás, M.; Domenech, E.; Conchado, A.; Escriche, I. Physicochemical Quality Parameters at the Reception of the Honey Packaging Process: Influence of Type of Honey, Year of Harvest, and Beekeeper. J. Chem. 2015, 929658, 1–6. [Google Scholar] [CrossRef]
- Beykaya, M. Determination of Physiochemical Properties of Raw Honey Samples. Progr Nutr 2021, 23. [Google Scholar]
- Chakir, A.; Romane, A.; Marcazzan, G. L.; Ferrazzi, P. Physicochemical Properties of Some Honeys Produced from Different Plants in Morocco. Arab. J. Chem. 2016, 9 (Supplement 1), S946–S954. [Google Scholar] [CrossRef]
- Crane, E. Honey: A Comprehensive Survey; Heinemann: London, UK, 1979. [Google Scholar]
- Čelechovská, O.; Vorlová, L. Groups of honey—Physicochemical properties and heavy metals. Acta Vet. Brno 2001, 70, 91–95. [Google Scholar] [CrossRef]
- Codex Alimentarius, Alinorm 01/25, Joint FAO/WHO Food Standard Programme, Codex Alimentarius Commission Twenty-fourth Session, Geneva, 2–7 July 2001. Available online: www.fao.org/download/report/277/Al01_25e (accessed on 19 June 2019).
- Albu, A.; Simeanu, C.; Pop, I.M.; Pui, A.; Tarcău, D.; Cucu-Man, S.-M. Selected Characteristics of Multifloral Honeys from North-Eastern Romania. Agriculture 2024, 14, 26. [Google Scholar] [CrossRef]
- Isopescu, R. D.; Josceanu, A. M.; Minca, I.; Colta, T.; Postelnicescu, P.; Mateescu, C. Characterization of Romanian Honey Based on Physico-Chemical Properties. Rev. Chim. (Bucharest) 2014, 65, 381–385. [Google Scholar]
- Oroian, M.; Sănduleac, E. T.; Pădureț, S. Physicochemical and Textural Properties of Honeys from North East Part of Romania. Food Environ. Saf. 2016, 15, 234–239. [Google Scholar]
- Vîjan, L.E.; Mazilu, I.C.; Enache, C.; Enache, S.; Topală, C.M. Botanical Origin Influence on Some Honey Physicochemical Characteristics and Antioxidant Properties. Foods 2023, 12, 2134. [Google Scholar] [CrossRef]
- Ðogo Mračević, S.; Krstić, M.; Lolić, A.; Ražić, S. Comparative study of the chemical composition and biological potential of honey from different regions of Serbia. Microchem. J. 2020, 152, 104420. [Google Scholar] [CrossRef]
- Alzahrani, H. A.; Alsabehi, R.; Boukraa, L.; Abdellah, F.; Bellik, Y.; Bakhotmah, B. A. Antibacterial and Antioxidant Potency of Floral Honeys from Different Botanical and Geographical Origins. Molecules 2012, 17, 10540–10549. [Google Scholar] [CrossRef] [PubMed]
- Chiş, A.M.; Purcărea, C. The phisico-chemical caracterisation of sun flower honey from bihor county. An. Univ. Din Oradea Fasc. Ecotoxicologie Zooteh. Şi Tehnol. Ind. Aliment. 2015, 14, 107–114. [Google Scholar]
- Kolayli, S.; Asadov, E.; Kanbur, E. D. Botanical, Physicochemical, and Biochemical Properties of Lavender (Lavandula spp.) Honey: A Case Report Study. 7th Int. Educ. Innov. Sci. Congr., May 12–13, Azerbaijan State Pedagogical University, 2023, 43.
- Kamaruzzaman, M.A.; Chin, K.-Y.; Ramli, E.S.M. A Review of Potential Beneficial Effects of Honey on Bone Health. Evid. Based Complement. Altern. Med. 2019, 2019, 8543618. [Google Scholar] [CrossRef] [PubMed]
- Labsvards, K.D.; Rudovica, V.; Borisova, A.; Kokina, K.; Bertins, M.; Naumenko, J.; Viksna, A. Multi-Element Profile Characterization of Monofloral and Polyfloral Honey from Latvia. Foods 2023, 12, 4091. [Google Scholar] [CrossRef]
- Sajtos, Z.; Herman, P.; Harangi, S.; Baranyai, E. Elemental Analysis of Hungarian Honey Samples and Bee Products by MP-AES Method. Microchem. J. 2019, 149, 103968. [Google Scholar] [CrossRef]
- Tarapatskyy, M.; Sowa, P.; Zaguła, G.; Dzugan, M.; Puchalski, C. Assessment of the Botanical Origin of Polish Honeys Based on Physicochemical Properties and Bioactive Components with Chemometric Analysis. Molecules 2021, 26, 4801. [Google Scholar] [CrossRef] [PubMed]
- Atanassova, J.; Yurukova, L.; Lazarova, M. Pollen and Inorganic Characteristics of Bulgarian Unifloral Honeys. Czech J. Food Sci. 2012, 30, 520–526. [Google Scholar] [CrossRef]
Figure 1.
The harvested areas from Iasi County
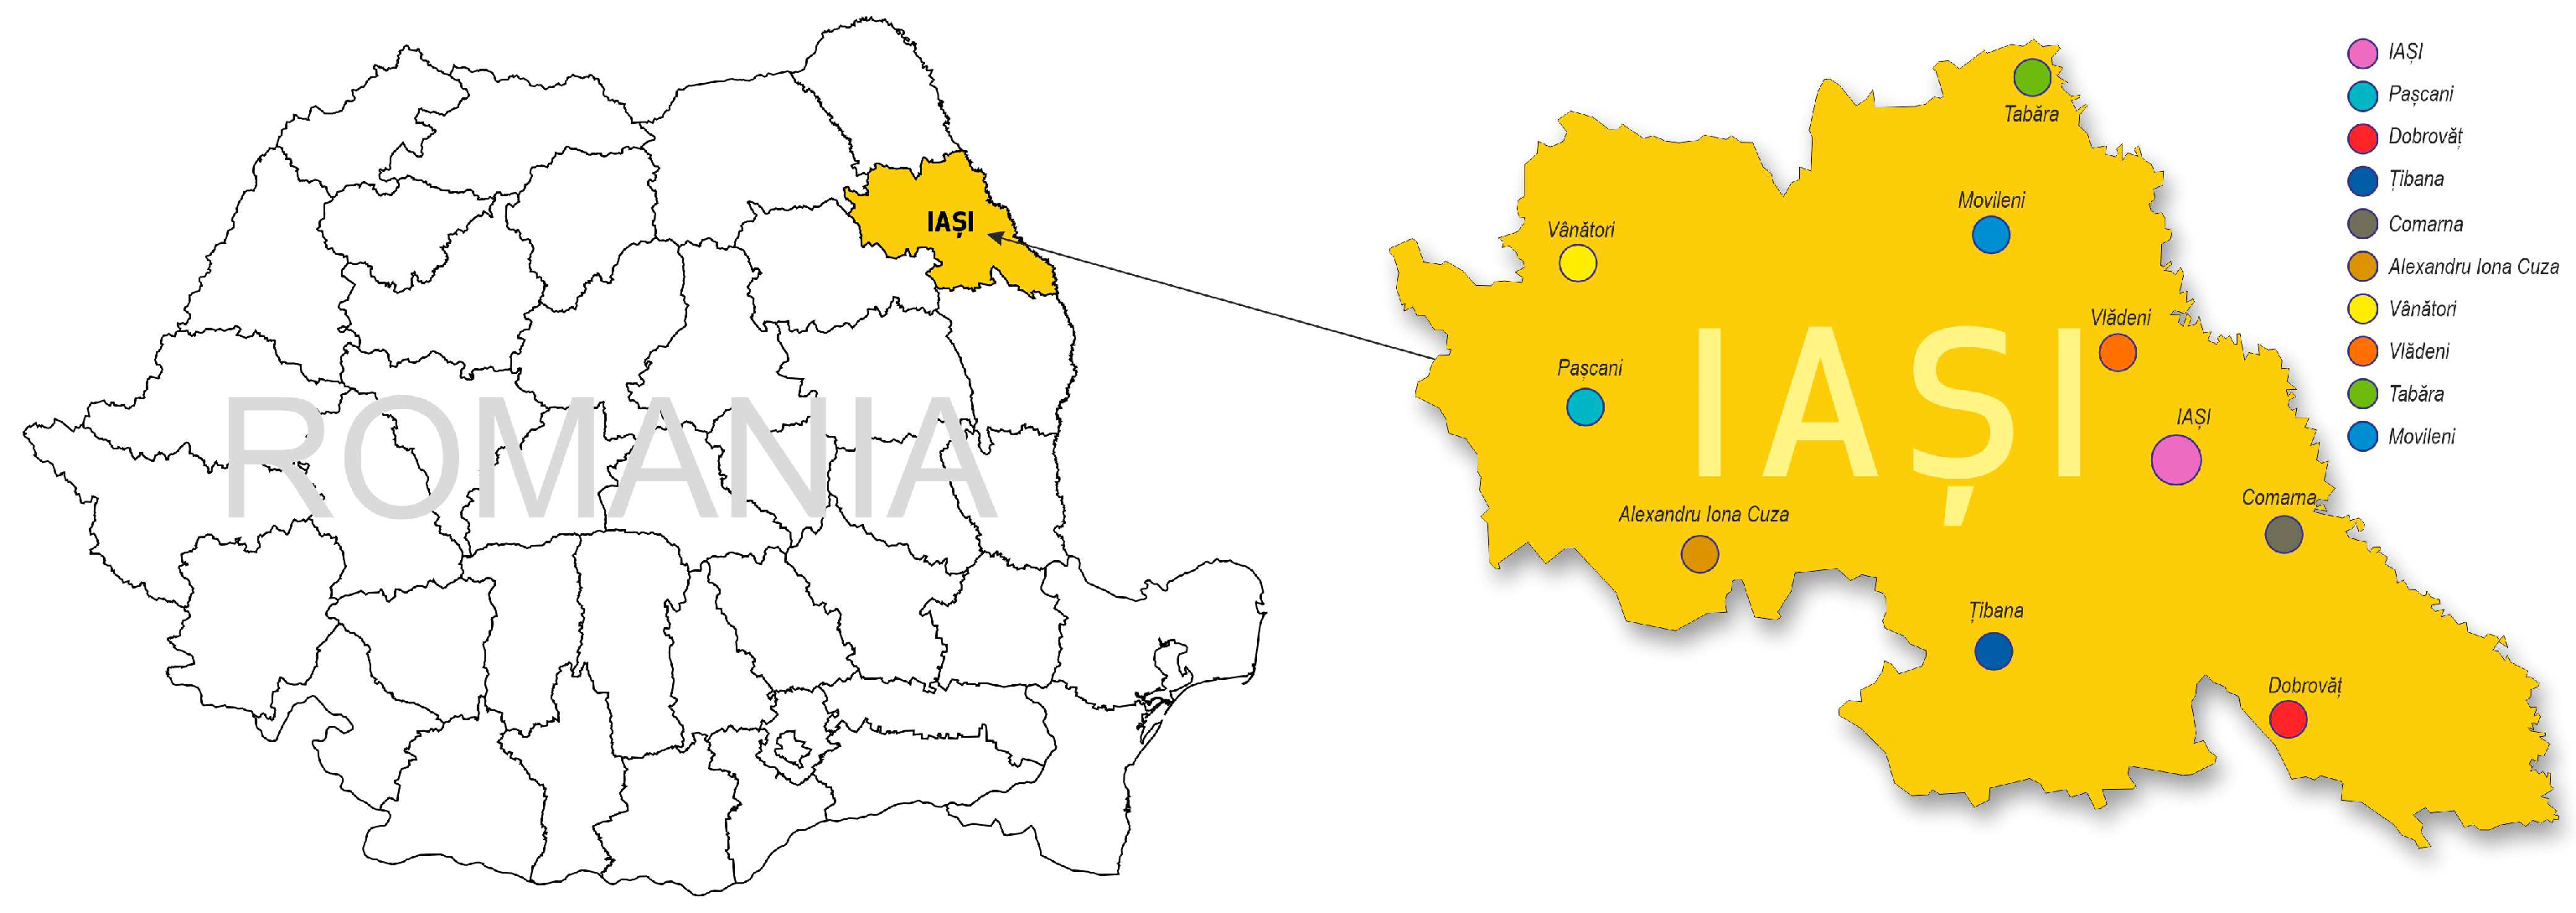
Figure 2.
The distribution of the most abundant plant families identified in the examined honey samples.
Figure 2.
The distribution of the most abundant plant families identified in the examined honey samples.
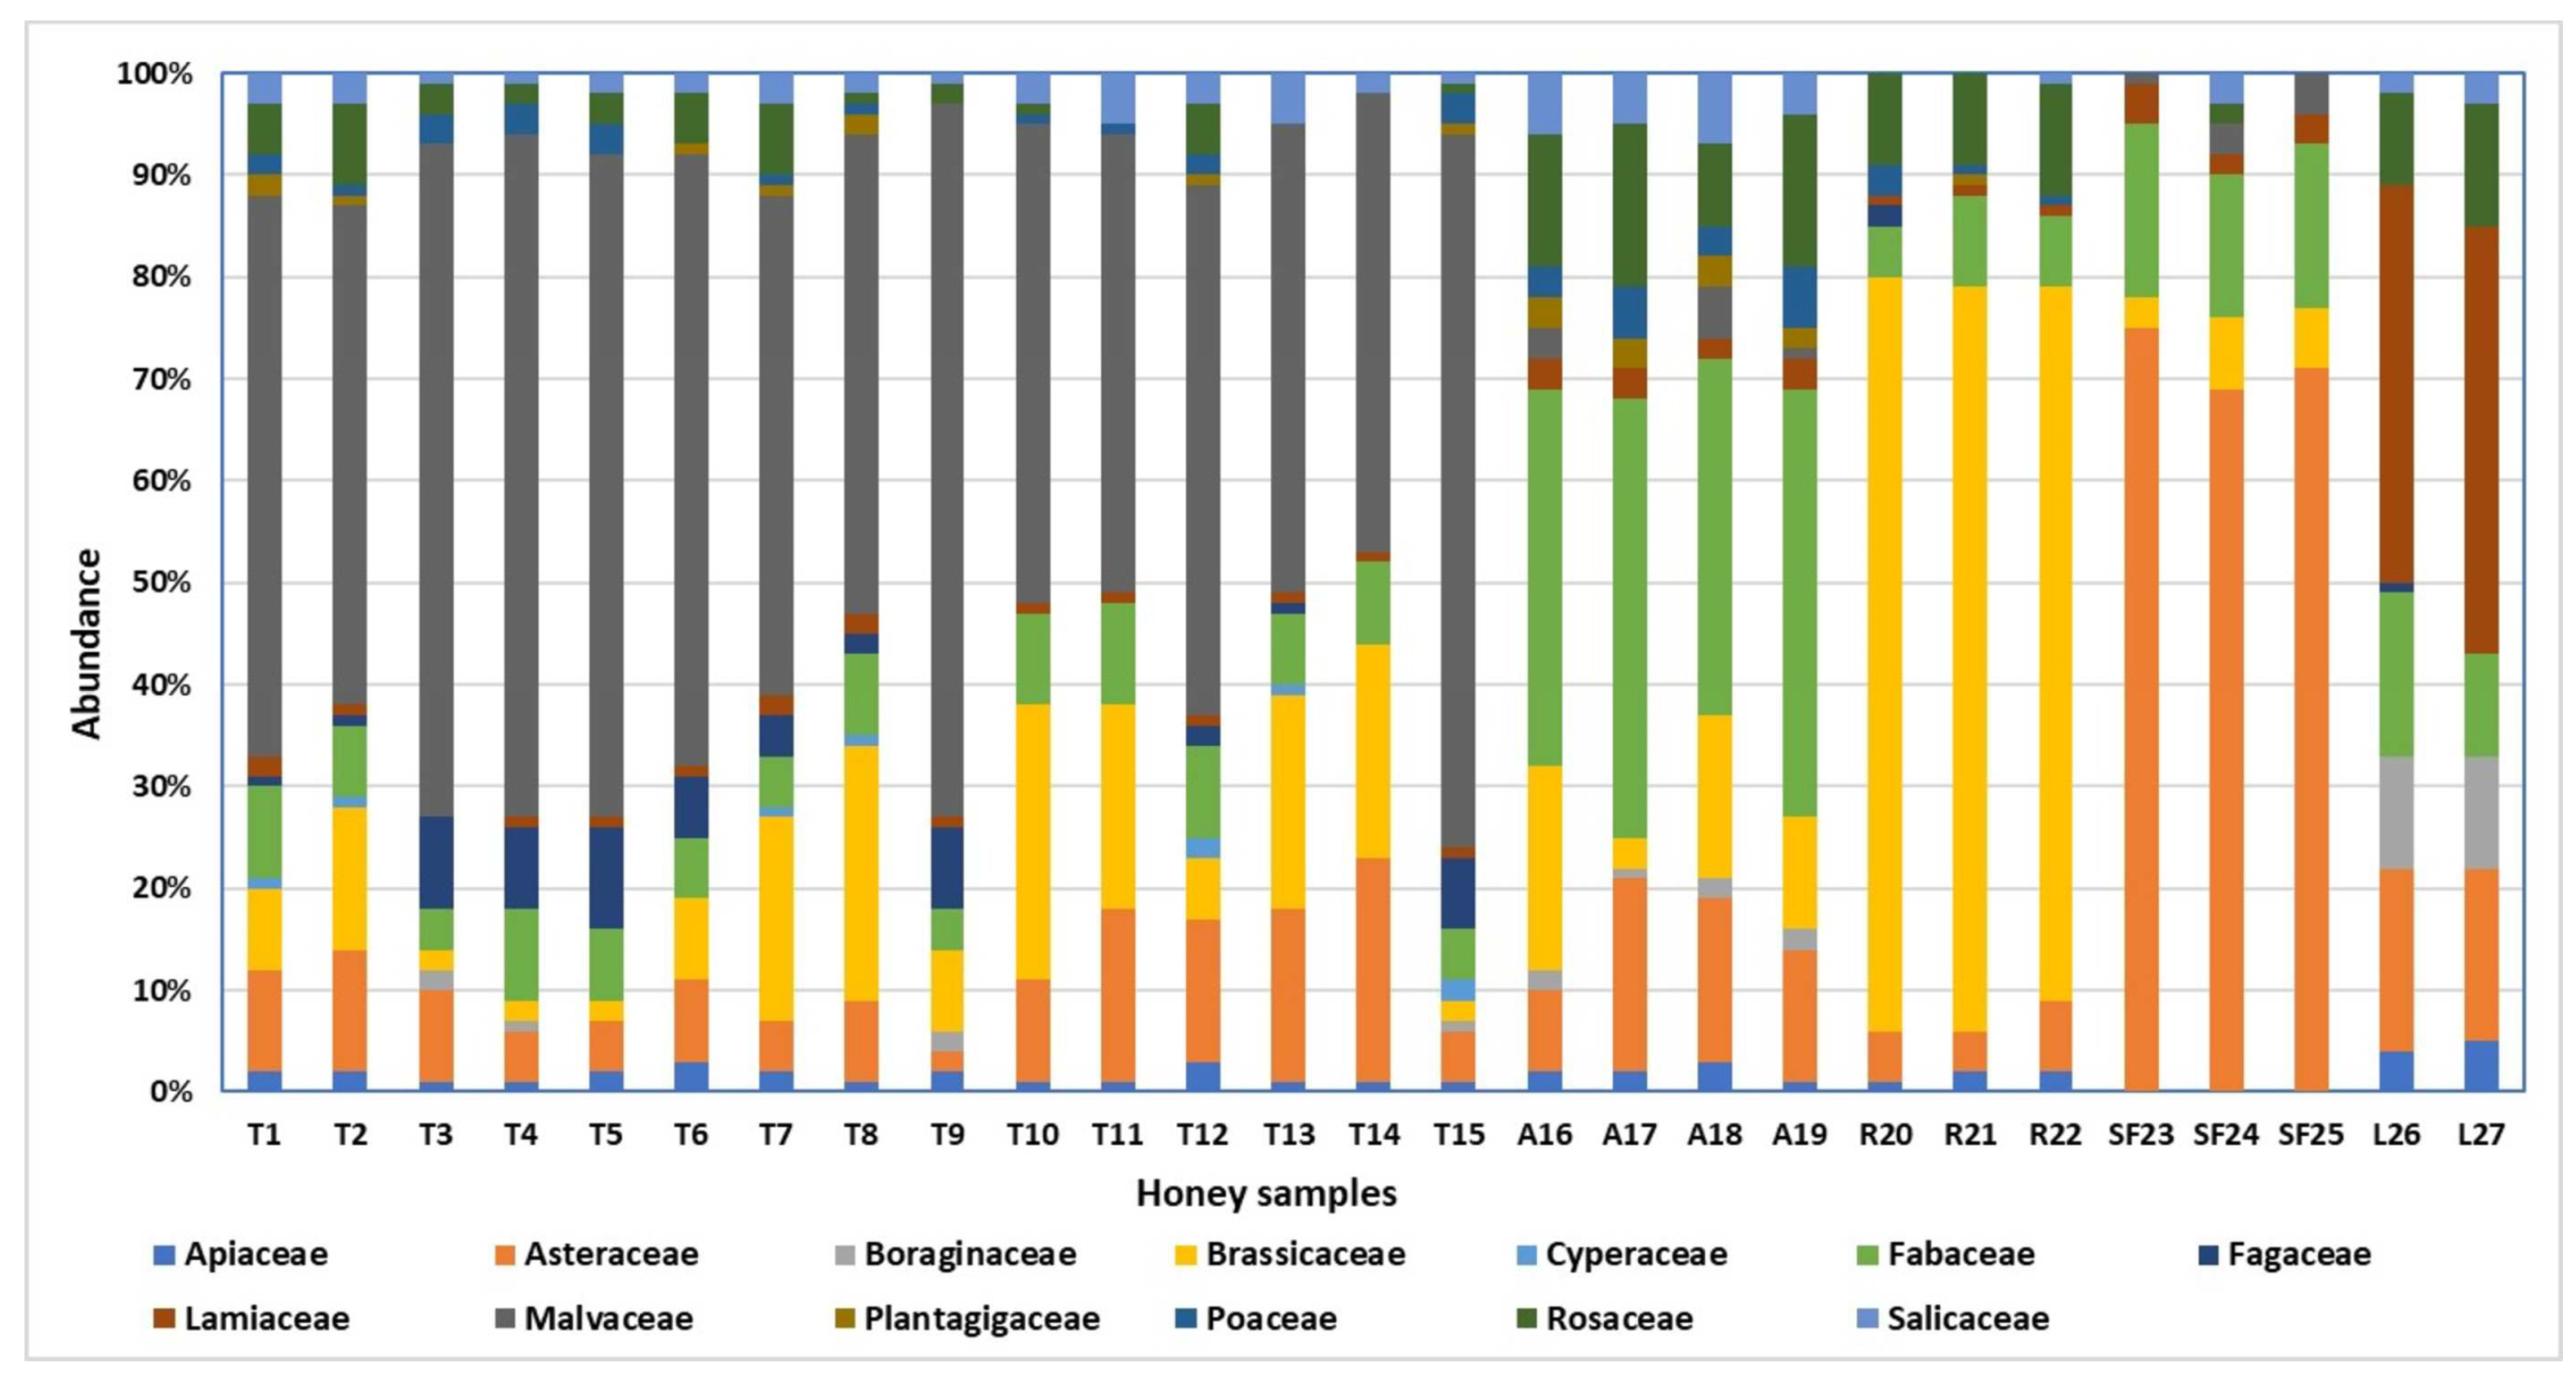

Table 1.
Identification code of samples, harvest locations and the corresponding years of collection.
Table 1.
Identification code of samples, harvest locations and the corresponding years of collection.
| Sample | Location | Year | Sample | Location | Year |
|---|---|---|---|---|---|
| T1 | Pascani | 2020 | T15 | Dobrovat | 2021 |
| T2 | Iasi | 2021 | A16 | Iasi | 2020 |
| T3 | Dobrovat | 2020 | A17 | Dobrovat | 2021 |
| T4 | Dobrovat | 2021 | A18 | Iasi | 2020 |
| T5 | Domnita | 2020 | A19 | Vanatori | 2020 |
| T6 | Comarna | 2020 | R20 | Comarna | 2020 |
| T7 | Iasi | 2021 | R21 | Vladeni | 2020 |
| T8 | Iasi | 2021 | R22 | Vladeni | 2021 |
| T9 | Dobrovat | 2020 | SF23 | Comarna | 2020 |
| T10 | Iasi | 2021 | SF24 | Tabara | 2020 |
| T11 | Iasi | 2020 | SF25 | Tabara | 2021 |
| T12 | Al. I. Cuza | 2020 | L26 | Movileni | 2020 |
| T13 | Iasi | 2021 | L27 | Movileni | 2021 |
| T14 | Iasi | 2021 |
Table 2.
Analysis results of monofloral honey samples, including mm Pfund (color), water insoluble solids (WIS), moisture (M), total soluble solids (TSS) and specific gravity (SG).
Table 2.
Analysis results of monofloral honey samples, including mm Pfund (color), water insoluble solids (WIS), moisture (M), total soluble solids (TSS) and specific gravity (SG).
| Type | Descriptive statistics | Parameter | |||||
|---|---|---|---|---|---|---|---|
| mm Pfund | Color | WIS % |
M % |
TSS % |
SG g/cm3 |
||
| T-R | mean±SD | 19.50±10.95 | Water white to Extra light amber | 0.154±0.04 | 18.18±0.95 | 80.32±0.94 | 1.429±0.01 |
| CV | 56.16 | 25.95 | 5.24 | 1.17 | 0.45 | ||
| min-max | 4.25-39.17 | 0.073-0.193 | 16.77-19.53 | 78.99-81.73 | 1.420-1.439 | ||
| T-C | mean±SD | 38.58±15.47 | Extra white to Light amber | 0.084±0.03 | 18.63±0.54 | 79.88±0.54 | 1.426±0.00 |
| CV | 40.09 | 29.54 | 2.92 | 0.67 | 0.27 | ||
| min-max | 12.94-55.48 | 0.043-0.113 | 18.00-19.68 | 78.84-80.50 | 1.419-1.431 | ||
| A-R | mean±SD | 0.04±0.14 | Water white | 0.052±0.01 | 19.11±1.27 | 79.46±1.18 | 1.423±0.01 |
| CV | 389.30 | 22.81 | 6.64 | 1.49 | 0.62 | ||
| min-max | -0.06-0.14 | 0.043-0.060 | 18.21-20.01 | 78.63-80.30 | 1.417-1.429 | ||
| A-C | mean±SD | -0.38±0.55 | Water white | 0.095±0.01 | 18.40±0.09 | 80.12±0.09 | 1.428±0.00 |
| CV | 145.15 | 12.41 | 0.51 | 0.11 | 0.05 | ||
| min-max | -0.77-0.01 | 0.087-0.103 | 18.33-18.47 | 80.05-80.18 | 1.427-1.428 | ||
| R-R | mean±SD | 53.47±5.59 | Extra light amber to Light amber | 0.138±0.02 | 18.94±1.26 | 79.57±1.24 | 1.424±0.01 |
| CV | 10.45 | 10.91 | 6.67 | 1.56 | 0.60 | ||
| min-max | 48.09-59.25 | 0.123-0.153 | 17.51-19.89 | 78.63-80.97 | 1.418-1.434 | ||
| SF-R | mean±SD | 12.22±0.76 | Extra white | 0.193±0.04 | 19.78±0.18 | 78.74±0.18 | 1.418±0.00 |
| CV | 6.19 | 21.60 | 0.91 | 0.22 | 0.09 | ||
| min-max | 11.64-13.07 | 0.150-0.233 | 19.60-19.96 | 78.57-78.92 | 1.417-1.420 | ||
| L-R | mean±SD | 16.74±0.93 | Extra white to White | 0.152±0.01 | 18.75±0.78 | 79.76±0.78 | 1.425±0.01 |
| CV | 5.54 | 7.77 | 4.17 | 0.97 | 0.38 | ||
| min-max | 16.08-17.39 | 0.143-0.160 | 18.20-19.31 | 79.21-80.31 | 1.422-1.429 | ||
SD-standard deviation; CV-coefficient of variation.
Table 3.
Analysis results of monofloral honey samples, including pH, free acidity (FA), lactonic acidity (LA), total acidity (TA), ash, electrical conductivity (EC) and hydroxymethylfurfural (HMF).
Table 3.
Analysis results of monofloral honey samples, including pH, free acidity (FA), lactonic acidity (LA), total acidity (TA), ash, electrical conductivity (EC) and hydroxymethylfurfural (HMF).
| Type | Descriptive statistics | Parameter | ||||||
|---|---|---|---|---|---|---|---|---|
| pH | FA meq·kg-1 |
LA meq·kg-1 |
TA meq·kg-1 |
Ash % |
EC mS·cm-1 |
HMF mg·kg-1 |
||
| T-R | mean±SD | 4.69±0.61 | 13.81±4.67 | 3.55±2.43 | 17.36±3.86 | 0.296±0.13 | 0.667±0.23 | 3.68±1.80 |
| CV | 12.97 | 33.78 | 68.46 | 22.24 | 43.65 | 35.03 | 48.92 | |
| min-max | 3.92-5.83 | 5.05-19.61 | 0.47-7.21 | 12.26-22.44 | 0.091-0.401 | 0.271-0.841 | 1.90-7.43 | |
| T-C | mean±SD | 4.22±0.23 | 19.75±5.21 | 6.19±3.05 | 25.93±7.73 | 0.211±0.05 | 0.494±0.09 | 8.84±3.67 |
| CV | 5.39 | 26.39 | 49.31 | 29.81 | 25.46 | 17.35 | 41.50 | |
| min-max | 3.93-4.52 | 12.74-25.00 | 3.33-11.79 | 16.19-36.32 | 0.156-0.322 | 0.398-0.667 | 4.67-14.72 | |
| A-R | mean±SD | 3.93±0.00 | 10.39±0.28 | 6.04±0.98 | 16.42±1.26 | 0.048±0.01 | 0.167±0.01 | 3.78±1.11 |
| CV | 0.01 | 2.65 | 16.29 | 7.66 | 12.80 | 6.51 | 29.31 | |
| min-max | 3.93-3.93 | 10.19-10.58 | 5.34-6.73 | 15.53-17.31 | 0.044-0.053 | 0.159-0.174 | 3.00-4.56 | |
| A-C | mean±SD | 4.07±0.01 | 7.15±1.11 | 4.51±2.30 | 11.66±1.19 | 0.035±0.00 | 0.141±0.00 | 5.12±2.70 |
| CV | 0.30 | 15.46 | 50.94 | 10.21 | 5.17 | 1.34 | 52.82 | |
| min-max | 4.06-4.08 | 6.37-7.93 | 2.88-6.13 | 10.8-12.50 | 0.034-0.037 | 0.140-0.142 | 3.21-7.03 | |
| R-R | mean±SD | 4.21±0.23 | 10.98±3.12 | 6.57±0.23 | 17.55±3.21 | 0.070±0.02 | 0.187±0.04 | 6.05±2.37 |
| CV | 5.56 | 28.41 | 3.49 | 18.27 | 21.84 | 20.98 | 39.15 | |
| min-max | 3.96-4.43 | 8.33-14.42 | 6.31-6.73 | 15.00-21.15 | 0.054-0.084 | 0.142-0.216 | 3.34-7.73 | |
| SF-R | mean±SD | 4.02±0.29 | 16.42±1.47 | 6.49±1.57 | 22.91±1.78 | 0.137±0.09 | 0.360±0.19 | 4.59±3.54 |
| CV | 7.12 | 8.93 | 24.22 | 7.77 | 63.15 | 51.71 | 77.08 | |
| min-max | 3.77-4.33 | 14.95-17.89 | 4.76-7.84 | 21.19-24.74 | 0.070-0.235 | 0.253-0.576 | 1.26-8.30 | |
| L-R | mean±SD | 4.05±0.11 | 11.60±1.11 | 4.59±0.31 | 16.19±0.80 | 0.081±0.00 | 0.219±0.00 | 7.26±0.82 |
| CV | 2.70 | 9.53 | 6.68 | 4.93 | 3.94 | 1.94 | 11.37 | |
| min-max | 3.98-4.13 | 10.82-12.38 | 4.37-4.81 | 15.63-16.76 | 0.079-0.083 | 0.216-0.222 | 6.67-7.84 | |
SD-standard deviation; CV-coefficient of variation.
Table 4.
Analysis resultsing of mineral elements (Na, K, Ca, Mg, Cu, Zn, Mn and Fe) in monofloral honey samples.
Table 4.
Analysis resultsing of mineral elements (Na, K, Ca, Mg, Cu, Zn, Mn and Fe) in monofloral honey samples.
| Type | Descriptive statistics | Parameter | |||||||
|---|---|---|---|---|---|---|---|---|---|
| Na mg·kg-1 |
K mg·kg-1 |
Ca mg·kg-1 |
Mg mg·kg-1 |
Cu mg·kg-1 |
Zn mg·kg-1 |
Mn mg·kg-1 |
Fe mg·kg-1 |
||
| T-R | mean±SD | 3.05±1.76 | 297. 09±248.45 | 114.83±92.81 | 28.08±7.69 | 0.082±0.13 | 0.282±0.44 | 0.79±0.73 | 16.63±12.73 |
| CV | 57.79 | 83.63 | 80.82 | 27.38 | 155.29 | 154.27 | 91.91 | 76.53 | |
| min-max | 1.62-6.78 | 42.83-776.15 | 11.39-253.82 | 16.06-35.44 | LoD -0.293 | LoD -1.073 | LoD -2.117 | 1.38-43.30 | |
| T-C | mean±SD | 7.56±4.00 | 411.34±205.81 | 97.24±59.17 | 24.24±6.71 | 0.18±0.15 | 0.39±0.35 | 1.27±1.29 | 15.71±11.82 |
| CV | 52.94 | 50.03 | 60.86 | 27.71 | 83.94 | 89.12 | 101.55 | 75.21 | |
| min-max | 2.96-13.83 | 201.54-715.19 | 22.11-200.41 | 17.09-38.22 | LoD -0.34 | LoD -0.79 | LoD -2.89 | 1.18-30.18 | |
| A-R | mean±SD | 25.87±4.72 | 64.34±15.68 | 12.67±7.67 | 3.71±0.49 | 0.47±0.06 | LoD | 2.17±0.16 | 34.17±28.83 |
| CV | 18.24 | 24.36 | 60.51 | 13.34 | 12.12 | 7.27 | 84.36 | ||
| min-max | 22.53-29.20 | 53.26-75.43 | 7.25-18.09 | 3.36-4.06 | 0.43-0.51 | 2.06-2.28 | 13.79-54.55 | ||
| A-C | mean±SD | 38.29±11.33 | 34.11±12.76 | 19.11±12.57 | 6.03±2.14 | 0.28±0.02 | 0.40±0.56 | 3.38±0.34 | 19.80±1.18 |
| CV | 29.58 | 37.39 | 65.81 | 35.44 | 7.62 | 141.42 | 10.13 | 5.98 | |
| min-max | 30.28-46.30 | 25.09-43.13 | 10.22-28.00 | 4.52-7.54 | 0.26-0.29 | LoD -0.79 | 3.13-3.62 | 18.96-20.63 | |
| R-R | mean±SD | 3.31±0.60 | 1256.88±108.00 | 41.48±2.24 | 10.67±0.85 | 0.57±0.04 | 1.02±0.14 | 0.74±1.29 | 5.14±4.64 |
| CV | 18.03 | 8.59 | 5.41 | 7.94 | 7.30 | 14.12 | 173.20 | 90.41 | |
| min-max | 2.76-3.94 | 1178.37-1380.04 | 39.97-44.06 | 10.00-11.62 | 0.54-0.62 | 0.87-1.16 | LoD -2.23 | 2.22-10.49 | |
| SF-R | mean±SD | 1.68±0.07 | 56.64±20.08 | 17.58±11.31 | 2.04±0.33 | 0.61±0.12 | 0.92±0.31 | 1.16±1.09 | 3.91±3.87 |
| CV | 4.32 | 35.45 | 64.32 | 16.09 | 19.37 | 33.42 | 93.98 | 99.00 | |
| min-max | 1.62-1.76 | 35.22-75.03 | 7.52-29.81 | 1.66-2.23 | 0.48-0.70 | 0.57-1.15 | LoD -2.16 | 1.33-8.36 | |
| L-R | mean±SD | 26.11±6.72 | 958.96±125.01 | 28.58±2.54 | 30.36±1.75 | LoD | 1.14±0.24 | 2.09±0.98 | 111.01±18.08 |
| CV | 25.74 | 13.04 | 8.87 | 5.75 | 20.62 | 46.76 | 16.29 | ||
| min-max | 21.36-30.86 | 870.56-1047.36 | 26.78-30.37 | 29.12-31.59 | 0.98-1.31 | 1.40-2.78 | 98.23-123.80 | ||
SD-standard deviation; CV-coefficient of variation. Limit of Detection (LoD) and Quantification (LoQ) for the determined elements (based on the standard deviation of blank samples): Na - LoD 3.991 μg·L-1, LoQ 13.232 μg·L-1; K - LoD 2.847 μg·L-1, LoQ 7.321 μg·L-1; Ca - LoD 5.384 μg·L-1, LoQ 17.986 μg·L-1; Mg - LoD 2.054 μg·L-1, LoQ 9.003 μg·L-1; Cu - LoD 0.035 μg·L-1, LoQ 0.139 μg·L-1; Zn - LoD 0.079 μg·L-1, LoQ 1.203 μg·L-1; Mn - LoD 0.012 μg·L-1, LoQ 0.039 μg·L-1; Fe - LoD 5.232 μg·L-1, LoQ 17.574 μg·L-1.
Table 5.
Pearson coefficients for the correlation between raw tilia honey parameters (significant at p < 0.05 (*), p < 0.01 (**), p < 0.001 (***)).
Table 5.
Pearson coefficients for the correlation between raw tilia honey parameters (significant at p < 0.05 (*), p < 0.01 (**), p < 0.001 (***)).
| mm Pfund | WIS | M | TSS | SG | pH | FA | LA | TA | ASH | EC | HMF | Na | K | Ca | Mg | Cu | Zn | Mn | Fe | |
|---|---|---|---|---|---|---|---|---|---|---|---|---|---|---|---|---|---|---|---|---|
| mm Pfund | 1 | |||||||||||||||||||
| WIS | -0.38 | 1 | ||||||||||||||||||
| M | 0.09 | 0.05 | 1 | |||||||||||||||||
| TSS | -0.09 | -0.06 | -1.00*** | 1 | ||||||||||||||||
| SG | -0.08 | -0.06 | -1.00*** | 1.00*** | 1 | |||||||||||||||
| pH | -0.33 | 0.42 | -0.03 | 0.04 | 0.03 | 1 | ||||||||||||||
| FA | 0.38 | -0.37 | -0.27 | 0.26 | 0.27 | -0.94*** | 1 | |||||||||||||
| LA | -0.07 | 0.33 | 0.31 | -0.31 | -0.32 | 0.43 | -0.56 | 1 | ||||||||||||
| TA | 0.42 | -0.24 | -0.13 | 0.12 | 0.12 | -0.86** | 0.85** | -0.05 | 1 | |||||||||||
| ASH | -0.6 | 0.61 | -0.4 | 0.41 | 0.4 | 0.77* | -0.61 | 0.06 | -0.7 | 1 | ||||||||||
| EC | -0.53 | 0.58 | -0.32 | 0.32 | 0.31 | 0.81* | -0.66 | 0.05 | -0.76* | 0.99*** | 1 | |||||||||
| HMF | 0.35 | 0.31 | -0.13 | 0.12 | 0.13 | -0.09 | 0.12 | 0.52 | 0.47 | -0.13 | -0.18 | 1 | ||||||||
| Na | -0.38 | -0.41 | -0.42 | 0.43 | 0.42 | 0.37 | -0.3 | 0 | -0.36 | 0.37 | 0.37 | -0.44 | 1 | |||||||
| K | 0.01 | -0.11 | 0.55 | -0.56 | -0.57 | -0.35 | 0.17 | 0.01 | 0.21 | -0.31 | -0.25 | -0.22 | -0.01 | 1 | ||||||
| Ca | 0.28 | -0.63 | -0.27 | 0.28 | 0.27 | 0.35 | -0.28 | 0.08 | -0.28 | 0.03 | 0.09 | -0.18 | 0.73* | -0.15 | 1 | |||||
| Mg | 0.53 | 0.09 | -0.06 | 0.06 | 0.06 | 0.38 | -0.23 | 0.06 | -0.24 | 0.25 | 0.36 | 0.1 | 0.08 | 0.14 | 0.44 | 1 | ||||
| Cu | 0.05 | 0.11 | -0.02 | 0.01 | 0 | -0.5 | 0.45 | 0.43 | 0.81* | -0.41 | -0.49 | 0.53 | -0.22 | 0.26 | -0.35 | -0.29 | 1 | |||
| Zn | 0.12 | 0.18 | 0.17 | -0.17 | -0.17 | -0.46 | 0.36 | 0.52 | 0.77* | -0.47 | -0.54 | 0.59 | -0.38 | 0.25 | -0.42 | -0.28 | 0.97*** | 1 | ||
| Mn | -0.05 | -0.14 | 0.44 | -0.43 | -0.44 | 0.63 | -0.75* | 0.47 | -0.61 | 0.18 | 0.28 | -0.33 | 0.49 | 0.31 | 0.59 | 0.42 | -0.33 | -0.29 | 1 | |
| Fe | 0.41 | 0.48 | 0.03 | -0.04 | -0.03 | -0.05 | 0.1 | 0.58 | 0.49 | -0.13 | -0.15 | 0.81* | -0.5 | 0.01 | -0.27 | 0.31 | 0.67 | 0.74* | -0.17 | 1 |
Table 6.
Pearson coefficients for the correlation between commercial tilia honey parameters (significant at p < 0.05 (*), p < 0.01 (**), p < 0.001 (***)).
Table 6.
Pearson coefficients for the correlation between commercial tilia honey parameters (significant at p < 0.05 (*), p < 0.01 (**), p < 0.001 (***)).
| mm | WIS | M | TSS | SG | pH | FA | LA | TA | ASH | EC | HMF | Na | K | Ca | Mg | Cu | Zn | Mn | Fe | |
|---|---|---|---|---|---|---|---|---|---|---|---|---|---|---|---|---|---|---|---|---|
| Pfund | ||||||||||||||||||||
| mm Pfund | 1 | |||||||||||||||||||
| WIS | -0.55 | 1 | ||||||||||||||||||
| M | 0.13 | -0.45 | 1 | |||||||||||||||||
| TSS | -0.13 | 0.45 | -1.00*** | 1 | ||||||||||||||||
| SG | -0.14 | 0.44 | -1.00*** | 1.00*** | 1 | |||||||||||||||
| pH | -0.85* | 0.13 | -0.1 | 0.09 | 0.11 | 1 | ||||||||||||||
| FA | 0.86* | -0.1 | -0.14 | 0.15 | 0.13 | -0.94** | 1 | |||||||||||||
| LA | 0.58 | 0.08 | -0.17 | 0.17 | 0.17 | -0.77* | 0.73 | 1 | ||||||||||||
| TA | 0.81* | -0.04 | -0.16 | 0.17 | 0.15 | -0.94** | 0.96*** | 0.89** | 1 | |||||||||||
| ASH | 0.18 | -0.12 | -0.53 | 0.54 | 0.53 | 0.17 | 0.13 | -0.04 | 0.07 | 1 | ||||||||||
| EC | 0.39 | -0.28 | -0.48 | 0.48 | 0.49 | -0.01 | 0.24 | 0.24 | 0.26 | 0.90** | 1 | |||||||||
| HMF | 0.51 | 0.01 | 0.23 | -0.22 | -0.22 | -0.78* | 0.61 | 0.89** | 0.76* | -0.45 | -0.15 | 1 | ||||||||
| Na | -0.27 | -0.31 | -0.26 | 0.25 | 0.28 | 0.66 | -0.59 | -0.41 | -0.56 | 0.45 | 0.53 | -0.57 | 1 | |||||||
| K | -0.56 | 0.01 | 0.03 | -0.03 | -0.02 | 0.47 | -0.58 | -0.52 | -0.6 | -0.56 | -0.6 | -0.31 | 0.22 | 1 | ||||||
| Ca | 0.06 | 0.45 | -0.33 | 0.34 | 0.31 | -0.39 | 0.46 | 0.07 | 0.34 | -0.21 | -0.42 | 0.06 | -0.66 | 0.17 | 1 | |||||
| Mg | -0.11 | 0.32 | -0.49 | 0.49 | 0.46 | 0.02 | 0.21 | -0.28 | 0.03 | 0.27 | -0.09 | -0.43 | -0.3 | 0.12 | 0.81* | 1 | ||||
| Cu | -0.66 | 0.08 | 0.01 | -0.02 | 0 | 0.83* | -0.77* | -0.39 | -0.68 | 0.3 | 0.22 | -0.45 | 0.57 | 0.04 | -0.68 | -0.28 | 1 | |||
| Zn | -0.48 | 0.18 | -0.07 | 0.06 | 0.09 | 0.5 | -0.5 | 0.12 | -0.29 | 0.16 | 0.25 | 0.04 | 0.38 | -0.1 | -0.67 | -0.49 | 0.85* | 1 | ||
| Mn | 0.24 | -0.12 | 0.23 | -0.23 | -0.24 | 0.02 | 0.04 | -0.24 | -0.07 | 0.48 | 0.39 | -0.31 | 0.15 | -0.63 | -0.31 | -0.12 | 0.13 | -0.13 | 1 | |
| Fe | -0.51 | 0.36 | -0.43 | 0.42 | 0.44 | 0.51 | -0.39 | 0.13 | -0.21 | 0.37 | 0.37 | -0.09 | 0.37 | -0.12 | -0.41 | -0.15 | 0.78* | 0.92** | -0.2 | 1 |
Table 7.
ANOVA test for the differences between raw and commercial honeys (significant at: p < 0.05 (*), p < 0.01 (**), ns- not significant).
Table 7.
ANOVA test for the differences between raw and commercial honeys (significant at: p < 0.05 (*), p < 0.01 (**), ns- not significant).
| Type honey | Parameters | |||||||||||||||||||
|---|---|---|---|---|---|---|---|---|---|---|---|---|---|---|---|---|---|---|---|---|
| mm Pfund | WIS | M | TSS | SG | pH | FA | LA | TA | Ash | EC | HMF | Na | K | Ca | Mg | Cu | Zn | Mn | Fe | |
| TR-TC | * | ** | ns | ns | ns | ns | * | ns | * | ns | ns | ** | * | ns | ns | ns | ns | ns | ns | ns |
| AR-AC | ns | ns | ns | ns | ns | ** | ns | ns | ns | ns | ns | ns | ns | ns | ns | ns | * | ns | * | ns |
TR-raw tilia; TC-commercial tilia; AR-raw acacia; AC-commercial acacia.
Table 8.
Pearson coefficients for the correlation between honey parameters (significant at p < 0.05 (*), p < 0.01 (**), p < 0.001 (***)).
Table 8.
Pearson coefficients for the correlation between honey parameters (significant at p < 0.05 (*), p < 0.01 (**), p < 0.001 (***)).
| mm Pfund | WIS | M | TSS | SG | pH | FA | LA | TA | Ash | EC | HMF | Na | K | Ca | Mg | Cu | Zn | Mn | Fe | |
|---|---|---|---|---|---|---|---|---|---|---|---|---|---|---|---|---|---|---|---|---|
|
mm Pfund |
1.00 | |||||||||||||||||||
| WIS | -0.17 | 1.00 | ||||||||||||||||||
| M | 0.00 | 0.06 | 1.00 | |||||||||||||||||
| TSS | -0.01 | -0.07 | -1.00*** | 1.00 | ||||||||||||||||
| SG | 0.00 | -0.07 | -1.00*** | 1.00*** | 1.00 | |||||||||||||||
| pH | -0.09 | 0.34 | -0.32 | 0.32 | 0.32 | 1.00 | ||||||||||||||
| FA | 0.49** | -0.18 | -0.02 | 0.01 | 0.01 | -0.40* | 1.00 | |||||||||||||
| LA | 0.32 | -0.09 | 0.32 | -0.32 | -0.32 | -0.20 | 0.20 | 1.00 | ||||||||||||
| TA | 0.54** | -0.18 | 0.11 | -0.11 | -0.11 | -0.42* | 0.93*** | 0.55** | 1.00 | |||||||||||
| ASH | 0.01 | 0.31 | -0.42* | 0.42* | 0.41* | 0.77*** | 0.15 | -0.20 | 0.05 | 1.00 | ||||||||||
| EC | 0.01 | 0.29 | -0.37 | 0.37 | 0.37 | 0.76*** | 0.18 | -0.18 | 0.09 | 0.99*** | 1.00 | |||||||||
| HMF | 0.50** | -0.27 | -0.01 | 0.00 | 0.01 | -0.31 | 0.46* | 0.60*** | 0.62*** | -0.20 | -0.18 | 1.00 | ||||||||
| Na | -0.48* | -0.40* | -0.01 | 0.02 | 0.02 | -0.27 | -0.46* | -0.02 | -0.40* | -0.47* | -0.49* | 0.02 | 1.00 | |||||||
| K | 0.53** | 0.06 | 0.09 | -0.10 | -0.09 | -0.08 | -0.14 | 0.04 | -0.10 | -0.27 | -0.29 | 0.16 | -0.13 | 1.00 | ||||||
| Ca | 0.25 | -0.13 | -0.40* | 0.40* | 0.40* | 0.46* | 0.22 | -0.12 | 0.15 | 0.45* | 0.47* | -0.01 | -0.34 | -0.05 | 1.00 | |||||
| Mg | 0.26 | 0.06 | -0.43* | 0.43* | 0.43* | 0.48* | 0.22 | -0.32 | 0.07 | 0.58** | 0.58** | 0.07 | -0.25 | 0.19 | 0.64*** | 1.00 | ||||
| Cu | -0.02 | 0.12 | 0.44* | -0.44* | -0.45* | -0.35 | -0.18 | 0.32 | -0.03 | -0.47* | -0.50** | -0.13 | -0.04 | 0.08 | -0.53** | -0.79*** | 1.00 | |||
| Zn | 0.16 | 0.32 | 0.27 | -0.28 | -0.27 | -0.31 | -0.06 | 0.30 | 0.06 | -0.38* | -0.39* | 0.17 | -0.10 | 0.47* | -0.45* | -0.23 | 0.47* | 1.00 | ||
| Mn | -0.29 | -0.28 | 0.18 | -0.18 | -0.18 | -0.18 | -0.27 | -0.01 | -0.23 | -0.29 | -0.30 | -0.10 | 0.61*** | -0.21 | -0.18 | -0.20 | -0.01 | -0.13 | 1.00 | |
| Fe | -0.22 | 0.03 | -0.04 | 0.05 | 0.05 | -0.12 | -0.21 | -0.01 | -0.18 | -0.20 | -0.22 | 0.15 | 0.49* | 0.23 | -0.22 | 0.28 | -0.26 | 0.34 | 0.23 | 1.00 |
Table 9.
Factor loadings (Varimax normalized) and explained variance (%) for the extracted principal components (marked loadings are >0.700).
Table 9.
Factor loadings (Varimax normalized) and explained variance (%) for the extracted principal components (marked loadings are >0.700).
| Variable | Factor 1 |
Factor 2 |
Factor 3 |
Factor 4 |
Factor 5 |
Factor 6 |
Factor 7 |
|---|---|---|---|---|---|---|---|
| mm Pfund | 0.008 | -0.423 | -0.027 | 0.724 | 0.124 | 0.237 | 0.307 |
| WIS | -0.107 | 0.189 | 0.845 | -0.084 | 0.121 | -0.080 | -0.085 |
| M | -0.967 | -0.019 | 0.013 | 0.015 | -0.228 | 0.023 | 0.069 |
| TSS | 0.967 | 0.023 | -0.025 | -0.023 | 0.230 | -0.024 | -0.067 |
| SG | 0.968 | 0.021 | -0.021 | -0.016 | 0.226 | -0.028 | -0.066 |
| pH | 0.158 | 0.517 | 0.245 | -0.023 | 0.772 | 0.155 | 0.047 |
| FA | 0.013 | -0.979 | 0.010 | 0.006 | 0.107 | 0.097 | 0.063 |
| LA | -0.229 | -0.160 | 0.017 | 0.026 | -0.146 | 0.057 | 0.911 |
| Ta | -0.077 | -0.894 | 0.015 | 0.015 | 0.035 | 0.104 | 0.402 |
| ASH | 0.241 | -0.029 | 0.345 | -0.227 | 0.821 | 0.155 | -0.025 |
| EC | 0.189 | -0.062 | 0.325 | -0.233 | 0.845 | 0.163 | -0.015 |
| HMF | 0.091 | -0.475 | -0.166 | 0.233 | -0.067 | -0.222 | 0.682 |
| Na | 0.077 | 0.387 | -0.571 | -0.275 | -0.347 | -0.483 | 0.053 |
| K | -0.061 | 0.133 | 0.122 | 0.912 | -0.126 | -0.171 | -0.001 |
| Ca | 0.252 | -0.132 | -0.235 | 0.221 | 0.692 | 0.228 | -0.060 |
| Mg | 0.250 | -0.180 | 0.013 | 0.312 | 0.778 | -0.350 | -0.186 |
| Cu | -0.272 | 0.184 | 0.263 | -0.008 | -0.711 | 0.408 | 0.173 |
| Zn | -0.150 | 0.009 | 0.541 | 0.345 | -0.501 | -0.311 | 0.214 |
| Mn | -0.228 | 0.273 | -0.569 | -0.307 | -0.121 | -0.282 | 0.026 |
| Fe | 0.042 | 0.114 | 0.010 | 0.069 | -0.066 | -0.944 | 0.034 |
| Eigenvalue | 5.82 | 3.75 | 2.61 | 2.04 | 1.53 | 1.23 | 1.01 |
| Total variance (%) | 29.12 | 18.73 | 13.04 | 10.22 | 7.64 | 6.17 | 5.03 |
| Cumulative variance (%) | 29.12 | 47.85 | 60.89 | 71.10 | 78.74 | 84.92 | 89.95 |
Table 10.
Factor scores (Varimax normalized) for the extracted factors.
| Sample | Factor 1 |
Factor 2 |
Factor 3 |
Factor 4 |
Factor 5 |
Factor 6 |
Factor 7 |
|---|---|---|---|---|---|---|---|
| T1 | 0.46 | 1.24 | -1.28 | 0.98 | 0.23 | -0.61 | -2.40 |
| T2 | 0.00 | 1.25 | -0.88 | 0.48 | 0.93 | -0.25 | -0.91 |
| T3 | 1.99 | -0.28 | 0.14 | -0.58 | 0.80 | -0.83 | -0.88 |
| T4 | -0.45 | -2.19 | -0.36 | 0.00 | 2.78 | -0.45 | 1.38 |
| T5 | -1.56 | -0.82 | 0.35 | 0.21 | 1.91 | 0.16 | -0.93 |
| T6 | 0.34 | -0.54 | 0.93 | -1.02 | 0.98 | -0.27 | -0.11 |
| T7 | -0.28 | 1.81 | -1.22 | -0.24 | 0.66 | -0.16 | 1.38 |
| T8 | -0.11 | 1.55 | -1.21 | 0.88 | 0.56 | -0.57 | 0.39 |
| T9 | 1.47 | 0.42 | 1.54 | -0.10 | 0.36 | 0.69 | 0.57 |
| T10 | 0.57 | 1.87 | 0.27 | -0.20 | 0.20 | 0.35 | 2.71 |
| T11 | 0.93 | -0.37 | 0.27 | 0.53 | -0.03 | 0.03 | -0.14 |
| T12 | 1.16 | 0.25 | 1.31 | -0.90 | 0.82 | -0.03 | -1.50 |
| T13 | 0.31 | 0.35 | -0.39 | -0.44 | 0.31 | 0.02 | 0.32 |
| T14 | -1.11 | -0.25 | -0.50 | 0.41 | 0.10 | -0.13 | -0.20 |
| T15 | -0.60 | 0.78 | 0.93 | 0.04 | -0.78 | 0.25 | -0.83 |
| A16 | 0.43 | -1.01 | -0.97 | -0.80 | -1.19 | 0.26 | -0.73 |
| A17 | 0.77 | -0.62 | -1.22 | -1.02 | -1.25 | -0.65 | -0.28 |
| A18 | 0.61 | -1.44 | -1.75 | -1.33 | -0.94 | 0.33 | 0.83 |
| A19 | -1.30 | -0.52 | -1.42 | -1.09 | -0.73 | 0.27 | 0.19 |
| R20 | -0.50 | -1.06 | 0.64 | 2.50 | -0.88 | -1.00 | 0.55 |
| R21 | 1.77 | -0.93 | 0.61 | 1.87 | -1.22 | -1.03 | 0.87 |
| R22 | -1.39 | -0.21 | -0.05 | 1.53 | -0.66 | -0.73 | -0.11 |
| SF23 | -1.32 | -0.02 | 1.91 | -1.16 | -0.38 | -0.96 | 0.35 |
| SF24 | -0.73 | 0.87 | 0.81 | -0.88 | -1.20 | -0.28 | 0.40 |
| SF25 | -1.19 | 0.32 | 1.14 | -1.09 | -0.98 | -0.53 | -0.53 |
| L26 | -0.72 | -0.12 | 0.13 | 0.61 | 0.01 | 2.90 | -0.29 |
| L27 | 0.49 | -0.34 | 0.25 | 0.81 | -0.41 | 3.25 | -0.12 |
Table 11.
Mineral elements (Na, K, Ca, Mg) from several sources.
| Na (mg·kg-1) | K (mg·kg-1) | Ca (mg·kg-1) | Mg (mg·kg-1) | Country | Sources |
|---|---|---|---|---|---|
| Tilia | |||||
| 8.61-23.41 | 76.17-697.64 | 17.69-81.42 | 13.52-35.78 | Romania | [19] |
| - | 225-339 | 34-59 | - | Romania | [23] |
| 5.10 | 1100 | 28.00 | 13.50 | Latvia | [69] |
| 3.88-35.89 | 626.50-2278 | 47.18-163.00 | 16.74-30.32 | Serbia | [18] |
| 8.38-29.32 | 107.08-401.16 | - | 13.85-27.23 | Serbia | [64] |
| 32.60 | 1327.50 | 111.90 | 22.40 | Hungary | [70] |
| 9.29 | 1278.08 | 67.85 | 16.51 | Hungary | [45] |
| 2.18-6.14 | 1413.47-2284.44 | 13.74-17.49 | 12.32-36.79 | Slovenia | [20] |
| - | 1062.91-1453.32 | 82.08-85.61 | 20.92-26.91 | Poland | [71] |
| 7.50 | 792.00 | 77.00 | 21.00 | Bulgaria | [72] |
| Acacia | |||||
| 5.30-23.35 | 83.40-736.61 | 18.50-33.52 | 2.17-30.95 | Romania | [19] |
| - | 169-486 | 45-98 | - | Romania | [23] |
| 2.35-36.49 | 236.30-566.00 | 10.33-245.80 | 3.12-25.34 | Serbia | [18] |
| 6.75-12.52 | 46.35-63.49 | - | 5.71-12.04 | Serbia | [64] |
| 23.50 | 327.90 | 28.10 | 10.40 | Hungary | [70] |
| 5.99 | 226.56 | 12.39 | 5.24 | Hungary | [45] |
| 2.06-19.95 | 247.79-571.90 | 4.31-6.60 | 12.39-14.49 | Slovenia | [20] |
| 8.11 | 126 | 32 | 6.0 | Bulgaria | [72] |
| Rapeseed | |||||
| 3.11-14.11 | 1012.05-1284.66 | 31.37-42.87 | 13.69-20.83 | Romania | [19] |
| - | 207-221 | 46-51 | - | Romania | [23] |
| 7.00 | 320 | 39.00 | 13.80 | Latvia | [69] |
| 9.25-160.04 | 47.70-90.22 | - | 16.22-72.31 | Serbia | [64] |
| 22.80 | 399.40 | 68.60 | 19.20 | Hungary | [70] |
| 8.49 | 105 | 46 | 11 | Bulgaria | [72] |
| Sunflower | |||||
| 3.02-47.70 | 45.35-1216.83 | 22.28-213.28 | 12.47-76.42 | Romania | [19] |
| - | 163-192 | 49-51 | - | Romania | [23] |
| 7.77-18.76 | 113.47-133.39 | - | 33.01-39.16 | Serbia | [64] |
| 55.10 | 847.40 | 217.70 | 49.70 | Hungary | [70] |
| 13.23 | 758.95 | 126.37 | 33.26 | Hungary | [45] |
| 87.93 | 276.86 | 24.92 | 68.18 | Portugal | [53] |
| 7.58 | 247 | 71 | 14 | Bulgaria | [72] |
| Lavender | |||||
| 25.66 | 1004.16 | 27.81 | 84.45 | Romania | [19] |
| 3551 | 5117 | LoQ | 41 | Turkey | [67] |
| 41.47-62.53 | 78.09-173.17 | 6.84-14.46 | 17.88-32.43 | Portugal | [53] |
LoQ- Limit of Quantification.
Table 12.
Mineral elements (Cu, Zn, Mn, Fe) from several researches.
| Cu (mg·kg-1) | Zn (mg·kg-1) | Mn (mg·kg-1) | Fe (mg·kg-1) | Country | Sources |
|---|---|---|---|---|---|
| Tilia | |||||
| LoQ-0.86 | LoQ-0.91 | 2.65-7.17 | LoQ-61.65 | Romania | [19] |
| 0.20-1.42 | 1.80-3.70 | - | 6.20-7.20 | Romania | [23] |
| <0.15 | - | 0.29 | <0.075 | Latvia | [69] |
| LoD-0.71 | 1.06-1.43 | 0.34-1.12 | 2.25-5.99 | Serbia | [64] |
| 114.60-217.40 | 0.25-7.59 | 0.53-2.14 | 0.79-3.44 | Serbia | [18] |
| - | 1.7 | 1.3 | - | Hungary | [70] |
| 0.12 | 0.15 | 1.01 | <0.05 | Hungary | [45] |
| 0.078-1.043 | 0.05-2.08 | 0.37-4.72 | 1.38-70.20 | Slovenia | [20] |
| 0.38-0.57 | 0.16-1.52 | 3.70-4.71 | 1.22-1.68 | Poland | [71] |
| 0.12 | 1.04 | 2.45 | 1.62 | Bulgaria | [72] |
| Acacia | |||||
| LoQ-2.01 | LoQ-0.36 | LoQ-2.01 | LoQ-32.05 | Romania | [19] |
| 0.10-1.42 | 0.90-4.30 | - | 1.30-7.90 | Romania | [23] |
| LoQ | 0.38-1.08 | 0.54-0.66 | 3.16-3.91 | Serbia | [64] |
| 43.76-257.30 | 0.44-6.85 | 0.08-0.49 | 0.38-4.13 | Serbia | [18] |
| <0.10 | 0.15 | 0.12 | <0.05 | Hungary | [45] |
| 0.109-0.626 | 0.22-2.10 | 0.17-0.87 | 0.21-134.59 | Slovenia | [20] |
| <0.01–0.15 | 0.22 | 0.11 | 0.83 | Bulgaria | [72] |
| Rapeseed | |||||
| LoQ | 0.63-1.29 | 0.89-2.12 | 1.65-3.55 | Romania | [19] |
| 0.38-0.39 | 4.60-4.80 | - | 9.80-11.50 | Romania | [23] |
| <0.15 | - | 0.37 | 1.4 | Latvia | [69] |
| - | 2.3 | 0.9 | - | Hungary | [70] |
| <0.01–0.02 | 0.25 | 0.17 | 1.01 | Bulgaria | [72] |
| Sunflower | |||||
| LoQ-4.31 | LoQ-3.43 | LoQ-1.92 | LoQ-10.52 | Romania | [19] |
| 0.17-0.26 | 2.70-4.10 | - | 9.80-11.00 | Romania | [23] |
| LoD | 2.46-3.14 | 0.25-1.17 | 2.83-3.09 | Serbia | [64] |
| - | 5.5 | 0.7 | - | Hungary | [70] |
| <0.10 | 4.87 | 0.45 | 0.75 | Hungary | [45] |
| < 0.01–0.07 | 0.61 | 0.36 | 1.93 | Bulgaria | [72] |
| Lavender | |||||
| 2.4 | LoQ | LoQ | 75.91 | Romania | [19] |
| - | LoQ | - | 3.57 | Turkey | [67] |
LoQ- Limit of Quantification.
Disclaimer/Publisher’s Note: The statements, opinions and data contained in all publications are solely those of the individual author(s) and contributor(s) and not of MDPI and/or the editor(s). MDPI and/or the editor(s) disclaim responsibility for any injury to people or property resulting from any ideas, methods, instructions or products referred to in the content. |
© 2024 by the authors. Licensee MDPI, Basel, Switzerland. This article is an open access article distributed under the terms and conditions of the Creative Commons Attribution (CC BY) license (http://creativecommons.org/licenses/by/4.0/).
Copyright: This open access article is published under a Creative Commons CC BY 4.0 license, which permit the free download, distribution, and reuse, provided that the author and preprint are cited in any reuse.


