
Submitted:
28 December 2024
Posted:
30 December 2024
You are already at the latest version
Abstract
Variable Frequency Drives (VFDs) are widely used in industry as an efficient means to control the rotational speed of AC motors by varying the supply frequency to the motor. VFD signatures can be detected in vibration signals in the form of sidebands (modulations) induced on tonal components (carrier frequencies). These sidebands are spaced at twice the “pseudo line” VFD frequency, as the magnetic forces in the motor have two peaks per current cycle. VFD-related signatures are generally less susceptible to interference from other mechanical sources, making them particularly useful for deriving speed variation information and obtaining a “pseudo” tachometer from the motor’s synchronous speed. This tachometer can then be employed to accurately estimate the speed profile, and to facilitate order tracking in mechanical systems for vibration analysis purposes. This paper presents a signal processing technique designed to extract a pseudo tachometer from the VFD signature found in a vibration signal. The algorithm was tested on publicly available vibration data from a test rig featuring a two-stage gearbox with seeded bearing faults operating under variable-speed conditions with no load; i.e. with minimal slip between the induction motor’s synchronous and actual speed. The results clearly demonstrate the feasibility of using VFD signatures both to extract an accurate speed profile and to effectively perform order tracking, leading to the identification of bearing faults. This approach offers an accurate and reliable tool for the analysis of vibration in mechanical systems driven by AC motors with VFDs. However, it is important to note that some inaccuracies may occur at higher motor slip levels under heavy or variable loads due to the mismatch between the synchronous and actual speeds. Slip-induced variations can further distort tracked order frequencies, compromising the accuracy of vibration analysis for gear mesh and bearing defects. These issues will need to be addressed in future research.
Keywords:
Variable Frequency Drive (VFD)
; pseudo tachometer
; order tracking
; bearing faults
1. Introduction
Order tracking is a signal processing technique which transforms a measured vibration signal from the time domain (sampled at fixed time intervals) into the order domain (constant number of samples per shaft rotation). This resampling enhances fault diagnosis in rotating machinery, allowing the separation of the vibration signal into synchronous and non-synchronous components. Order tracking has proven successful in detecting and diagnosing various mechanical faults, including gear faults, misalignment and bearing defects, and is commonly utilized for gear fault detection [1], misalignment fault diagnosis [2] and bearing fault diagnosis [3].
For effective order tracking, a speed reference signal synchronized with the vibration measurements is essential. Typically, these signals are acquired using speed sensors such as tachometers, key phasors (proximity probes) or optical encoders. Speed sensors may be impractical or challenging to install in harsh operating conditions [4,5], or they may be limited to a location which may not be synchronously related to a shaft of interest. In such situations, “tacho-less” approaches have been developed that rely solely on vibration signals to deduce the instantaneous angular speed. Various tacho-less order tracking techniques have emerged to convert vibration signals into the order domain from the time domain.
Narrow-band phase demodulation techniques, such as those suggested by Bonnardot et al. [6], employ the acceleration signal at specific gear mesh frequencies to track small variations in rotational speed. Another common technique works on extracting a “pseudo” tachometer signal through the phase demodulation of a shaft harmonic component after bandpass filtering, providing a phase (shaft rotation angle) versus time map that is sampled at uniform intervals [7]. With larger speed variations, it often becomes necessary to demodulate a low-frequency harmonic to avoid contamination from sidebands related to another harmonic [7]. Another, relatively straightforward, method to extract a pseudo-tacho involves identifying a separable band in the frequency domain which contains one of the harmonics of the shaft of interest, extracting it (as a complex frequency signal with phase intact) into a new buffer, and inverse transforming it back into the time domain [8]. Zero crossing detection can then be used to identify shaft rotations and obtain a speed profile. The vibration signal can then be resampled with the aid of these zero crossing locations to ensure a constant number of samples for each shaft rotation. This method is illustrated schematically in Figure 1.
Spectrogram-based methods have gained popularity, with Heyns et al. [10] introducing a clustering procedure to track instantaneous frequency (IF), filtering it to resample the signal for fault detection. In cases of larger speed variations, maxima-tracking approaches have demonstrated efficacy. Urbanek et al. [11], Zhao et al. [12] and Schmidt et al. [13] developed techniques to extract the instantaneous frequency from spectrograms that employ filtering and resampling to track signals under varying speed conditions. Others have employed advanced signal decomposition and transformation techniques; e.g. He et al. [14] used discrete spectrum correction, and Leclere et al. [15] used a multi-order method utilizing probability density functions. Significant advancements in ridge detection and time-frequency analysis have also been achieved. Li et al. [16,17] introduced the improved cost function ridge detection (ICFRD) method, which enhances ridge extraction in time-frequency planes through adaptive bandwidth and cost function optimization. Legros et al. [18] combined short-time Fourier transforms and sparse sampling theory to estimate signal modes in noisy environments. Li et al. also proposed the automated and adaptive ridge extraction (AARE) method [19], and the time-frequency ridge estimation (TFRE) method [20].
Despite advancements in tacho-less order tracking methods, accurately identifying and isolating a separable frequency band based on one of the rotor shaft harmonics remains a challenging task due to interference from various other frequency components that are not related to the speed. To address this issue in machinery with VFDs, it is proposed to exploit the VFD signature embedded in the vibration signal as a means to extract an accurate estimate of the AC supply frequency; i.e. the motor’s instantaneous synchronous speed. For induction motors, the shaft speed will approximate the synchronous speed under low-load conditions (minimum slippage).
VFDs play a vital role in applications requiring precise rotational speed and torque control of an AC electric motor. A typical VFD includes an AC rectifier, a DC link, and a DC-to-AC inverter. The rectifier initially converts the AC input voltage – characterized by constant amplitude and frequency – into a pulsating DC voltage, often using a full-wave bridge rectifier with diodes [21]. Following this, the DC link regulates and smooths the rectified signal, typically employing a capacitor bank for energy storage. This arrangement stabilizes the DC voltage and mitigates load-side transients that could affect the distribution system. The DC link serves as a bridge between the rectifier and the inverter, enabling the conversion of the smoothed DC back into a variable-frequency AC supply, often employing advanced technologies such as insulated-gate bipolar transistors (IGBTs). The inverter utilizes Pulse Width Modulation (PWM) techniques to produce a pseudo-sinusoidal voltage of varying frequency [22]. Typically, a high-frequency triangular or sawtooth carrier wave is compared with a sinusoidal signal with the desired output amplitude and frequency. The IGBT switches on when the signal exceeds the carrier wave and switches off when the signal falls below it. The resulting PWM output is then typically passed through a dV/dt and/or a sinewave filter to provide a smoother AC output with the desired voltage and frequency.
VFDs can operate at various carrier frequencies, such as 4, 6, 8, and 10 kHz. Users operating test rigs at lower (e.g. 4 or 6 kHz) frequencies often experience high-pitched noise [23]. Conversely, increasing the carrier frequency to 8 or 10 kHz significantly reduces this audible noise. Generally, higher carrier frequencies lead to a more sinusoidal waveform, albeit at the expense of increased losses within the VFD. The vibration characteristics resulting from VFD operation typically include harmonics of the carrier frequency with sidebands at both the rotor speed and VFD frequency. Notably, the magnitude of the carrier frequency and its harmonics is generally lower than that of the sidebands. Higher-amplitude sidebands manifest at the pseudo line frequency of the VFD, with their amplitude increasing as the carrier frequency decreases [23].
This paper is organized as follows: Section 2 (Material and Methods) presents a summary of the public dataset and the experimental test rig (two-stage gearbox driven by a VFD three-phase four-pole motor). Two separate approaches for extracting speed profiles are then discussed. The first examines the VFD signature from the current signal, while the second utilizes the VFD signature from the vibration signal. Section 3 (Results) details the use of VFD signatures in vibration data for identifying inner and outer race faults in the system. Finally, Section 4 (Discussion and Conclusions) summarizes key insights and findings presented in the paper.
2. Materials and Methods
2.1. Experimental Setup and Data Collection
This study utilizes a public dataset from a vibration test rig powered by a small 3 HP (2.24 kW), 3-phase 4-pole induction motor controlled by a VFD [24]. For a 4-pole motor, the synchronous speed, , can be calculated using equation (1):
The details of the test rig are illustrated in Figure 2, which is extracted from [24]. The motor connects to a two-stage step-up gearbox with a reported overall gear ratio of 2.07 (see gear teeth discussion below). The dataset comprises various data types, including vibration data, motor current data, acoustic data, and temperature data, all collected under different load conditions, speeds, and fault scenarios. For variable-speed conditions, only vibration, motor current and speed data at no load are available. Speed is measured at the gearbox output high-speed shaft (HSS), and ranges from 680 to 2460 rpm. The vibration data are sampled at 25.6 kHz, the current data at 100 kHz, and the acoustic data at 51.2 kHz. The HSS rpm is measured every 0.11 seconds. Additionally, constant-speed data are available at a motor speed of approximately 1500 rpm, resulting in a gearbox output speed of about 3010 rpm.
A schematic representation of the two-stage gearbox is shown in Figure 3. The exact number of teeth on each gear was not provided. These were therefore deduced using the vertical vibration signal recorded at bearing A under constant-speed conditions (HSS ≈ 3010 rpm). This corresponds to a motor and gearbox low-speed shaft (LSS) speed of 1,498 rpm based on the reported overall gear ratio (2.07) of the gearbox. The method of identifying the number of teeth was based on the approach outlined by Sawalhi and Randall [25] in their study on gear parameter identification using vibration signals. The identified number of teeth for each gear were calculated to be: N1 = 60, N2 = 40, N3 = 58, and N4 = 42 giving an overall actual gear ratio of 87/42 ≈ 2.0714. The corresponding actual frequencies for the LSS, intermediate-speed shaft (ISS), and HSS are therefore 24.22 Hz (1,453.22 rpm), 36.33 Hz (2,179.80 rpm), and 50.17 Hz (3,010.2 rpm), respectively. Figure 4 shows the vibration spectrum of bearing A (vertical direction) under constant speed conditions. The second-stage gear mesh frequency (1×GMF2) is clearly identified at 2106.43 Hz, corresponding to N4×HSS. The second harmonic of the first gear mesh frequency (2×GMF1) appears at 2905.43 Hz, with an amplitude higher than the fundamental (1×GMF1), suggesting a possible misalignment of the LSS. Further evidence of LSS misalignment is provided by the distinct sidebands around 1×GMF1 (1452.715 Hz) at 1×LSS, as displayed in the zoomed-in section. Additionally, the vibration signal includes the variable frequency drive (VFD) carrier frequency at 6002.4 Hz, with noticeable sidebands at 2×VFD. These VFD-related observations are discussed further in Sections 2.2 and 2.3.
In the varying load condition test, each bearing fault – inner race, outer race, and ball fault – was introduced separately in bearing housing B. The bearing used for testing is an NSK 6205 DDU, featuring a ball diameter (d) of 7.90 mm, a pitch diameter (D) of 38.5 mm, a contact angle (θ) of zero degrees, and a total of 9 balls (N). Table 1 presents the fundamental train frequency (FTF), ball pass frequency inner (BPFI), ball pass frequency outer (BPFO), and ball spin frequency (BSF), expressed as orders of the high-speed shaft (HSS).
2.2. Current and Vibration Signal Comprasion Under Constant Speed
Figure 5 presents a comparison between the current and vibration spectra from bearing housing A in the low-frequency range (0 – 150 Hz), displayed on both linear and logarithmic (dB) scales. From Figure 5 we can see that the VFD is 48.4812 Hz (motor synchronous speed = VFD/2 = 24.2406 Hz) and that the LSS = 24.2133 Hz. As such, the slip frequency can be calculated as: 24.2406 − 24.2133 = 0.0273 Hz (1.638 rpm). In the current spectrum, the dominant frequency is 1×VFD at 48.4812 Hz, which is clearly visible in the linear scale. In the log-scale (dB) spectrum, two frequencies at 24.2756 Hz and 72.6876 Hz are also visible in addition to 2×VFD. These two frequencies are very close to 0.5×VFD and 1.5×VFD. However, they appear to be spaced at approximately 24.2056 Hz around the VFD suggesting a modulation of the VFD by the rotor speed, as the spacing is closer to the rotor speed (24.2133 Hz) rather than 0.5×VFD (24.2406 Hz). The vibration spectrum provides more detailed information about the mechanical system. The 1×HSS frequency at 50.1567 Hz is clearly visible, along with a significant 2×HSS harmonic, which appears to suggest some misalignment of the HSS. Both the ISS (36.32 Hz) and LSS (24.2133 Hz) frequencies are also present in the linear spectrum, but with lower amplitudes compared to the HSS. In the log-scale spectrum, components at 2×, 3× and 4×LSS can also be seen.
Figure 6 compares the current and vibration linear spectra around the VFD carrier frequency. In the current spectrum, sidebands are visible at 1×VFD, with the VFD carrier itself exhibiting a low amplitude. In contrast, the vibration spectrum shows the VFD carrier along with prominent sidebands at 2×VFD. This behavior is attributed to the motor's magnetic forces (torque) fluctuating at twice the VFD frequency due to two magnetic flux peaks per current cycle. Note that a smaller amplitude vibration at 1×VFD sidebands is also evident. This is possibly due to slight variations between the pole pairs in the 4-pole motor. Torque modulation typically takes place around the steady-state torque component (0 Hz) and the VFD PWM carrier frequency. Modulation around the steady-state torque frequency may overlap with other mechanical vibrations, such as harmonics from the motor or gearbox. However, modulation near the VFD carrier frequency is more isolated, allowing for clearer demodulation of the VFD frequency.
2.3. Speed Profile Extraction from the Current Signal Under Variable Speed Operation
Figure 7 illustrates a typical current signal and its frequency content for variable-speed operation under no-fault conditions. In the signal shown in Figure 7.a, a varying sinusoidal frequency is observed, with a fundamental frequency corresponding to the VFD frequency. This can be further examined using frequency analysis (Figure 7.c), which shows that the VFD frequency varies between 10 and 40 Hz. For a 4-pole motor, the motor synchronous speed (≈ LSS under no load) will therefore vary between 5 to 20 Hz. The HSS speed is the LSS (motor) speed multiplied by the gear ratio of 87/42. Zooming in on the time interval between 0.1 and 0.11 seconds (Figure 7.b) highlights the sawtooth carrier frequency at 6 kHz, accompanied by voltage switching spikes. Zooming in on the frequency interval around the 6 kHz carrier frequency (Figure 7.d) shows that, the first-order VFD sidebands around the 6 kHz carrier in fact carry the same information as the VFD baseband (Figure 7.c) and can therefore relay the same information.
A pseudo tachometer signal can be derived from any of the three frequency bands illustrated in Figure 7: Band A (0-50 Hz), Band B (5950-6002.4 Hz), or Band C (6002.4-6050 Hz). It is important to note that the carrier frequency at 6002.4 Hz represents a line of symmetry, as indicated by the red dashed line in Figure 8.d. This line is analogous to zero frequency. Consequently, in Figure 7.d, the frequencies to the right of this line (Band C) represent positive frequencies, while those to the left (Band B) represent negative frequencies. To extract a speed profile, a buffer filled with zeros, sized similarly to the Fast Fourier Transform (FFT) size, is first created. The frequency band of interest (one of the three bands mentioned above) is then copied into this buffer, ensuring that the carrier frequency (for Bands B and C) aligns with the zero frequency. Following this, the buffer undergoes an inverse-FFT transformation to the time domain, resulting in a pseudo encoder signal at the VFD line frequency. By identifying the zero crossings of this pseudo encoder signal, the instantaneous VFD frequency can be calculated. To obtain a speed profile for the HSS, the VFD frequency is multiplied by 2 and divided by 4 as per equation (1). This yields the synchronous motor speed (≈LSS), which is then multiplied by the gear ratio (87/42) to obtain the HSS speed. This process is illustrated schematically in Figure 8.
The extracted speed profiles for the three bands are displayed in Figure 9, with smoothing applied using a median filter of 5 samples. Importantly, the use of any of these bands yields an accurate speed estimate as compared to the actual rpm profile, as there is no significant signal interference present. Time-frequency plots alongside the extracted speed profiles (with no smoothing) are presented in Figure 10 and Figure 11 for Bands A, B and C, respectively. Note that these two figures show time-frequency plots for the selected bands, clearly illustrating the observed speed variations. Furthermore, the extracted speed profiles align closely with the variations depicted in these time-frequency plots.
2.4. Speed Profile Extraction Using VFD Signature in the Vibration Signal
Figure 12 presents a 60-second acceleration signal measured on Bearing B, (vertical direction) accompanied by a spectrogram that reveals the speed profile variation. This variation is clearly observable in the low-frequency regions, around the gear mesh frequencies, and near the 6 kHz VFD carrier frequency. Figure 13 further examines the vibration signal collected from Bearing B within three frequency bands [0-45 Hz], [5900-6002.4 Hz], and [6002.4-6100 Hz], designated as Bands A, B and C respectively. It is important to note that to extract a tachometer reference, one must isolate a frequency band that contains the variation from a single component without interference from other components. This task is particularly challenging in this context, as different shaft harmonics often coexist in the selected frequency band. The situation is further complicated in the vicinity of the gear mesh frequencies due to the rich content of sidebands surrounding each harmonic. Note that Bands B and C are asymmetric (unlike the equivalent signal bands in the current signal presented earlier in Figure 7.d). Asymmetric sidebands in the vibration signal from a variable frequency drive (VFD) carrier frequency can result from several factors. The use of Pulse Width Modulation (PWM) leads to non-linearity in the switching pattern, causing uneven energy distribution around the carrier frequency. Note that the sidebands in the current signal are more balanced because the inductive nature of the load (like motors) naturally filters out high-frequency PWM harmonics, smoothing the current waveform. In contrast, the vibration signal is more directly affected by the switching and mechanical resonances, leading to more pronounced and uneven sidebands around the carrier frequency. Variations in load, such as changes in torque or inertia, can further contribute to a non-linear frequency response and asymmetry.
The extracted speed profiles for the three bands are presented in Figure 14 with smoothing applied using a median filter of 21 samples. Notably, the speed profile derived from Band A fails to provide an accurate representation of the actual speed, particularly at lower speeds. In contrast, the speed profiles obtained from Bands B and C clearly yield accurate results that closely match the measured rpm profile.
Figure 15 and Figure 16 display spectrogram plots for the selected bands, alongside the actual and smoothed profiles for Bands A, B and C, respectively. Note that Band A is dominated by the 1×HSS and 2×HSS harmonics, not the VFD, and so the speed profile in this particular case is based on the demodulation of these components. Figure 15 illustrates the interaction between the 1×HSS and 2×HSS harmonics under misalignment conditions, highlighting the greatest error occurring at minimum speed. In Figure 16, the spectrogram around the VFD carrier frequency reveals a clear speed profile at 2×VFD, characterized by minimal interference, thereby resulting in a more accurate estimate of the speed profile.
3. Results
3.1. Inner Race Fault Identification
Figure 17 shows the time and frequency plots of a vibration signal with an inner race fault. The frequency bands used for HSS speed profile extraction are presented in Figure 17.c (Band A) and Figure 17.d (Bands B and C: sidebands at 2×VFD). Note that Bands B and C, are asymmetric with more energy levels seen in Band C.
Figure 18 shows the speed profile extracted using Band A [0-45 Hz]. The unfiltered rpm profile exhibits spikes where the HSS fundamental interacts with the 2×HSS harmonic. Applying a median smoothing filter with a window of 21 samples effectively eliminates these spikes. The smoothed rpm profile can be seen to closely follow the pattern observed in the spectrogram, except for the peaks, which are flattened due to the smoothing filter. Figure 19 displays the rpm speed profiles (both raw and smoothed), extracted using the VFD signature in Bands B and C, alongside their corresponding spectrograms. The profile obtained from Band C, which has the higher energy, is notably less susceptible to interference, providing a clear representation that closely aligns with the rpm pattern observed in the spectrogram. In contrast, the rpm profiles derived from Band B are less accurate, particularly at peak speeds, where the lowest negative left sideband frequencies exhibit the least energy and as such are more affected by noise interference. Overall, the results indicate that using VFD sidebands, especially those with higher energy such as Band C, yields better outcomes.
Figure 20 presents a comparison of the residual envelope signals and spectra for order-tracked signals using Bands A, B, and C. The results indicate that order tracking with VFD Bands B and C significantly outperforms that using Band A. This is evident in the number of identified harmonics, the reduction of the smearing effect, and the clarity of the sidebands around the ball pass frequency of the inner race (BPFI). Band C delivers the clearest envelope spectrum, effectively illustrating the BPFI without any smearing up to the fourth harmonic. Additionally, the sidebands around the BPFI, particularly the 2× harmonic indicative of misalignment, are prominently visible. Band B also performs well, though not as effectively as Band C, while Band A lacks clarity and harmonic identification. Overall, the analysis demonstrates that using VFD bands, especially Band C, enhances the detection and characterization of critical frequency components in the vibration signals.
3.2. Outer Race Fault Identification
Figure 21 presents the time and frequency plots of the vibration signal measured from a defective bearing with an outer race fault. The rpm speed profile extraction bands are illustrated in Figure 21.c (Band A) and Figure 21.d (Bands B and C). Notably, Bands B and C exhibit symmetry with similar energy levels, in contrast to the scenario with the inner race defect. This symmetry suggests that both bands are likely to yield effective rpm profile extraction with minimal noise interference.
Figure 22 shows the speed profile obtained using Band A [0-45 Hz]. The unfiltered rpm profile closely follows the spectrogram, with minimal interference from the 2×HSS component, indicating that the speed variations are mainly influenced by the fundamental harmonic. When a median smoothing filter is applied, the smoothed rpm profile aligns well with the spectrogram pattern, though the peaks are flattened due to the filter effect. Overall, Band A appears to effectively capture the speed profile accurately.
Figure 23 shows the rpm speed profiles (both raw and smoothed) extracted from the VFD signature using Bands B and C, along with their corresponding spectrograms. Bands B and C exhibit similar characteristics due to similar energy levels, and provide better speed profiles at the peaks, as these profiles are not flattened like those from band A.
Figure 24 compares the residual envelope signals and spectra for order-tracked signals using bands A, B, and C. The results demonstrate that order tracking with VFD bands B and C significantly outperforms band A. This improvement is evident in the number of identified harmonics and the reduction of the smearing effect. Both bands B and C clearly display the fundamental ball pass frequency of the outer race (1×BPFO) and its second harmonic, whereas band A only shows the 1×BPFO at a low level and in a smeared manner.
4. Discussion, Conclusions and Future Work
This study demonstrates the effectiveness of using VFD signatures in vibration signals to accurately extract speed profiles and perform order tracking under light load. The results show that VFD signatures provide a reliable means of deriving speed variations directly from vibration data, especially in cases where traditional speed sensors are unavailable or insufficient due to rapid speed fluctuations. The speed profiles were extracted from the vibration signal using a band around the fundamental frequency (Band A) and two additional bands around the carrier frequency: Band B (left) and Band C (right). The results for vibration signal Band A were dominated by the 1×HSS and 2×HSS harmonics rather than the VFD signature. Smoothing was applied using a median filter of 21 samples. It was observed that the speed profile derived from Band A did not accurately represent the actual speed, particularly at lower rotational speeds. In contrast, the speed profiles obtained from Bands B and C provided more accurate results, closely matching the measured RPM profile. These profiles also aligned well with those extracted from the current signal, where similar bands (A, B, and C) were used, further confirming their reliability. The use of VFD Bands B and C – representing the left and right sidebands at 2×VFD around the carrier frequency – offers significant advantages for order tracking. In detecting both inner race and outer race faults, these bands not only present clearer representations of the ball pass frequencies (BPFI and BPFO) and their harmonics, but they also show fewer artifacts and improved harmonic identification compared to Band A, which relies on the HSS frequency. Bands B and C consistently yield the clearest envelope spectra, effectively capturing critical frequencies with minimal smearing. This enhanced performance is attributed to the higher energy content in the VFD sidebands of Bands B and C, making them more resilient to noise interference.
It is important to note that as order tracking relies on a reference rotational speed, using the VFD as the reference may result in orders that do not align with actual rotor events, especially at higher slip levels under heavy or variable loads. Dynamic slip variations can further distort tracked order frequencies, reducing analysis accuracy. While synchronous and rotor speed profiles follow similar trends, the slip-induced offset prevents perfect alignment of rotor-related vibration signals, such as gear mesh and bearing defect frequencies, with the VFD-based reference. Therefore, accounting for slip through adjustments or corrections is essential for accurate order tracking and reliable bearing frequency analysis in induction motors.
Suggested future work should focus on testing and improving bearing fault detection methods under varying load conditions, particularly addressing slip-induced frequency shifts, such as those caused by speed-dependent loads (like motor-driven fans). This should include evaluating the accuracy of order tracking when the VFD-extracted speed is used as the reference instead of rotor speed, assessing the reliability of envelope analysis for identifying bearing defect frequencies, and examining the impact of motor slip on fault detection performance. Other factors worth investigating include: the interaction of drivetrain vibration components within the VFD carrier frequency bands, especially in cases where significant gear mesh frequencies overlap with the carrier region, as might occur in drivetrains with lower carrier frequencies (e.g., 4 kHz); and exploring demodulation around second or higher harmonics of the carrier frequency. These efforts aim to enhance the reliability and adaptability of vibration-based diagnostic techniques for diverse operational scenarios.
Supplementary Materials
The interference of Variable Frequency Drives (VFDs) on the vibration signature analysis of machine defects: https://spectraquest.com/technote_display/?technote_id=37
Author Contributions
Conceptualization, N.S. methodology, N.S.; software, N.S.; validation, N.S. formal analysis, N.S.; investigation, N.S.; resources, N.S ; data curation, N.S.; writing—original draft preparation, N.S.; writing—review and editing, N.S., visualization, N.S.; supervision, N.S. All authors have read and agreed to the published version of the manuscript.
Funding
This research received no external funding.
Institutional Review Board Statement
Not applicable.
Informed Consent Statement
Not applicable.
Data Availability Statement
The data used in this work is a public dataset that can be accessed using the following link: https://data.mendeley.com/datasets/ztmf3m7h5x/6 (accessed on 1 October 2024).
Acknowledgement
The author would like to acknowledge Dr. Suri Ganriwala from SpectraQuest for his rich discussions and support for an earlier work on VFD signatures in vibration signals, which inspired this paper. Acknowledgments also goes to Dr. Wenyi Wang and Dr. David Blunt from DSTG for reviewing the paper.
Conflicts of Interest
The author declares no conflicts of interest.
References
- Heyns, T.; Heyns, P.S.; De Villiers, J.P. Combining synchronous averaging with a Gaussian mixture model novelty detection scheme for vibration-based condition monitoring of a gearbox. Mech. Syst. Signal Process 2012, 32, 200–215. [CrossRef]
- Stander, C.J.; Heyns, P.S.; Schoombie, W. Using vibration monitoring for local fault detection on gears operating under fluctuating load conditions. Mech. Syst. Signal Process 2002, 16(6), 1005–1024. [CrossRef]
- Qi, X.; Yuan, Z.; Han, X. Diagnosis of misalignment faults by tacholess order tracking analysis and RBF networks. Neurocomputing 2015, 169, 439–448. [CrossRef]
- Abboud, D.; Antoni, J.; Sieg-Zieba, S.; Eltabach, M. Envelope analysis of rotating machine vibrations in variable speed conditions: a comprehensive treatment. Mech. Syst. Signal Process 2017, 84, 200–226. [CrossRef]
- Combet, F.; Gelman, L. An automated methodology for performing time synchronous averaging of a gearbox signal without speed sensor. Mech. Syst. Signal Process 2007, 21(6), 2590–2606. [CrossRef]
- Zhao, M.; Lin, J.; Wang, X.; Lei, Y.; Cao, J. A tacho-less order tracking technique for large speed variations. Mech. Syst. Signal Process 2013, 40(1), 76–90. [CrossRef]
- Bonnardot, F.; El Badaoui, M.; Randall, R.B.; Daniere, J.; Guillet, F. Use of the acceleration signal of a gearbox in order to perform angular resampling (with limited speed fluctuation). Mech. Syst. Signal Process 2005, 19(4), 766–785. [CrossRef]
- Coats, M.D.; Sawalhi, N.; Randall, R.B. Extraction of tacho information from a vibration signal for improved synchronous averaging. In Proceedings of Acoustics Australia; 2009; Adelaide, Australia, 23–25 November 2009.
- Urbanek, J.; Barszcz, T.; Sawalhi, N.; Randall, R.B. Comparison of amplitude-based and phase-based methods for speed tracking in application to wind turbines. Metrology and Measurement Systems 2011, 18, 295–304. [CrossRef]
- Heyns, T.; Heyns, P.S.; Zimroz, R.; Combining discrepancy analysis with sensorless signal resampling for condition monitoring of rotating machines under fluctuating operations. Int. J. Condition Monit. 2012, 2(2), 52–58.
- Urbanek, J.; Barszcz, T.; Antoni, J. A two-step procedure for estimation of instantaneous rotational speed with large fluctuations. Mech. Syst. Signal Process 2013, 38(1), 96–102. [CrossRef]
- Zhao, M.; Lin, J.; Wang, X.; Lei, Y.; Cao, J. A tacho-less order tracking technique for large speed variations. Mech. Syst. Signal Process 2013, 40(1), 76–90. [CrossRef]
- Schmidt, S.; Heyns, P.S.; De Villiers, J.P. A tacholess order tracking methodology based on a probabilistic approach to incorporate angular acceleration information into the maxima tracking process. Mech. Syst. Signal Process 2018, 100, 630–646. [CrossRef]
- He, G.; Ding, K.; Li, W.; Jiao, X. A novel order tracking method for wind turbine planetary gearbox vibration analysis based on discrete spectrum correction technique. Renew. Energy 2016, 87, 364–375. [CrossRef]
- Leclere, Q.; André, H.; Antoni, J. A multi-order probabilistic approach for instantaneous angular speed tracking debriefing of the CMMNO14 diagnosis contest. Mech. Syst. Signal Process 2016, 81, 375–386. [CrossRef]
- Li, Y.; Yang, Y.; Chen, Y.; Chen, Z. Iterative characteristic ridge extraction for bearing fault detection under variable rotational speed conditions. ISA Trans. 2022, 119, 172–183. [CrossRef]
- Li, Y.; Yang, Y.; Saraygord Afshari, S.; Liang, X.; Chen, Z. Adaptive cost function ridge estimation for rolling bearing fault diagnosis under variable speed conditions. IEEE Trans. Instrum. Meas. 2022, 71, 1–12. [CrossRef]
- Legros, Q.; Fourer, D. Time-frequency ridge estimation of multi-component signals using sparse modeling of signal innovation. arXiv 2022, arXiv:2212.11343.
- Li, Y.; Yang, Y.; Feng, K.; Zuo, M.J.; Chen, Z. Automated and adaptive ridge extraction for rotating machinery fault detection. IEEE/ASME Trans. Mechatron. 2023. [CrossRef]
- Li, Y.; Zhang, X.; Chen, Z.; Yang, Y.; Geng, C.; Zuo, M.J. Time-frequency ridge estimation: An effective tool for gear and bearing fault diagnosis at time-varying speeds. Mech. Syst. Signal Process 2023, 189, 110108. [CrossRef]
- Full Wave Rectifier and Bridge Rectifier Theory: https://www.electronics-tutorials.ws/diode/diode_6.html (accessed on the 15th of October , 2024).
- How Pulse Width Modulation in a VFD works: KEB: https://www.kebamerica.com/blog/pulse-width-modulation-in-vfds/ (accessed on the 15th of October , 2024).
- The interference of Variable Frequency Drives (VFDs) on the vibration signature analysis of machine defects: https://spectraquest.com/technote_display/?technote_id=37 (accessed on the 15th of October, 2024).
- Jung, W.; Kim, S.-H.; Yun, S.-H.; Bae, J.; Park, Y.-H. Vibration, Acoustic, Temperature, and Motor Current Dataset of Rotating Machine Under Varying Operating Conditions for Fault Diagnosis. Data Brief 2023, 48, 109049. [CrossRef]
- Sawalhi, N.; Randall, R.B. Gear Parameter Identification in a Wind Turbine Gearbox Using Vibration Signals. Mech. Syst. Signal Process. 2014, 42, 368–376. [CrossRef]
Figure 1.
Reference (speed) signal extraction stages: (a) identifying a separable band, (b) extracting the band into a new buffer and (c) inversing transforming signal b into the time domain (zoomed in) [8].
Figure 1.
Reference (speed) signal extraction stages: (a) identifying a separable band, (b) extracting the band into a new buffer and (c) inversing transforming signal b into the time domain (zoomed in) [8].
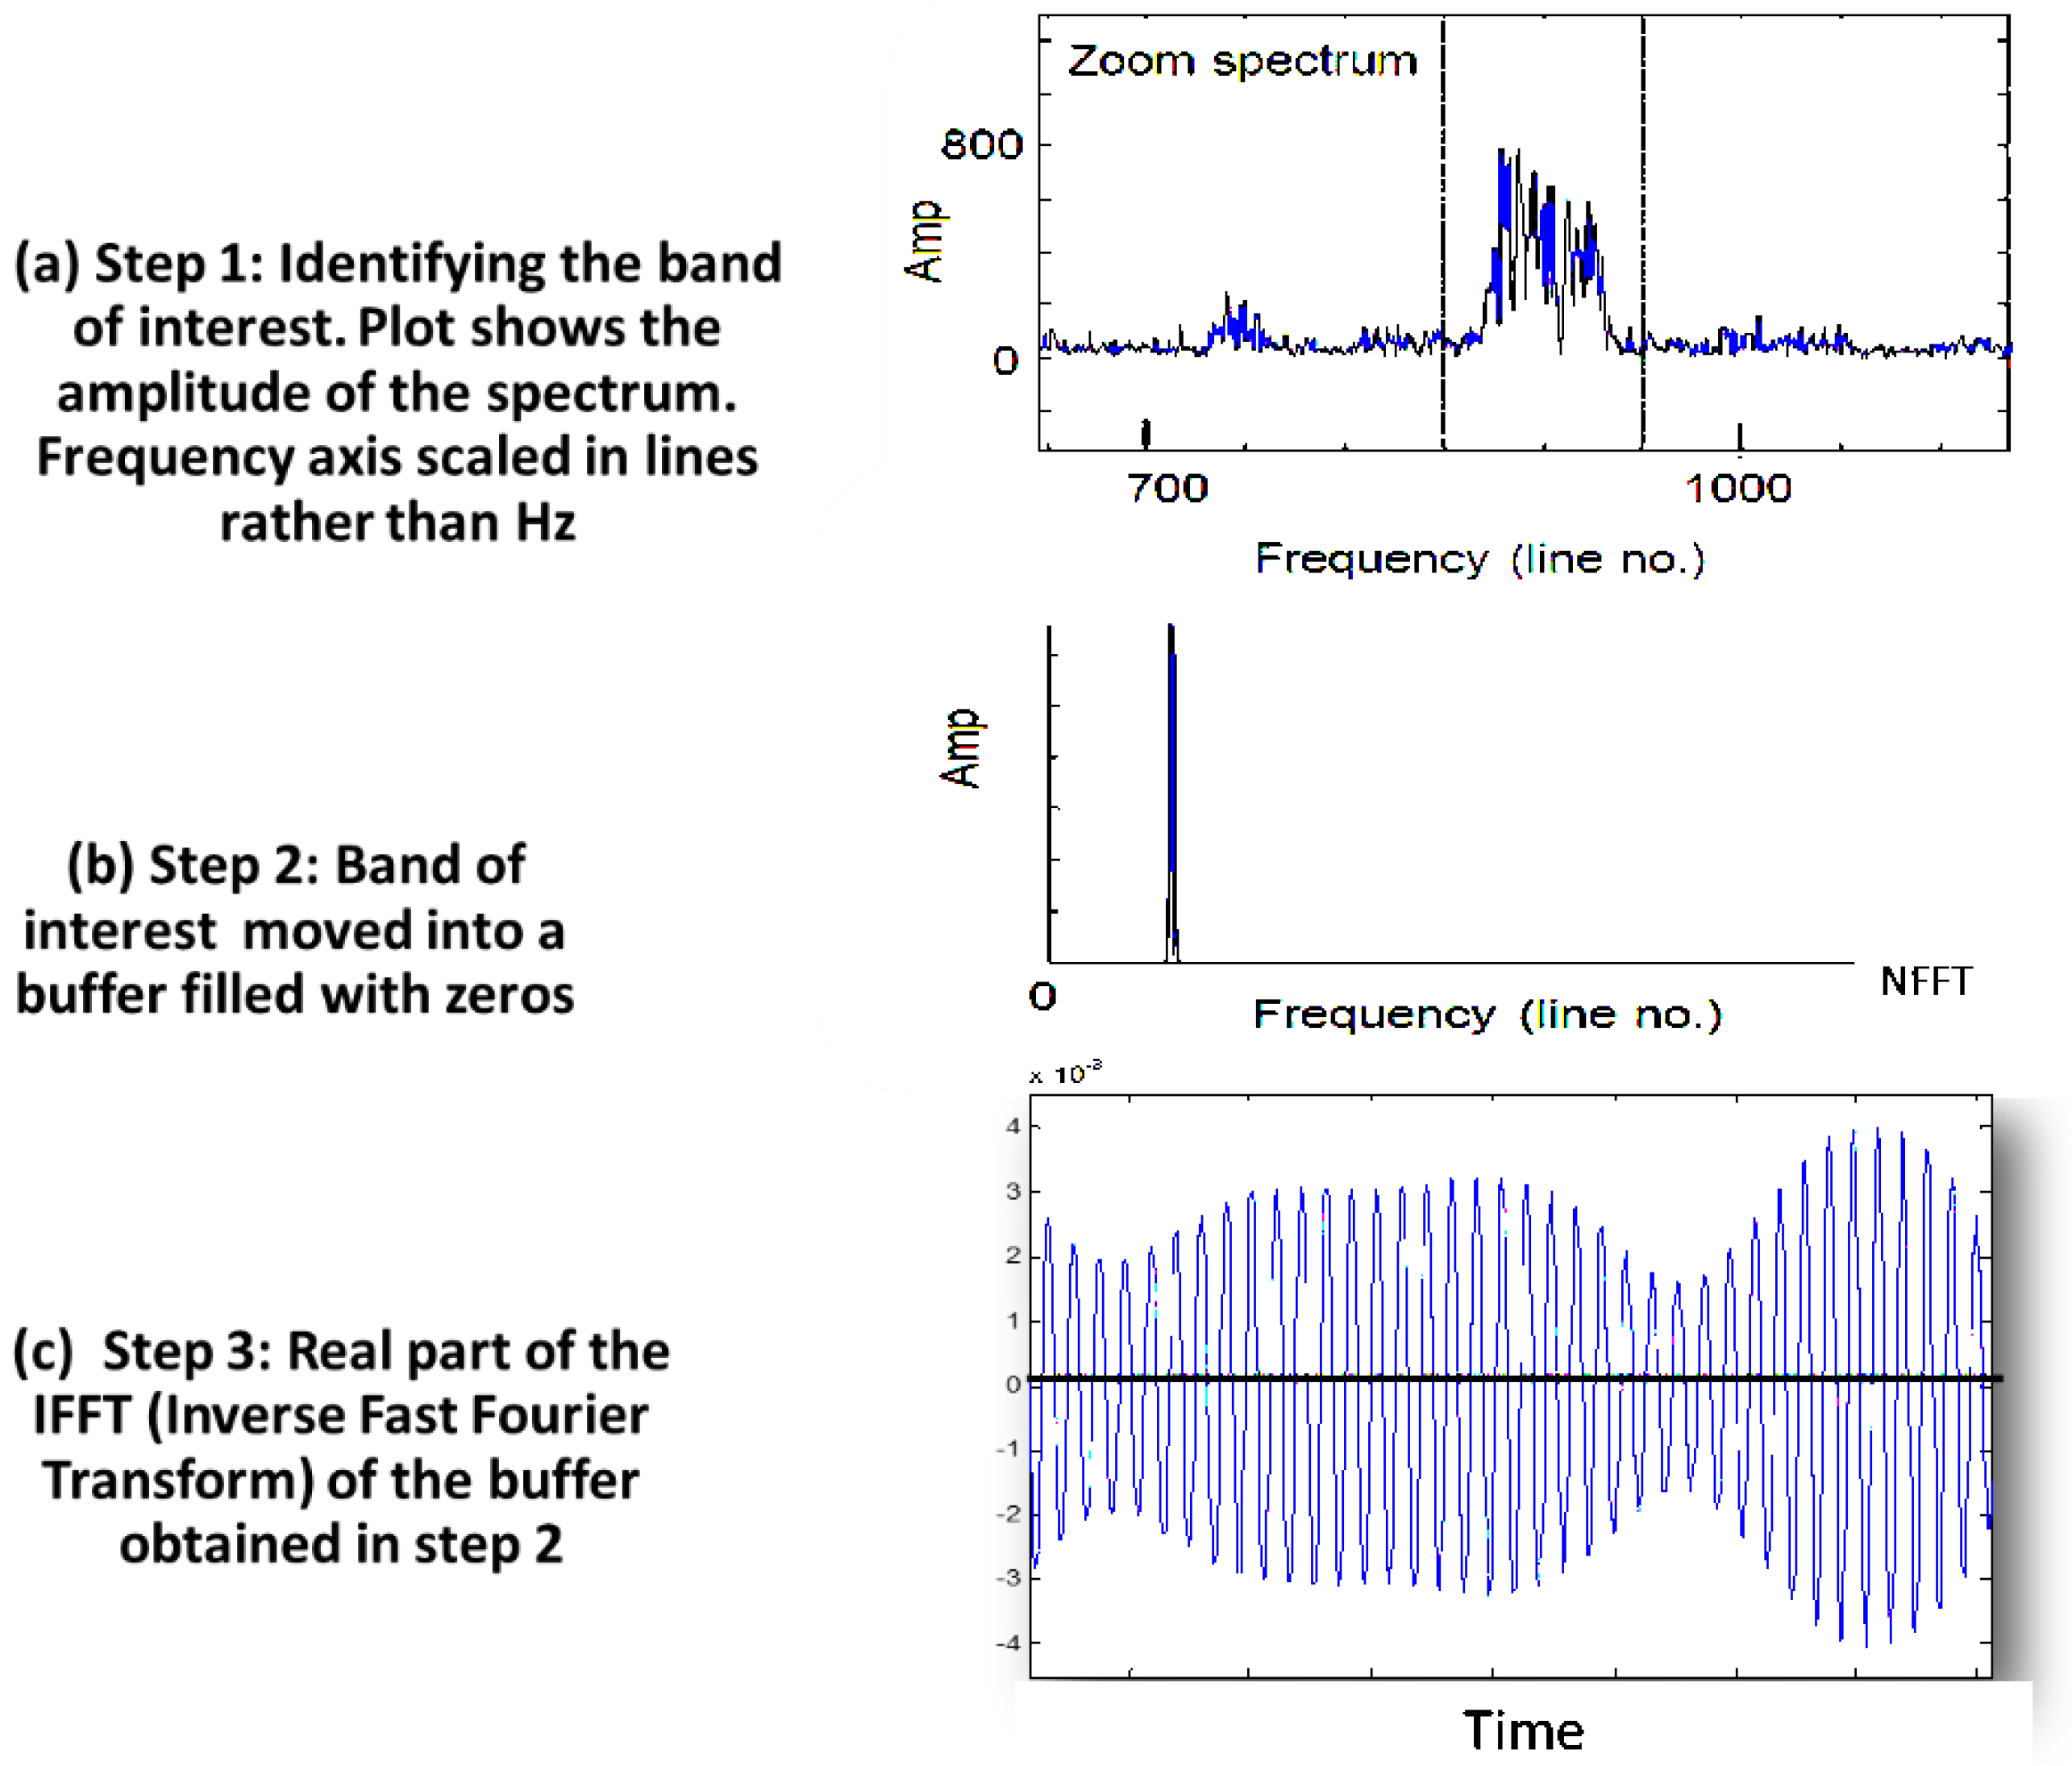
Figure 2.
Image of the test rig [24].
Figure 2.
Image of the test rig [24].
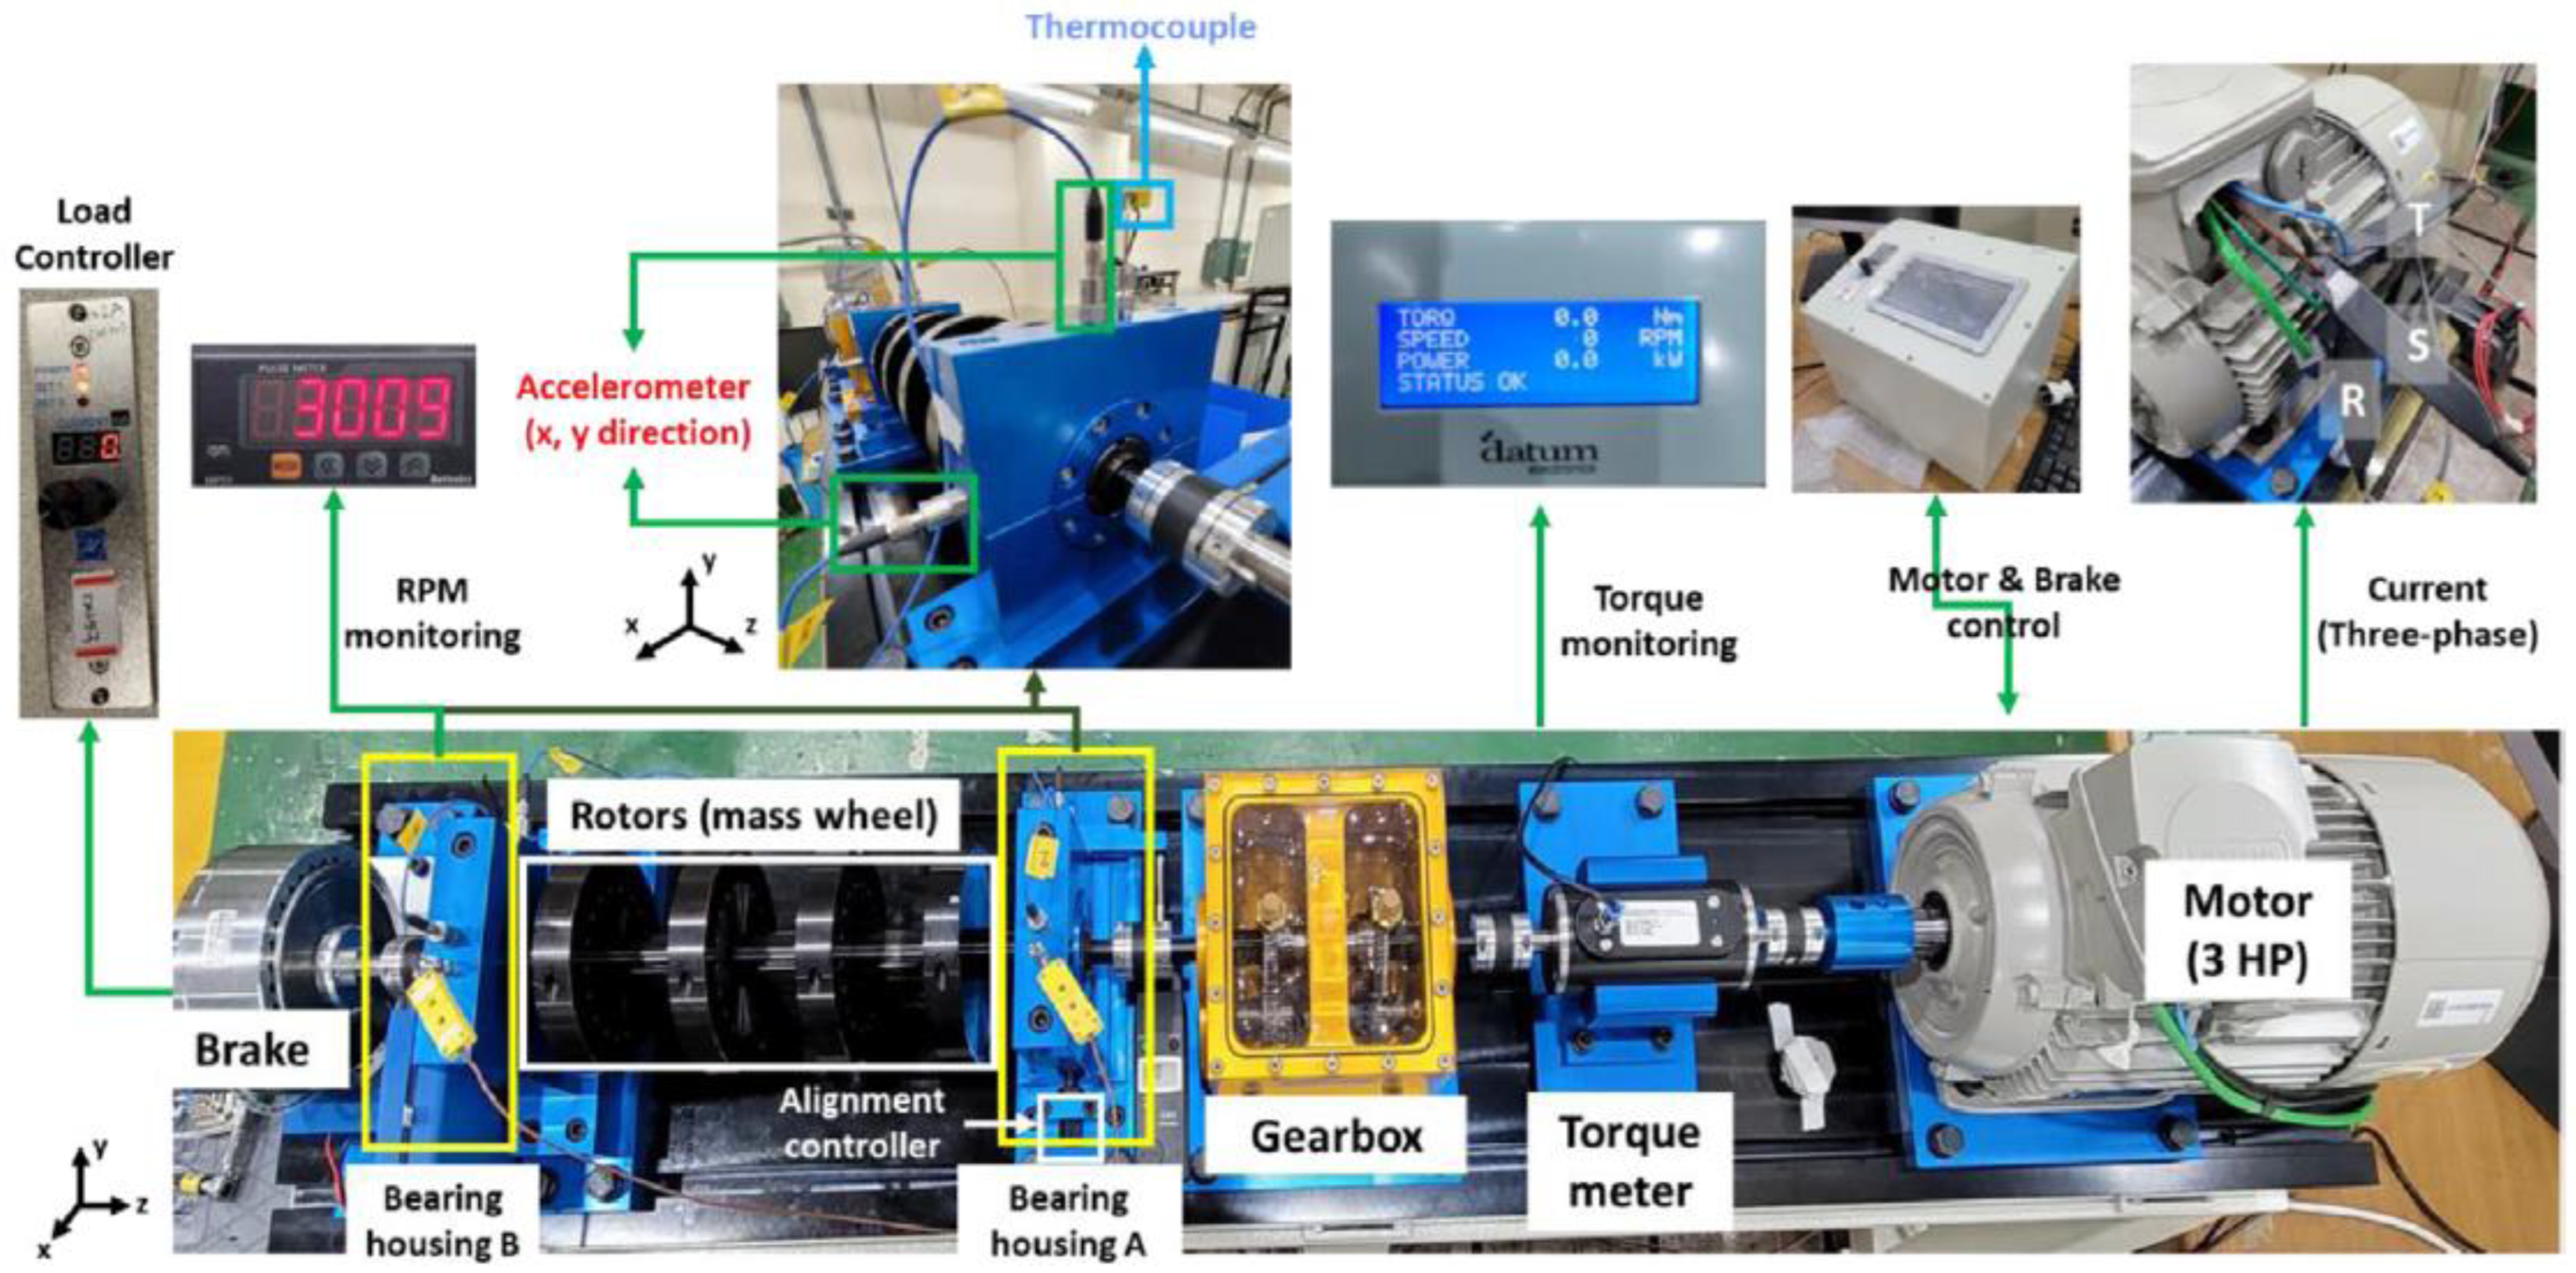
Figure 3.
Schematic presentation of the 2-stage gearbox.
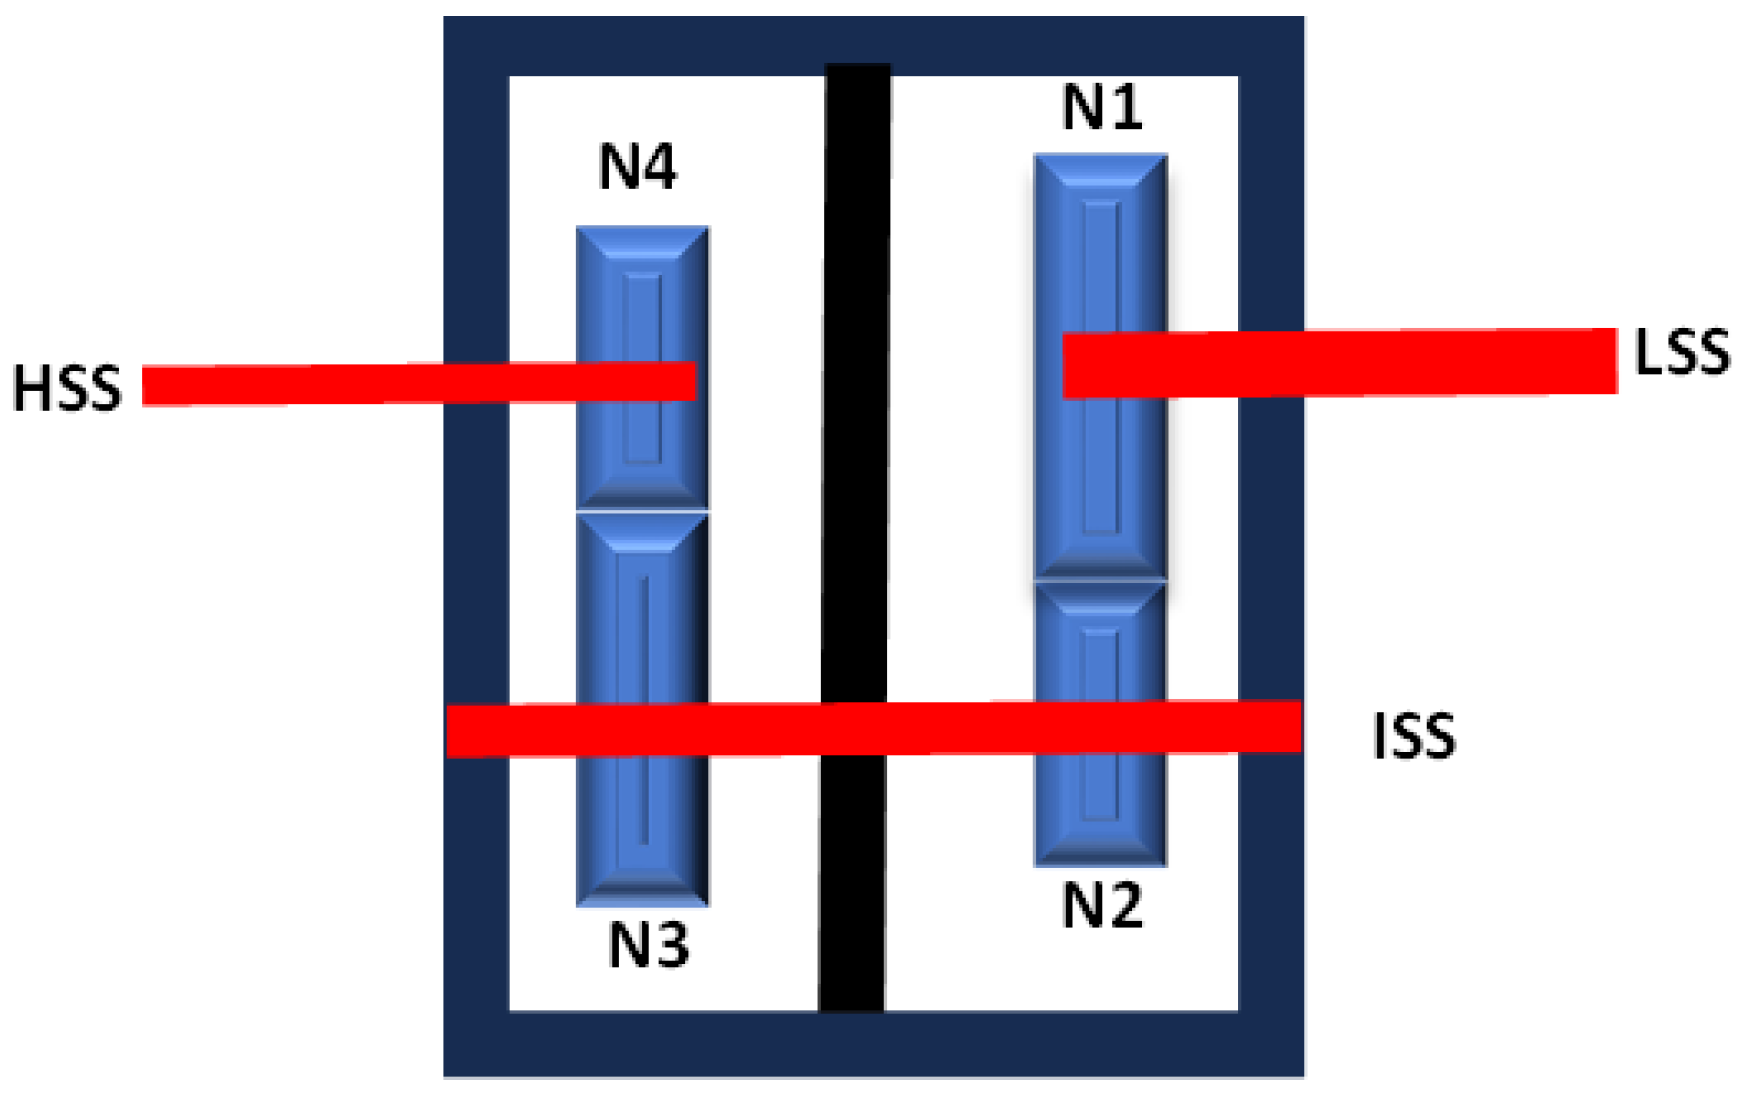
Figure 4.
Bearing A vertical vibration under constant speed (HSS ≈ 3010 rpm) and no load.

Figure 5.
Comparison between current spectra and vibration spectra in the low frequency region (0-150 Hz) on both linear and log (dB) scale).
Figure 5.
Comparison between current spectra and vibration spectra in the low frequency region (0-150 Hz) on both linear and log (dB) scale).
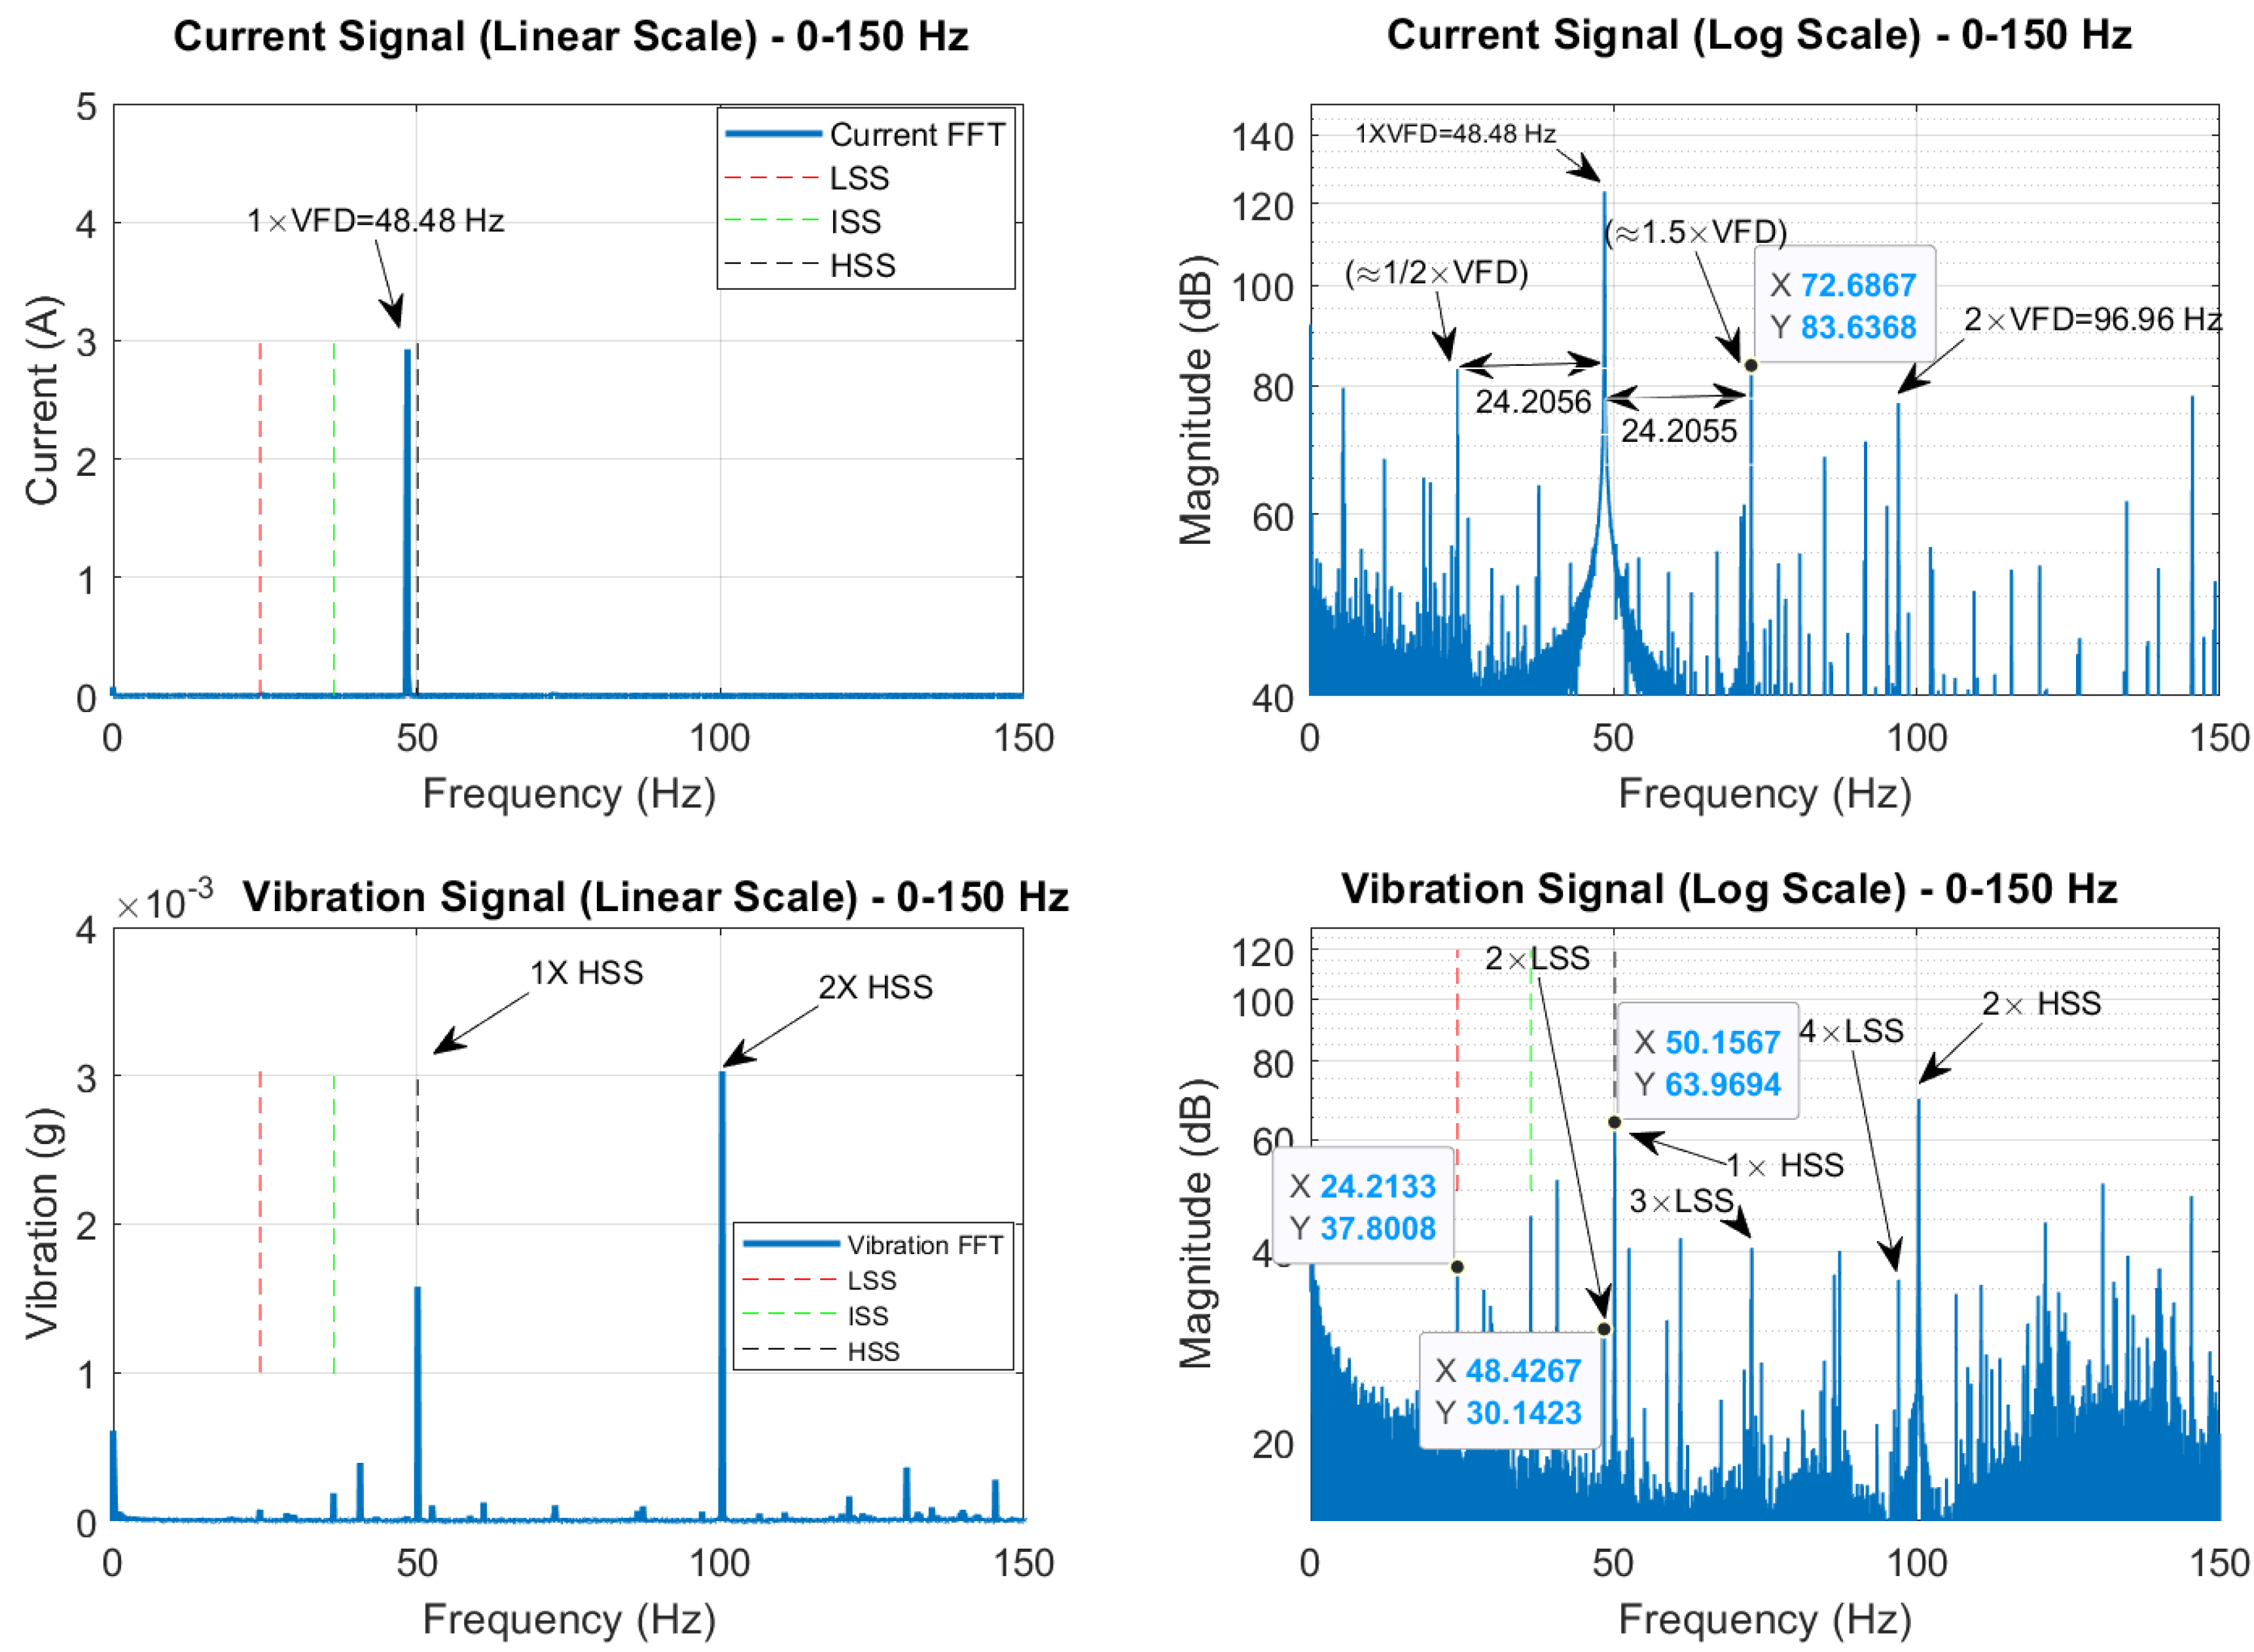
Figure 6.
Comparison between current spectra and vibration linear spectra around the VFD carrier frequency.
Figure 6.
Comparison between current spectra and vibration linear spectra around the VFD carrier frequency.
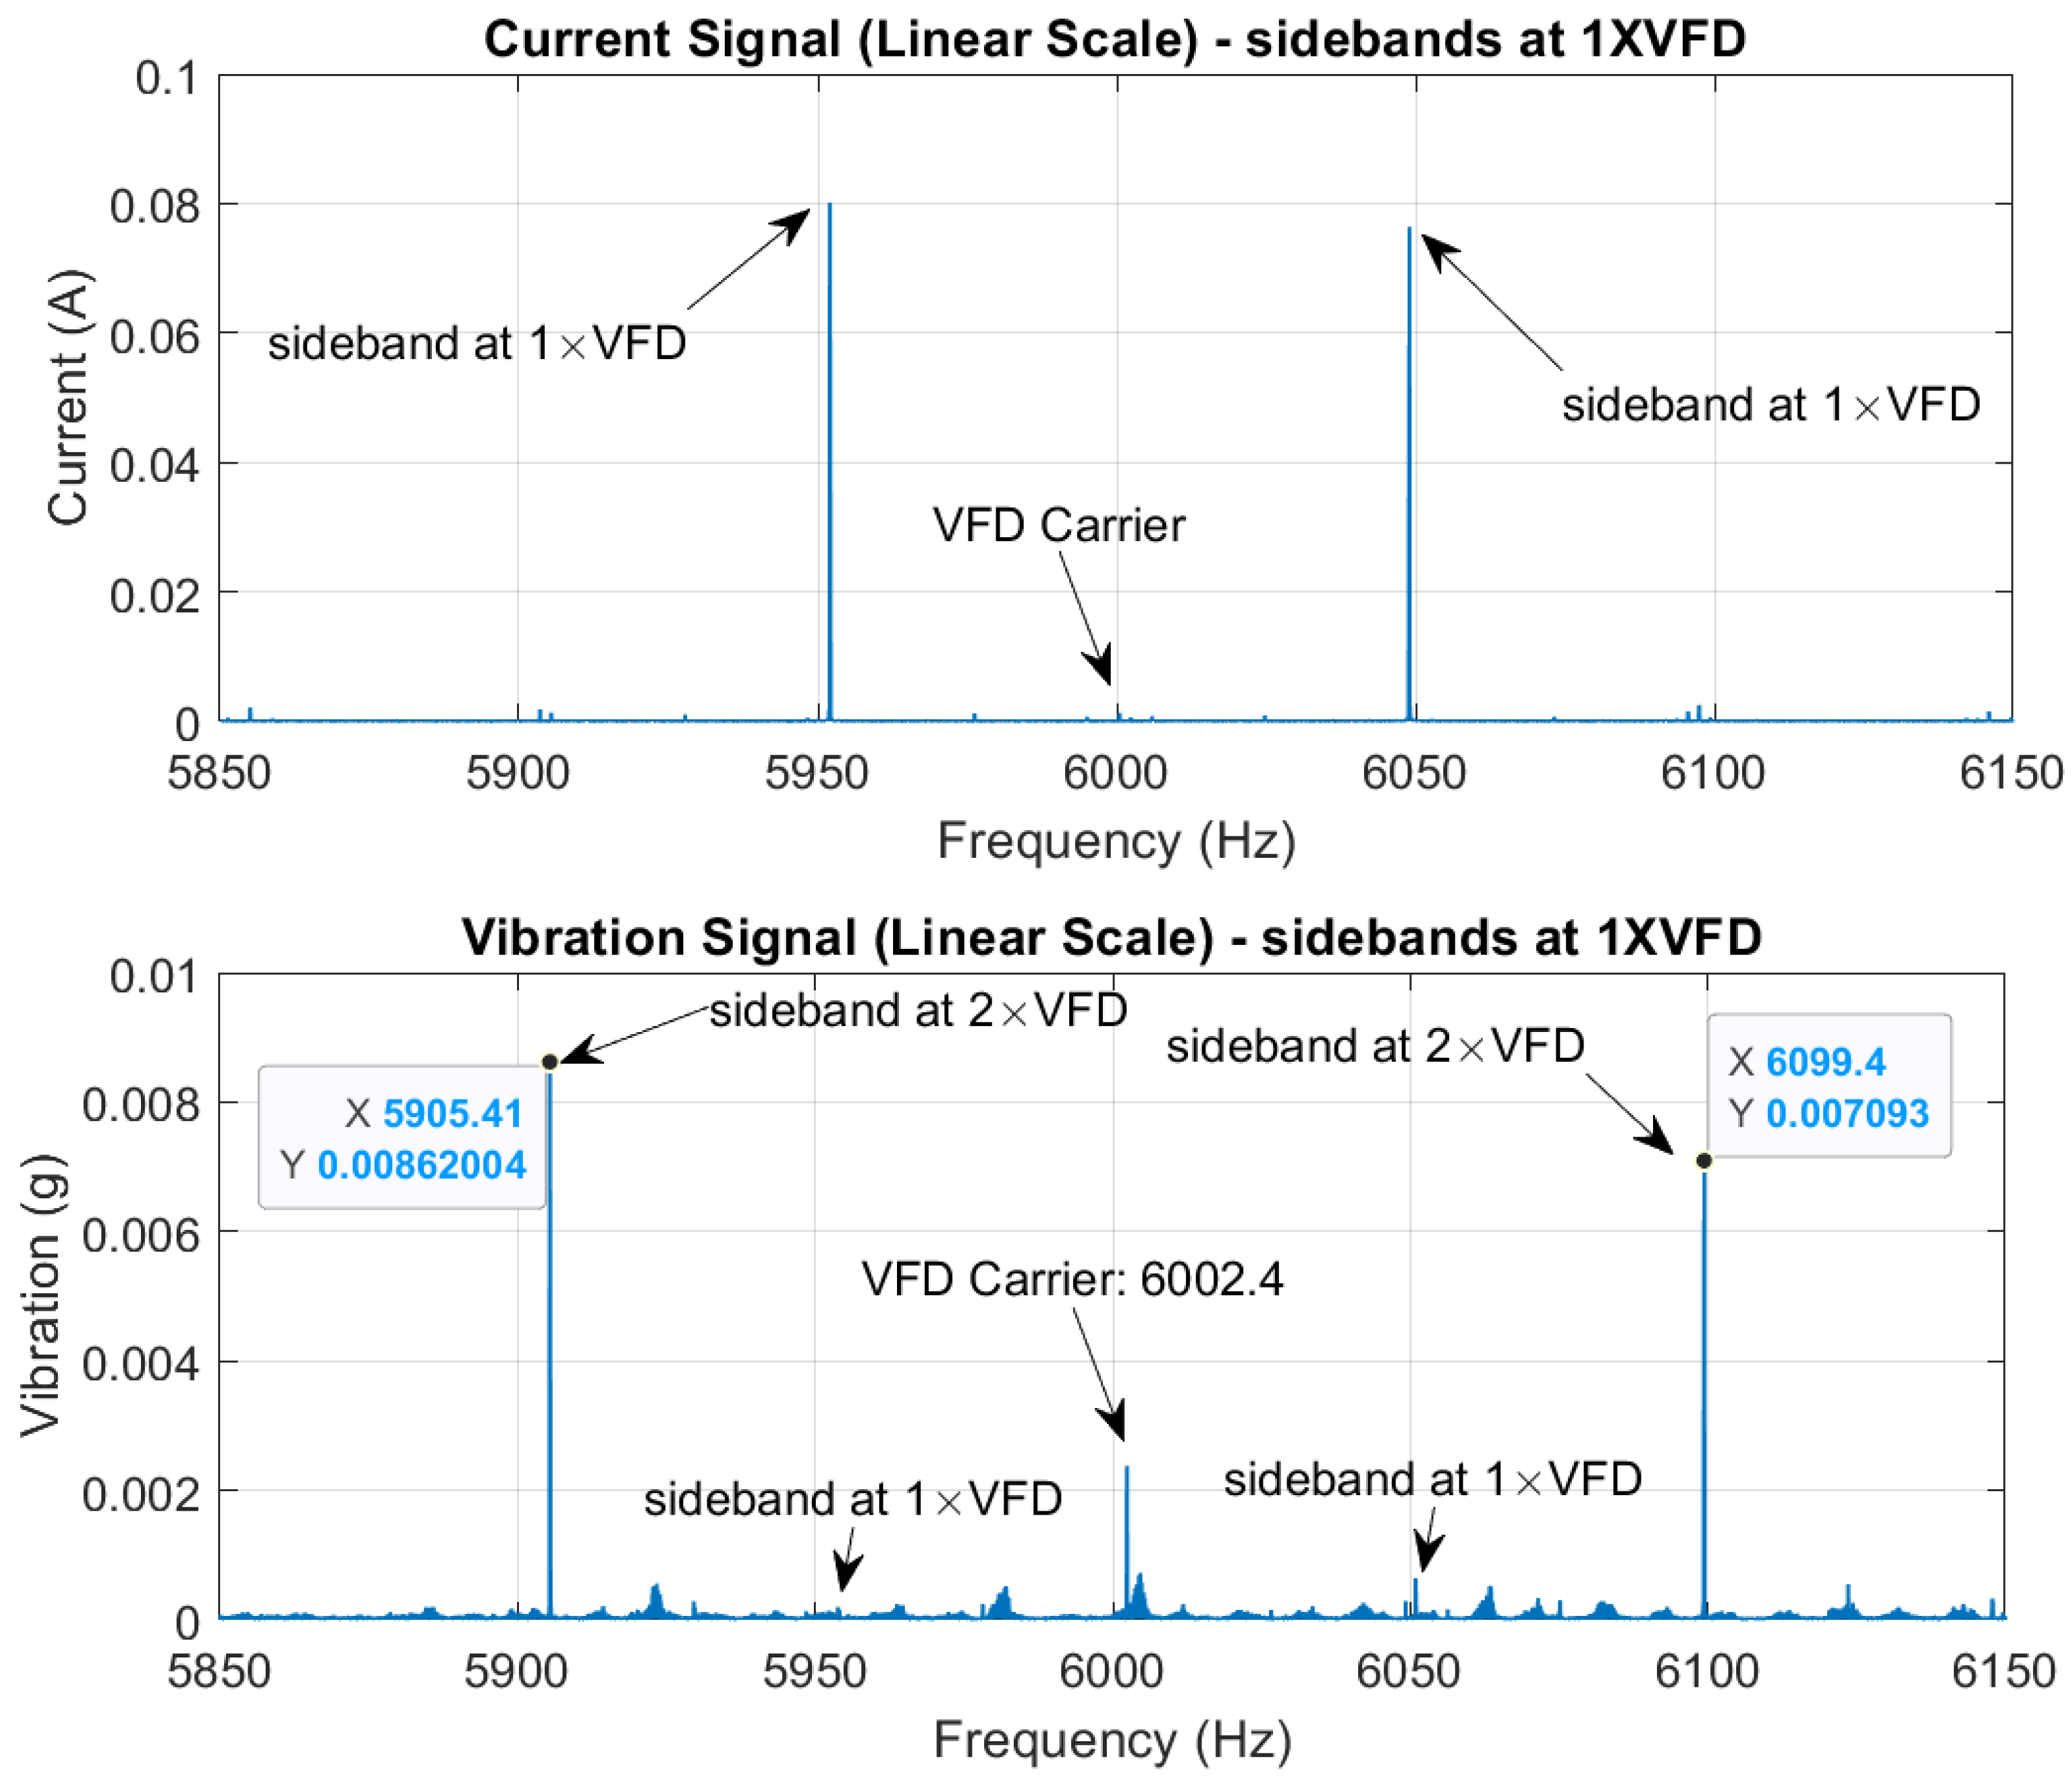
Figure 7.
Current signal shown in the time and frequency domains: (a) time domain; (b) time domain zoomed in [0.1-0.11] showing the VFD carrier frequency and voltage switching spikes; (c) frequency band A [0-50 Hz); (d) first-order VFD sidebands around the carrier frequency: band B [5950 Hz-6002.4Hz ] and band C [6002.4 Hz -6050 Hz].
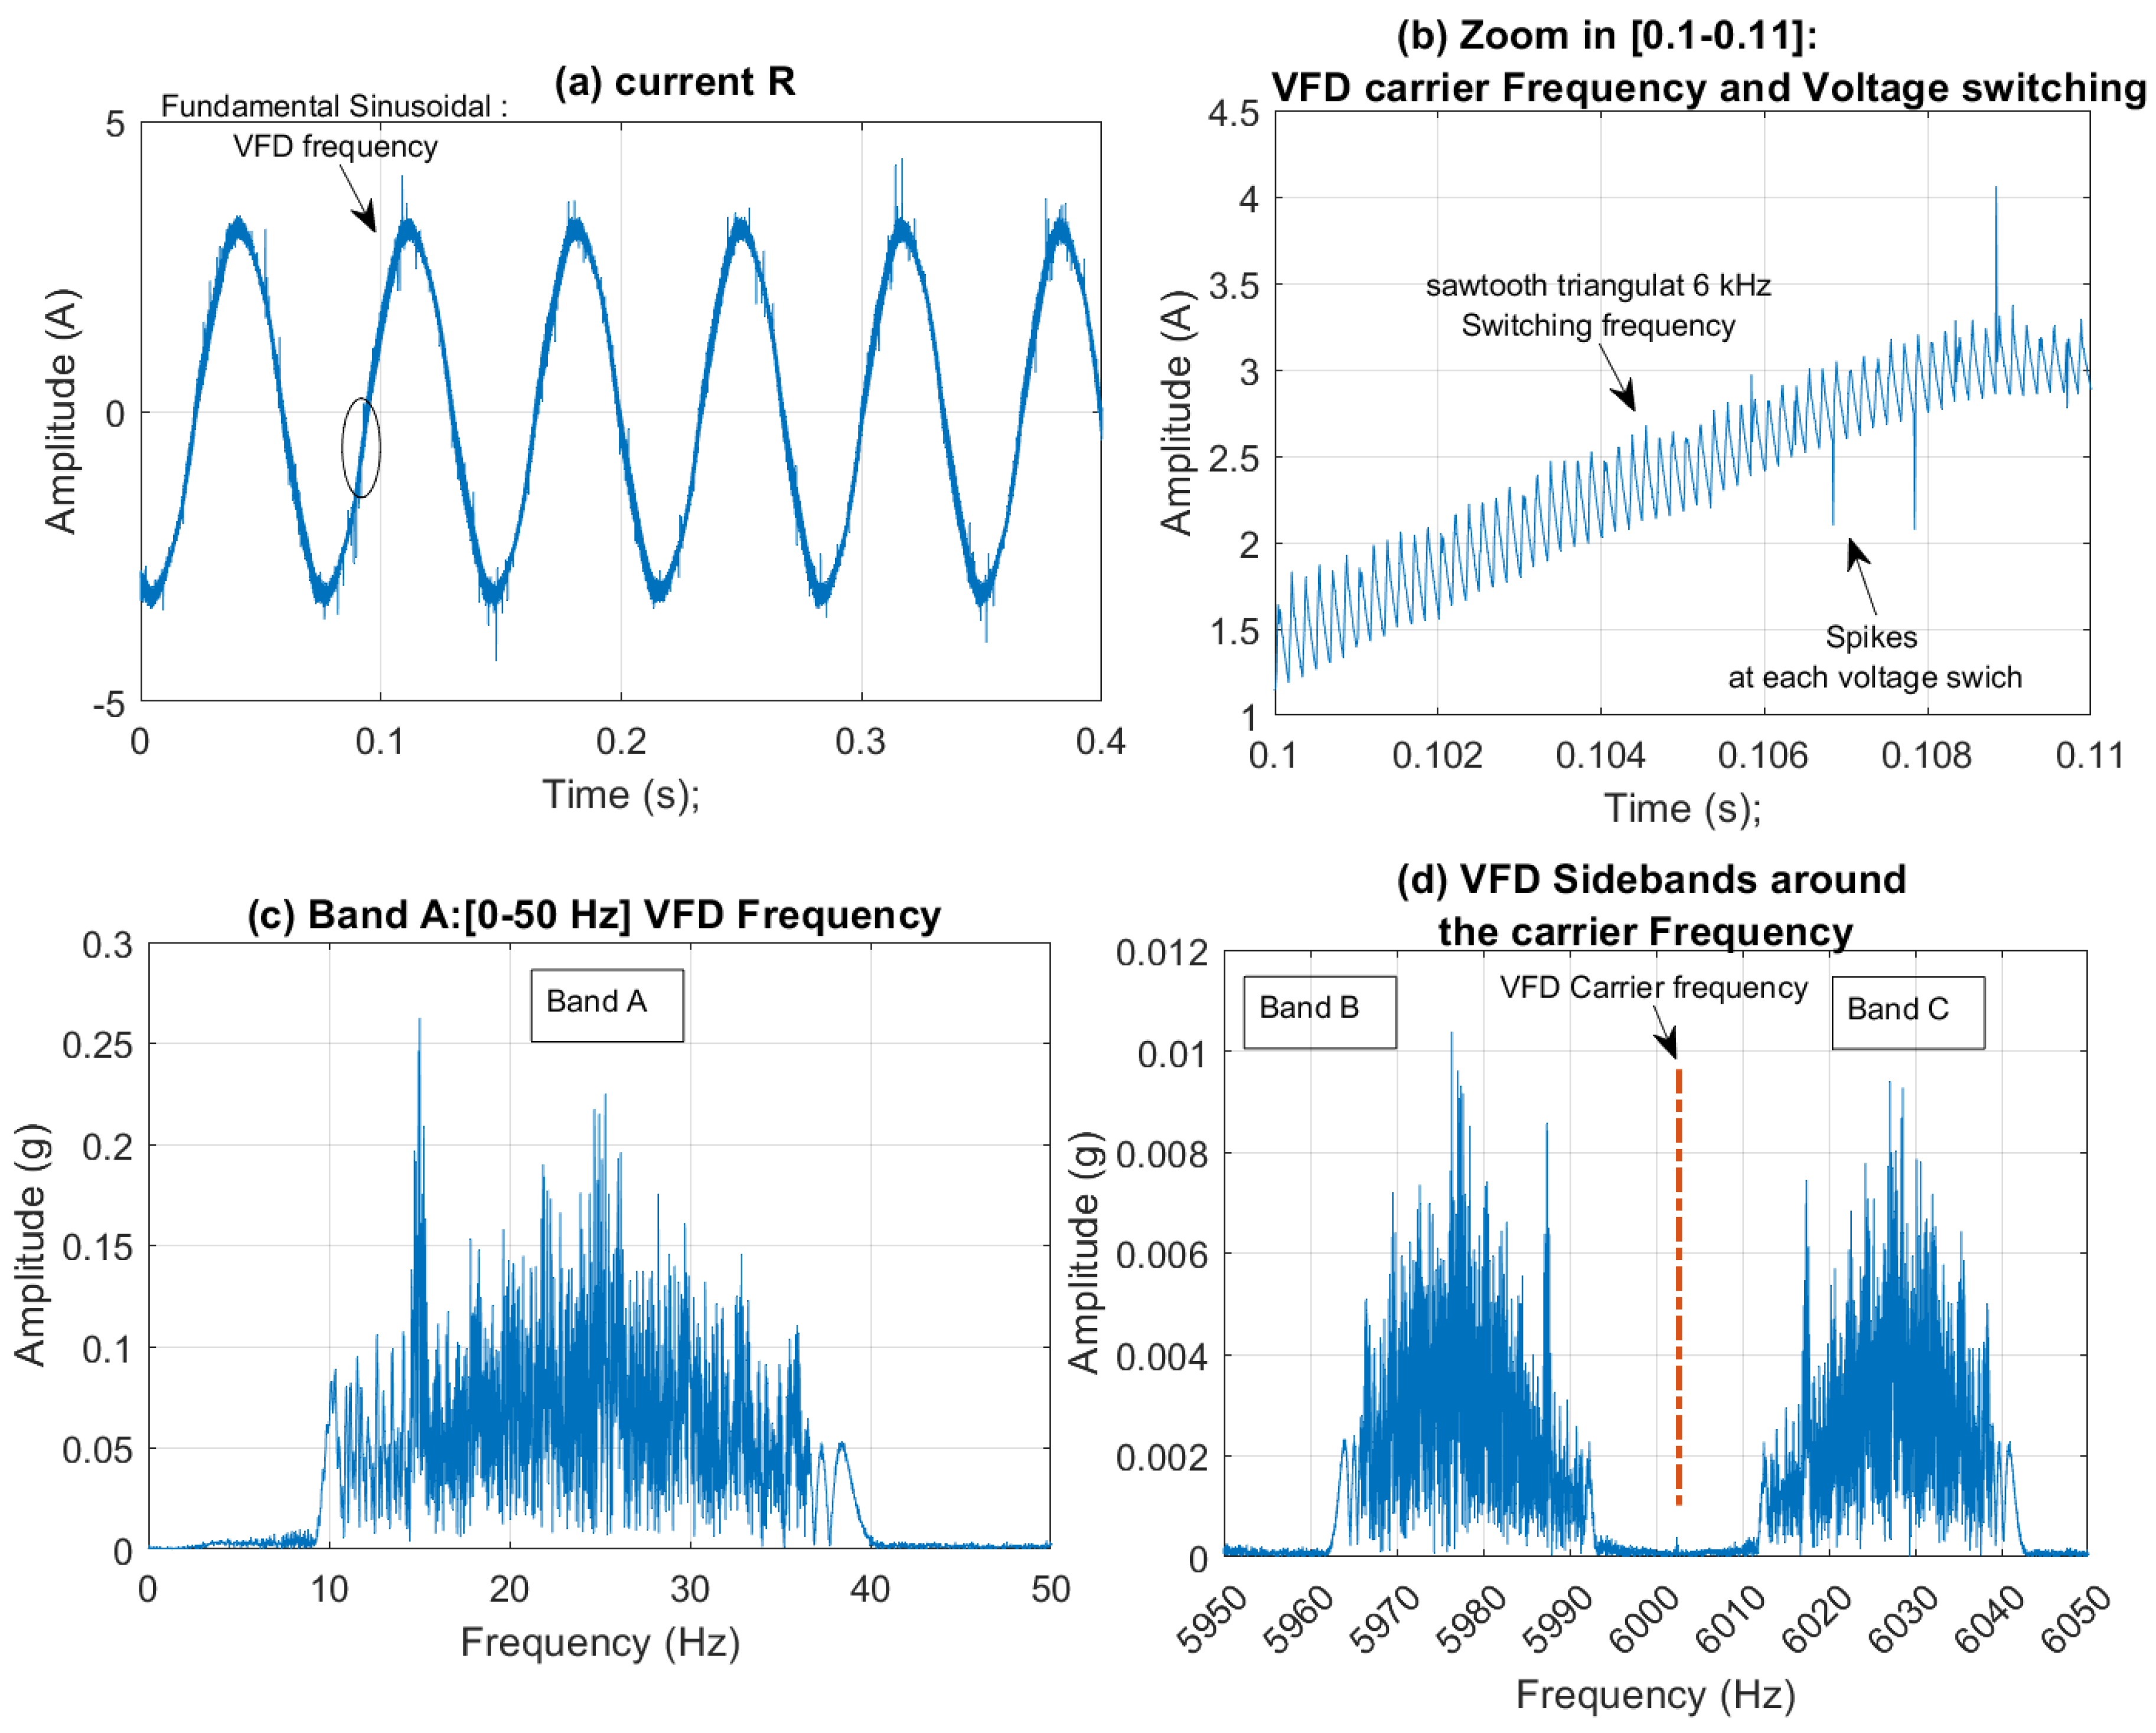
Figure 8.
Pseudo tachometer extraction and rpm profile scaling and smoothing.
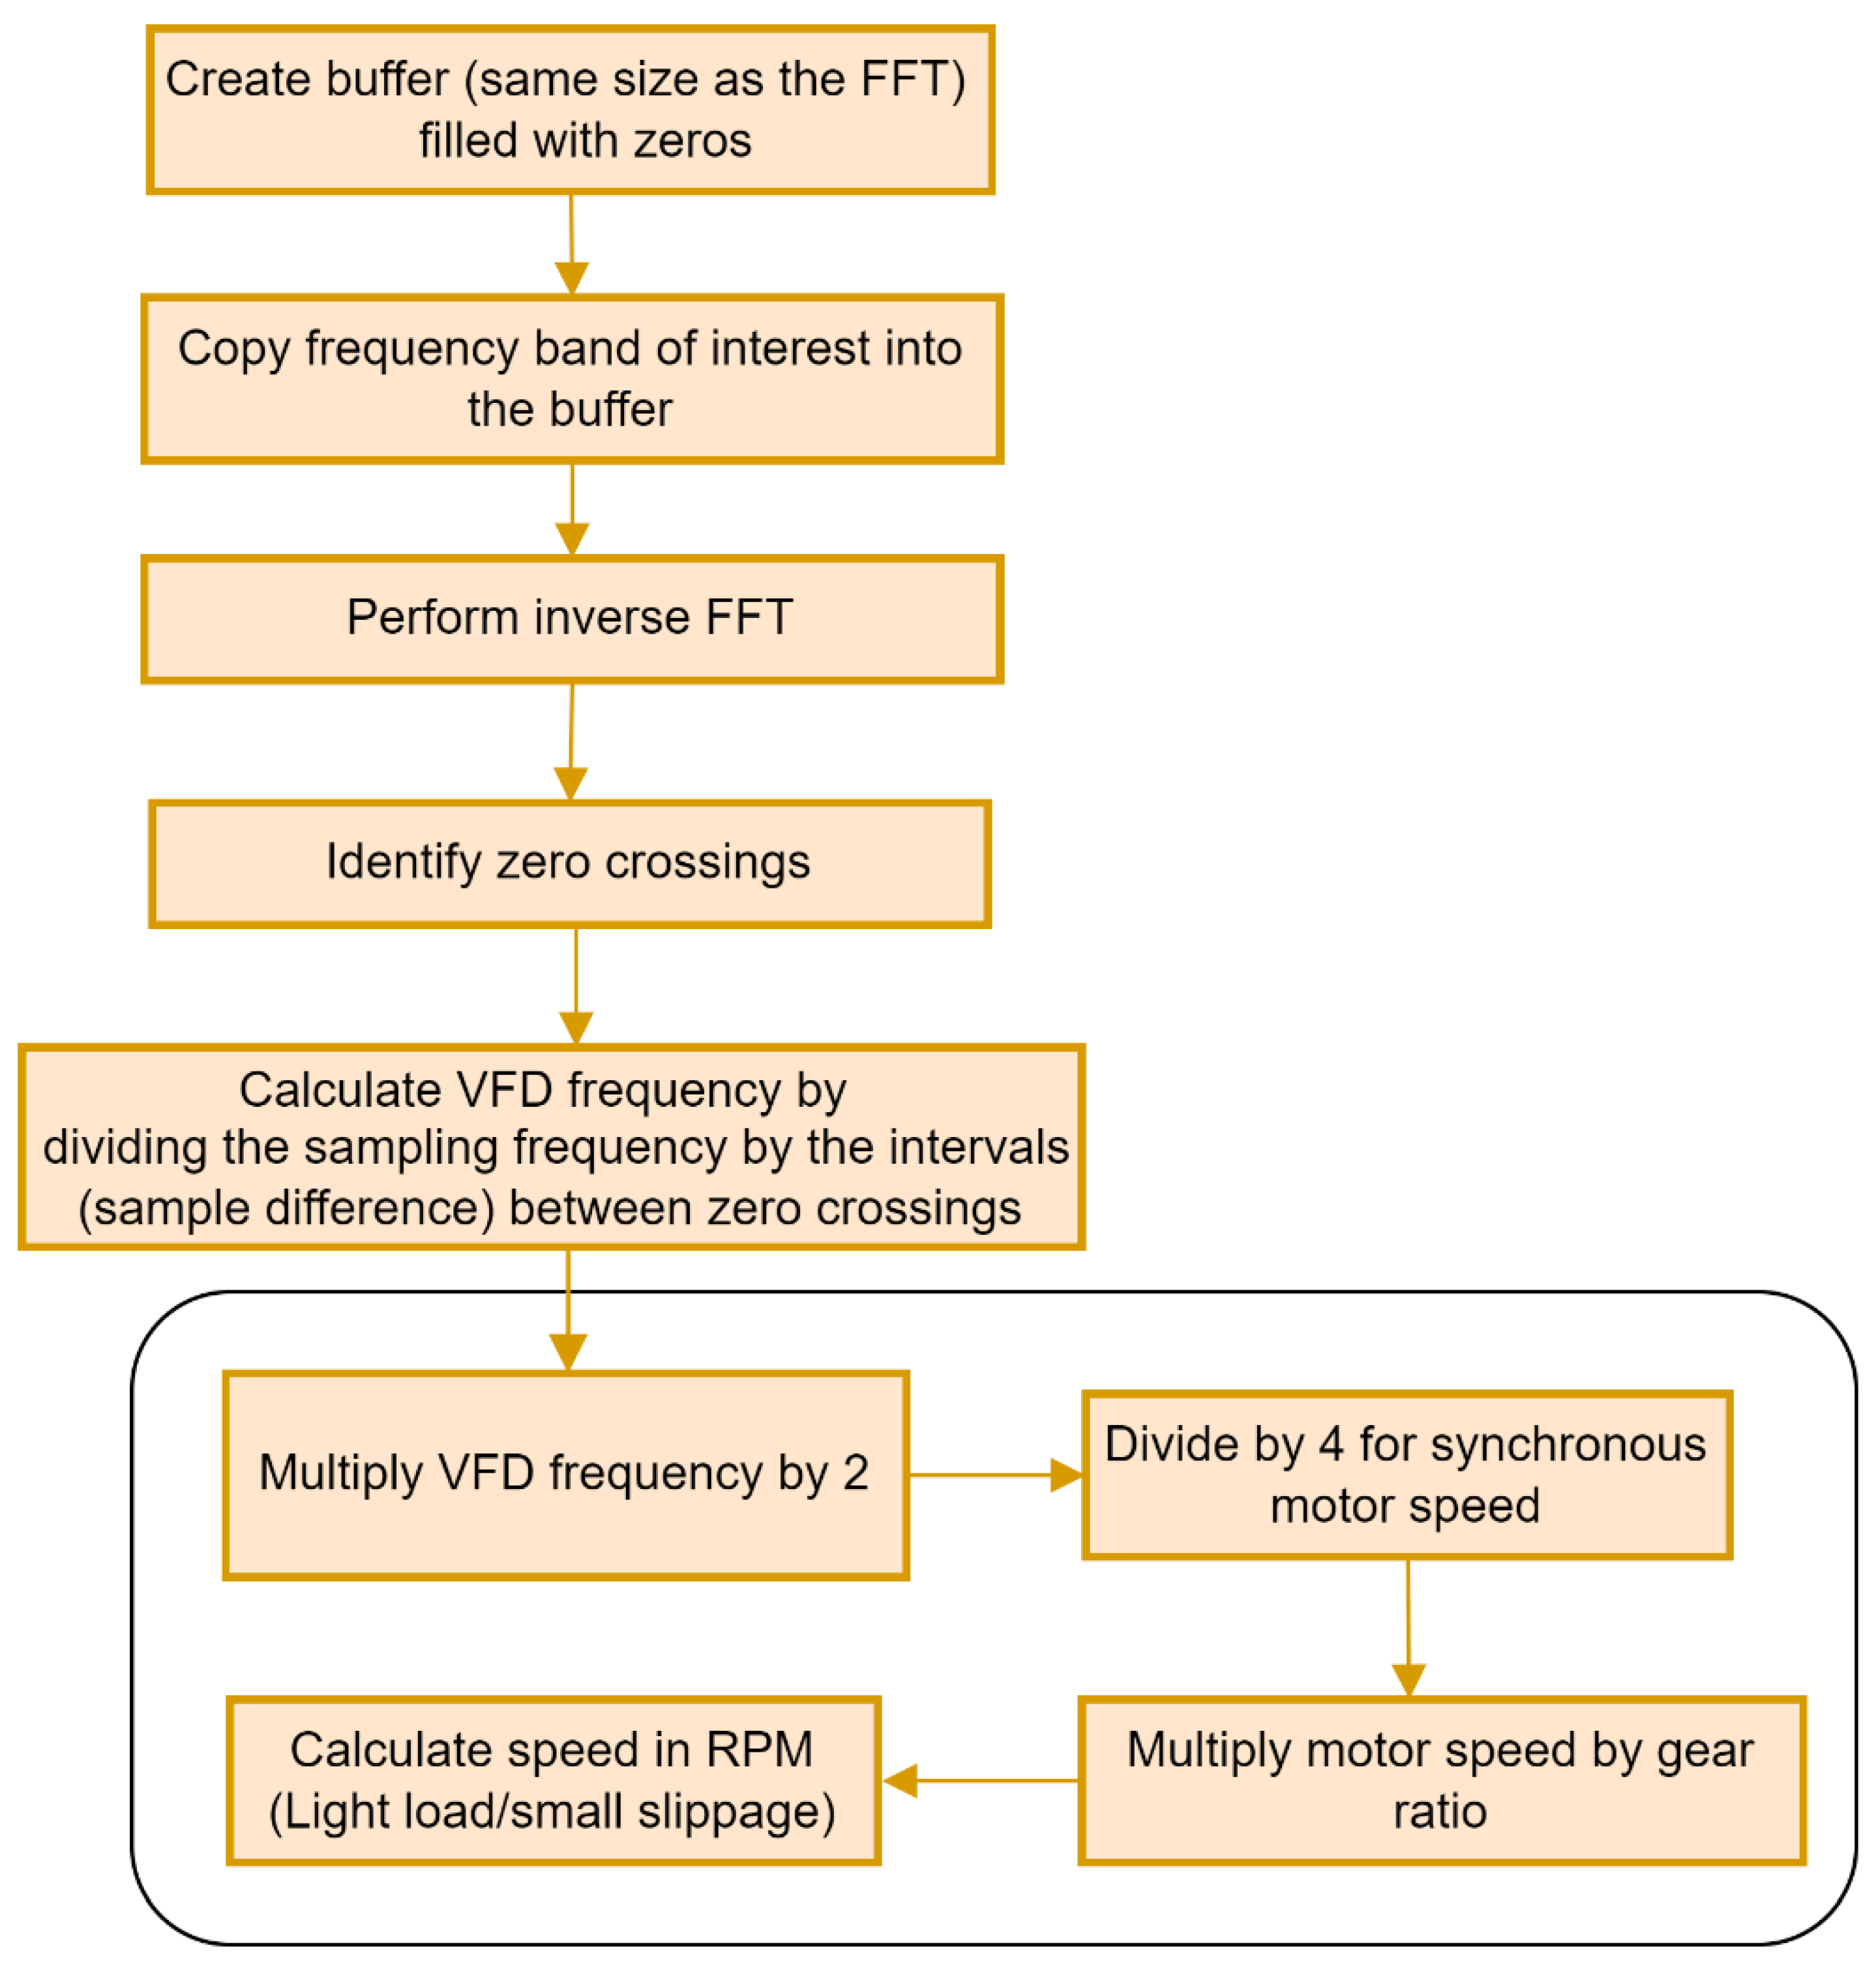
Figure 9.
HSS Speed-profile comparison: (a) actual rpm; (b) extracted rpm from VFD frequency Band A; (c) extracted rpm from VFD carrier lower sideband Band B; (d) extracted rpm from VFD carrier upper sideband Band C.
Figure 9.
HSS Speed-profile comparison: (a) actual rpm; (b) extracted rpm from VFD frequency Band A; (c) extracted rpm from VFD carrier lower sideband Band B; (d) extracted rpm from VFD carrier upper sideband Band C.
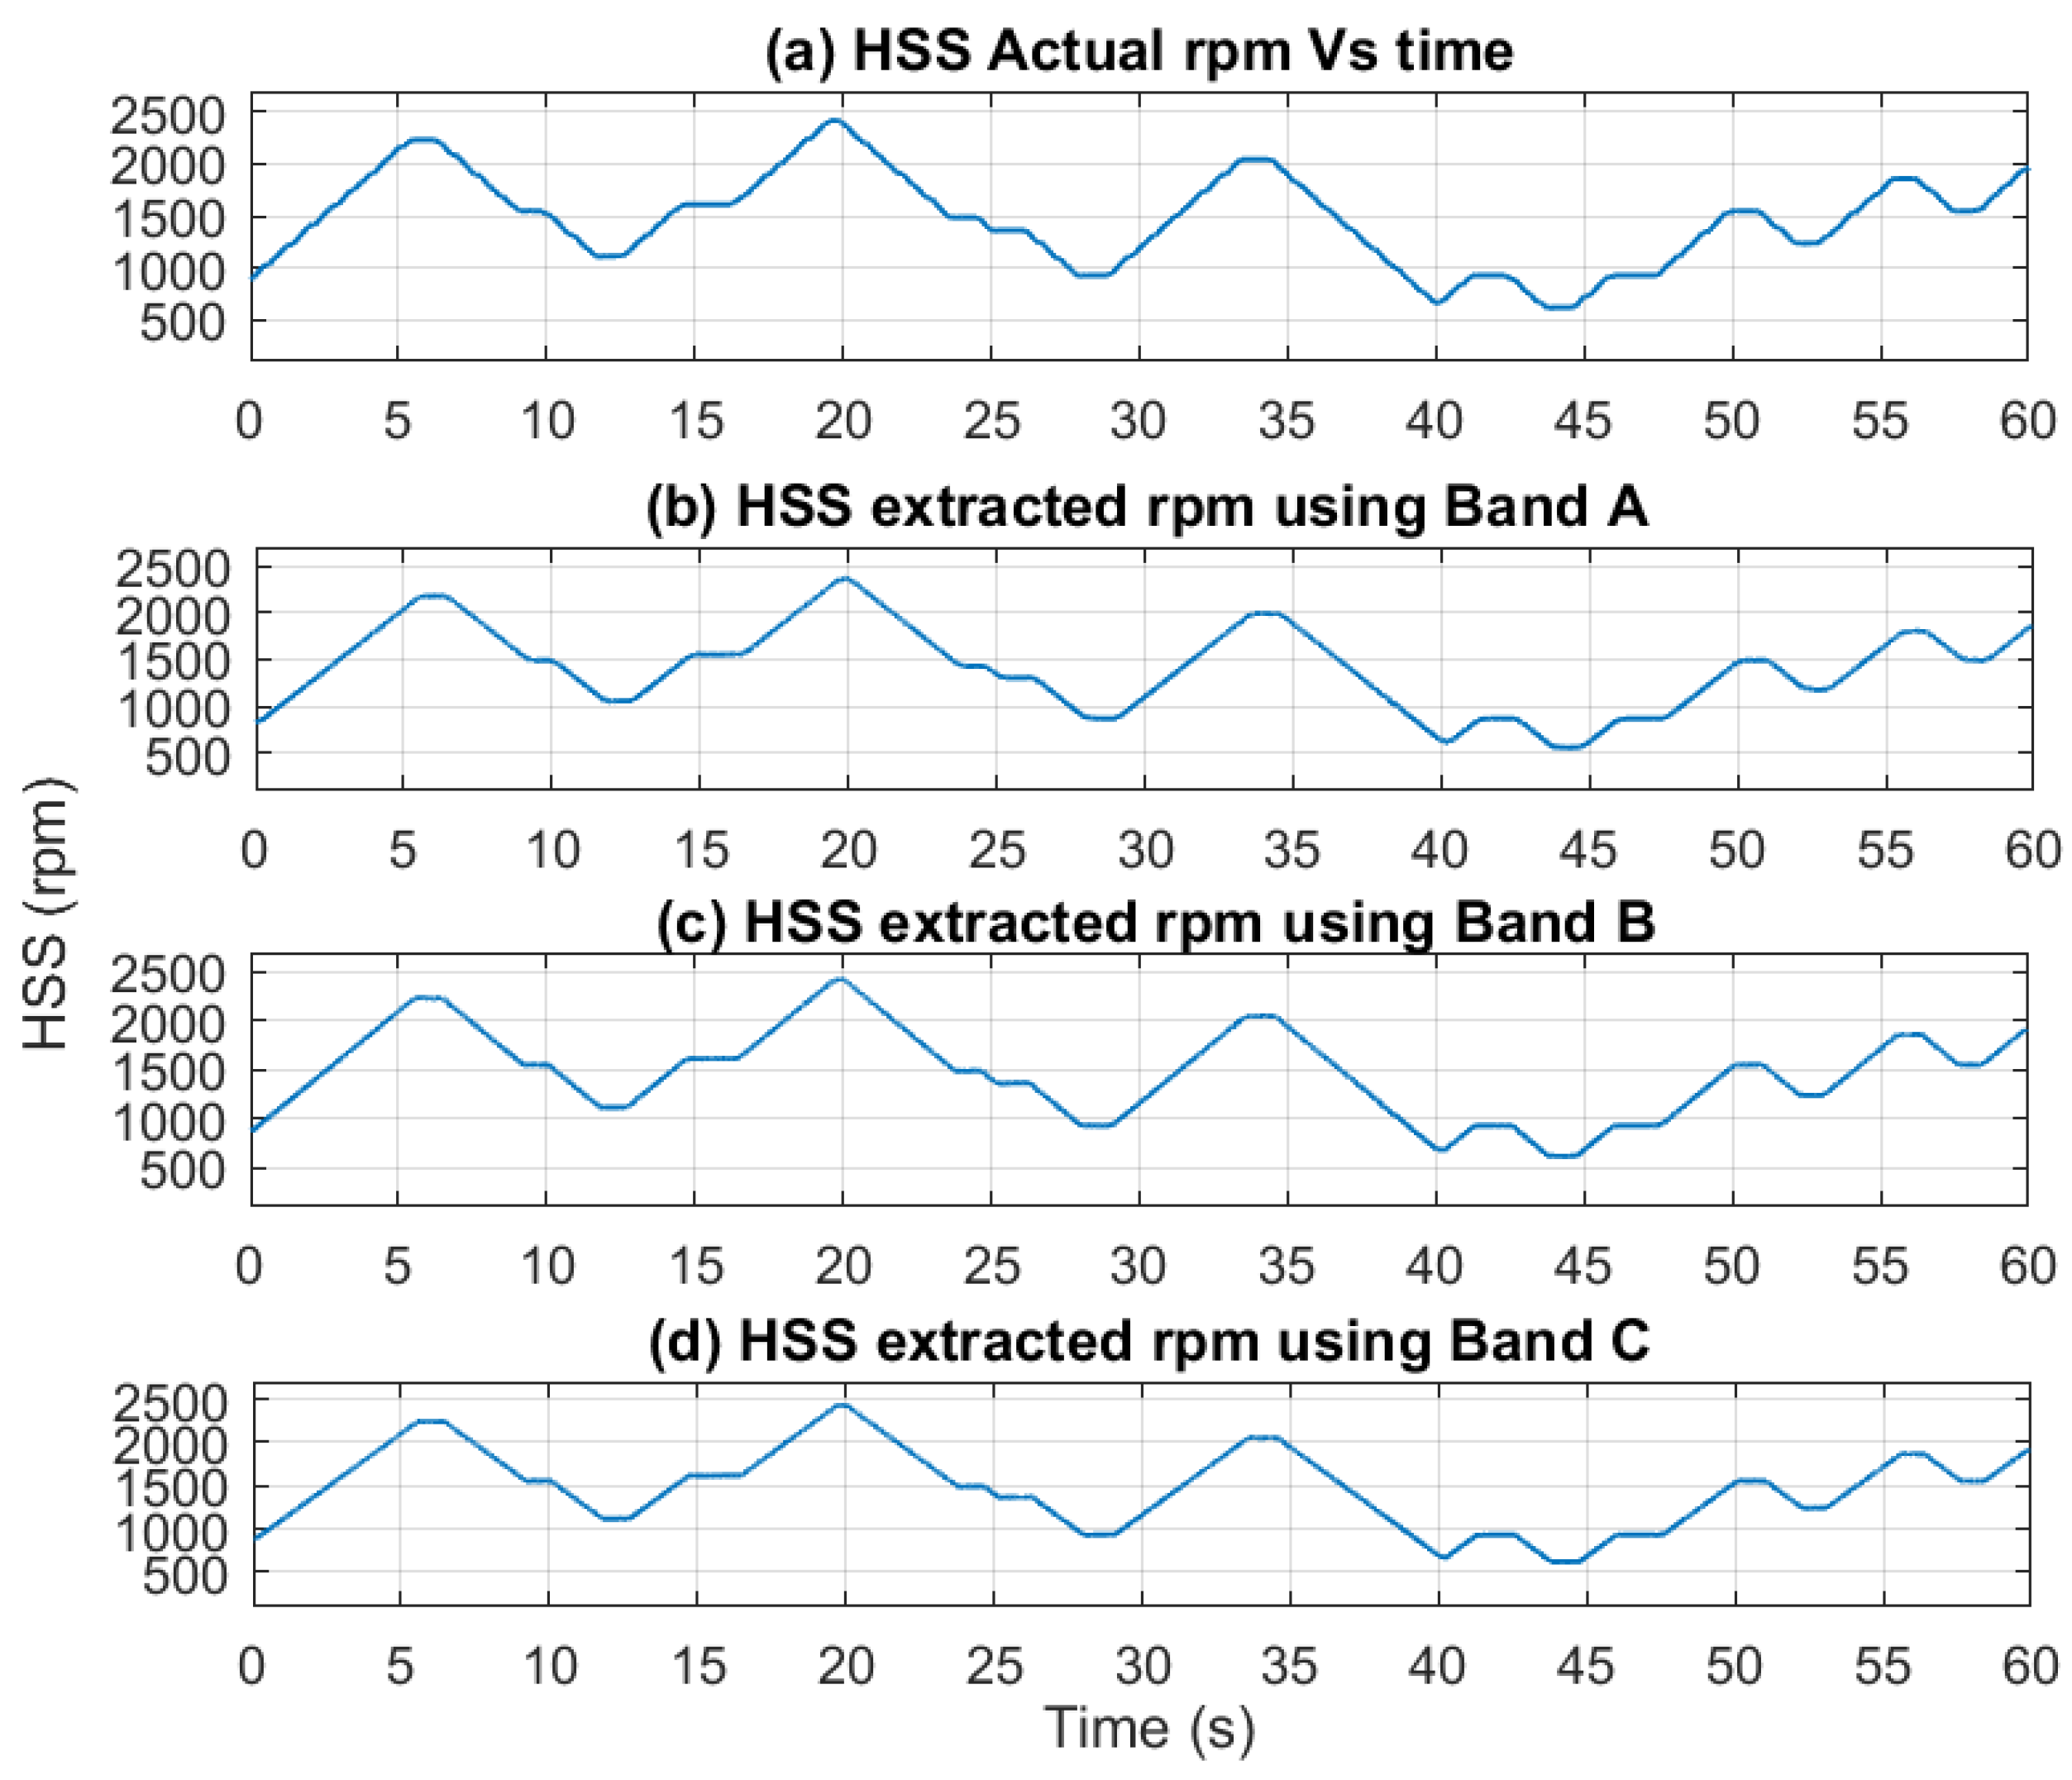
Figure 10.
(a) Current time-frequency spectrogram [2-100 Hz]; (b) HSS extracted rpm profile using Band A without median filter smoothing.
Figure 10.
(a) Current time-frequency spectrogram [2-100 Hz]; (b) HSS extracted rpm profile using Band A without median filter smoothing.
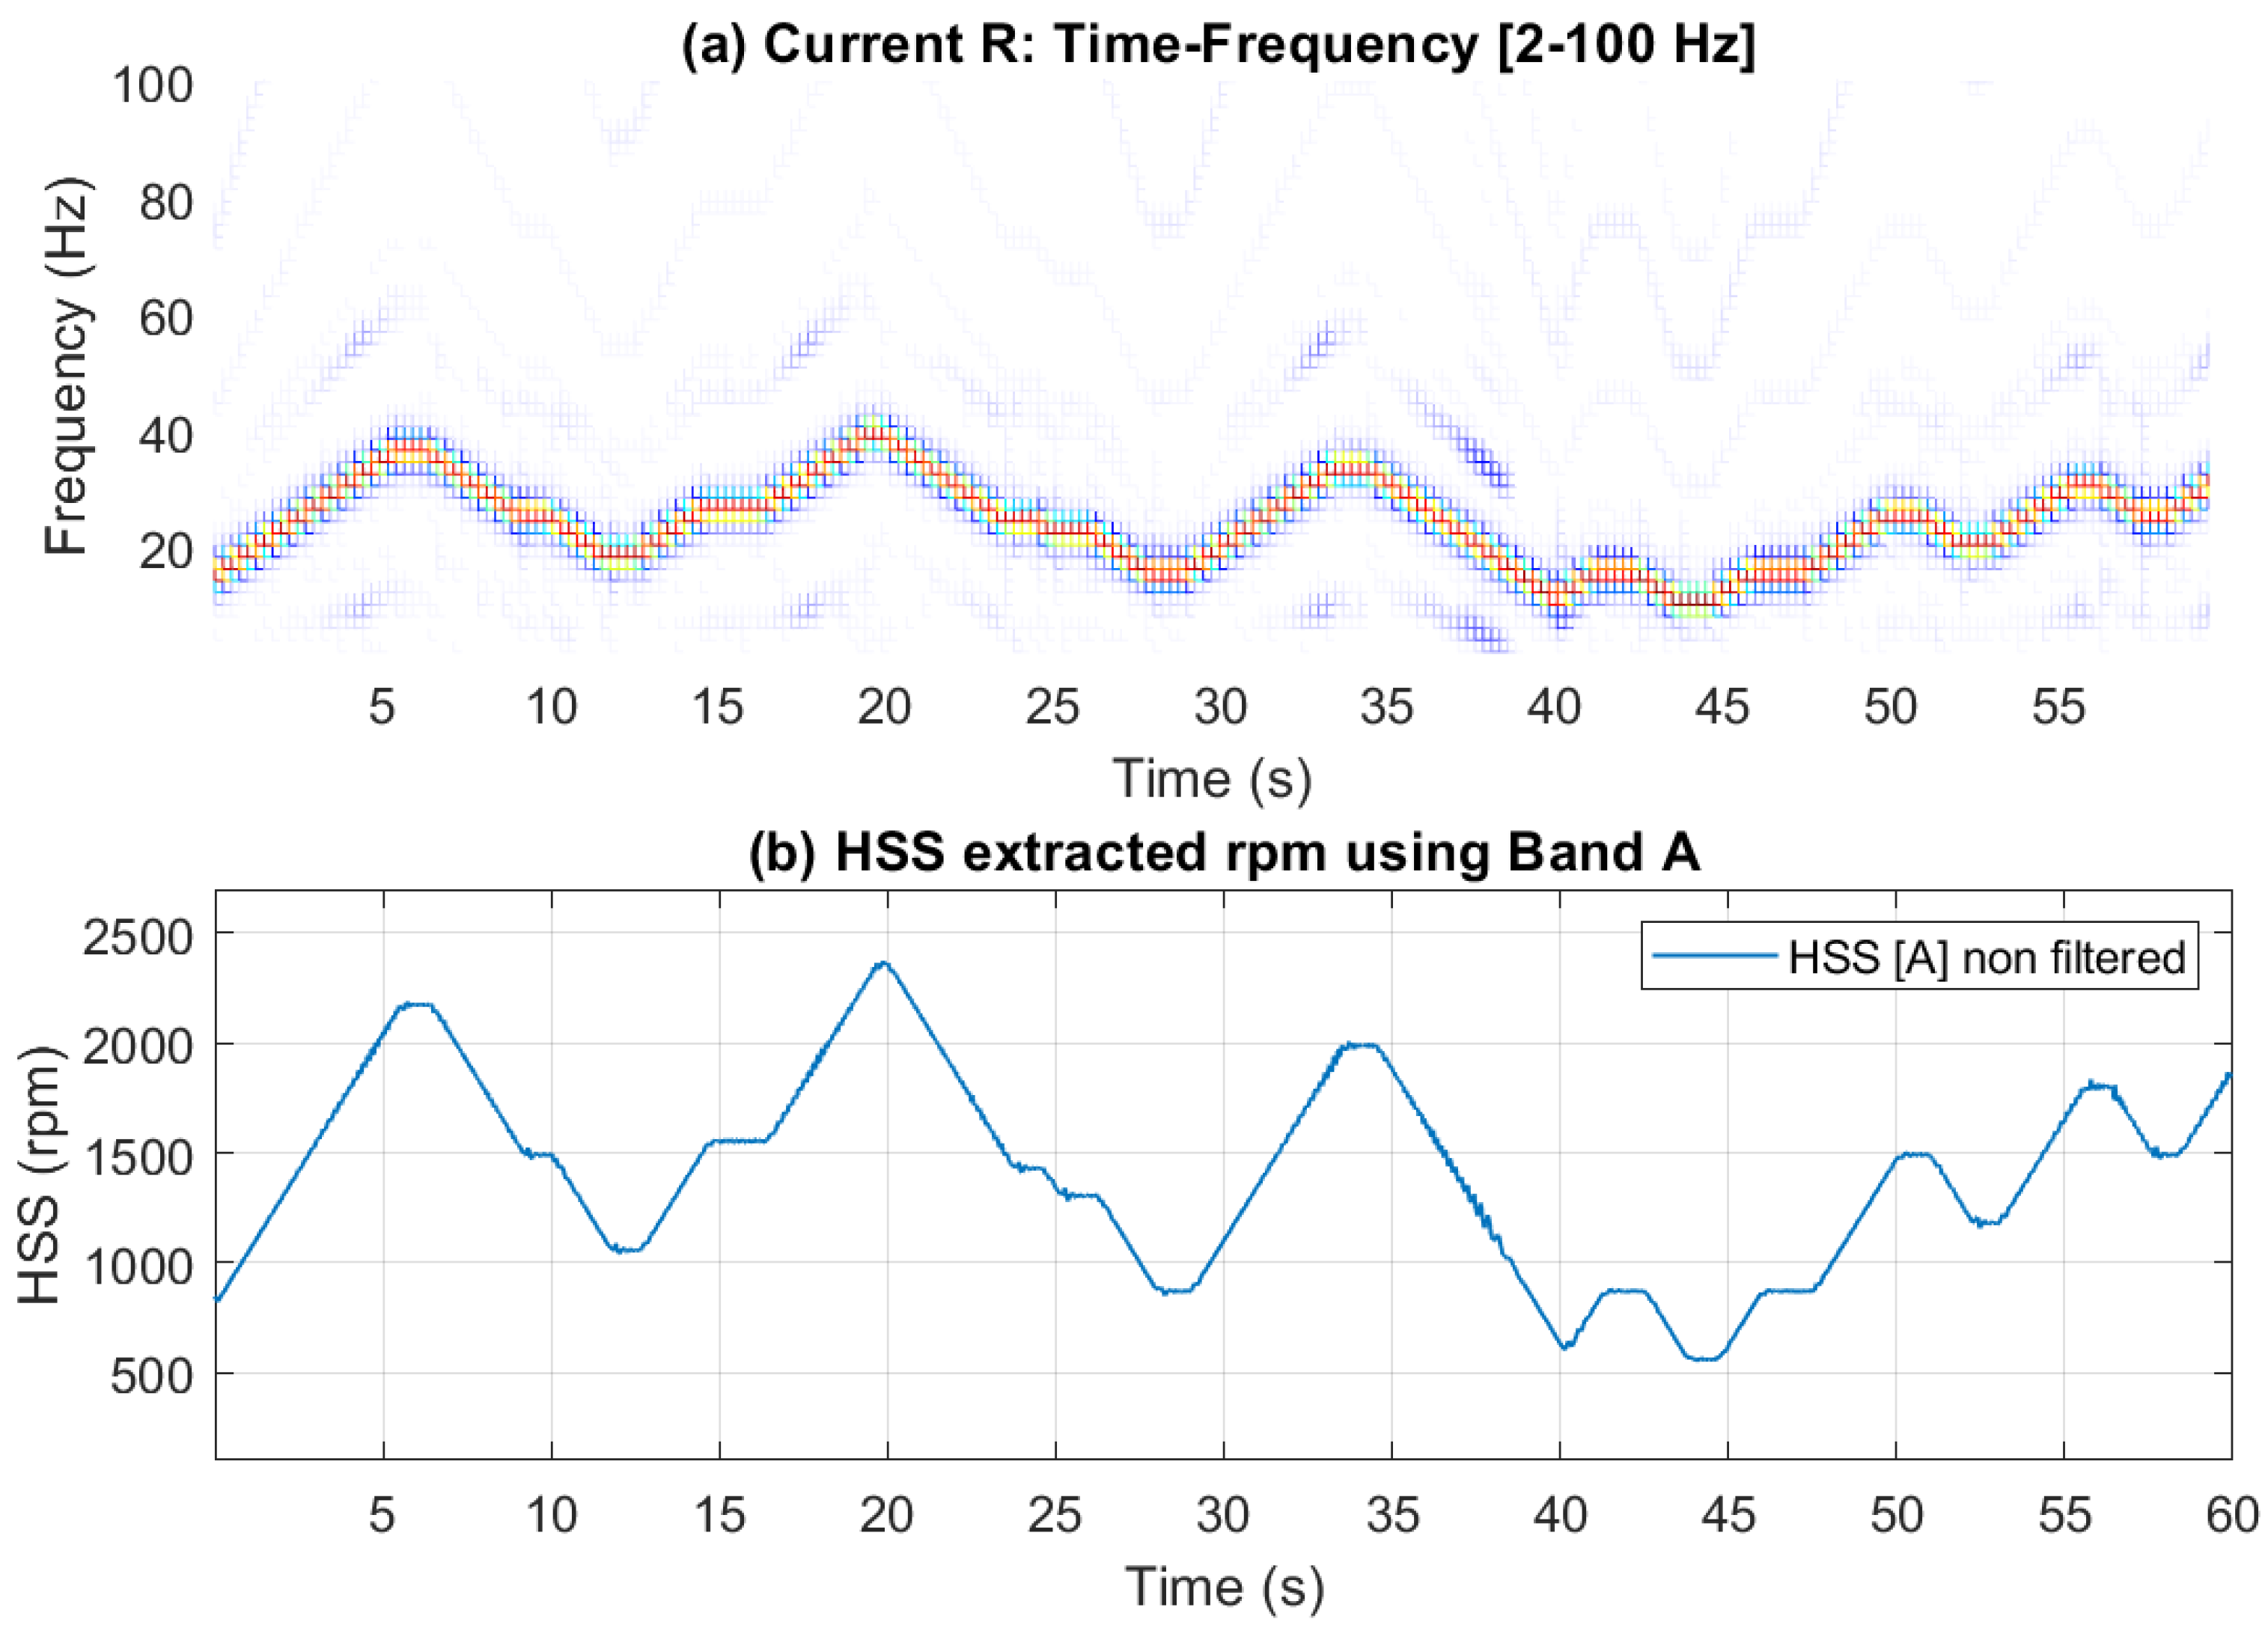
Figure 11.
(a) Current time-frequency spectrogram [5950-6050Hz]; (b) HSS extracted rpm profile using Band B without median filter smoothing; (c) HSS extracted rpm profile using Band C without median filter smoothing.
Figure 11.
(a) Current time-frequency spectrogram [5950-6050Hz]; (b) HSS extracted rpm profile using Band B without median filter smoothing; (c) HSS extracted rpm profile using Band C without median filter smoothing.
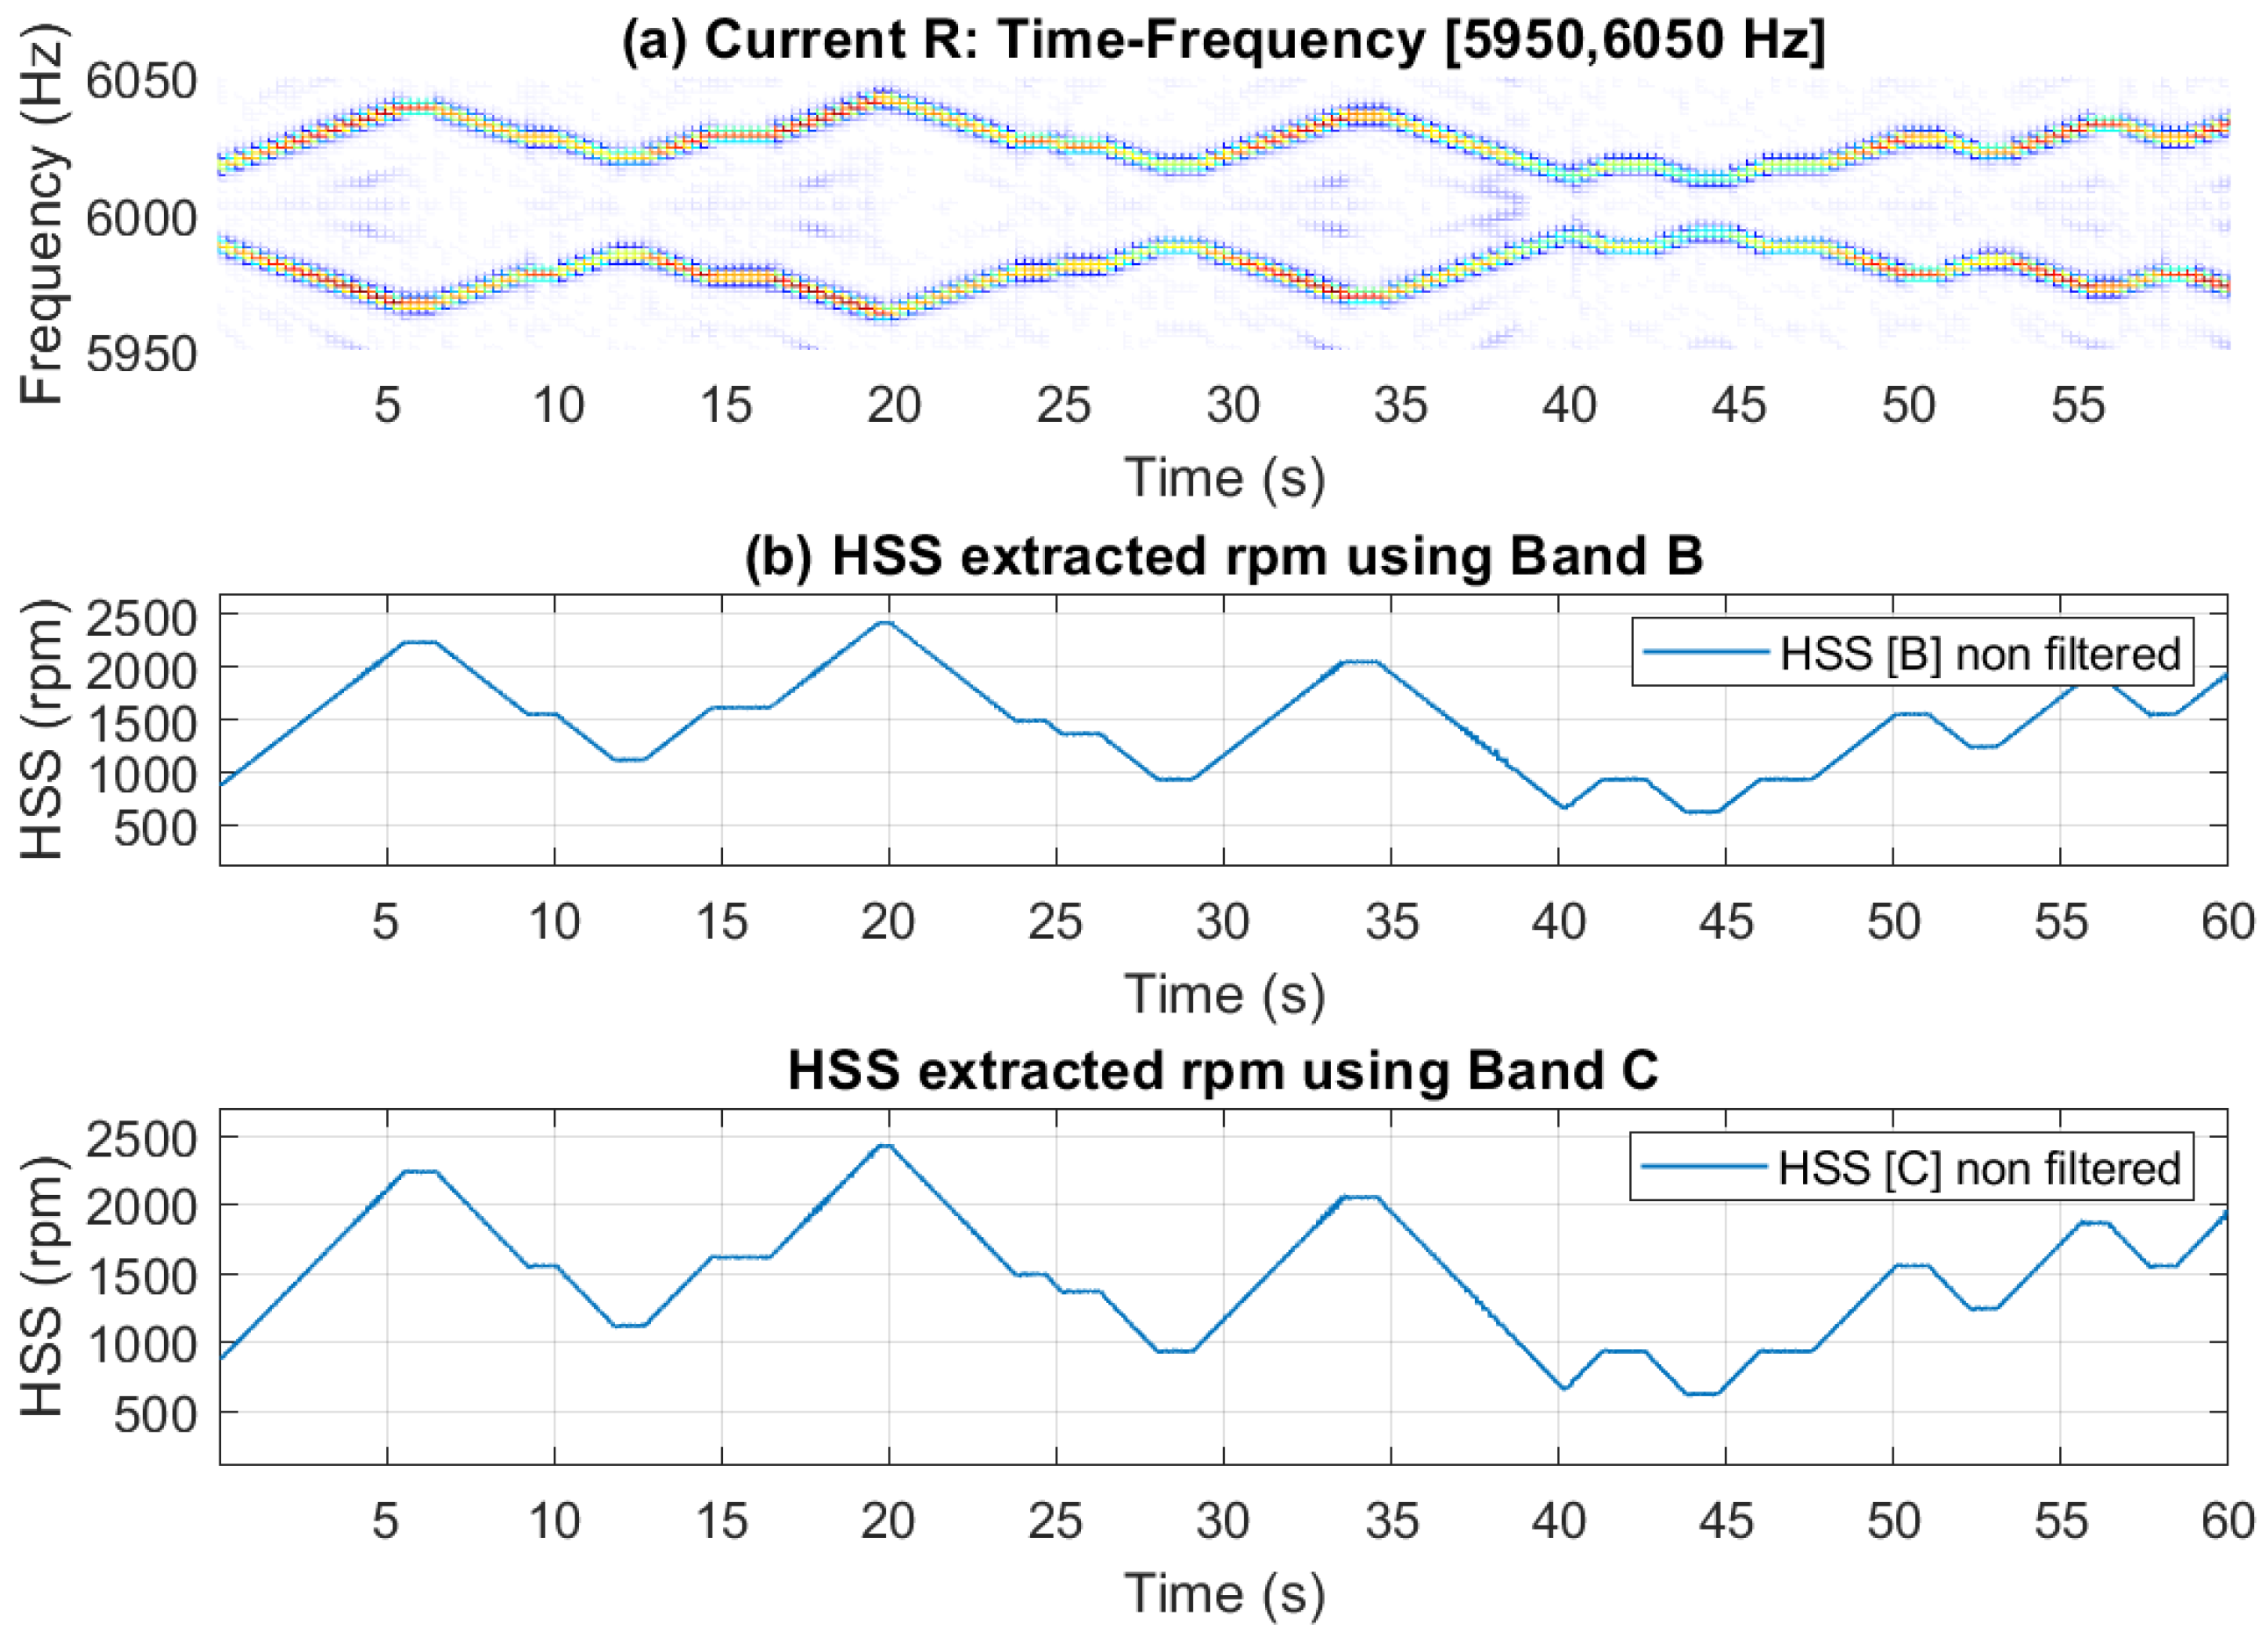
Figure 12.
(a) Bearing B vertical vibration acceleration signal; (b) Spectrogram [5 Hz- 10 kHz].
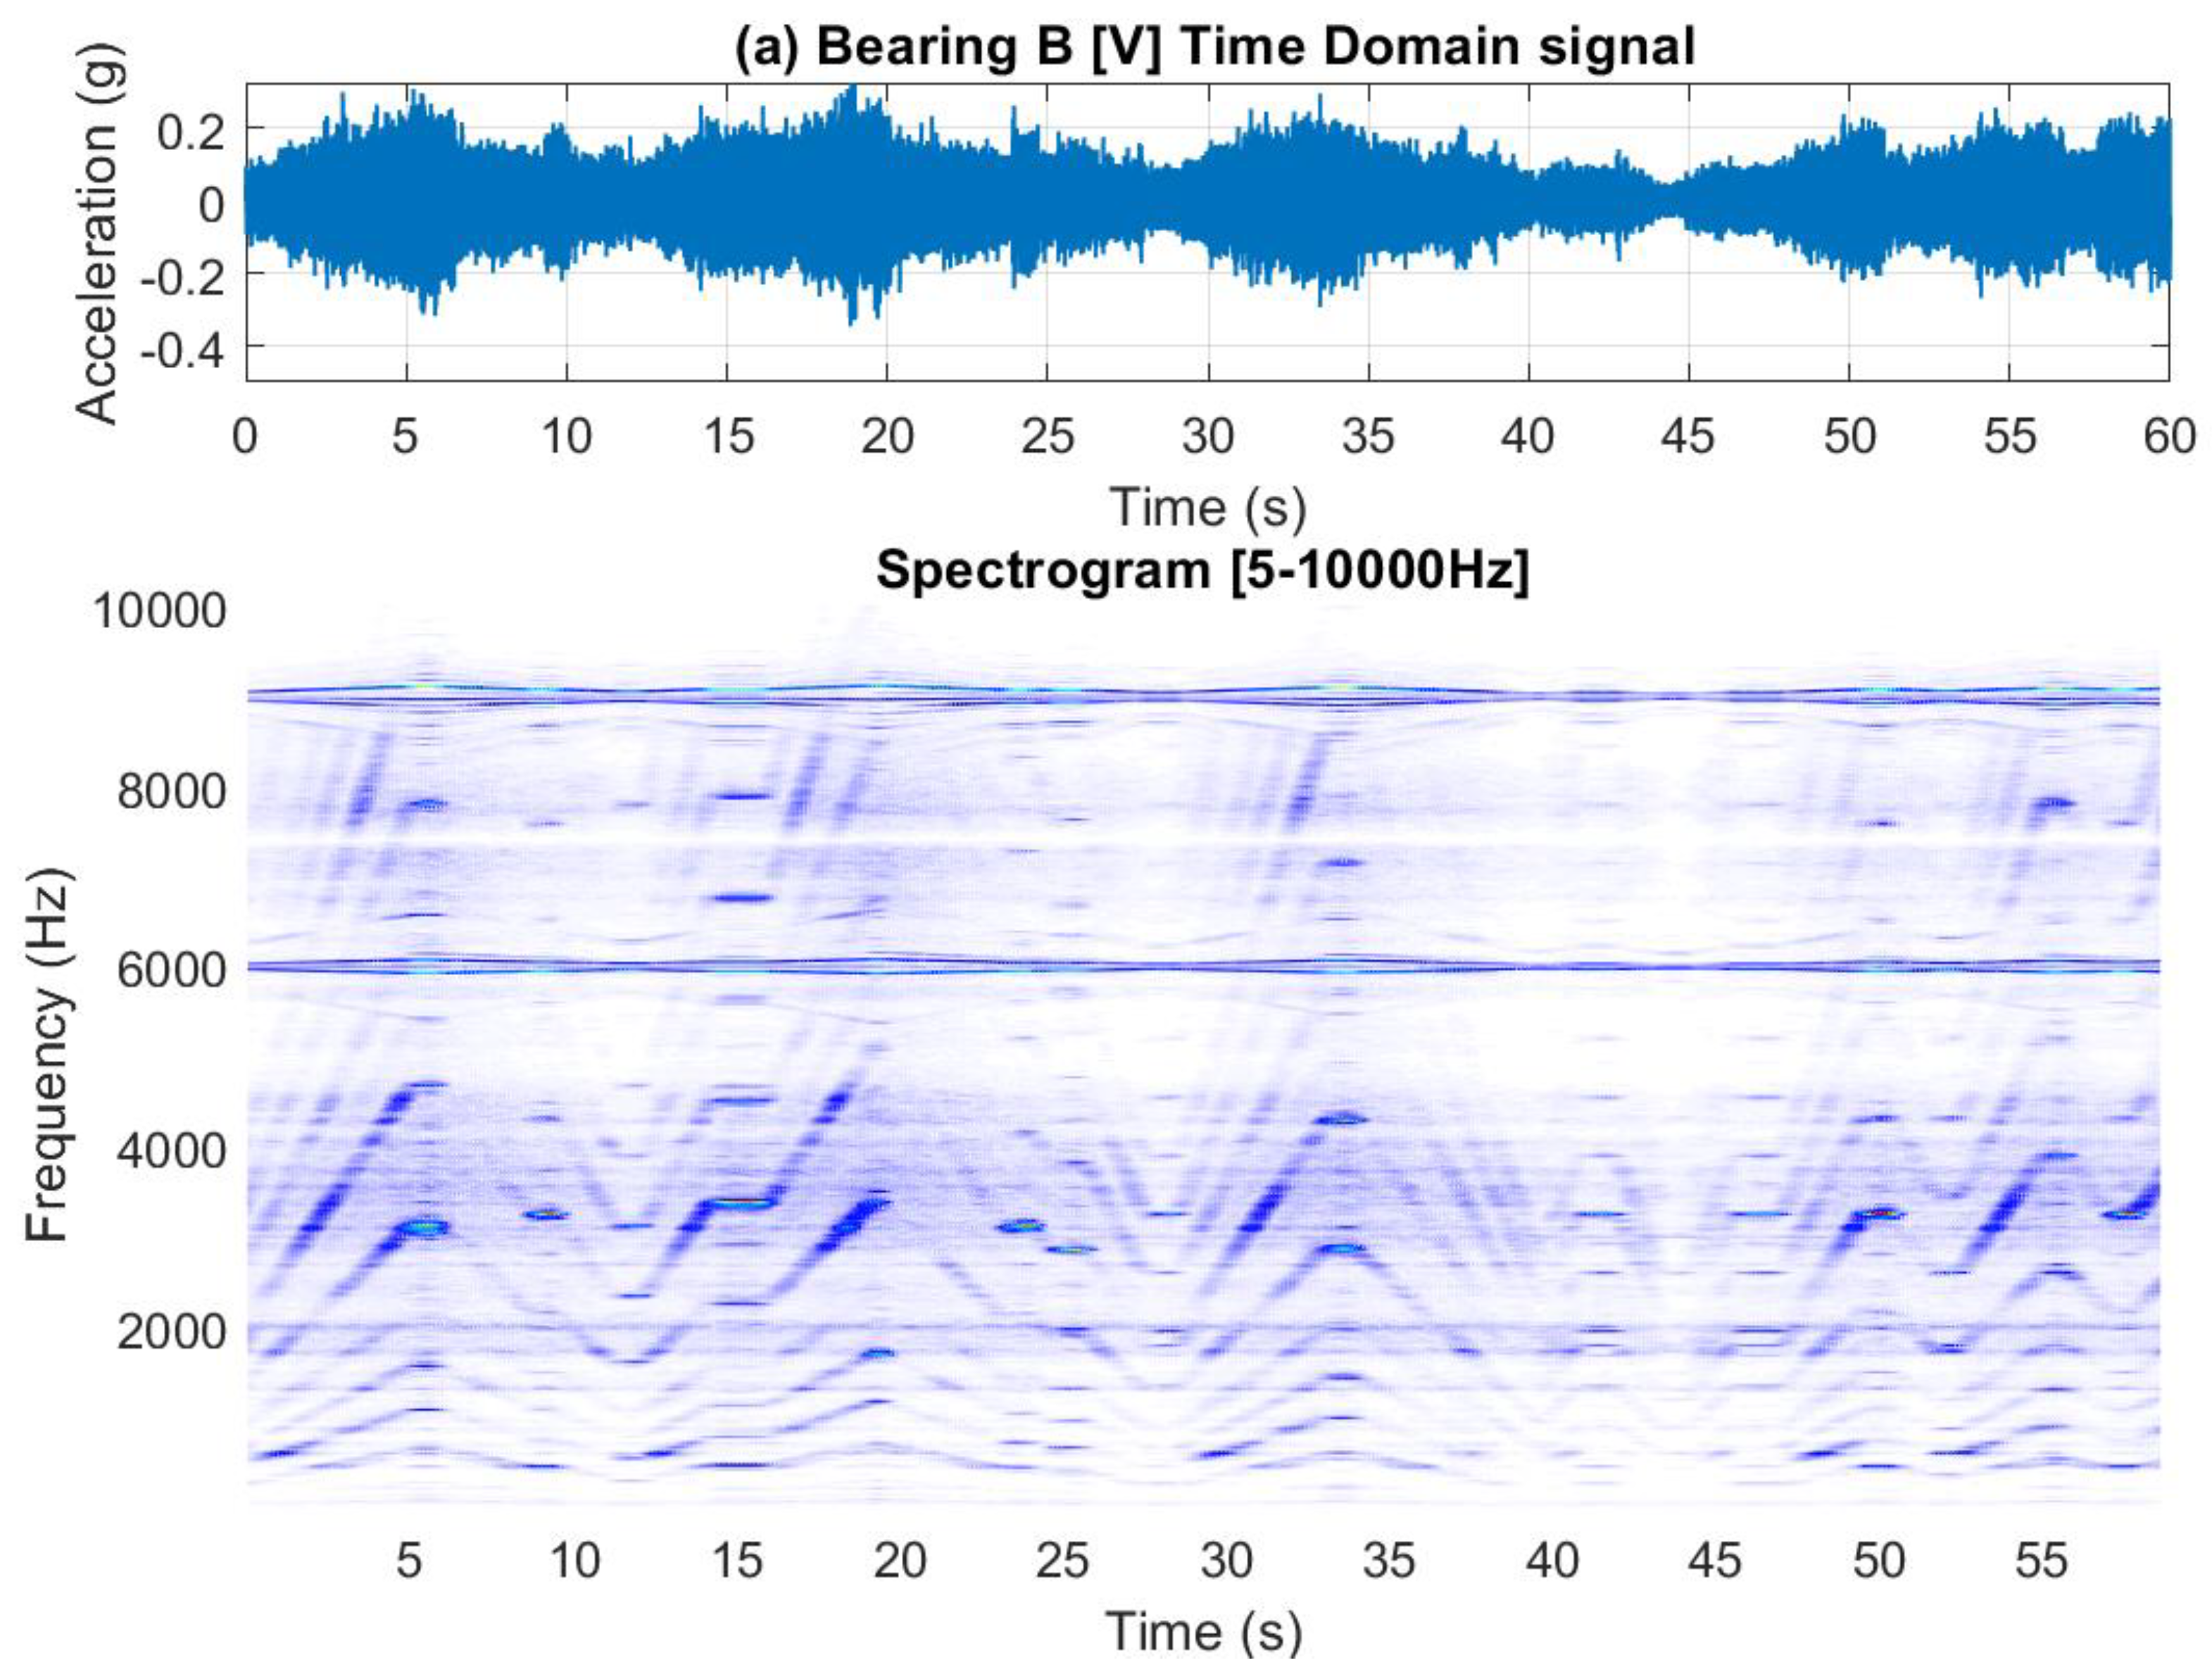
Figure 13.
(a) Bearing B vertical vibration signal; (b) one second zoom in; (c) Band A; (d) Band B and C around the VFD carrier frequency.
Figure 13.
(a) Bearing B vertical vibration signal; (b) one second zoom in; (c) Band A; (d) Band B and C around the VFD carrier frequency.
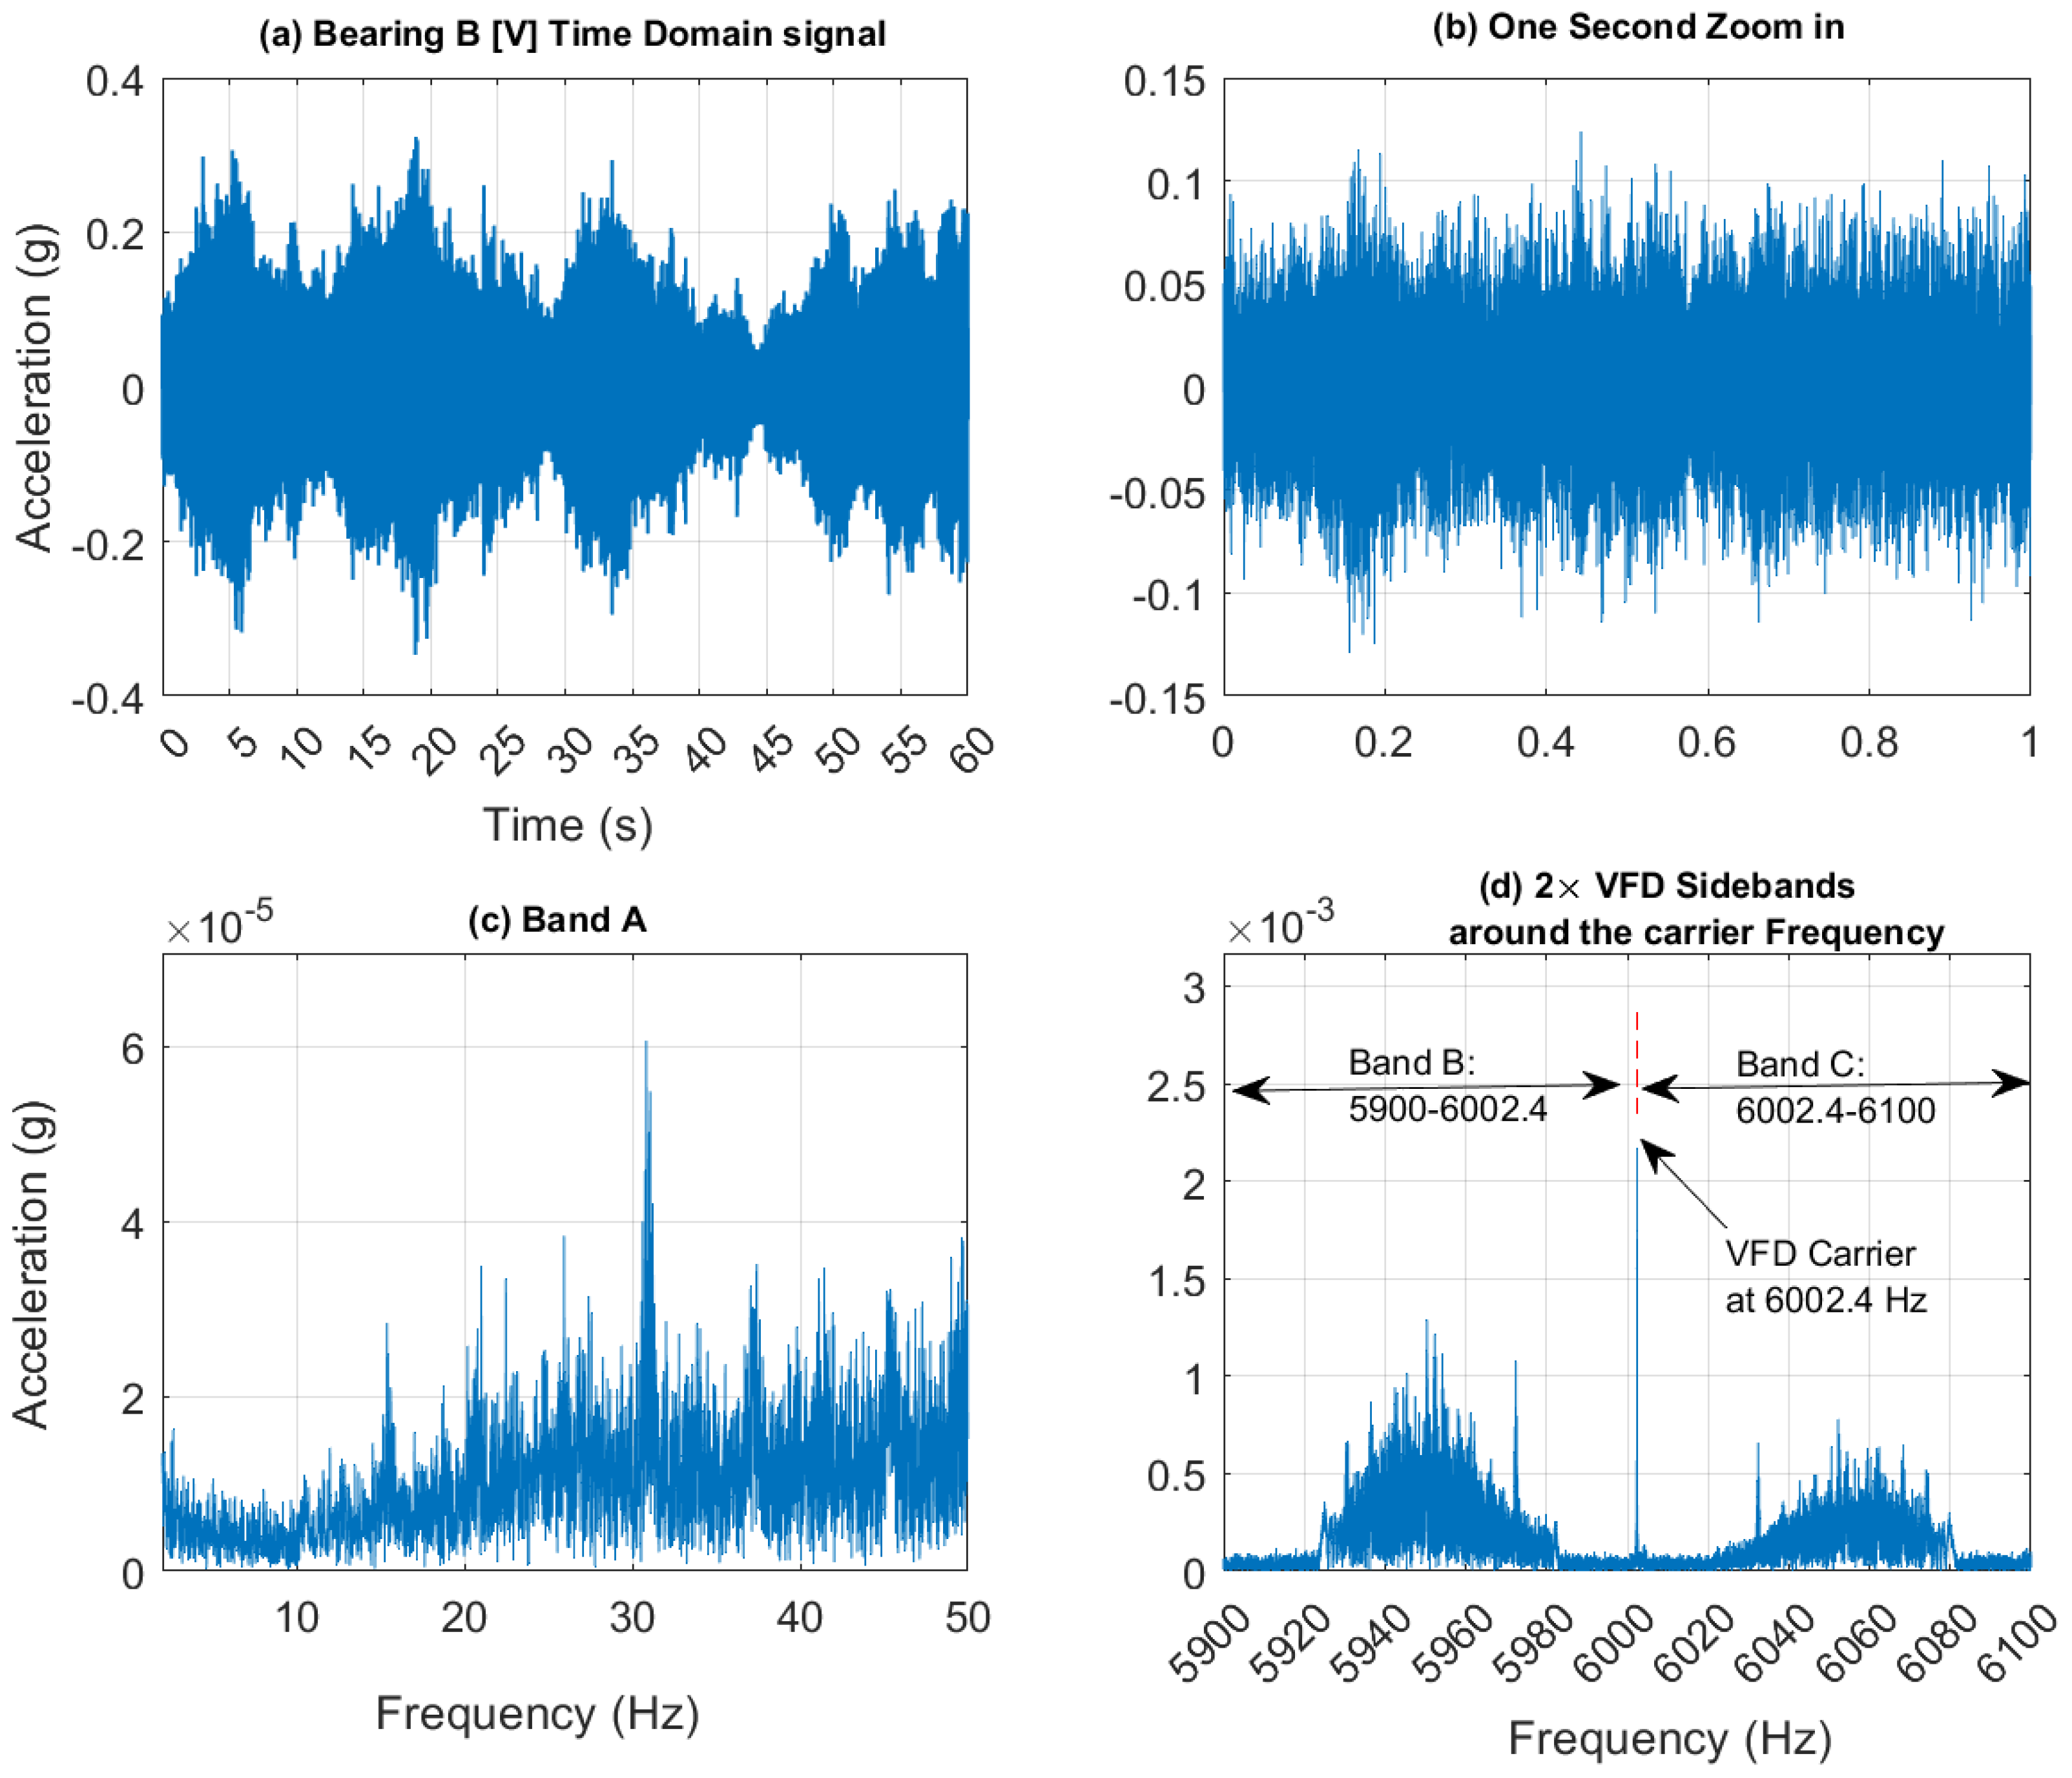
Figure 14.
(a) HSS Actual rpm profile (b) HSS extracted rpm profile using Band A (c) HSS extracted rpm profile using Band B (d) HSS extracted rpm profile using Band C.
Figure 14.
(a) HSS Actual rpm profile (b) HSS extracted rpm profile using Band A (c) HSS extracted rpm profile using Band B (d) HSS extracted rpm profile using Band C.
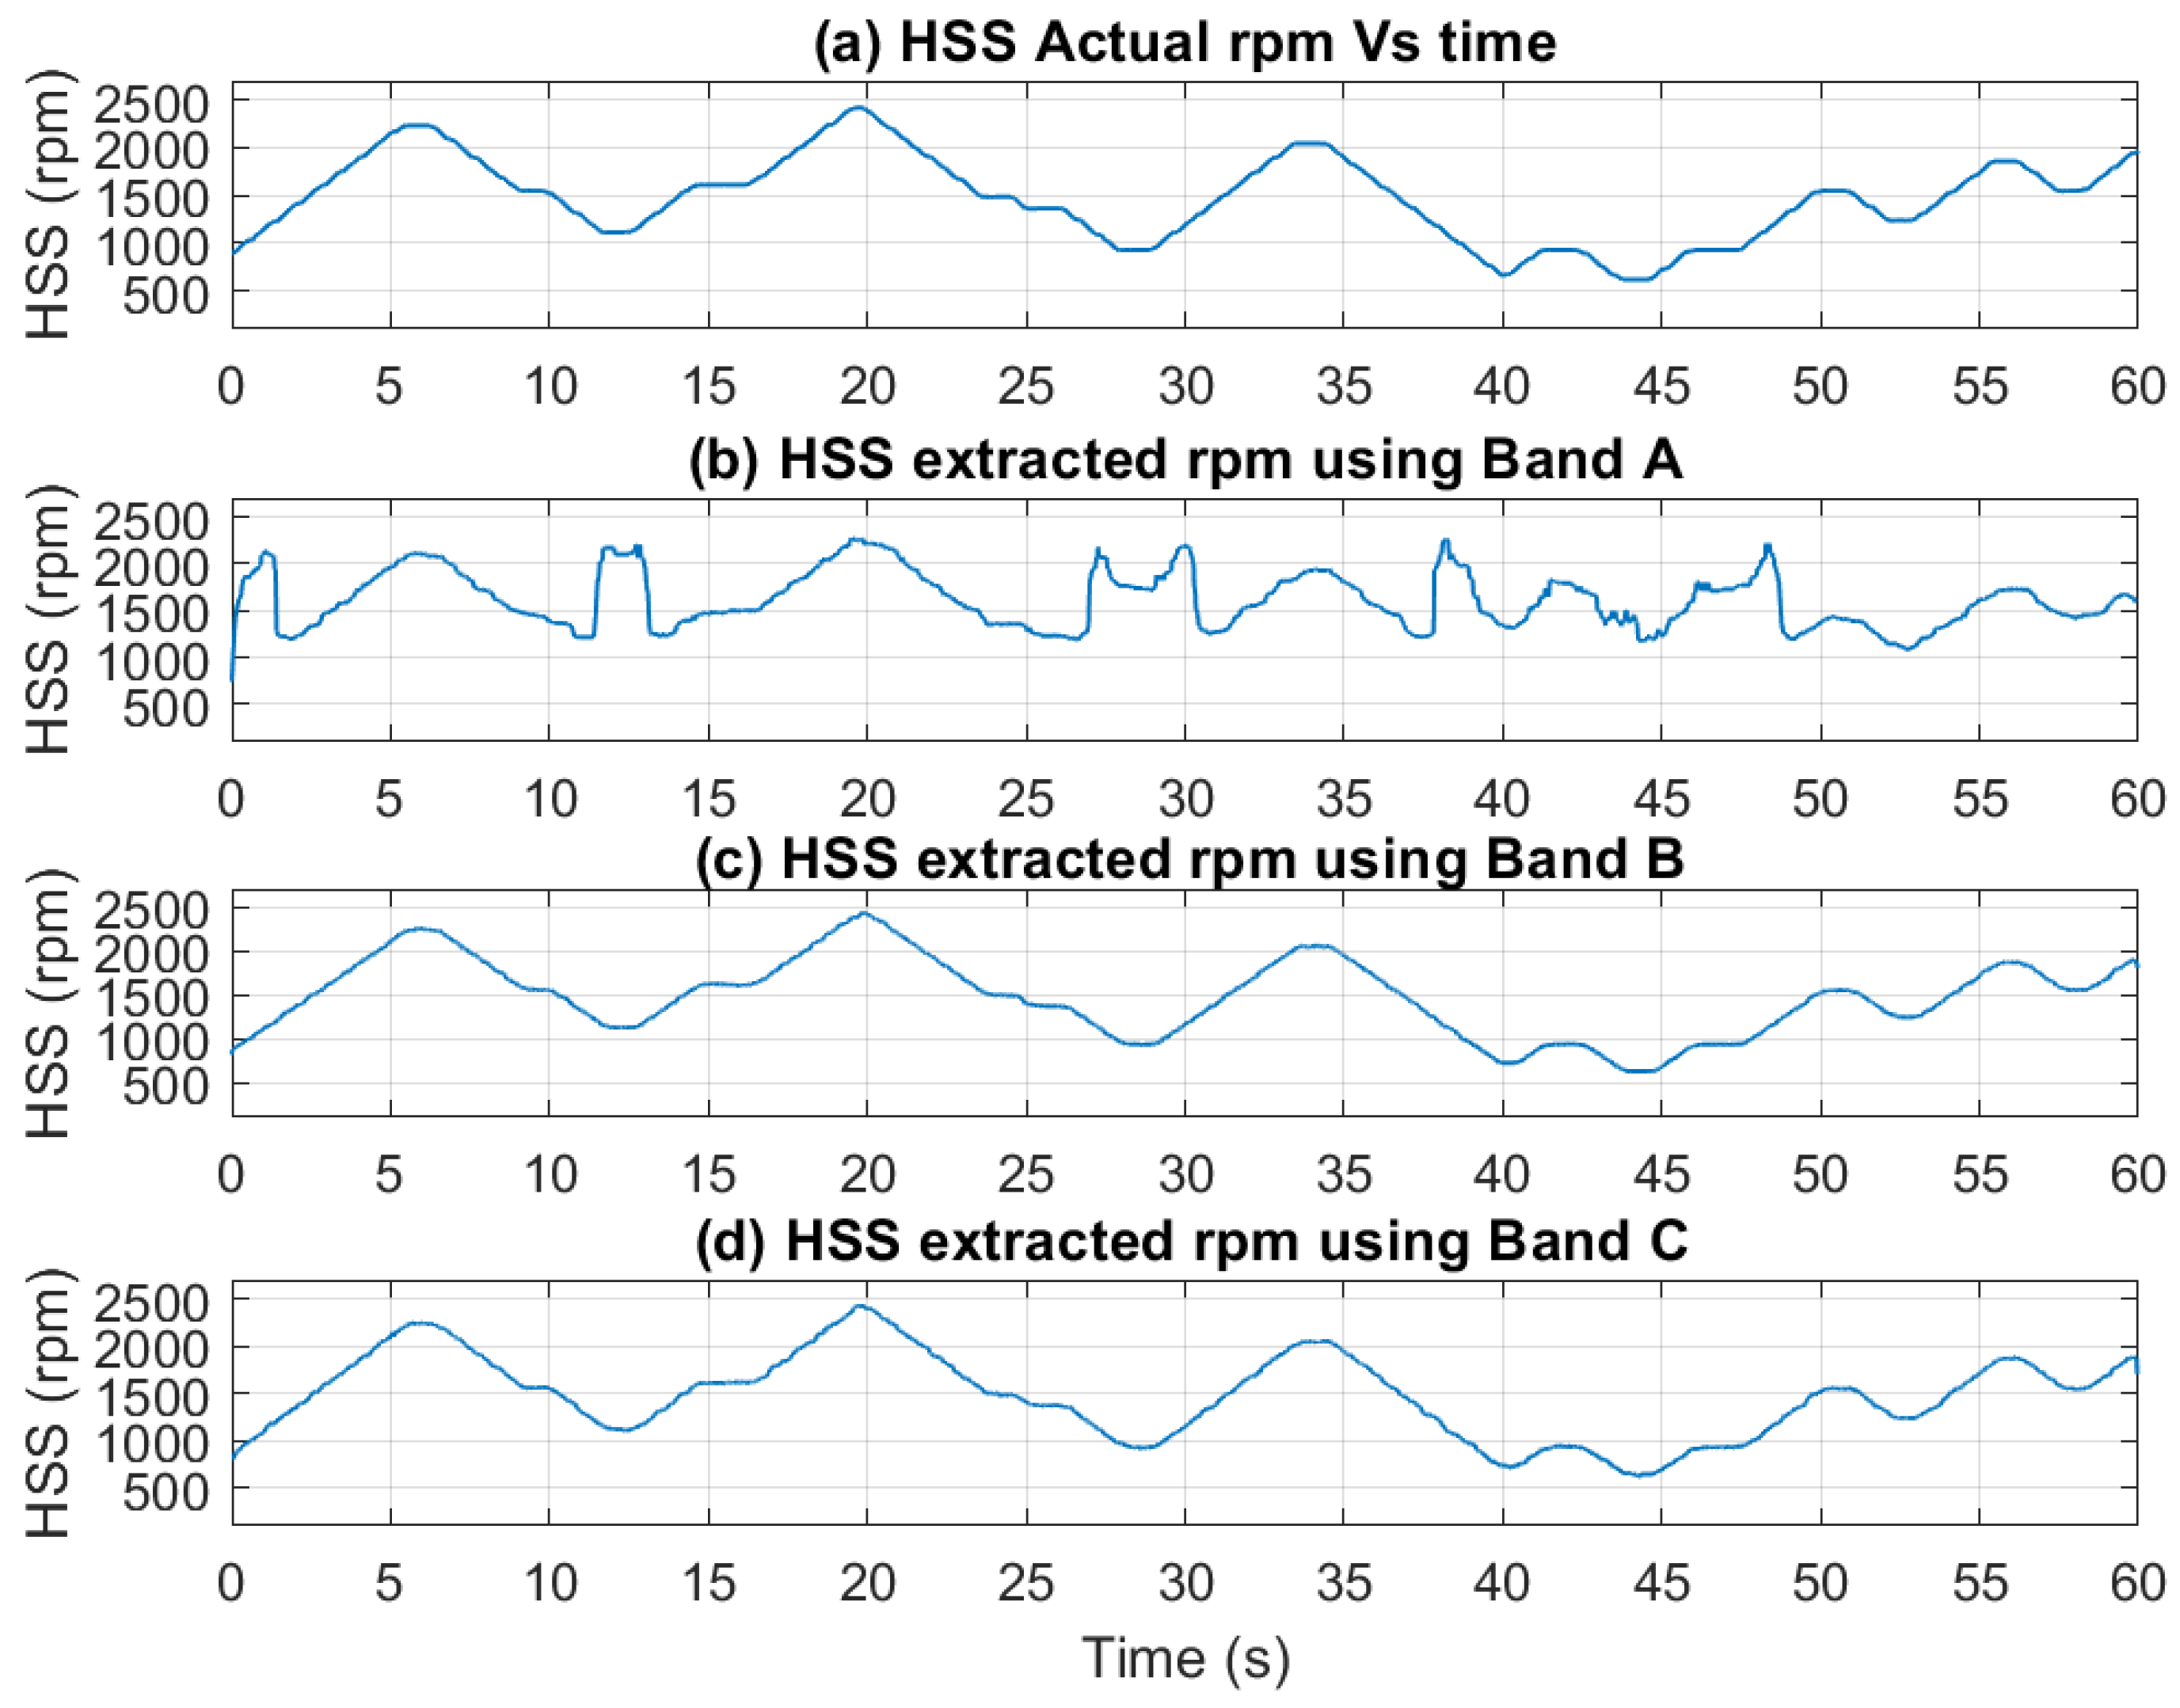
Figure 15.
(a) Bearing B Vertical vibration time-frequency plot; (b) HSS extracted rpm using Band A with and without smoothing.
Figure 15.
(a) Bearing B Vertical vibration time-frequency plot; (b) HSS extracted rpm using Band A with and without smoothing.
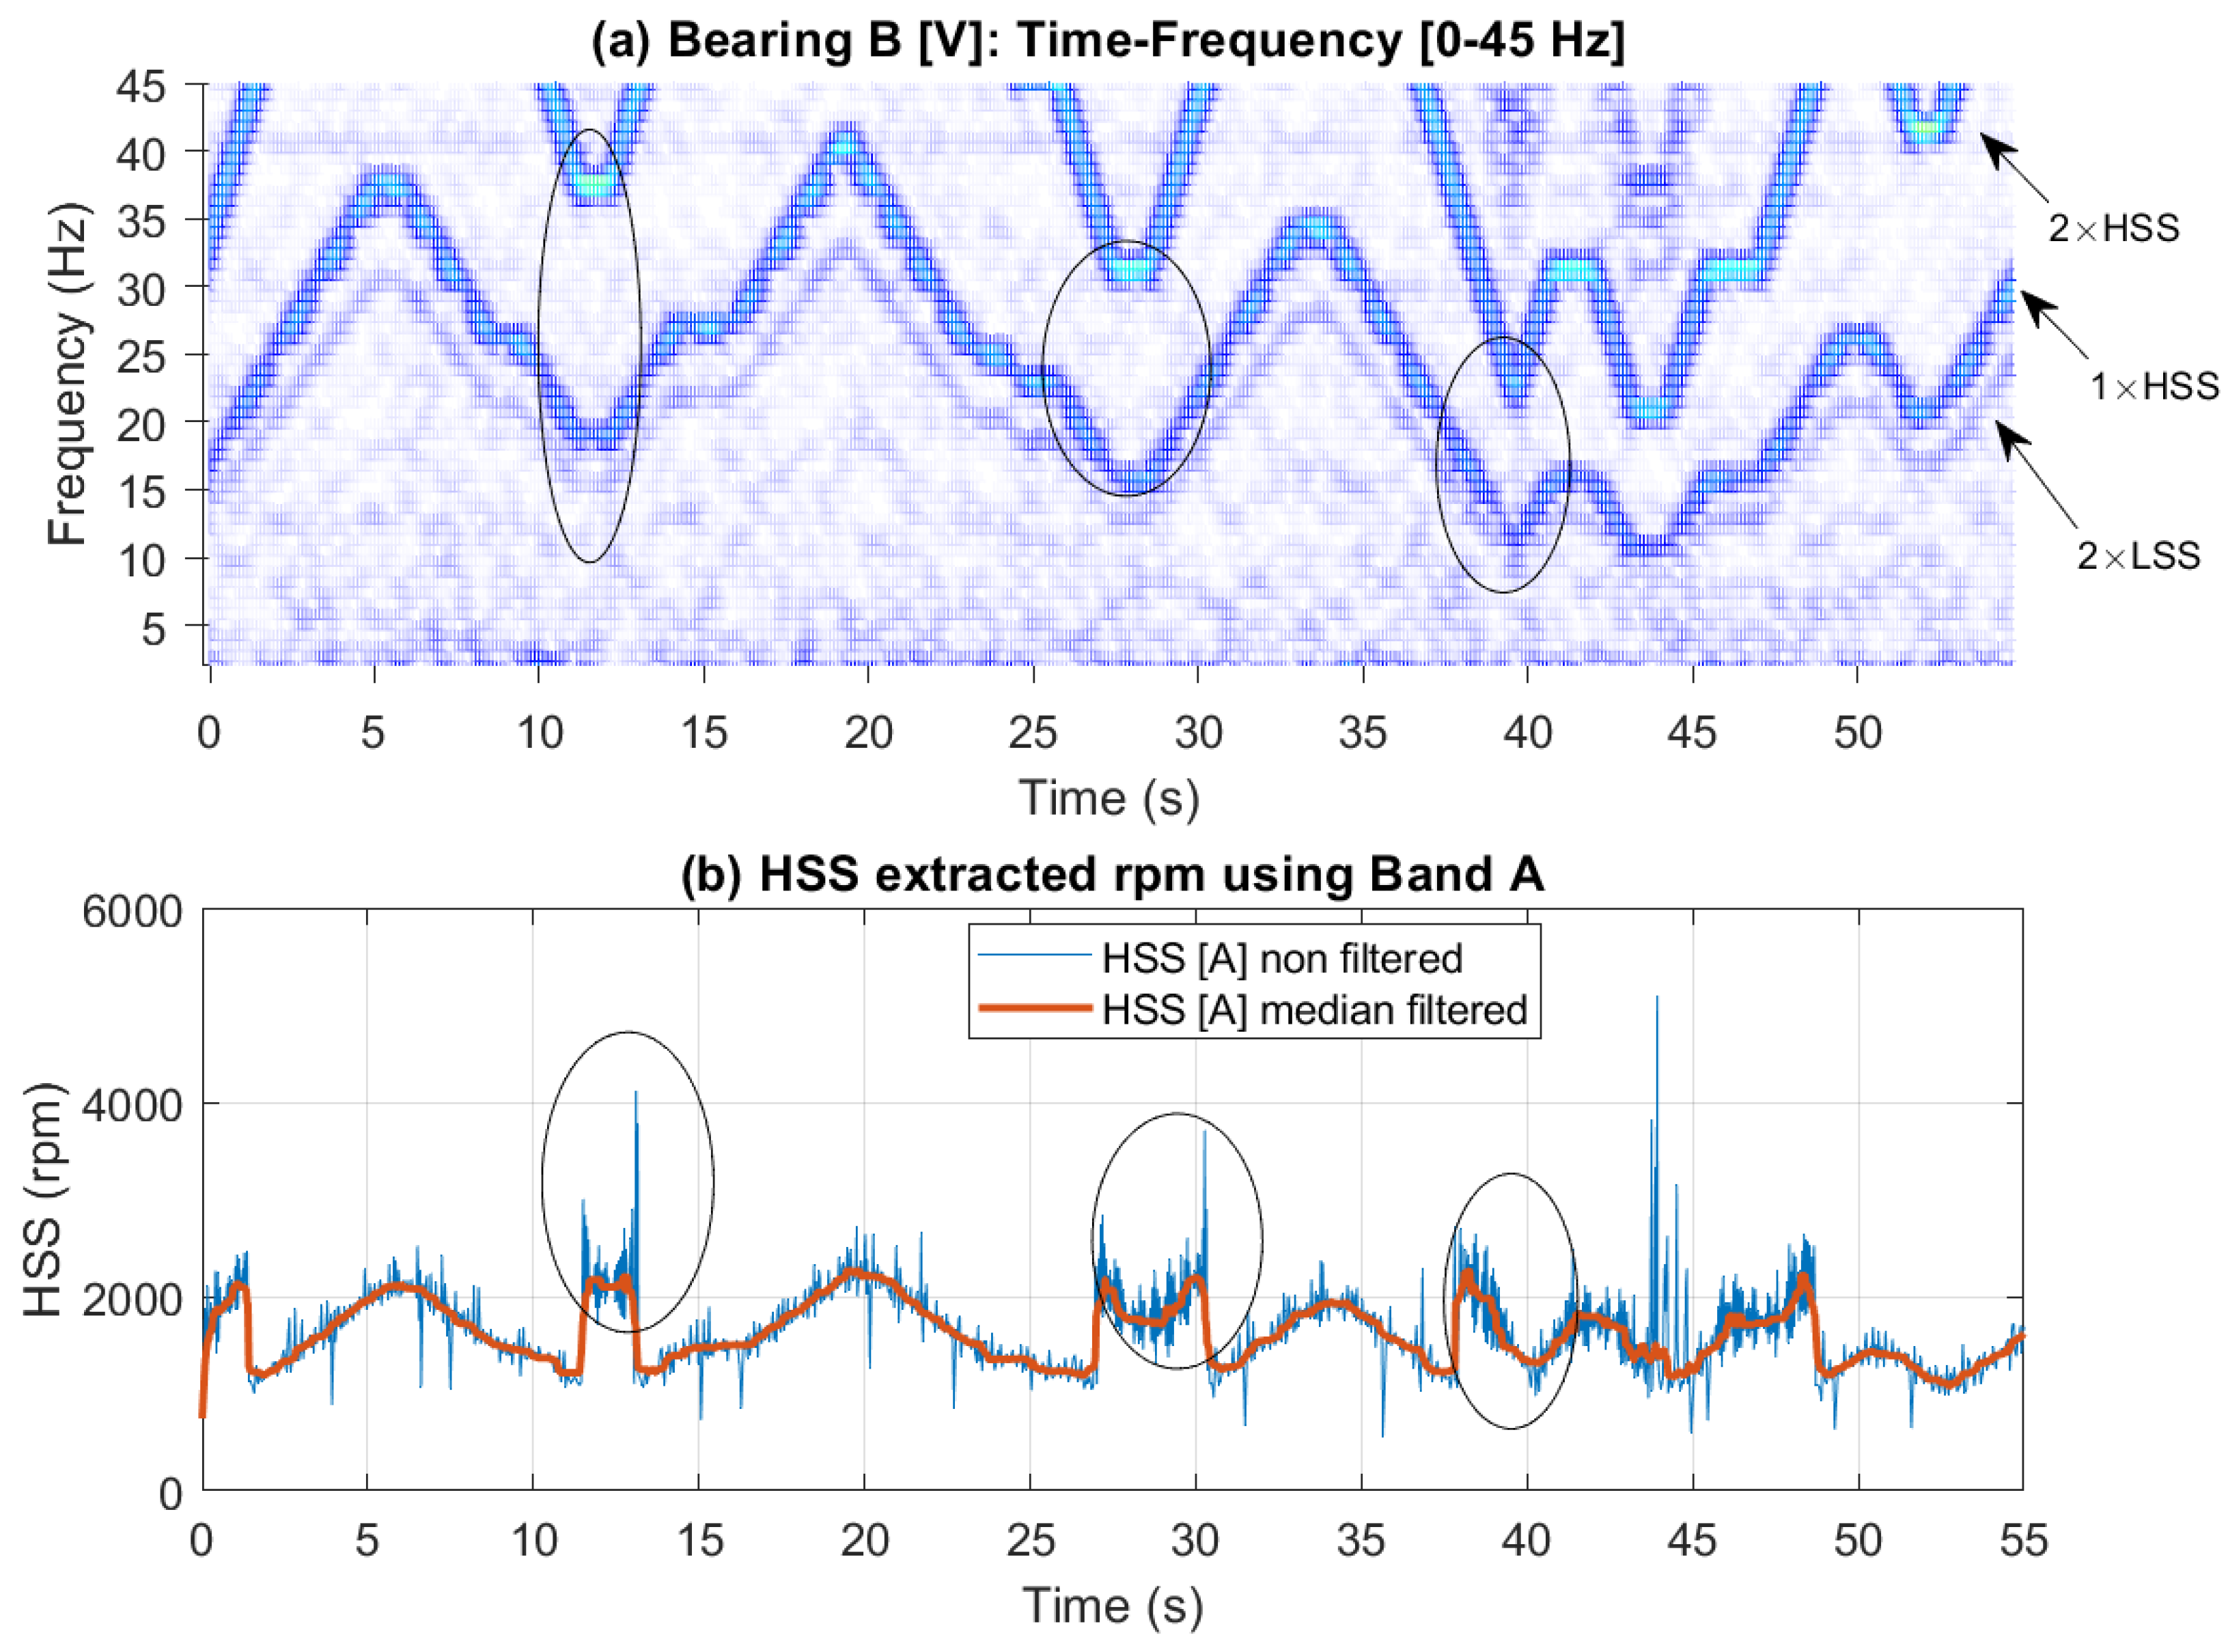
Figure 16.
(a) 2×VFD sidebands around the VFD carrier frequency showing Bands B and C; (b) HSS extracted rpm profile using Band B; (c) HSS extracted profile using Band C.
Figure 16.
(a) 2×VFD sidebands around the VFD carrier frequency showing Bands B and C; (b) HSS extracted rpm profile using Band B; (c) HSS extracted profile using Band C.
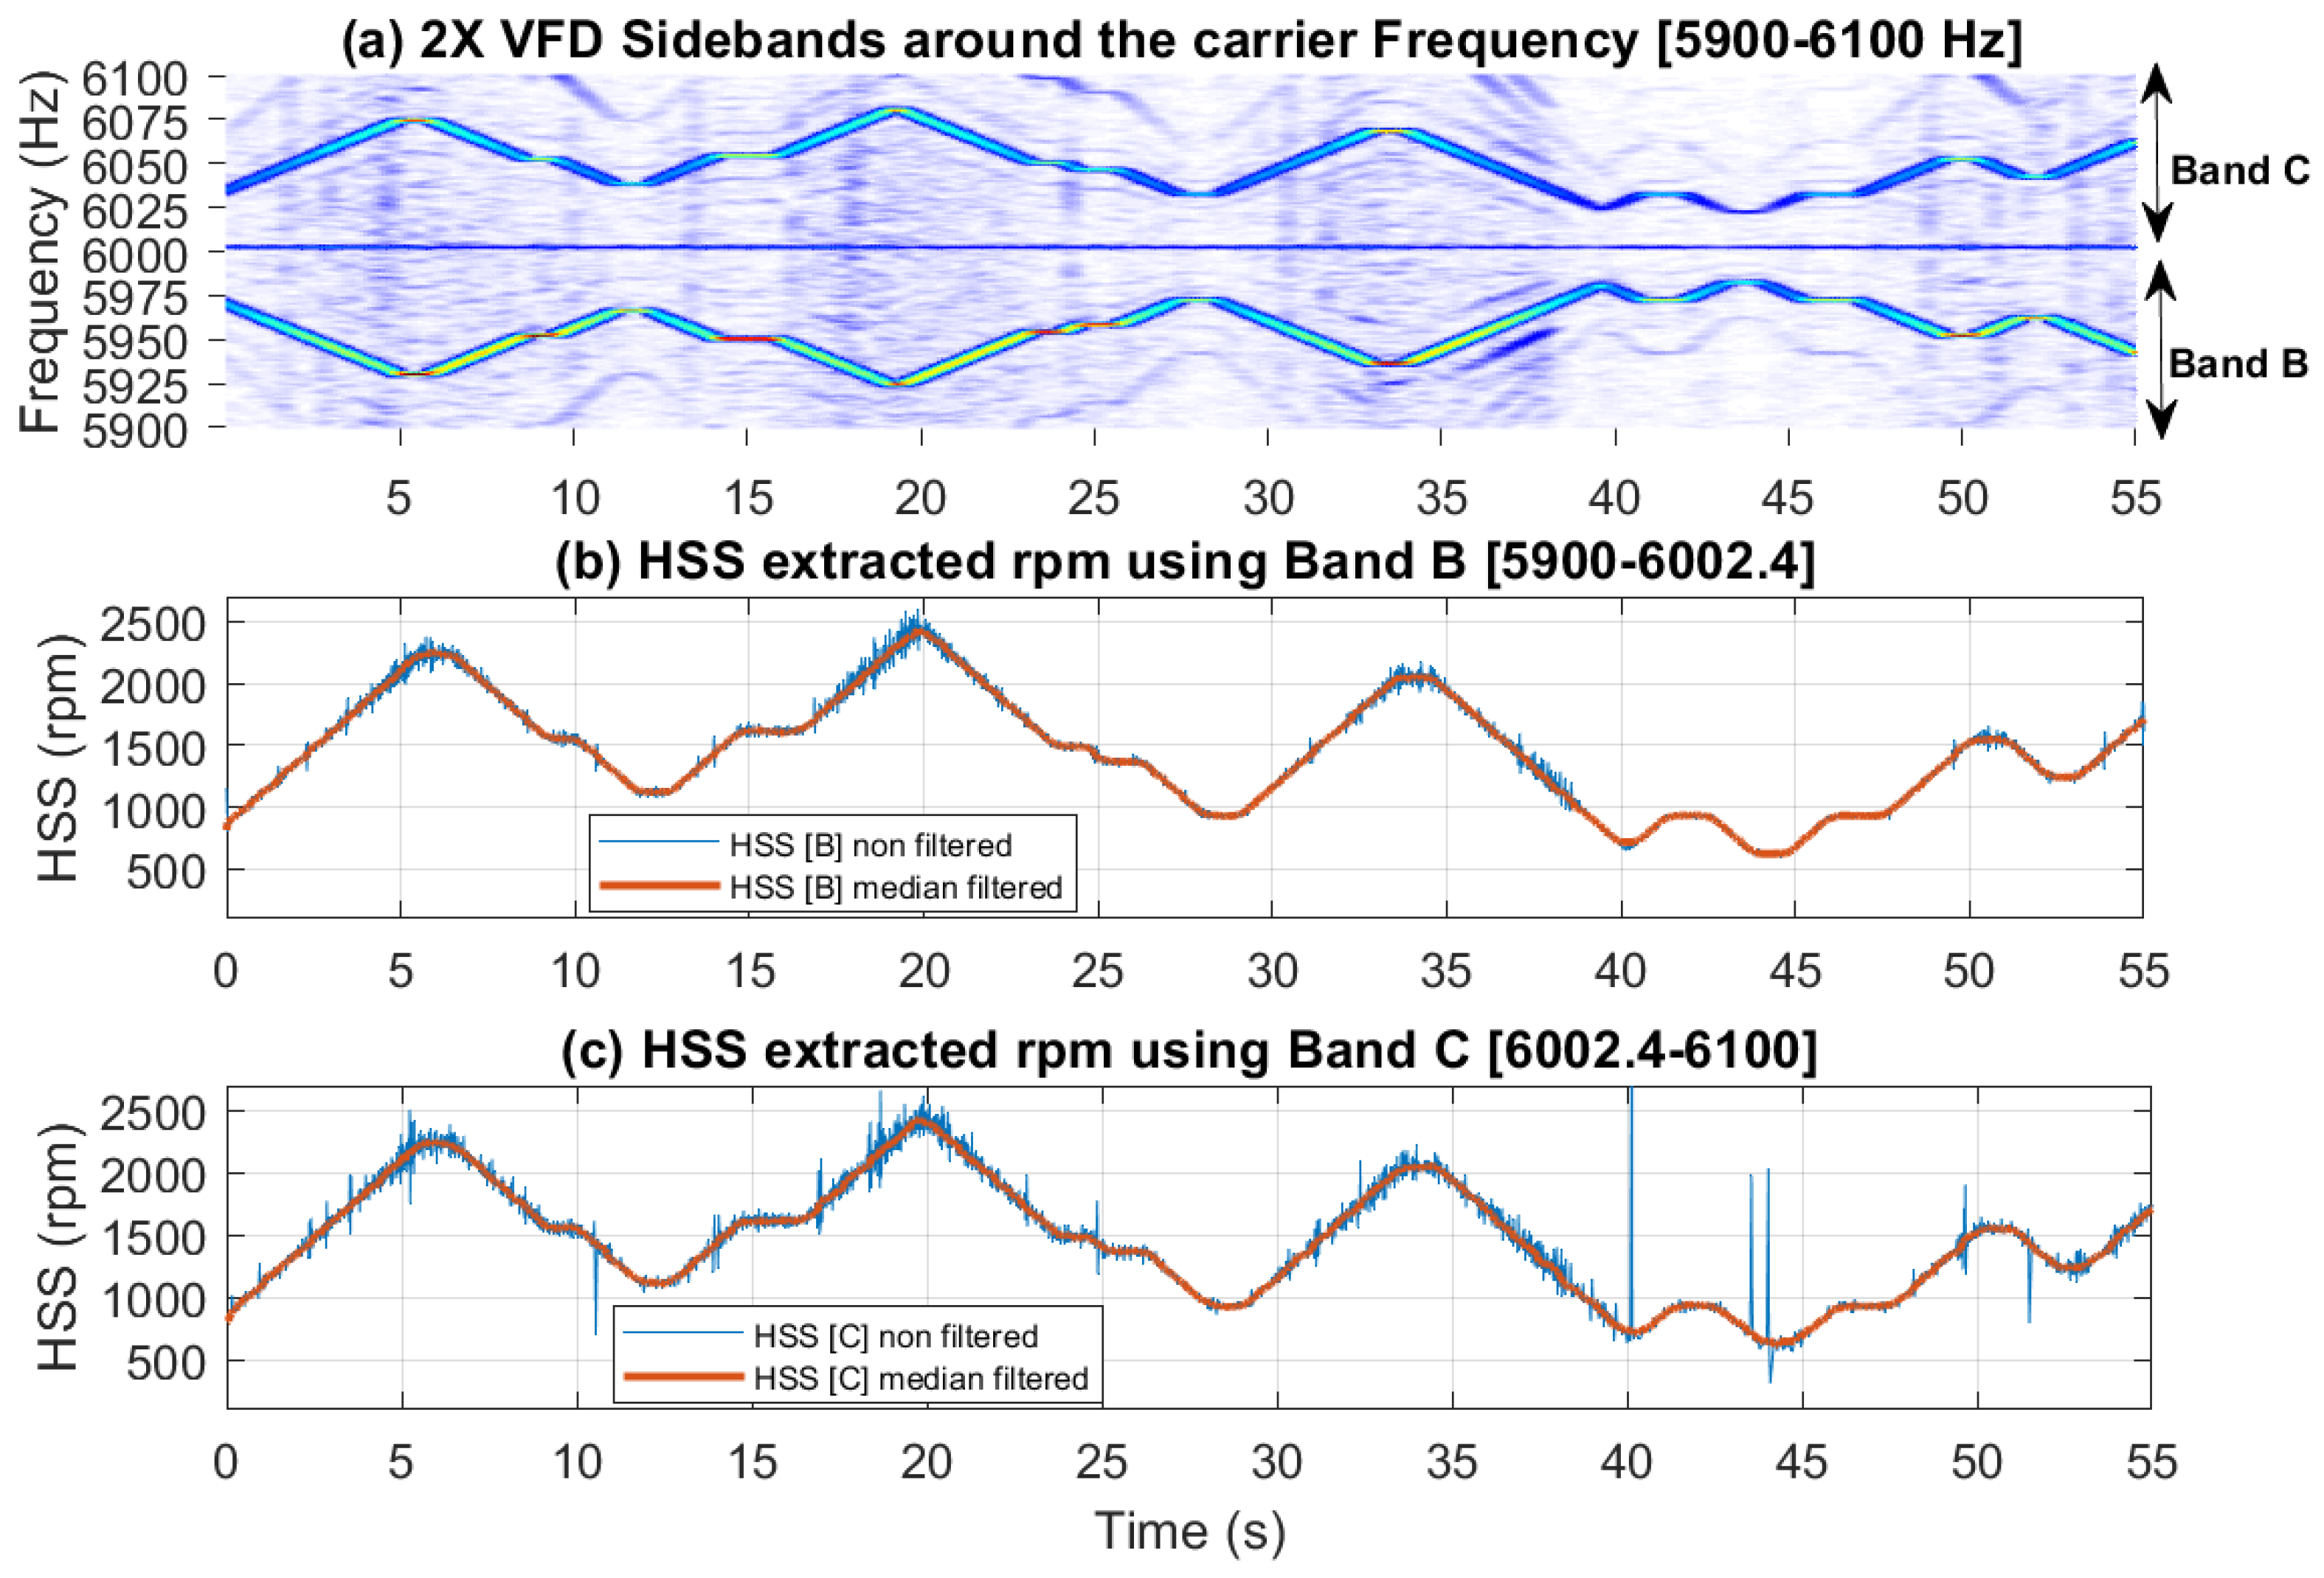
Figure 17.
(a) Inner race HSS drive shaft vertical vibration signal; (b) one second zoom in; (c) frequency plot of the spectrum [Band A: 0-45 Hz); (d) zoom in around the carrier frequency [5900-6100 Hz) showing two bands: Band B the left of the carrier and Band C to the right.
Figure 17.
(a) Inner race HSS drive shaft vertical vibration signal; (b) one second zoom in; (c) frequency plot of the spectrum [Band A: 0-45 Hz); (d) zoom in around the carrier frequency [5900-6100 Hz) showing two bands: Band B the left of the carrier and Band C to the right.

Figure 18.
Inner race: (a) Bearing B Vertical vibration time-frequency plot (Band A: 2-100Hz); (b) HSS extracted rpm using Band A with and without smoothing.
Figure 18.
Inner race: (a) Bearing B Vertical vibration time-frequency plot (Band A: 2-100Hz); (b) HSS extracted rpm using Band A with and without smoothing.
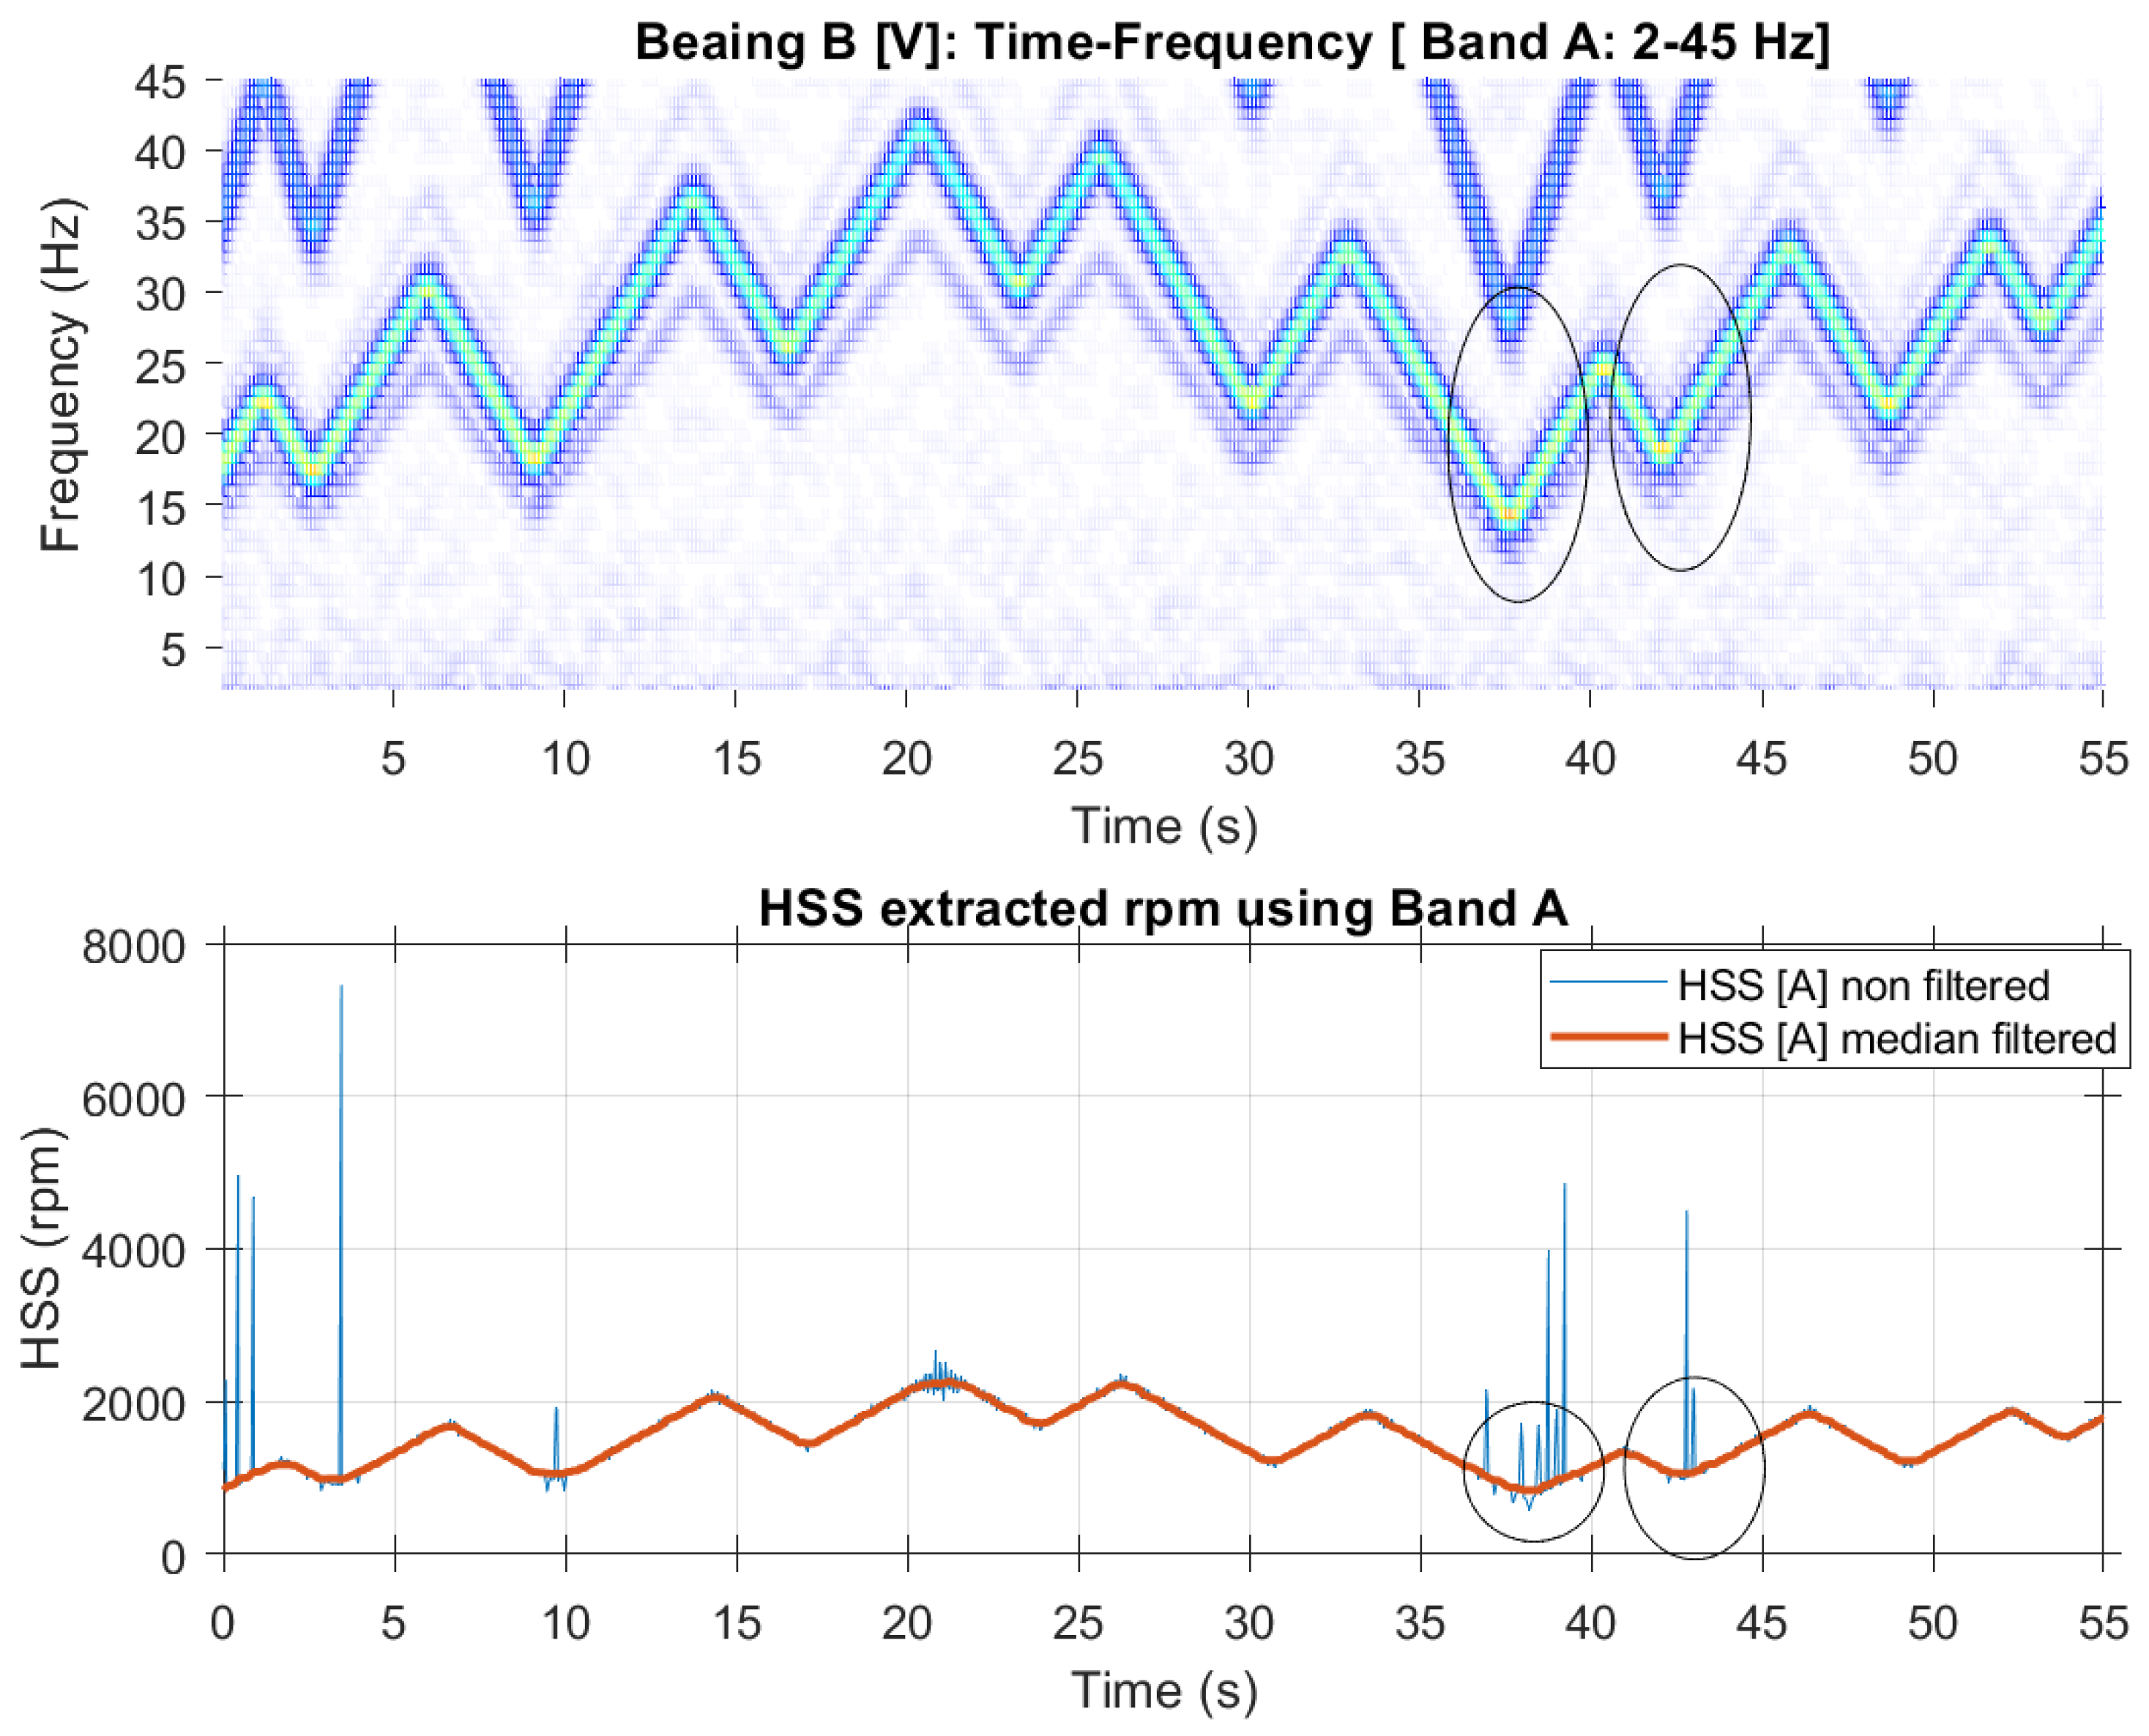
Figure 19.
Inner race: (a) 2×VFD sidebands around the VFD carrier frequency showing Bands B and C [5800-6200]; (b) HSS extracted rpm profile using Band B; (c) HSS extracted profile using Band C.
Figure 19.
Inner race: (a) 2×VFD sidebands around the VFD carrier frequency showing Bands B and C [5800-6200]; (b) HSS extracted rpm profile using Band B; (c) HSS extracted profile using Band C.
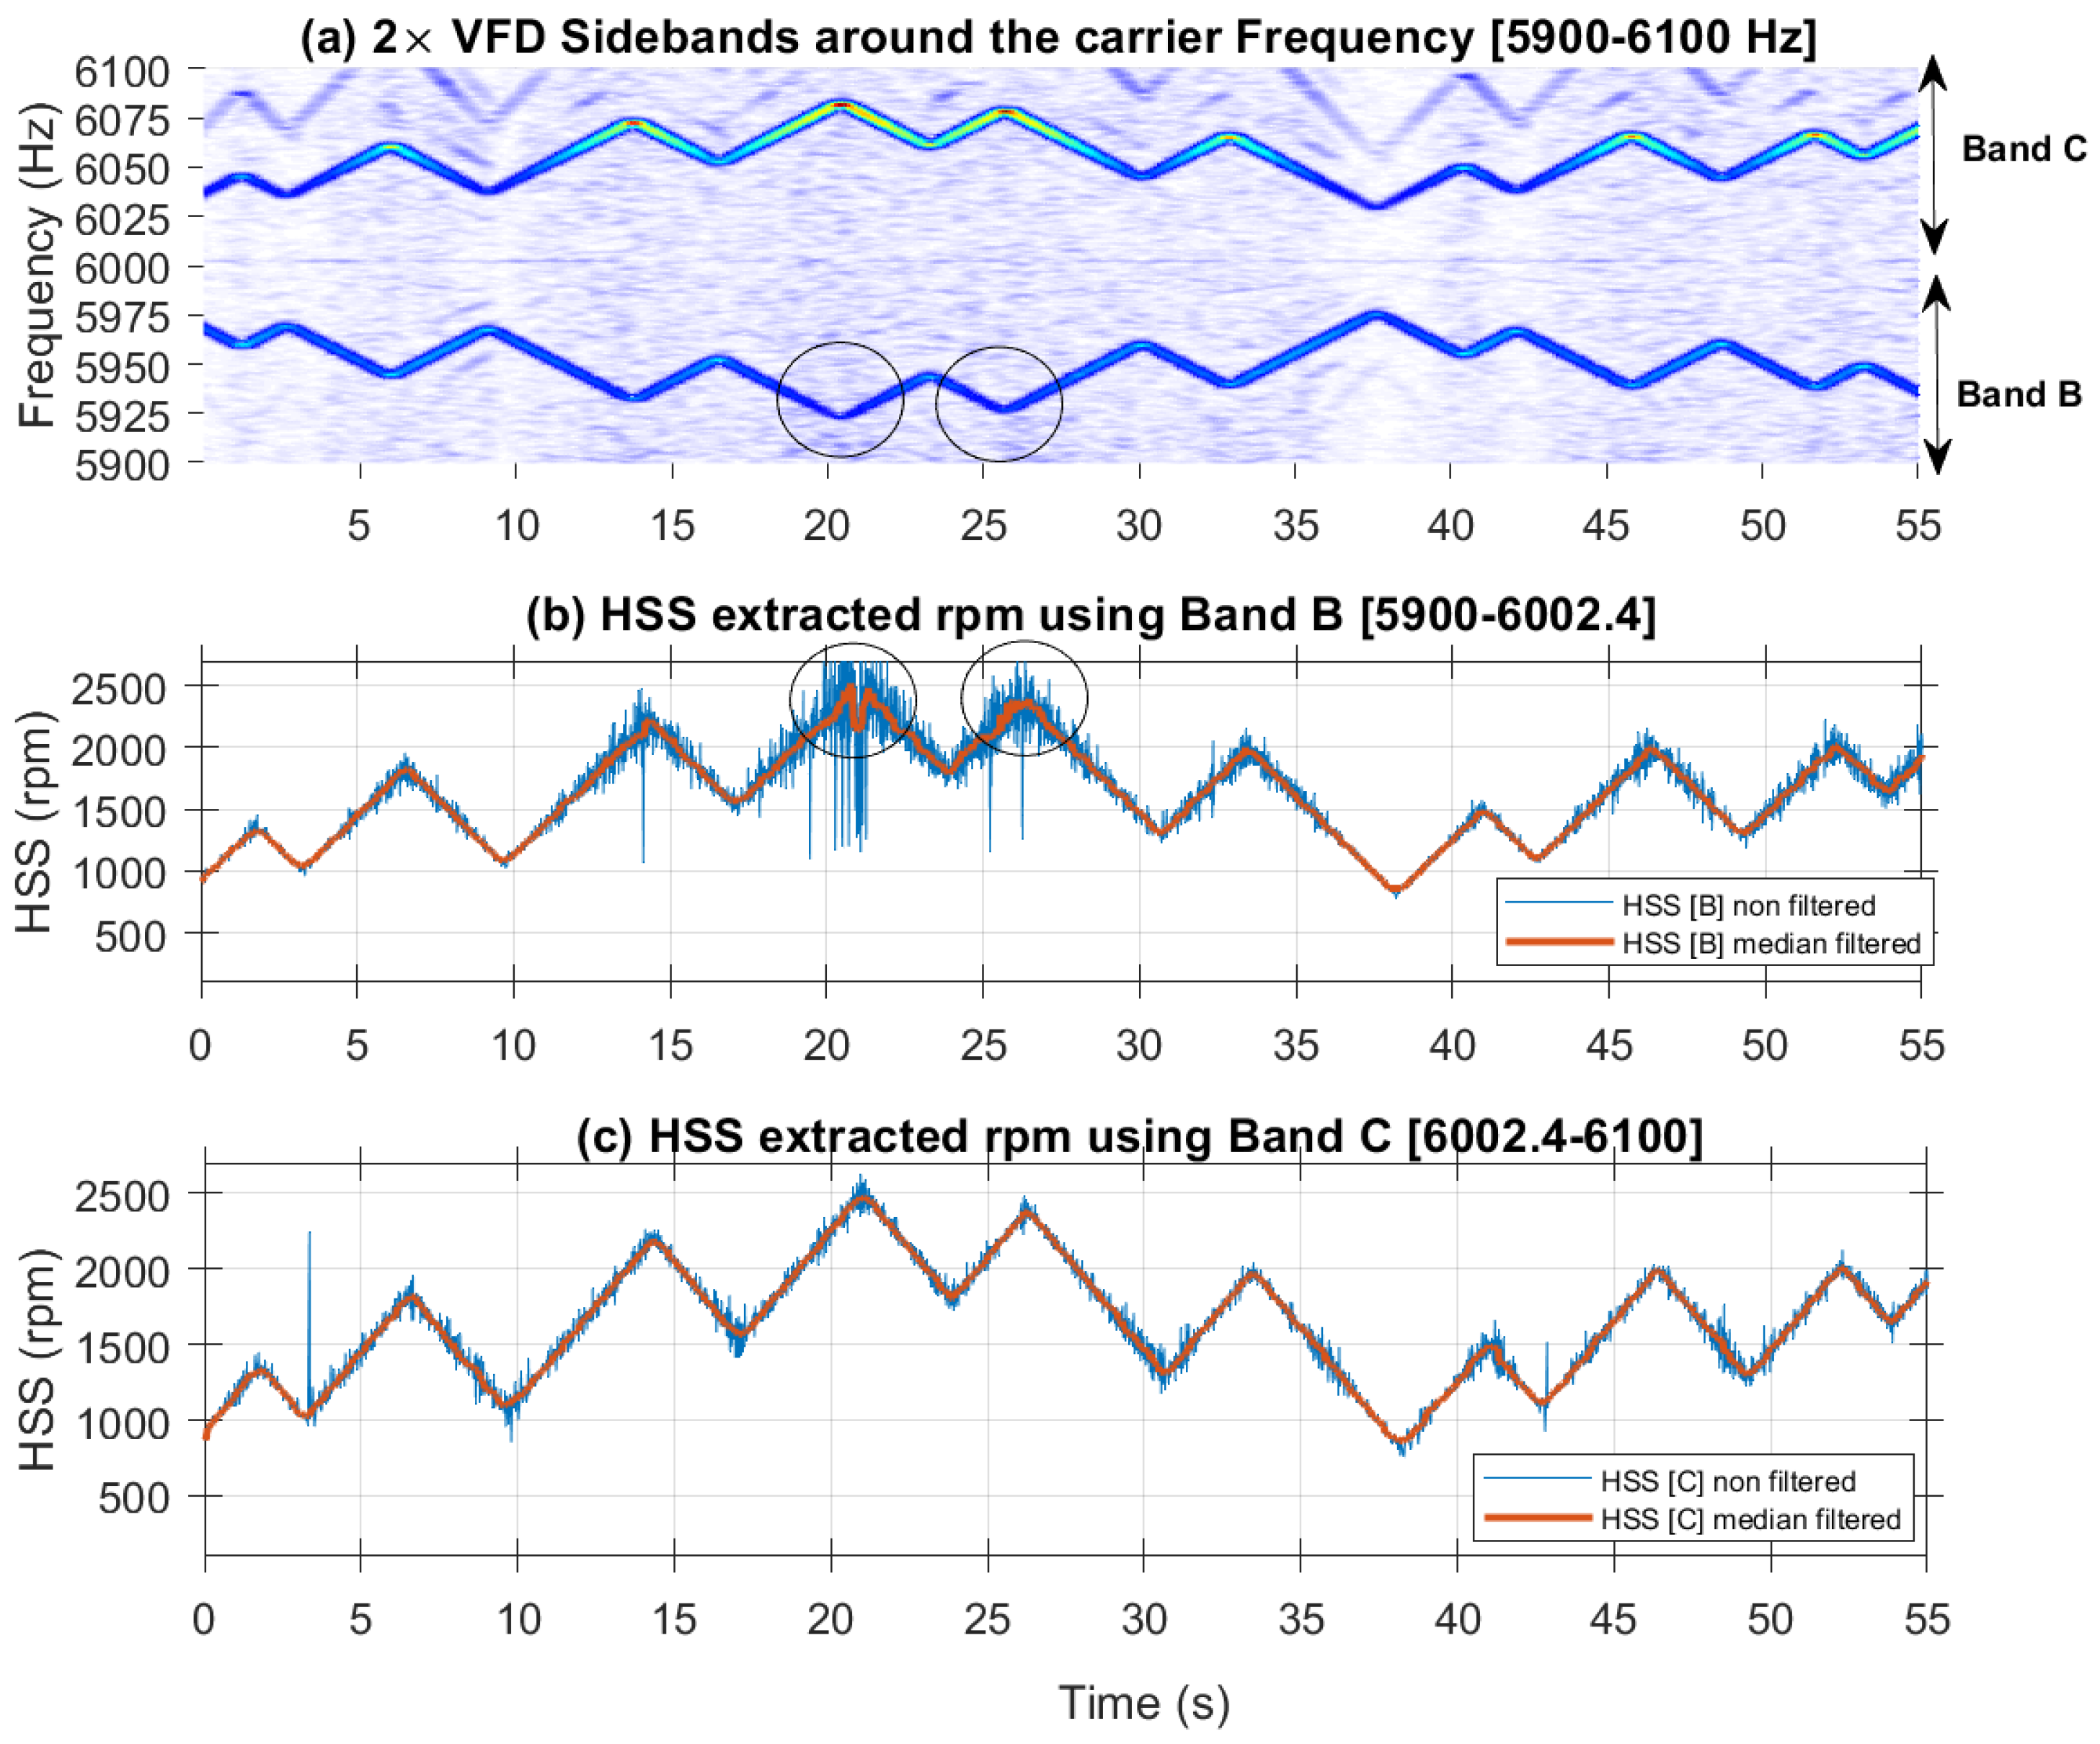
Figure 20.
Inner race fault diagnosis: residual envelope signals and envelope spectra for Band A, Band B and Band C.
Figure 20.
Inner race fault diagnosis: residual envelope signals and envelope spectra for Band A, Band B and Band C.
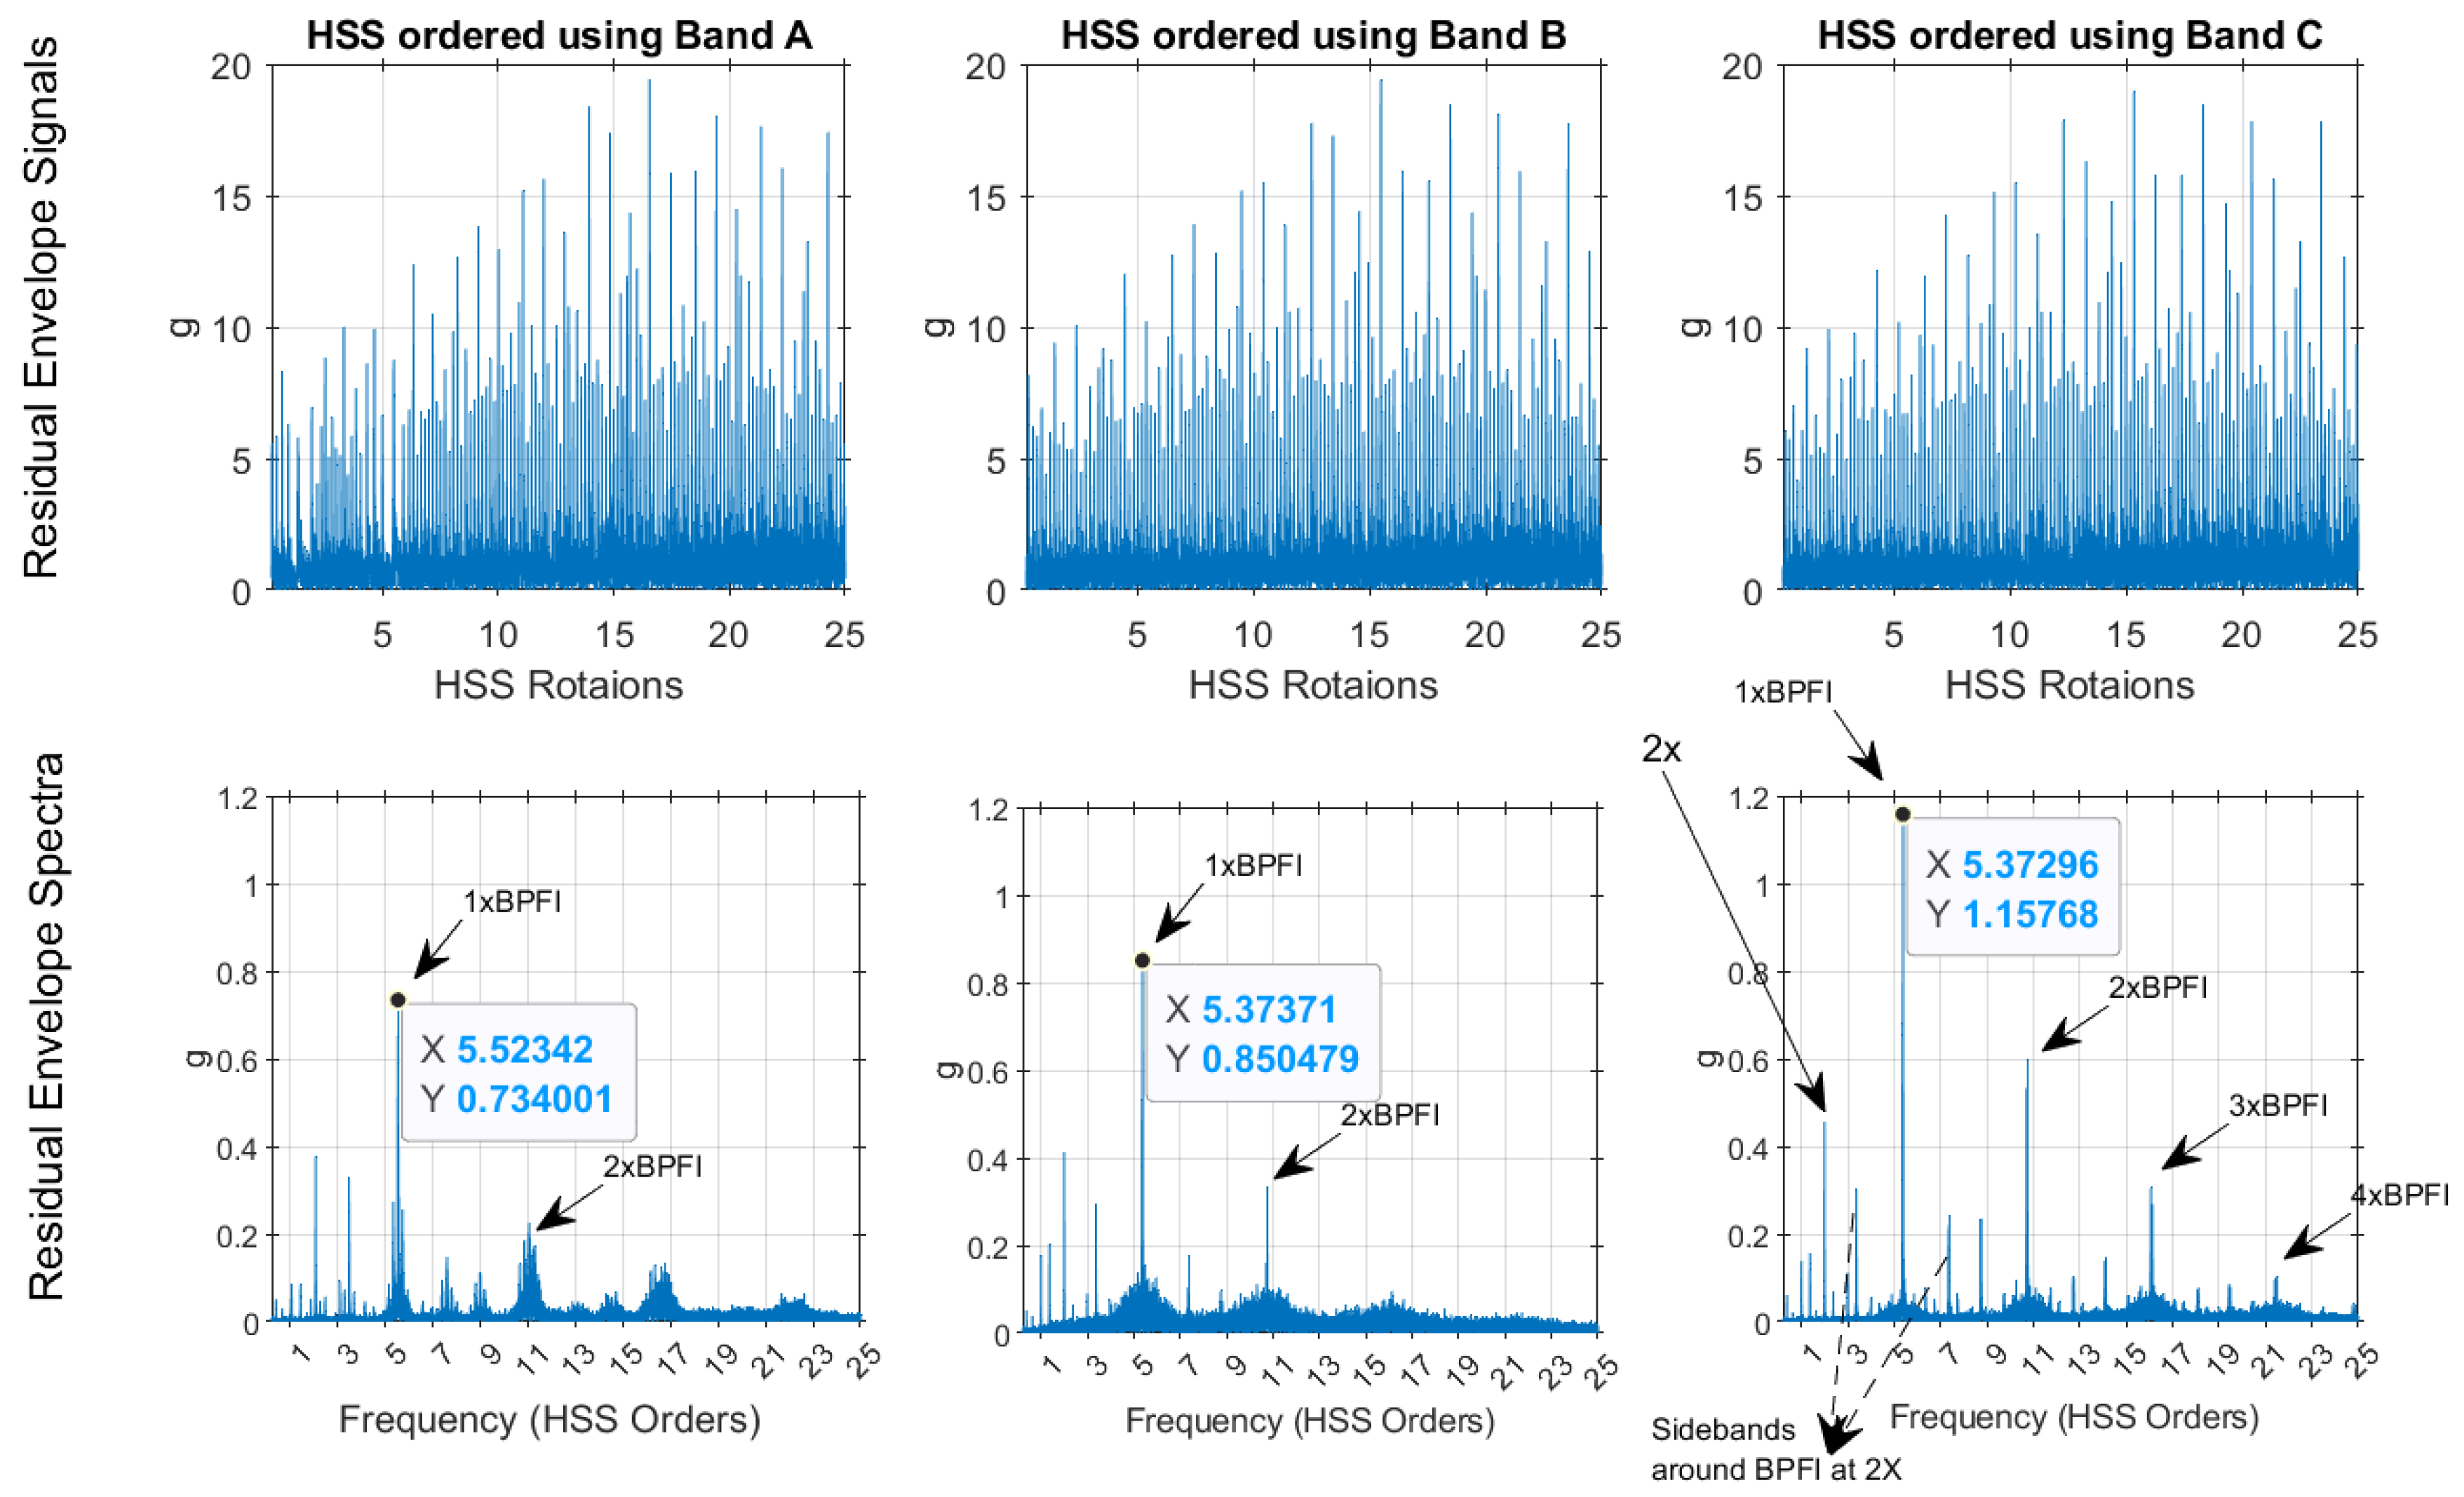
Figure 21.
Outer race HSS drive shaft vertical vibration signal: (a) time domain; (b) one second zoom in; (c) zoom in plot of spectrum [Band A: 0-45 Hz); (d) zoom in around the carrier frequency [5900-6100 Hz) showing two bands: Band B to the left of the carrier and band C to the right.
Figure 21.
Outer race HSS drive shaft vertical vibration signal: (a) time domain; (b) one second zoom in; (c) zoom in plot of spectrum [Band A: 0-45 Hz); (d) zoom in around the carrier frequency [5900-6100 Hz) showing two bands: Band B to the left of the carrier and band C to the right.
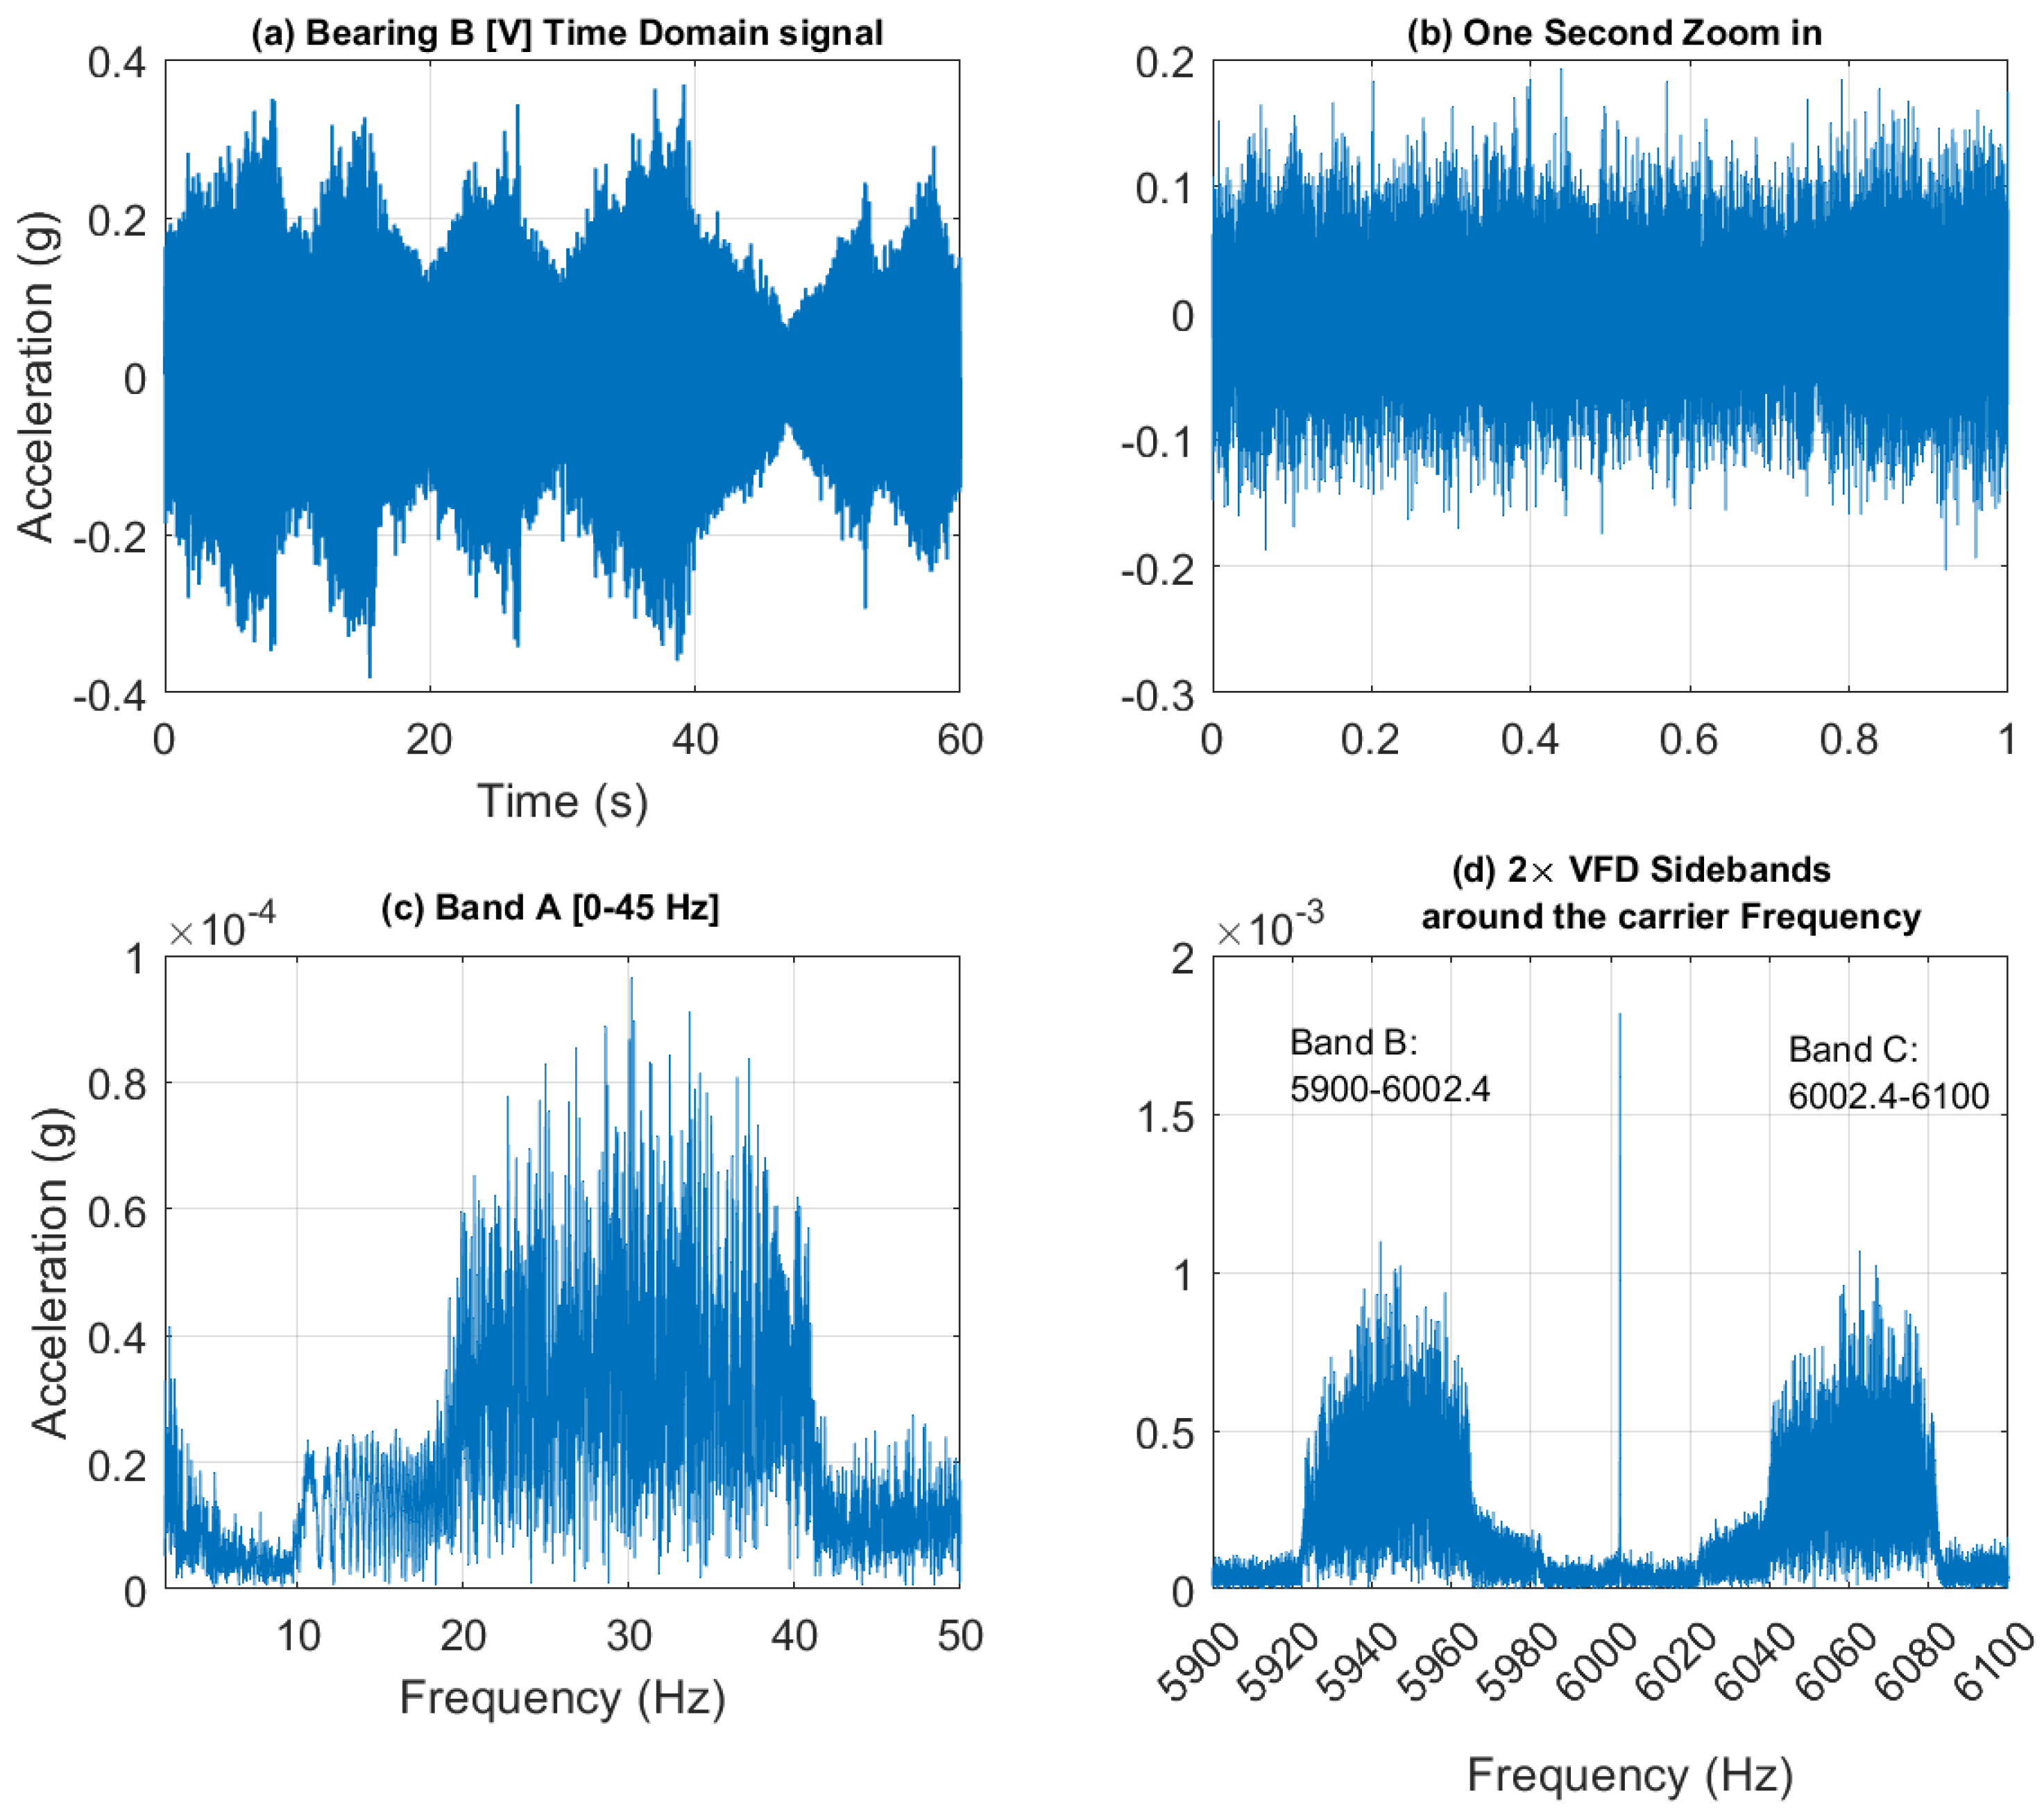
Figure 22.
Outer race: (a) Bearing B vertical vibration time-frequency plot (Band A: 045Hz); (b) HSS extracted rpm using Band A with and without smoothing.
Figure 22.
Outer race: (a) Bearing B vertical vibration time-frequency plot (Band A: 045Hz); (b) HSS extracted rpm using Band A with and without smoothing.
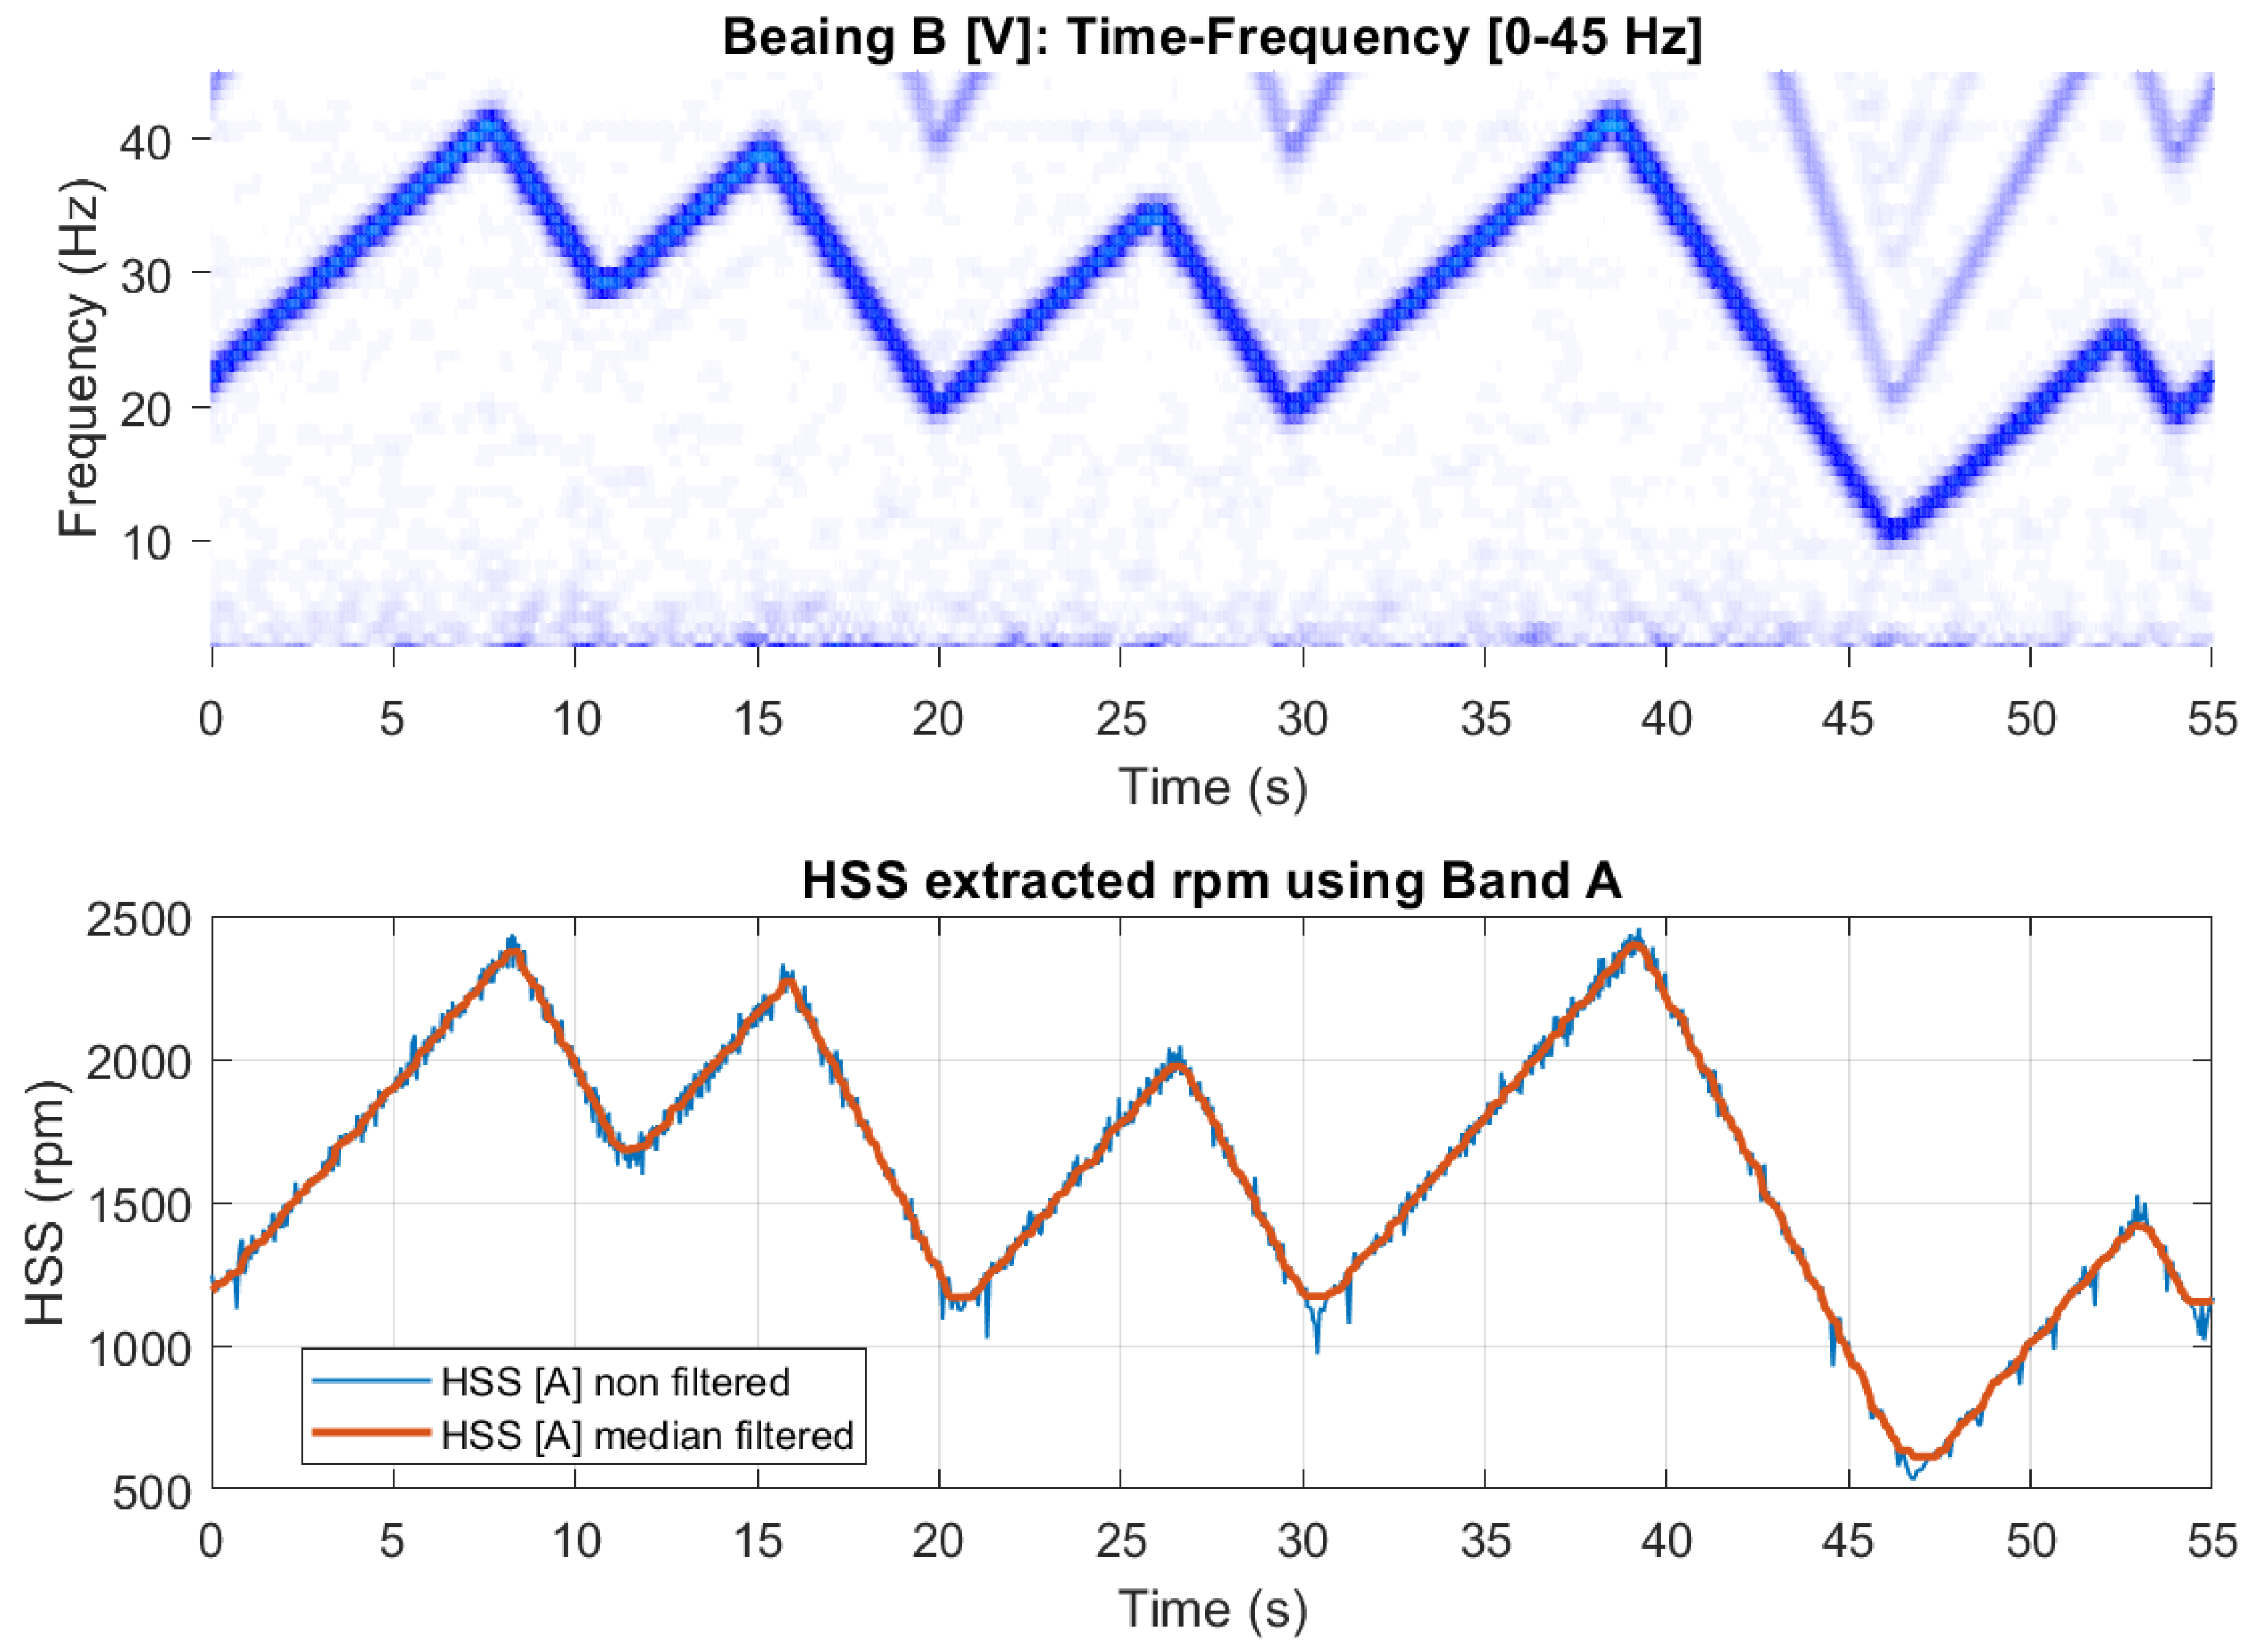
Figure 23.
Outer race: (a) 2×VFD sidebands around the VFD carrier frequency showing Bands B and C [5800-6200]; (b) HSS extracted rpm profile using Band B; (c) HSS extracted profile using Band C.
Figure 23.
Outer race: (a) 2×VFD sidebands around the VFD carrier frequency showing Bands B and C [5800-6200]; (b) HSS extracted rpm profile using Band B; (c) HSS extracted profile using Band C.
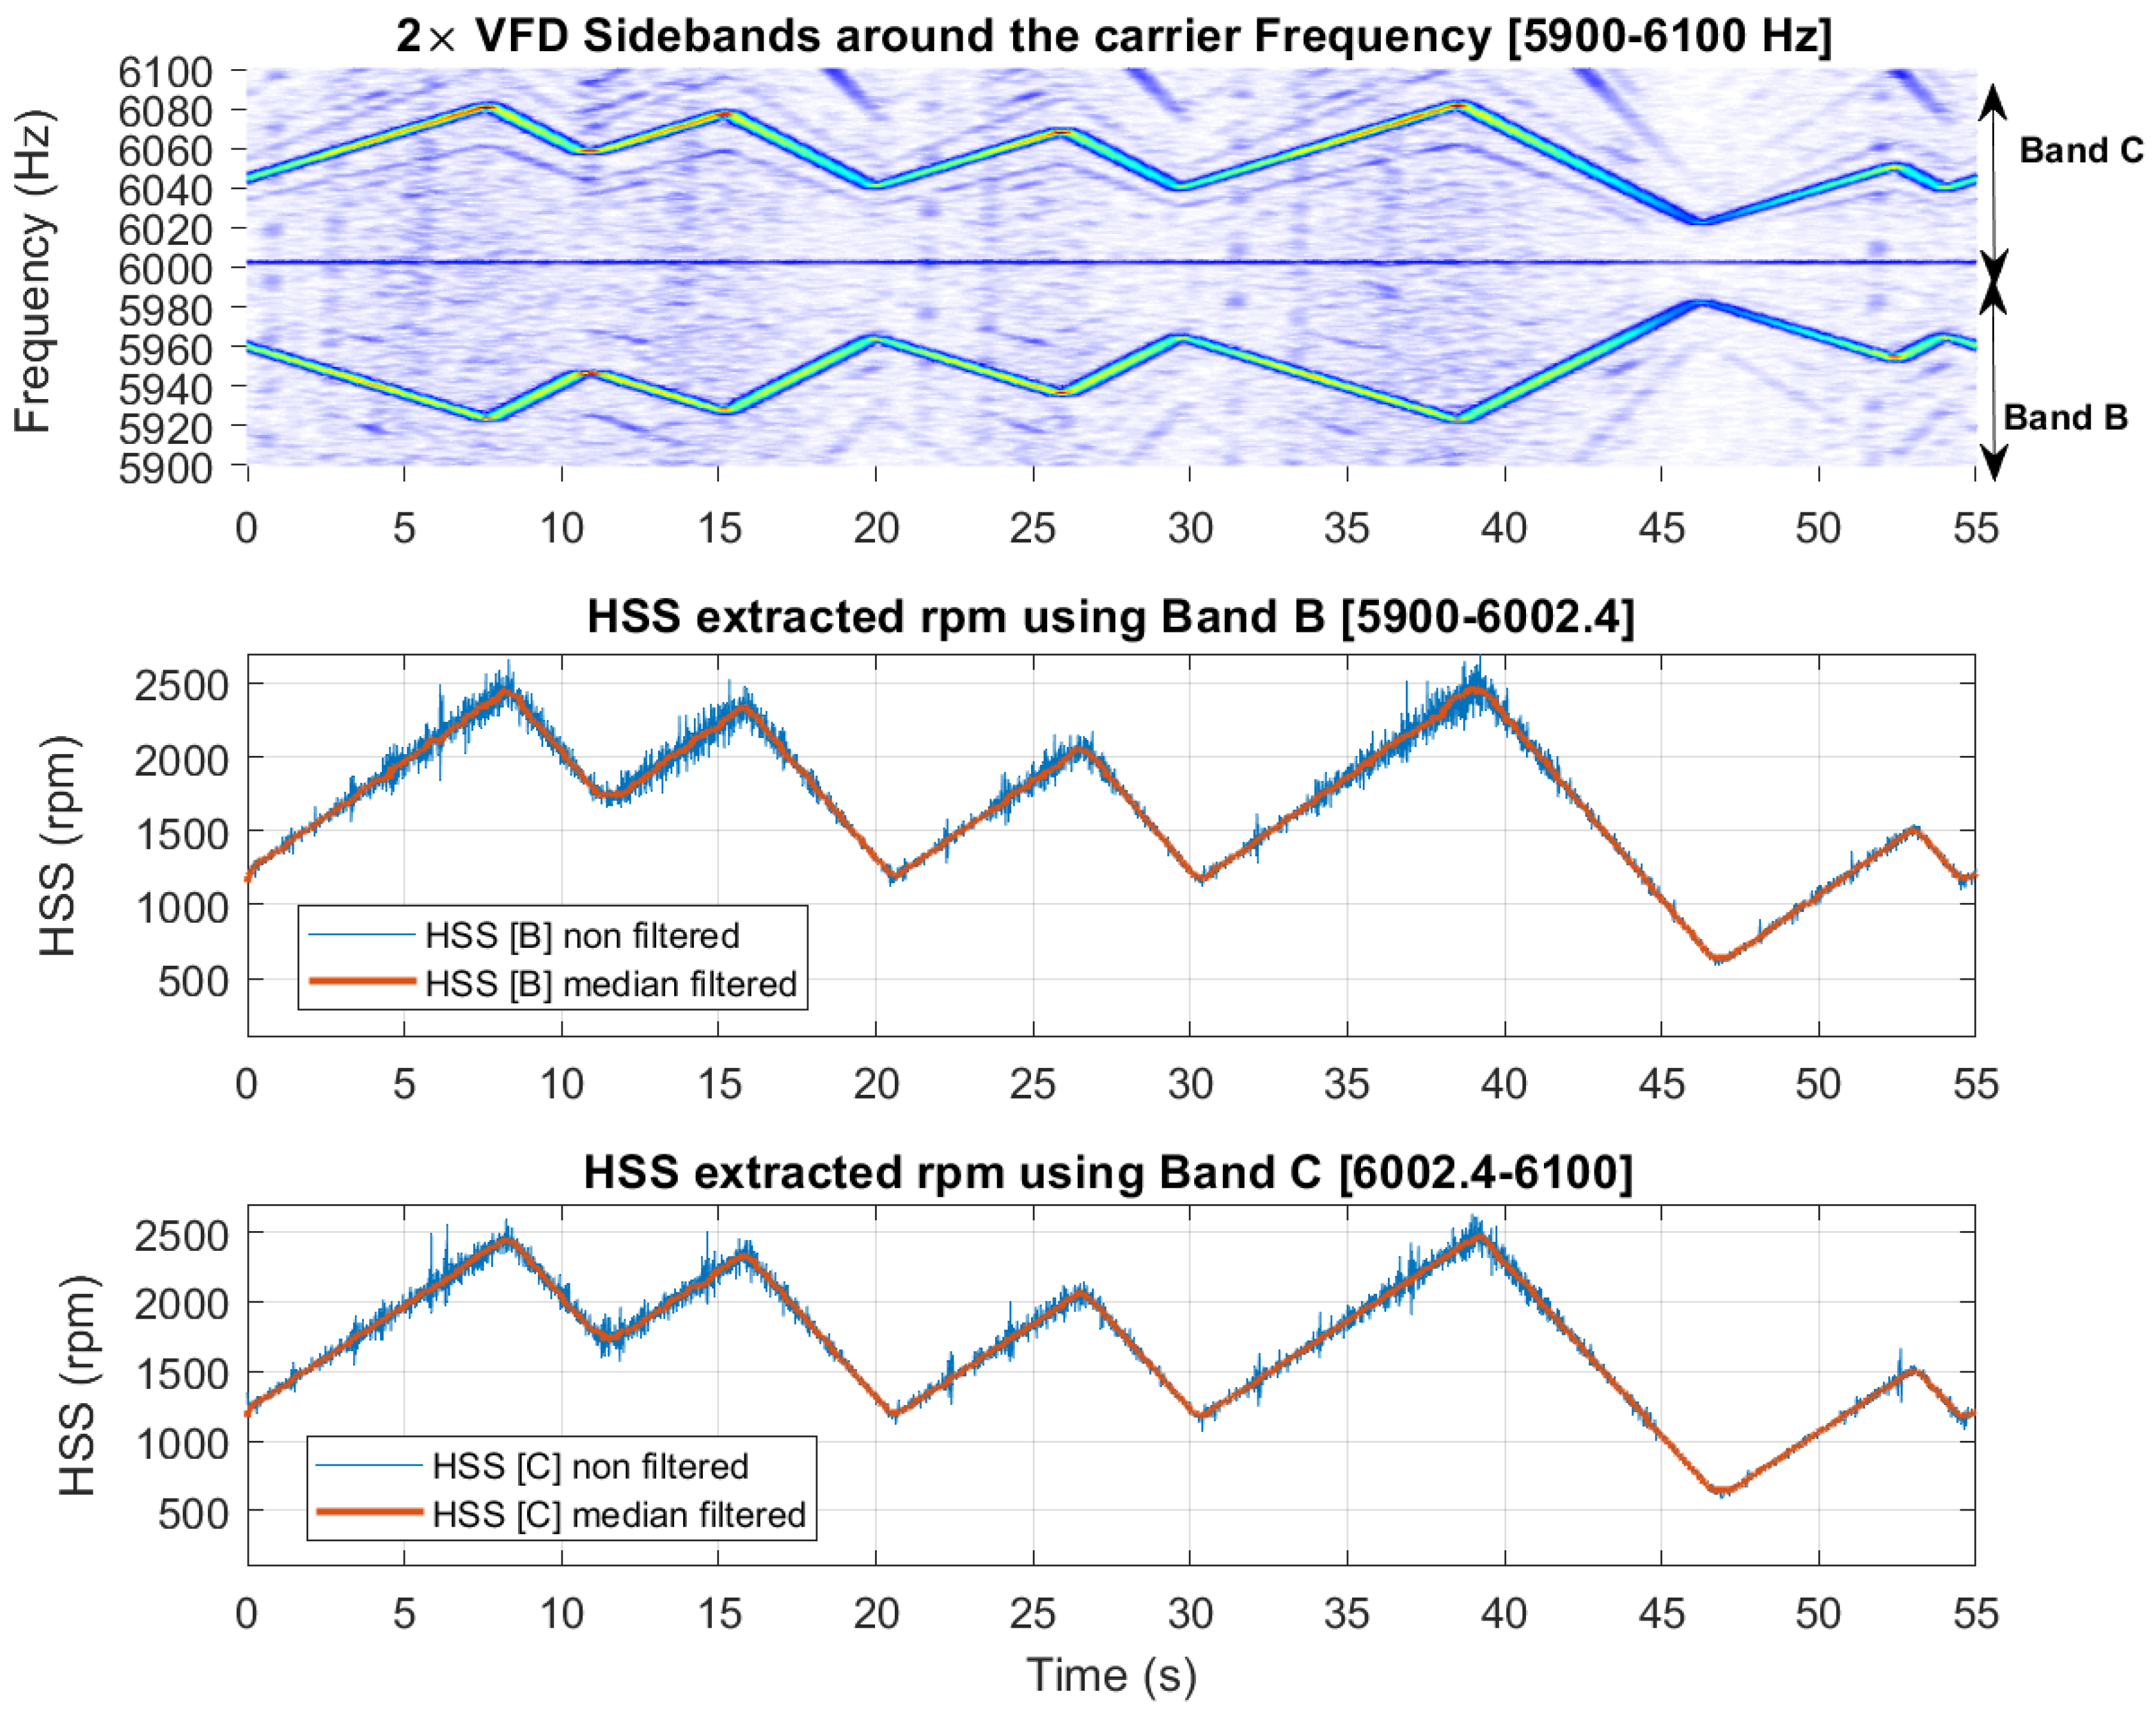
Figure 24.
Outer race fault diagnosis: residual envelope signals and envelope spectra for Bands A, B and C, respectively.
Figure 24.
Outer race fault diagnosis: residual envelope signals and envelope spectra for Bands A, B and C, respectively.
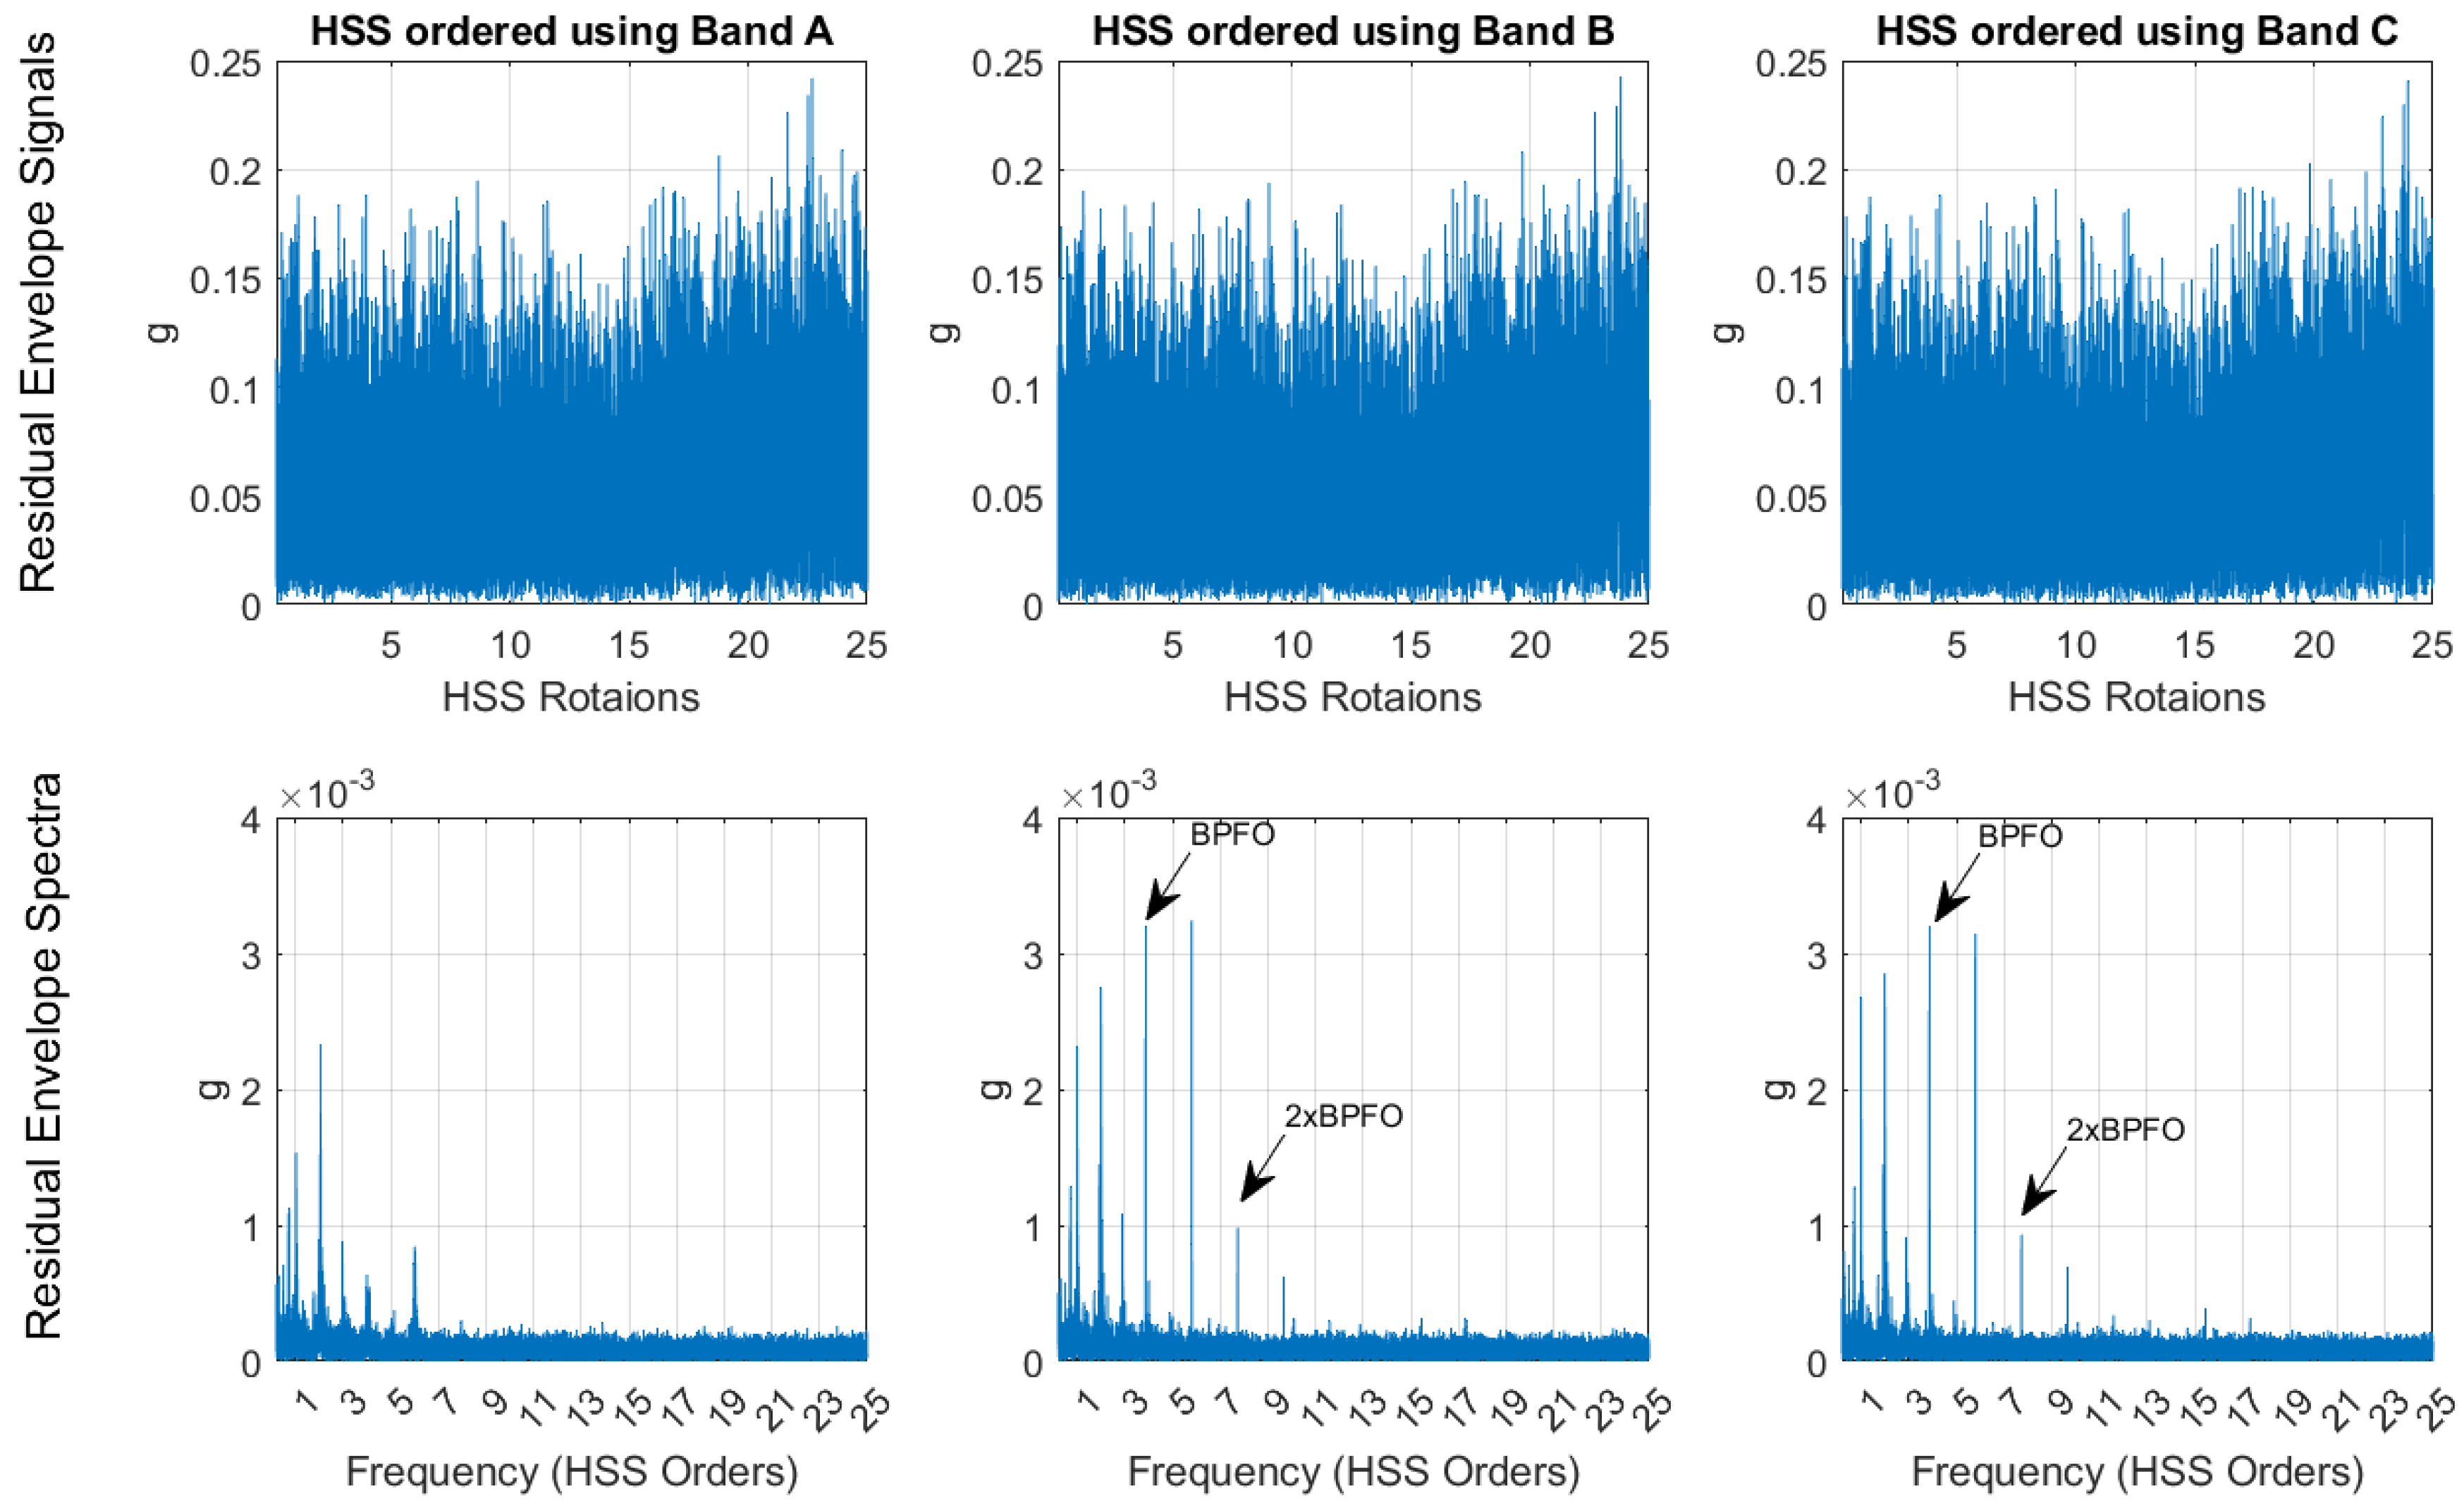

Table 1.
Bearing fault frequencies.
| Bearing Fault frequencies | Orders (× HSS) |
|---|---|
| FTF | 0.40 |
| BPFO | 3.58 |
| BSF | 4.67 |
| BPFI | 5.42 |
Disclaimer/Publisher’s Note: The statements, opinions and data contained in all publications are solely those of the individual author(s) and contributor(s) and not of MDPI and/or the editor(s). MDPI and/or the editor(s) disclaim responsibility for any injury to people or property resulting from any ideas, methods, instructions or products referred to in the content. |
© 2024 by the authors. Licensee MDPI, Basel, Switzerland. This article is an open access article distributed under the terms and conditions of the Creative Commons Attribution (CC BY) license (http://creativecommons.org/licenses/by/4.0/).
Copyright: This open access article is published under a Creative Commons CC BY 4.0 license, which permit the free download, distribution, and reuse, provided that the author and preprint are cited in any reuse.


