Preprint
Article

This version is not peer-reviewed.

Further Development of SAMPDI-3D: Machine Learning Method for Predicting Binding Free Energy Changes Caused by Mutations in Either Protein or DNA

A peer-reviewed article of this preprint also exists.

Submitted:

27 December 2024

Posted:

30 December 2024

You are already at the latest version

Abstract

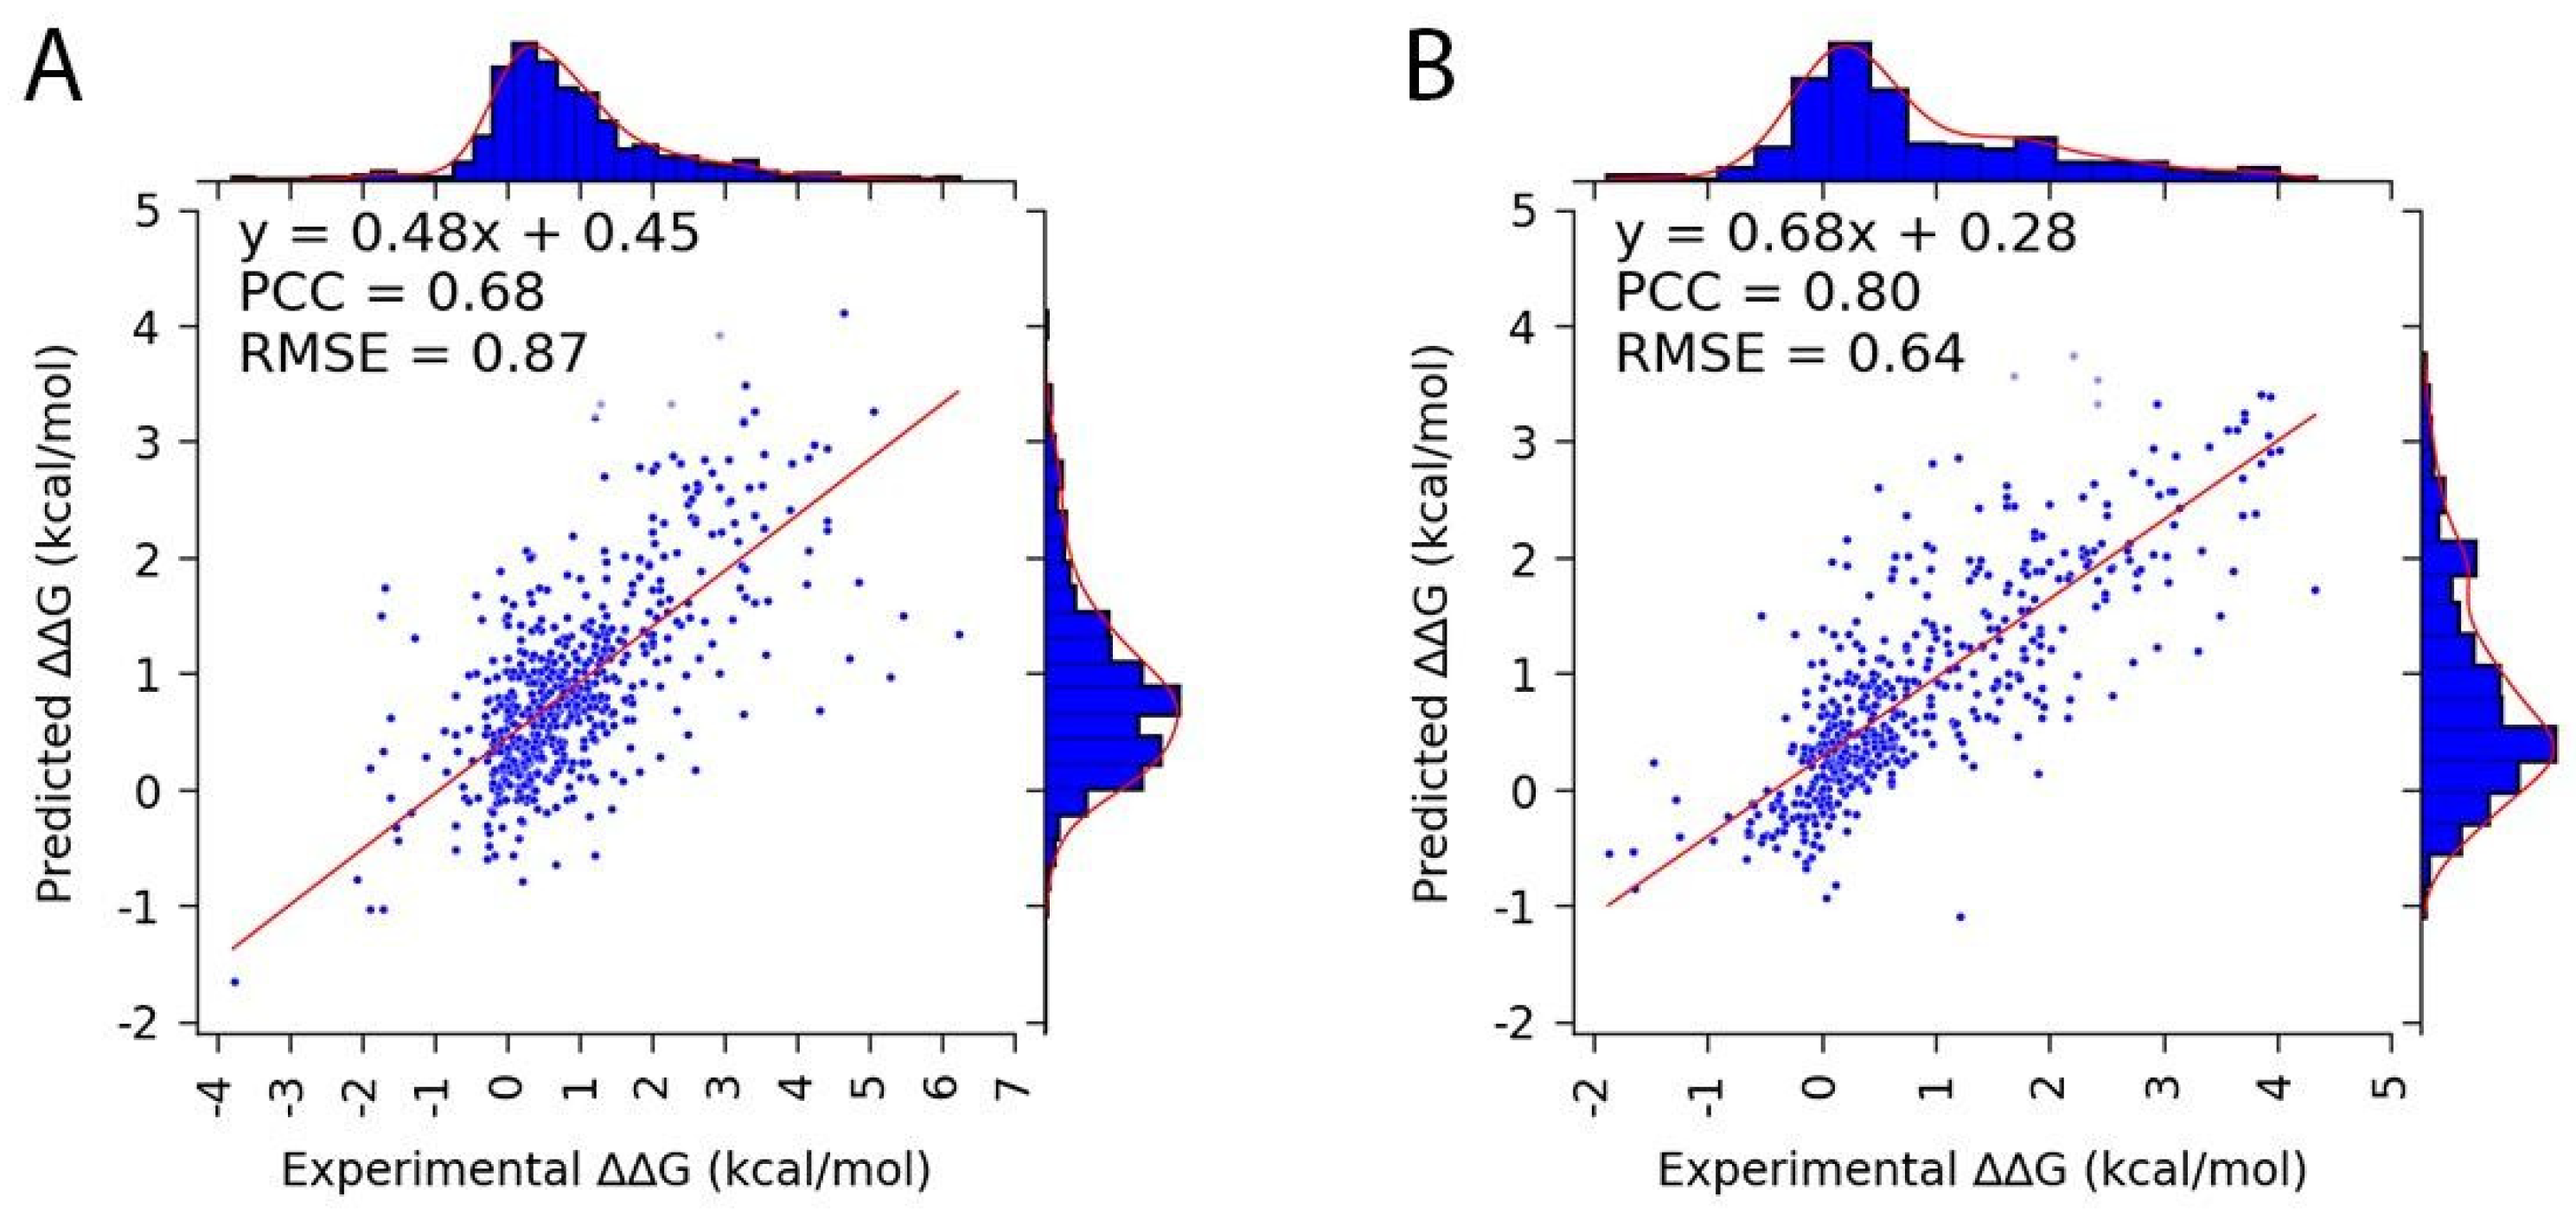
Background/Objectives: Predicting the effects of mutations in proteins and DNA on the binding free energy of protein-DNA complexes is crucial for understanding how DNA variants impact wild-type cellular function. As many cellular interactions involve protein-DNA binding, accurately predicting changes in binding free energy (ΔΔG) is valuable for distinguishing pathogenic mutations from benign ones. Methods: The study describes the further development of the SAMPDI-3D machine learning method, which is trained on an expanded database of experimentally measured ΔΔGs. This enhanced model incorporates new features, including the 3D structure of the mutant protein, structural features of the mutant structure, and a position-specific scoring matrix (PSSM). Benchmarking was conducted using 5-fold cross-validation. Results: The updated SAMPDI-3D model achieves a Pearson Correlation Coefficient (PCC) of 0.68 for mutations in proteins and a PCC of 0.80 for mutations in DNA. These results represent significant improvements over existing tools. Additionally, the method’s rapid execution time enables genome-scale predictions. Conclusions: The advancements in SAMPDI-3D enhance its predictive performance and utility for analyzing mutations in protein-DNA complexes. By leveraging structural information and an expanded training dataset, SAMPDI-3D provides researchers with a more accurate and efficient tool for mutation analysis, contributing to the identification of pathogenic variants and improving our understanding of cellular function.

Keywords: 
;  ;  ;  ;  ;  

1. Introduction

The Regulation of genetic information and integrity of cellular functions is profoundly governed by protein-DNA interactions (PDI) [1,2]. Transcription factors (TF) are a specialized class of proteins that use their DNA-binding domains to bind DNA and regulate gene expression [3]. Cellular processes inside cells, such as transcription, DNA repair, chromatin remodeling, cell cycle control, apoptosis, immune response, and epigenetic regulation, are also regulated by the PDIs [4,5]. In a protein-DNA complex, a point mutation either in the protein (missense mutation) or the cognate DNA impacts the binding affinity and specificity, which is computed as a change of binding free energy, ΔΔG = ΔG(mutant) – ΔG(wild-type), depicting the differences in binding free energy between mutant and wild-type. It has the potential to disrupt the normal function of cells and may cause diseases such as cancer [6], Alzheimer’s [7], cardiovascular disease [8] and neurological disorders [9,10].
Thus, to understand the pathogenic potential and to develop therapeutic strategies, precise quantification of the impact of mutations on PDIs is essential. Numerous experimental methods are available to estimate the impact of mutation on PDIs. Among these, electrophoretic mobility shift assay (EMSA) is one of the widely used methods based on the foundation that the electrophoretic mobility of a free DNA is higher than that of a protein-DNA complex [11]. Due to the higher charge/mass ratio of free DNA [12], it migrates faster through the gel matrix during electrophoresis. These differences in electrophoretic mobility between bound DNA with protein and the free DNA help quantify the dissociation constant (Kd), which serves as a determinant of binding affinity [13,14], with a lower Kd value indicating stronger binding between the protein and DNA. Isothermal titration calorimetry (ITC) is another technique that provides thermodynamic parameters as the binding affinity (Kd), including reaction enthalpy and binding stoichiometry of a protein-DNA complex by titrating a protein solution into a solution of DNA [15,16]. The heat changes associated with each batch of protein solution injection in the titration reaction are then integrated and plotted against the molar ratio of the interacting DNA molecules to generate binding isotherm [17]. This isotherm is subsequently analyzed using non-linear least squares (NLLS) fitting to get the binding affinity (Kd) of the interacting protein and DNA [17]. However, ITC requires a large amount of samples. Surface plasmon resonance (SPR) is a label-free technique for studying protein-DNA interactions which involves immobilizing one of the molecules, such as DNA, on a sensor surface and measuring changes in the refractive index caused by binding events when a solution containing the protein flows over the surface [18,19]. These changes in refractive index then affect the resonance conditions of the surface plasmon wave, leading to a quantifiable shift in the angle at which the light is reflected, producing the SPR signal [20]. This SPR signal is plotted over time, producing a sensorgram demonstrating the interaction’s kinetics and then by analyzing the sensorgram, the association and dissociation rates of protein and DNA allow to calculate the equilibrium dissociation constant (Kd), which reflects the binding affinity of a protein-DNA complex [19]. Nevertheless, this technique also requires large amounts of samples. Ultimately, the aforementioned traditional methods cannot be applied to large-scale investigations because they require large amounts of samples and significant time to deliver the results. In addition to traditional methods, there are high throughput methods to investigate the impacts of mutations on PDIs. For example, protein binding microarrays (PBMs) is a fluorescence-based methods that assess the binding specificities of TFs to interacting DNA [21,22]. It measures the fluorescence intensity, which indicates the amount of TF bound to the DNA and provides the parameter of binding affinity and dissociation constant (Kd). High-throughput systematic evolution of ligands by exponential enrichment (HT-SELEX) is a technique that combines the traditional SELEX with high throughput sequencing to determine the binding specificities of DNA-binding proteins [23] by recognizing preferred DNA-binding motifs of a TF by selecting DNA sequences from a random oligonucleotide library, purifying the protein-DNA complexes, and amplifying the bound DNA through polymerase chain reaction (PCR), which ultimately allows for quantification of the affinity between protein and it’s interacting DNA [23,24]. Recently developed methods determine the relative binding affinity of TFs by integrating EMSA and HT-SELEX data. For example, the no read left behind (NRLB) method [25] employs biophysical methods and statistical models to predict protein-DNA binding affinity from single-round SELEX data. In comparison, another study [26] uses a similar combinatorial of EMSA and HT-SELEX techniques to study the binding mechanism of TFs. Moreover, the binding specificity of a TF is estimated using a method called BEMSER, which utilizes the data obtained from protein-binding microarrays (PBM) [27]. However, the methods mentioned above, such as BEMSER and the approaches that utilize a combination of EMSA and HT-SELEX, still provide essential data regarding protein-DNA binding affinity, but it depends on the techniques such as PBM, EMSA, or HT-SELEX, and the resulting quantification of binding affinity is in relative terms, thus unable to predict ΔΔG [28]. Due to this, to measure the binding affinity of protein-DNA complexes, it is inevitable that one has to rely on traditional experimental methods, which are labor-intensive and expensive for high-throughput measurements [28].
The demand for the quantification of binding affinity data across a genomic scale drives the field toward the development of computational techniques. Our previously developed method, SAMPDI, uses the enhanced MM/PBSA method, combining molecular mechanics energy calculations and continuum solvation models alongside knowledge-based descriptors to predict changes in protein-DNA binding free energy caused by single point protein mutations [29]. However, it lacked the prediction of the impact of DNA mutation. Expanding upon SAMPDI, we also developed SAMPDI-3D employing a gradient-boosting decision tree algorithm by incorporating a wide range of features, including physicochemical properties, structural characteristics of the mutation site, and protein-DNA interactions. This gives it the ability to predict binding free energy changes resulting from both single-point protein and DNA mutations [28]. Other models available are mCSM-NA [30] and mmCSM-NA [31], which are primarily built upon graph-based structural signatures to predict the impact of protein mutation in proteins interacting with DNA/RNA [30,31]. The mCSM-NA method emphasizes single-point missense mutations, depicting protein and nucleic acid structures as a graph while atoms and edges represent nodes reflecting interactions [30]. By altering the graph-based signature of the wild-type residue environment, the mCSM-NA method introduces the desired mutation, consequently introducing changes in pharmacophore modeling and physicochemical properties. Then, it compares the altered graph to the wild-type graph to quantify changes in binding affinity (ΔΔG) [30]. Essentially, mmCSM-NA expands on the same concept as mCSM-NA but can predict the effect of both single and multiple-point mutations, which is built upon the consideration of changes in protein stability, dynamics, non-covalent interactions and residue depth which is an optimized version of graph-based signatures and utilize the similar approach of mCSM-NA to introduce the multiple point-mutations in protein to quantifying the changes of binding affinity [30,31]. PremPDI, another method, utilizes energy minimization and side-chain optimization algorithms to compare the interaction energies of the mutant and wild-type complexes to predict binding free energy changes [32]. A recently developed algorithm named protein-nucleic acid binding affinity change estimator (PNBACE) [33] can predict the binding affinity changes due to point and multiple mutations either in protein or in a nucleic acid (DNA/RNA) in a protein-nucleic acid complex. Decomposing the binding free energy of a complex into pairwise interaction energies between atoms gives an overall energetic landscape of the interactions within the complex. Then, it builds different energy networks from these obtained pairwise interactions and formulates energy-based topological features from them, along with partition-based energy features that depict the energy contribution of different complex segments. These obtained features are then input to train individual machine learning (ML). Subsequently, these individual ML models combined to produce an ensemble model by employing a differential evolution algorithm, which ultimately predicts the impact of binding affinity due to the imposed mutation in the complex [33].
However, these aforementioned computational methods, mCSM-NA [30], mmCSM-NA [31], PremPDI [32], SAMPDI [29], SAMPDI-3D [28] and PNBACE [33] designed to estimate the changes in binding free energies due to mutation in a protein-DNA complex, were developed and trained on small number of cases, This can potentially limit their ability to accurate predict the impact of new mutations, mutations types not available in the training dataset. Furthermore, except SAMPDI-3D and PNBACE, no other methods can predict the effects of mutation in DNA on ΔΔG. However, PNBACE requires high computational time; thus, it cannot be applied to large-scale investigations.
The computational methods mentioned above use a database of mutations in protein or DNA and associated changes in binding free energy (ΔΔG) due to the mutation. These methods learn the relationship between the features and the ΔΔG during the training phase and predict based on learned associations. However, these databases are often very small, limiting the method’s generalizability. Due to this, an increase in the available data requires re-training or even re-evaluation of features used previously to make more accurate predictions. Considering these, we are reporting here a new version of SAMPDI-3D. This method uses an approximately 42% larger dataset for mutations in proteins in PDI cases and a 9% larger dataset for mutations in DNA in PDI cases.
In this new development of our SAMPDI-3D, we trained it on the largest training dataset currently available, introduced new features and improved the performance as indicated by a significantly improved Pearson correlation coefficient (PCC).
We tested SAMPDI-3D and other methods mentioned above on the new entries in ProNAB [34]. However, as shown in the result section, none of them could achieve good performance. This motivated us further to develop SAMPDI-3D on the newly available data points and to add new features to address the outlined limitations.

2. Materials and Methods

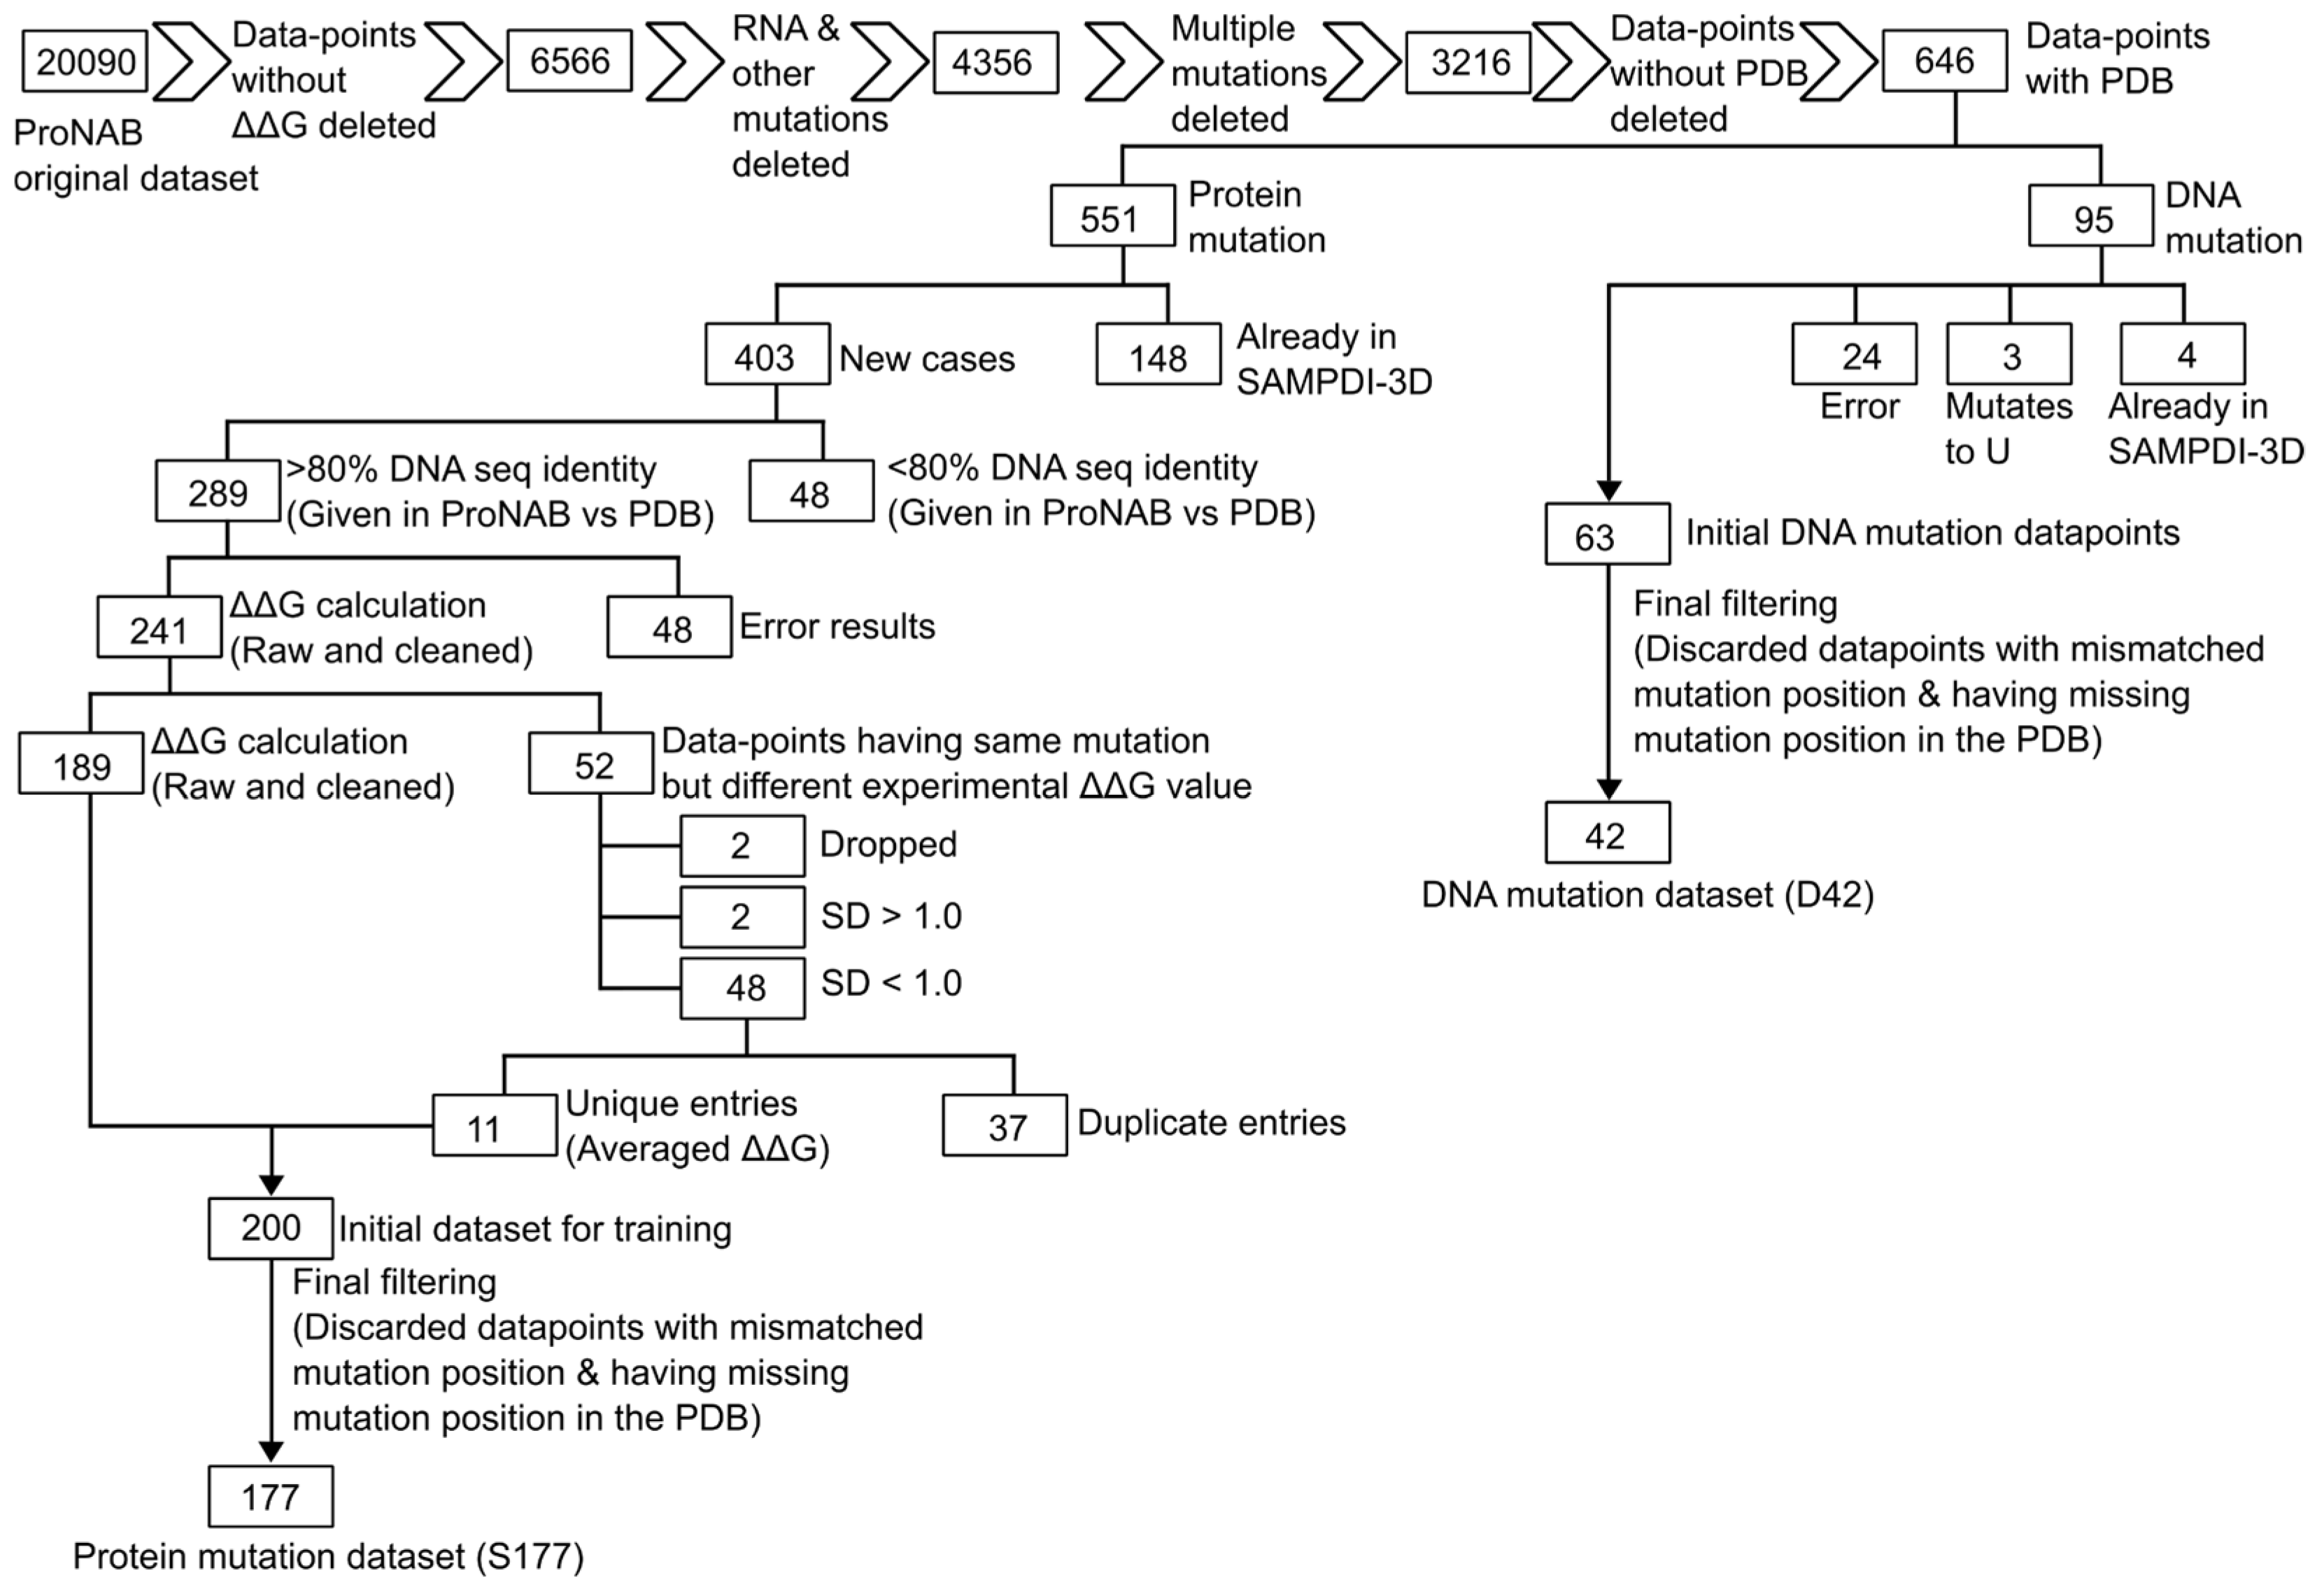
2.1. Data Cleaning (ProNAB)

In the original ProNAB dataset [34], there are 20,090 data points. However, many of these entries cannot be used because of insufficient information or typos. This necessitated extensive manual cleaning of the original database, as outlined in Figure 1. Since our model development requires experimentally measured changes of binding free energy (ΔΔG) upon mutation of either in protein or DNA. Therefore, we deleted entries without ΔΔG value; thus, the original dataset was reduced to 6,661 data points. Next, we excluded data points related to RNA mutations (since SAMPDI-3D is aimed at protein-DNA binding free energy predictions), leaving 4290 data points. Furthermore, we discarded data points where protein and DNA mutations are mentioned simultaneously since we are aiming at single-point mutations only. Thus, the dataset was reduced to 3671. Afterward, entries where binding free energy changes resulted from two or more mutations in a single entry were filtered out, further refining the dataset to 3,216 data points. Moving forward, we deleted entries that lacked the corresponding wildtype PDB ID, resulting in a final set of 646 data points with point mutations in either DNA or protein. Of these, 551 represent protein mutations, and 95 represent DNA mutations.
Among 551 protein mutations, we identified 148 overlapping protein mutations with our previous SAMPDI-3D training dataset S419, leaving us with 403 new protein mutation cases taken from ProNAB. For protein mutation cases, ProNAB also provided the cognate DNA sequence information. For a given mutation, we extracted the DNA sequence from the corresponding PDB file and performed pairwise sequence alignment using CLUSTAL Omega [35] between the DNA sequences given in ProNAB and the corresponding PDB files. Upon sequence alignment, we discarded data points where sequence identity was less than 80%, yielding 289 protein mutation data points with high DNA sequence identity (>80%) between the ProNAB and DNA sequences in the PDB file.
In some cases, multiple copies of protein and DNA sequences are present in a PDB file. For example, a protein chain may be labeled as A, where the mutation is located, with DNA chains labeled as B and C. However, frequently, there are several copies of the protein and the binding DNA due to crystallization and structure-solving artifacts. However, the binding free energy measurements are representative of the biological assembly of the complex. Therefore, we cleaned the PDB structure to keep only a single copy of the protein-DNA complex and called it cleaned PDB. The cleaned PDBs were generated from the original PDBs by keeping only a single copy of interacting chains of protein and DNA using UCSF Chimera [36]. Two polymer (protein/DNA) chains are considered interacting when one or more pairs of atoms from two are within a distance threshold of 5.0 Å. Henceforth, the cleaned PDBs are utilized in the work. Furthermore, among these 289 protein mutation data points, PDB files associated with 48 are very low-resolution structures and have only alpha carbons of the protein backbone, preventing secondary structure determination and, in turn, ΔΔG prediction. So, we discarded these data points with structural issues, and we were left with 241 protein mutation data points.
Among the 241 remaining protein mutation data points, we identified 52 cases where the same mutation had different ΔΔG values. For example, mutation R52S in PDB 1AAY had three different ΔΔG values, which leaves us with 189 data points. So, for these 52 data points, we categorized them based on the standard deviation of their corresponding multiple ΔΔG for the same mutation. Upon calculation of the standard deviation (SD), we removed two data points where SD is greater than one kcal/mol, as well as two additional points with high ΔΔG values. So, we remain with 48 data points having SD less than one kcal/mol and for them, we averaged their ΔΔG values, resulting in 11 unique data points. By merging these 11 unique data points with the remaining 189, we arrived at 200 new protein mutation data sets. However, we again made a careful observation and found that, out of these 200 data points, 11 cases for a particular PDB (1LMB chain 3) had residue mismatched in PDB as well as another 12 cases again overlapped with our old SAMPDI-3D protein mutation dataset S419; thus, we discarded them and ended up final 177 new data points of protein mutation, and we named this dataset S177 Including the dataset S419, consisting 419 point mutations in protein from our previous version of SAMPDI-3D [28], we have a dataset of 596 point mutations in protein which we call S596, henceforth.
Regarding DNA mutations, initially, we had 95 DNA mutation data points. We found that four of these data points were already present in our previous SAMPDI-3D D463 DNA mutation dataset, while three mutations were related to the base U, indicating RNA rather than DNA mutations. Additionally, 34 data points had issues with the PDB components (e.g., missing residues), and they were removed, resulting in 63 DNA mutation data points. Upon further observation, 21 cases failed for reasons such as wild-type base mismatch at the mutation site or the mutation site itself missing in the associated PDB. Finally, after data cleaning, 42 new DNA mutation entries were found, which we named the D42 dataset. Additionally, we had 460 data points from the D463 dataset compiled in our previous version of SAMPDI-3D; here, three mutation sites were found missing in PDB and were thus ignored. Merging the dataset of 460 (old) and 42 new single base/base-pair mutations in DNA, we created a dataset consisting of 502 data points called the D502 dataset henceforth.
These cleaned datasets, S177 and D42, can be downloaded from http://compbio.clemson.edu/SAMPDI-3Dv2/.

2.2. Training Dataset for Protein Mutations

In our previous version of SAMPDI-3D, the S419 dataset was used for training and testing of ΔΔG caused by protein mutation. It consists of 419 single mutations in 96 proteins. This dataset was prepared by merging the datasets S219 and S200 taken from PremPDI [32] and a literature search [28]. It is mentioned that data in S219 originally came from ProNIT [37] and dbAMEPNI [38]. In contrast, data in S200 originally came from literature at the time of SAMPDI-3D development, which was not included in the ProNIT database.
Now, in our recent development of SAMPDI-3D v2 in 2024, we curated protein mutation data from the ProNAB [34] database, which was cleaned by following the aforementioned ProNAB data cleaning process. We included 177 (termed as S177) new single protein mutation data points with our previous data 419 protein mutation data points termed S419, which resulted in 596 combined protein mutation data points, and the final dataset was S596.

2.3. Training Dataset for DNA Mutations

For the previous version of SAMPDI-3D, the D463 dataset was constructed as the training dataset for DNA mutations. The data came from ProNIT and the literature available at the time of the publication of the previous version. For the mutations in DNA, our training set combined the ProNIT database and data from recent literature. It comprises 245 single mismatches and 218 single base-pair substitutions, a total of 463 mutations in 30 proteins with quantitatively characterized ΔΔGs. Among them, 123 were taken from the ProNIT database. This dataset is termed D463.
For the development of our SAMPDI-3D v2, we looked into the D463 dataset (ref our paper) and found that three of the PDBs did not have mutation position - thus, we eliminated these and constructed D460 modified DNA mutation dataset from SAMPDI-3D. After several stages of cleaning ProNAB, we ended up with 42 DNA mutation data points and created a new DNA mutation dataset called D42. Thus, the modified previous DNA mutation dataset from SAMPDI-3D (D460) and recently curated DNA mutation dataset from ProNAB combined made the new DNA mutation for our SAMPDI-3D v2, termed D502.

2.4. Key Features in SAMPDI-3D v2 Machine Learning Model

2.4.1. Protein Mutation

A wide range of features is used to develop a machine-learning model predicting binding free energy changes in protein-DNA complexes caused by single amino acid mutations. These include evolutionary preferences (point I), physicochemical properties (points II and III), structural features (points IV, V and VI), secondary structure preferences (point VII), protein-DNA interaction features (point VIII), and mutation-induced interaction perturbations (point IX). The definitions and calculations of these features are as follows:
(I) Position-specific scoring matrix
The protein sequence is derived from the input protein-DNA complex structure. Initially, residues are identified from the coordinate records and complemented with missing residues listed in the “REMARK 465” record in the PDB header. These sets of residues are merged and aligned with the “SEQRES” record to ensure consistency. Any non-standard residues identified using the “MODRES” record are reverted to their corresponding standard residues. Expression tag residues, parsed from the “SEQADV” record, are excluded. Finally, residues are mapped to their one-letter codes, and the protein sequence is saved in a FASTA format.
The cleaned protein sequence is queried against the UniRef50 database [39] using PSI-BLAST (v2.10.0) [40] with default parameters for three iterations to identify homologous sequences. This generates a PSSM matrix, which is written as an ASCII text file. The matrix dimensions are n×20, where n is the sequence length, and the 20 columns represent the standard amino acids.
From the PSSM matrix, the following features are derived:
(a) Evolutionary sequence composition features: For each of the 20 amino acids, a vector of normalized odds ratios across all positions in the sequence is computed using f(x) = 1 / (1 + e-x). The mean of these normalized odds ratios for each amino acid serves as a feature, capturing its sequence composition preference.
(b) Evolutionary odds of the mutation. Calculated as the difference in odds ratios between the mutant and wild-type residues at the mutation site.
(II) Mutation type related Features
Net volume: The change in residue volume due to the mutation is computed as the difference in molar volumes of the mutant and wild-type residues.
Net hydrophobicity: The hydrophobicity difference between mutant and wild-type residues derived from Moon’s hydrophobicity index [41].
Net flexibility: The change in rotamer counts, calculated as the logarithmic difference between the rotamers of mutant and wild-type residues using data from the Dunbrack rotamer library [42].
(III) Amino acid category features
Mutation hydropathy class: It is a categorical feature for which the twenty standard amino acids are grouped into three classes with Glycine (G), Histidine (H), Proline (P), Serine (S), Threonine (T), and Tyrosine (Y) as hydropathically neutral; Aspartate (D), Glutamate (E), Lysine (K), Asparagine (N), Glutamine (Q), and Arginine (R) as hydrophilic; and Alanine (A), Cysteine (C), Phenylalanine (F), Isoleucine (I), Leucine (L), Methionine (M), Valine (V), and Tryptophan (W) as hydrophobic [43]. Further, based on classes of wild-type and mutated amino acid, a unique label is calculated as HCI(wild-type) × 3 + HCI(mutant), where HCI(x) gives the hydrophobicity-class-index of the amino acid x. Thus, this feature maps all possible 20 × 20 combinations of wild-type and mutant amino acids to nine (3 × 3) different labels.
Mutation polarity class: It is a categorical feature for which the twenty standard amino acids are grouped into four classes with Alanine (A), Cysteine (C), Phenylalanine (F), Isoleucine (I), Leucine (L), Methionine (M), Valine (V), Tryptophan (W), Glycine (G), and Proline (P) as nonpolar; Aspartate (D) and Glutamate (E) as polar-acidic; Lysine (K), Arginine (R), and Histidine (H) as polar-basic; and Asparagine (N), Glutamine (Q), Serine (S), Threonine (T), and Tyrosine (Y) as polar-neutral [43]. Further, based on classes of wild-type and mutated amino acids, a unique label is calculated as PCI(wild-type) × 4 + PCI(mutant), where PCI(x) gives the polarity-class index of the amino acid x. Thus, this feature maps all possible 20 x 20 combinations of wild-type and mutant amino acids to sixteen (4×4) different labels.
Mutation size class: It is a categorical feature for which the twenty standard amino acids are grouped into five classes with Alanine (A), Glycine (G), and Serine (S) as very-small; Cysteine (C), Proline (P), Aspartate (D), Asparagine (N), and Threonine (T) as small; Valine (V), Glutamate (E), Histidine (H), and Glutamine (Q) as medium; Isoleucine (I), Leucine (L), Methionine (M), Lysine (K), and Arginine (R) as large; and Phenylalanine (F), Tryptophan (W), and Tyrosine (Y) as very-large [43]. Further, based on classes of wild-type and mutated amino acids, a unique label is calculated as AASCI(wild-type) × 5 + AASCI(mutant), where AASCI(x) gives the Amino acid size-class index of the amino acid x. Thus, this feature uses twenty-five (5×5) different labels covering all possible 20 × 20 combinations of wild-type and mutant amino acids.
Mutation hydrogen-bonding class: It is a categorical feature for which the twenty standard amino acids are grouped into four classes with Isoleucine (I), Leucine (L), Methionine (M), Valine (V), Cysteine (C), Proline (P), Phenylalanine (F), Alanine (A), and Glycine (G) as non-hydrogen-bonding; Lysine (K), Arginine (R), and Tryptophan (W) as hydrogen-bond donors; Histidine (H), Glutamine (Q), Asparagine (N), Threonine (T), Tyrosine (Y), and Serine (S) as hydrogen-bond donor-acceptors; and Glutamate (E) and Aspartate (D) as hydrogen-bond acceptors [43]. Further, based on classes of wild-type and mutated amino acids, a unique label calculated as HBCI(wild-type) × 4 + HBCI(mutant), where HBCI(X) gives the hydrogen-bonding-class-index of the amino acid X. Thus, this features uses a total of sixteen (4×4) different labels covering all possible 20 × 20 combinations of wild-type and mutant amino acids.
Mutation chemical-type class: It is a categorical feature for which the twenty standard amino acids are grouped into seven classes based on the chemical type of the sidechain with Lysine (K), Arginine (R), and Histidine (H) as basic; Glutamine (Q) and Asparagine (N) as amide; Aspartate (D) and Glutamate (E) as acidic; Methionine (M) and Cysteine (C) as sulfur-containing; Serine (S) and Threonine (T) as hydroxyl; Tryptophan (W), Tyrosine (Y), and Phenylalanine (F) as aromatic; and Isoleucine (I), Leucine (L), Valine (V), Proline (P), and Alanine (A), Glycine (G) as aliphatic. Further, based on classes of wild-type and mutated amino acids, a unique label is calculated as CTCI(wild-type) × 7 + CTCI(mutant), where CTCI(x) gives the chemical-type-class index of the amino acid x. Thus, this feature uses forty-nine (7×7) different labels covering all possible 20 × 20 combinations of wild-type and mutant amino acids.
Mutation type class: It is a categorical feature that uses four hundred different labels for all possible combinations of twenty standard wild-type and mutant amino acids.
(IV) Accessibility of the mutation site
The accessibility of the mutation site is calculated using mkdssp (v2.0.4) [44,45] from the wild-type protein-DNA complex structure.
(V) Accessibility changes due to mutation
The accessibility of the mutation site for wild-type (accwild-type) and mutant (accmutant) are calculated using mkdssp (v2.0.4) from the wild-type protein-DNA complex structure and modeled structure of the mutated protein-DNA complex, respectively. Then, the accessibility change (delta_acc) is calculated as accwild-type – accmutant.
(VI) Backbone torsion angles of the mutation site: Two features corresponding to backbone torsions, Φ and Ψ for the mutation site, calculated using mkdssp (v2.0.4) for the protein-DNA complex structure, are included.
(VII) Protein secondary structure composition. The seven-class secondary structure for each protein residue in the protein-DNA complex is predicted using mkdssp (v2.0.4), and the ratio of counts of amino acids adopting a given secondary structure to the total number of residues in the protein structure is calculated. In our dataset, the ratio for pi-helix was zero in all mutation cases. Thus, it was discarded, leaving a list of ratios of six secondary structures: alpha-helix, isolated beta-bridge, extended bridge participating in beta-ladder, 310-helix, hydrogen-bonded turn, and bend.
(VIII) Protein-DNA contact features
The protein-DNA wild-type complex structure is analyzed using the snap program of the x3dna-dssr (v2.4.5) [46], and the following four total interactions are extracted from the output and are used as four features.
(a)
Nucleotide Amino Acid contacts: Total number of interactions between the protein and the DNA.
(b)
Base amino acid hydrogen-bonds: Total number of hydrogen-bonds nucleotide bases in the DNA and protein residues.
(c)
Phosphate amino acid hydrogen bonds: Total number of hydrogen bonds between nucleotide phosphate and protein residues.
(d)
Base amino acid stacks: Total number of stacks identified in the protein-DNA complex structure between the nucleotide bases and protein residues.
(IX) Changes in Protein-DNA contacts due to mutation
To calculate these features, we needed the mutated protein-DNA complex structure with a single amino acid mutation in the protein. To model a mutated protein-DNA complex structure. First, a mutated protein structure is modeled using the wild-type protein structure extracted from the complex. We have used Scwrl4 (v4.0.2) [47] side chain modeling tool for this purpose. Scwrl4 (v4.0.2) requires the input protein structure to have only standard amino acids with complete backbone for each residue. To meet these requirements, the extracted protein structure is cleaned by purging residues with incomplete backbone, followed by renaming the non-standard amino acids to their parent standard amino acids and listing corresponding atoms with “ATOM” record if they are listed with “HETATM” in the extracted protein structure. Afterward, using Scwrl4 (v4.0.2), the side chains of non-standard to reverted standard amino acid residues are regenerated to yield a cleaned wild-type protein structure. Secondly, the cleaned wild-type protein structure is superposed to the input protein-DNA complex over the common backbone atoms in the protein in the two structures. All the non-protein atoms are copied to the cleaned wild-type protein structure to result in a cleaned wild-type protein-DNA complex. Similarly, the single amino acid mutant protein structures are modeled using Scwrl4 (v4.0.2), and the complex structure is compiled after superposition as described earlier.
The protein-DNA wild-type complex structure and mutated protein-DNA model structures are analyzed using the snap program of the x3dna-dssr (v2.4.5), and the following four total interactions are extracted from the output for both wild-type and mutation cases and the difference between the wild-type and mutant are used as four delta features.
(a) Delta Nucleotide Amino Acid contacts: Total change in number of interactions between the protein and the DNA due to mutation.
(b) Delta Base amino acid hydrogen-bonds: Total change in number of hydrogen-bond nucleotide bases in the DNA and protein residues due to mutation.
(c) Delta Phosphate amino acid hydrogen bonds: Total change in the number of hydrogen bonds between nucleotide phosphate and protein residues due to mutation.
(d) Delta Base amino acid stacks: Total change in number of stacks identified in the protein-DNA complex structure between the nucleotide bases and protein residues due to mutation.

2.4.2. DNA Mutation

The features, according to their characteristics associated with protein-DNA interaction, are grouped and described below. These features are used to develop the model for predicting the free energy change due to the mutation in the DNA base pair in the protein-DNA complex.
(I) Protein structure features: The protein secondary structure ratios defined and calculated as described in section 2.4.1 – point (VII) are also used for predicting binding free energy change due to DNA base pair mutations.
(II) DNA structural feature of the mutation site: There are 18 features related to the DNA base pair structure at the mutation site, including six base-pairing parameters (shear, stretch, stagger, buckle, propeller, and opening), six base-pair step parameters (shift, slide, rise, tilt, roll and twist), six base-pair helicity parameters (x-displacement, y-displacement, helical rise, inclination, tip, and helical twist) are calculated using x3dna-dssr (v2.4.5) for the wild-type protein-DNA complex structure. The variations in these parameters impact the base-pairing strength at the DNA mutation site, affecting protein-DNA binding strength. However, these parameters are defined for only double-stranded DNA. For protein-DNA complexes consisting of single-stranded DNA, all of these 18 features are assigned a zero value.
(III) DNA Mutation categorical features
(a) Base pair type: The base pairs are grouped into two classes, with AT and TA into pairs bonded with two hydrogen bonds and GC and CG bonded with three hydrogen bonds. Two labels are zero for AT or TA and one for GC or CG pair. This feature encodes the type of wild-type base pair.
(b) Wild or mutation base-pair mismatch: This feature encodes the matched/mismatched base-pair status of wild and mutation base pairs. If both wild-type base-pair and mutant base-pair match, i.e., belong to set AT, TA, CG or GC, then use a label zero; otherwise, use label one.
(c) Mutation base-pair category: This categorical feature uses 256, i.e., 16×16 different labels to encode the wild-type to mutation base-pairs; note there are 16 possible base-pairs of four nucleotides. These 16 base pairs are assigned 16 distinct indices from zero to fifteen. The wild-type base-pair/mutation base-pair label index is calculated as BPI(wild-type base-pair) × 16 + BPI(mutation base-pair), where BPI(XY) represents the base-pair index of XY.
(IV) Protein-DNA interaction features: The four features capturing the number of protein-DNA contacts and hydrogen bonds as defined and calculated as described in section 2.4.1 – point (VIII) for the wild-type protein-DNA structure are also used. Note these features account for contacts between any DNA base pairs and any protein residue in the protein-DNA complex structure.
(V) Protein-mutation site forward strand base interaction features: These four features consider only contacts and hydrogen bond features defined in section 2.4.1 – point (VIII), but involving only the forward strand DNA base at the mutation site and any protein residue in the protein-DNA complex structure.
A categorization of features used for predicting the binding free energy change due to mutations of a single amino acid in protein and single base/base-pair in DNA are provided in Supplementary Material Table S1 and S2, respectively.

2.5. Machine Learning Model Training

The complete set of features described in section 2.4, along with the target variable, the binding free energy change (ΔΔG), forms the training dataset for the machine learning training, testing, and model development processes. Two distinct datasets, comprising mutations in protein and DNA within the complexes, referred to as S596 and D502, respectively, will be trained independently. This approach will result in development of two separate models tailored to these specific cases.
A critical objective in developing any machine learning model is to avoid overfitting or underfitting. To address this, the dataset is partitioned into multiple folds, utilizing a technique known as k-fold cross-validation. In this method, the dataset is divided into k equal-sized subsets (or folds), where k-1 folds are used for training, and the remaining fold is reserved for cross-validation. The process is iterated k times, ensuring that each fold is used for training and testing. Model performance is evaluated during each iteration using metrics such as the Pearson correlation coefficient (PCC) and root mean square error (RMSE). This systematic approach ensures robust model evaluation and minimizes the risk of overfitting, contributing to reliable predictive performance.

2.6. Selecting the Optimal Machine Learning Approach Using PyCaret

Predicting a continuous numerical variable, the change in binding free energy (ΔΔG), necessitates using regression-based machine learning methods. The AutoML functionality of the PyCaret [48] library facilitates a quick and preliminary assessment of the performance of various regression algorithms on the training dataset. This approach ensures a streamlined and efficient evaluation process by leveraging default hyperparameters and an automated training pipeline. The protein and DNA mutation datasets, along with their respective feature sets, were trained using 5-fold cross-validation. The performance metrics for the top 10 regression algorithms, ranked by their predictive accuracy, are summarized in Table 1 and Table 2, corresponding to the protein and DNA mutation datasets, respectively.

2.7. Hyperparameter Tuning and Advanced Model Training

Following the preliminary results from AutoML, the top seven models, ranked based on the Pearson correlation coefficient (PCC) between experimental and predicted ΔΔG values, were selected for further training with extensive hyperparameter tuning. Hyperparameters, pre-determined parameters governing how a model learns and operates during training, are critical in preventing overfitting or underfitting. To optimize the models, a comprehensive dictionary of potential hyperparameter values was constructed. Each model underwent rigorous training involving 1,000 iterations of 5-fold cross-validation. During each iteration, a unique combination of hyperparameters was randomly sampled from the dictionary, enabling the identification of the optimal hyperparameter set for which PCC between the actual and predicted values are maximum.
The performance metrics for the best-performing iterations of all seven algorithms applied to the protein and DNA mutation datasets are summarized in Table 3 and Table 4, respectively. Extreme Gradient Boosting (XGBoost) achieved Pearson correlation coefficients (PCC) of 0.67 and 0.78 for the protein and DNA mutation datasets, respectively. The hyperparameters corresponding to these best-performing iterations will be utilized in subsequent study phases.
Based on these results, Extreme Gradient Boosting (XGBoost) [49] was selected as the regressor model for further analysis due to its superior performance in predicting ΔΔG values across both datasets. XGBoost is an advanced implementation of gradient-boosted decision trees. It is known for its efficiency, scalability, and ability to balance computational speed with high predictive accuracy, making it ideal for handling large and complex datasets.

3. Results

3.1. Dataset (Protein Mutations) Comparison of SAMPDI-3D and Newly Curated Dataset from ProNAB

S419 is the protein mutation dataset we obtained from our SAMPDI-3D training dataset, while S177 is a newly curated protein mutation dataset compiled from ProNAB. We followed the staged filtering method while curating the S177 dataset mentioned in the data cleaning section. We compared the mutated residue counts and percentages (Table 5) between our SAMPDI-3D training dataset S419 and the newly created S177 dataset.
The comparison of mutated amino acid residues between the S419 and S177 datasets marks clear differences in the types and frequencies of amino acid mutations (Table 5). This motivates us to carefully design features for machine learning model development. Alanine (A) mutations are common in both datasets. However, S419 has a higher frequency (70.64%) than S177 (61.02%). Cysteine (C) mutations are present in S419 (1.43%) but not S177. The S177 has a higher frequency of aspartic acid (D) and glutamic acid (E) mutations, with glutamic acid mutations accounting for 7.34% against 1.43% in S419.
Methionine (M) mutations occur more frequently in S177 (3.95%) than in S419 (1.43%). Glycine (G) and proline (P) mutations are more common in S177, whereas histidine (H) mutations are more common in S419 (1.43%) than S177 (0.56%). S419 contains mutations in isoleucine (I), tryptophan (W), and tyrosine (Y), but S177 does not (Table 5).
Other amino acids, including Phenylalanine (F), Lysine (K), Leucine (L), Asparagine (N), Glutamine (Q), Arginine (R), Serine (S), Threonine (T), and Valine (V), have generally similar frequencies in the two datasets, with some slight changes. Overall, S419 has a higher percentage of Alanine and Histidine mutations, whereas S177 has more diversity, with higher frequencies of Glutamic acid, Glycine, Methionine, and other alterations, illustrating the differences between the datasets’ mutation profiles.
For a consolidated quantitative comparison of the diversity (representativeness) of the two datasets, S419 and S177, we computed the Shannon entropy based on the probability of each of the 20 mutating amino acids. Shannon entropy is calculated as H   =   Σ a     a m i n o   a c i d s   p a l n ( p a ) , where p a is the probability of a particular amino acid a . Note that a higher Shannon entropy implies greater diversity or closeness to the distribution being equiprobable as information is more evenly distributed across categories. The Shannon entropy for the S419 is 1.432 nats, while for S177, it is 1.663 nats, indicating a greater diversity in S177. To provide context for these values, the maximum entropy—achieved when all twenty amino acids are equally represented in the dataset—is 2.996 nats.
Overall, the S419 dataset, taken from our SAMPDI-3D training data, has a high proportion of Alanine mutations (70.64%), and overall lower diversity / representativeness, indicating a different mutation profile. In comparison, the recently curated S177 dataset from ProNAB exhibits increased diversity, including substantial Glutamic acid, Glycine, and Methionine variants, providing a larger mutation spectrum for investigation.

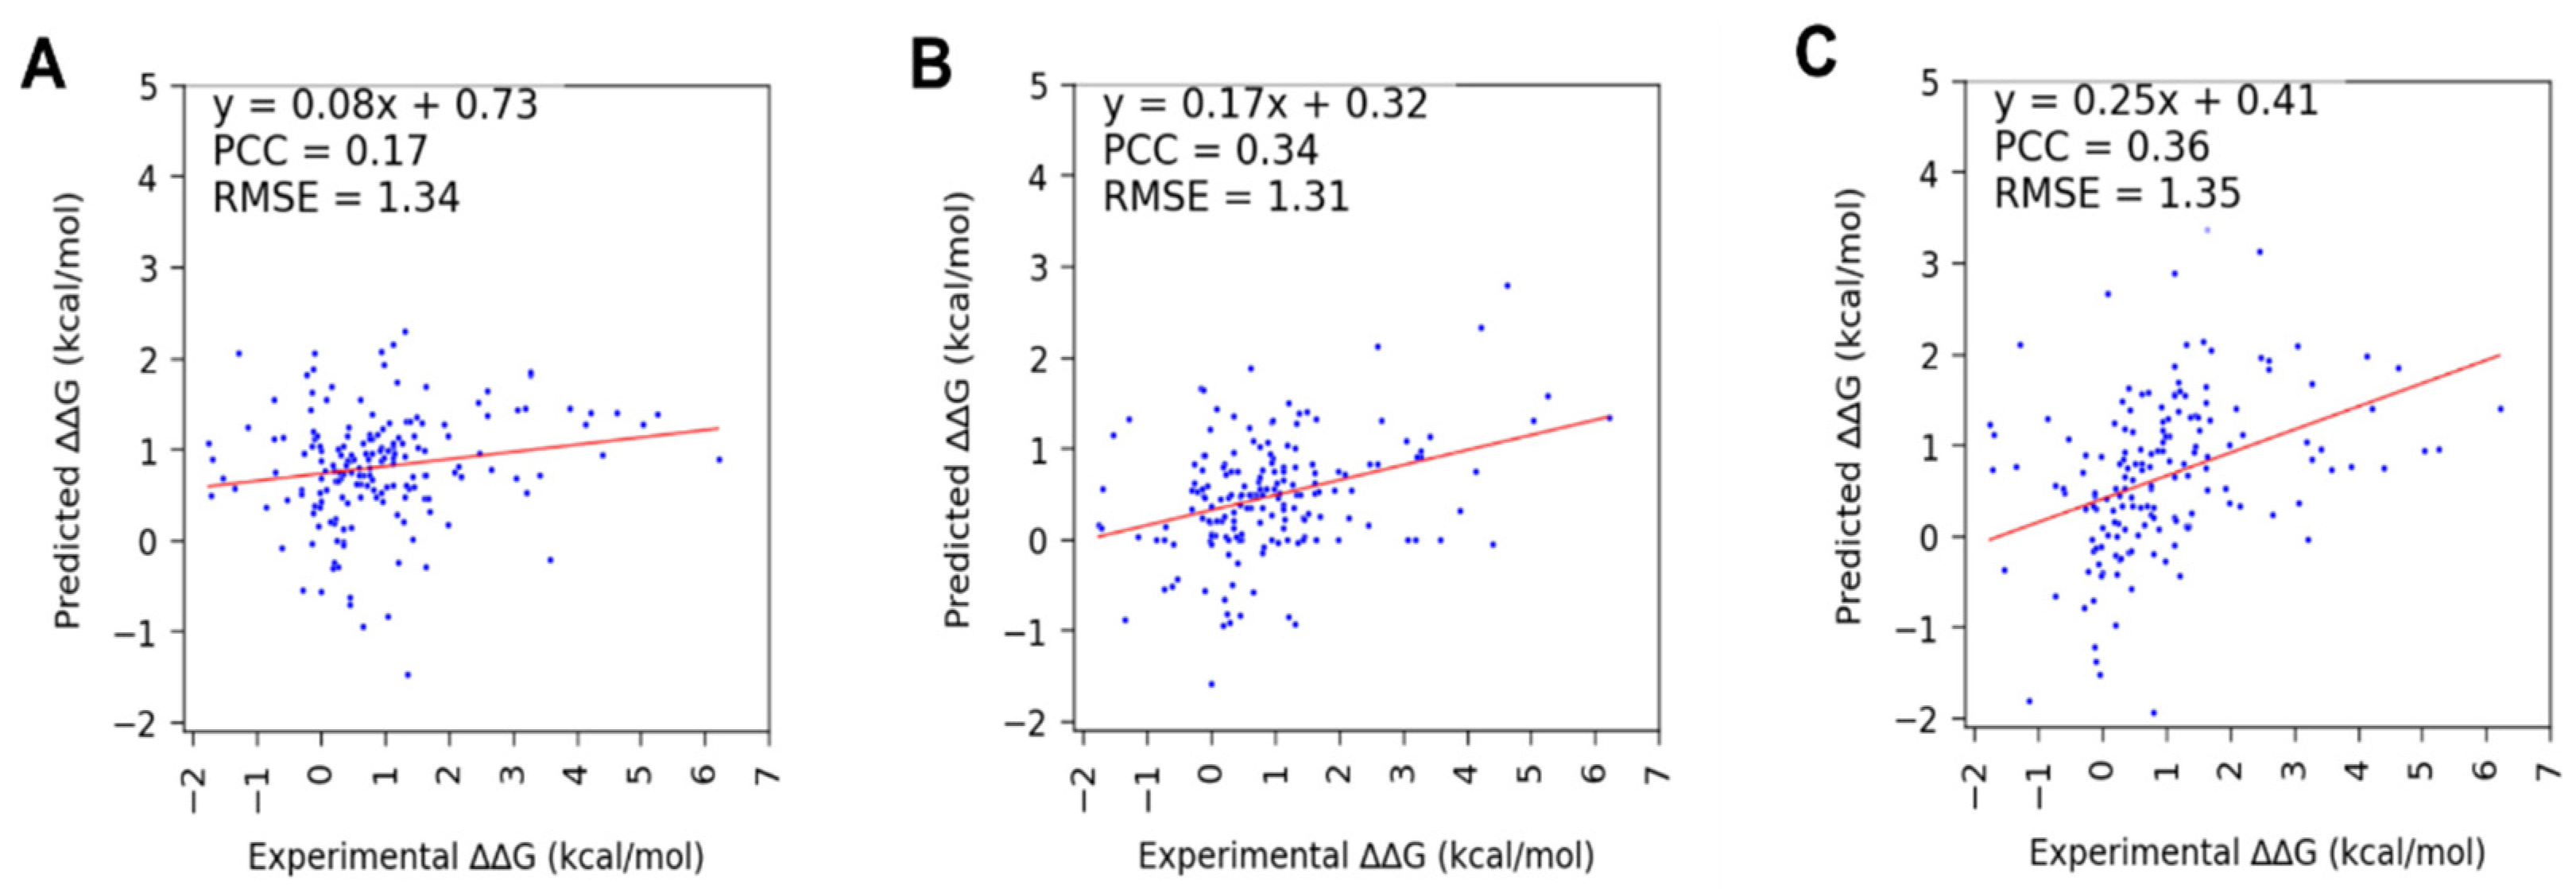
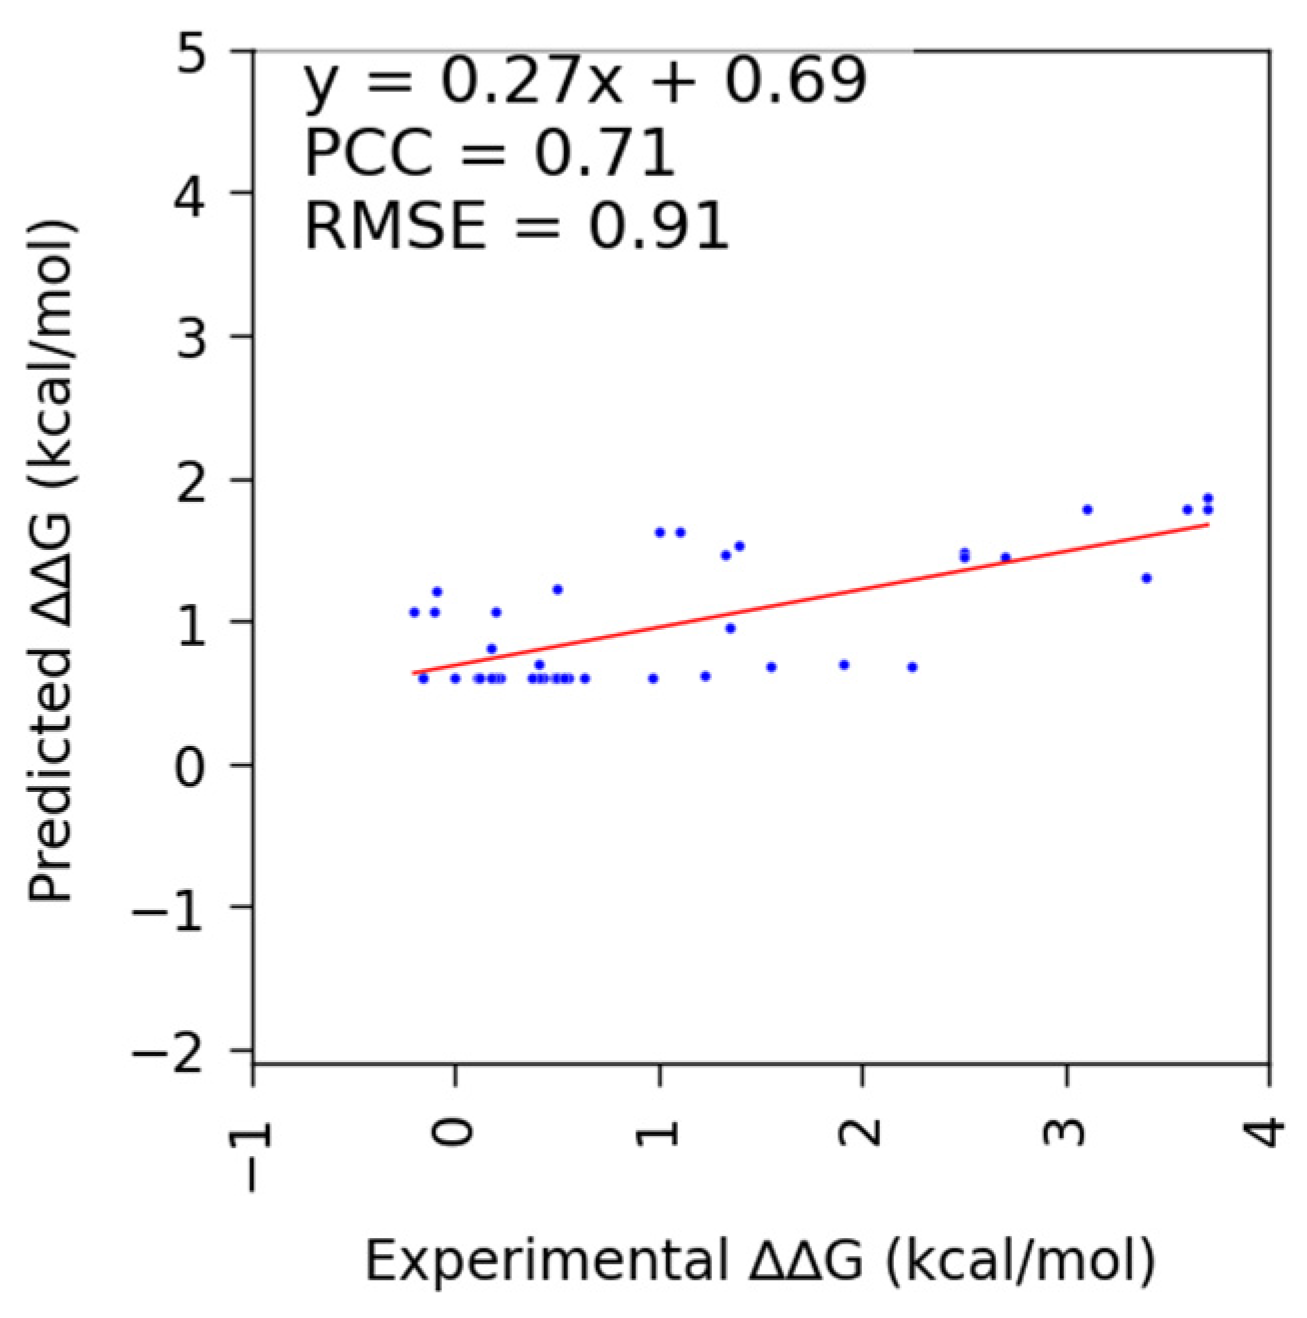
3.2. Performance of SAMPDI-3D and Other Available Methods on S177 and D42 (Newly Curated from ProNAB) Datasets

The datasets S177 consisted of 177 new single-amino acid mutations in proteins, and D42 consisted of 42 new single base/base-pair mutations in DNA of protein-DNA complex obtained by cleaning ProNAB. We begin by assessing the performance of the state-of-the-art methods for single mutation-induced binding free energy change in protein-DNA complex over these two new data sets to learn the current standing of the methods and identify further scope for improvement.
Using SAMPDI-3D to predict binding free energy change due to point mutations in a protein involved in protein-DNA binding, we obtained a PCC of 0.17 and RMSE of 1.34 kcal/mol. Similarly, mCSM-NA and PremPDI resulted in a PCC 0.34, RMSE 1.31 kcal/mol and a PCC 0.36, RMSE 1.35 kcal/mol, respectively (Figure 2 and Table 6). In the case of single base/base-pair mutation in DNA, a PCC of 0.71 using SAMPDI-3D is obtained (Figure 3 and Table 6). However, among the listed methods, apart from SAMPDI-3D, only PNBACE can predict binding free energy changes due to mutations in DNA for a protein-DNA complex, but the very long computational time (up to 24 hours for a single mutation) of the PNBACE web server prevented predicting ΔΔG using it for the D42 data set within a reasonable time. This limited us to using only SAMPDI-3D for predicting ΔΔG for DNA mutations listed in the D42 dataset. (Figure 3 and Table 6). Note that SAMPDI-3D and PremPDI define the binding free energy change ΔΔG = ΔG(mutant) - ΔG(wild-type). In contrast, mCSM-NA defines ΔΔG = ΔG(wild-type) - ΔG(mutant). To facilitate consistent comparison with other prediction methods, we reversed the sign of the predicted ΔΔG values obtained from mCSM-NA to conduct the analysis.
Reflecting on the performance of SAMPDI-3D, we recall that SAMPDI-3D was trained on S419 for the protein mutation and D463 for the DNA mutation datasets and had achieved PCC 0.76 (MSE 0.53 kcal/mol) and 0.80 (MSE 0.39) for the protein mutation and the DNA mutation [28], respectively. Considering that the dataset S419 is less diverse than the new S177 (see section 3.1.1), such results are expected. However, for the D42 dataset, though the performance is not as good as for D463, it is still comparable, suggesting scope for further extending the feature set to cover under-represented categories.
The performance assessment of existing methods, including SAMPDI-3D on the newer experimental data sets, indicated that they need to improve to achieve good performance on the new data. This motivates us to train the SAMPDI-3D further on expanded datasets available now and use an extended feature set to advance its prediction capability.

3.3. Performance of SAMPDI-3D v2 on Protein and DNA Mutation Databases

Using the optimized hyperparameters obtained during the tuning phase, 50 iterations of 5-fold cross-validation were conducted separately for the protein and DNA mutation datasets, utilizing 49 features for the protein dataset and 35 features for the DNA mutation dataset.
For each iteration of the 5-fold cross-validation (k = 5), separate models are trained by designating one of the five folds as the validation set and using the remaining folds for training. Each model generates predictions for cross-validation set during the iteration, which are compiled into a list. This approach ensures that each data point appears in the validation set exactly once and is excluded from training while predicting data points from the associated fold during that iteration. Performance metrics, like Pearson correlation coefficient (PCC), root mean square error (RMSE), and the slope and intercept of the fitted line, are calculated based on the combined predictions set.
For the best-performing iteration, a Pearson correlation coefficient (PCC) of 0.68 and 0.80 is achieved for the protein and DNA mutation datasets, respectively (metrics are calculated as detailed in Section 2.5). The final prediction model is constructed using an ensemble prediction approach, obtained by averaging the models’ predictions across all five folds of the best-performing iteration. This consensus model has been implemented in both the web server and the standalone code. The performance metrics for the best-performing iteration and the average performance across all 50 iterations are summarized in Table 7. Additionally, plots were generated for the best-performing iterations among the 50 iterations for whole datasets in both cases (see Figure 4).

3.4. Web Server Implementation

The updated version of SAMPDI-3D, SAMPDI-3D v2, is freely available at http://compbio.clemson.edu/SAMPDI-3Dv2/. It features an easily accessible, user-friendly interface for job submissions. Users can upload the PDB structure of a complex, specify a single mutation or a batch of mutations, and obtain the predicted ΔΔG values directly from the website. A sample format for specifying mutations is also provided on the website. Additionally, a stand-alone code is provided for download, enabling local predictions.

4. Discussion

The work resulted in a new version of the SAMPDI-3D method, which is now more accurate than the previous version, equipped with new features to strengthen the specificity of the predictions, especially for mutations in the DNA and trained on a larger database. In the new development, the users are given additional information, as compared with the previous SAMPDI-3D algorithm, as the 3D structure of the mutant protein. Furthermore, in the new SAMPDI-3D, the final prediction model was constructed using an ensemble prediction approach, obtained by averaging the predictions of models across all five folds of the best-performing iteration, in contrast to the old SAMPDI-3D where the best model is implemented. The algorithm is available as a web server and as a stand-alone code. The computational time for delivering a prediction is less than a few minutes per complex, making the SAMPDI-3D v2 a tool that can be applied for genome-scale investigations.
An important component of the present work is database cleaning. While it is tempting to use the large database consisting of entries automatically collected from literature, that comes with many wrong entries, either wrong ΔΔGs or mutation position and type of mutation, just to mention some. Directly, using the uncleaned database for training new algorithms comes with a greater risk of inaccurate predictions due to accumulated noises from inaccurate data points, and using these predicted ΔΔGs may lead to wrong conclusions while assessing the impact of mutations and their pathogenicity.

Supplementary Materials

The following supporting information can be downloaded at the website of this paper posted on Preprints.org, Table S1: Categorization of features used for predicting the binding free energy change due to mutations in protein; Table S2: Categorization of features used for predicting the binding free energy change due to mutations in DNA.

Author Contributions

Conceptualization, P.R, S.P., S.P.; methodology, P.R, S.P., S.P.; software, P.R, S.P. ; investigation, P.R, S.P., S.P.; resources, P.R, S.P., S.P.; data curation, S.P.; writing—original draft preparation, P.R, S.P., S.P.; supervision, E.A.; funding acquisition, E.A. All authors have read and agreed to the published version of the manuscript.

Funding

This research was funded by NIH, grant number R35GM151964.

Institutional Review Board Statement

Not applicable.

Informed Consent Statement

Not applicable.

Data Availability Statement

The datasets S177 and D42 can be downloaded from http://compbio.clemson.edu/SAMPDI-3Dv2/.

Acknowledgments

We thank Palmetto supercomputer.

Conflicts of Interest

The authors declare no conflicts of interest.

Abbreviations

The following abbreviations are used in this manuscript:
PCC Pearson correlation coefficient
MSE Mean squared error
RMSE Root mean squared error

References

  1. Bendel, A.M.; Faure, A.J.; Klein, D.; Shimada, K.; Lyautey, R.; Schiffelholz, N.; Kempf, G.; Cavadini, S.; Lehner, B.; Diss, G. The Genetic Architecture of Protein Interaction Affinity and Specificity. Nat. Commun. 2024, 15, 8868. [CrossRef]
  2. Vigneault, F.; Guérin, S.L. Regulation of Gene Expression: Probing DNA-Protein Interactions in Vivo and in Vitro. Expert Rev. Proteomics 2005, 2, 705–718. [CrossRef]
  3. Göös, H.; Kinnunen, M.; Salokas, K.; Tan, Z.; Liu, X.; Yadav, L.; Zhang, Q.; Wei, G.-H.; Varjosalo, M. Human Transcription Factor Protein Interaction Networks. Nat. Commun. 2022, 13, 766. [CrossRef]
  4. Sancar, A.; Lindsey-Boltz, L.A.; Unsal-Kaçmaz, K.; Linn, S. Molecular Mechanisms of Mammalian DNA Repair and the DNA Damage Checkpoints. Annu. Rev. Biochem. 2004, 73, 39–85. [CrossRef]
  5. Aggarwal, B.D.; Calvi, B.R. Chromatin Regulates Origin Activity in Drosophila Follicle Cells. Nature 2004, 430, 372–376. [CrossRef]
  6. Wang, D.; Qian, X.; Sanchez-Solana, B.; Tripathi, B.K.; Durkin, M.E.; Lowy, D.R. Cancer-Associated Point Mutations in the DLC1 Tumor Suppressor and Other Rho-GAPs Occur Frequently and Are Associated with Decreased Function. Cancer Res. 2020, 80, 3568–3579. [CrossRef]
  7. Pifer, P.M.; Yates, E.A.; Legleiter, J. Point Mutations in Aβ Result in the Formation of Distinct Polymorphic Aggregates in the Presence of Lipid Bilayers. PloS One 2011, 6, e16248. [CrossRef]
  8. Kramers, C.; Danilov, S.M.; Deinum, J.; Balyasnikova, I.V.; Scharenborg, N.; Looman, M.; Boomsma, F.; de Keijzer, M.H.; van Duijn, C.; Martin, S.; et al. Point Mutation in the Stalk of Angiotensin-Converting Enzyme Causes a Dramatic Increase in Serum Angiotensin-Converting Enzyme but No Cardiovascular Disease. Circulation 2001, 104, 1236–1240. [CrossRef]
  9. Zeviani, M.; DiDonato, S. Neurological Disorders Due to Mutations of the Mitochondrial Genome. Neuromuscul. Disord. NMD 1991, 1, 165–172. [CrossRef]
  10. Calianese, D.C.; Noji, T.; Sullivan, J.A.; Schoch, K.; Shashi, V.; McNiven, V.; Ramos, L.L.P.; Jordanova, A.; Kárteszi, J.; Ishikita, H.; et al. Substrate Specificity Controlled by the Exit Site of Human P4-ATPases, Revealed by de Novo Point Mutations in Neurological Disorders. Proc. Natl. Acad. Sci. U. S. A. 2024, 121, e2415755121. [CrossRef]
  11. Bi, M.; Su, W.; Li, J.; Mo, X. Insights into the Inhibition of Protospacer Integration via Direct Interaction between Cas2 and AcrVA5. Nat. Commun. 2024, 15, 3256. [CrossRef]
  12. Hellman, L.M.; Fried, M.G. Electrophoretic Mobility Shift Assay (EMSA) for Detecting Protein–Nucleic Acid Interactions. Nat. Protoc. 2007, 2, 1849–1861.
  13. Garner, M.M.; Revzin, A. A Gel Electrophoresis Method for Quantifying the Binding of Proteins to Specific DNA Regions: Application to Components of the Escherichia Coli Lactose Operon Regulatory System. Nucleic Acids Res. 1981, 9, 3047–3060. [CrossRef]
  14. Fried, M.; Crothers, D.M. Equilibria and Kinetics of Lac Repressor-Operator Interactions by Polyacrylamide Gel Electrophoresis. Nucleic Acids Res. 1981, 9, 6505–6525. [CrossRef]
  15. Freire, E.; Mayorga, O.L.; Straume, M. Isothermal Titration Calorimetry. Anal. Chem. 1990, 62, 950A-959A. [CrossRef]
  16. Velázquez-Campoy, A.; Ohtaka, H.; Nezami, A.; Muzammil, S.; Freire, E. Isothermal Titration Calorimetry. Curr. Protoc. Cell Biol. 2004, Chapter 17, Unit 17.8. [CrossRef]
  17. Bastos, M.; Abian, O.; Johnson, C.M.; Ferreira-da-Silva, F.; Vega, S.; Jimenez-Alesanco, A.; Ortega-Alarcon, D.; Velazquez-Campoy, A. Isothermal Titration Calorimetry. Nat. Rev. Methods Primer 2023, 3, 17. [CrossRef]
  18. Capelli, D.; Scognamiglio, V.; Montanari, R. Surface Plasmon Resonance Technology: Recent Advances, Applications and Experimental Cases. TrAC Trends Anal. Chem. 2023, 163, 117079, doi:. [CrossRef]
  19. Nguyen, H.H.; Park, J.; Kang, S.; Kim, M. Surface Plasmon Resonance: A Versatile Technique for Biosensor Applications. Sensors 2015, 15, 10481–10510. [CrossRef]
  20. Lameirinhas, R.A.M.; Torres, J.P.N.; Baptista, A.; Martins, M.J.M. A New Method to Analyse the Role of Surface Plasmon Polaritons on Dielectric-Metal Interfaces. IEEE Photonics J. 2022, 14, 1–9.
  21. Berger, M.F.; Bulyk, M.L. Universal Protein-Binding Microarrays for the Comprehensive Characterization of the DNA-Binding Specificities of Transcription Factors. Nat. Protoc. 2009, 4, 393–411. [CrossRef]
  22. Berger, M.F.; Bulyk, M.L. Protein Binding Microarrays (PBMs) for Rapid, High-Throughput Characterization of the Sequence Specificities of DNA Binding Proteins. Methods Mol. Biol. Clifton NJ 2006, 338, 245–260. [CrossRef]
  23. Pantier, R.; Chhatbar, K.; Alston, G.; Lee, H.Y.; Bird, A. High-Throughput Sequencing SELEX for the Determination of DNA-Binding Protein Specificities in Vitro. STAR Protoc. 2022, 3, 101490. [CrossRef]
  24. Biedner, B.; Yassur, Y. Effect of Resection of Lateral Rectus Muscle in Undercorrected Esotropia. Ophthalmol. J. Int. Ophtalmol. Int. J. Ophthalmol. Z. Augenheilkd. 1987, 195, 45–48. [CrossRef]
  25. Rastogi, C.; Rube, H.T.; Kribelbauer, J.F.; Crocker, J.; Loker, R.E.; Martini, G.D.; Laptenko, O.; Freed-Pastor, W.A.; Prives, C.; Stern, D.L.; et al. Accurate and Sensitive Quantification of Protein-DNA Binding Affinity. Proc. Natl. Acad. Sci. U. S. A. 2018, 115, E3692–E3701. [CrossRef]
  26. Dantas Machado, A.C.; Cooper, B.H.; Lei, X.; Di Felice, R.; Chen, L.; Rohs, R. Landscape of DNA Binding Signatures of Myocyte Enhancer Factor-2B Reveals a Unique Interplay of Base and Shape Readout. Nucleic Acids Res. 2020, 48, 8529–8544. [CrossRef]
  27. Zhao, Y.; Ruan, S.; Pandey, M.; Stormo, G.D. Improved Models for Transcription Factor Binding Site Identification Using Nonindependent Interactions. Genetics 2012, 191, 781–790. [CrossRef]
  28. Li, G.; Panday, S.K.; Peng, Y.; Alexov, E. SAMPDI-3D: Predicting the Effects of Protein and DNA Mutations on Protein–DNA Interactions. Bioinformatics 2021, 37, 3760–3765. [CrossRef]
  29. Peng, Y.; Sun, L.; Jia, Z.; Li, L.; Alexov, E. Predicting Protein-DNA Binding Free Energy Change upon Missense Mutations Using Modified MM/PBSA Approach: SAMPDI Webserver. Bioinforma. Oxf. Engl. 2018, 34, 779–786. [CrossRef]
  30. Pires, D.E.V.; Ascher, D.B. mCSM-NA: Predicting the Effects of Mutations on Protein-Nucleic Acids Interactions. Nucleic Acids Res. 2017, 45, W241–W246. [CrossRef]
  31. Nguyen, T.B.; Myung, Y.; de Sá, A.G.C.; Pires, D.E.V.; Ascher, D.B. mmCSM-NA: Accurately Predicting Effects of Single and Multiple Mutations on Protein-Nucleic Acid Binding Affinity. NAR Genomics Bioinforma. 2021, 3, lqab109–lqab109. [CrossRef]
  32. Zhang, N.; Chen, Y.; Zhao, F.; Yang, Q.; Simonetti, F.L.; Li, M. PremPDI Estimates and Interprets the Effects of Missense Mutations on Protein-DNA Interactions. PLOS Comput. Biol. 2018, 14, e1006615. [CrossRef]
  33. Si-Rui Xiao; Yao-Kun Zhang; Kai-Yu Liu; Yu-Xiang Huang; Rong Liu PNBACE: An Ensemble Algorithm to Predict the Effects of Mutations on Protein-Nucleic Acid Binding Affinity. BMC Biol. 2024. [CrossRef]
  34. Harini, K.; Srivastava, A.; Kulandaisamy, A.; Gromiha, M.M. ProNAB: Database for Binding Affinities of Protein–Nucleic Acid Complexes and Their Mutants. Nucleic Acids Res. 2022, 50, D1528–D1534. [CrossRef]
  35. Sievers, F.; Wilm, A.; Dineen, D.; Gibson, T.J.; Karplus, K.; Li, W.; Lopez, R.; McWilliam, H.; Remmert, M.; Söding, J.; et al. Fast, Scalable Generation of High-Quality Protein Multiple Sequence Alignments Using Clustal Omega. Mol. Syst. Biol. 2011, 7, 539. [CrossRef]
  36. Pettersen, E.F.; Goddard, T.D.; Huang, C.C.; Couch, G.S.; Greenblatt, D.M.; Meng, E.C.; Ferrin, T.E. UCSF Chimera--a Visualization System for Exploratory Research and Analysis. J. Comput. Chem. 2004, 25, 1605–1612. [CrossRef]
  37. Prabakaran, P.; An, J.; Gromiha, M.M.; Selvaraj, S.; Uedaira, H.; Kono, H.; Sarai, A. Thermodynamic Database for Protein-Nucleic Acid Interactions (ProNIT). Bioinforma. Oxf. Engl. 2001, 17, 1027–1034. [CrossRef]
  38. Liu, L.; Xiong, Y.; Gao, H.; Wei, D.-Q.; Mitchell, J.C.; Zhu, X. dbAMEPNI: A Database of Alanine Mutagenic Effects for Protein–Nucleic Acid Interactions. Database 2018, 2018. [CrossRef]
  39. Suzek, B.E.; Huang, H.; McGarvey, P.; Mazumder, R.; Wu, C.H. UniRef: Comprehensive and Non-Redundant UniProt Reference Clusters. Bioinformatics 2007, 23, 1282–1288. [CrossRef]
  40. Schäffer, A.A.; Aravind, L.; Madden, T.L.; Shavirin, S.; Spouge, J.L.; Wolf, Y.I.; Koonin, E.V.; Altschul, S.F. Improving the Accuracy of PSI-BLAST Protein Database Searches with Composition-Based Statistics and Other Refinements. Nucleic Acids Res. 2001, 29, 2994–3005. [CrossRef]
  41. Moon, C.P.; Fleming, K.G. Side-Chain Hydrophobicity Scale Derived from Transmembrane Protein Folding into Lipid Bilayers. Proc. Natl. Acad. Sci. 2011, 108, 10174–10177. [CrossRef]
  42. Shapovalov, M.V.; Dunbrack Jr., R.L. A Smoothed Backbone-Dependent Rotamer Library for Proteins Derived from Adaptive Kernel Density Estimates and Regressions. Structure 2011, 19, 844–858. [CrossRef]
  43. Pommié, C.; Levadoux, S.; Sabatier, R.; Lefranc, G.; Lefranc, M.-P. IMGT Standardized Criteria for Statistical Analysis of Immunoglobulin V-REGION Amino Acid Properties. J. Mol. Recognit. JMR 2004, 17, 17–32. [CrossRef]
  44. Touw, W.G.; Baakman, C.; Black, J.; te Beek, T.A.H.; Krieger, E.; Joosten, R.P.; Vriend, G. A Series of PDB-Related Databanks for Everyday Needs. Nucleic Acids Res. 2015, 43, D364–D368. [CrossRef]
  45. Kabsch, W.; Sander, C. Dictionary of Protein Secondary Structure: Pattern Recognition of Hydrogen-Bonded and Geometrical Features. Biopolymers 1983, 22, 2577–2637, doi:. [CrossRef]
  46. Lu, X.-J.; Bussemaker, H.J.; Olson, W.K. DSSR: An Integrated Software Tool for Dissecting the Spatial Structure of RNA. Nucleic Acids Res. 2015, 43, e142–e142. [CrossRef]
  47. Krivov, G.G.; Shapovalov, M.V.; Dunbrack Jr., R.L. Improved Prediction of Protein Side-Chain Conformations with SCWRL4. Proteins Struct. Funct. Bioinforma. 2009, 77, 778–795, doi:. [CrossRef]
  48. Ali, M. PyCaret: An Open Source, Low-Code Machine Learning Library in Python 2020.
  49. Chen, T.; Guestrin, C. XGBoost: A Scalable Tree Boosting System. In Proceedings of the Proceedings of the 22nd ACM SIGKDD International Conference on Knowledge Discovery and Data Mining; Association for Computing Machinery: New York, NY, USA, 2016; pp. 785–794.
Figure 1. Flowchart for ProNAB database cleaning process to remove entries with insufficient information, duplicated entries and typos.
Preprints 144352 g001
Figure 2. The scatter plots augmented with trend lines and fitted parameter values over experimental and predicted binding free energy changes for the newly curated protein mutation dataset (S177) curated from ProNAB, using (A) SAMPDI-3D, (B) mCSM-NA, and (C) premPDI. Note for SAPMDI-3D and mCSM-NA, the data points are the same. However, in the case of the premPDI, prediction failed for thirteen, leaving only 164 data points to analyze.
Preprints 144352 g002
Figure 3. The scatter plots augmented with trend lines and fitted parameter values over experimental and predicted binding free energy changes using SAMPDI-3D for the newly curated DNA mutation dataset (D42) curated from ProNAB.
Preprints 144352 g003
Figure 4. The scatter plots augmented with marginal distributions and trend lines with fitted parameter values over experimental and predicted binding free energy changes from the best-performing iterations of the (A) protein – S596 and (B) DNA – D502 mutation datasets, respectively.
Preprints 144352 g004
Table 1. Top 10 regression algorithms from pyCaret on the protein mutation database based on performance (PCC) in the screening phase.
Model PCC RMSE (kcal/mol)
CatBoost Regressor 0.65 1.32
Extra Trees Regressor 0.65 1.28
Gradient Boosting Regressor 0.64 1.16
Light Gradient Boosting Machine 0.64 1.24
Random Forest Regressor 0.63 1.28
Extreme Gradient Boosting 0.63 1.28
AdaBoost Regressor 0.61 1.30
Linear Regression 0.46 1.46
Ridge Regression 0.43 1.49
Huber Regressor 0.32 0.56
Table 2. Top 10 regression algorithms from pyCaret on the DNA mutation database based on performance (PCC) in the screening phase.
Model PCC RMSE (kcal/mol)
CatBoost Regressor 0.71 0.75
Random Forest Regressor 0.69 0.77
Extra Trees Regressor 0.68 0.79
Gradient Boosting Regressor 0.67 0.79
Extreme Gradient Boosting 0.67 0.79
Light Gradient Boosting Machine 0.65 0.81
K Neighbors Regressor 0.62 0.84
AdaBoost Regressor 0.59 0.86
Decision Tree Regressor 0.45 0.94
Decision Tree Regressor 0.45 0.98
Table 3. Top 7 regression algorithms on the protein mutation database, ranked by their performance (PCC), after thorough hyperparameter tuning.
Model PCC
(Best Iteration)
RMSE (kcal/mol)
(Best Iteration)
Extreme Gradient Boosting 0.67 0.89
CatBoost Regressor 0.66 0.91
Gradient Boosting Regressor 0.66 0.89
Extra Trees Regressor 0.65 0.91
Light Gradient Boosting Machine 0.65 0.9
AdaBoost Regressor 0.64 0.92
Random Forest Regressor 0.63 0.91
Table 4. Top 7 regression algorithms on the DNA mutation database, ranked by their performance (PCC), after thorough hyperparameter tuning.
Models PCC
(Best Iteration)
RMSE (kcal/mol)
(Best Iteration)
Extreme Gradient Boosting 0.78 0.69
CatBoost Regressor 0.77 0.69
Light Gradient Boosting Machine 0.77 0.7
Random Forest Regressor 0.76 0.7
Extra Trees Regressor 0.76 0.7
Gradient Boosting Regressor 0.76 0.7
K Neighbors Regressor 0.74 0.73
Table 5. Percentages and count table of mutated residue in S419 and S177 datasets.
Mutated Residue S419 (Count) S419 (%) S177 (Count) S177 (%)
Alanine (A) 296 70.64 108 61.02
Cysteine (C) 6 1.43 0 0
Aspartic acid (D) 5 1.19 4 2.26
Glutamic acid (E) 6 1.43 13 7.34
Phenylalanine (F) 9 2.15 4 2.26
Glycine (G) 9 2.15 7 3.95
Histidine (H) 6 1.43 1 0.56
Isoleucine (I) 2 0.48 0 0
Lysine (K) 13 3.1 5 2.82
Leucine (L) 12 2.86 4 2.26
Methionine (M) 6 1.43 7 3.95
Asparagine (N) 5 1.19 3 1.69
Proline (P) 2 0.48 2 1.13
Glutamine (Q) 7 1.67 5 2.82
Arginine (R) 9 2.15 3 1.69
Serine (S) 9 2.15 5 2.82
Threonine (T) 6 1.43 3 1.69
Valine (V) 7 1.67 3 1.69
Tryptophan (W) 1 0.24 0 0
Tyrosine (Y) 3 0.72 0 0
Table 6. Performance of SAMPDI-3D and other methods on newly curated data points from ProNAB for the protein S177 and DNA D42 datasets.
Mutation Method PCC RMSE
Protein SAMPDI-3D 0.17 1.34
mCSM-NA 0.34 1.31
PremPDI 0.36 1.35
DNA SAMPDI-3D 0.71 0.91
Table 7. Performance metrics for the best-performing iteration and average metrics over 50 iterations of 5-fold cross-validation for protein and DNA mutation datasets.
Mutation PCC
(Best Iteration)
Average PCC
(50 Iterations)
Number of Features
Protein 0.68 0.65 ± 0.05 49
DNA 0.80 0.77 ± 0.06 35
Disclaimer/Publisher’s Note: The statements, opinions and data contained in all publications are solely those of the individual author(s) and contributor(s) and not of MDPI and/or the editor(s). MDPI and/or the editor(s) disclaim responsibility for any injury to people or property resulting from any ideas, methods, instructions or products referred to in the content.
Copyright: This open access article is published under a Creative Commons CC BY 4.0 license, which permit the free download, distribution, and reuse, provided that the author and preprint are cited in any reuse.
Prerpints.org logo

Preprints.org is a free preprint server supported by MDPI in Basel, Switzerland.

Subscribe

Disclaimer

Terms of Use

Privacy Policy

Privacy Settings

© 2025 MDPI (Basel, Switzerland) unless otherwise stated