
Submitted:
27 December 2024
Posted:
27 December 2024
You are already at the latest version
Abstract
The timely and accurate identification of invasive species is a critical first step in recognizing and managing the threats that they present in their new habitats. The accurate identification of an invasive species, however, can prove difficult if that species displays taxonomic complexity in its native range, i.e. consists of multiple, morphologically similar subspecies. Across its native range, the grass Taeniatherum caput-medusae (medusahead) exhibits taxonomic complexity: three subspecies have been recognized. As part of ongoing research to better understand and manage the invasion of T. caput-medusae in the western United States, the accurate identification of these three subspecies is a requisite first step. Plants from each native population were grown in a greenhouse common garden, harvested at maturity, and measured using five previously described morphological characters. Three characters, glume length, glume angle, and palea length, were found to be statistically significant, and are diagnostic in differentiating the three subspecies. Two other characters were less informative. Genetic differentiation among native populations of T. caput-medusae was further assessed using a molecular marker, allozymes. The results of a UPGMA cluster diagram based on allozyme data, indicates that subspecies crinitum is genetically differentiated from the other two, some populations of subspecies caput-medusae and asperum co-occur within a cluster, and subspecies asperum is the most variable. Results of the analysis of multilocus genotypes are generally consistent with the UPGMA diagram (e.g., subspecies caput-medusae and asperum share six multilocus genotypes). Our findings confirm the need to better understand the taxonomic complexity that can be found in the native range of invasive species.
Keywords:
allozymes
; morphological characters
; genetic diversity and structure
; genetic relationships
; invasive annual grass
; greenhouse common garden
; medusahead
; multilocus genotypes
; Poaceae
; Triticeae
1. Introduction
Human activities such as international trade and commerce have greatly increased the number and rate of biological invasions worldwide [1,2,3,4]. Invasive species often have negative ecological consequences such as loss of native biodiversity and community structure; modification of ecosystem processes such as nutrient cycling and trophic level interactions; and alteration of disturbance regimes, especially the frequency and intensity of wildfires [1,5,6,7,8]. Such events also have enormous economic costs [9]. Thus, invasions are now considered one of the main drivers of global change [10,11].
Biological invasions occur when organisms are taken from their native range and transported to a new territory where they become established, proliferate, and spread beyond their original point of introduction [1,4,12]. In fact, many invasions can be described as large-scale (intercontinental) biogeographical events [1,13,14]. Thus, to gain a better understanding of the invasion process, comprehensive analyses of invasive species must, by this characterization, adopt an equally large geographical scope. Two reviews [2,14] have emphasized the importance of studying invasive species in both their native and introduced ranges, and this approach has yielded considerable insights into the ecological, genetic and evolutionary aspects of invasive species (see Sax et al. [15]).
Because non-native species are novel to a region, their timely and accurate identification is a critical first step in recognizing and managing the threats that they may present in their new habitats [16]. Quick and reliable taxonomic identification of introduced/invasive species requires recognition of them by field personnel, sufficient diagnostic information, and accessible databases [17,18]. Accurate identification of an introduced species can assist in predicting whether it will become invasive in its new range, based on its performance and impacts elsewhere [18,19]. However, accurate identification of an introduced species in its new range can prove difficult for a species that displays taxonomic complexity in its native range, i.e. consists of multiple, morphologically similar subspecies.
Knowledge and recognition of the taxonomic complexity of an invasive species can be used to: 1) differentiate between invasive and non-invasive subspecies in their native range (e.g. Acacia nilotica [20,21,22], Centaurea stoebe [23,24], and Codium fragile [25,26]), 2) identify native and non-native subspecies within the same region (e.g. Phragmites australis in North America, [27,28,29], 3) identify different invasive subspecies of the same species (Lepidium draba [30,31,32], 4) determine whether subspecies exhibit ecological differentiation, as described by Clausen and Hiesey [33], in either their native and/or introduced ranges, and 5) allows for the detection of a cryptic invasion through the identification of a previously unrecognized invasive subspecies [34]. The accurate identification of invasive subspecies also aids in the search for the most specific and effective biological control agents in the native range of a species [21,34,35,36,37].
Taeniatherum caput-medusae (L.) Nevski (Poaceae, common name medusahead), is a self-pollinating, diploid, annual, Eurasian grass in the Triticeae (the wheat tribe) that is invasive in the western United States (U.S.). In previous taxonomic treatments Taeniatherum had been included in Elymus, Hordelymus, or Hordeum (for a review of the taxonomic history of Taeniatherum see Frederiksen [38]. Linnaeus [39] originally recognized a single species placed in Elymus (E. caput-medusae L.), while Schreber [40] named two species (E. caput-medusae and E. crinitus Schreb.), and Link [41] named three species (E. caput-medusae, E. crinitus and E. platyatherus Link). Nevski [42] established Taeniatherum and recognized three species: T. caput-medusae (L.) Nevski, T. crinitum (Schreber) Nevski, and T. asperum (Simonk.) Nevski. Although other taxonomic treatments have been proposed (e.g., Humphries [43]), probably the most widely accepted taxonomic revision of Taeniatherum recognizes three subspecies [38]: T. caput-medusae subspecies caput-medusae, T. caput-medusae subspecies crinitum (Schreb.) Melderis, and T. caput-medusae subspecies asperum (Simk.) Melderis. These three subspecies were recognized by Frederiksen [38] based on five morphological characters associated with inflorescences and caryopses (hereafter referred to as seeds). Intermediate morphological forms were reported in regions where the geographic distributions of subspecies overlap [38].
All three subspecies have a diploid chromosome number (2n = 14) and exhibit the same karyotype [38,44]. Crossing experiments among the subspecies produced hybrids of low fertility, although a high amount of bivalent formation was observed during meiosis. The low fertility of these crosses, combined with observations concerning chromosome pairing behavior, led Frederiksen and von Bothmer [44] to conclude that all three subspecies have similar genomes and that differences among them appeared to be genetically determined. The subspecies do exhibit different geographic distributions, although some overlap does occur. In general, subspecies caput-medusae is found in the western Mediterranean (Morocco, Portugal, Spain and France), subspecies crinitum occurs from eastern Europe and the eastern Mediterranean to central Asia (Kyrgyzstan, Tajikistan and Afghanistan) and subspecies asperum is found across almost the entire Eurasian native range of Taeniatherum (see Frederiksen [38] for a map of the geographic distribution of the three T. caput-medusae subspecies).
In the western U.S., T. caput-medusae occurs in disturbed sites in the 25-100 cm mean annual precipitation zones, and it can dominate sites with high clay content or well-developed soils [45,46]. The grass has invaded millions of hectares of semi-arid woodlands and shrub-steppe rangelands in California, Idaho, Montana, Nevada, Oregon, Utah and Washington [47,48,49,50,51]. Based on the examination of plants in the native and invasive ranges, it is believed that the taxon introduced into the U.S. was T. caput-medusae subspecies asperum [49,52,53].
The overall goal of this research program is to determine the genetic and evolutionary consequences of the introduction of T. caput-medusae into the western U.S. However, given that, across its extensive Eurasian native range, three subspecies of T. caput-medusae have been recognized, gaining a better understanding of this taxonomic complexity is a requisite first step for achieving this overall goal. Thus, the specific objectives of the current study are to: 1) determine the utility of the morphological characters described by Frederiksen [38] (1986) in distinguishing the three subspecies of T. caput-medusae, 2) assess morphological variation within and among native populations of the three subspecies of T. caput-medusae, and 3) determine the level of genetic diversity and genetic differentiation among the three subspecies using a selectively-neutral molecular marker, allozymes (or enzyme electrophoresis).
2. Materials and Methods
2.1. Sampling Locations and Populations
For this study, population collections of T. caput-medusae were made at native range sampling locations; these collection efforts were conducted by RFHS and SJN over multiple years (Table S1). Field collected samples were tentatively assigned to a subspecies based upon the morphological characters described by Frederiksen [38]. For each population, 30-35 intact inflorescences were sampled haphazardly 1 -3 m apart. In populations with fewer than 30 individuals, all individuals were harvested. Intact inflorescences were stored in individually labeled paper envelopes at room temperature. Many of the sampling locations were along roadsides, adjacent to agricultural fields, within abandoned agricultural fields, or in disturbed areas. Plants from 87 sampling locations were collected from the native range. Two sampling locations, Villaviciosa de Cordoba, Spain and Guzelkonak, Turkey consisted of two subspecies and were each separated into two “populations” for analysis, bringing the total number of populations to 89. Seventy-four populations were used in both the morphological and genetic analysis, seven populations in only the morphological analysis and eight populations in only the genetic analysis (Table S1). Thus, 81 populations were included in the morphological analysis and 82 populations were included in the genetic analysis. The seven populations from Greece and Turkey collected in 2010 were analyzed only for genetic diversity and were not included in the morphological analysis. One population (Kars, Turkey) was not included in the morphological analysis because it did not successfully set seed. Seven populations were not used in the genetic analysis because of their geographic proximity to other populations that were included (see Table S1).
Samples for 22 of the populations included in this research were obtained as accessions from the USDA Western Region Plant Introduction Laboratory, Pullman, Washington (USA); 13 from Turkey, seven from Afghanistan, two from Iran and one from Kazahkstan (Table S1). Unfortunately, in some cases the geographic location and collection date for these accessions are not provided. In addition, since they were first collected in their country of origin, these accessions are the product of an unknown number of grow-outs in Pullman, Washington. Seeds from the Sterea Hellas, Greece population were kindly provided by Dr. Signe Frederiksen, Institute of Systematic Botany, University of Copenhagen, Denmark.
2.2. Greenhouse Common Garden
To determine which morphological characters are diagnostic for distinguishing the three subspecies, a greenhouse common garden was established at Boise State University in mid-winter 2009. For each population, two seeds from six randomly chosen individuals (maternal plants) were grown in a pot (V = 2000 mL) containing standard potting soil supplemented with ¼ cup granulated fertilizer. If both seedlings from each maternal plant emerged, one of the two was randomly selected and discarded, leaving a maximum of six plants per pot. Plants were maintained under ambient growing conditions (e.g., no supplemental lighting), although the temperature within the greenhouse was not allowed to drop below 2 °C or rise above 32 °C. Plants were watered three times a week, and more if needed. The next summer (2010), spikes of mature plants were harvested and placed in separate envelopes.
Figure 1.
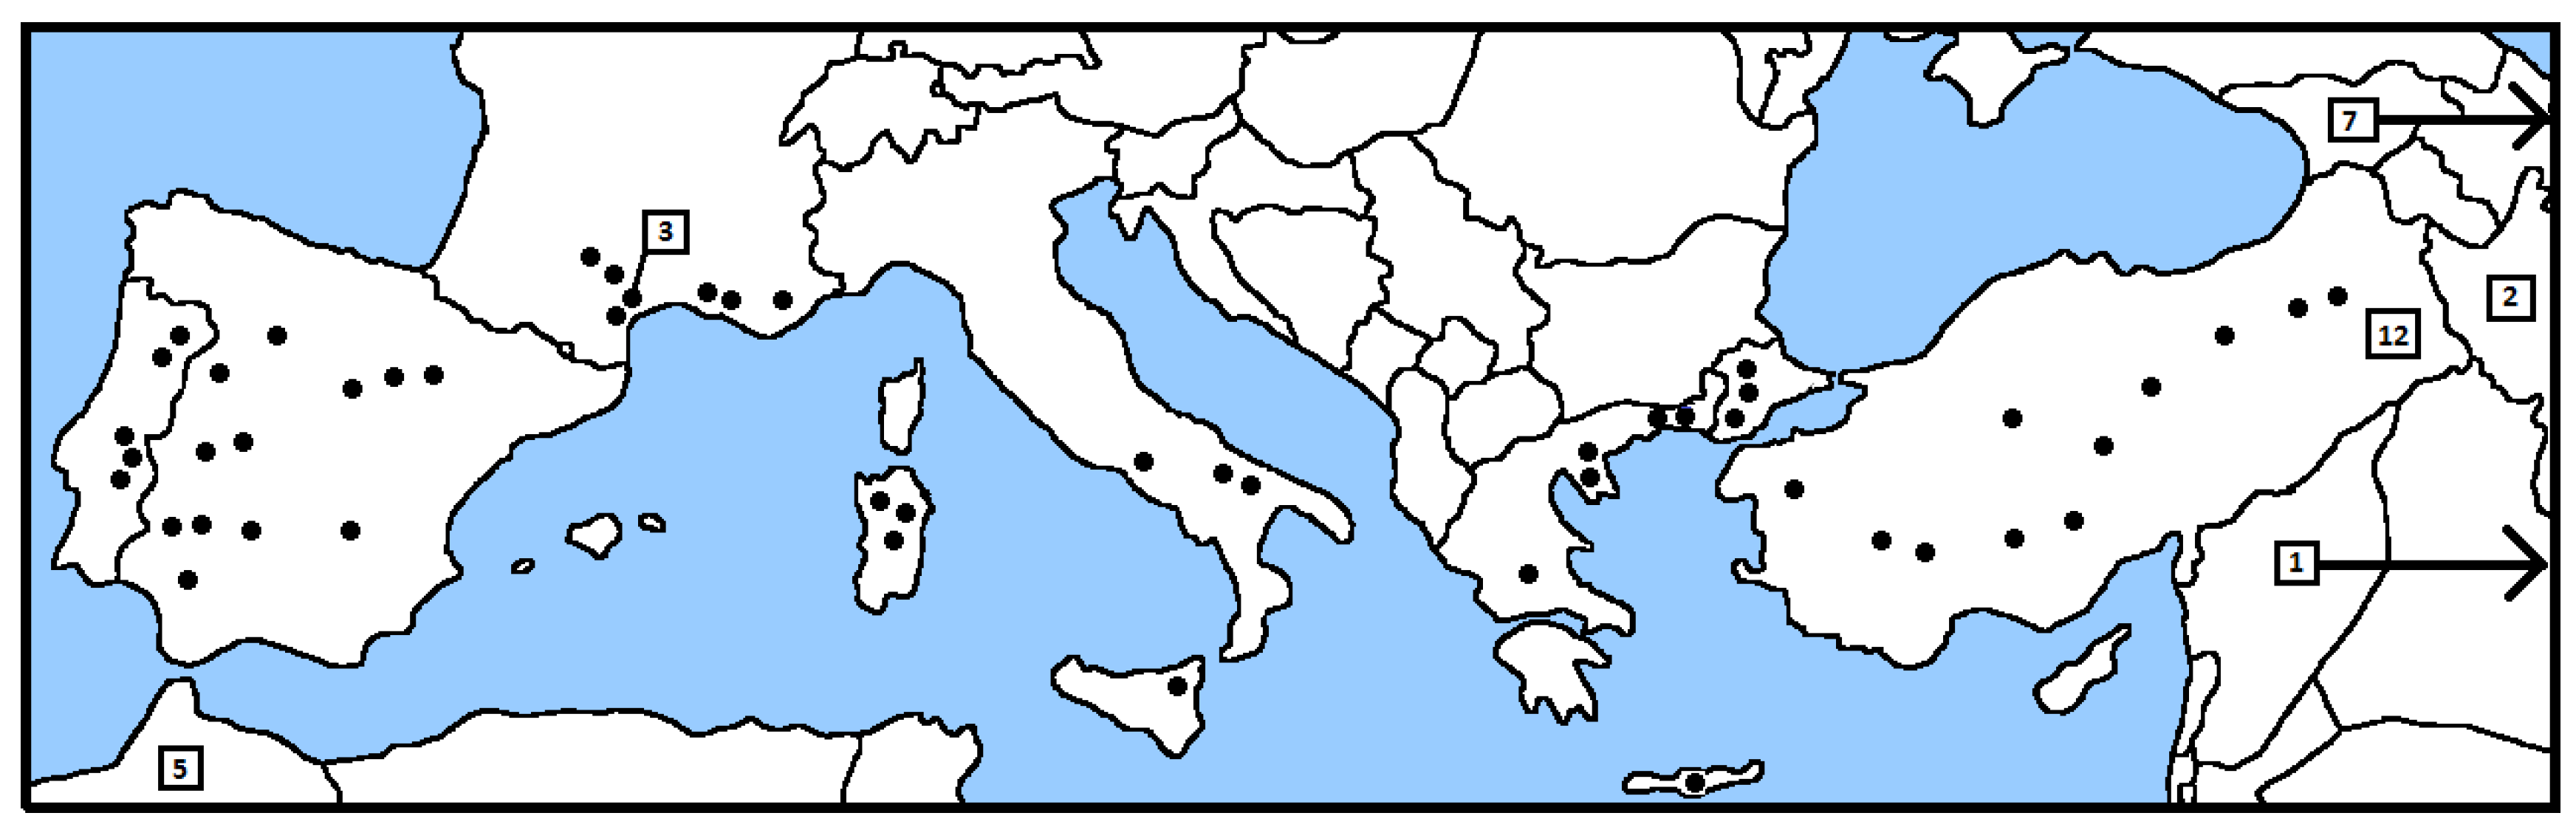
Map showing the 80 native sampling locations (82 populations) of Taeniatherum caput-medusae analyzed in genetic analysis portion of the study. Numbers in boxes indicate the number of populations in certain countries, or areas. The arrow in the upper right of the figure indicates the seven populations sampled from Afghanistan and the lower arrow indicates the single population from Kazhkstan included in the study. .
Figure 1.
Map showing the 80 native sampling locations (82 populations) of Taeniatherum caput-medusae analyzed in genetic analysis portion of the study. Numbers in boxes indicate the number of populations in certain countries, or areas. The arrow in the upper right of the figure indicates the seven populations sampled from Afghanistan and the lower arrow indicates the single population from Kazhkstan included in the study. .
2.3. Morphological Characters and Measurements
The inflorescence of T. caput-medusae is a spike with two to three spikelets per node, each spikelet consists of two glumes at the base and one or more florets above [50,54]. Each spikelet produces a single seed. The dorsal surface of seeds of this grass includes a tissue referred to as the lemma, which contains conical cells and close-set hairs (see Figure 7 Frederiksen [38]). The ventral surface of these seeds includes a tissue referred to as the palea. Based on these reproductive structures, Frederiksen [38] described five morphological characters that can be used to distinguish between the three subspecies: glume length, spreading of glumes (glume angle) at maturity, palea length, conical cell prominence on the lemma, and lemma surface hair location (Table 1). After harvest, measurements of the five traits were obtained for each individual, in each population. The traits glume length and palea length were measured using a standard metric ruler and scored as continuous variables. Glume angle was measured with a True Angle ® protractor and was also scored as a continuous variable. Conical cell characteristics and the location of hairs on the lemma surface were determined using a Leica EZ4 Dissecting scope at various magnifications and scored categorically: conical cells not prominent = 1 and conical cells prominent = 2; hairs only at the margins of the lemma surface = 1 and hairs throughout the entire lemma surface = 2.
2.4. Allozyme Analysis
Allozymes are single-locus, codominant molecular markers. Thus, individuals can be genotyped (i.e., homozygous versus heterozygous) based on their enzyme banding patterns. However, allozymes provide and underestimate of genetic diversity compared to other molecular markers because nucleotide substitutions can occur but not alter enzyme banding patterns [55]. Additionally, allozymes only assess genetic diversity at a limited number of loci.
Allozymes were chosen for this study because this technique requires no development time, and it is a relatively inexpensive and rapid method for gathering population genetic data. Finally, the use of allozymes allows us to directly compare the results of this study to those for 46 invasive populations of T. caput-medusae subsp. asperum currently In Press [56].
Our allozyme analysis methods generally followed the procedures of Soltis et al. [57], with modifications described by Novak et al. [58]. In addition, these methods were fine-tuned for T. caput-medusae as described in Marsh et al. [56]. Seeds were germinated in petri dishes on moistened filter paper and harvested 7 – 10 days following germination. Entire seedlings (shoot and root tissue) were macerated in a tris-HCl grinding buffer-PVP solution] (pH 7.5). The starch concentration of each gel was approximately 12.5% (w/v). A suite of 15 enzymes were stained and visualized using the following buffer systems: isocitrate dehydrogenase (IDH), glucose-3-phosphate dehydrogenase NADP (G3PDH-NADP), and shikimate dehydrogenase (SKDH) using system 1; alcohol dehydrogenase (ADH), glutamate dehydrogenase (GDH), and phosphoglucoisomerase (PGI) using system 6; aldolase (ALD), colorimetric esterase (CE), glutamate oxalacetate transaminase (GOT), malic enzyme (ME), superoxide dismutase (SOD), and triosephosphate isomerase (TPI) using system 8; and malate dehydrogenase (MDH), phosphoglucomutase (PGM) and 6-phosphogluconate dehydrogenase (6PGD) using system 9.
Because T. caput-medusae is a diploid, with low genetic diversity, the genetic basis of all allozyme variation observed was easily inferred based on the known subunit structure and compartmentalization of these enzymes [59,60]. Nomenclature for loci and alleles generally followed that of Marsh et al. [56], but also included modification based on the diversity detected in the current study. Across the 46 invasive populations of T. caput-medusae subsp. asperum, Marsh et al. [56] determined allelic diversity at 29 loci; but due to low gene expression and banding intensity, the genetic diversity of native populations of T. caput-medusae was assessed using 23 allozyme loci. For example, Marsh et al. [56] scored six CE loci across invasive populations, but only two of these loci could be reliably scored among native populations: Ce-2 and Ce-4. As new alleles were detected in native populations the nomenclature for alleles had to be updated, with the most anodally migrating allele designated a, the next b, and so on.
2.5. Data Analysis
All continuous variables (glume angle, glume length, and palea length) were log transformed prior to statistical analysis because they were not normally distributed. We used the program SAS™ [61] to analyze the morphological data. Contingency tables were generated for the categorical variables (conical cell prominence and lemma surface hair location) and analysis of variance (ANOVA) was conducted on the log transformed continuous variables. To test for significant differences among subspecies morphology, Student-Newman–Keuls tests were run on each significant variable to determine which traits were significantly different for the three subspecies. Subsequently, a Bonferroni correction was performed to mitigate false positives when testing multiple hypotheses on the same data set [62]. Using only those morphological characters found to be significant, PROC GPLOT in SAS™ was used to generate three-dimensional (3D) scatter plots. The 3D scatter plots provide a visual representation of the data’s ability to discriminate between the three subspecies.
Because T. caput-medusae is broadly distributed across Eurasia and includes areas where the distribution of subspecies overlaps, populations with two subspecies and/or intermediate forms have been reported [38]. For populations which were suspected of being composed of two subspecies, all individuals from the population were assigned to their respective subspecies and analyzed as two separate “populations.” In cases of intermediacy, populations were classified as a certain subspecies based on the consensus derived when considering all available evidence (including the traits not found to be significantly different).
Allozyme data for 82 populations of T. caput-medusae were analyzed using POPGENE 1.32 [63]. The data were entered as individual multilocus genotypes (MLGs) and the populations were hierarchically arranged based on subspecies. Genetic diversity within subspecies of T. caput-medusae were expressed as the total number of alleles, the mean number of alleles per locus, the total number of polymorphic loci, the percentage polymorphic loci per subspecies, percentage of polymorphic populations, Nei’s expected mean heterozygosity (Hexp) and the mean observed heterozygosity (Hobs). The expected mean heterozygosity was computed using the unbiased estimate method of Nei [64], and the observed mean heterozygosity was determined using the Direct Count Method. FST and NM were calculated using POPGENE 1.32 [63].
The unweighted pair-group method with arithmetic averaging (UPGMA) algorithm (POPGENE 1.32) was used to generate a phenogram that displays the genetic relationships among populations of the three subspecies. Nei’s [64] unbiased genetic identity method (modified from the NEIGHBOR procedure of PHYLIP version 3.5c) was used to generate the UPGMA phenogram because it is best suited for use with data sets containing small sample sizes. The threshold for missing data was set at 0.05%.
The number and identity of MLGs for all three subspecies were determined using ARLEQUIN v.3.5.1.2 [65]. Allozyme data were entered as psuedohaplotype frequencies for each population and structured hierarchically according to subspecies. In addition, we used analysis of molecular variance (AMOVA) to estimate the amount of genetic variation partitioned among and within subspecies. Individuals with missing data were deleted from the data file prior to analysis with ARLEQUIN.
3. Results
3.1. Morphological Characters and Variation Among Subspecies
After sequential Bonferonni correction [62]: three of the five morphological characters were found to be significantly different among the three subspecies: glume length (F2,381= 369.41, p = 0.0003), glume angle (F2,381 = 389.67, p = 0.0003) and palea length (F2,381 = 339.28, p = 0.0003). Conical cell prominence (Χ2 = 7.2527, d.f. = 2, p = 0.0532) and lemma surface hair locations (Χ2 = 1.2403, d.f. = 2, p = 0.5379) were found to be non-significant among the three subspecies. Values for the statistically significant morphological characters for each of the three subspecies are given in Table S2. In general, subspecies asperum has moderately short glumes (mean = 28.3 mm), a mean glume angle of 63.8° and a palea length of 8.4 mm. Subspecies caput-medusae has the longest glumes (mean = 49.8 mm), an obtuse glume angle (mean = 122.5°) and a palea length of 8.3 mm. Subspecies crinitum has the shortest glumes (mean = 21.5 mm), an acute glume angle (mean = 36.8°) and the longest palea length (mean 11.1 mm) (Table S3). Results of the Student-Neuman-Keuls test reveal that the means for glume length and glume angle are significantly different among all three subspecies (Figures 2a and 2b); whereas only subspecies crinitum is significantly different for palea length (Figure 2c).
Three-dimensional scatter plots were created with SAS™ as graphical representations of the morphological variation found among the 81 populations and 385 individuals measured in this study (Figures 3a and 3b, respectively). At the population level, three distinct clouds of data points are apparent and clearly differentiate each of the three subspecies (Figure 3a). Conversely, some overlap among individuals associated with the three subspecies can be observed in Figure 3b. For instance, subspecies asperum and subspecies caput-medusae show overlap for palea and glume length while subspecies asperum and subspecies crinitum show overlap for glume angle. No overlap in morphological characters can be seen between subspecies caput-medusae and subspecies crinitum.
3.2. Allozyme Diversity
Estimates of genetic (allozyme) diversity and structure of native range T. caput-medusae are based on the analysis of populations from 80 sampling locations, two of these locations contained two different subspecies: Villaviciosa de Cordoba, Spain (subspecies asperum and caput-medusae) and Guzelkonak, Turkey (subspecies asperum and crinitum). Thus, individuals from each of these two localities were separated and assigned to the appropriate subspecies, for a total of 82 populations in the allozyme analysis (~ 29 individuals per populations). The 15 enzymes were coded by 23 putative loci and across all three subspecies 16 of the 23 (70%) loci were polymorphic: Adh-1, Ce-2, Ce-4, G3pdh-2, Gdh-1, Got-1, Got-2, Idh-1, Mdh-1, Mdh-2, Mdh-3, Pgi-2, Pgm-2, 6Pgd-2, Skdh-1, Tpi-2. Across the 82 populations analyzed, a total of 50 alleles were detected (2.17 alleles/locus) for all 23 loci. Each polymorphic locus has between 2 and 5 alleles. Three loci, Ce-2, Mdh-3 and Pgi-2, had five alleles. Among all individuals analyzed, only two (one each in the Iran 1 population and Afghanistan 5 population) were found to be heterozygous at any of the 23 loci examined. Just over half (44 of 82, 53.7%) of the populations examined were genetically polymorphic with the remaining 37 populations being monomorphic across all loci (Table 2).
Subspecies asperum showed the highest amount of genetic diversity with 48 of the 50 alleles detected (2.09 alleles per locus) and 15 polymorphic loci (65.2% polymorphic loci) (Table 2). Subspecies asperum also had the highest expected mean heterozygosity values of any of the three subspecies (Hexp = 0.1408), and 23 of 34 (67.6%) subspecies asperum populations were polymorphic. Subspecies caput-medusae generally had intermediate values for genetic diversity parameters, whereas subspecies crinitum had the lowest values. For subspecies caput-medusae, 36 alleles (1.57 alleles per locus) and 10 polymorphic loci (43.5%) were detected. Half of the subspecies caput-medusae populations were polymorphic. Subspecies crinitum had 33 alleles (1.43 alleles per locus), nine polymorphic loci (39.3 %), and 11 of 28 (39.3%) populations were polymorphic.
3.3. Multilocus Genotypes
The program ARLEQUIN was used to identify all MLGs across and within the three subspecies of T. caput-medusae. A total of 93 MLGs were detected across the three subspecies, with subspecies asperum having over two-thirds of these genotypes (66 out of 93) (Table S3).
Subspecies caput-medusae had 22 MLGs and subspecies crinitum had 11 MLGs. Six MLGs were shared between subspecies asperum and subspecies caput-medusae, and neither of these two subspecies shared a MLG with subspecies crinitum.
3.4. Genetic Relationships Among Subspecies of Taeniatherum Caput-Medusae
The UPGMA cluster diagram based on Nei's [64] unbiased genetic identity values provides a graphic representation of the genetic relationships found among the three subspecies (Figure 4). Four distinct clusters of populations are apparent in the phenogram. Clusters 1 and 4 include 24 of the 34 (70.6%) populations of subspecies asperum included in this analysis. Cluster 2 includes all 20 populations of subspecies caput-medusae and eight populations of subspecies asperum, with these eight populations of subspecies asperum sampled from either Spain or Morocco. Cluster 3 contains all populations of subspecies crinitum and two populations of subspecies asperum. Cluster 4 contains the most genetically diverged populations and includes three populations from the Italian mainland and three populations from Morocco.
Analysis of molecular variance (AMOVA) reveals that 92.6% of the total genetic diversity for T. caput-medusae is partitioned at the two highest hierarchical levels: 48.38% among subspecies and 44.22% among populations within subspecies (Table 3). The high level of genetic diversity partitioned among populations within subspecies is due to the high level of genetic differentiation among populations of the three subspecies, especially among populations of subspecies asperum. Only 7.18% of the total genetic diversity is partitioned within populations, indicating that populations of T. caput-medusae possess little genetic diversity.
4. Discussion
Taeniatherum caput-medusae exhibits taxonomic complexity in its native range. This study utilizes morphological characters and genetic data to gain a better understanding of this complexity and determine the level of differentiation among populations of the three subspecies of T. caput-medusae. These analyses will allow precise and valid comparisons of native and invasive populations. The morphological characters used to differentiate the three subspecies show overlap among traits for the subspecies but appear to be diagnostic. The assessment of genetic differentiation among the subspecies shows some intermixing between subspecies, but generally reflects the relationships observed in the morphological analysis.
This study reveals that three morphological characters can be used to identify the three subspecies of T. caput-medusae. The traits glume angle and glume length are significantly different among all three subspecies (Figures 2a and 2b); whereas palea length shows overlap between subspecies asperum and subspecies caput-medusae, but clearly distinguishes these two subspecies from subspecies crinitum (Figure 2c). Variability among the three subspecies for palea length reflects the larger overall seed size associated with subspecies crinitum, compared to the other two subspecies [38]. While all three morphological characters, in combination, are effective in distinguishing the three subspecies of T. caput-medusae, some morphological overlap between individuals of subspecies asperum and caput-medusae and between individuals of subspecies asperum and subspecies crinitum does occur (see below).
Frederiksen [38] found the prominence of conical cells and the density and location of lemma surface hairs to be diagnostic between the three subspecies. We, however, did not find these characters to be diagnostic for distinguishing the three subspecies. Several methodological differences may explain this discrepancy. First, Frederiksen [38] used a scanning electron microscope to analyze the prominence of conical cells and density, and location of hairs found on the lemma surface, whereas we used a standard light microscope. Perhaps differences in magnification contributed to these discrepancies. Second, Frederiksen [38] conducted her study with herbarium specimens, while the measurements reported in the current study were made on plants grown in a greenhouse common garden. Finally, Frederiksen [38] appears to have made her observations on a single individual per locality, whereas we measured an average of 4.75 individuals per population (range = 2-6 individuals per population). Perhaps, this larger sample size per population increased the population-level variability detected for these traits.
The three-dimensional scatter plots reveal different patterns at the population and individual levels. At the population level, three distinct groups of symbols, one for each of the three subspecies, can be observed (Figure 3a). Because each symbol represents the mean values of these three characters for individuals in each population (thus ignoring trait variation among individuals), this scatter plot better illustrates morphological differentiation among the subspecies. This result is not surprising, as characters associated with spikes or spikelets have repeatedly been shown to be diagnostic for members of the Triticeae [66,67,68,69,70]. For example, Barkworth et al. [71] evaluated 61 characters for their ability to assign herbarium specimens to one of 13 genera in the Triticeae and found that specimens could almost always be identified to one of the genera using a single spike. At the species level, Kharazian and Rahiminejad [72] showed that species within Triticum (Triticeae) could be differentiated using two characters: the awns of the uppermost spikelet and the form of glumes.
The use of morphological characters, particularly those associated with spikes, panicles and/or seeds have widespread utility and are often diagnostic for species and subspecies identification within the Poaceae. For example, Saltonstall et al. [28] used a combination of morphological traits (ligule length, lower glume length, upper glume length and lemma length) and chloroplast DNA haplotype data to identify a cryptic subspecies of Phragmites (Poaceae) that is native throughout much of North America.
Unlike at the population level, some individuals belonging to these subspecies do exhibit morphological overlap (Figure 3b). This overlap however occurs only among several individuals of subspecies asperum and subspecies crinitum and among several individuals of subspecies asperum and subspecies caput-medusae. Morphological overlap among certain individuals is not surprising considering that these three subspecies have been shown to be quite variable and intermediate morphological forms have been reported [38,44]. Additionally, morphological overlap occurs among individuals from populations in localities where the geographic distribution of subspecies also overlaps (e.g. Morocco, Spain and France for subspecies asperum and caput-medusae and Sardinia and Sicily for subspecies asperum and crinitum). These morphological data suggest that hybridization may be taking place in areas where the distribution of subspecies overlaps. Hybridization among the subspecies has previously been reported, although crossing experiments among subspecies produced hybrids of low fertility [38,44]. Depicting trait measurements at the individual level clearly blurs the morphological boundaries among some individuals of the three subspecies, however these results may signal important events (e.g. hybridization) that have occurred in the evolutionary history of populations of T. caput-medusae in regions where they co-occur.
The goal of this phase of our research was to better understand the taxonomic complexity of T. caput-medusae in its native range through an assessment of variation in the morphological characters used to distinguish the three subspecies. This work was not designed as a quantitative genetic study. Plants grown in the greenhouse common garden were derived from field-collected seeds, and we did not perform a preliminary grow-out in the greenhouse environment to purge maternal (environment) effects [73,74,75]. Maternal effects may contribute to some of the morphological trait variation and overlap observed among individuals of the three subspecies included in this analysis. For example, seed size has been shown to be influenced by maternal effects, and seed size differences influence germination characteristics, seedling size and adult plant size [74]. Thus, some of the morphological traits measured in this experiment may have been influenced by maternal carryover effects. The influence of maternal effects on morphological trait variation in T. caput-medusae can only be fully resolved by future studies that utilize a quantitative genetic approach.
Across all three subspecies (Table 2), the allozyme diversity of T. caput-medusae (69.6% polymorphic loci and 2.17 alleles per locus) is higher than the mean values (50.5% polymorphic loci and 1.96 alleles per locus) reported for 473 plant species [76]. The level of allozyme diversity in subspecies asperum (65.2% polymorphic loci and 2.09 alleles per locus) is also higher than the mean values for all plant species reported by Hamrick and Godt [76]; whereas allozyme diversity across populations of subspecies caput-medusae and subspecies crinitum is lower than the mean values reported for all plants. In addition, allozyme diversity across all populations of subspecies asperum is generally higher or similar to the range of values (41.8 - 59.2 percent polymorphic loci and 1.69 – 2.38 alleles per locus) reported for selfing, early successional, annual, and monocot plant species [76], while the same does not hold for subspecies caput-medusae or subspecies crinitum.
Genetic diversity and genetic differentiation vary among the three subspecies of T. caput-medusae. Subspecies asperum exhibits the greatest amount of allozyme diversity, while subspecies crinitum possesses the least. The high diversity found within subspecies asperum may be related to its large geographic range [38]. Karron [77] reported that species exhibiting large geographic distributions typically exhibit higher levels of genetic diversity, compared to congeners with smaller distributions. The lower level of genetic diversity detected for subspecies crinitum, compared with the other two subspecies, may be explained, in part, by the type of plant collections mostly used to assess the diversity of this subspecies. Twenty-two of 28 (68.8%) subspecies crinitum population samples were obtained as accessions from the Western Regional Plant Introduction (PI) Station, Pullman, Washington (Table S1), and the use of this type of plant material may contribute to an underestimation of genetic diversity. This underestimate of genetic diversity may occur because: 1) information about these accession is sparse and the original field collections may only have included a limited number of individuals; thus may not reflect the overall diversity of the sampled populations, 2) each accession has been through an unknown number of grow-outs since they were stored at the PI Station and this may further reduce diversity through genetic drift, and 3) grow-outs were carried out in Pullman, WA and selection for or against certain genotypes in a novel (non-native) environment may further reduce genetic diversity. However, some field-collected populations of subspecies crinitum (e.g., Avcilar, Dendril and Seydisehir, Turkey) also exhibit similarly low diversity, and some PI accessions (Uzumluk, Tukey, Afghanistan 4 and Karagali, Kazahkstan) do exhibit higher amounts of genetic diversity (data not shown). Thus, the low genetic diversity detected for subspecies crinitum, especially for some populations from eastern Turkey, Iran and Afghanistan, may reflect a regional pattern, and not be due to factors associated with how these populations were sampled. Resolving this issue can only be accomplished through the analysis of more populations of subspecies crinitum from this region.
Genetic relationships among the three subspecies of T. caput-medusae is illustrated by the UPGMA cluster diagram (Figure 4). Populations of subspecies asperum exhibit the highest amount of genetic differentiation (and variation) as indicated by the occurrence of subspecies asperum populations throughout the cluster diagram. For example, Clusters 1 and 4 are exclusively composed of only populations of subspecies asperum, and these two clusters are highly diverged. Cluster 4 includes populations from Italy and Morocco, with populations from these two countries exhibiting relatively long branch lengths, suggesting that these populations are relatively well differentiated. Cluster 1 includes populations of subspecies asperum that possess genotypes that either match or are very similar to the genotypes detected in populations of T. caput-medusae subspecies asperum from western U.S. [56]. A detailed comparison of the genetic diversity of these native populations with that of western U.S. populations will provide insights into the geographic origins and genetic consequences (e.g., founder effects) of this invasion.
Cluster 2 includes all 20 populations of subspecies caput-medusae included in this study, as well as eight populations of subspecies asperum form either Spain or Morocco (Figure 4). Several of the populations of subspecies caput-medusae and subspecies asperum that co-occur in Cluster 2 share six MLGs (Table S3). Thus, genetic results agree with morphological data and suggest that certain subspecies asperum and subspecies caput-medusae populations (especially from Spain and Morocco) are morphologically and genetically similar. Taken together, these data further support the possibility of hybridization occurring between these two subspecies in regions where their geographic distributions overlap.
Cluster 3 primarily consists of populations of subspecies crinitum (Figure 4). The short branch lengths observed for 21 of the 28 populations of subspecies crinitum included in this analysis indicate a low level of genetic differentiation among these populations. Two populations of subspecies asperum (Orosei, Sardinia, Italy and Iran 1) also occur in Cluster 3, indicating that both populations are genetically more similar to populations of subspecies crinitum than they are to other populations of subspecies asperum. This is true even though these two populations of subspecies asperum do not share any MLGs with populations of subspecies crinitum (Table S3). The population from Orosei, Sardinia, Italy is in the UPGMA cluster diagram with the population of subspecies crinitum from Lunguaglossa/Mt. Etna, Sicily, Italy. Individuals from Orosei and Lunguaglossa/Mt. Etna exhibit morphological overlap (Figure 3b); and Orosei shares more alleles with populations of crinitum than it does with other populations of subspecies asperum (including other populations from Sardinia). As observed for populations of subspecies asperum and subspecies caput-medusae from Spain and Morocco, these data suggest that hybridization may be occurring between subspecies asperum and subspecies crinitum (or at least intermediate forms are present) in regions where their distributions overlap.
Most of the total genetic diversity assessed using AMOVA is partitioned among the subspecies (48.4%) and among populations within subspecies (44.2%), indicating high genetic structure associated with the three subspecies (Table 3). This result is supported by data on the distribution of MLGs (Table S3): only six MLGs are shared between subspecies asperum and caput-medusae and the remaining 93 genotypes are found exclusively in one subspecies, or another. Additionally, very little diversity is partitioned within populations (7.2%) and within individuals (0.25%) (Table 3). The pattern by which genetic diversity is distributed among and within native subspecies and populations of T. caput-medusae is typical with that reported for highly self-pollinating plant species [76,78]. Indeed, values for mean observed heterozygosity (Hobs) reported for the three subspecies (Table 2), suggest exceedingly high rates of self-pollination. Future research should examine and compare the level of heterozygosity of native and invasive populations of T. caput-medusae to assess the role of mating system in the invasion of this grass in the western U.S.
The timely and accurate identification of introduced species is critical in their management [16]. Taxonomic complexity arises when multiple, morphologically similar subspecies have been recognized within a species’ native range, and this complexity is accentuated by the presence of intermediate morphological forms among these subspecies. These intermediate forms are likely to occur because of hybridization events.
5. Conclusions
Results of morphological characters, crossing studies, and chromosome pairing studies conducted by Frederiksen [38} and Frederiksen and von Bothmer [44} revealed an indistinct boundary between three taxa; thus, Frederiksen [38] recognized three subspecies, rather than the three species described by Nevski [42]. Using the taxonomic revision described by Frederiksen [38] we found that 1) the morphological traits associated with spikes and seeds are robust and useful in identifying the three subspecies of T. caput-medusae, 2) the three subspecies of this grass show genetic differentiation with a small amount of overlap, 3) individuals with intermediate morphological and genetic traits occur in areas where the geographic distributions of two subspecies overlap, and 4) subspecies asperum, the subspecies with the broadest distribution in the native range, is the most genetically diverse of the three subspecies. Based on this understanding of the taxonomic complexity associated with the three subspecies of T. caput-medusae, future analyses comparing native and introduced populations of this species will likely lead to a better understanding of this invasion in the western U.S. and how it can be managed.
Supplementary Materials
The following supporting information can be downloaded at the website of this paper posted on Preprints.org., TableS1: Latitude/longitude Coordinates, date of collection, and the type of data collected for all populations of Taeniatherum caput-medusae included in this study. Types of data collected: G indicates population included in the genetic analysis, M for those included in the morphological analysis, and B for populations included in both analyses. *Population provided by Signe Frederiksen; Table S2: Summary statistics for the three statistically significant morphological characters for each subspecies of Taeniatherum caput-medusae. n is the sample size. Glume length and palea length are measured in millimeters. Glume angle is measured in degrees; Table S3: Multilocus genotypes detected in each of the three subspecies of Taeniatherum caput-medusae, based on the allele at each of the scored loci. Letters represent the allele at each locus.
Author Contributions
Conceptualization, R.F.H.S. and S.J.N..; methodology, M.L.H., R.F.H.S., J.F.S., M.D.S., and S.J.N.; data curation, M.L.H. and S.J.N., data analysis and evaluation, M.L.H., R.F.H.S., J.F.S., M.D.S., and S.J.N.; writing – original draft preparation, M.L.H. and S.J.N.; writing – review and editing, M.L.H., R.F.H.S., J.F.S., M.D.S., and S.J.N.; funding acquisition, S.J.N. and R.F.H.S. All authors have read and agreed to the published version of the manuscript.
Funding
Funding for this research was obtained by SJN by the United States Department of Agriculture, National Institute of Food and Agriculture (USDA, NIFA), Project Number IDAR-2008-03063 and the Faculty Research Program at Boise State University. Additional funding for foreign travel was provided by R.F.H.S. and the United States Department of Agriculture, European Biological Control Laboratory (USDA-ARS-EBCL).
Acknowledgments
The authors thank Kevin Hansen, Kelly Burdon, Vivian Zapata, and Yves Tindón for their enthusiasm and help in the laboratory and in the greenhouse. MLH extends her appreciation to Lacie Schulte, Emma Wilson, Allison Korte, Kevin (Gus) Gluckert, Michael Davis, her family, and her husband, Erik Hinkle, for their continuous support while working on this project. Finally, all authors acknowledge the Bar Gernika Evolution Group for many a Friday night engaging in wide-ranging discussions over tasty beverages.
Conflicts of Interest
The authors declare no conflict of interest.
References
- Mack, R.N.; Simberloff, D.; Lonsdale, W.M.; Evans, H.; Clout, M.; Bazzaz, F.A. Biotic invasions: causes, epidemiology, global consequences, and control. Ecol. Applic. 2000, 10, 689–710. [Google Scholar] [CrossRef]
- Bossdorf, O.; Auge, H.; Lafuma, L.; Rogers, W.E.; Siemann, E.; Prati, D. Phenotypic and genetic differentiation between native and introduced plant populations. Oecologia 2005, 144, 1–11. [Google Scholar] [CrossRef] [PubMed]
- Simberloff, D.; Rejmanek, M. Encyclopedia of biological invasions. University of California Press, Berkeley, California, USA, 2011.
- Lockwood, J.L. , Hoopes, M.F.; Marchetti, M.M. Invasion Ecology. 2nd Ed. Wiley-Blackwell Publishing, Oxford, UK, 2013.
- D’Antonio, C.M.; Vitousek, P.M. Biological invasion by exotic grasses, the grass/fire cycle and global change. Annu. Rev. Ecol. Syst. 1992, 23, 63–87. [Google Scholar] [CrossRef]
- Simberloff, D.; Martin, J.L.; Genovesi, P.; Maris, V.; Wardle, D.A.; Aronson, J.; Courchamp, F.; Galil, B.; Garcia-Berthou, E.; Pascal, M.; Pysek, P. Impacts of biological invasions: what’s what and the way forward. Trends Ecol. Evol. 2013, 28, 58–66. [Google Scholar] [CrossRef]
- Gaertner, M.; Biggs, R.; Beest, M.T.; Hui, C.; Molofsky, J.; Richardson, D.M. Invasive plants as drivers of regime shifts: identifying high-priority invaders that alter feedback relationships. Divers. Distrib. 2014, 20, 733–744. [Google Scholar] [CrossRef]
- Bellard, C.; Cassey, P.; Blackburn, T.M. Alien species as a driver of recent extinctions. Ecol. Lett. 2016, 12, 20150623. [Google Scholar] [CrossRef]
- Pimental, D. : Zuniga, R.; Morrison, D. Update on the environmental and economic costs associated with alien-invasive species in the United States. Ecol. Econ. 2005, 52, 273–288. [Google Scholar] [CrossRef]
- Vitousek, P.M.; D’Antonio, C.M.; Loope, L.L.; Westbrooks, R. Biological invasion as global environmental change. Amer. Sci. 1996, 84, 468–478. [Google Scholar]
- Sala, O.E. ; Chapin, III, F.S.; Armesto, J.J.; Berlow, E.; Bloomfield, J.; Dirzo, R.; Huber-Sandwald, E.; Huenneke, L.F.; Jackson, R.B.; Kinzig, A.; Leemans, R.; Lodge, D.M.; Mooney, H.A.; Oesterheld, M.; Poff, N.L.; Sykes, M.T.; Walker, B.H.; Walker, M.; Wall, D.H. Global biodiversity scenarios for the year 2100. Science, 1770. [Google Scholar]
- Colautti, R.I.; MacIsaac, H.J. A neutral terminology to define ‘invasive’ species. Div. Distrib. 2004, 10, 135–141. [Google Scholar] [CrossRef]
- Groves, R.H.; Di Castri, F. Biogeography of Mediterranean Invasions, Cambridge University Press, Cambridge, Massachusetts, USA, 1991.
- Hierro, J.L.; Maron, J.L.; Callaway, R.M. A biogeographical approach to plant invasions: the importance of studying exotics in their introduced and native range. J. Ecol. 2005, 93, 5–15. [Google Scholar] [CrossRef]
- Sax, D.F.; Stachowicz, J.J.; Gaines, S.D. Species invasions: insights into ecology evolution and biogeography. Sinauer, Sunderland, Massachusetts, 2005.
- Wittenberg, R.; Cock, M.J.W. (2005) Best practices for the prevention and management of invasive alien species. In Invasive alien species, a new synthesis; Mooney, H.A., Mack, R.N., McNeely, J.A., Neville, L.E., Schei, P.J., Waage, J.K., Eds.; Island Press, Washington, D.C., 2005; pp. 209-232.
- Ricciardi, A.; Steiner, W.W.M.; Mack, R.N.; Simberloff, D. Toward a global information system for invasive species. BioScience 2000, 50, 239–244. [Google Scholar] [CrossRef]
- D’Antonio, C.M.; Jackson, N.E.; Horvitz, C.C.; Hedberg, R. Invasive plants in wildland ecosystems: merging the study of invasion process with management need. Front. Ecol. Environ. 2004, 2, 513–521. [Google Scholar] [CrossRef]
- Reichard, S.H.; Hamilton, C.W. Predicting invasions of woody plants introduced into North America. Consv. Biol. 1997, 11, 193–203. [Google Scholar] [CrossRef]
- Kriticos, D.J.; Sutherst, R.W.; Brown, J.R.; Adkins, S.W.; Maywald, G.F. Climate change and the potential distribution of an invasive alien plant: Acacia nilotica ssp. indica in Australia. J. App. Ecol. 2003, 40, 111–124. [Google Scholar] [CrossRef]
- Wardill, T.J.; Graham, G.C.; Zalucki, M.; Palmer, W.A.; Playford, J.; Scott, K.D. The importance of species identity in the biocontrol process: identifying the subspecies of Acacia nilotica (Leguminosae: Mimosoideae) by genetic distance and the implications for biological control. J. Biogeogr. 2005, 32, 2145–2159. [Google Scholar] [CrossRef]
- Khatoon, S.; Ali. S.I. Hybridization in Acacia nilotica complex in Indo-Pakistan subcontinent: cytological evidence. Pak. J. Bot. 2006, 38, 63–66. [Google Scholar]
- Hufbauer, R.A.; Sforza, R. Multiple introductions of two invasive Centaurea taxa inferred from cpDNA haplotypes. Div. Distrib. 2008, 14, 252–261. [Google Scholar] [CrossRef]
- Marrs, R.A.; Sforza, R.; Hufbauer, R.A. When invasion increases population genetic structure: a study with Centaurea diffusa. Biol. Invas. 2008, 10, 561–572. [Google Scholar] [CrossRef]
- Trowbridge, C.D. (2001) Coexistence of introduced and native congeneric algae: Codium fragile and C. tomentosum on Irish rocky shores. J. Mar. Biol. Assoc. UK 2008, 81, 931–937. [Google Scholar] [CrossRef]
- Provan, J.; Murphy, S.; Maggs, C.A. Tracking the invasive history of the green alga Codium fragile ssp. tomentosoides. Mol. Ecol. 2005, 14, 189–194. [Google Scholar] [CrossRef]
- Saltonstall, K. Cryptic invasion by a non-native genotype of the common reed, Phragmites australis, into North America. Proc. Natl. Acad. Sci. USA 2002, 99, 2445–2449. [Google Scholar] [CrossRef] [PubMed]
- Saltonstall, K.; Peterson, P.M.; Soreng, R.J. Recognition of Phragmites australis subsp. americanus (Poaceae: Arunidnoideae) in North America: evidence from morphological and genetic analyses. SIDA 2004, 21, 683–692. [Google Scholar]
- Meyerson, L.A.; Saltonstall, K.; Chambers, R.M. Phragmites australis in easter North America: a historical and ecological perspective. In Human impacts on salt marshes: a global perspective; 2009. [Google Scholar]
- Mummenhoff, K.; Bruggermann, H.; Bowman, J.L. Chloroplast DNA phylogeny and biogeography of Lepidium (Brassicaceae). Am. J. Bot. 2001, 88, 2051–2063. [Google Scholar] [CrossRef] [PubMed]
- Al-Shehbaz, I.A.; Mummenhoff, K.; Appel, O. Cardaria, Coronopus, and Stroganowia are united with Lepidium (Brassicaceae). Novon, 2002, 12, 5–11. [Google Scholar] [CrossRef]
- Gaskin, J.F.; Zhang, D-Y. ; Bon, M-C. Invasion of Lepidium draba (Brassicaceae) in the western United States: distributions and origins of chloroplast DNA haplotypes. Mol. Ecol. 2005, 14, 2331–2341. [Google Scholar] [CrossRef]
- Clausen, J.; Hiesey, W.M. Experimental studies on the nature of species. IV. Genetic structure of ecological races. Carnegie Inst. Washington Publ., Washington, D. C.
- Kriticos, D.J.; Brown, J.R.; Radford, I.; Nicholas, M. Plant population ecology and biological control: Acacia nilotica as a case study. Biol. Control 1999, 16, 230–239. [Google Scholar] [CrossRef]
- Bickford D,: Lohman, D. J. ; Sodhi, N.S. ; Ng, P.K.L. Cryptic species as a window on diversity and conservation. Trends Ecol. Evol. 2007, 22, 148–155. [Google Scholar] [CrossRef]
- Palmer, W.A.; Lockett, C.J.; Senaratne, K.A.D.W.; McLennan, A. The introduction and release of Chiasmia inconspicua and C. assimilis (Lepidoptera: Geometridae) for the biological control of Acacia nilotica in Australia. Biol. Control 2007, 41, 368-378.
- Gaskin, J.F. ; Bon, M-C.; Cock, M.J.W.; Cristofaro, M.; DeBiase, A., De Clerck-Floate, R.; Ellison, C.A.; Hinz, H.L.; Hufbauer, R.A.; Julien, M.H.; Sforza, R. Applying molecular based approaches to classical biological control of weeds. Biol. Control 2011, 58, 1–21.
- Frederiksen, S. Revision of Taeniatherum (Poaceae). Nord. J. Bot. 1986, 6, 389–397. [Google Scholar] [CrossRef]
- Linnaeus, C. Species Plantarum. I. Ed. 1. Stockholm, Sweeden, 1753.
- Schreber, J.C.D. Beschreibung der Graser. 2,1. Leipzig, Germany, 1772.
- Link, H.F. Hortus Regius Botanicus Berolinensis. I. Berlin, Germany, 1827.
- Nevski, S.A. Schedae ad Herbarium Florae Asiae Mediae. Acta Univ. Asiae Med. VIII b. Botanica 1934, 17, 1–94. [Google Scholar]
- Humphries, C. Variation in Taeniatherum caput-medusae (L. ) Nevski. Bot. J. Lineean Soc. 1978, 76, 340–344. [Google Scholar]
- Frederiksen, S.; von Bothmer, R. Relationships in Taeniatherum (Poaceae). Canad. J. Bot. 1986, 10, 2343–2347. [Google Scholar] [CrossRef]
- Dahl, B.E.; Tisdale, E.W. Environmental factors related to medusahead distributrion. J. Range Manag. 1975, 28, 463–468. [Google Scholar] [CrossRef]
- Hironaka, M. Medusahead: natural successor to the cheatgrass type in the northern Great Basin. Proceedings - Ecology, Management, and Restoration of Intermountain Annual Rangelands, INT-GTR-313: 89-91, USDA Forest Service.
- McKell, C.M.; Robison, J.P.; Major, J. Ecotypic variation in medusahead, an introduced annual grass. Ecology, 1962, 43, 686–698. [Google Scholar] [CrossRef]
- Young, J.A.; Evans, R.A. Ecology and management of medusahead (Taeniatherum caput-medusae ssp. asperum (Simk) Melderis). Great Basin Natur. 1970, 52, 245–252. [Google Scholar]
- Young, J. Ecology and management of medusahead (Taeniatherum caput-medusae subspecies asperum [Simk.] Melderis). Great Basin Natur. 1992, 52, 245–252. [Google Scholar]
- Miller, H.C.; Clausnitzer, D.; Borman, M.M. Borman. Medusahead. In Biology and Management of Noxious Rangeland Weeds; Sheley, R.L., Petroff, J.K., Eds.; Oregon State University Press, Corvallis, Oregon, 1999; pp. 271-281.
- Blank, R.R.; Sforza, R. Plant–soil relationships of the invasive annual grass Taeniatherum caput-medusae: a reciprocal transplant experiment. Plant Soil 2007, 298, 7–19. [Google Scholar] [CrossRef]
- Major, J.; McKell, C.M.; Berry, L.J. Improvement of medusahead infested rangeland. California Agricultural Experiment Station Extension Service, 1960, Leaflet 123.
- Kostivkovosky, V.; Young, J. Invasive exotic rangeland weeds: a glimpse at some of their native habitats. Rangelands, 2000, 22, 3–6. [Google Scholar] [CrossRef]
- Hickman, J. The Jepson manual: Higher plants of California. University of California Press, Berkeley, California, USA, 1993.
- Rowe, G.; Sweet, M.; Beebee, T. An introduction to molecular ecology. 3rd Ed. Oxford University Press, Oxford, UK, 2017.
- Marsh, D.R.; Deines, L.; Rausch, J.H.; Tindon, Y.; Sforza, R.F.H.; Melton, A.E.; Novak, S.J. Reconstructing the introduction of the invasive grass Taeniatherum caput-medusae subspecies asperum in the western United States: low within-population genetic diversity does not preclude invasion. Amer. J. Bot. 2025, In press.
- Soltis, D.E.; Haufler, C.H.; Darrow, D.C.; Gastony, G.L. Starch gel electrophoresis of ferns: a compilation of grinding buffers, gel and electrode buffers, and staining schedules. Amer. Fern J. 1983, 73, 9–27. [Google Scholar] [CrossRef]
- Novak, S.J.; Mack, R.N.; Soltis, D.E. Genetic variation in Bromus tectorum (Poaceae): population differentiation in its North American range. Amer. J. Bot. 1991, 78, 1150–1161. [Google Scholar] [CrossRef]
- Gottlieb, L.D. Conservation and duplication of isozymes in plants. Science 1982, 216, 373–380. [Google Scholar] [CrossRef]
- Weeden, N.F.; Wendel, J.F. Genetics of plant isozymes. In Isozymes in plant biology; Soltis, D.E., Soltis, P.S. Eds.; Diorscorides Press, Portland, Oregon, 1989; pp. 46-72.
- SAS Institute. SAS user’s guide, version 9.1. SAS Institute, Inc., Cary, North Carolina, 2002.
- Rice, W.R. Analyzing tables of statistical tests. Evolution 1989, 43, 223–225. [Google Scholar] [CrossRef] [PubMed]
- Yeh, F.C. , Boyle, T.J.B. Population genetic analysis of co-dominant and dominant markers and quantitative traits. Belgian J. Bot. 1997, 129, 157. [Google Scholar]
- Nei, M. Estimation of average heterozygosity and genetic distance from a small number of individuals. Genetics 1978, 89, 583–590. [Google Scholar] [CrossRef] [PubMed]
- Excoffier, L.; Laval, G.; Schneider, S. Arlequin (version 3.0): an integrated software package for population genetics data analysis. Evol. Bioinform. 2005, 1, 47–50. [Google Scholar] [CrossRef]
- Dewey, D.R. The Hordeum violaceum complex of Iran. Amer. J. Bot. 1979, 66, 166–172. [Google Scholar] [CrossRef]
- Baum, B.R.; Bailey, L.G. Key and synopsis of North American Hordeum species. Canad. J. Bot. 1990, 68, 2433–2442. [Google Scholar] [CrossRef]
- Murphy, M.A. Relationships among taxa of Elymus (Poaceae: Triticeae) in Australia: reproductive biology. Austr. Syst. Bot. 2003, 16, 633–642. [Google Scholar] [CrossRef]
- Frederiksen, S.; Peterson, G. Morphometric analyses of Secale L. (Triticeae, Poaceae). Nord. J. Bot. 1997, 17, 185–198. [Google Scholar] [CrossRef]
- Cabi, E.; Dogan, M. Taxonomic study of the genus Eremophyrum (Ledeb.) Jaub. et Spach (Poaceae) in Turkey. Plant Syst. Evol. 2010, 287, 129–140. [Google Scholar] [CrossRef]
- Barkworth, M.E.; Culter, D.R.; Rollo, J.S.; Jacobs, S.W.L.; Rashid, A. Morphological identification of genomic genera in the Triticeae. Breed. Sci. 2009, 59, 561–570. [Google Scholar] [CrossRef]
- Kharazian, N.; Rahiminejad, M.R. Evaluation of diagnostic reproductive and vegetative characters among tetraploid Triticum L. species (Poaceae; Triticeae) in Iran. Turk. J. Bot. 2005, 29, 283–289. [Google Scholar]
- Schall, B.A. (1984) Life-history variation, natural selection, and maternal effects in plant populations. In Perspectives on plant population biology; Dirzo, R., Sarukhan, J. Eds.; Sinauer, Sunderland, Massachusetts, 1984; pp. 166-187.
- Roach, D.A.; Wulff, R.D. Maternal effects in plants. Ann. Rev. Ecol. Syst. 1987, 18, 209–235. [Google Scholar] [CrossRef]
- Falconer, D.S.; Mackay, T.F.C. Introduction to quantitative genetics, 4th Ed. Addison Wesley Longman, Harlow, UK, 1996.
- Hamrick JL, Godt, M.J.W. (1989) Allozyme diversity in plant species. In Plant Population Genetics, Breeding and Genetic Resources; Brown, A.H.D., Clegg, M.T., Kahler, A., Weir, B.S. Eds.; Sinauer, Sunderland, Massachusetts, 1989; pp. 43-63.
- Karron, J.D. A comparison of levels of genetic polymorphism and self-compatibility in geographically restricted and widespread plant congeners. Evol. Ecol. 1989, 1, 47–58. [Google Scholar] [CrossRef]
- Hamrick, J.L.; Godt, M.J.W. Effects of life history traits on genetic diversity in plants. Phil. Trans. Roy. Soc. London B 1996, 351, 1291–1298. [Google Scholar]
Figure 2.
Histograms showing means and significant differences among the three subspecies of Taeniatherum caput-medusae for the three significant morphological characters: (a) glume length, (b) glume angle, and (c) palea length. Letters above bars denote SKN groupings for significantly different means. Lengths are measured in millimeters; angles are measured in degrees.
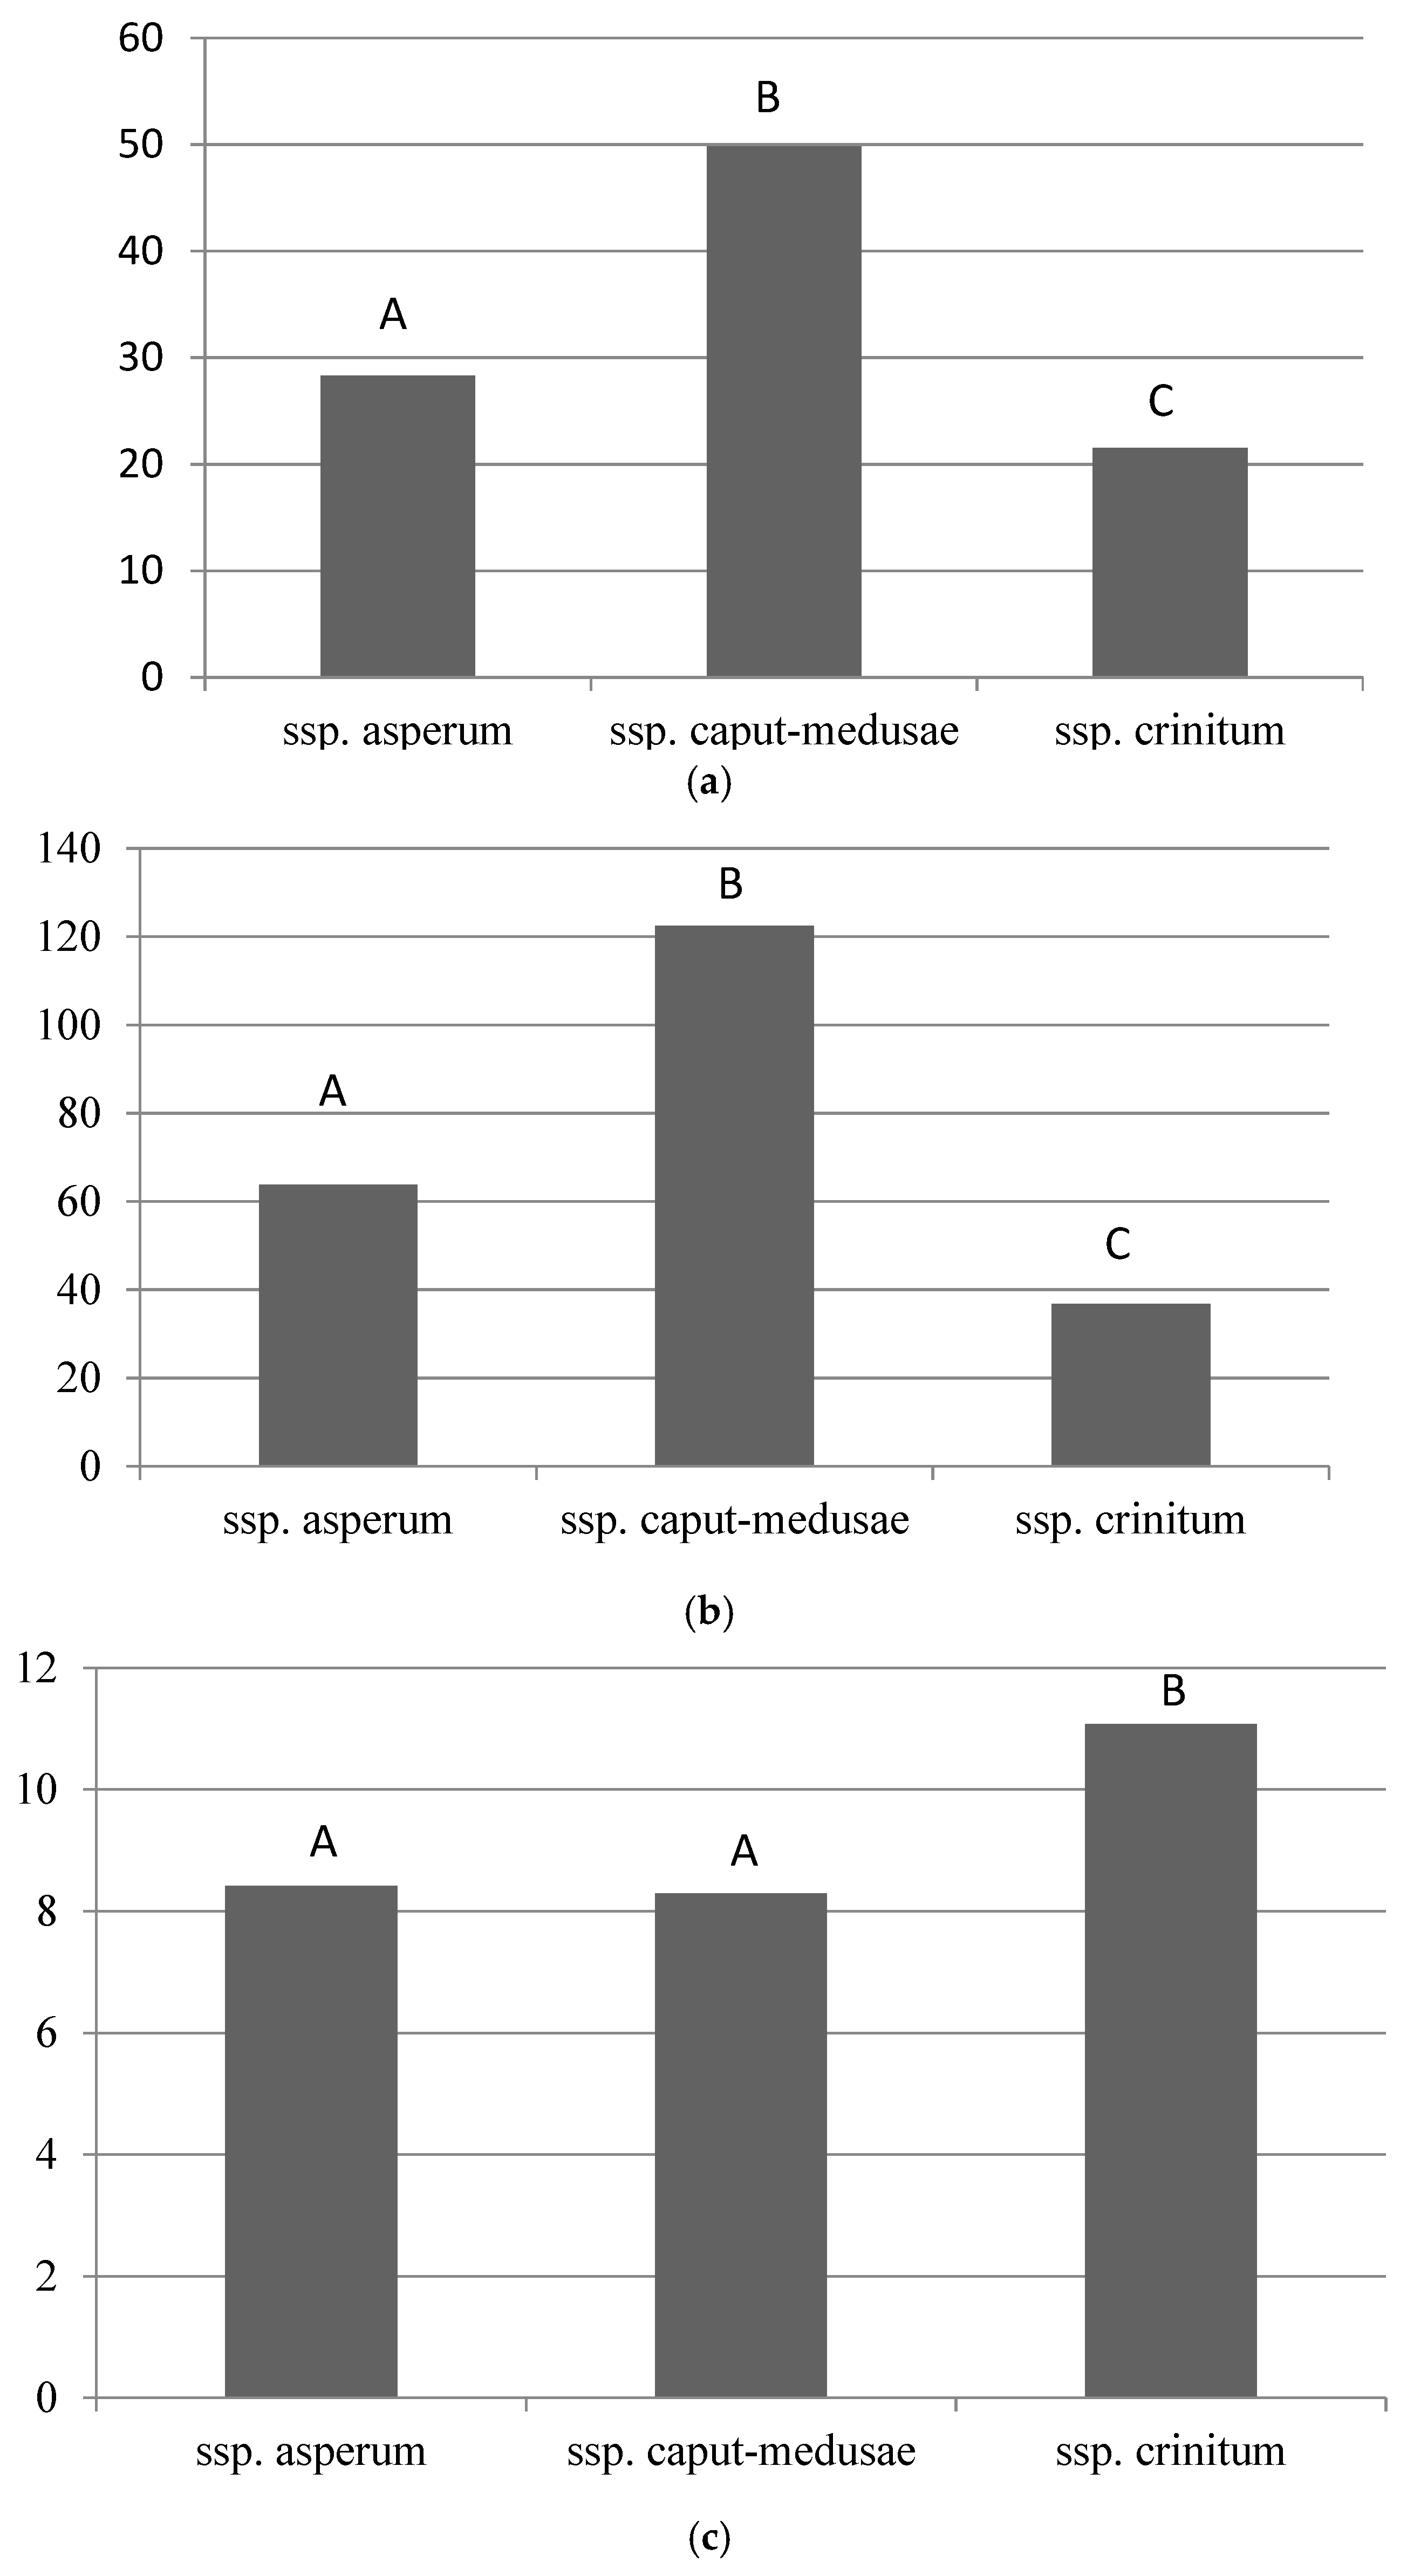
Figure 3.
Three-dimensional scatter plots based on the three significant morphological characters for (a) 81 populations and (b) 384 individuals of the three subspecies of Taeniatherum caput-medusae. Red symbols indicate subspecies asperum populations and individuals, blue symbols indicate subspecies caput-medusae populations and individuals, and green symbols indicate subspecies crinitum populations and individuals. .
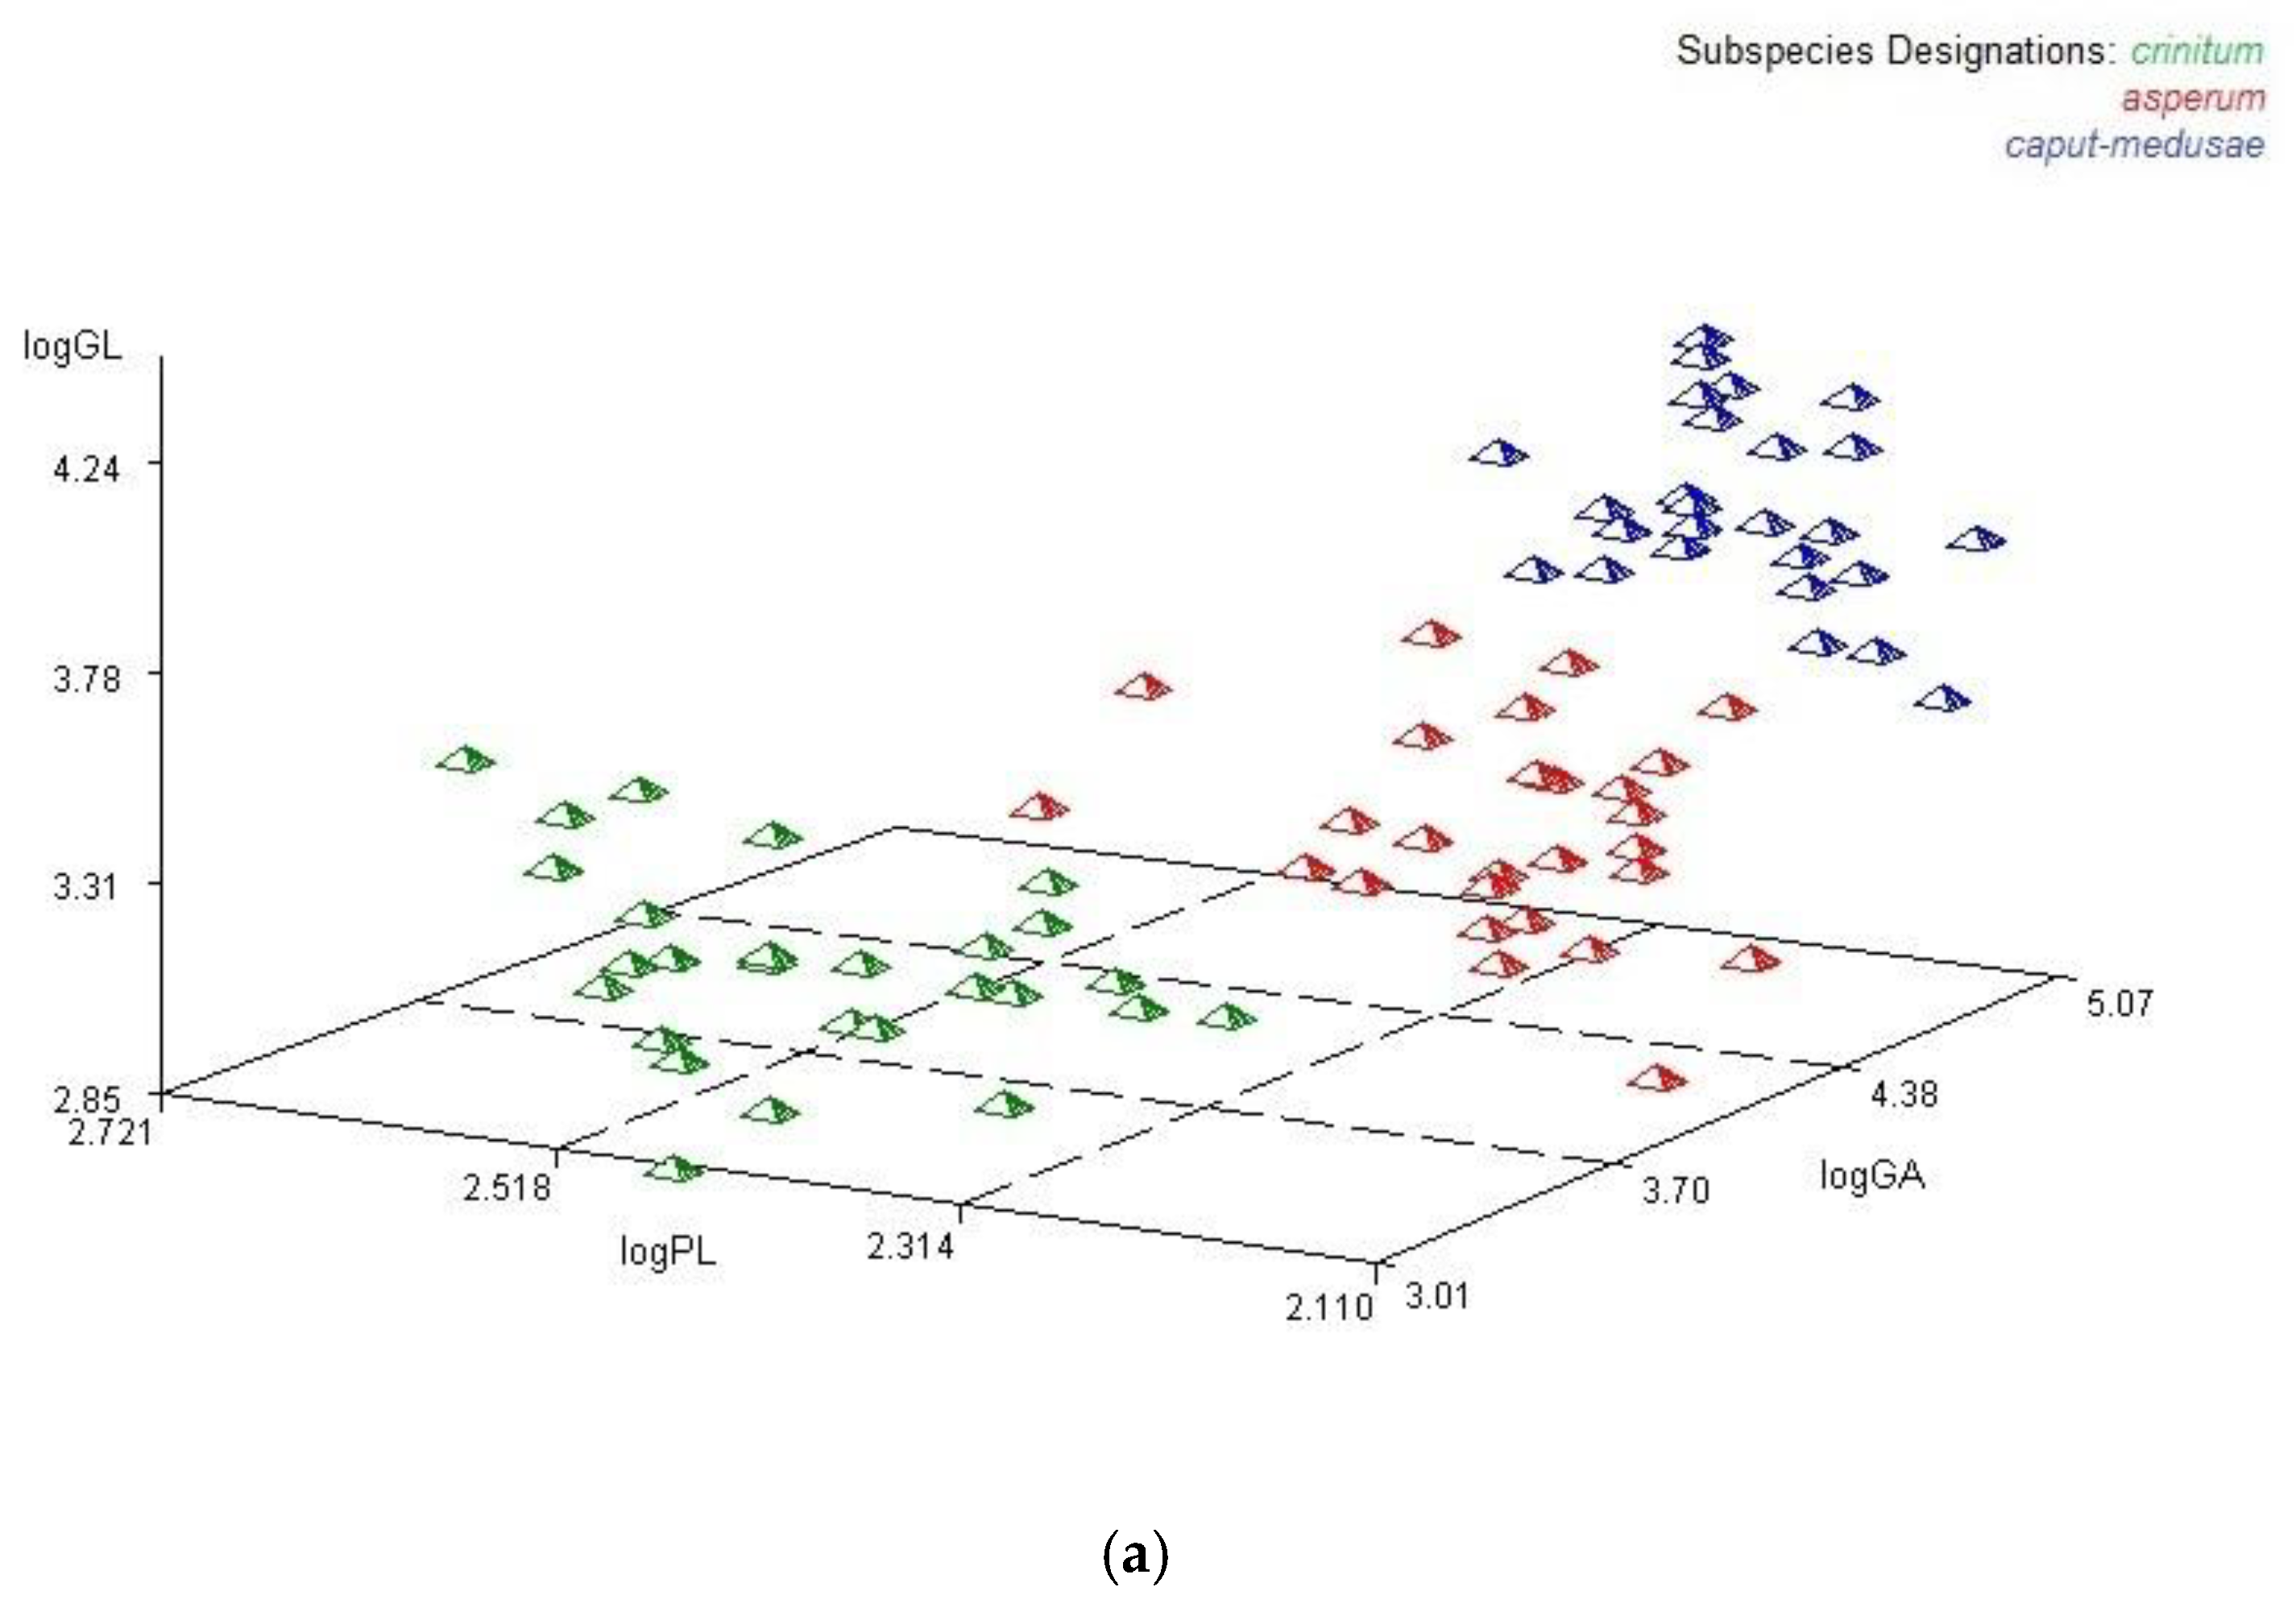
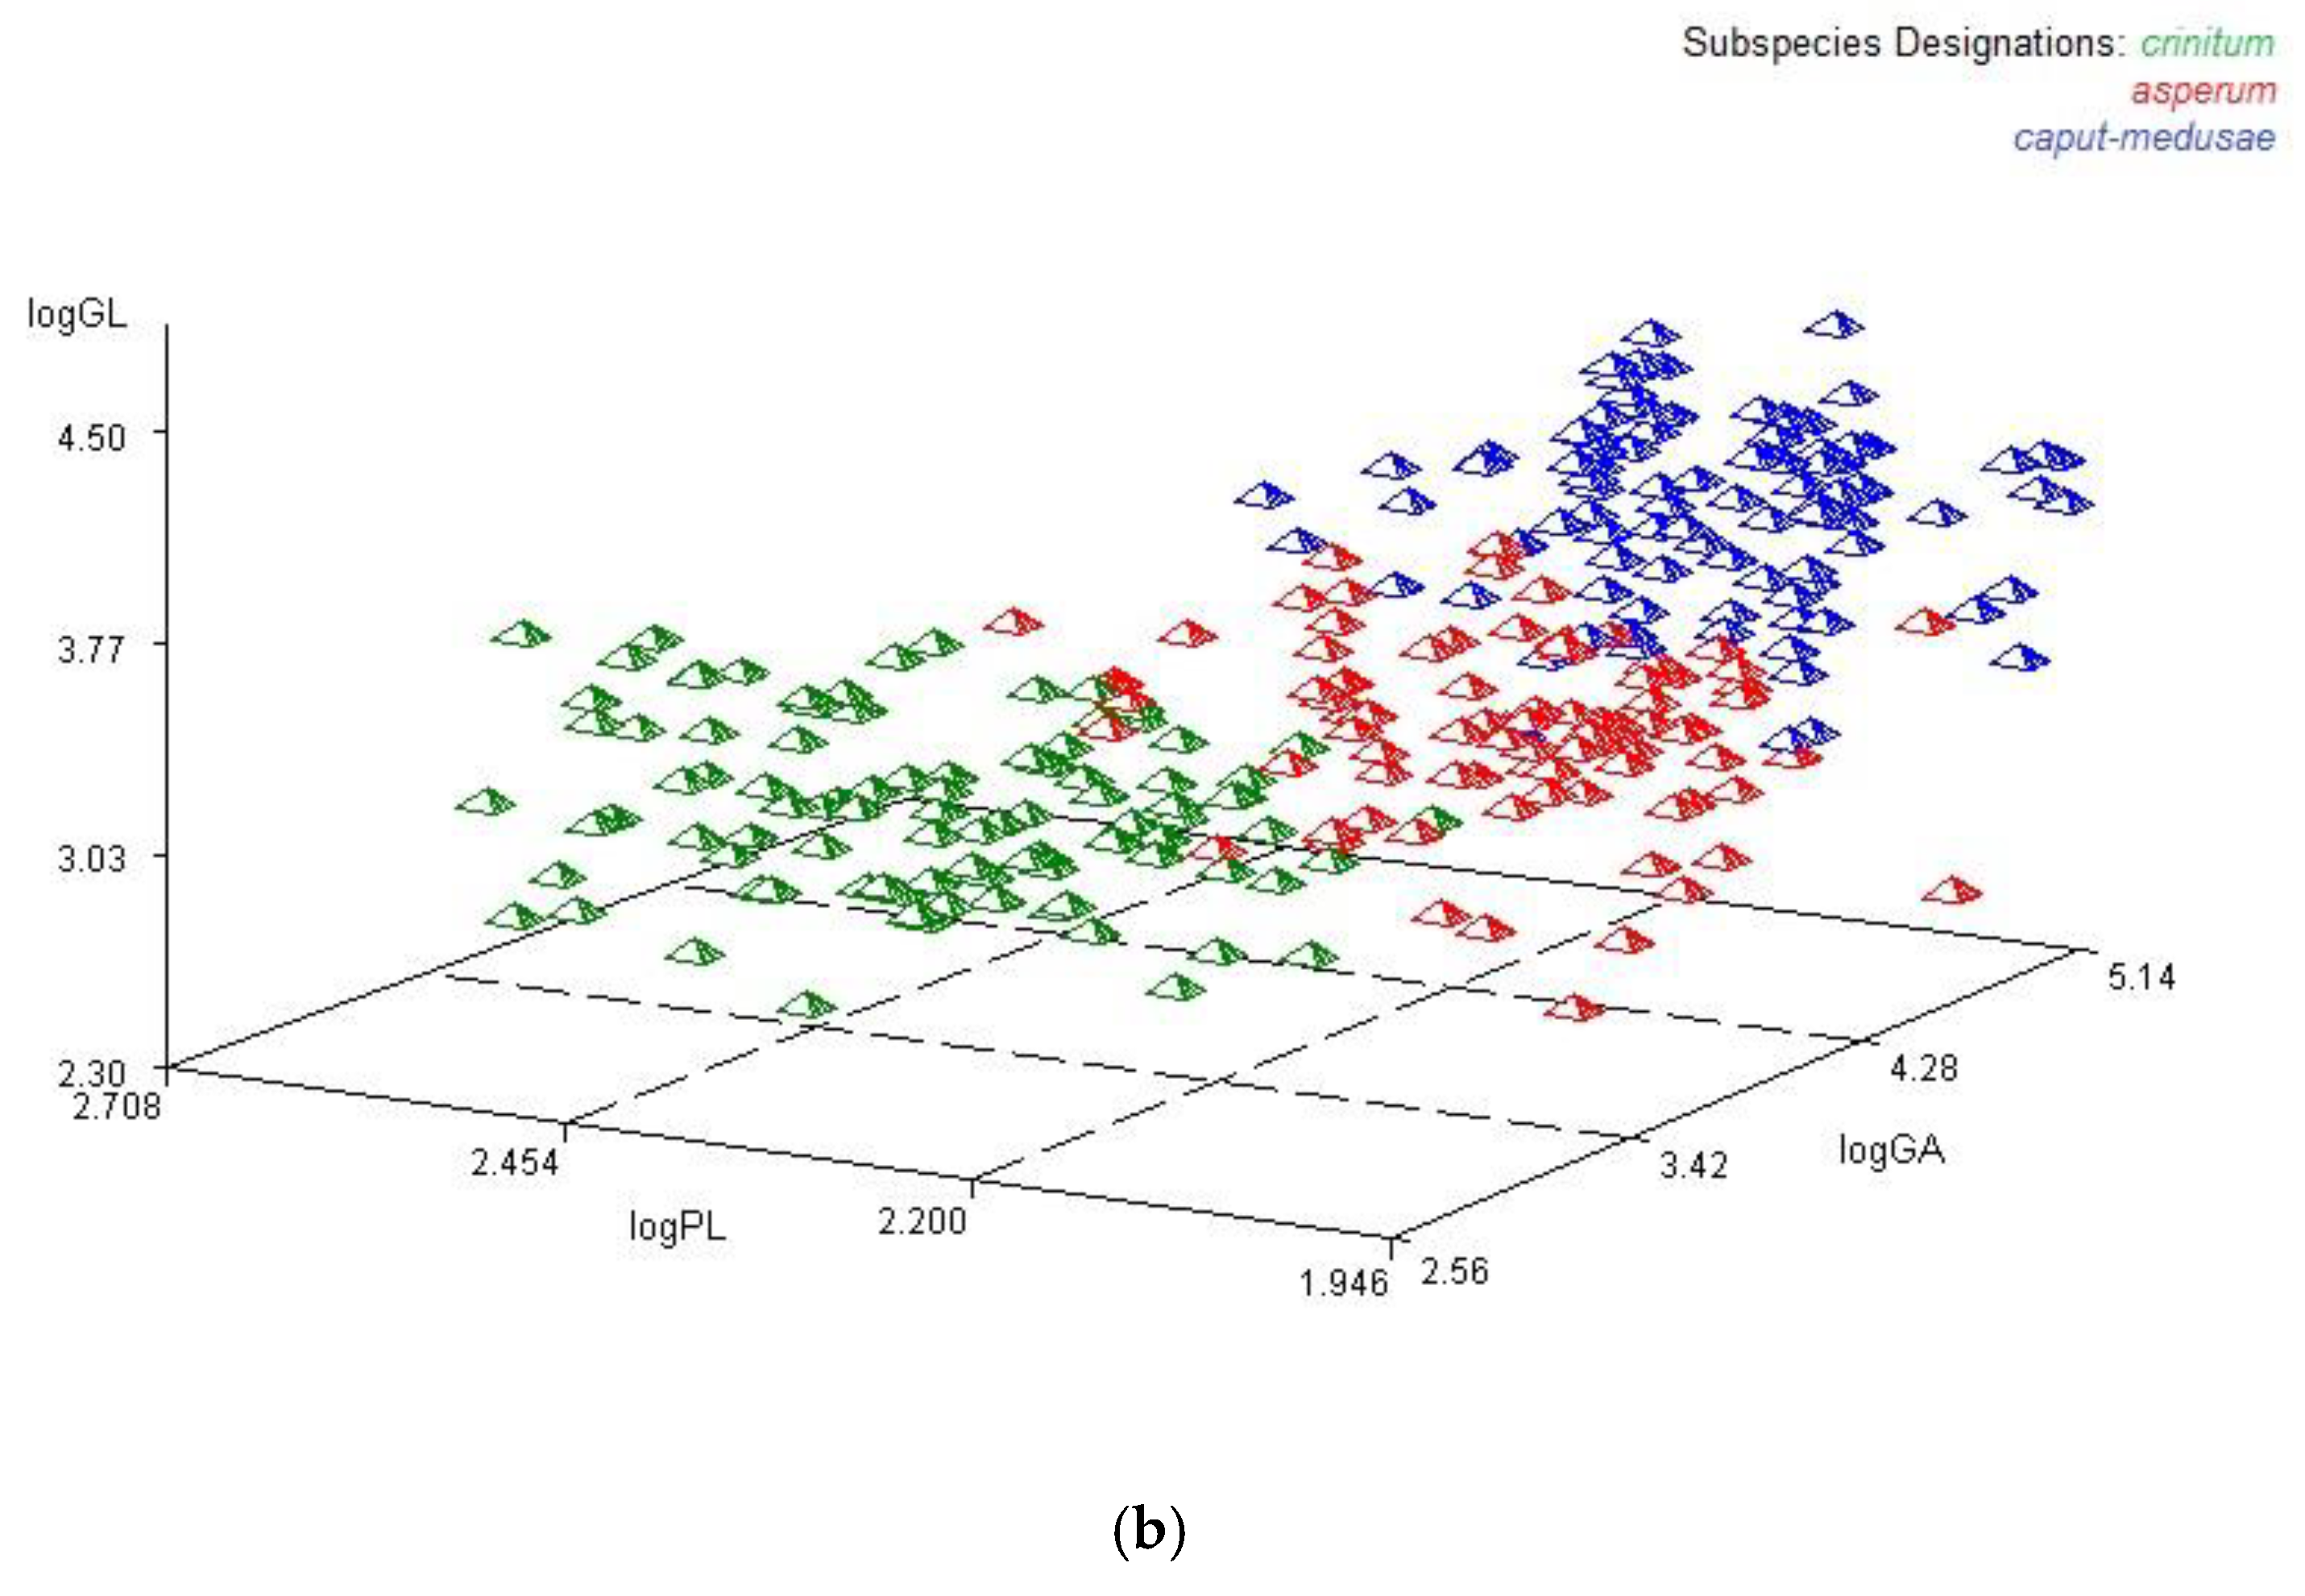
Figure 4.
UPGMA cluster diagram of 82 native populations of Taeniatherum caput-medusae. The population from Villaviciosa de Cordoba, Spain, consisted of subspecies asperum and subspecies caput-medusae, indicated here by an ‘A’ and ‘C’, respectively. The population from Guzelkonak, Turkey, consisted of subspecies asperum and subspecies crinitum, indicated here by an ‘A’ and ‘C’, respectively. Populations of subspecies asperum are indicated by the red font, populations of subspecies caput-medusae are indicated by the blue font, and populations of subspecies crinitum are indicated by the green font.
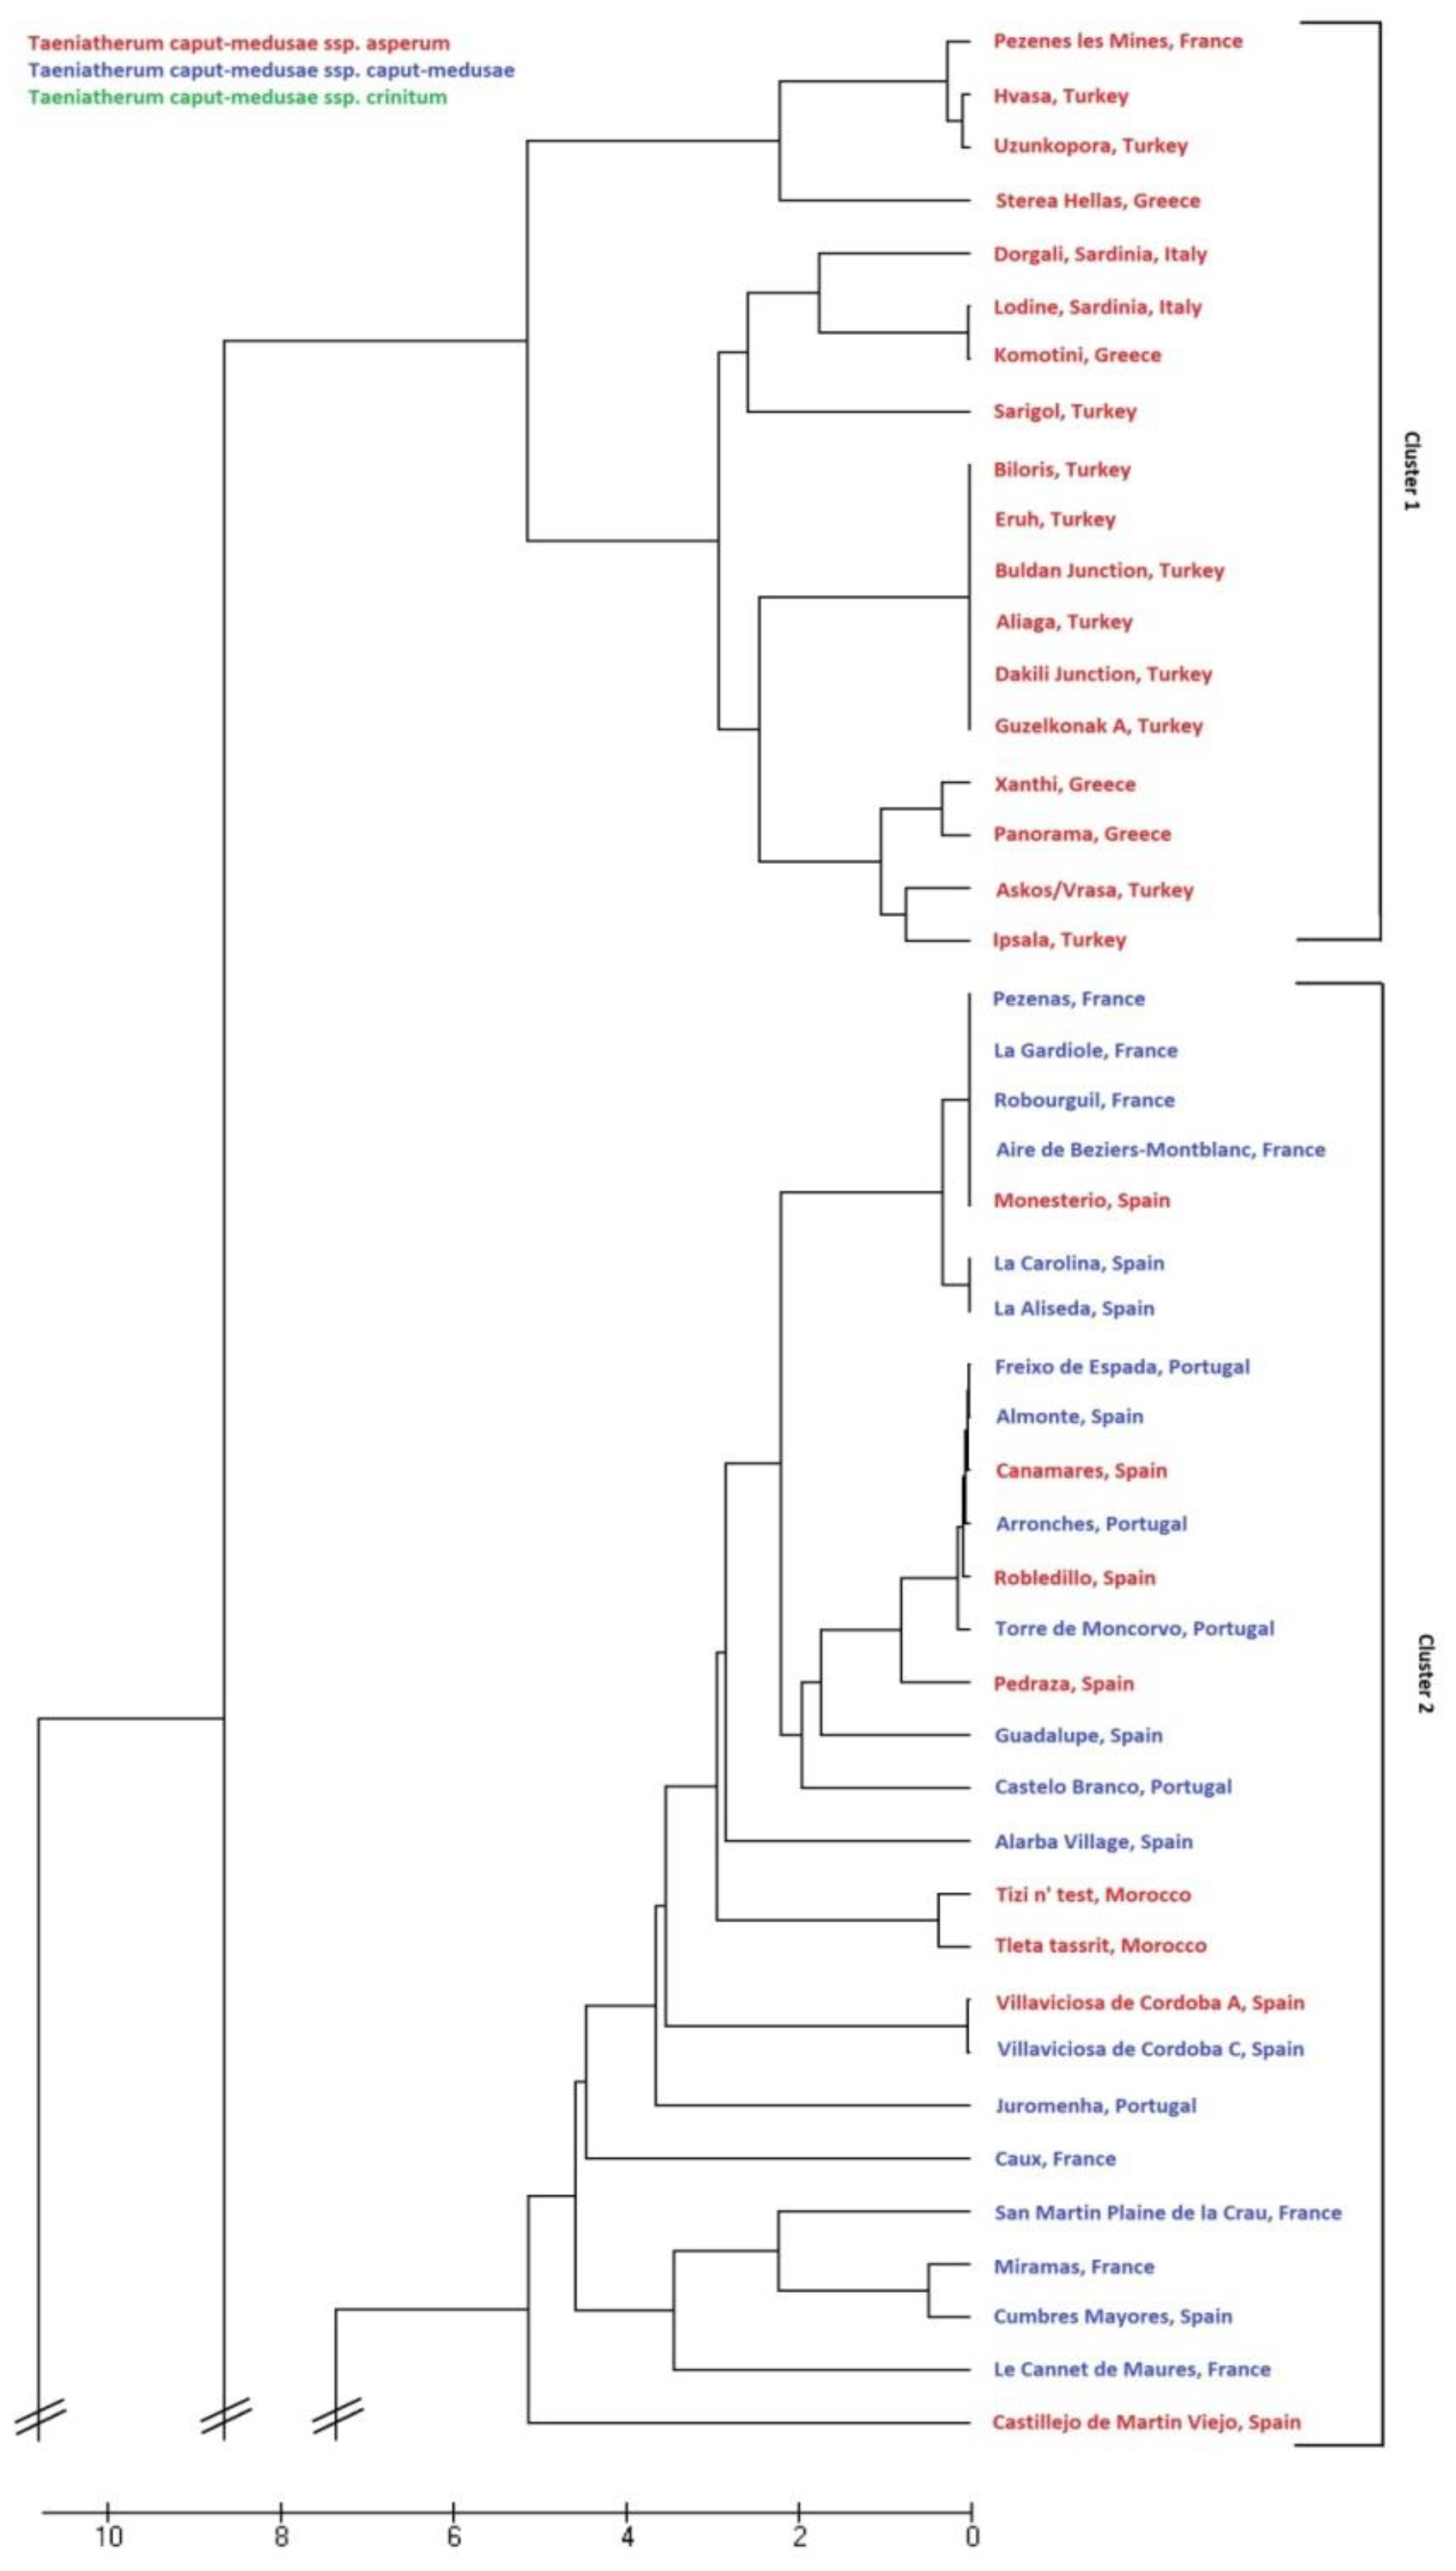
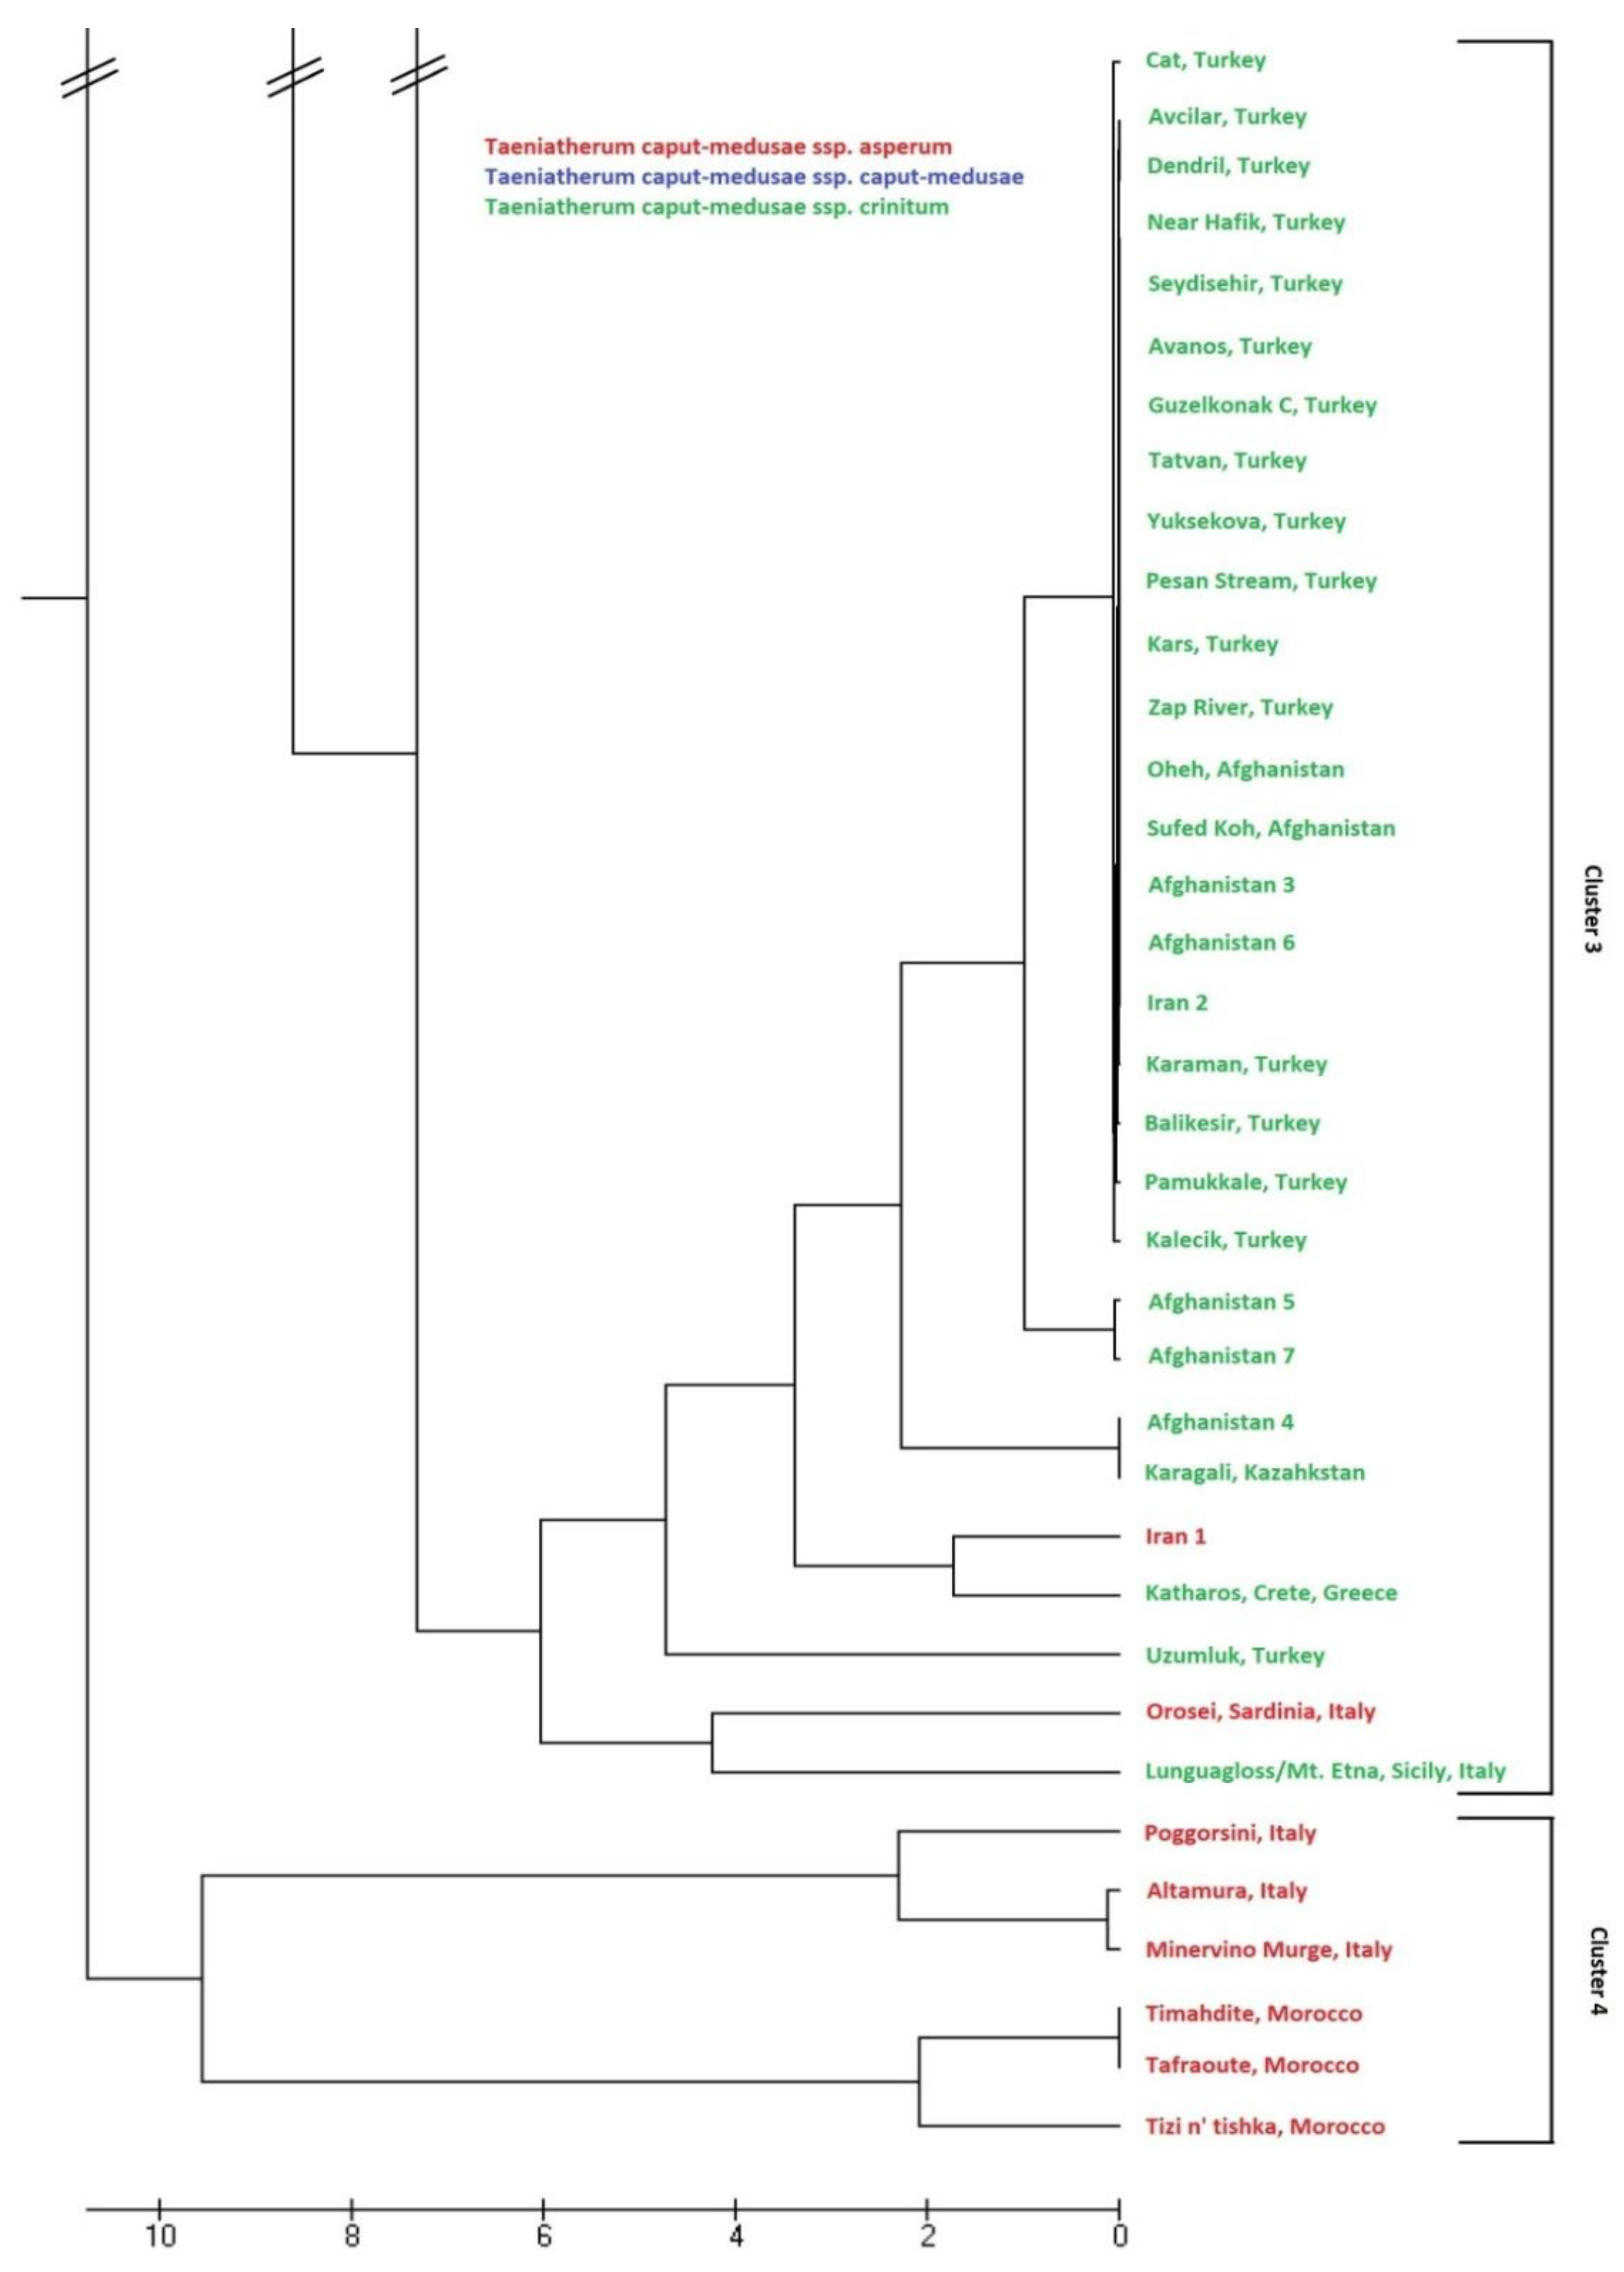

Table 1.
The five morphological characters described by Frederiksen [38] for distinguishing the three subspecies of Taeniatherum caput-medusae.
Table 1.
The five morphological characters described by Frederiksen [38] for distinguishing the three subspecies of Taeniatherum caput-medusae.
| Morphological character | subsp. asperum | subsp. crinitum | subsp. caput-medusae |
| Glume length | 1.5 - 4.0 cm | 1.5 - 3.5 cm | 3.5 - 8.0 cm |
| Glume angle | Curved | Erect | Horizontal or reflexed downward |
| Palea length | 5.0 - 9.5 mm | 10.0 - 13.5 mm | 5.0 - 8.5 mm |
| Lemma surface: hairs | Scabrous | Glabrous | Glabrous |
| Lemma surface: conical cells | Many prominent conical cells | Without prominent conical cells | Without prominent conical cells |
Table 2.
Genetic diversity parameters within and among (i.e., overall) populations of the three subspecies of Taeniatherum caput-medusae. n is the number of populations for each subspecies.
Table 2.
Genetic diversity parameters within and among (i.e., overall) populations of the three subspecies of Taeniatherum caput-medusae. n is the number of populations for each subspecies.
| subsp. asperum (n=34) | subsp. caput-medusae (n=20) | subsp. crinitum (n=28) | Overall | |
| # Alleles | 48 | 36 | 33 | 50 |
| Alleles/Locus | 2.09 | 1.57 | 1.43 | 2.17 |
| # Polymorphic Loci | 15 | 10 | 9 | 16 |
| %Polymorphic Loci | 65.22% | 43.48% | 39.13% | 69.57% |
| %Polymorphic Populations | 67.64% | 50.00% | 39.29% | 53.66% |
| Nei's Expected Mean Heterozygosity | 0.1408 | 0.0725 | 0.0258 | 0.1314 |
| Mean Observed Heterozygosity | 0.00003 | 0.00000 | 0.00003 | 0.00002 |
| FST | 0.8423 | 0.8663 | 0.8285 | 0.9081 |
| NM | 0.0468 | 0.0386 | 0.0518 | 0.0253 |
| # of Multilocus Genotypes | 66 | 22 | 11 | 93 |
Table 3.
Hierarchical Analysis of Molecular Variance (AMOVA) for 82 native populations of Taeniatherum caput-medusae.
Table 3.
Hierarchical Analysis of Molecular Variance (AMOVA) for 82 native populations of Taeniatherum caput-medusae.
| d.f | Sum of Squares | Variation Component | Percentage Variation | |
| Among subspecies | 2 | 2561.552 | 0.86506 | 48.38 |
| Among populations within subspecies | 75 | 3455.088 | 0.79073 | 44.22 |
| Among individuals within populations | 2194 | 571.854 | 0.12845 | 7.18 |
| Within individuals | 2272 | 8.500 | 0.00374 | 0.21 |
| Total | 4543 | 6686.994 | 1.78799 | -- |
Disclaimer/Publisher’s Note: The statements, opinions and data contained in all publications are solely those of the individual author(s) and contributor(s) and not of MDPI and/or the editor(s). MDPI and/or the editor(s) disclaim responsibility for any injury to people or property resulting from any ideas, methods, instructions or products referred to in the content. |
© 2025 by the authors. Licensee MDPI, Basel, Switzerland. This article is an open access article distributed under the terms and conditions of the Creative Commons Attribution (CC BY) license (https://creativecommons.org/licenses/by/4.0/).
Copyright: This open access article is published under a Creative Commons CC BY 4.0 license, which permit the free download, distribution, and reuse, provided that the author and preprint are cited in any reuse.


