
Submitted:
26 December 2024
Posted:
27 December 2024
You are already at the latest version
Abstract
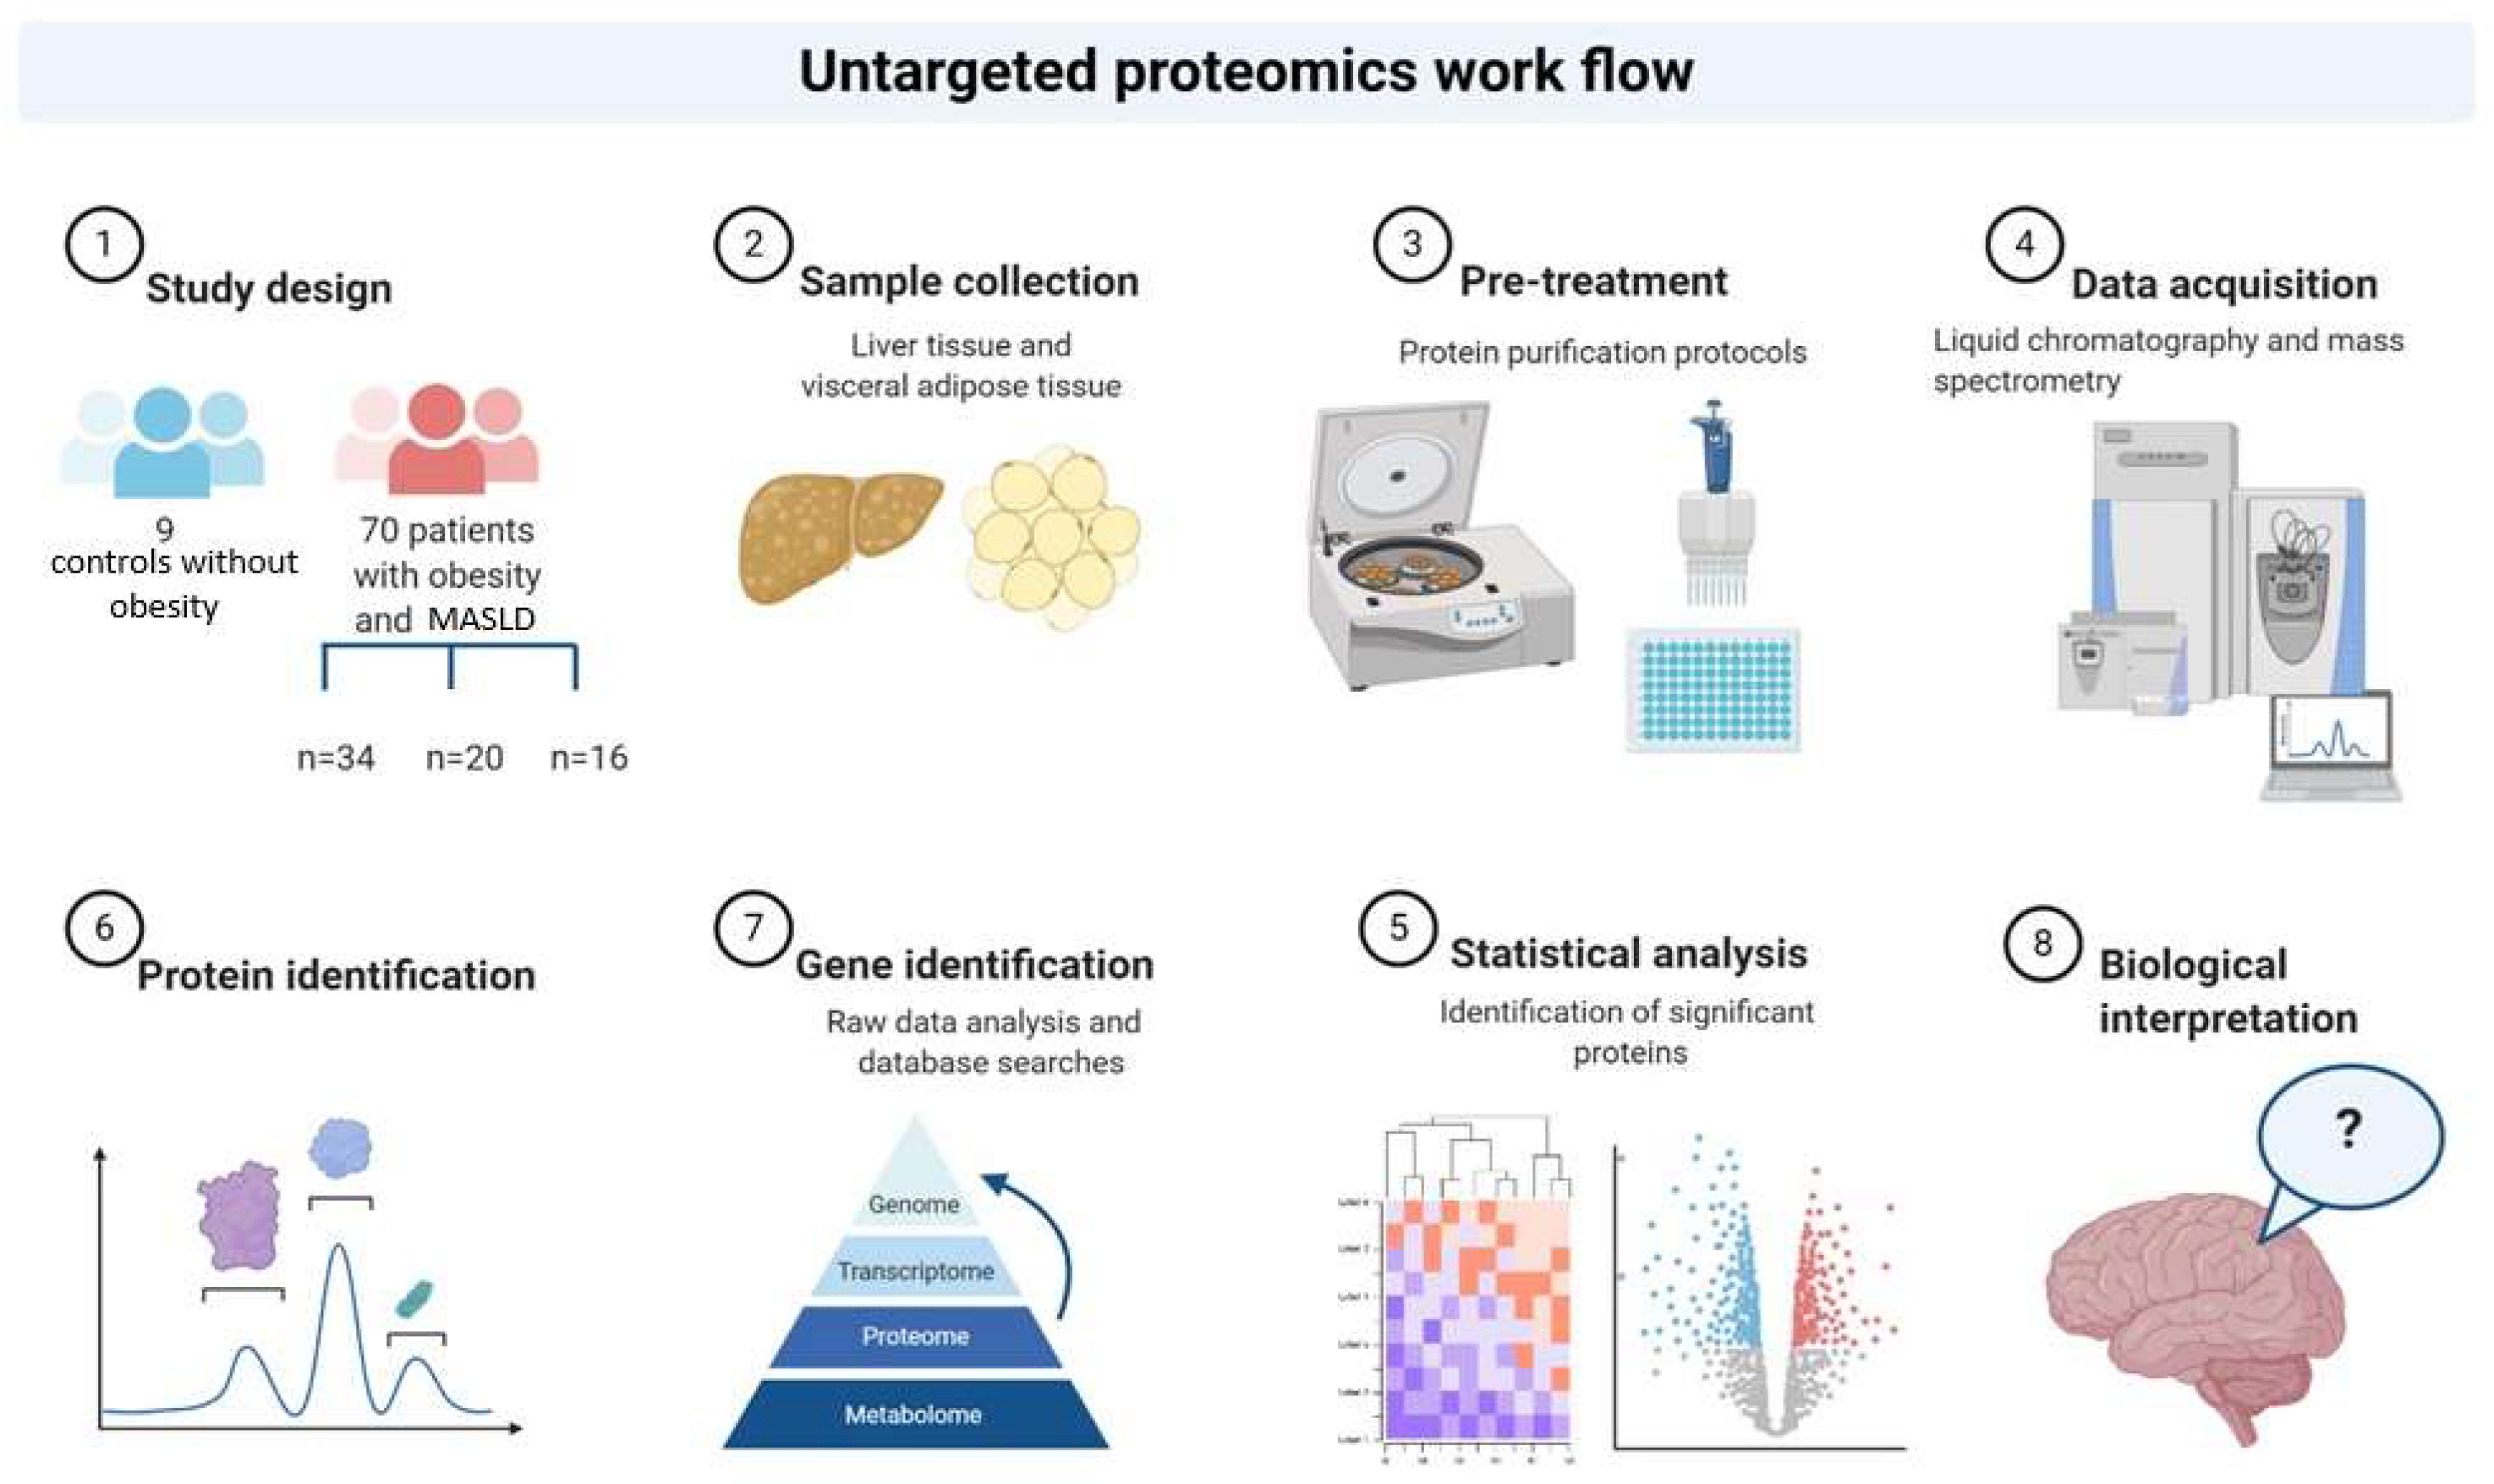
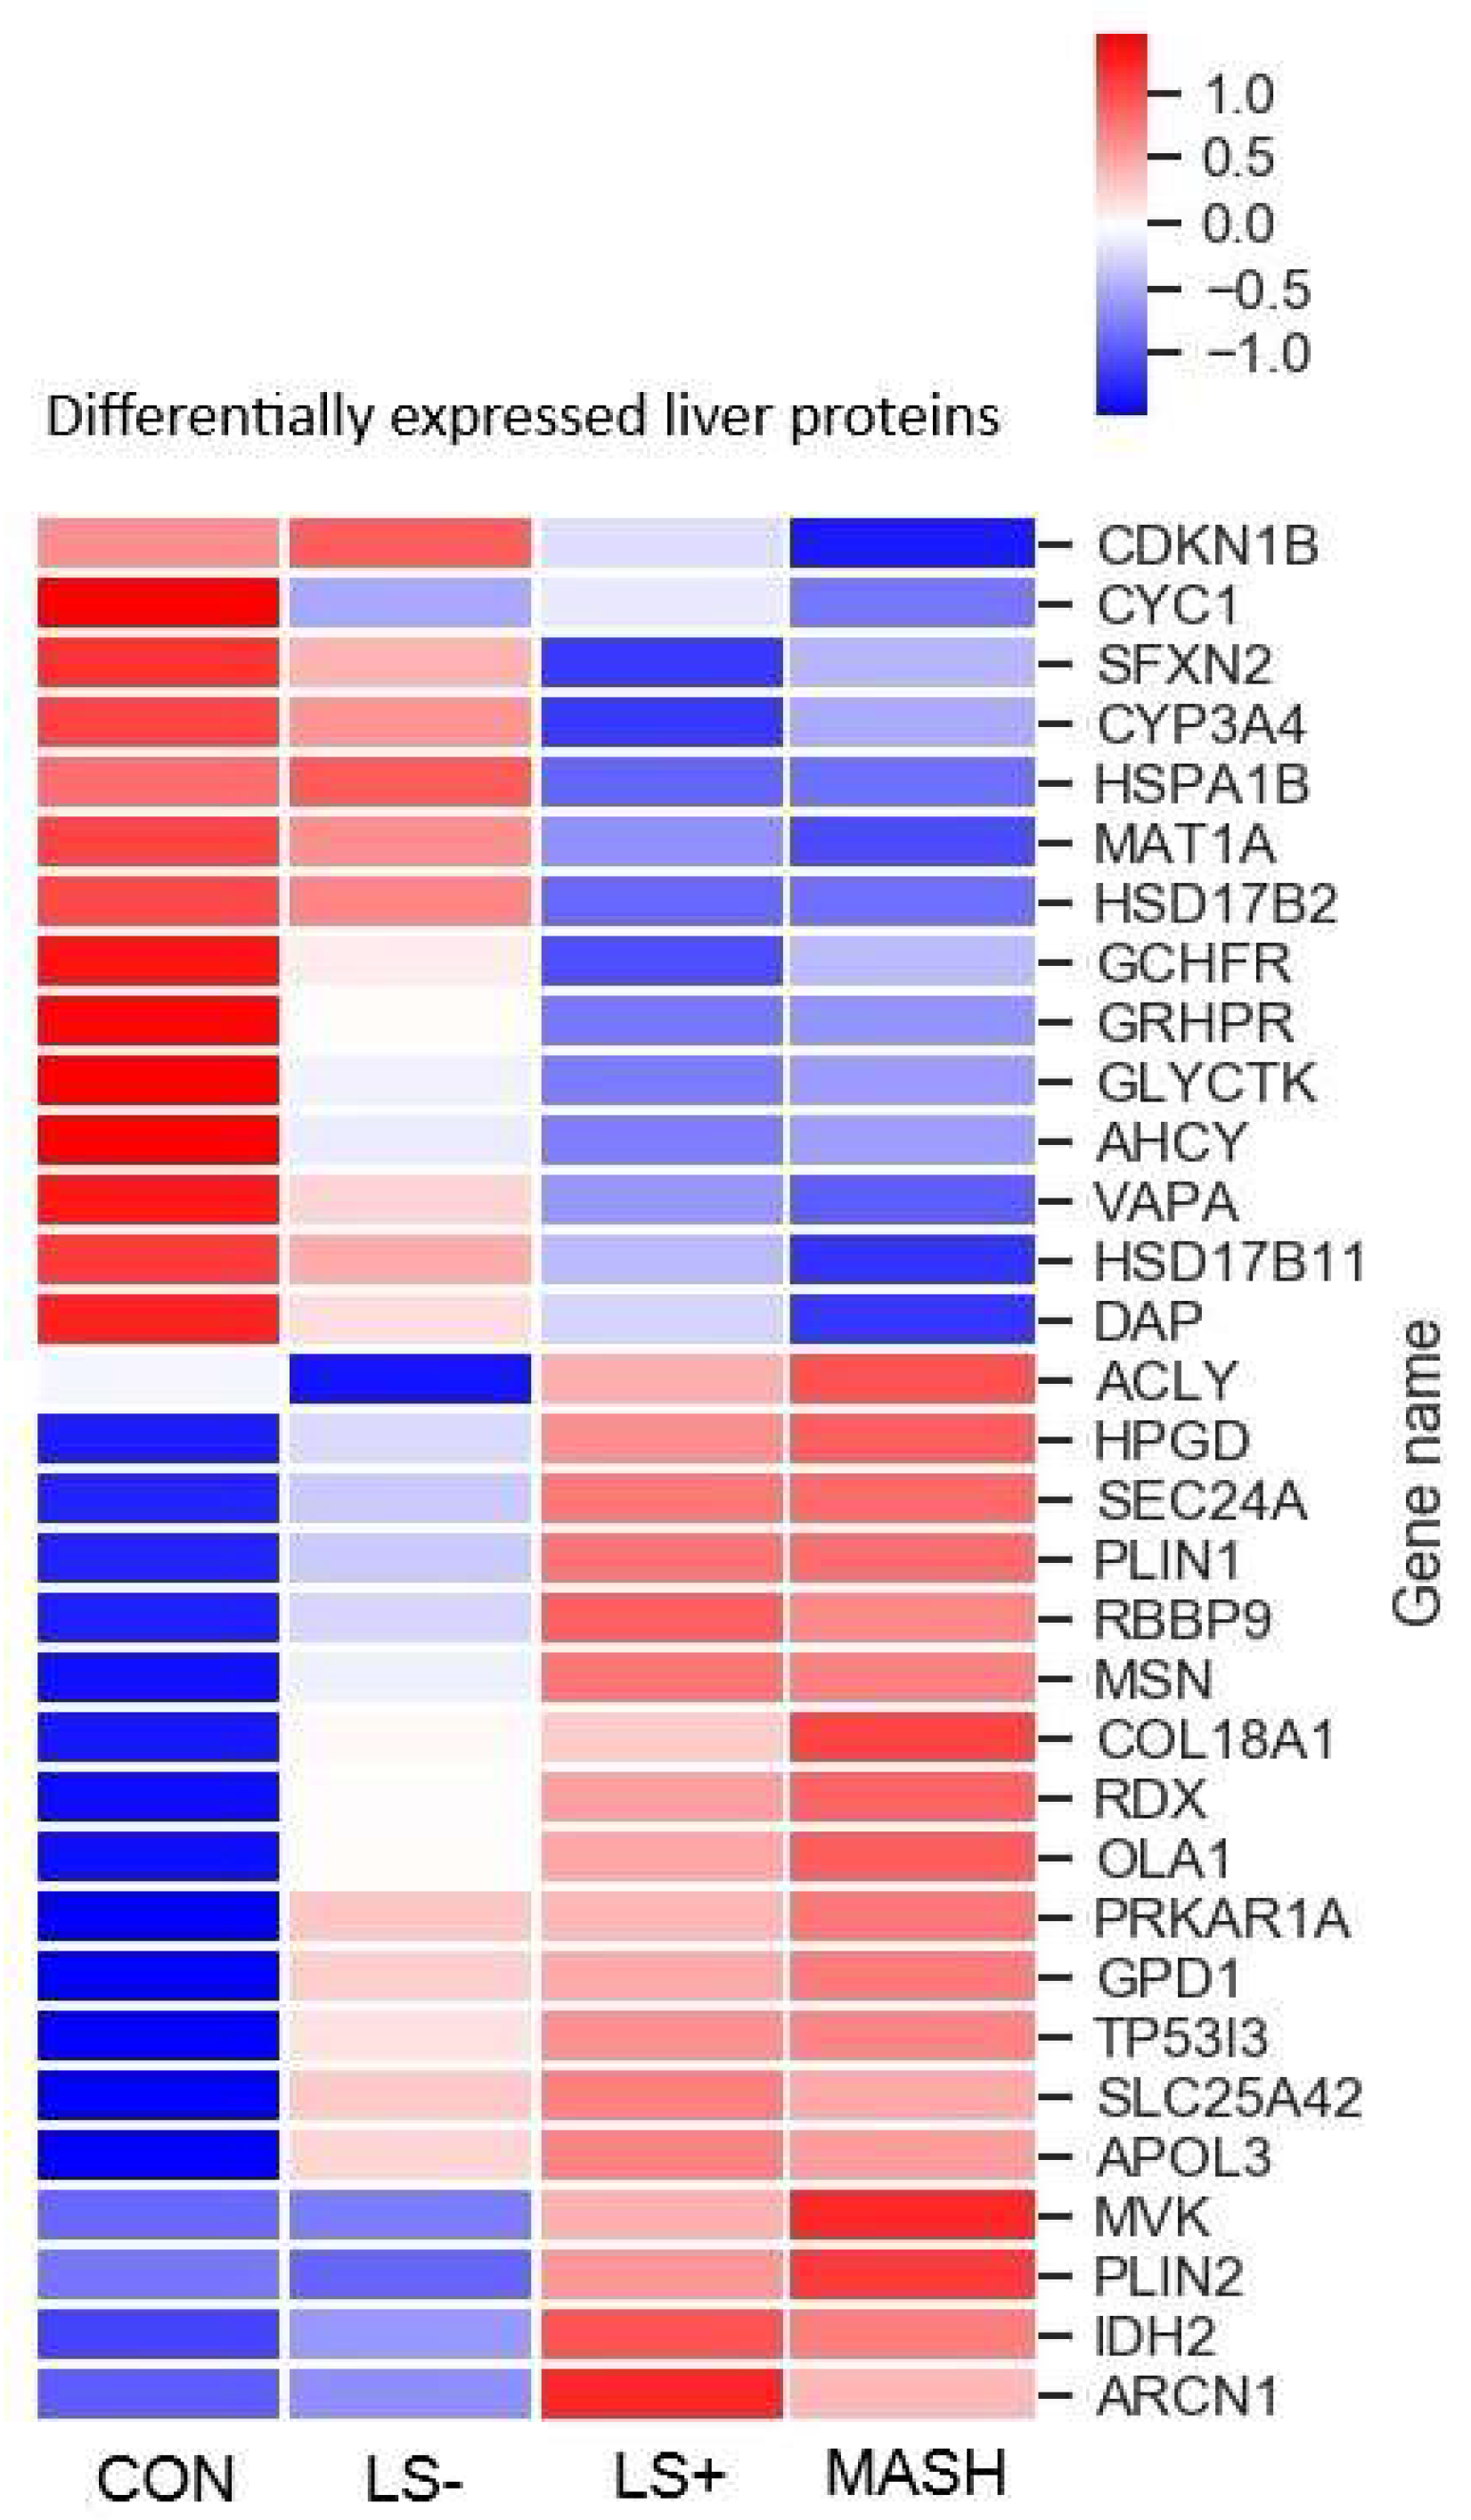
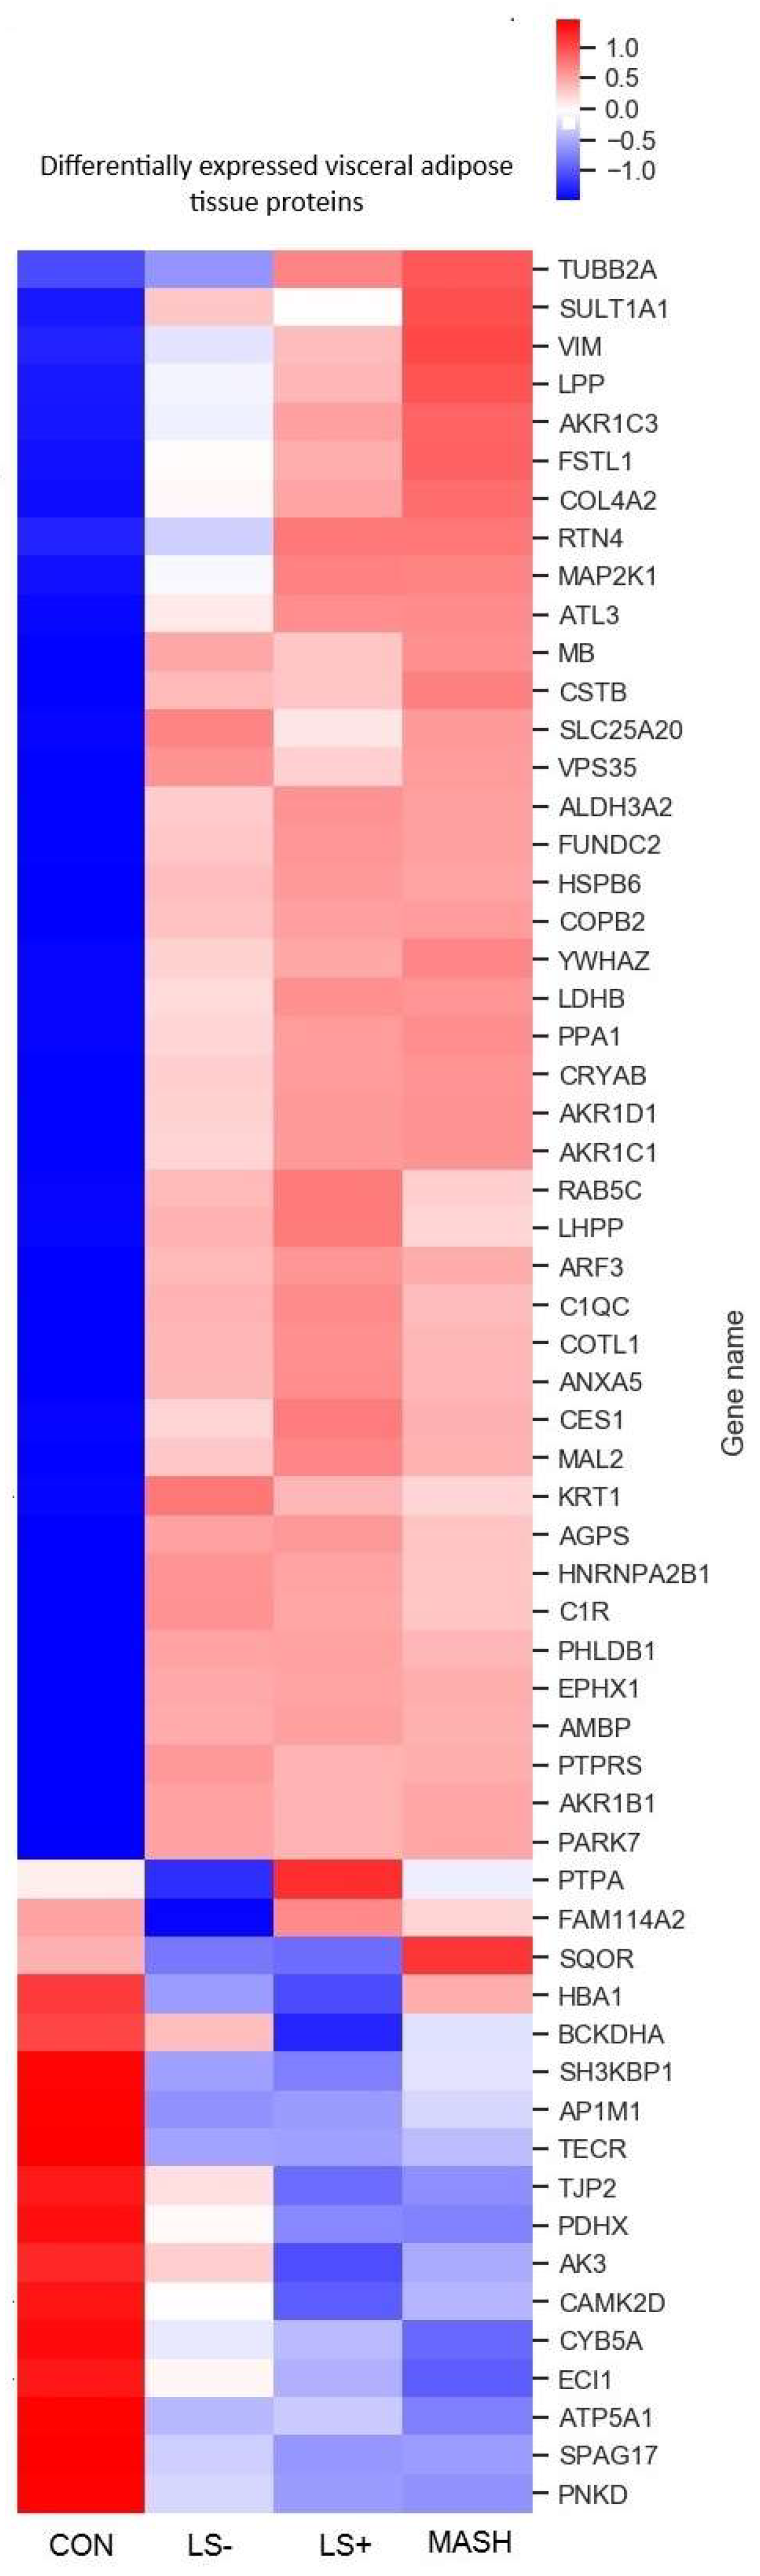
Background/Objectives: Visceral adipose tissue (VAT) could be directly involved in the develop- ment of metabolic-associated steatotic liver disease (MASLD) and progression to metabol-ic-associated steatohepatitis (MASH). We employed untargeted proteomics analyses of paired VAT and liver biopsies to explore protein expression patterns in patients with obesity, MASLD and MASH in search of the potential presence of a MASH associated proteome in VAT and liver. Methods: VAT and liver tissue were collected from 70 subjects with severe obesity (SWO) and nine control study subjects without obesity (CON). SWO were stratified on the basis of liver his-tology into LS- (no liver steatosis), LS+ (liver steatosis) and MASH. Peptides were extracted from frozen tissue and were analyzed by liquid chromatography coupled to tandem mass spectrome-try (LC-MS/MS). Raw files were analyzed with Spectronaut, proteins were searched against the human FASTA Uniprot database and the significantly expressed proteins in the two tissues were analyzed. P-values were false discovery rate (FDR) corrected. Results: 59 VAT and 42 liver proteins were significantly differentially expressed between the four groups; LS-, LS+ and MASH and CON. The majority were upregulated, and many were related to lipid metabolism. In VAT only one protein, SQOR, was significantly downregulated in the MASH group only. In liver tissue from patients with MASH six proteins were significantly altered compared with the three other groups. Correlation analyses between the top 10 positive VAT and liver proteins were dominated by inflammatory and detoxification proteins. Conclusions: Presence of MASH is not reflected in the VAT proteome and both the VAT, and the liver proteome are generally affected more by the presence of obesity than by MASLD severity. Several immunomodulating proteins correlated significantly between VAT and liver tissue and could reflect common pathophysiological characteristics.
Keywords:
1. Introduction
2. Materials and Methods
Cohort and Study Investigations
Liver histology and Grouping of Study Subjects
- 1)
- No Liver steatosis (LS-): no liver steatosis present in liver biopsies
- 2)
- Liver steatosis present (LS+): Liver steatosis present but without MASH (NAS score < 5)
- 3)
- MASH: NAS ≥ 5 with points from all subcategories (steatosis, inflammation, and ballooning).
Sample Preparation for MS Analysis
LC-MS/MS Analysis (Liquid Chromatography-Mass Spectroscopy/Mass Spectrometry Analysis)
Quantification and Statistical Analysis: Raw Data Processing and Analysis
3. Results
3.1.1. Liver Tissue
3.1.2. Differentially Expressed Upregulated Liver Proteins (Table 2 and Figure 2)
3.1.3. Differentially Expressed Downregulated Liver Proteins (Table 2 and Figure 2)
3.1.4. Visceral Adipose Tissue
3.1.5. Differentially Expressed Upregulated VAT Proteins (Table 3 and Figure 3)
3.1.6. Differentially Expressed Downregulated VAT Proteins (Table 3 and Figure 3)
3.1.7. Associations Between VAT and Liver Tissue in MASLD: Correlation Data (Table 4).

| Protein name | Gene name | q-value | Pearsons r | Location in cell | Tissue specificity | Main function(s) |
|---|---|---|---|---|---|---|
| Hemoglobin subunit gamma-1 | HBG1 | 0.0000 | 0.717 | C | Placenta | FetalHG, Oxb, OxT |
| Immunoglobulin heavy constant alpha 2 | IGHA2 | 0.0000 | 0.630 | PM, Secreted | Low | ImR |
| Angiotensinogen | AGT | 0.0000 | 0.624 | Secreted | Liver | RAAS, BPReg |
| Ribosyldihydronicotinamide dehydrogenase [quinone] | NQO2 | 0.0000 | 0.603 | C | Low | DeTox, OxStress protector |
| Glutathione S-transferase theta-1 | GSTT1 | 0.0001 | 0.595 | C | Breast | GluthB, GluthM |
| NAD(P)HX epimerase | NAXE | 0.0001 | 0.586 | C, N | Low | NAD(P)HXrep |
| Immunoglobulin heavy constant mu | IGHM | 0.0002 | 0.557 | PM, Secreted | Low | ImR |
| Complement C4-A | C4A | 0.0005 | 0.554 | Secreted | Liver | CP, ImR(+) |
| Copine-1 | CPNE1 | 0.0006 | 0.535 | N, NM | Low | TNFaSig, TF |
| Enoyl-CoA hydratase domain-containing protein 3, mitochondrial | ECHDC3 | 0.0006 | 0.532 | M | Liver, muscle | FAM, LiM |
| Complement C4-B | C4B | 0.0010 | 0.521 | Secreted | Liver | CP, ImR(+) |
| Afamin | AFM | 0.0025 | 0.5 | ECM, Se | Liver | PT, FAB |
| N-acetylneuraminate lyase | NPL | 0.0452 | 0.492 | VE, PM | Blood | CM |
| Epsin-1 | EPN1 | 0.0041 | 0.491 | PM, C | Low | Endocytosis |
| Acyl-coenzyme A thioesterase 1 | ACOT1 | 0.0064 | 0.476 | M | Liver | FAM, AcoAM |
| Phosphoglucomutase-1 | PGM1 | 0.0068 | 0.473 | C | Muscle | CM, GluM |
| Glycogenin-2 | GYG2 | 0.0290 | 0.44 | C, N | Adipose tissue, brain, breast | GlycB |
| Tyrosine-protein kinase CSK | CSK | 0.0313 | 0.433 | C, V | Lymphoid tissue | Reg, Imm |
| Heat shock protein HSP 90-alpha | HSP90AA1 | 0.0360 | 0.428 | C | Vagina | Cha, HVI, SR |
| Interferon-induced protein with tetratricopeptide repeats 1 | IFIT1 | 0.0367 | 0.426 | C | Low | HVI, Imm |
| Histidine-rich glycoprotein | HRG | 0.0455 | 0.415 | Secreted | Liver | Angio(+), BC, Chem |
| Tetratricopeptide repeat protein 38 | TTC38 | 0.0498 | 0.411 | C, secreted | Liver, intestine | Unknown |
| 60S ribosomal protein L38 | RPL38 | 0.0453 | -0.416 | ER, C | Low | RibP, Translation |
| RAB14 member RAS oncogene family | RAB14 | 0.0450 | -0.419 | Er, C | Low | RibP, Translation |
| Oxb; oxygen binding, OxT; Oxygen transport, ImR; Immune response, RAAS; Renin-angiotensiogen-aldosterone-system, BPReg; Blood pressure regulator, DeTox; Detoxification process, OxStress; Oxidative stress, GluthB; Gluthation biosynthesis, GluthM; Gluthation metabolism, NAD(P)HXrep; Repairs NAD(P)H hydrates (NAD(P)HX), CP; Complement pathway, ImR; Immuneresponse, TNFaSig; TNF-alpha signalling,TF; transcription factor, FAM; Fatty acid metabolism, LiM; Lipid metabolism, PT; Protein transport, FAB; Fatty acid binding,AcoAM; Acetyl CoA metabolism, CM; Carbohydrate metabolism, GlycB; Glycogen breakdown, Imm; Adaptive immunity, Cha; Chaperone, HVI; Host-virus interaction Angio+; positive regulator of angiogenesis, BC; Blood coagulation, Chem; Chemotaxis, RibP; Ribosomal protein | ||||||
4. Discussion
No Overlapping DEPs Between VAT and Liver Tissue in Subjects with Obesity, MASLD and MASH
Changes in the VAT Proteome in Obesity, T2DM and MASLD
Correlation Analyses Pinpoint Inflammatory and Detoxification Proteins
Changes in the Liver Proteome in Relation to Obesity and MASLD
Strengths and Limitations
5. Conclusions
Author Contributions
Funding
Institutional Review Board Statement
Informed Consent Statement
Data Availability Statement
Acknowledgments
Conflicts of Interest
References
- Rosen, E. D. & Spiegelman, B. M. What We Talk About When We Talk About Fat. Cell 156, 20–44 (2014). [CrossRef]
- Ohlson, L.-O. et al. The Influence of Body Fat Distribution on the Incidence of Diabetes Mellitus: 13.5 Years of Follow-up of the Participants in the Study of Men Born in 1913. Diabetes 34, 1055–1058 (1985). [CrossRef]
- Nielsen, S., Guo, Z., Johnson, C. M., Hensrud, D. D. & Jensen, M. D. Splanchnic lipolysis in human obesity. J. Clin. Invest. 113, 1582–1588 (2004).
- Tilg, H. & Moschen, A. R. Adipocytokines: mediators linking adipose tissue, inflammation and immunity. Nat. Rev. Immunol. 6, 772–783 (2006). [CrossRef]
- Fontana, L., Eagon, J. C., Trujillo, M. E., Scherer, P. E. & Klein, S. Visceral Fat Adipokine Secretion Is Associated With Systemic Inflammation in Obese Humans. Diabetes 56, 1010–1013 (2007). [CrossRef]
- Eckel, R. H., Grundy, S. M. & Zimmet, P. Z. The metabolic syndrome. Lancet Lond. Engl. 365, 1415–1428 (2005).
- Vanni, E. et al. From the metabolic syndrome to NAFLD or vice versa? Dig. Liver Dis. 42, 320–330 (2010).
- Yki-Järvinen, H. Non-alcoholic fatty liver disease as a cause and a consequence of metabolic syndrome. Lancet Diabetes Endocrinol. 2, 901–910 (2014). [CrossRef]
- Hotamisligil, G. S., Shargill, N. S. & Spiegelman, B. M. Adipose expression of tumor necrosis factor-alpha: direct role in obesity-linked insulin resistance. Science 259, 87–91 (1993). [CrossRef]
- Sun, K., Kusminski, C. M. & Scherer, P. E. Adipose tissue remodeling and obesity. J. Clin. Invest. 121, 2094–2101 (2011). [CrossRef]
- Goossens, G. H. The role of adipose tissue dysfunction in the pathogenesis of obesity-related insulin resistance. Physiol. Behav. 94, 206–218 (2008). [CrossRef]
- Xu, H. et al. Chronic inflammation in fat plays a crucial role in the development of obesity-related insulin resistance. J. Clin. Invest. 112, 1821–1830 (2003).
- Weisberg, S. P. et al. Obesity is associated with macrophage accumulation in adipose tissue. J. Clin. Invest. 112, 1796–1808 (2003).
- Younossi, Z. M. et al. The economic and clinical burden of nonalcoholic fatty liver disease in the United States and Europe. Hepatology 64, 1577–1586 (2016). [CrossRef]
- Item, F. & Konrad, D. Visceral fat and metabolic inflammation: the portal theory revisited: Visceral fat and metabolic inflammation. Obes. Rev. 13, 30–39 (2012).
- Kakehashi, A. et al. Proteome Characteristics of Non-Alcoholic Steatohepatitis Liver Tissue and Associated Hepatocellular Carcinomas. Int. J. Mol. Sci. 18, (2017). [CrossRef]
- Younossi, Z. M. et al. An exploratory study examining how nano-liquid chromatography–mass spectrometry and phosphoproteomics can differentiate patients with advanced fibrosis and higher percentage collagen in non-alcoholic fatty liver disease. BMC Med. 16, (2018). [CrossRef]
- Niu, L. et al. Plasma proteome profiling discovers novel proteins associated with non-alcoholic fatty liver disease. Mol. Syst. Biol. 15, e8793 (2019). [CrossRef]
- Wichmann, C. et al. MaxQuant.Live Enables Global Targeting of More Than 25,000 Peptides. Mol. Cell. Proteomics MCP 18, 982–994 (2019). [CrossRef]
- Grinfeld, D., Aizikov, K., Kreutzmann, A., Damoc, E. & Makarov, A. Phase-Constrained Spectrum Deconvolution for Fourier Transform Mass Spectrometry. Anal. Chem. 89, 1202–1211 (2017). [CrossRef]
- Greenberg, A. S. et al. Perilipin, a major hormonally regulated adipocyte-specific phosphoprotein associated with the periphery of lipid storage droplets. J. Biol. Chem. 266, 11341–11346 (1991). [CrossRef]
- Karvar, S. et al. Moesin, an Ezrin/Radixin/Moesin Family Member, Regulates Hepatic Fibrosis. Hepatol. Baltim. Md (2019). [CrossRef]
- Li, F., Xiao, H., Zhou, F., Hu, Z. & Yang, B. Study of HSPB6: Insights into the Properties of the Multifunctional Protective Agent. Cell. Physiol. Biochem. 44, 314–332 (2017). [CrossRef]
- Arderiu, G. et al. Type 2 Diabetes in Obesity: A Systems Biology Study on Serum and Adipose Tissue Proteomic Profiles. Int. J. Mol. Sci. 24, 827 (2023). [CrossRef]
- Chen, Z.-Z. et al. Protein Markers of Diabetes Discovered in an African American Cohort. Diabetes 72, 532–543 (2023). [CrossRef]
- Jackson, M. R., Melideo, S. L. & Jorns, M. S. Human sulfide:quinone oxidoreductase catalyzes the first step in hydrogen sulfide metabolism and produces a sulfane sulfur metabolite. Biochemistry 51, 6804–6815 (2012). [CrossRef]
- Paul, B. D. & Snyder, S. H. H2S: a novel gasotransmitter that signals by sulfhydration. Trends Biochem. Sci. 40, 687 (2015). [CrossRef]
- Younossi, Z. M. et al. Global epidemiology of nonalcoholic fatty liver disease—Meta-analytic assessment of prevalence, incidence, and outcomes. Hepatology 64, 73–84 (2016).
- Fang, L. et al. Analysis of the Human Proteome in Subcutaneous and Visceral Fat Depots in Diabetic and Non-diabetic Patients with Morbid Obesity. J. Proteomics Bioinform. 8, 133–141 (2015).
- Kim, S.-J. et al. A Protein Profile of Visceral Adipose Tissues Linked to Early Pathogenesis of Type 2 Diabetes Mellitus. Mol. Cell. Proteomics MCP 13, 811–822 (2014). [CrossRef]
- Gómez-Serrano, M. et al. Proteome-wide alterations on adipose tissue from obese patients as age-, diabetes- and gender-specific hallmarks. Sci. Rep. 6, 25756 (2016). [CrossRef]
- Alfadda, A. A., Masood, A., Al-Naami, M. Y., Chaurand, P. & Benabdelkamel, H. A Proteomics Based Approach Reveals Differential Regulation of Visceral Adipose Tissue Proteins between Metabolically Healthy and Unhealthy Obese Patients. Mol. Cells 40, 685–695 (2017). [CrossRef]
- Insenser, M. et al. A nontargeted proteomic approach to the study of visceral and subcutaneous adipose tissue in human obesity. Mol. Cell. Endocrinol. 363, 10–19 (2012). [CrossRef]
- Jt, T. et al. Perilipin ablation results in a lean mouse with aberrant adipocyte lipolysis, enhanced leptin production, and resistance to diet-induced obesity. Proceedings of the National Academy of Sciences of the United States of America vol. 98 https://pubmed.ncbi.nlm.nih.gov/11371650/ (2001).
- Orlicky, D. J. et al. Perilipin-2 promotes obesity and progressive fatty liver disease in mice through mechanistically distinct hepatocyte and extra-hepatocyte actions. J. Physiol. 597, 1565–1584 (2019). [CrossRef]
- Straub, B. K., Stoeffel, P., Heid, H., Zimbelmann, R. & Schirmacher, P. Differential pattern of lipid droplet-associated proteins and de novo perilipin expression in hepatocyte steatogenesis. Hepatol. Baltim. Md 47, 1936–1946 (2008). [CrossRef]
- Murri, M. et al. Proteomic analysis of visceral adipose tissue in pre-obese patients with type 2 diabetes. Mol. Cell. Endocrinol. 376, 99–106 (2013). [CrossRef]
- Shang, C. et al. Comparative Proteomic Analysis of Visceral Adipose Tissue in Morbidly Obese and Normal Weight Chinese Women. Int. J. Endocrinol. 2019, 2302753 (2019). [CrossRef]
- Schöttl, T. et al. Proteomic and Metabolite Profiling Reveals Profound Structural and Metabolic Reorganization of Adipocyte Mitochondria in Obesity. Obes. Silver Spring Md 28, 590–600 (2020). [CrossRef]
- Newgard, C. B. et al. A Branched-Chain Amino Acid-Related Metabolic Signature that Differentiates Obese and Lean Humans and Contributes to Insulin Resistance. Cell Metab. 9, 311–326 (2009). [CrossRef]
- She, P. et al. Obesity-related elevations in plasma leucine are associated with alterations in enzymes involved in branched chain amino acid (BCAA) metabolism. Am. J. Physiol. Endocrinol. Metab. 293, E1552–E1563 (2007).
- Polyzos, S. A., Kountouras, J. & Mantzoros, C. S. Adipokines in nonalcoholic fatty liver disease. Metab. - Clin. Exp. 65, 1062–1079 (2016). [CrossRef]
- Rochette, J., Craig, J. E., Thein, S. L. & Rochette, J. Fetal hemoglobin levels in adults. Blood Rev. 8, 213–224 (1994). [CrossRef]
- Yuan, X. et al. Proteomic analysis to identify differentially expressed proteins between subjects with metabolic healthy obesity and non-alcoholic fatty liver disease. J. Proteomics 103683 (2020). [CrossRef]
- Brandtzaeg, P. Transport models for secretory IgA and secretory IgM. Clin. Exp. Immunol. 44, 221–232 (1981).
- de Marco, M. C. et al. MAL2, a novel raft protein of the MAL family, is an essential component of the machinery for transcytosis in hepatoma HepG2 cells. J. Cell Biol. 159, 37–44 (2002).
- de Marco, M. C., Puertollano, R., Martínez-Menárguez, J. A. & Alonso, M. A. Dynamics of MAL2 during glycosylphosphatidylinositol-anchored protein transcytotic transport to the apical surface of hepatoma HepG2 cells. Traffic Cph. Den. 7, 61–73 (2006). [CrossRef]
| Subjects with obesity according to histology | ||||
|---|---|---|---|---|
|
|
LS- (n=34) |
LS+ (n=20) |
MASH (n=16) |
CON (n=9) |
| Liver histology | ||||
| MASLD activity score (NAS) | 2,3 (0,9) | 3,2 (0,7) | 5,1 (0,3) | 1,1 (0,9) |
| Steatosis | 0,0 (0,0) | 1,1 (0,3) | 1,7 (0,6) | 0,0 (0,0) |
| Inflammation | 1,1 (0,6) | 0,9 (0,3) | 1,6 (0,5) | 0,9 (0,6) |
| Ballooning | 1,2 (0,5) | 1,2 (0,5) | 1,9 (0,3) | 0,2 (0,4) |
| Fibrosis | 1,0 (0,3) | 1,2 (0,4) | 1,1 (0,5) | 0,9 (0,3) |
| Age, years | 45 (11) | 45 (8) | 45 (9) | 39 (8) |
| Female (%) | 25 (58) | 9 (21) | 9 (21) | 7 (78) |
| Diabetes, n (%) | 3 (16) | 7 (37) | 9 (47) | NA |
| Weight, kg | 124 (20)* | 138 (29)* | 125 (17)* | 71 (10) |
| BMI, kg/m2 | 41,8 (5,1)* | 44,6 (8,4)* | 42,4 (5,4)* | 24,4 (2,2) |
| Waist-hip ratio | 0,88 (0,11) | 0,95 (0,13) | 0,98 (0,08)*† | 0,83 (0,10) |
| Systolic blood pressure, mmHg | 126 (12) | 130 (14) | 131 (16) | 117 (11) |
| Diastolic Blood Pressure,mmHg | 81(8) | 82 (9) | 82 (11) | 77 (9) |
| Heart rate (BPM) | 72 (12) | 76 (13) | 76 (14) | 69 (7) |
| ALT, U/L | 28 (10) | 34 (15) | 39 (15)*† | 21 (9) |
| AST, U/L | 24 (6) | 25 (9) | 27 (7) | 21 (4) |
| Fasting plasma glucose, mmol/L | 5,9 (0,7) | 6,8 (1,5) | 7,0 (2,2) | 5,5 (0,4) |
| C-peptide pmol/L | 1162 (343)* | 1217 (257)* | 1649 (523)*†§ | 791 (204) |
| Fasting insulin pmol/L | 118,8 (47,3) | 122,78 (44,6) | 208,6 (88,9)*†§ | 63,3 (30,4) |
| HbA1c | 35 (3) | 41 (8)*† | 37 (4)* | 32 (3) |
| HOMA-IR | 4,4 (1,8) | 5,2 (1,7) | 9,1 (4,2)*†§ | 2,2 (1,1) |
| LDL cholesterol, mmol/L | 2,79 (0,98) | 2,25 (0,56) | 2,02 (0,61) | 2,59 (0,53) |
| HDL cholesterol, mmol/L | 1,22 (0,27) | 1,20 (0,41) | 1,09 (0,15) | 1,39 (0,23) |
| VLDL cholesterol, mmol/L | 0,58 (0,24) | 0,69 (0,43) | 0,75 (0,33) | 0,50 (0,21) |
| Triglycerides, mmol/L | 1,29 (0,52) | 1,53 (0,95) | 1,66 (0,74) | 1,13 (0,50) |
| HsCRP (mg/L) | 5,2 (4,1) | 9,2 (10,7)* | 5,1 (3,7) | 1,5 (1,3) |
| Data are presented as mean (SD). P-values are one-way ANOVA with Bonferroni correction. or Chi Square/Fischer’s exact test. LS, liver steatosis; MASH, Metabolic associated steatohepatitis; CON, control study subjects; MASLD, Metabolic associated steatotic liver disease; RYGB, Roux-en-Y gastric bypass; SG, Sleeve gastrectomy; PCO, Polycystic ovarian syndrome; BMI, Body mass index; mmHg, Millimeter mercury; BPM, beats per minute; ALT, Alanine aminotransferase; AST, Aspartate aminotransferase; HbA1c, Glycated hemoglobin; HOMA-IR, Homeostatic Model Assessment for Insulin Resistance; LDL, Low-density lipoprotein; HDL, High density lipoprotein; VLDL, Very low-density lipoprotein; HsCRP, Highly sensitive C-reactive protein mm, Millimeters. *P < 0.05 compared with CON †P < 0.05 compared with LS- § P < 0.05 compared with LS+ ‡ P < 0.05 compared with MASH | ||||
| Protein name | Gene name | CON Log2 intensity |
LS- Log2 intensity | LS+ Log2 intensity |
MASH Log2 intensity |
Location in cell |
Tissue specificity | Main function(s) |
|---|---|---|---|---|---|---|---|---|
| Upregulated liver proteins in SWO/MASLD groups | ||||||||
| Metabolism | ||||||||
| Isocitrate dehydrogenase 2 | IDH2 | 22.57 | 22.81 | 22.97* | 23.03* | M,C,PX | Low | TCA |
| Glycerol-3-phosphate dehydrogenase 1 | GPD1 | 22.12 | 22.71* | 22.86* | 22.84* | C | Low | CaM,LiM,LiB |
| OBG like ATPase 1 | OLA1 | 18.86 | 19.20* | 19.33* | 19.35* | C | Low | CP, ATPH, GTPH |
| ATP citrate lyase | ACLY | 18.40 | 18.06 | 18.76† | 18.72† | C | Low | ACoA, LiM, LiB |
| Mevalonate Kinase | MVK | 17.99 | 18.11 | 18.79 | 18.92*† | C,PX | Low | ChoB, ChoM, LiM, LiB, SterB, SterM |
| 15-hydroxyprostaglandin dehydrogenase | HPGD | 18.07 | 18.77 | 19.37*† | 19.32* | C, N | Placenta, liver, GI tract | FAM, LiM, PGM |
| Perilipin 1 | PLIN1 | 14.24 | 14.99 | 16.09*† | 16.25*† | Adipose tissue | LiMM, LiBi | |
| Perilipin 2 | PLIN2 | 15.09 | 15.08 | 16.87† | 17.09† | Adipose tissue | LiMM, LiBi | |
| Transport and carriers | ||||||||
| Apolipoprotein 3 | APOL3 | 15.03 | 16.21* | 16.51* | 16.64* | C | Low | LiT |
| Solute carrier family 25 member 42 | SLC25A42 | 15.03 | 16.31* | 16.51* | 16.57* | M | Liver | MTC, MTT, ADPT,ATPT, AMPT, ACoAT |
| Archain 1 | ARCN1 | 18.23 | 18.26 | 18.38*† | 18.31 | V, ER | Low | ERGT, PT |
| Protein transport protein Sec24A | SEC24A | 16.65 | 16.81 | 17.00*† | 17.01*† | V | Low | ERGT, PT |
| Cytoskeleton, ECM and signal transduction | ||||||||
| Collagen type XVIII alpha 1 chain | COL18A1 | 18.62 | 19.11* | 19.23* | 19.40* | ECM | Liver | EMO |
| Radixin | RDX | 20.70 | 20.93* | 20.98* | 21.04* | PM | Adrenal gland | CO, CA, ST |
| Moesin | MSN | 20.38 | 20.96* | 20.93* | 20.76* | PM | Low | CO, CA, ST |
| Protein kinase cAMP-dependent type I regulatory subunit alpha | PRKAR1A | 18.37 | 18.61* | 18.64* | 18.67* | C | Low | cAMP, ST |
| Cell, quality, cell cycle, and apoptosis | ||||||||
| Tumor protein p53 inducible protein 3 | TP53I3 | 13.96 | 15.13* | 15.84* | 16.03*† | C | Intestine | Apop(+), SR |
| Retinoblastoma binding protein 9 | RBBP9 | 18.01 | 18.17 | 18.31* | 18.28* | N | Low | SH, TS, CCR |
| Downregulated liver proteins in SWO/MASLD groups | ||||||||
| Metabolism | ||||||||
| Glycerate kinase | GLYCKTK | 19.80 | 19.36* | 19.09* | 19.15* | C, G | Liver | FC, SD |
| Glyoxylate hydroxypyrovate dehydrogenase | GRHPR | 24.04 | 23.82 | 23.59*† | 23.69* | C, N | Liver | GlyoxM, PyroM |
| GTP cyclohydrolase I feedback regulator | GCHFR | 20.09 | 19.70* | 19.51* | 19.55* | C, N | Liver | RP |
| Methionine adenosyltransferase 1A | MAT1A | 21.67 | 21.57 | 21.38 | 21.34*† | C | Liver | 1CM, MT, MetC |
| Adenosylhomocysteinase | ACHY | 22.53 | 22.22* | 22.08* | 22.13* | C | Low | 1CM, MT |
| Hydroxysteroid 17-beta dehydrogenase 2 | HSD17B2 | 19.79 | 19.32 | 19.00* | 18.94* | ER | Liver, intestine, placenta | LiB, LiM, SteB |
| Hydroxysteroid 17-beta dehydrogenase 11 | HSD17B11 | 19.51 | 19.33 | 19.98 | 18.82* | ER, LD | Immune cells, intestine | LiB, LiM, SterB, AndC, EstB |
| Cytochrome P450 family 3 subfamily A member 4 | CYP3A4 | 21.85 | 21.71 | 21.01*† | 21.19 | C, ER | Liver | FAM, CholM, LiM, LiB, SterB, SterM, DrugM |
| Mitochondrial | ||||||||
| Sideroflexin 2 | SFXN2 | 17.88 | 17.36 | 17.14*† | 17.65 | M | low | MTTT, AAT |
| Cytochrome b-c1 complex (CIII) | CYC1 | 19.74 | 19.35* | 19.35* | 19.23* | M | low | ET, ATPS, RCP |
| Intracellular transport and carriers | ||||||||
| VAMP associated protein A | VAPA | 19.30 | 19.25 | 19.14 | 19.06*† | ER, N, PM | Low | ERGT, PT, MF |
| Cell quality, cell cycle, apoptosis | ||||||||
| Death associated protein | DAP | 17.97 | 17.65 | 17.44 | 17.24*† | V, M, N | Pancreas | Autop(-), Apop(-), NFkaBTF (-) |
| Heat shock protein family A (Hsp70) member 1B | HSPA1B | 20.93 | 20.97 | 20.65† | 20.78 | V, C, N | Vagina | CHA, PF, SR |
| Cyclin-dependent kinase inhibitor | CDKN1B | 14.78 | 14.83 | 14.40 | 13.49† | N, V | Low | CCP |
|
Location in cell: C, Cytosol; ECM, Extra cellular matrix; ER, Endoplasmatic reticulum; G, Golgi apparatus; LD, Lipid droplets; M, Mitochondria; N, Nucleus; PM, Plasma membrane; PX, Peroxisome; V, Vesicles Main function: AAT, Amino acid transport (serine); ACoA, Acetyl CoA; ACoAT, Acetyl CoA transport; ADPT, ADP transport; ADPT, , AMP transport; AMPT; AndC, Androgen catabolism; Apop(+), Positive regulator of cell apoptosis; Apop(-), Negative regulator of cell apoptosis; ATPH, ATP hydrolysis; ATPS, ATP synthesis; ATPT, ATP transport; Autop(-), Negative regulator of autophagia; CA, Cell adhesion; CaM, Carbohydrate metabolism; cAMP, Cyclic adenosine monophosphate; CCR, Cell cycle regulator; CHA, Chaperone; ChoB, Cholesterol biosynthesis; ChoM, Cholesterol metabolism; CO, Cytoskeleton organization; CP, Cell proliferation; CCP, Cell cycle progression; DrugM, Drug metabolism; EMO, Extracellular matrix organization; ERGT, Endoplasmatic reticulum-Golgi apparatus transport; EstB, Estrogen biosynthesis; ET, Electron transport; FAM, Fatty acid metabolism; FC, Fructose catabolism; GlyoxM, Glyoxylate metabolism; GTPH, GTP hydrolysis; LiB. Lipid biosynthesis, LiBi, Lipid binding; LiM, Lipid metabolism; LiMM, Lipid metabolism modulator; LiT, Lipid transport; MetC, Methionine catabolism; MF, Membrane fusion; MT, Methylation; MTC, Mitochondrial carrier (ACoA transport into mitochondria in exchange for ATP/ADP/AMP); MTTT, Mitochondrial transmembrane transport; NFkaBTF(-), Negative regulator of NF-Kappa Beta transcription factor; PF, Protein folding; PGM, Prostaglandin metabolism (interleukins, eicosanoids etc) ; PT, protein transport; PyroM, Pyrovate metabolism; RCP, Respiratory chain protein; RP, Regulatory protein (phenalyalanine metabolism); SD, Serine degradation; SH, Serine hydrolase (unidentified substrates); SR, Stress response; ST, Signal transduction; SterB, Steroid biosynthesis; SterM, Steroid metabolism; TCA, Tricarboxylic acid cycle; Ts, Tumor suppressor; 1CM, One carbon metabolism | ||||||||
| Protein name | Gene name |
CON Log2 intensity |
LS- Log2 intensity |
LS+ Log2 intensity |
MASH Log2 intensity |
Location in cell |
Tissue specificity | Main function(s) |
|---|---|---|---|---|---|---|---|---|
| Upregulated VAT proteins in MASLD | ||||||||
| Metabolism | ||||||||
| L-lactate dehydrogenase B chain | LDHB | 16.53 | 17.96* | 18.51* | 18.40* | C | Heart, kidney | CM, PyrvM,Ferm |
| Inorganic pyrophosphatase | PPA1 | 13.47 | 15.30* | 15.28* | 15.68* | C | Low | PhosM |
| Lipid metabolism | ||||||||
| Sulfotransferase 1A1 | SULT1A1 | 13.36 | 14.96* | 14.50 | 15.36* | C | Liver | CateM, LiM, SterM, XM |
| Fatty aldehyde dehydrogenase | ALDH3A2 | 12.41 | 14.19* | 14.09* | 14.37* | PXM, ERM | Low | FAM, LiM, SB |
| Aldo-keto reductase family 1 member C1 | AKR1C1 | 16.83 | 18.12* | 18.28* | 18.47* | C | Liver | PM, SterM |
| 3-oxo-5-beta-steroid 4-dehydrogenase | AKR1D1 | 14.86 | 16.97* | 17.16* | 17.85* | C | Liver | AndM, BAB, ChoC, SterM |
| Aldo-keto reductase family 1 member B | AKR1B1 | 13.24 | 14.44 | 14.42* | 14.45* | C | Adrenal gland | CM(PP), SteM, PGM, SIG |
| Aldo-keto reductase family 1 member C3 | AKR1C3 | 15.07 | 16.06* | 16.51* | 16.53* | C | Liver | M, SteM, ProglM, AndM, CellD(+), Apop(+) ROSM(+) |
| Liver carboxylesterase 1 | CES1 | 17.31 | 18.45* | 18.95* | 18.94* | ER | Liver | FAM, XM, ChoB |
| Epoxide hydrolase 1 | EPHX1 | 15.91 | 17.91* | 17.95* | 17.78* | ER | Liver, adrenal gland | AHC, DtX |
| Alkylglycerone phosphate synthase | AGPS | 7.80 | 10.68* | 10.68* | 10.16* | PX | Low | LiB, LiM |
| Mitochondrial | ||||||||
| Mitochondrial carnitine/acylcarnitine carrier protein |
SLC25A20 | 11.57 | 13.17 | 13.02* | 13.36* | M | Low | CarnS |
| Sulfide:quinone oxidoreductase, mitochondrial | SQOR | 13.72 | 12.83 | 12.89 | 13.85†§ | M | Low | H2SM |
| Inflammation | ||||||||
| Complement C1q subcomponent subunit C | C1QC | 15.19 | 16.37* | 16.61* | 16.26* | XC (extra cellular) | Lymphoid tissue (monocytes) | ComP, ImR(+) |
| Complement C1r | C1QR | 12.93 | 14.41* | 14.10* | 14.00* | XC | Lymphoid tissue (monocytes) | ComP, ImR(+) |
| Alpha-1-microglobulin | AMBP | 14.86 | 16.41* | 16.27* | 16.59* | G,S,XC | Liver | HVI, ImR(-) |
| Intracellular transport and carriers | ||||||||
| Member RAS oncogene family | RAB5C | 15.49 | 16.45* | 16:36* | 16.50* | EN | Low | PT |
| VPS35 endosomal protein sorting factor like | VPS35 | 14.76 | 15.43* | 15.43* | 15.69* | EN, PM | Low | GPMT, PT |
| Coatomer subunit beta’ | COPB2 | 13.56 | 14.27* | 14.41* | 14.37* | C | Low | ERGT, PT |
| ADP-ribosylation factor 3 | ARF3 | 15.05 | 16.11* | 16.11* | 16.13* | ER | Brain | ERGT, PT |
| MAL proteolipid protein 2 | MAL2 | 11.19 | 14.12* | 14.23* | 14.42* | PM | Esophagus | TC (PIGR) |
| Cytoskeleton and ECM | ||||||||
| Keratin, type II cytoskeletal 1 | KRT1 | 14.85 | 16.45* | 16.06* | 16.35* | PM | Skin | CO, ST, ComA |
| Vimentin | VIM | 21.16 | 22.49* | 22.47* | 22.49* | PM,CS,N | Low | CO, HVI |
| Collagen alpha-2 (IV) chain | COL4A2 | 18.08 | 19.55* | 19.90* | 19.92* | ECM | Placenta | EMO |
| Tubulin beta-2A chain | TUBB2A | 14.90 | 15.41 | 15.80* | 15.87* | CS | Brain | CO, MCC |
| Lipoma-preferred partner | LPP | |||||||
| Signal transduction and regulation, apoptosis | ||||||||
| Tyrosine 3-monooxygenase | YWHAZ | 18.42 | 19.21* | 19.28* | 19.44* | C, N | low | ST, Apop(-), Angio(+) |
| Phospholysine phosphohistidine inorganic pyrophosphate phosphatase | LHPP | 12.19 | 13.88* | 13.90* | 13.71* | C | Brain | PDP |
| Annexin A5 | ANXA5 | 17.59 | 18.94* | 19.15* | 19.13* | NM | Low | ST, BC(-), Apop(-) |
| Pleckstrin homology-like domain family B member 1 | PHLDB1 | 12.23 | 13.88* | 13.95* | 13.86* | N, MiS | Brain | Reg |
| Dual specificity mitogen-activated protein kinase kinase 1 | MAP2K1 | 11.92 | 13.10* | 13.29* | 13.49* | C, PM | Low | MAPKSC(+), PPARGSC(+) |
| Receptor-type tyrosine-protein phosphatase S | PTPRS | 9.16 | 12.15* | 11.74* | 10.86 | C, PM | Low | ST, MAPK(-), ImR(-) |
| Cell cycle, cell quality, and apoptosis | ||||||||
| Atlastin-3 | ATL3 | 12.63 | 14.00* | 14.24* | 14.21* | ER | Low | ERQ |
| Reticulon-4 | RTN4 | 13.33 | 13.90 | 14.17* | 14.28* | ER | Low | ERS, Angio(+), Infl(+) |
| Crystallin alpha B | CRYAB | 18.29 | 20.31* | 20.76* | 20.62* | C, PM | Muscle | CHA |
| Heat shock protein beta-6 | HSPB6 | 16.24 | 18.22* | 18.23* | 18.35* | C, G | Muscle | CHA, SR, Angio(+) |
| Heterogeneous nuclear ribonucleoproteins A2/B1 | HNRNPA2B1 | 16.40 | 17.68* | 17.63* | 17.69* | N | Low | mRNAp, mRNAs, mRNAt, HVI, ImR(+) |
| Parkinsonism associated deglycase | PARK7 | 15.51 | 17.17* | 16.96* | 17.11* | C, N | Low | CHA, PRep, PDeglyc, OxSS, MtHom |
| Follistatin-related protein 1 | FSTL1 | 10.56 | 11.50* | 11.67* | 11.98* | C, V | Low | CP, CD |
| Coactosin-like protein | COTL1 | 14.19 | 15.28* | 15.32* | 15.25* | C | Blood, lymphoid tissue | CHA, LeuS |
| Miscellaneous | ||||||||
| Myoglobin | MB | 9.99 | 12.72* | 12.05 | 13.07* | C | Muscle | OxT, OxR |
| Cystatin-B | CSTB | 16.15 | 17.57* | 17.47* | 17.63* | C, N | Esophagus, tongue | Pro(-) |
| Unknown function | ||||||||
| FUN14 domain-containing protein 2 | FUNDC2 | 12.99 | 14.22* | 14.31* | 14.23* | N, M | Low | MTautop |
| Downregulated VAT proteins in MASLD | ||||||||
| Mitochondrial metabolism | ||||||||
| 2-oxoisovalerate dehydrogenase subunit alpha, mitochondrial | BCKDHA | 13.00 | 12.43 | 11.32* | 11.04* | M | Low | BCAAC |
| Pyruvate dehydrogenase protein X component, mitochondrial | PDHX | 13.88 | 12.32* | 12.31* | 11.24* | M | Low | AcoAB, PyrvM |
| ATP synthase subunit alpha, mitochondrial | ATP5A1 | 18.58 | 17.85* | 17.89* | 17:54* | M | Low | ATPsyn |
| GTP:AMP phosphotransferase AK3, mitochondrial | AK3 | 16.21 | 15.25* | 15.08* | 15.51* | M | Low | NPI |
| Sulfide:quinone oxidoreductase, mitochondrial | SQOR | 13.72 | 12.83 | 12.89 | 13.85†§ | M | Low | H2SM |
| Lipid metabolism | ||||||||
| Very-long-chain enoyl-CoA reductase | TECR | 15.21 | 14.34* | 14.37* | 14.33* | ER | Low | FAB, FAE, FAM, LiB, LiM, SteM, SM |
| Enoyl-CoA delta isomerase 1, mitochondrial | ECI1 | 15.00 | 14.49 | 14.13* | 13.98*† | M | Muscle | FAOX, FAM, LiM |
| Cytochrome b5 | CYP5A | 17.46 | 16.51* | 16.47* | 16.00* | C, V | Liver | ET |
| Signal transduction | ||||||||
| Calcium/calmodulin dependent protein kinase II delta | CAMK2 | 14.66 | 14.04* | 13.70* | 13.92* | C,PM | Low | CaB, ST |
| Intracellular transport | ||||||||
| AP-1 complex subunit mu-1 | AP1M1 | 15.54 | 13.93* | 13.93* | 14.36 | C, G | Low | PT, HVI |
| Cytoskeleton, ECM and signaling | ||||||||
| Tight junction protein 2 | TJP2 | 12.89 | 11.71* | 11.22* | 11.05* | PM, CJ | Low | CA,TJ |
| Cell cycle, cell quality, and apoptosis | ||||||||
| SH3 domain-containing kinase-binding protein 1 | SH3KBP1 | 14.08 | 12.72* | 12.65* | 13.08 | CS | Low | ST, CO, CA |
| Serine/threonine-protein phosphatase 2A activator | PTPA | 13.94 | 13.01* | 13.85† | 13.01 | C, N | Low | PF, DNArep, CCP |
| Antioxidant defense | ||||||||
| Probable hydrolase PNKD | PNKD | 13.28 | 12.41* | 12.26* | 12.22* | C, M | Low | GlutB(+) |
| Miscellaneous | ||||||||
| Sperm associated antigen-17 | SPAG17 | 20.56 | 18.68* | 18.70* | 18.88* | C, CS | Testis, epididymis, brain | CilB, CiF |
| Family with sequence similarity member A2 | FAM114A2 | 11.54 | 10.26* | 11.30† | 11.09 | V | low | PuNB |
| Hemoglobin subunit alpha | HBA1 | 25.86 | 24.55* | 24.36* | 25.02 | C | Bone marrow | OxT |
|
Location in cell: C, Cytosol; CJ, Cell junction; CS, Cytoskeleton; ECM, Extra cellular matrix; EN, Endosome; ER, Endoplasmatic reticulum, ERM, Endoplasmatic reticulum membrane; G, Golgi apparatus; M, Mitochondria; MiS, Mitochondrial spindle; N, Nucleus, NM, Nuclear mem; PM, Plasma membrane; PX, Peroxisome; PXM, Peroxisome membrane; S, Secreted; V, Vesicle; XC, Extra cellular Main function: ACoAB, Acetyl CoA biosynthesis; AHC, Aromatic hydrocarbon catabolism; AndM, Androgen metabolism; Angio(+), Postitive regulator of angiogenesis; Apop(+), Positive regulator of cell apoptosis; Apop(-), Negative regulator of cell apoptosis; ATPsyn, ATP synthesis; BAB, Bile acid biosynthesis; BC(-), Negative regulator of blood coagulation (anti-coagulant); BCAAC, Branched chain amino acid; CA, Cell adhesion; CaB, Calcium binding; CarnS, Carnitine shuttle; CateM, Cathecolamin metabolism; CCP, Cell cycle progression; CD, Cell differentiation; CellD(+), Positive regulator of cell death; CHA, Chaperone; ChoB, Cholesterol biosynthesis; ChoC, Cholesterol catabolism; CilB, Cillium biosynthesis; CilF, Cillium function; CM, Carbohydrate metabolism; CM(PP), Carbohydrate metabolism (polyol pathway); CO, Cytoskeleton organization; ComA, Complement activation; ComP, Complement pathway; CP, Cell proliferation; DNArep, DNA repair; Dtx, Detoxification; EMO, Extra cellular matrix, ERGT, Endoplasmatic reticulum-Golgi apparatus transport; ERS, Endoplasmatic reticulum stabilization; ERQ, Endoplasmatic reticulum quality; ET, Electron transport; FAB, Fatty acid biosynthesis; FAE, Fatty acid elongation; FAM, Fatty acid metabolism; FAOX, Fatty acid beta oxidation; Ferm, Fermentation; GlutB(+), Positive regulator of gluthation biosynthesis; GPMT, Golgi-plasma membrane transport; HVI, Host-virus interaction; H2SM, Hydrogene sulfide metabolism; ImR(+), Positive regulator of immune response; ImR(-), Negative regulator of immune response; Infl(+), Inflammation; LeuS, Leukotriene synthesis; LiB, Lipid biosynthesis; LiM, Lipid metabolism; MAPK(-), Negative regulator of MAP kinase; MAPKSC(+), Positive regulator of MAPK signaling cascade; MMC, Miotic cell cycle; mRNAp, mRNA processing; mRNAs, mRNA splicing; mRNAt, mRNA transport; MTautop, Mitochondrial autophagia; MtHom, Mitochondrial homeostasis; NPI, Nucleoside phosphate interconversion; OxR, Oxygen transport; OxSS, Oxygen stress sensor; OxT, oxygen transport; PDeglyc, Proetin deglucase activity; PDP, PF, Protein folding; Protein dephosphorylation; PGM, Prostaglandin metabolism; PhosM, Phosphate metabolism; PM, Progesterone metabolism; PPARGSC(+), Positive regulator of PPRAG signaling cascade; PRep, Protein repair; Pro(-), Protease inhibitor; PT, Protein transport; PuNB; Purine nucleotide binding; PyrvM, Pyruvate metabolism; Reg, Regulator; ROSM(+), Positive regulator of reactive oxygen species; SIG, Signalling; SB, Sphingolipid biosynthesis; SM, Sphingolipid metabolism; SR, Stress response; ST, Signal transduction; SterM, Steroid metabolism; TJ, Tight junction; TC;, Transcytosis; XM, Xenobiotic metabolism | ||||||||
Disclaimer/Publisher’s Note: The statements, opinions and data contained in all publications are solely those of the individual author(s) and contributor(s) and not of MDPI and/or the editor(s). MDPI and/or the editor(s) disclaim responsibility for any injury to people or property resulting from any ideas, methods, instructions or products referred to in the content. |
© 2024 by the authors. Licensee MDPI, Basel, Switzerland. This article is an open access article distributed under the terms and conditions of the Creative Commons Attribution (CC BY) license (http://creativecommons.org/licenses/by/4.0/).


