Submitted:
27 December 2024
Posted:
27 December 2024
You are already at the latest version
Abstract
The safekeeping of the genetic code has been entrusted, for the most part, to interactions between aminoacyl-tRNA synthetases and their cognate tRNA. In a previous phylogenomic study, chro-nologies of RNA substructures, protein domains and dipeptide sequences uncovered the early emergence of an ‘operational’ code in the acceptor arm of tRNA prior to the implementation of the 'standard' genetic code in the anticodon loop of the molecule. This history likely originated in synthetase urzymes capable of aminoacylation and peptide bond formation, but was driven by episodes of molecular co-evolution and recruitment that promoted flexibility and folding of pri-mordial proteins. Here, we show that dipeptide sequences offer deep time insight into the chro-nology of code emergence. A phylogeny describing the evolution of the repertoire of 400 canonical dipeptides reconstructed from an analysis of 4.3 trillion dipeptide sequences across 1,561 prote-omes revealed the overlapping temporal emergence of dipeptides containing Leu, Ser and Tyr, followed by those containing Val, Ile, Met, Lys, Pro, and Ala, all of which supported the opera-tional RNA code. Our study uncovers a hidden evolutionary link between a protein code of di-peptides – arising from the structural demands of emerging proteins – and an early operational code shaped by co-evolution, editing, catalysis and specificity.
Keywords:
operational RNA code
; molecular evolution
; origin of life
; peptide bond
; phylogenomic reconstruction
; protein structure
1. Introduction
Peptides and polypeptides are generally linear heteropolymer chains of amino acids covalently linked together by peptide bonds. Peptides contain fewer than 50 amino acid residues. They make up a number of bioactive compounds, including neurotransmitters, hormones, and antimicrobials. Ribosomally synthesized and post-translationally modified peptides (RiPPs) for example represent major classes of natural products present in all superkingdoms of life [1]. Similarly, large families of non-ribosomal peptides are synthesized by non-ribosomal peptide synthases (NRPSs) from more than 500 different amino acid and fatty acid monomers [2]. Polypeptides, on the other hand, are larger and more structurally complex. Proteins for example are polypeptides 5-500 kDa in mass that make up nanoparticles 2-10 nm in diameter [3]. These macromolecules consist of one or more chains 11-to-34,350 residues long synthesized by the ribosomal translation machinery from a repertoire of 22 genetically encoded (proteinogenic) L-α-amino acids, including the 20 standard amino acids as well as selenocysteine and pyrrolysine, both of which are incorporated by specialized translation mechanisms [4]. Proteins fold cooperatively into globular, fibrous or membrane forms exhibiting compact and stable atomic three-dimensional (3D) conformations [5], although some regions or complete chains may remain intrinsically disordered [6]. Remarkably, even short peptides adopt residue- and size-dependent conformations that deviate from random coils [7]. A frustrated landscape of structure and disorder therefore percolates the folding process and is expected to impact its evolution [8].
The origin and evolution of peptides and proteins, while still not fully understood, have been increasingly clarified with evolutionary chronologies and time-dependent networks reconstructed with structural phylogenomic methodologies [5,9]. An initial focus has been on protein domains, which serve as the structural, functional and evolutionary building blocks of proteins. Another focus has been on protein loops, which are the elemental architects of protein structure. Chronologies describe the ‘time of origin’ (age) of individual domain and loop structures [10,11]. Evolving networks dissected recruitment processes responsible for the birth of domains [12,13] and domain organization [14]. Here, we extend our phylogenomic study of the protein world to the most elemental building block of protein chemistry – the peptide bond. Each bond defines a 2-mer component of the polypeptide chain. For simplicity, we refer to these pairs of sequential residues as dipeptides, acknowledging that each dipeptide represents one of ~400 possible canonical peptide bond ‘types’ that constitute protein sequence and structure.
More than a decade ago, Caetano-Anollés and colleagues used chronologies of dipeptides, domains and tRNA structures to study the emergence of amino acid charging and codon specificities [15]. A timeline of genetic code expansion uncovered the co-evolution of aminoacyl-tRNA synthetases (aaRSs) and tRNA structures, as well as the early appearance of an ‘operational’ RNA code driven by editing specificities. This primordial code, intimated long ago by the discovery of determinants of specificity in the acceptor arm of tRNA [16,17], evolved into modern genetics through episodes of recruitment. Remarkably, the amino acid and dipeptide compositions of single-domain proteins that appeared before the standard code suggested that genetics emerged through co-evolutionary interactions between polypeptides and nucleic acid cofactors favoring protein flexibility and folding [15]. Furthermore, phylogenomic data provided support to the hypothesis that primordial polypeptides were assembled through ligation in a biosynthetic cycle facilitated by archaic aaRSs that were homologous in structure to the catalytic domains of tyrosyl-tRNA and seryl-tRNA synthetases. Consequently, studying the evolution of dipeptides may reflect an early evolutionary accretion process in which dipeptides gradually formed structured polypeptides. We now integrate these initial studies with direct phylogenomic reconstructions of the history of dipeptides in the protein world. We reveal significant phylogenetic signatures in dipeptide composition, enabling the reconstruction of a tree of dipeptide sequences (ToDS) and a dipeptide chronology that confirms our inferences about the origin and evolution of the genetic code. Additionally, we show that domains exhibit dipeptide compositions that are biased and follow a biphasic evolutionary pattern typical of processes of module creation. These biases shaped structural innovation in evolution of protein domain makeup.
2. Materials and Methods
2.1. Overall Experimental Strategy
Figure 1a describes a workflow summarizing the phylogenomic reconstruction strategy. Structural censuses of domains and dipeptides in proteomes provided the data necessary to generate demography tables and nexus-encoded phylogenetic data matrices with which to build ToDSs and phylogenomic trees of domains (ToDs). Evolutionary chronologies were derived directly from the phylogenetic trees with time of origin calculations. Chronologies of dipeptides were generated using direct and indirect retrodiction approaches, which were then annotated with frequencies, genetic code-linked timeline and functionalities, dipeptide network representations, and structural and physicochemical properties. Direct retrodiction involved building a ToDS using dipeptide abundances in proteomes as phylogenetic characters. Indirect retrodiction involved mapping enriched dipeptide frequencies obtained from a reference structural set to domains along a ToD-delimited timeline.
2.2. Proteome Dataset
A dataset of 1,561 proteomes representing organisms from the three superkingdoms of life, Archaea, Bacteria and Eukarya (Table 1), was selected for the direct retrodiction analysis of dipeptides. Protein sequences were retrieved from a local installation of the Superfamily 2 MySQL database [18], which currently holds information from 3,200 completely sequenced genomes. The proteome set, which was retroactively compatible with proteomes of the Superfamily legacy version 1.75, contained over 10 million proteins and about 4.3 trillion dipeptide sequences. Note that the number of eukaryotic proteins is almost double that of bacterial proteins despite originating from about a third of proteomes. This attests to their coding potential. Proteomes were identified with 2-letter codes.
2.3. Reference Structural Dataset
A published dataset of 2,384 sequences present in high-quality 3D structures of single-domain proteins [15] was used as reference for our indirect retrodiction study. This high-quality reference structural set avoided the effect of domain recruitment in multi-domain proteins and allowed comparison with results from our previous study [15]. The set was originally selected from 204,531 domain sequences (51,392,487 amino acid residues) of Protein Data Bank (PDB) entries using the protein sequence-culling server PISCES [19]. The culled set embedded 1,475 domain families defined according to SCOP database classification [20]. Domains were identified with hidden Markov models (HMMs) from Superfamily [18]. Domain families were named using concise classification strings (ccs). For example, the ccs of the oldest and most abundant domain family corresponds to c.37.1.12, in which c represents the protein class [alpha and beta proteins (a/b)], 37 the fold (P-loop containing nucleoside triphosphate hydrolases), 1 the fold superfamily (P-loop containing nucleoside triphosphate hydrolases), and 12 the fold family (ABC transporter ATPase domain-like). The structural set was used in downstream analysis.
2.4. Phylogenomic Reconstruction
Phylogenomic analyses were conducted using methodologies similar to those previously described for the evolutionary analysis of structural domains (e.g. [21]). Abundances of the 400 possible dipeptides arising from the combination of the standard 20 proteinogenic amino acids (excluding the 2 ambiguous amino acids, Z and X), were calculated for the protein sequences of the 1,561 proteomes (Table S1). These total counts were also expressed as frequencies. Figure 1b shows a heatmap describing the distribution of dipeptide abundances in the proteomes that were examined. The heat map shows that most dipeptides harbored abundance values close to the median of the abundance data. In order to construct a phylogenomic data matrix, raw dipeptide abundance values were log-transformed and rescaled to protect against the effects of unequal proteome size and variances and to ensure software compatibility. To illustrate, the raw abundance value aij of dipeptide i in proteome j was divided by the maximum abundance value in that proteome (aij_max), and was then rescaled from 0 to 31 to yield 32 possible phylogenetic character states according to equation (1).
Such transformation and rescaling was repeated for every dipeptide. Normalized abundance values aij_normal were encoded in nexus format using an alphanumeric scale (0-9 and A-V). The resulting phylogenomic data matrices were subjected to phylogenetic reconstruction using maximum parsimony (MP) as the optimality criterion in PAUP* (version 4.0 build 169)[22]. The heuristic search involved optimizing the fit of phylogenetically informative (diagnostic) character data along the branches of the trees while traveling through the tree solution space via tree-bisection-reconnection (TBR) branch-swapping operations with a reconnection limit of 8 and 100 replicates of random addition sequence. Starting trees were obtained via stepwise addition, with a random addition sequence. All characters were retained because they were parsimony-informative. Optimization complies with a model of character state change (transformation series) defined by a fully ordered ‘character state graph’ of undirected ordered (Wagner) multistate phylogenetic characters. These characters define ‘serial homologies’ that are typical in the analysis of morphological features. The model was defined in the ‘assumptions’ block of the nexus file. Trees were rooted a posteriori using Lundberg optimization [23], which places the root in the most parsimonious location and does not require the specification of an outgroup. The method invokes Weston’s generality criterion [24,25], which in the ‘standard’ Lundberg implementation optimizes ancestral-derived homology relationships in nested patterns along branches of the trees, or in the ‘ancestor’ implementation makes use of a maximum (state V for ToDS) character state according to evolutionary considerations [26] by invoking the Ancstates command. The generality criterion is the most powerful ‘direct’ rooting approach [27]. It avoids the use of outgroups or molecular clock models. Rooting with both implementations of Lundberg produced topologically isomorphic trees. The structure of phylogenetic signal in the data was tested by the skewness (g1) of the length distribution of 10,000 random trees nd permutation tail probability (PTP) tests of cladistic covariation using 1,000 replicates. [28]. Tree distribution profiles and metrics of skewness indicated strong cladistic structure (p<0.01). The reliability of deep evolutionary relationships was assessed with 2,000 bootstrap replicates. Optimal trees that were retained were visualized with Figtree ver. 1.4.4 [29].
2.5. Chronologies
For direct retrodiction, an evolutionary timeline was directly derived from the rooted ToDS, indicating the time of origin of each dipeptide. The highly imbalanced tree established a branching order that allows for estimating a relative age for each one of its leaves (dipeptides) based on a node distance (nd) from the root. This distance, calculated with a Perl script, measures ancestry on a scale from 0 (oldest) to 1 (youngest)[30].
For indirect retrodiction, dipeptides from the reference set were matched to domain families along a chronology of domains [Figure 1c] based on a published ToD [15]. A ‘clock of folds’, defined at domain family level and calibrated with biomarkers and geomarkers, converted relative nd values to absolute time (t) in billions of years (Gy) using the formula t = –3.8nd + 3.8, with correlation coefficient r = –0.974 and R2 = 0.900. This approach links domain evolution with the geological record [31].
Tree balance statistics that measure the symmetry of trees (N-bar, cherry count, and Colless) and statistics that define their shape (E/I ratio, and treeness) were calculated using TreeStat v. 1.2 [32]. N-bar is the number of internal nodes between the base and the tips of the tree, cherry count is the number of internal nodes that have only terminal leaves as children, and Colless tree imbalance index is the normalized sum of differences of numbers of children in left and right subtrees over all internal nodes. The external/internal (E/I) ratio is the ratio of the total length of external branches to the total length of internal branches. Treeness is the proportion of the total length of the tree that is taken up by internal branches, interpreted as a measure of how well the data fit the phylogenetic tree.
2.6. Enrichment Analysis
Abundances of the 20 proteinogenic amino acids and the 400 possible dipeptides were calculated for all sequences of the 1,475 domain families belonging to the reference set. Dipeptide frequencies were matched to secondary structures assigned using the Dictionary of Secondary Structures of Proteins (DSSP) [33]. Because dipeptide frequencies were remarkably consistent throughout the timeline of domains (see Figure 6A in ref. 15), we assessed which dipeptide sequences were significantly enriched in specific nd bins compared to the full set of dipeptides unfolding across the entire chronology. For each of the two sequence sets, we counted the numbers of multiple occurrences of individual dipeptides. We then calculated the probability of enrichment of every dipeptide in a bin using the hypergeometric distribution, as shown in the probability function equation (2).
Observed values K and k indicate the numbers of multiple occurrences of dipeptides in the 2,384-sequence set and the nd bin-sequence set, respectively. The values N and n are the numbers of multiple occurrences of all dipeptides in the two sequence sets, respectively. The probability P(X = k) reflects the chance that a random variable X has k multiple occurrences of dipeptides for a given dipeptide. P values were calculated for every dipeptide that has k/n larger than K/N, and evaluated statistical significance of enrichment of each dipeptide of an nd bin at 99% confidence levels (P < 0.01).
2.7. Dipeptide Networks
The makeup of enriched dipeptides in each nd bin was described using network representations. In these networks, nodes are amino acids participating in dipeptides and links connecting them are peptide bonds defining 2-mer components. Links were weighted by the number of dipeptide types (generally 1 or 2). These types of networks were also used to describe dipeptides in nd bins of the chronology of dipeptides derived directly from the ToDS.
2.8. Statistical Analyses of Proteome and Structural Datasets
A multivariate analysis of variance (MANOVA) of the 400-column matrices was conducted to investigate the main effect of proteome makeup – defined as the total number of proteins or dipeptides in the dataset – on dipeptide abundance within proteomes, as well as the effect of domain age – reflected by the time of origin of domains – on dipeptide abundance in domains. Given large sample sizes (n >> 100), the use of parametric methods is appropriate. Large sample sizes can help mitigate the reliance on certain MANOVA assumptions, such as multivariate normality and homogeneity of covariance matrices, and may reduce the impact of non-linear relationships among variables. Assumptions were assessed and found acceptable, specifically, multivariate normality was verified, and Box’s M test indicated homogeneity of covariance matrices (p = 0.45?). Data summaries and MANOVA analyses were computed using routines in R [34].
2.9. Principal Component Analysis
Principal components (PCs) were computed for the standardized 400-column dipeptide abundance matrix from proteomes and domain families. Standardization was achieved by calculating z-scores, with a mean of zero and a variance of one. Only PCs with eigenvalues (or standard deviations) greater than one were retained, following the Kaiser criterion. Scree plots were used to assess the number of PCs to retain, based on the ‘elbow’ or inflection point in the explained variance. Pairs of PCs explaining the highest variances were then plotted to identify potential clusters.
2.10. General Linear Model Analysis
To perform General Linear Models (GLMs), the matrix-form data was transformed (‘melted’) to co-align dipeptide abundance values as categorical variables based on dipeptide labels along the main effect variables of proteome size in the proteome dataset and domain age in the structural dataset, respectively. This melting enabled creation of histograms displaying a single set of dipeptide abundance values, which revealed right-skewed distributions in proteomes and domains. Given that dipeptide abundances resembled count data, we selected the ‘Poisson’ family for the GLM analysis. In these models, dipeptide abundances were treated as the response variable, modeled against the main effects of proteome size and domain age, respectively. We compared each main-effect model to a null model using a chi-square test of ANOVA, and calculated AIC scores for the main-effect models. In both datasets, the main effects were found to significantly explain dipeptide abundance. For compatibility with the Poisson model, normalized dipeptide abundances in domain data were scaled to integer values by multiplying by 109.
3. Results
3.1. Statistical Evaluation of Factors Affecting Dipeptide Abundance in Proteomes and Domains
We initially assessed the statistical significance of the makeup of proteomes and the evolutionary age of domains across 400-column response matrices of abundances of possible dipeptide sequences in proteome data. These analyses were aimed at examining the impact of both proteome scale and domain origin on the dipeptides of the proteome and structural datasets. A MANOVA was performed to examine the main effects of the following factors: (i) total numbers of proteins (prot) and total number of dipeptides (dp) in the proteomes of the proteome data set (proxies for the evolutionary accumulation of dipeptides in proteomes), and (ii) the time of origin (nd) of domain families in the reference structural set (proxy for the role of dipeptides in establishing structural innovations [15]). Each factor was tested individually for its main effect, and any interaction effects were examined as well. Table 2 presents key statistical indicators for the main effects and interactions, all of which were statistically significant. The null hypotheses – that dipeptide abundances could not be explained by proteome makeup or by the age of domains – were therefore rejected. Note that the interaction term of protein and dipeptide variables was found to be significant, suggesting that the combined effect adds additional explanatory power beyond the individual effects.
MANOVA results align with a Poisson GLM analysis conducted to assess the impact of proteome size and domain age on dipeptide abundances. Each model factor was tested against a null model using a chi-square test of model deviance. The proteome effect on dipeptide abundance was significant (p < 2.20 x 10⁻¹⁶), with a deviance of 3.52 x 10⁹ and residual deviance of 7.95 x 10⁹ (resid. df = 624398), indicating that including proteome size in the model significantly improved the fit compared to the null model. Similarly, domain age significantly explained variance in dipeptide abundance (p < 3.36 x 10⁻⁹) ), with a deviance of 34.962 and residual deviance of 3.50 x 10¹² (resid. df = 589998).
A principal component analysis (PCA) of the proteome dataset showed that only 5 PCs with a standard deviation greater than one were sufficient to explain over 98% of the variance in dipeptide abundances across proteomes (Figure 2). This result rejects the null hypothesis that PCs in the normalized abundances of proteome data fail to explain a high percentage of variation in the data. The scree plot for the proteome dataset shows a single inflection point at PC2, covering the largest variance. Furthermore, a biplot of PC1 and PC2, capturing the highest variance, prominently separates Homo sapiens and other crown and basal eukaryotic species from a bisected central cluster. In contrast, the PCA for the domain family dataset required 152 PCs, each with a standard deviation greater than one, to explain only 68.73% of the variation in dipeptide abundances. This finding also rejects the null hypothesis that PCs in the normalized dipeptide abundances of domain data fail to explain a substantial portion of data variance. The scree plot for the domain dataset shows multiple inflection points, with the most prominent one at PC4, covering nearly 70% of the variance. Interestingly, although PC4 in the domain dataset introduces more variability than PC3 (as shown by a convex elbow at PC4 following a dip at PC3), the greatest spread is observed between PC2 and PC3. Middle-aged domain families showed the highest variance in dipeptide abundance, displaying a broad spread around the central cluster.
3.2. Tracing the Origin and Evolution of Dipeptide Sequences
Direct and indirect retrodiction analyses show there is deep phylogenetic information in the proteome and structural datasets. We use this information to uncover the evolutionary origins of dipeptides and the operational genetic code.
3.2.1. Direct Retrodiction
A ToDS describing the evolution of dipeptide sequences was built from a phylogenetic matrix of dipeptide abundances. The columns of the matrix represented the repertoire of 400 dipeptides and the rows represented the proteomes of 1,561 organisms sampled from the three superkingdoms of cellular life [Figure 1b]. Raw abundance data is available in Table S1. Data was normalized, transformed and appropriately coded for phylogenetic reconstruction using MP as optimality criterion (nexus file is available in File S1). Note that MP approximates maximum likelihood (ML) when phylogenetic characters evolve at different rates [35] and outperforms ML and other phylogenetic methods under models appropriate for morphology [36] such as those used in our phylogenomic studies. A single unrooted most-parsimonious tree was retained that was well resolved (Figure 3). Tree distribution profiles and metrics of skewness indicated strong cladistics structure (p < 0.001). Ensemble consistency (CI) and retention (RI) indices, which measure the confounding characteristic of homoplasy and the desired characteristic of synapomorphy, respectively, were comparable to those recovered when building large trees such as those in ToD building exercises (e.g. Figure 1). Reconstruction of subtrees confirmed the topology of the tree with acceptable bootstrap support levels. In addition, the existence of significant phylogenetic signal in dipeptide data was also confirmed by transposing the phylogenetic matrix and building a universal tree of proteomes (Wang et al., ms. in preparation). This ‘Tree of Life’ dissected the evolution of the cellular world in well-established organismal groups.
The reconstructed ToDS was significantly imbalanced and asymmetric. Tree balance statistics (N-bar = 41.8; cherry count = 108; Colless = 0.188) rejected the null hypothesis of a Yule model at 0.05 significance level, supporting instead a highly imbalanced topology. Its shape was also highly biased (E/I ratio = 1.12; treeness = 0.471). These properties, typical of semi-punctuated evolutionary processes, enabled the calculation of times of origin of individual dipeptides through node distance (nd) values (Table S2). The oldest dipeptide will have an nd value of 0 and the most derived dipeptides will have nd values of 1.
Dipeptides were identified with one-letter amino acid nomenclature and indexed along the chronology with amino acid properties known to be associated with the origin of the genetic code. These properties were derived from a phylogenomic analysis of aaRS structures, which specified three groups of amino acid charging functionalities (Groups 1, 2 and 3) and 9 possible categories of amino acid combinations (1-1, 1-2, 2-1, …) [15]. Groups 1 and 2 define the origin of editing and an early ‘operational’ code, while Group 3 describes more derived anticodon binding functions that were later translated into the standard genetic code. To index the chronology of dipeptides with these groups and categories, dipeptides were first divided into 10 nd bins of times of origin. The makeup of dipeptides in these temporal bins was then explored with network representations in which participating amino acids belonging to the three aaRS-derived groups (nodes) were connected by peptide bonds (lines) in the graphs (Figure 3). Remarkably, the temporal sequence of dipeptide sets described by the network representations revealed significant connectivity biases. The first bin holding the most ancient dipeptides, nd = [0,0.1), was exclusively populated by Leu and Ser-containing sequences, as shown by the Leu and Ser connectivity hubs of its network. This pattern of Group 1 evolutionary enrichment was gradually replaced in the following two bins by Tyr-containing and Group 2 amino acid-containing dipeptides. These three basal dipeptide bins appearing during the nd = [0,0.3) range involved interactions with only 5 amino acids of Group 3 (Gly, Glu, Asp, Asn, and Arg). In sharp contrast, bins spanning the rest of the chronology (i.e., the nd = [0.3,1.0) range), gradually increased both the connectivity of Groups 2 and 3 amino acids, at first driven by Group 2 hubs, such as Met at nd = [0.5,0.6) or Pro and Lys at nd = [0.5,0.6), but then quickly complemented by Group 3 hubs such as Gln at nd = [0.4,0.6), Trp at nd = [0.6,0.9), or Cys at nd = [0.7,1.0).
Figure 4 illustrates the 9 categories of amino acid combinations observed in each chronological dipeptide bin. The centrality of Group 1 amino acids in the first nd bin of the timeline, and that of Group 2 amino acids in the next two bins, confirm their sequential role in establishing an early operational code that was originally inferred from times of origin of tRNA and aaRS structures [15].
Dividing the dipeptide chronology into 9 plots, each reflecting a 2-mer combination of Groups 1, 2 and 3 amino acids, allowed for a more detailed analysis of the early nd = [0,0.3) range responsible for the operational code (Figure 5). The first 21 dipeptides to appear in evolution before nd = 0.137 were exclusively associated with Group 1 amino acids Leu and Ser, 3 belonging to category 1-1, 11 belonging to categories 1-2 and 2-1, and 7 belonging to categories 1-3 and 3-1. This Group 1-driven epoch of primordial emergence (shaded in peach) lacked dipeptides that exclusively involved both Groups 2 and 3 amino acids but included a total of 8 dipeptides holding one Group 3 amino acid, either Gly, Glu, or Asp. The following 35 dipeptides of the timeline, which spanned nd = [0.137,0.301), were mostly defined by Group 2 amino acids. In fact, 80% of dipeptides always involved one or more of the 8 amino acids that make up the group. This epoch (shaded in light green) harbored 23 dipeptides belonging to the Group 2-centric 2-3, 3-2 and 2-2 categories, 9 dipeptides belonging to the Group 1-centric 2-1, 3-1, 1-2 and 1-3 categories (including 6 involving Leu and 3 involving Tyr), and only 2 dipeptides belonging to the 3-3 category. Group 1-centric amino acids appeared early in this epoch and, with one exception (DY), were absent in the nd = [0.18-0.3) range. This peculiar distribution supports the existence of an important transition occurring at the end of these two epochs of dipeptide evolution. A third evolutionary epoch defined by the nd = [0.301-0,548) range of the timeline (shaded in light blue) harbors dipeptides containing all standard amino acids except for Cys (Figure 5). This epoch is driven by Group 3 amino acids linked to anticodon binding functions, a fact that is made evident by the highly connected His, Gln, Asp, Asn and Glu hubs appearing in the highly connected network that characterizes the epoch. Finally, a terminal epoch spanning the nd = [0.794-1) range involved the rise of Cys-containing dipeptides, supporting the very late evolutionary emergence of this disulfide-bond enabling and metal ion-binding amino acid.
Finally, we further examined the rise of the 1-1 category in Figure 5, which is the first to appear in the timeline. The category holds the oldest dipeptide, LL, and displays an order of dipeptide appearance that supports the centrality of Leu in establishing interactions between Group 1 amino acids, first with Ser and then with Tyr. The central role of Leu is further highlighted by the emergence of 37 out of the 39 Leu-containing dipeptide combinations during the first half of the timeline, with 17 of them being the oldest dipeptides of the timeline. In contrast, all other dipeptides associated with specific amino acids exhibited a more protracted evolution. Dissection of the dipeptide chronology by dividing it into 20 overlapping timelines showcased the evolution of individual amino acid-containing dipeptides (Figure 6). This approach showed distribution patterns of dipeptide emergence and tested congruence between dipeptide chronologies and the origin and evolution of amino acid charging inferred from co-evolving chronologies of tRNA and protein domain structures [15]. A focus on dipeptide combinations involving specific amino acids had the consequence of double-counting dipeptides in the chronological plots but allowed to display the temporal sequence of amino acid inceptions into the code, which we unfold in Figure 6 from bottom to top. This history distinguished dipeptide first accounts (closed symbols) from double-entries (open symbols), confirming the expected increase of double-entries in both the horizontal (dipeptide history) and vertical (genetic code) timelines. Departures from expected values defined ‘transition’ phases between groups, which suggested a late inception of Tyr into the operational code and an early inception of Thr and Phe into the standard code (Figure 6, inset). Boxplots described time of origin distributions of dipeptide sets, revealing that median values (crosses in the figure) gradually increased in Group 1 and basal amino acids of Group 2, matching the first expansion of the ‘operational’ genetic code [15]. Remarkably, a global increasing tendency of dipeptide first accounts when climbing the sequence of amino acid inception into the operational and genetic code can be visualized by evaluating the enrichment of first accounts below a diagonal plotted between the first and last dipeptide inception. While notable departures are observed from the rule in chronologies for Thr, Phe, Gln and Asp, the lower triangle below the diagonal harbors most first appearances, confirming the two chronologies are co-evolving.
3.2.3. Indirect Retrodiction
Our indirect retrodiction effort involved mapping dipeptide frequencies present in the structural domains of 2,384 single-domain proteins to a chronology of domains derived from a published ToD [15]. While dipeptide frequencies remained quite consistent throughout the timeline in this reference structural dataset, 505 dipeptides were significantly enriched (p < 0.05) in specific nd bins (Table S3). These enriched dipeptides were analyzed for their amino acid composition and makeup (Figure 7). Notably, individual dipeptides were often enriched across multiple bins. Only 302 out of the possible 400 dipeptides were enriched. Their enrichment reflected patterns of dipeptide diversification along the evolutionary timeline of domain innovations. This contrasts with the direct retrodiction approach, which places the 400 possible dipeptides in a timeline.
Network representations showed that the enriched dipeptide makeup of nd bins was highly variable and exhibited a temporal biphasic pattern (Figure 7). A minimum connectivity at nd = [0.4, 0.5) (1.9-2.3 Gya) divided the timeline into two episodes of growth, the more derived being more intense. These types of biphasic evolutionary patterns are typical of processes of module creation. Cys-containing dipeptides were absent during the first 4 nd bins of the chronology, supporting their late inception in evolution (Figure 5). Dipeptides containing other amino acids were also absent in selected nd bins, such as Leu in the sixth and seventh bin, Ser in the first and third bin, Phe in the first and third, His in the first and seventh, Trp in the third, Thr in the fifth, Met in the seventh, and Lys in the fourth and seventh. These absences show major biases in dipeptide makeup that impact entire groups of fold structures. The circular bar chart of Figure 7 quantifies the role of amino acids in enriched dipeptides, showing for example the steady participation of Leu, the growing participation of Ser, Tyr and Lys, or the decreasing participation of Ala.
Figure 8 examines the 9 categories of amino acid combinations specified by Groups 1, 2 and 3 across each nd bin. Unlike the patterns in Figure 4, the central role of Group 1 amino acids materializes at varying degrees throughout the timeline, with only modest contributions of Group 2 amino acids to enriched dipeptide composition. A comparison with the distribution in the total structural set and the expected distribution calculated by free permutation showed a significant overrepresentation of Group 1 amino acids and an underrepresentation of Group 2 amino acids in the enriched dipeptide dataset. This strongly supports the persistence of early dipeptide emergence patterns across the timeline of domain structures.
Finally, about a quarter of dipeptides appearing in proteomes during the rise of the operational code, i.e. the nd = [0, 0.3) period of the chronology (Figure 5), were also present in enriched dipeptides appearing in structures before the rise of anticodon binding domains and genetics at nd = 0.2 (3.0 Gya) (Figure 7). These 16 dipeptides included LV, LG, GL, AL, LA, SL, EV, VE, PE, PL, EG, GE, IR, YG, AK and PI, ordered according to time of origin. The significant match recapitulates the early centrality of Leu and Ser and the late appearance of Tyr during the rise of the operational code.
4. Discussion
4.1. Deep Time Evolution of the Protein World
The present study represents the first phylogenomic data-driven retrodiction effort aimed at elucidating the evolutionary history of dipeptide sequences in proteomes and the origin of the genetic code. The effort involved an analysis of about 4.3 trillion dipeptide sequences in 1,561 proteomes and the phylogenomic reconstruction of a ToDS from a phylogenetic data matrix of dipeptide abundances with phylogenetic characters representing proteomes and taxa representing a closed set of 400 canonical dipeptides (Figure 3). The raw matrix itself suggested that statistically biased information reflected history. When ordering dipeptides according to their time of origin and depicting the matrix as a heat diagram, distinctive patterns of dipeptide abundance were visually displayed across proteomes [Figure 1b], some expected, including increases of abundance with dipeptide age, temporal biphasic tendencies, and superkingdom-specific distributions. An assessment of the statistical significance of the 400-dipeptide response matrices revealed high variances in abundance distributions, much greater in structural domains than in proteomes. Phenetic dissection with PCA showed that only 5 PCs with a standard deviation greater than one explained over 98% of the variance of dipeptide abundances across proteomes, while 152 PCs were required to explain only 68.73%.of the variance across domains. PCA plots separated the proteomes of crown and basal eukaryotic species from a bisected central microbial cluster and dissected domains that evolved half-way in a timeline of domain history (Figure 2). Statistical results support the importance of the evolutionary accumulation of dipeptides in proteomes and the role of dipeptides in establishing structural domain innovations, validating the use of dipeptide abundances as phylogenetic characters. Note that the existence of significant biological information in the amino acid make up of proteomes is expected. Small modular elements such as amino acids, dipeptides and bigger k-mers acted for example as powerful proteomic signatures of thermophilic, halophilic, and pH adaptations to extreme environments [37], revealed compositional patterns typical of the proteomes of superkingdoms [38], uncovered trends in composition over time [39], helped phylogenetic reconstruction of the history of proteomes [40], and facilitated the mining of stratigraphic analyses of Pfam domains [41]. Amino acid composition, when expressed as a point in a 20-dimensional space, distinguished general fold designs and classified proteins [42]. Similarly, it also enabled the prediction of protein interactions, either alone or in conjunction with evolutionarily-rich domain features [43].
The reconstructed ToDS, which exploits the shared-and-derived tenet of phylogenetic analysis, displayed strong cladistic structure (p < 0.001) and levels of homoplasy and synapomorphy comparable to those recovered from trees of similar size, including ToDs (e.g. [15, 31]) or trees describing the evolution of Gene Ontology (GO) terms of molecular functions [44]. The criterion of ‘primary homology’ (correspondence arising from common ancestry) for reconstruction rests on the accumulation of individual dipeptides and their distribution and reuse in proteomes. These primary homologies materialize as ‘secondary homologies’, shared and derived (phylogenetically-informative) characters (synapomorphies) along the branches of the tree. The ToDS is a universal phylogenetic statement describing the evolutionary inception of each one of the 400 dipeptide sequences that make up proteomes. The tree was rooted a posteriori with Lundberg optimization [23] using either the ‘standard’ or ‘ancestor’ implementation, both resulting in isomorphic topologies. This shows rooting enforces Weston’s generality criterion of hierarchical nesting of homologies [24,25] while complying with retention of serial homologs in the branches of the optimal tree. Note that the absence of phylogenetically uninformative characters in the proteome dataset showcases the power of serial homologies, the use of which has been rare in molecular biology but common in paleontology and systematic biology [45]. The reconstructed tree was significantly imbalanced and asymmetric, properties, that are typical of semi-punctuated evolutionary processes [46]. This enabled calculation of times of origin of individual dipeptides through node distance (nd) values. These inception events were placed in the order of their occurrence and on a fixed temporal scale along a chronology that describes rare episodes of evolutionary innovation occurring during the emergence of a modern, catalytically-driven protein world.
The chronology offered insights into dipeptide evolution. The origin and recruitment of dipeptides associated with individual amino acids generally spanned most of the timeline, with exceptions in Met, His, Gln, Trp and Cys, which unfolded in more restricted time frames (Figure 6). For example, Cys-containing dipeptides were the last to appear in evolution. This observation is expected given structural phylogenomic evidence supporting the relatively late appearance of tRNA-dependent and independent Cys biosynthetic pathways [47]. We found that the origin of dipeptides was linked to Leu, Ser and Tyr-containing dipeptides. The Leu-containing dipeptides were the oldest of the timeline, with LL being the first to appear in evolution. The striking result aligns with mounting evidence of an early rise of aaRS-like core structures engaging in stereochemical interactions with small primordial tRNA molecules [15] responsible for an early operational genetic code [17,18]. Catalytic domains of Class I and II aaRSs have thiol acylation activities, which are believed to represent vestiges of an ancient thioester world [48]. In addition, a number of aaRS-homologous enzymes are involved in peptide bond synthesis, some proposed to embody primordial enzymatic synthesis prior to the appearance of the ribosome [49]. Two are particularly remarkable. Amino acid-[acyl-carrier-protein]-ligases (aaACPLs) homologous to seryl-tRNA synthetases carry ligase functions resembling those of NRPS modules [50]. These enzymes lack tRNA binding but transfer activated amino acids to phosphopantetheine prothetic groups of carrier proteins for non-ribosomal protein biosynthesis. Cyclodipeptide synthases (CDPSs) homologous to tyrosyl-RNA and tryptophanyl-tRNA synthetases catalyze the formation of cyclodipeptides [51]. These enzymes, which are involved in numerous biosynthetic pathways of secondary metabolism [52], use two aminoacyl-tRNA (aa-tRNA) molecules and a well-documented ping-pong mechanism to form two successive aminoacyl-enzyme intermediates. Catalysis involves two deep solvent-accessible pockets (P1 and P2) that are close to the catalytic site where the transfer of the aminoacyl moiety to a conserved Ser residue forms in subsequent steps the aminoacyl-enzyme and then the dipeptidyl-enzyme intermediate. The last step involves the nucleophilic attack of the enzyme ester bond facilitated by a Tyr residue and the release of the cyclodipeptide. The enzyme interacts with the major groove of the acceptor stem of tRNA through β2 and β7 strands of the Rossmann fold, bending the 3’ CAA end into the P1 pocket (typical of Class I aaRSs) and placing the 5’ terminal A76 adenosine into the P2 pocket [53]. CDPSs are very promiscuous, each enzyme producing a main dipeptide and a variety of other less abundant dipeptide products [51,52]. They favor specificity for the first aminoacyl moiety but have less specificity for the second substrate that is accommodated in P2. They can also synthesize dipeptides from small activated amino esters, showing their biosynthetic abilities are catalytically versatile and RNA-independent [54]. Remarkably, CDPSs and elongation factors interact with opposite sides of the acceptor arm of tRNA, showing dipeptide synthesis and translation are intimately linked processes [53].
Exploring the structural neighborhoods of aaACPLs and CDPSs showed that the most closely related structures were seryl-tRNA and tyrosyl-RNA synthetases, respectively, with structural cores and crucial ligand-binding sites being highly conserved [15]. These results suggest aaACPLs and CDPSs embed structural cores that are relics and founders of ancient peptide bond-producing enzymatic activities. In fact, a phylogenetic survey of CDPSs and their products revealed they produce 75 cyclodipeptides, most involving hydrophobic (Leu, Val, Ileu, Met), aromatic (Tyr, Phe, Trp), and small (Ala, Pro, Gly) amino acids [52], many of which belong to Groups 1 and 2 we found are linked to the origin of the operational code [15]. An analysis of a set of 568 CDPSs showed that the most widely spread metabolites were cLL and cYY cyclodipeptides, with cLL and cLI/cLL representing the largest predicted activity (20%). An analysis of consensus motifs defining the residues lining pockets P1 and P2 of the CDPS specificity-based groups of enzymes classified according to the dipeptide products they produce [52] again showed a large preponderance of residues linked to the origin of the operational code (Figure S1).
4.2. A Compositional Origin of the Genetic Code
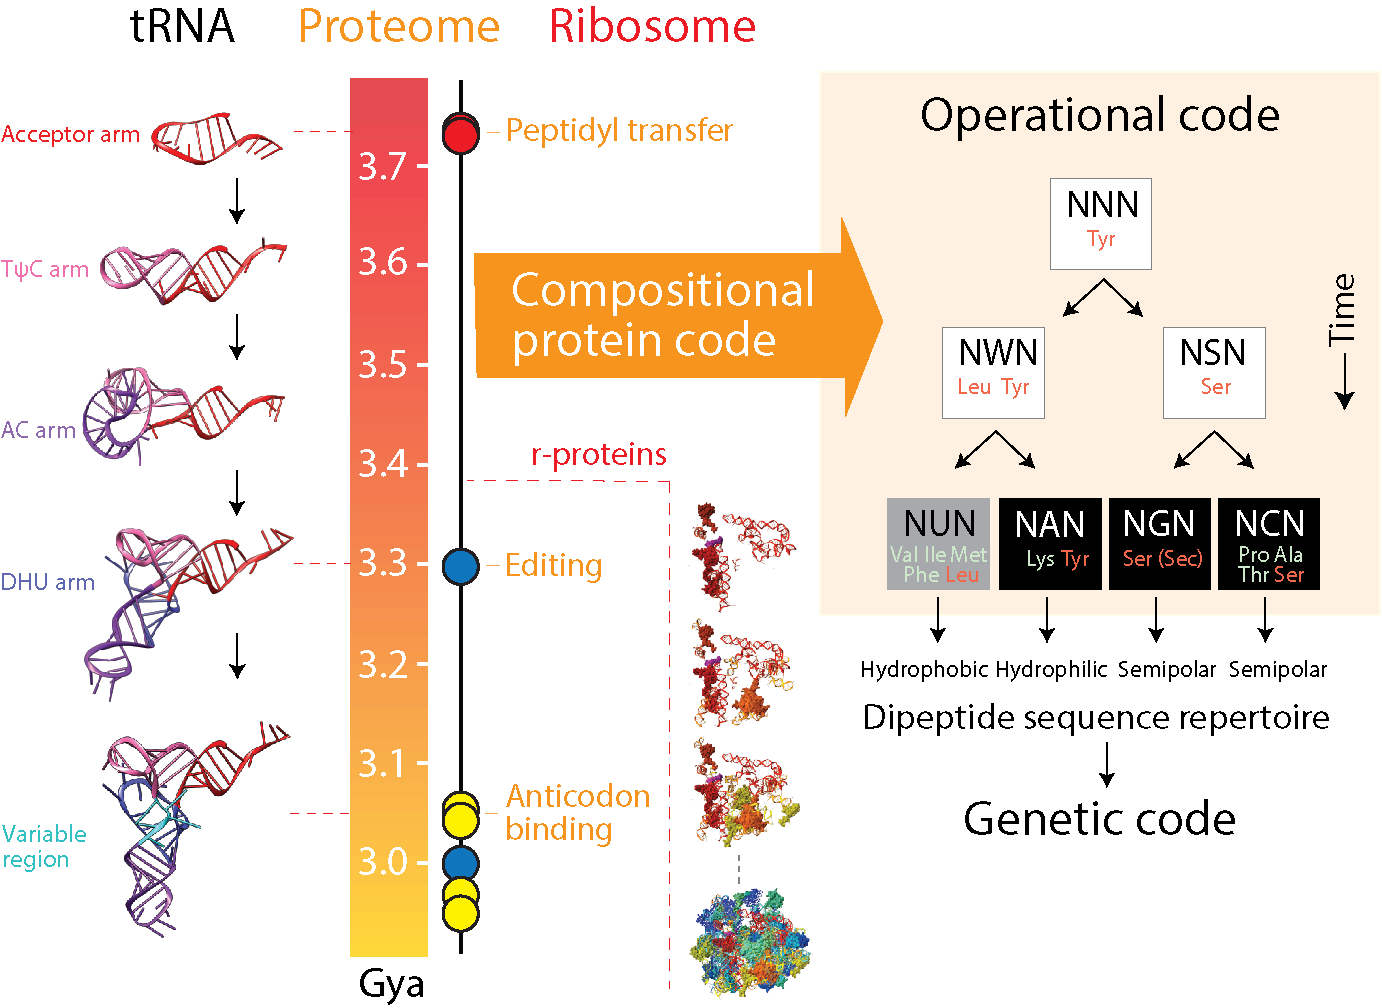
Our analysis of dipeptide history provided a link to the origin of the genetic code, supporting important findings from a previous phylogenomic study [15]. In that exploration we showed that two coding systems evolved sequentially but acted redundantly [15]. An operational code evolved first by generating amino acid charging and proofreading capabilities. The standard code evolved later by developing anticodon specificities. Both codes followed a convoluted history of recruitment and co-evolution that was untangled by tracing the origin and evolution of stereochemical interactions between RNA cofactors and protein structures. Figure 9a illustrates how tRNA, aaRS and ribosomal histories were linked to each other with phylogenomic approaches.
Tracing the evolution of tRNA with a computational analysis of the sequence and structure of thousands of molecules provided an evolutionary model of molecular evolution and growth [55,56,57,58]. Phylogenies revealed that the molecule evolved by accretion of substructures, with the ‘top half’ (the acceptor and TΨC arms) being more ancient than the ‘bottom half (the anticodon, DHU and variable arms). This made amino acid charging ancestral and distant to codon recognition by the anticodon loop, which is located ~76 Å away from the acceptor arm. The ancestral nature of the top half conforms with both the ‘genomic tag’ hypothesis, which divides genomic from coding information [59], and significant biochemical evidence supporting both an operational code [16,17] and sensitivity to primordial folding rules associated with a genetic-biosynthetic duality of primordial aaRS ‘urzymes’ [60,61]. Figure 9a illustrates the accretion model with structures predicted using deep learning trRosettaRNA [62] from the reconstructed sequence of a universal tRNA ancestor [63]. tRNA history was also matched to a chronology of structural domains, which allowed to track the evolutionary appearance of catalytic, editing, anticodon binding and accessory domains of aaRSs and their interaction with evolving tRNA [15]. This matching anchored tRNA and structural domain chronologies. While catalytic domains of Class I and II aaRSs, including their putative interactions with primordial minihelix cofactors, appeared together very early in protein evolution (~3.7 Gya), interactions of the ‘ValRS/IleRS/LeuRS editing’ domain (SCOP family b.51.1.1) with the DHU arm [64] suggested that the cloverleaf structure was already present 3.3 Gya [65]. The appearance of anticodon binding domains (beginning with c.51.1.1) in well over half of aaRSs confirms that anticodon loop identity elements of the tRNA ‘bottom half’ were already present ~3 Gya. Remarkably, a chronology of co-evolving rRNA and ribosomal protein (r-protein) structures [63] anchored ribosomal functions to aaRS history. The origin of the first r-protein, S12, established an interaction with helix 44 of the small subunit (SSU) rRNA ~ 3.4 Gya, at a time when the anticodon arm of tRNA may have been already developed. The emergence of the peptidyl transferase center (PTC) of the large subunit (LSU) rRNA 2.8-3.1 Gya confirmed that a full cloverleaf tRNA structure was already present during that period and spanned the inter-subunit interface that was being established [63]. These results highlight the late arrival of the ribosome to the emerging translation system. Collectively, they support the early protein-RNA interactions that are necessary for the operational code in the absence of anticodon binding and modern ribosomal functions.
The coevolutionary timelines illustrated in Figure 9 define three groups of domain structures [15]. The most ancient, Group 1, involved catalytic domains interacting with type II tRNA that charge Tyr, Ser and Leu. These tRNAs harbor a long variable loop necessary for recognition. A second more derived group, Group 2, involved domains interacting with type I tRNA charging Val, Ile, Met, Lys, Pro, Ala, Thr and Phe. A third group, Group 3, involved modern domains that interact with the bottom half of tRNA. Figure 9b maps these groups to a decision tree (modified from [66] in [15]) and a condensed vis-á-vis complementarity representation of the genetic code with major and minor groove modes of tRNA recognition [67,68]. Recall that Class I aaRSs approach tRNA from its minor groove to aminoacylate the 2’-hydroxyl group of the terminal adenosine (except tyrosyl-tRNA synthetase), while class II aaRSs approach tRNA from its major groove esterifying the 3’-hydroxyl group (except phenylalanyl-tRNA synthetase)[69]. Each step of the decision tree, which unfolds downwards in time, introduces a new identity element in tRNA that reduces sequence ambiguity, is most parsimonious in changes of the 3’ N73 discriminator of the acceptor stem [70], and complies with the coevolutionary progression. The topmost node of the decision tree represents tyrosyl-tRNA synthetase-like catalytic structures with major groove recognition, emerging A73 discriminator identity functions, and a maximally ambiguous recognition code. A change of the recognition alphabet from A to G in the 3’ N73 discriminator of the original cognate tRNA, likely a minihairpin or nucleic acid cofactor, splits the emerging structures into two molecular lineages capable of charging either Leu or Ser. This binary decision step also splits the future code into complementary NWN and NSN codons once identity elements of the acceptor are recruited into other parts of the growing tRNA structure. The two lineages are also founders of groove modes of tRNA recognition, the structure charging Ser interacting with the major groove and the structure charging Leu interacting with the minor groove, which represented a novel configuration. The next decision step involves the 5’ second base (B2) of the acceptor stem, which splits each of the two initial molecular lineages into founders of the NUN-NAN and NGN-NCN mirror modes of the vis-á-vis representation that will later unfold in the standard genetic code. The four lineages translate into physicochemical properties of amino acids: NUN coding for hydrophobic, NAN coding for hydrophilic, and NGN and NCN coding for semipolar amino acids (except the more derived Arg) (following [71]). Other identity elements help solidify lineages. For example, the N4:N69 base pair is uniquely recognized by aaRSs charging Leu, Ile, Val and Met of the NUN lineage, and aaRSs charging Ser in the NSN lineages. The coordinated complementarity of the C2:G72 and G2:C72 base pairs of the acceptor arm in the vis-á-vis representation, present in 90% of comparisons, later translates to corresponding complementarities of identity elements of the anticodon loop that unfold at the base of the decision tree. Consequently, a number of ambiguity reduction steps coupled to episodes of molecular growth result in the gradual evolution of the genetic code, first grounded in archaic synthetases and ligases interacting with RNA cofactors and minihelices and later grounded in synthetases interacting with full-blown tRNA structures. A progression of the inception of amino acid charging into an operational code delimited by the first few decision steps can be derived starting with Group 1 Leu, Ser and Tyr, followed by Group 2 Val, Ile, Met, Lys, Pro, Ala, Thr and Phe, in that order. Inception of Group 3 amino acids during the establishment of the standard genetic code and an operational ribosomal core occurred in parallel with recruitment of Groups 1 and 2, once the anticodon loop identities were established in the growing molecules. Finally, tracing ancestries of anticodon tRNA-aaRS binding onto the vis-á-vis representation at the base of the decision tree unfolded expansion groups A, B and C that are highlighted in Figure 9b, each one involving new inceptions together with recruitments.
Remarkably, the ToDS generated from dipeptide abundance counts in proteomes (Figure 3) and its associated chronology (Table S2) recapitulates the reconstructed history of the operational code [15] that was illustrated in Figure 9, providing a direct link between peptide biosynthesis and identity elements responsible for code specificities. Tracing Group 1 and 2 structures along the dipeptide chronology unambiguously placed Group 1-centric dipeptides at its origin, closely followed by those of Group 2 (Figure 4 and Figure 5). This finding strongly supports the origin of the operational code in Group 1 structures responsible for the synthesis of dipeptide sequences and the coevolutionary timelines described in Figure 9, which explain the gradual expansion of the operational code as successive steps of innovations in nucleic acid-polypeptide recognition. Partitioning the chronology of dipeptides into participating amino acids (Figure 6) confirmed distribution patterns of dipeptide emergence were congruent with operational code history [15]. The timelines of dipeptides containing Leu, Ser and Tyr, followed by those containing Val, Ile, Met, Lys, Pro, and Ala, which were overlapping each other, showed that their successive temporal emergence was imprinted in proteome makeup.
The link between the compositional makeup of proteomes and genetic code history that we have uncovered requires a mechanistic model that can explain it. The topmost node of the decision tree of innovations and recruitments (Figure 9), which embodies tyrosyl-tRNA synthetase-like catalytic structures, could well represent synthase ancestors of CDPSs and aaRSs capable of dipeptide biosynthesis [15]. These ancestral urzymes benefitted from the growing establishment of stable interactions with nucleic acid cofactors, including the development of crucial identity elements for dipeptide catalysis. Those identity elements were likely imprinted in their ‘genomic’ (informational) makeup, giving gradual rise to the ‘mirror’ modes of tRNA acceptor and anticodon stem aaRS recognition that Rodin and Rodin [67,68] anticipated were signatures of genetic complementarity. This complementarity later extended to rRNA by recruitment of fully grown tRNA molecules, turning the ribosome into both a catalytic machine and a primordial genome [72,73]. What is missing in this mechanistic scheme, is a link of the emerging operational code to a growing and stable proteome, which we here propose was at first catalytic in nature.
4.3. Dipeptide History in Structural Domains
In contrast with the direct retrodiction effort of building a ToDS, finding patterns of enrichment of dipeptides in domains of a reference structural dataset and using a chronology of domains to make inferences about dipeptide evolution is indirect and more limited but still informative (Figure 7 and Figure 8). Enrichment is a bioinformatic strategy that identifies overrepresented entities in biological sets, providing a list of those that are most pertinent to the biological system under study (e.g., gene lists; [74]). We found 505 dipeptides were significantly enriched (p < 0.05) along bins of the chronology of domains, many enriched across multiple bins, and many absent. In fact, dipeptides containing specific amino acids were often missing in individual bins, showing major biases in structural representation. Examples included Cys-containing dipeptides, which were notoriously absent during the first 1.5 Gy of protein evolution (nd = 0-0.4). This matches the late inception of Cys-containing dipeptides observed in dipeptide chronologies (Figure 5). Enriched dipeptides reflected patterns of diversification that were specific to individual fold structures appearing in each bin of the timeline, an observation that conforms with the early report that amino acid composition provides unique signatures of fold structure [42]. In fact, previous use of this reference structural dataset [15] showed that the 400-dimensional dipeptide signature vectors of structural domains visualized in a heat map representation of dipeptide composition [Figure 1c] exhibited patterns that acted as diagnostic ‘fingerprints’ of domain structures. These compositional biases, which have significant potential for fold recognition applications in structural bioinformatics, appear to follow a temporal bimodal pattern of dipeptide abundance and use, with the most ancient and most recent domains showing a general tendency towards higher levels of abundance and diversity. This bimodal temporal pattern was also present in the chronologies of enriched dipeptides (Figure 7). A minimum number of enriched dipeptides appearing 1.9-to-2.3 Gya divided the timeline into two episodes of growth. The first episode was driven by the steady participation of Leu, Ala and Gly, while the more derived and massive episode was initially driven by the significant participation of Ser, Lys, Gly and Cys.
This biphasic evolutionary behavior evident in heatmaps and networks describing dipeptide make up aligns with a ‘linkage’ theory developed to explain the generation of modules and hierarchical structure in biology [75,76]. Under this theoretical framework, biphasic “bowtie” patterns are driven by a ‘double tale’ of accretion and change, in which accretion brings together parts to form wholes and change provides opportunities for growth and innovation. In a first phase, parts are weakly linked and associate diversely. As parts diversify, growing interactions increasingly constrain their structure and associations, leading to modular structures. In a second phase, variants of the modules and their functions evolve and become new parts for a new generative cycle of higher-level organization. In our model of dipeptide evolution, parts are dipeptide sequences and modules are compositional biases that manifest in evolution as fingerprints of protein structure.
Indexing amino acids of enriched dipeptides appearing in each temporal bin with amino acid charging functionalities of Groups 1, 2 and 3 (Figure 8), consistently revealed the central role and significant overrepresentation of Group 1-centric dipeptides. This pattern of overrepresentation, which materialized at different degrees throughout the timeline, strongly supports the existence of a persistent memory of the operational code across the entire timeline of domain structures. The observation is strengthened by the appearance of a same set of 16 dipeptides in domains prior to the rise of genetics at nd = 0.2, 3 Gya (Figure 7), and in proteomes prior to the rise of the standard code at nd = 0.3 (Figure 5), which anchors both chronologies to each other and places them in the temporal framework of the geological record thanks to a molecular clock of fold structures [31]. The significant match recapitulates the early centrality of Leu and Ser and the late appearance of Tyr during the rise of the operational code.
5. Conclusions
There is growing consensus [60,61,77] supporting our early phylogenomic data-driven coevolutionary proposal that molecular evolution started with polypeptides in interaction with nucleic acids and other cofactors prior to the rise of genetics [15,49,78]. An early inception of protein molecules in origin of life scenarios was anticipated by Fox [79], Lipman [80], Dyson [81,82], Kauffman [83], and De Duve [84], among others, and its details championed by Trifonov and colleagues decades ago [85,86]. Primordial elements for piecemeal buildup of molecular complexity were found embedded in the modular makeup of proteins [87], including elementary functional loops [12,88], supersecondary motifs [13], and domains [9,10,11]. These modules provided insight into early protein evolution. For example, phylogenomic chronologies, network representations and AI-driven AlphaFold2 modeling showed that structural cores of protein folds emerge by combination of loop structures in processes of recruitment that appear ongoing [12,13]. Remarkably, P-loop structures that were founders of the oldest core structures were capable of binding phosphate-containing ligands, including RNA and single stranded DNA, when engineered into slightly larger structures [89]. Moreover, polypeptides comprising single P-loop elements acted as helicases capable of separating and exchanging nucleic acid strands [90]. These results support the functionality of modeled molecular intermediates (prior molecular states [10]), highlighting the power of phylogenomic research.
Here we explore the evolution of the most basic module of protein structure, the dipeptide sequence that delimits the peptide bond. As with structural domains, phylogenies of dipeptide sequences are powerful evolutionary statements because they describe a closed (finite) system in which phylogenetic taxa represent features that are exhaustively enumerated [45]. Since all possible canonical dipeptide sequences are being surveyed in proteomes, statements are axiom-like and of the highest level of universality that is attainable. Conversely, phylogenetic character sets (proteomes) represent open systems; proteomes can always be added to the phylogenomic study, potentially uncovering new useful homology statements that could strengthen historical corroboration. Under boundary conditions, however, the theoretical system approaches its status as an evolutionary axiom, which reduces any Popperian-like scientific enterprise to minimally sufficient and necessary logical terms [45]. Remarkably, our phylogeny of dipeptide sequences unfolds the history of a compositional repertoire of proteins that embeds a primordial ‘protein code’. This code is responsible for the limited lexicon of amino acids used by the world of proteins, which by necessity must be linked to the genetic code that stores the hereditary information of living systems. Our study finds a hidden link between the protein code of dipeptides, which is driven by the needs of emerging protein structure, and an early operational code delimited by aaRS-tRNA co-evolution, which is driven by catalysis and specificity. Both coevolving codes strive to reduce ambiguity, increase economy (parsimony) and dissipation of energy and information, and maximize communication (recognition) between the structural parts of the evolving biological system [91].
Supplementary Materials
The following supporting information can be downloaded at the website of this paper posted on Preprints.org, Figure S1: Consensus motifs of P1 and P2 sites of CDPS specificity-based groups of enzymes indexed with Group 1, 2 and 3 amino acids; Table S2: Abundances of dipeptides in proteomes; Table S2: Time of origin (nd) of dipeptides indexed with genetic code group participation; Table S2: Enriched dipeptides indexed with nd bins; File S1, Nexus file used to build the ToDS phylogeny; File S2, Nexus tree file.
Author Contributions
Conceptualization, M.W., M.F.A. and G.C-A.; methodology, M.W., M.F.A. and G.C-A.; data curation, M.W. and M.F.A.; validation, M.W., M.F.A. and G.C-A.; formal analysis, G.C-A. and M.F.A.; investigation, M.W., M.F.A. and G.C-A.; writing—original draft preparation, G.C-A.; writing—review and editing, G.C-A., M.W. and M.F.A.; visualization, G.C-A; supervision, G.C-A.; project administration, G.C-A.; funding acquisition, G.C-A. All authors have read and agreed to the published version of the manuscript.
Funding
Research was supported by grants from the National Science Foundation (MCB-0749836 and OISE-1132791) and the United States Department of Agriculture (ILLU-802-909 and ILLU-483-625) and supported by Blue Waters supercomputer allocations from the National Center for Supercomputing Applications (NCSA) to GCA.
Institutional Review Board Statement
Not applicable.
Informed Consent Statement
Not applicable.
Data Availability Statement
Materials and data necessary to interpret the findings of this paper have been included in the manuscript.
We encourage all authors of articles published in MDPI journals to share their research data. In this section, please provide details regarding where data supporting reported results can be found, including links to publicly archived datasets analyzed or generated during the study. Where no new data were created, or where data is unavailable due to privacy or ethical restrictions, a statement is still required. Suggested Data Availability Statements are available in section “MDPI Research Data Policies” at https://www.mdpi.com/ethics.
Acknowledgments
We acknowledge supercomputer support from the Illinois Campus Cluster Program. We dedicate this manuscript to the memory of Sergei Rodin. We thank him for his inspiration and friendship.
Conflicts of Interest
The authors declare no conflicts of interest. The funders had no role in the design of the study; in the collection, analyses, or interpretation of data; in the writing of the manuscript; or in the decision to publish the results.
References
- Montalban-Lopez, M.; Scott, T.A.; Ramesh, S.; et al. New developments in RiPP discovery, enzymology an engineering. Nat. Prod. Rep. 2021, 38, 130–239. [Google Scholar] [CrossRef]
- Flissi, A.; Ricart, E.; Campart, E.; Chevalier, M.; Dufresne, Y.; Michalik, J.; Jacques, P.; Flahault, C.; Lisacek, F.; Leclère, V.; Pupin, M. Norine: update of the non- ribosomal peptide resource. Nucleic Acids Res. 2020, 48, D466–D469. [Google Scholar]
- Erickson, H.P. Size and shape of protein molecules at the nanometer level determined by sedimentation, gel filtration, and electron microscopy. Biol. Proced. Online 2009, 11, 32–51. [Google Scholar] [CrossRef]
- Ambrogelly, A.; Palioura, S.; Söll, D. Natural expansion of the genetic code. Nat. Chem. Biol. 2007, 3, 29–35. [Google Scholar] [CrossRef]
- Caetano-Anollés, G.; Wang, M.; Caetano-Anollés, D.; Mittenthal, J.E. The origin, evolution and structure of the protein world. Biochem. J. 2009, 417, 621–637. [Google Scholar] [CrossRef]
- Oldfield, C.J.; Uversky, V.N.; Dunker, A.K.; Kurgan, L. Introduction to intrinsically disordered proteins and regions. In Intrinsically Disordered Proteins; Salvi, N., Ed.; Elsevier Inc., 2019; pp. 1–34. [Google Scholar]
- Schweitzer-Stenner, R. The relevance of short peptides for an understanding of unfolded and intrinsically disordered proteins. Phys. Chem. Chem. Phys. 2023, 25, 11908–1933. [Google Scholar] [CrossRef]
- Kocher, C.D.; Dill, K.A. Origins of life: The protein folding problem all over again? Proc. Natl. Acad. Sci. USA 2024, 121, e2315000121. [Google Scholar] [CrossRef]
- Caetano-Anollés, G.; Aziz, M.F.; Mughal, F.; Caetano-Anollés, D. Tracing protein and proteome history with chronologies and networks: folding recapitulates evolution. Exp. Rev. Proteomics 2021, 18, 863–880. [Google Scholar] [CrossRef]
- Caetano-Anollés, K.; Aziz, M.F.; Mughal, F.; Caetano-Anollés, G. On protein loops, prior molecular states and common ancestors of life. J. Mol. Evol. 2024, 92, 624–646. [Google Scholar] [CrossRef]
- Caetano-Anollés, G.; Mughal, F.; Aziz, M.F.; Caetano-Anollés, K. Tracing the birth and intrinsic disorder of loops and domains in protein evolution. Biophysical Rev. 2024. [Google Scholar] [CrossRef]
- Aziz, M.F.; Caetano-Anollés, K.; Caetano-Anollés, G. The early history and emergence of molecular functions and modular scale-free network behavior. Sci. Rep. 2016, 6, 25058. [Google Scholar] [CrossRef]
- Aziz, M.F.; Mughal, F.; Caetano-Anollés, G. Tracing the birth of structural domains from loops during protein evolution. Sci. Rep. 2023, 13, 14688. [Google Scholar] [CrossRef]
- Aziz, M.F.; Caetano-Anollés, G. Evolution of networks of protein domain organization. Sci. Rep. 2021, 11, 12075. [Google Scholar] [CrossRef]
- Caetano-Anollés, G.; Wang, M.; Caetano-Anollés, D. Structural phylogenomics retrodicts the origin of the genetic code and uncovers the evolutionary impact of protein flexibility. PLoS One 2013, 8, e72225. [Google Scholar] [CrossRef]
- Hou, Y.M.; Schimmel, P. A simple structural feature is a major determinant of the identity of a transfer RNA. Nature 1988, 333, 140–145. [Google Scholar] [CrossRef]
- Schimmel, P.; Giegé, R.; Moras, D.; Yokohama, S. An operational RNA code for amino acids and possible relationship to genetic code. Proc. Natl. Acad. Sci. USA 1993, 90, 8763–8768. [Google Scholar] [CrossRef]
- Gough, J.; Karplus, K.; Hughey, R.; Chothia, C. Assignment of homology to genome sequences using a library of Hidden Markov Models that represent all proteins of known structure. J. Mol. Biol. 2001, 313, 903–919. [Google Scholar] [CrossRef]
- Wang, G.; Dunbrack Jr., R. L. PISCES: a protein sequence culling server. Bioinformatics 2003, 19, 1589–1591. [Google Scholar] [CrossRef]
- Murzin, A.; Brenner, S.E.; Hubbard, T.; Clothia, C. SCOP: a structural classification of proteins for the investigation of sequences and structures. J. Mol. Biol. 1995, 247, 536–540. [Google Scholar] [CrossRef] [PubMed]
- Nasir, A.; Caetano-Anollés, G. A phylogenomic data-driven exploration of viral origins and evolution. Sci. Adv. 2015, 1, e1500527. [Google Scholar] [CrossRef] [PubMed]
- Swofford, D.L. PAUP*: Phylogenomic Analysis Using Parsimony (*and Other Methods), version 4.0b10; Sinauer: Sunderland, MA, USA, 2004. [Google Scholar]
- Lundberg, J. Wagner networks and ancestors. Syst. Zool. 1972, 21, 398–413. [Google Scholar] [CrossRef]
- Weston, P.H. Indirect and direct methods in systematics. In Ontogeny and Systematics; Humphries, C.J., Ed.; Columbia Universit Press: New York, NY, USA, 1988; pp. 27–56. [Google Scholar]
- Weston, P.H. Methods for rooting cladistic trees. In Models in Phylogeny Reconstruction; Siebert, D.J., Scotland, R.W., Williams, D.M., Eds.; Systematics Association Special Volume No. 52; Clarendon Press: Oxford, UK, 1994; pp. 125–155. [Google Scholar]
- Caetano-Anollés, D.; Nasir, A.; Kim, K.M.; Caetano-Anollés, G. Testing empirical support for evolutionary models that root the tree of life. J. Mol. Evol. 2019, 87, 131–142. [Google Scholar] [CrossRef]
- Caetano-Anollés, G.; Nasir, A.; Kim, K.M.; Caetano-Anollés, D. Rooting phylogenies and the Tree of Life while minimizing ad hoc and auxiliary assumptions. Evol. Bioinform. 2018, 14, 1176934318805101. [Google Scholar] [CrossRef] [PubMed]
- Hillis, D.M.; Huelsenbeck, J.P. Signal, noise, and reliability in molecular phylogenetic analysis. J. Hered. 1992, 83, 189–195. [Google Scholar] [CrossRef] [PubMed]
- FigTree. Available online: https://github.com/rambaut/figtree/ (accessed on 1 December 2024).
- Caetano-Anollés, G.; Caetano-Anollés, D. Universal sharing patterns in proteomes and evolution of protein fold architecture and life. J. Mol. Evol. 2005, 60, 484–498. [Google Scholar] [CrossRef]
- Wang, M.; Jiang, Y.-Y.; Kim, K.M.; Wu, G.; Ji, H.-F.; Mittenthal, J.E.; Zhang, H.-Y.; Caetano-Anollés, G. A universal molecular clock of protein folds and its power in tracing the early history of aerobic metabolism and planet oxygenation. Mol. Biol. Evol. 2011, 28, 567–582. [Google Scholar] [CrossRef]
- TreeStat. Available online: http://tree.bio.ed.ac.uk/software/treestat/ (accessed on 1 December 2024).
- Kabsch, W.; Sander, C. Dictionary of protein secondary structure: pattern recognition of hydrogen-bonded and geometrical features. Biopolymers 1983, 22, 2577–2637. [Google Scholar] [CrossRef] [PubMed]
- R Core Team. R: A language and environment for statistical computing. R Foundation for Statistical Computing, Vienna, Austria. 2014. ISBN 3-900051-07-0.
- Kolaczkowski, B.; Thornton, J.W. Performance of maximum parsimony and likelihood phylogenetics when evolution is heterogeneous. Nature 2004, 431, 980–984. [Google Scholar] [CrossRef]
- Goloboff, P.A.; Torres, A.; Arias, J.S. Weighted parsimony outperforms other methods of phylogenetic inference under models appropriate for morphology. Cladistics 2018, 34, 407–437. [Google Scholar] [CrossRef]
- Amangeldina, A.; Tan, Z.W.; Berezovsky, I.N. Living in trinity of extremes: genomic and proteomic signatures of halophilic, thermophilic and pH adaptation. Curr. Res. Struct. Biol. 2024, 7, 100129. [Google Scholar] [CrossRef]
- Pe’er, I.; Felder, C.E.; Man, O.; Silman, I.; Sussman, J.S.; Beckmann, J.S. Proteomic signatures: amino acid and oligopeptide compositions differentiate among taxa. Proteins 2004, 54, 20–40. [Google Scholar] [CrossRef] [PubMed]
- Jordan, I.K.; Kondrashov, F.A.; Adzhubei, I.A.; Wolf, Y.I.; Koonin, E.V.; Kondrashov, A.S.; Sunyaev, S. A universal trend of amino acid gain and loss in protein evolution. Nature 2005, 433, 633–638. [Google Scholar] [CrossRef]
- Choi, J.; Kim, S.-H. Whole-proteome tree of life suggests a deep burst of organism diversity. Proc Natl Acad Sci USA 2020, 117, 3678–3686. [Google Scholar] [CrossRef]
- James, J. E.; Willis, S. M.; Nelson, P. G.; Weibel, C.; Kosinski, L.J.; Masel, J. Universal and taxon-specific trends in protein sequences as a function of age. Elife 2021, 10, e57347. [Google Scholar] [CrossRef]
- Nakashima, H.; Nishikawa, K.; Ooi., T. The folding type of a protein is relevant to the amino acid composition. J. Biochem. 1986, 99, 153–162. [Google Scholar] [CrossRef] [PubMed]
- Roy, S.; Martinez, D.; Platero, H.; Lane, T.; Werner-Washburne, M. Exploiting amino acid composition for predicting protein-protein interactions. PLoS One 2009, 4, e7813. [Google Scholar] [CrossRef]
- Koç, I.; Caetano-Anollés, G. The natural history of molecular functions inferred from an extensive phylogenomic analysis of gene ontology data. PLoS One 2017, 12, e0176129. [Google Scholar] [CrossRef]
- Caetano-Anollés, G. Retrodiction – Exploring the history of parts and wholes in the biosystems of life. In Untangling Molecular Biodiversity Caetano- Anollés, G., Ed.; World Scientific: Singapore, 2021; pp. 23–90. [Google Scholar]
- Webster, A.J.; Payne, R.J.H.; Pagel., M. Molecular phylogenies link rates of evolution and speciation. Science 2003, 301, 478. [Google Scholar] [CrossRef] [PubMed]
- Zhang, H.-Y.; Qin, T.; Jiang, Y.-Y.; Caetano-Anollés, G. Structural phylogenomics uncovers the early and concurrent origins of cysteine biosynthesis and iron-sulfur proteins. J. Biomol. Struct. Dyn. 2012, 30, 542–545. [Google Scholar] [CrossRef] [PubMed]
- Jakubowski, H. Homocysteine editing, thioester chemistry, coenzyme A, and the origin of coded peptide synthesis. Life 2017, 7, 6. [Google Scholar] [CrossRef]
- Caetano-Anollés, G.; Kim, K.M.; Caetano-Anollés, D. The phylogenomic roots of modern biochemistry: Origins of proteins, cofactors and protein biosynthesis. J. Mol. Evol. 2012, 74, 1–34. [Google Scholar] [CrossRef]
- Mocibob, M.; Ivic, N.; Bilokapic, S.; Maier, T.; Luic, M.; Ban, N.; Weygand-Durasevic, I. Homologs of aminoacyl-tRNA synthetases acylate carrier proteins and provide a link between ribosomal and nonribosomal peptide synthesis. Proc. Natl. Acad. Sci. USA 2010, 107, 14585–14590. [Google Scholar] [CrossRef] [PubMed]
- Gondry, M.; Sauguet, L.; Belin, P.; Thai, R.; Amouroux, R.; Tellier, C.; Tuphile, K.; Jacquet, M.; Braud, S.; Courçon, M.; Masson, C.; Dubois, S.; Lautru, S.; Lecoq, A.; Hashimoto, S.; Genet, R.; Pernodet, J.-L. Cyclodipeptide synthetases are a family of tRNA-dependent peptide-bond- forming enzymes. Nature Chem. Biol. 2009, 5, 414–420. [Google Scholar] [CrossRef]
- Gondry, M.; Jacques, I.B.; Thai, R.; Babin, M.; Canu, N.; Seguin, J.; Belin, P.; Pernodet, J.-L.; Moutiez, M. A comprehensive overview of the cyclodipeptide synthase family enriched with the characterization of 32 new enzymes. Front. Microbiol. 2018, 9, 46. [Google Scholar] [CrossRef] [PubMed]
- Bourgeois, G.; Seguin, J.; Babin, M.; Gondry, M.; Mechulam, Y.; Schmitt, E. Structural basis of the interaction between cyclodipeptide synthases and aminoacylated tRNA substrates. RNA 2020, 26, 1589–1602. [Google Scholar] [CrossRef] [PubMed]
- Harding, C.J.; Sutherland, E.; Hanna, J.G.; Houston, D.R.; Czekster, C.M. Bypassing the requirement for aminoacyl-tRNA by a cyclodipeptide synthase enzyme. RSC Chem Biol. 2021, 2, 230–240. [Google Scholar] [CrossRef]
- Sun, F.-J.; Caetano-Anollés, G. The origin and evolution of tRNA inferred from phylogenetic analysis of structure. J. Mol. Evol. 2008, 66, 21–35. [Google Scholar] [CrossRef]
- Sun, F.-J.; Caetano-Anollés, G. Evolutionary patterns in the sequence and structure of transfer RNA: early origins of archaea and viruses. PLoS Comput. Biol. 2008, 4, e1000018. [Google Scholar] [CrossRef]
- Sun, F.-J.; Caetano-Anollés, G. Evolutionary patterns in the sequence and structure of transfer RNA: a window into early translation and the genetic code. PLoS One 2008, 3, e2799. [Google Scholar] [CrossRef]
- Sun, F.-J.; Caetano-Anollés, G. Menzerath-Altmann’s law of syntax in RNA accretion history. Life 2021, 11, 489. [Google Scholar] [CrossRef] [PubMed]
- Weiner, A.M.; Maizels, N. tRNA-like structures tag the 3’ ends of genomic RNA molecules for replication: implications for the origin of protein synthesis. Proc. Natl. Acad. Sci. U.S.A. 1987, 84, 7383–7387. [Google Scholar] [CrossRef] [PubMed]
- Carter Jr., C. W. What RNA world? Why peptide/RNA partnership merits renewed experimental attention. Life 2015, 5, 294–320. [Google Scholar] [CrossRef]
- Carter Jr., C. W.; Wills, P.R. The roots of genetic coding in aminoacyl-tRNA synthetase duality. Annu. Rev. Biochem. 2021, 90, 349–373. [Google Scholar] [CrossRef]
- Wang, W.; Feng, C.; Han, R.; Wang, Z.; Ye, L.; Du, Z.; Wei, H.; Zhang, F.; Peng, Z.; Yang, J. trRosettaRNA; automated prediction of RNA 3D structure with transformer network. Nature Commun. 2023, 14, 7266. [Google Scholar] [CrossRef]
- Harish, A.; Caetano-Anollés, G. Ribosomal history reveals origins of modern protein synthesis. PLoS One 2012, 7, e32776. [Google Scholar] [CrossRef]
- Hale, S.P.; Auld, D.S.; Schmidt, E.; Schimmel, P. Discrete determinants in transfer RNA for editing and aminoacylation. Science 1997, 276, 1250–1252. [Google Scholar] [CrossRef]
- Caetano-Anollés, G.; Sun, F.-J. The natural history of transfer RNA and its interaction s with the ribosome. Front. Genet. 2014, 5, 127. [Google Scholar]
- Delarue, M. An asymmetric underlying rule in the assignment of codons: possible clue to a quick early evolution of the genetic code via successive binary choices. RNA 2007, 13, 1–9. [Google Scholar] [CrossRef]
- Rodin, S.N.; Rodin, A.S. On the origin of the genetic code: signatures of its primordial complementarity in tRNAs and aminoacyl-tRNA synthetases. Heredity 2008, 100, 341–355. [Google Scholar] [CrossRef] [PubMed]
- Rodin, S. , Ohno, S. Four primordial modes of tRNA-synthetase recognition, determined by the (G,C) operational code. Proc. Natl. Acad. Sci. USA 1997, 94, 5183–5188. [Google Scholar] [CrossRef]
- Eriani, G.; Delarue, M.; Poch, O.; Gangloff, J.; Moras, D. Partition of aminoacyl-tRNA synthetases into two classes based on mutually exclusive sets of conserved motifs. Nature 1990, 347, 203–206. [Google Scholar] [CrossRef]
- Shitivelband, S.; Hou, Y.-M. Breaking the stereo barrier of amino acid attachment to tRNA by a single nucleotide. J. Mol. Biol. 2005, 348, 513–521. [Google Scholar] [CrossRef]
- Saier Jr, M.H. Understanding the genetic code. J. Bacteriol. 2019, 201, e00091-19. [Google Scholar] [CrossRef]
- Root-Bernstein, M.; Root-Bernstein, R. The ribosome as a missing link in the evolution of life. J. Theor. Biol. 2015, 367, 130–158. [Google Scholar] [CrossRef]
- Caetano-Anollés, D.; Caetano-Anollés, G. Piecemeal buildup of the genetic code, ribosomes, and genomes from primordial tRNA building blocks. Life 2016, 6, 43. [Google Scholar] [CrossRef] [PubMed]
- Huang, D.W.; Sherman, B.T.; Lempicki, R.A. Bioinformatics enrichment tools: paths towards the comprehensive functional analysis of large gene lists. Nucleic Acids Res. 2008, 37, 1–13. [Google Scholar] [CrossRef] [PubMed]
- Mittenthal, J.E.; Caetano-Anollés, D.; Caetano-Anollés, G. Biphasic patterns of diversification and the emergence of modules. Front. Genetics 2012, 3, 147. [Google Scholar] [CrossRef]
- Caetano-Anollés, G.; Aziz, M.F.; Mughal, F.; Gräter, F.; Koç, I.; Caetano-Anollés, K.; Caetano-Anollés, D. Emergence of hierarchical modularity in evolving networks uncovered by phylogenomic analysis. Evol. Bioinform. 2019, 15, 1176934319872980. [Google Scholar] [CrossRef]
- Fried, S.D.; Fujishima, K.; Makarov, M.; Chereppashuk, I.; Hlouchova, K. Peptide before and during the nucleotide world: an origins story emphasizing cooperation between proteins and nucleic acids. J. R. Soc. Interface 2022, 19, 20210641. [Google Scholar] [CrossRef]
- Caetano-Anollés, G.; Seufferheld, M.J. The coevolutionary roots of biochemistry and cellular organization challenge the RNA world paradigm. J. Mol. Microbiol. Biotechnol. 2013, 23, 152–177. [Google Scholar] [CrossRef]
- Fox, S.W.; Dose, K. Molecular evolution and the origin of life; Marcel Dekker: New York, 1977. [Google Scholar]
- Lipmann, F. Attempts to map a process evolution of peptide biosynthesis. Science 1971, 173, 875–884. [Google Scholar] [CrossRef]
- Dyson, F.J. A model for the origin of life. J. Mol. Evol. 1982, 18, 344–350. [Google Scholar] [CrossRef]
- Dyson, F.J. Origin of Life; Cambridge University Press: Cambridge, 1999. [Google Scholar]
- Kauffman, S.A. Autocatalytic sets of proteins. J. Theor. Biol. 1986, 119, 1–24. [Google Scholar] [CrossRef]
- De Duve, C. The beginnings of life on earth. Am. Sci. 1995, 83, 428–437. [Google Scholar]
- Berezovsky, I.N.; Grosberg, A.Y.; Trifonov, E.N. Closed loops of nearly standard size: Common basic element of protein structure. FEBS Letters 2000, 466, 283–286. [Google Scholar] [CrossRef] [PubMed]
- Trifonov, E.N.; Kirzhner, A.; Kirzhner, V.M.; Berezovsky, I.N. Distinct stages of protein evolution as suggested by protein sequence analysis. J. Mol. Evol. 2001, 53, 394–401. [Google Scholar] [CrossRef]
- Trifonov, E.N.; Frenkel, Z.M. Evolution of protein modularity. Curr. Op. Struct. Biol. 2009, 18, 335–340. [Google Scholar] [CrossRef]
- Goncearenco, A.; Berezovsky, I.N. Protein function from its emergence to diversity in contemporary proteins. Phys. Biol. 2015, 12, 45002. [Google Scholar] [CrossRef]
- Romero Romero, M.L.; Yanf, F.; Lin, Y.-R.; Toth-Petroczy, A.; Berezovsky, I.N.; Goncearenco, A.; Yang, W.; Welinger, A.; Kumar-Deshmukh, F.; Sharon, M.; Varani, G.; Tawfik, D.S. Simple yet functional phosphate-loop proteins. Proc. Natl. Acad. Sci. USA 2018, 115, E11943–E11950. [Google Scholar] [CrossRef]
- Vyas, P.; Trofimyuk, O.; Longo, L.M.; Tawfik, D.S. Helicase-like functions in phosphate loop containing beta-alpha polypep- tides. Proc. Natl. Acad. Sci. USA 2021, 118, e2016131118. [Google Scholar] [CrossRef]
- Caetano-Anollés, G. Agency in evolution of biomolecular communication. Ann N.Y. Acad. Sci. 2023, 1525, 88–103. [Google Scholar] [CrossRef]
Figure 1.
Phylogenomic data-driven analyses allow exploration of the evolution of dipeptide sequences in proteomes. (a) A workflow shows the general phylogenomic reconstruction strategy. Hidden Markov models (HMMs) of structural recognition are used to build demography tables and nexus-encoded phylogenomic data matrices of domains, amino acid and dipeptide abundances. Matrices and models of character state change (transformation series) involving ordered multistate Wagner characters were then used to build trees of domains (ToD) and trees of dipeptide sequences (ToDS) from which to derive chronologies using the maximum parsimony criterion and heuristic search strategies. Workflow steps highlighted in grey were conducted in [15] but used in the present study. (b) An evolutionary heat map shows the relative dipeptide composition of 1,561 proteomes with dipeptides ordered according to a chronology of dipeptides (this work). Time of origin was expressed as a node distance (nd). (c) An evolutionary heat map shows the dipeptide composition of domain families ordered according to a chronology of domains (data from [15]). Time of origin was expressed as nd or as billions of years ago (Gya). The ToD shown below represents an optimal most parsimonious phylogenomic reconstruction from an analysis of the proteomes of 420 free-living organisms. Terminal leaves are not labeled in the tree since they would not be legible. The Venn diagram shows occurrence of domain families in the three superkingdoms.

Figure 2.
PCA results and classification effects for proteomes (a) and domains (b). Proteomes and domains in PCA plots are labeled with alphanumeric identifiers and time of origin (nd) values, respectively. The more widely-spread proteomes were Homo sapiens (hs), Trichomonas vaginalis (tx), Tetrahymena thermophila (hy), Paramecium tetraurelia (ir), Gossypium raimondi (p5l), Acremonium alcalophilum (q0), and Micromonas pusilla (iq). The more widely-spread domains had ages that appeared halfway in the evolutionary timeline. Scree plots are provided as insets.
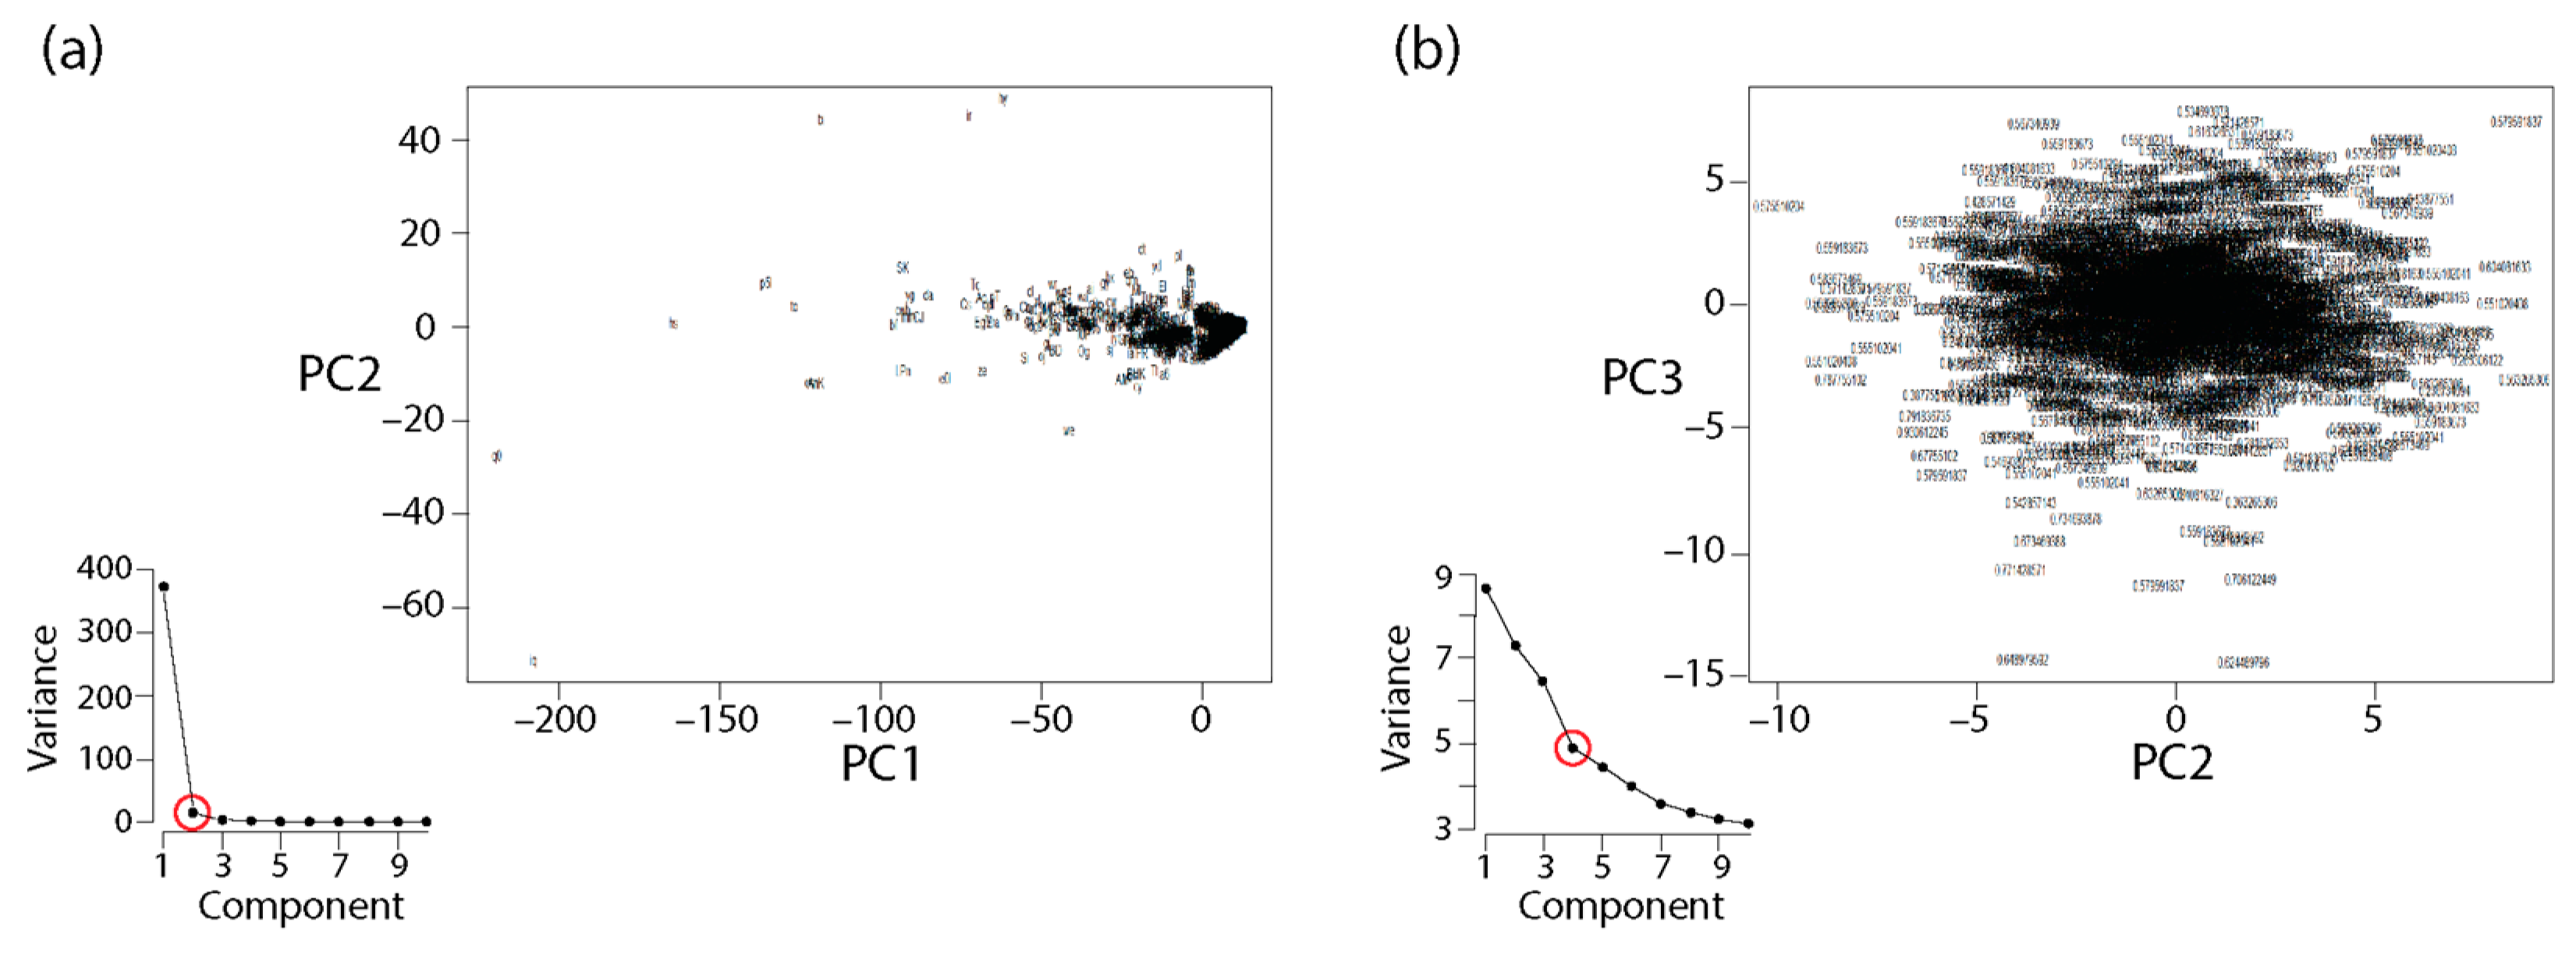
Figure 3.
Rooted phylogenomic tree of dipeptide sequences (ToDS) describing the origin and evolution of 400 dipeptides in the proteomes of 1,561 organisms. The single rooted most-parsimonious tree (MPT) of 191,935 steps in length was supported by a consistency index (CI) of 0.063 and retention index (RI) of 0.726. The frequency distribution of the lengths of 10,000 trees (inset) had a mean of 571,365 steps (SD = 6,537; g1 = –0.157, g2 = 0.035). The tree with minimum length of the distribution of suboptimal trees (546,229 steps) was 3 times longer than the unrooted tree retained in the search (179,116 steps), showing the effectiveness of the search strategy. Networks describe dipeptide makeup in bins of times of origin (nd) by connecting participating amino acids (nodes labeled with single-letter amino acid nomenclature) with peptide bonds (lines describing dipeptide types). If both possible dipeptides (e.g., GL and LG describing the two possible sequence arrangements of amino acids Gly and Leu) were present in a bin, lines connecting them were double weighted. Amino acids belonging to Groups 1, 2 and 3, which are delimited by amino acid charging functionalities, were color coded in orange, green and blue, respectively.

Figure 4.
Dipeptide composition along the chronology of dipeptide sequences. Stacked column charts describe dipeptides corresponding to the 9 categories specified by aaRS structure-delimited Groups 1, 2 and 3 amino acids.
Figure 4.
Dipeptide composition along the chronology of dipeptide sequences. Stacked column charts describe dipeptides corresponding to the 9 categories specified by aaRS structure-delimited Groups 1, 2 and 3 amino acids.
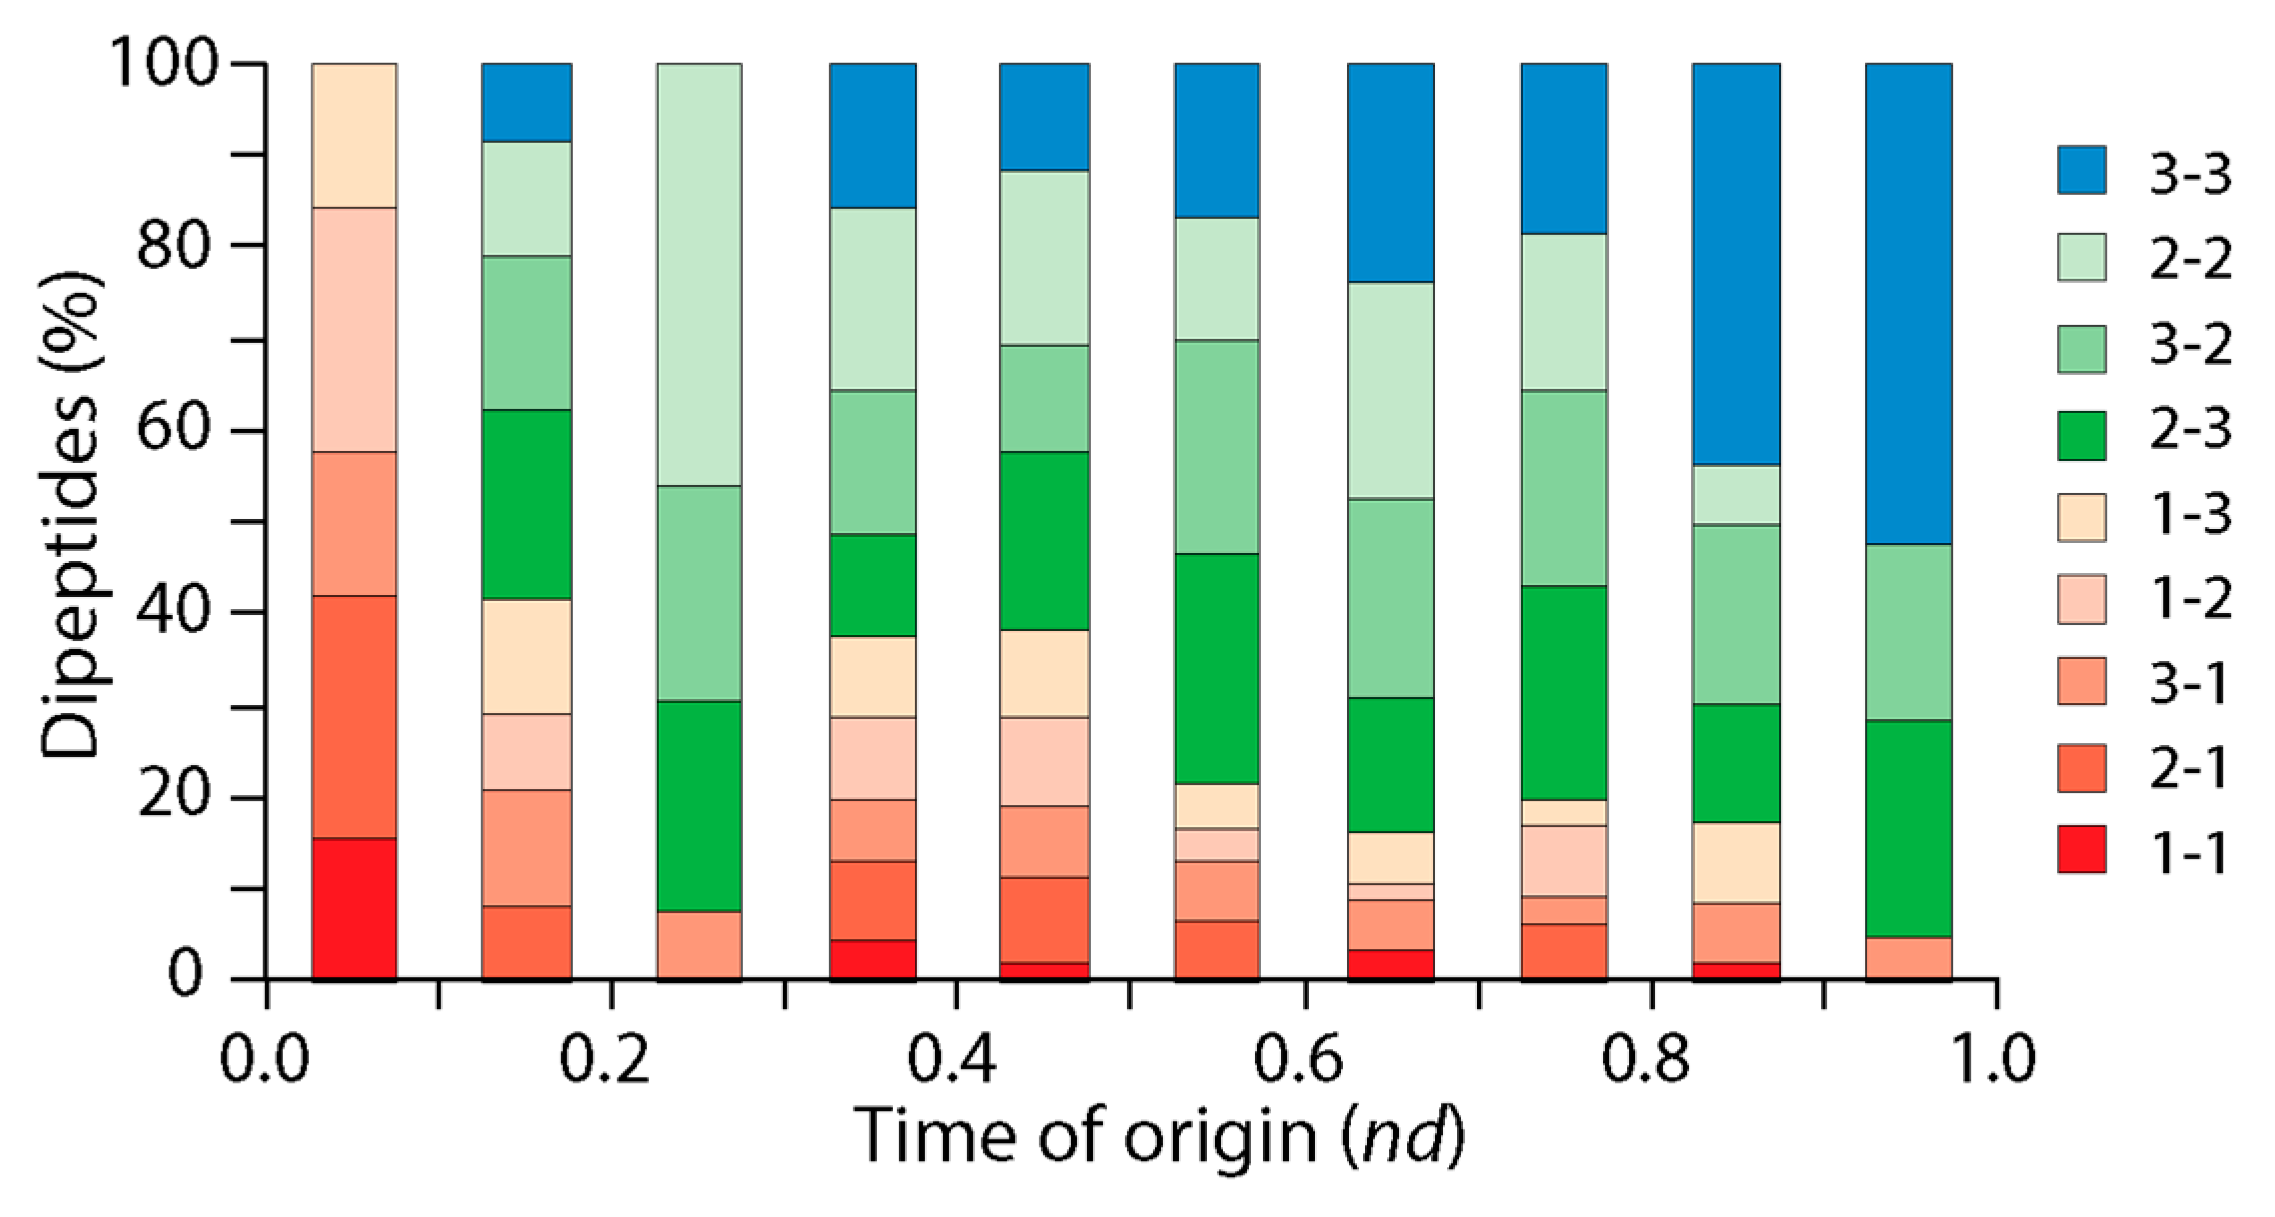
Figure 5.
Chronology plots of dipeptide sequences and their link to the ‘operational’ origins of the genetic code in amino acid charging and editing functionalities. The chronology was indexed with dipeptides containing Group 1, 2 and 3 amino acids. The initial three epochs of the chronology describe the evolutionary rise of Group 1, Group 2 and Group 3-containing dipeptides. A fourth and last epoch defines the rise of Cys-containing dipeptides (blue symbols) towards the end of dipeptide evolution. Networks describe dipeptide makeup by connecting participating amino acids (nodes) with peptide bonds (lines weighted by number of dipeptide types).
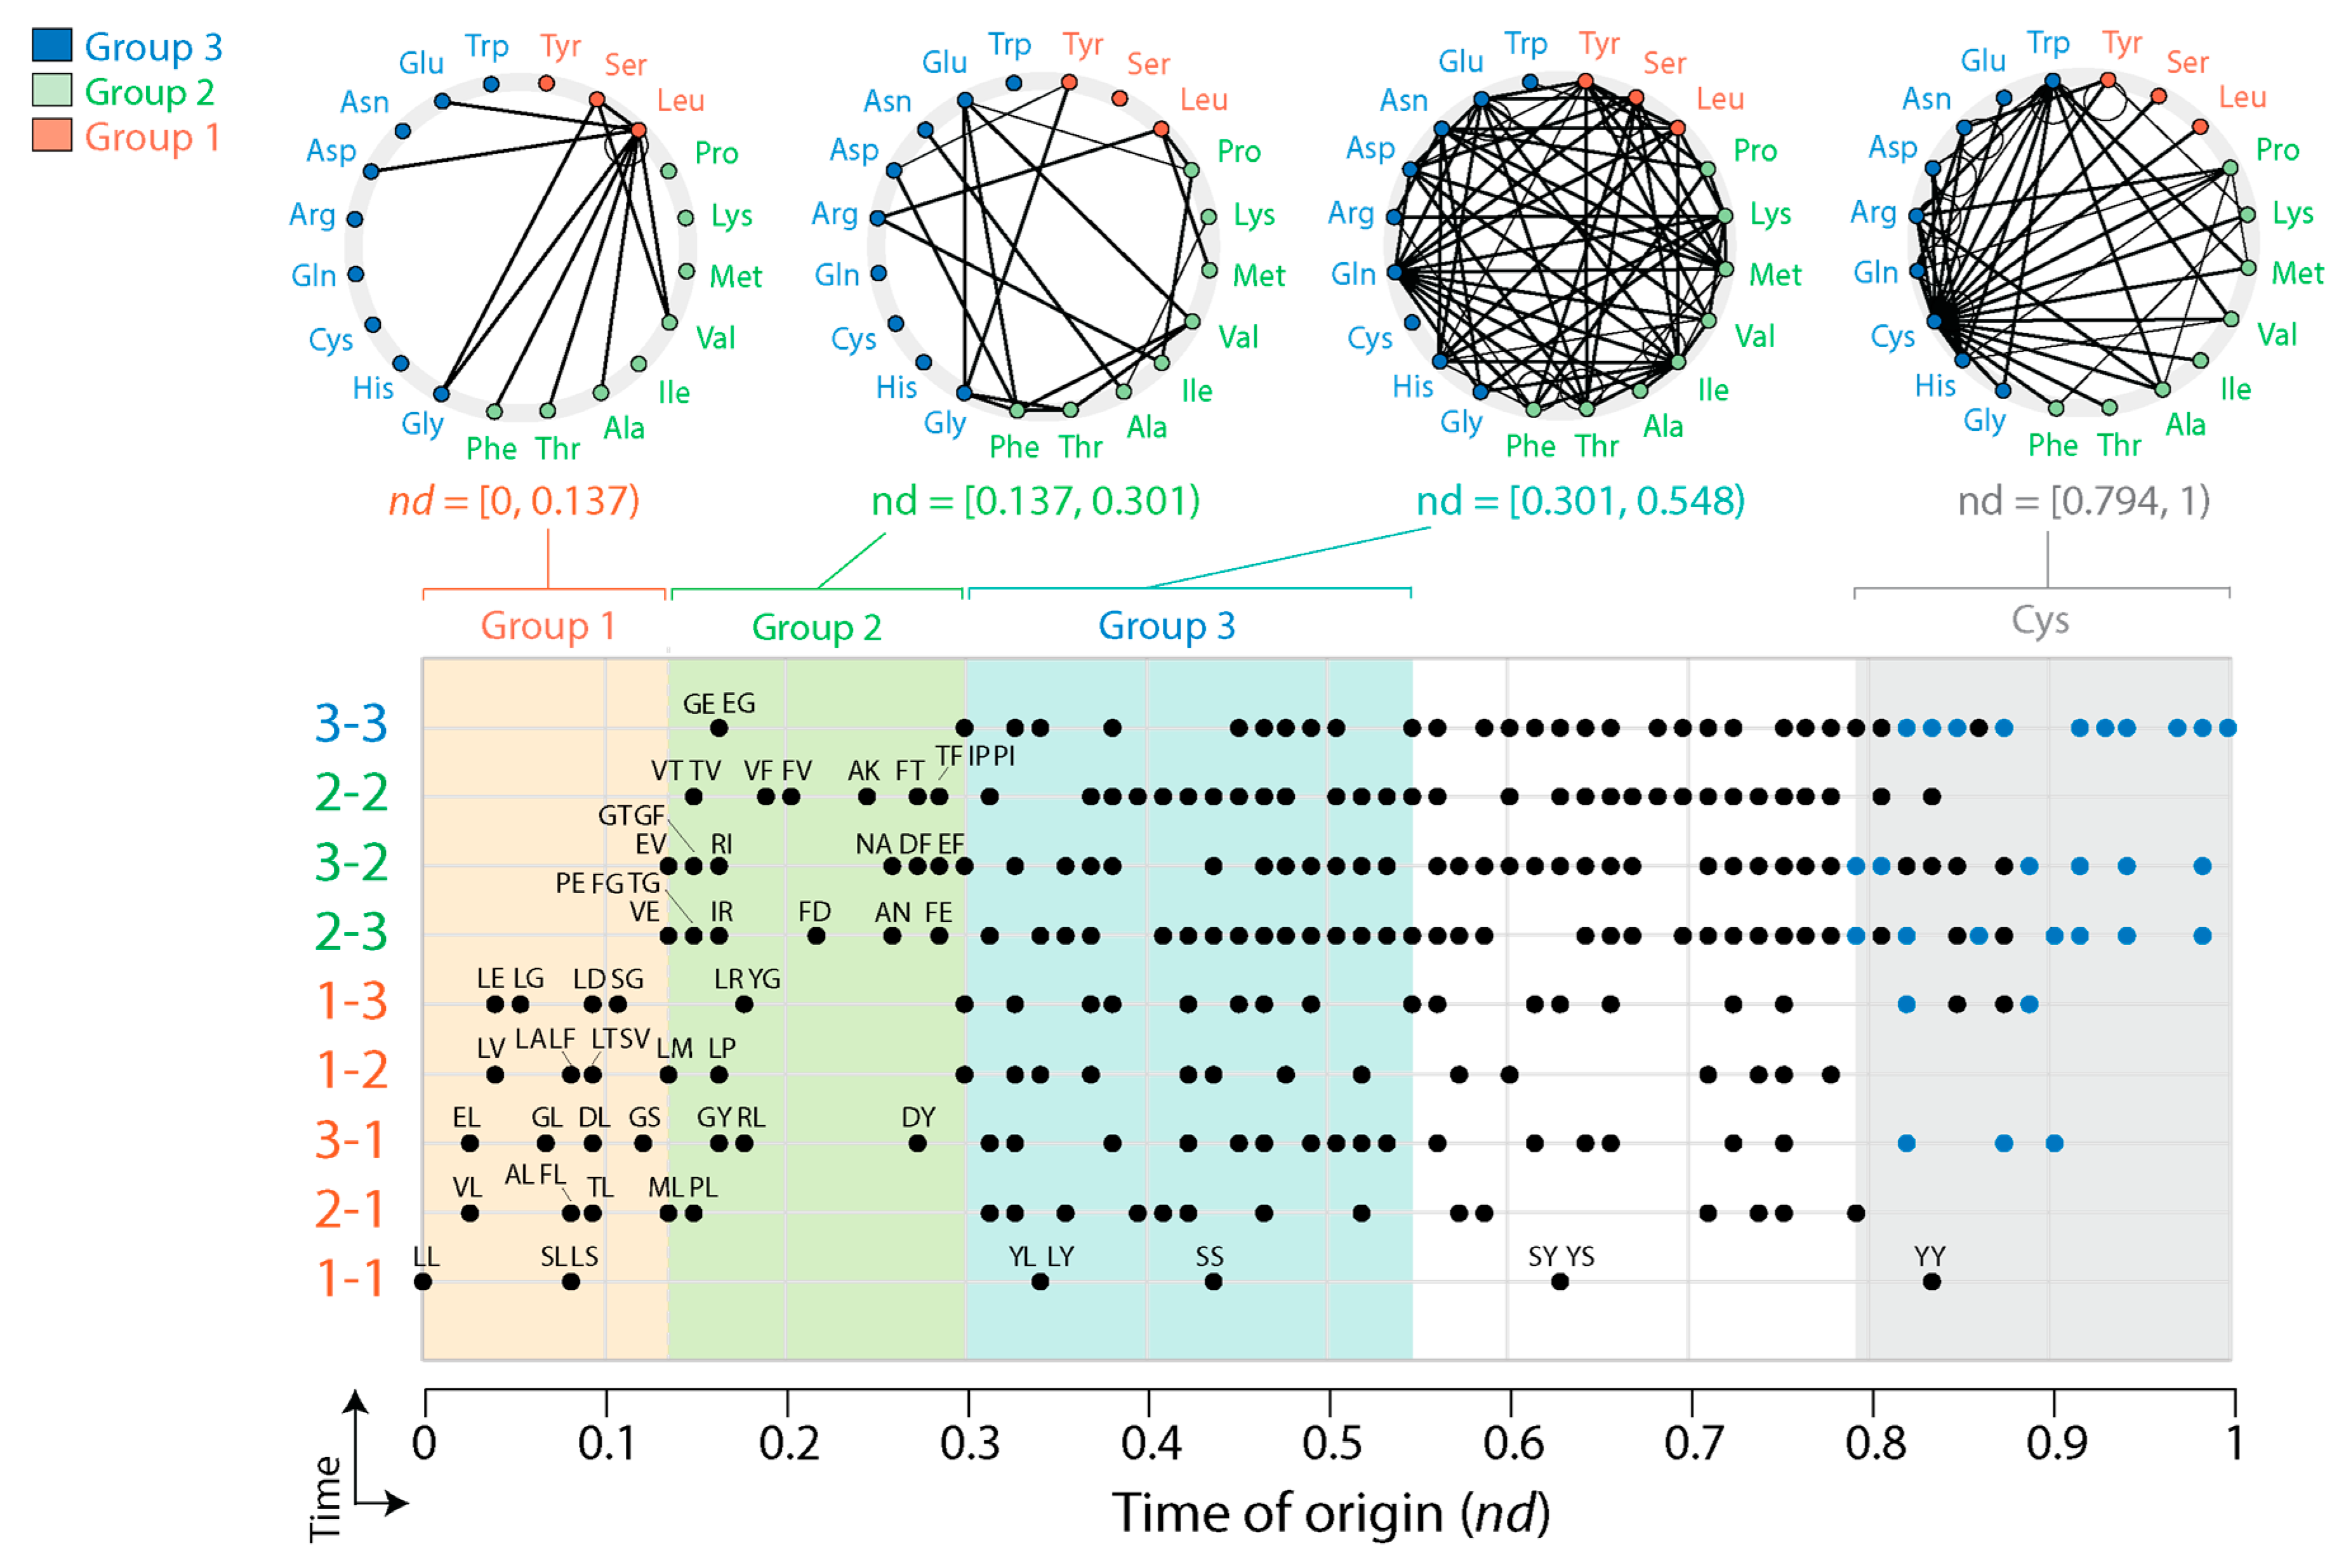
Figure 6.
Chronology of dipeptide sequences partitioned into participating amino acids. Amino acids were ordered according to their time of inception in the operational code, which follows amino acid Groups 1, 2 and 3. Time flows from left to right in the timelines and from bottom to top in the amino acid inception sequence. Dipeptide first accounts (closed symbols) were distinguished from double entries (open symbols). Box plots were overlaid onto the timelines to reveal the distribution of dipeptide emergence. The inset shows the expected decrease of first accounts with the sequence of amino acid inception (dashed green line) and departures from expected values, which we use to define ‘transition’ phases between groups.
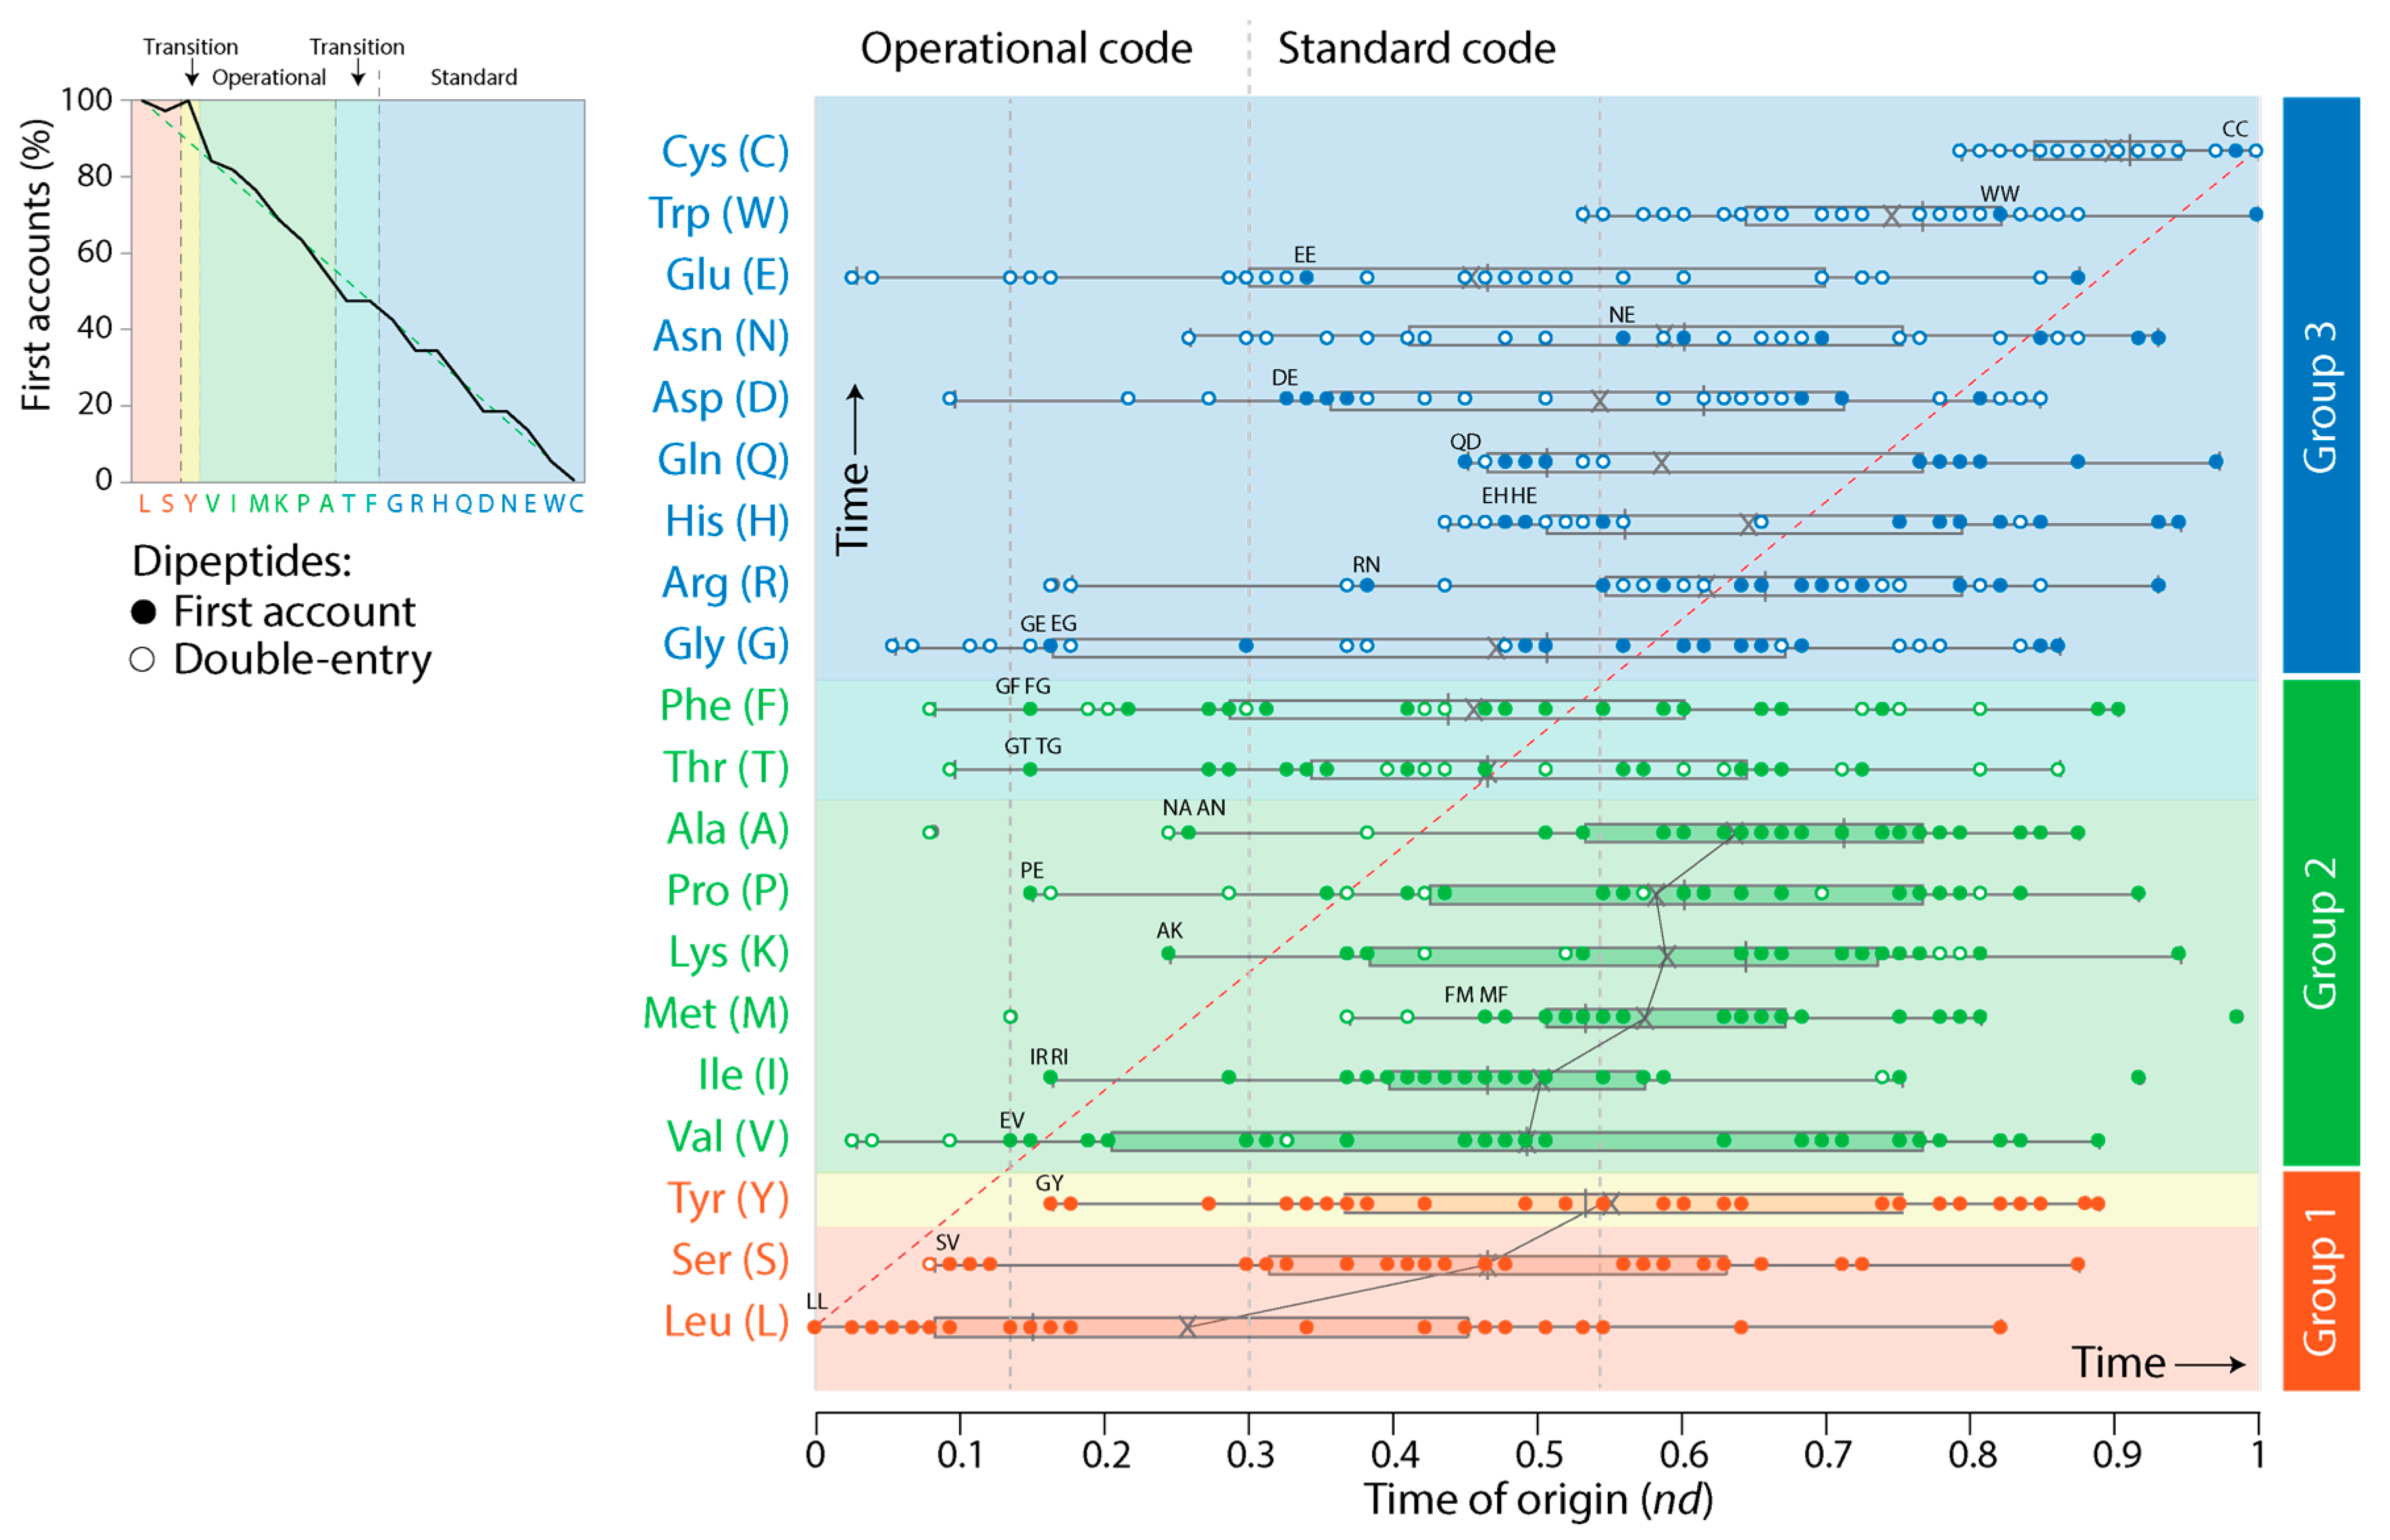
Figure 7.
Tracing the evolution of enriched dipeptides along a chronology of structural domains. Networks describing the dipeptide makeup of individual nd bins (combinations of 2 amino acids) are arranged in a circle with time flowing clockwise and with numbers of enriched dipeptides in the center. The circular bar chart in the center describes the amino acid composition of the dipeptides of individual nd bins using a polar coordinate system in which time flows outward.
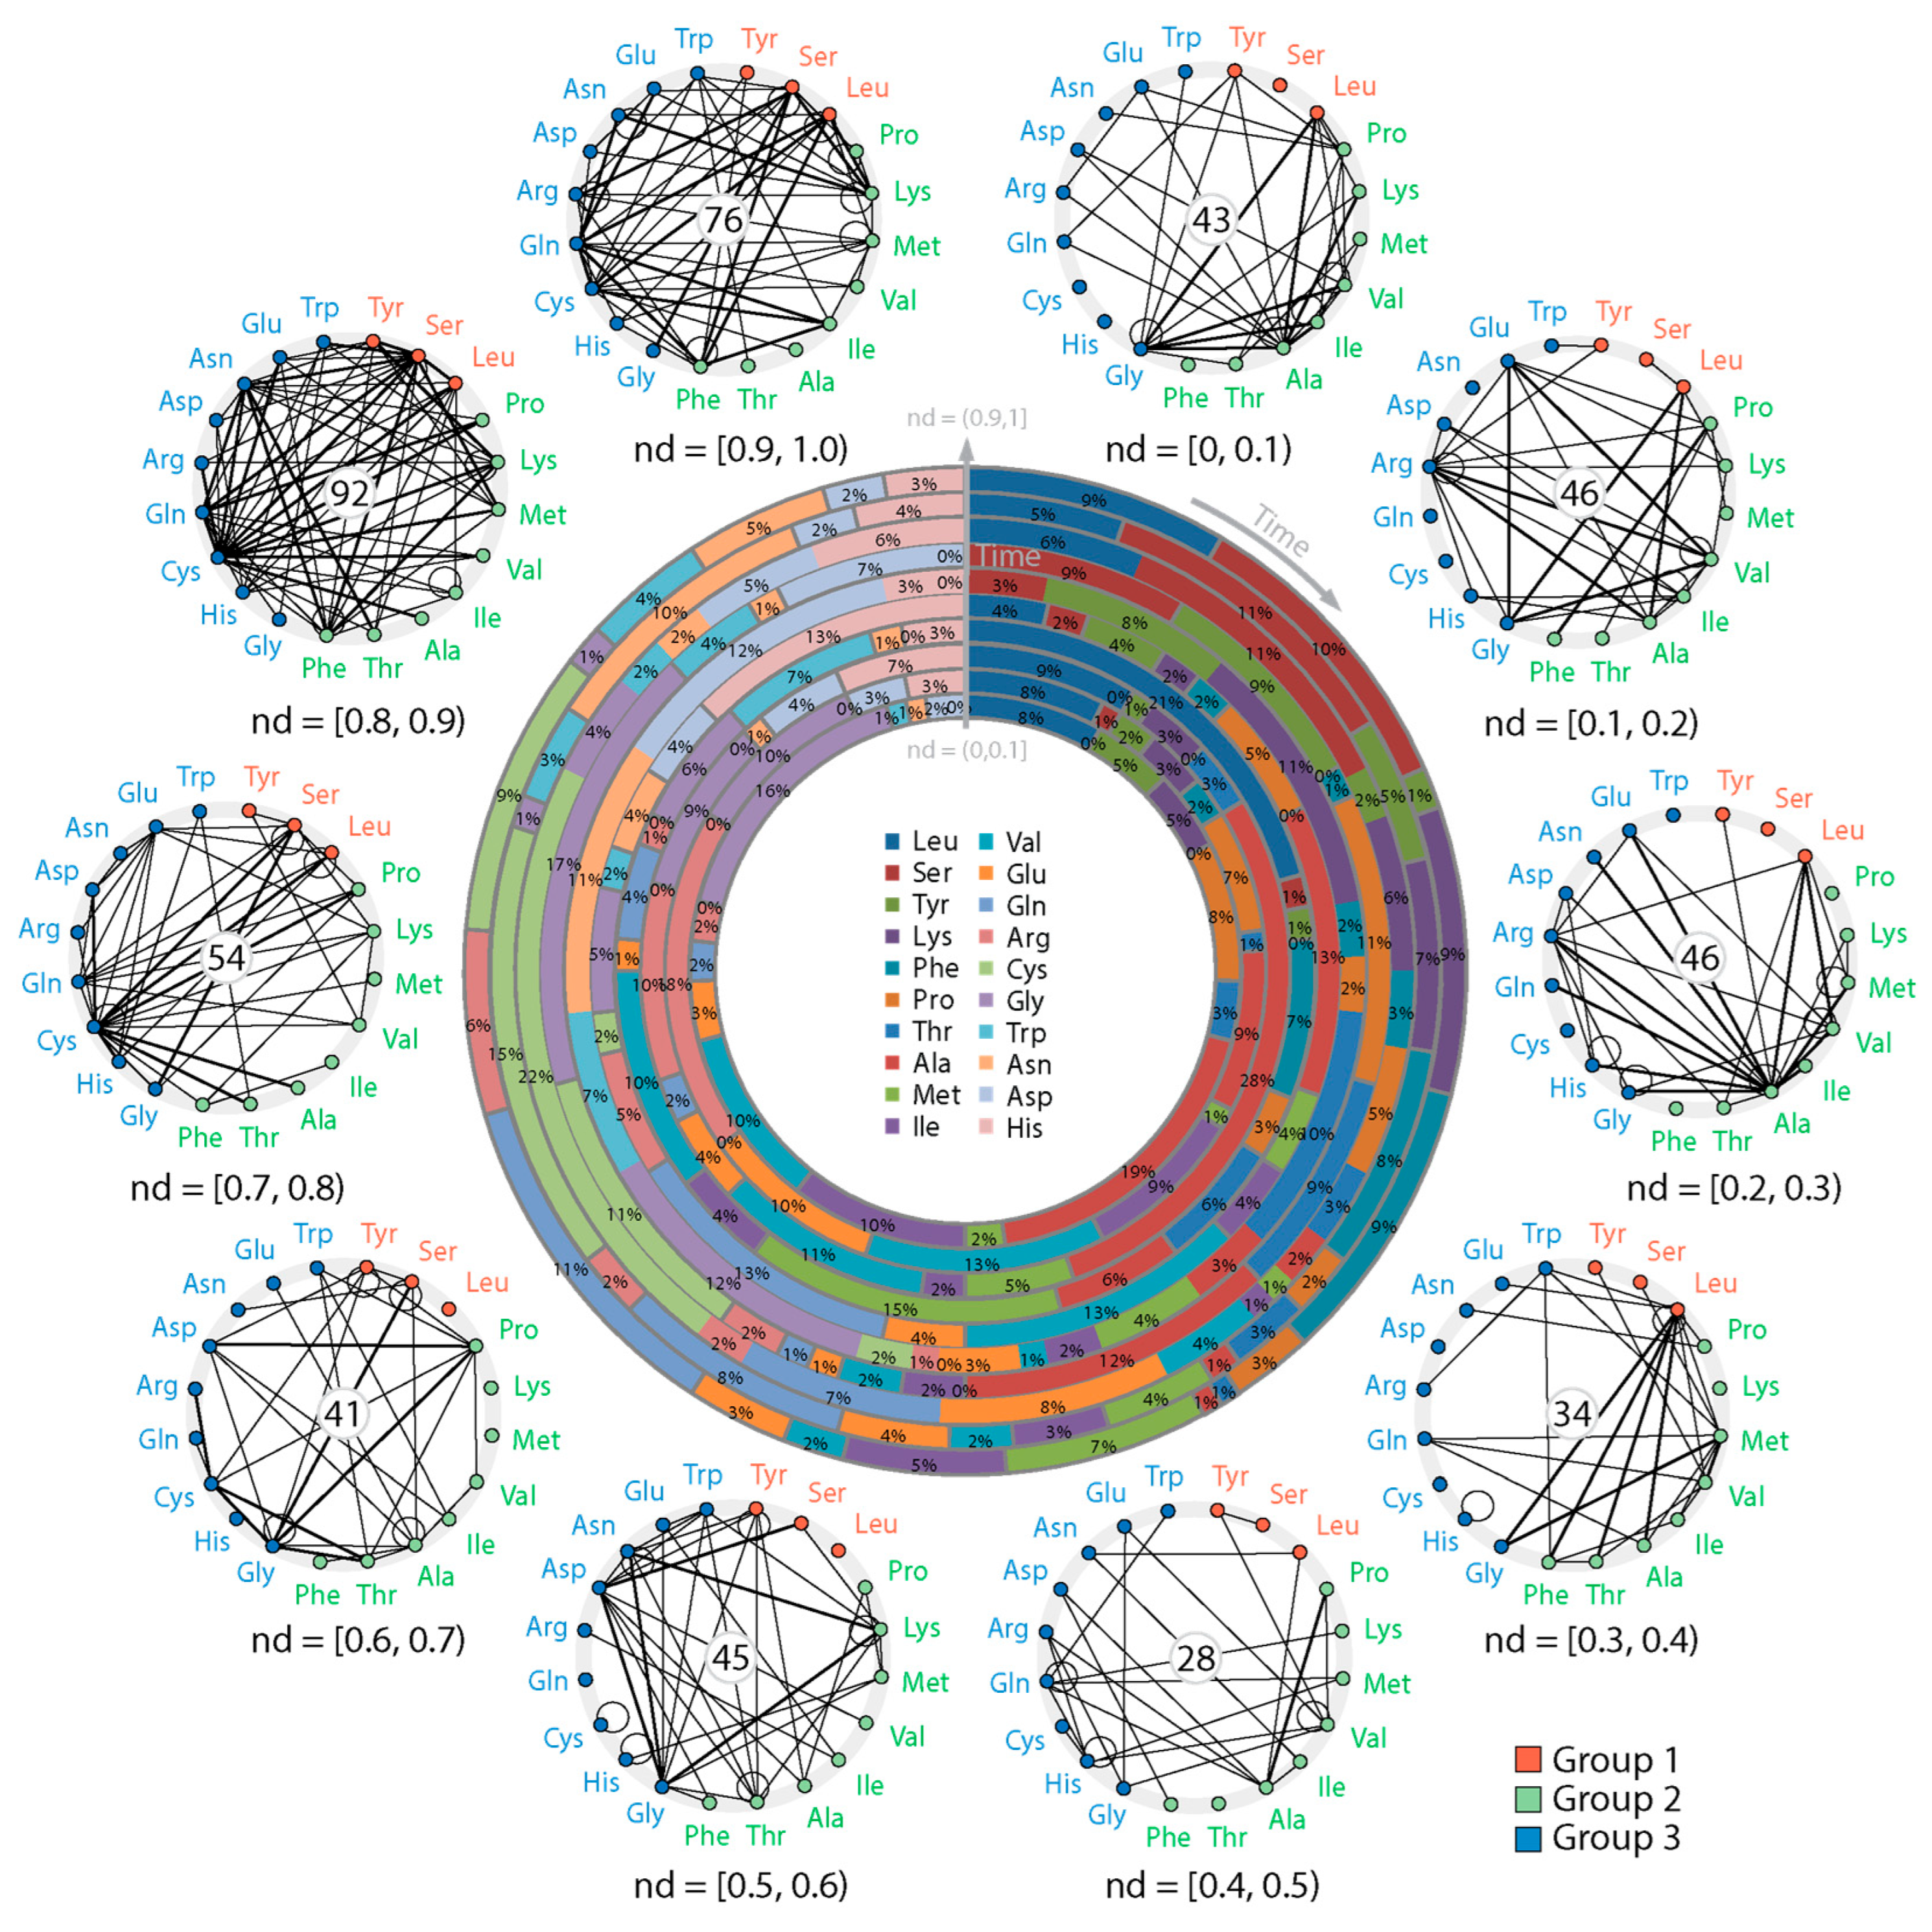
Figure 8.
Enriched dipeptide composition along the chronology of structural domains. Stacked column charts describe dipeptides corresponding to the 9 categories specified by Groups 1, 2 and 3 of amino acids. Stacked columns on the right display the general distribution pattern observed in the total structural dataset (Total) and the expectation of dipeptide set distributions calculated by free permutations (Exp.).
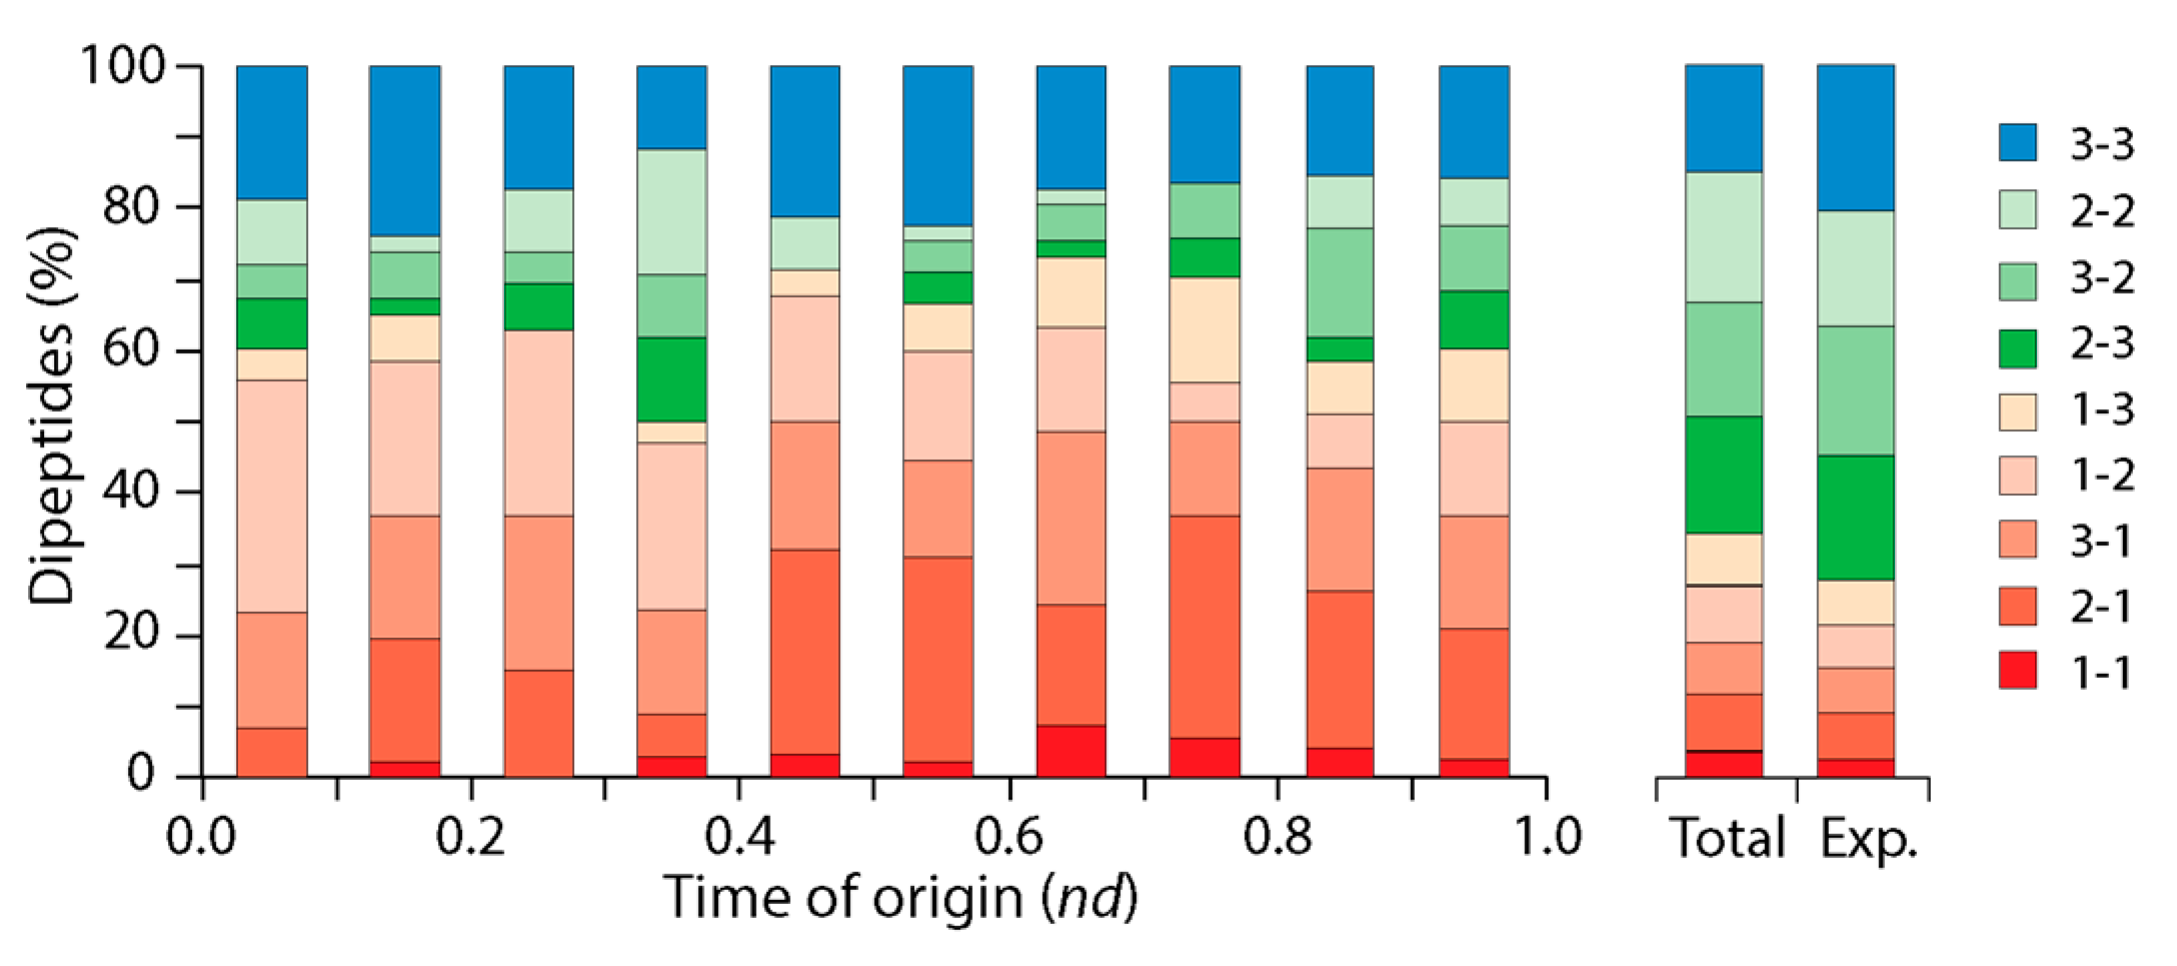
Figure 9.
Origin and evolution of the genetic code inferred from a phylogenomic study of the co-evolution of aaRS domains and their cognate tRNA molecules [15]. (a) Linking chronologies describing the evolution of tRNA, aaRS and the ribosome anchors crucial innovations and interactions to a common timeline. The atomic structures of evolving tRNA structures were modeled using deep learning trRosettaRNA [62] from an ancestor sequence reconstructed from a tRNA dataset of 571 molecules [55] using maximum likelihood methods in PAUP* [63]. Ribosomal models with rRNA substructures and r-protein domains colored according to their time of origins are from Harish and Caetano-Anollés [63]. (b) Inception of the operational code followed by the standard genetic code inferred by mapping a chronology of amino acid charging functions involving primordial aaRSs and tRNA molecules onto a binary decision-tree (modified from [66]) and a condensed vis-á-vis complementarity representation of the genetic code with major and minor groove modes of tRNA recognition [67,68]. Identity elements of the growing tRNA molecules responsible for main steps of the decision tree are indicated, with R72 discriminator identities provided in open squares and B2 base of the acceptor stem above each cell of the tree. Main tRNA identity elements responsible for crucial interactions of recognition are highlighted in side diagrams of the tRNA reconstructed structure.
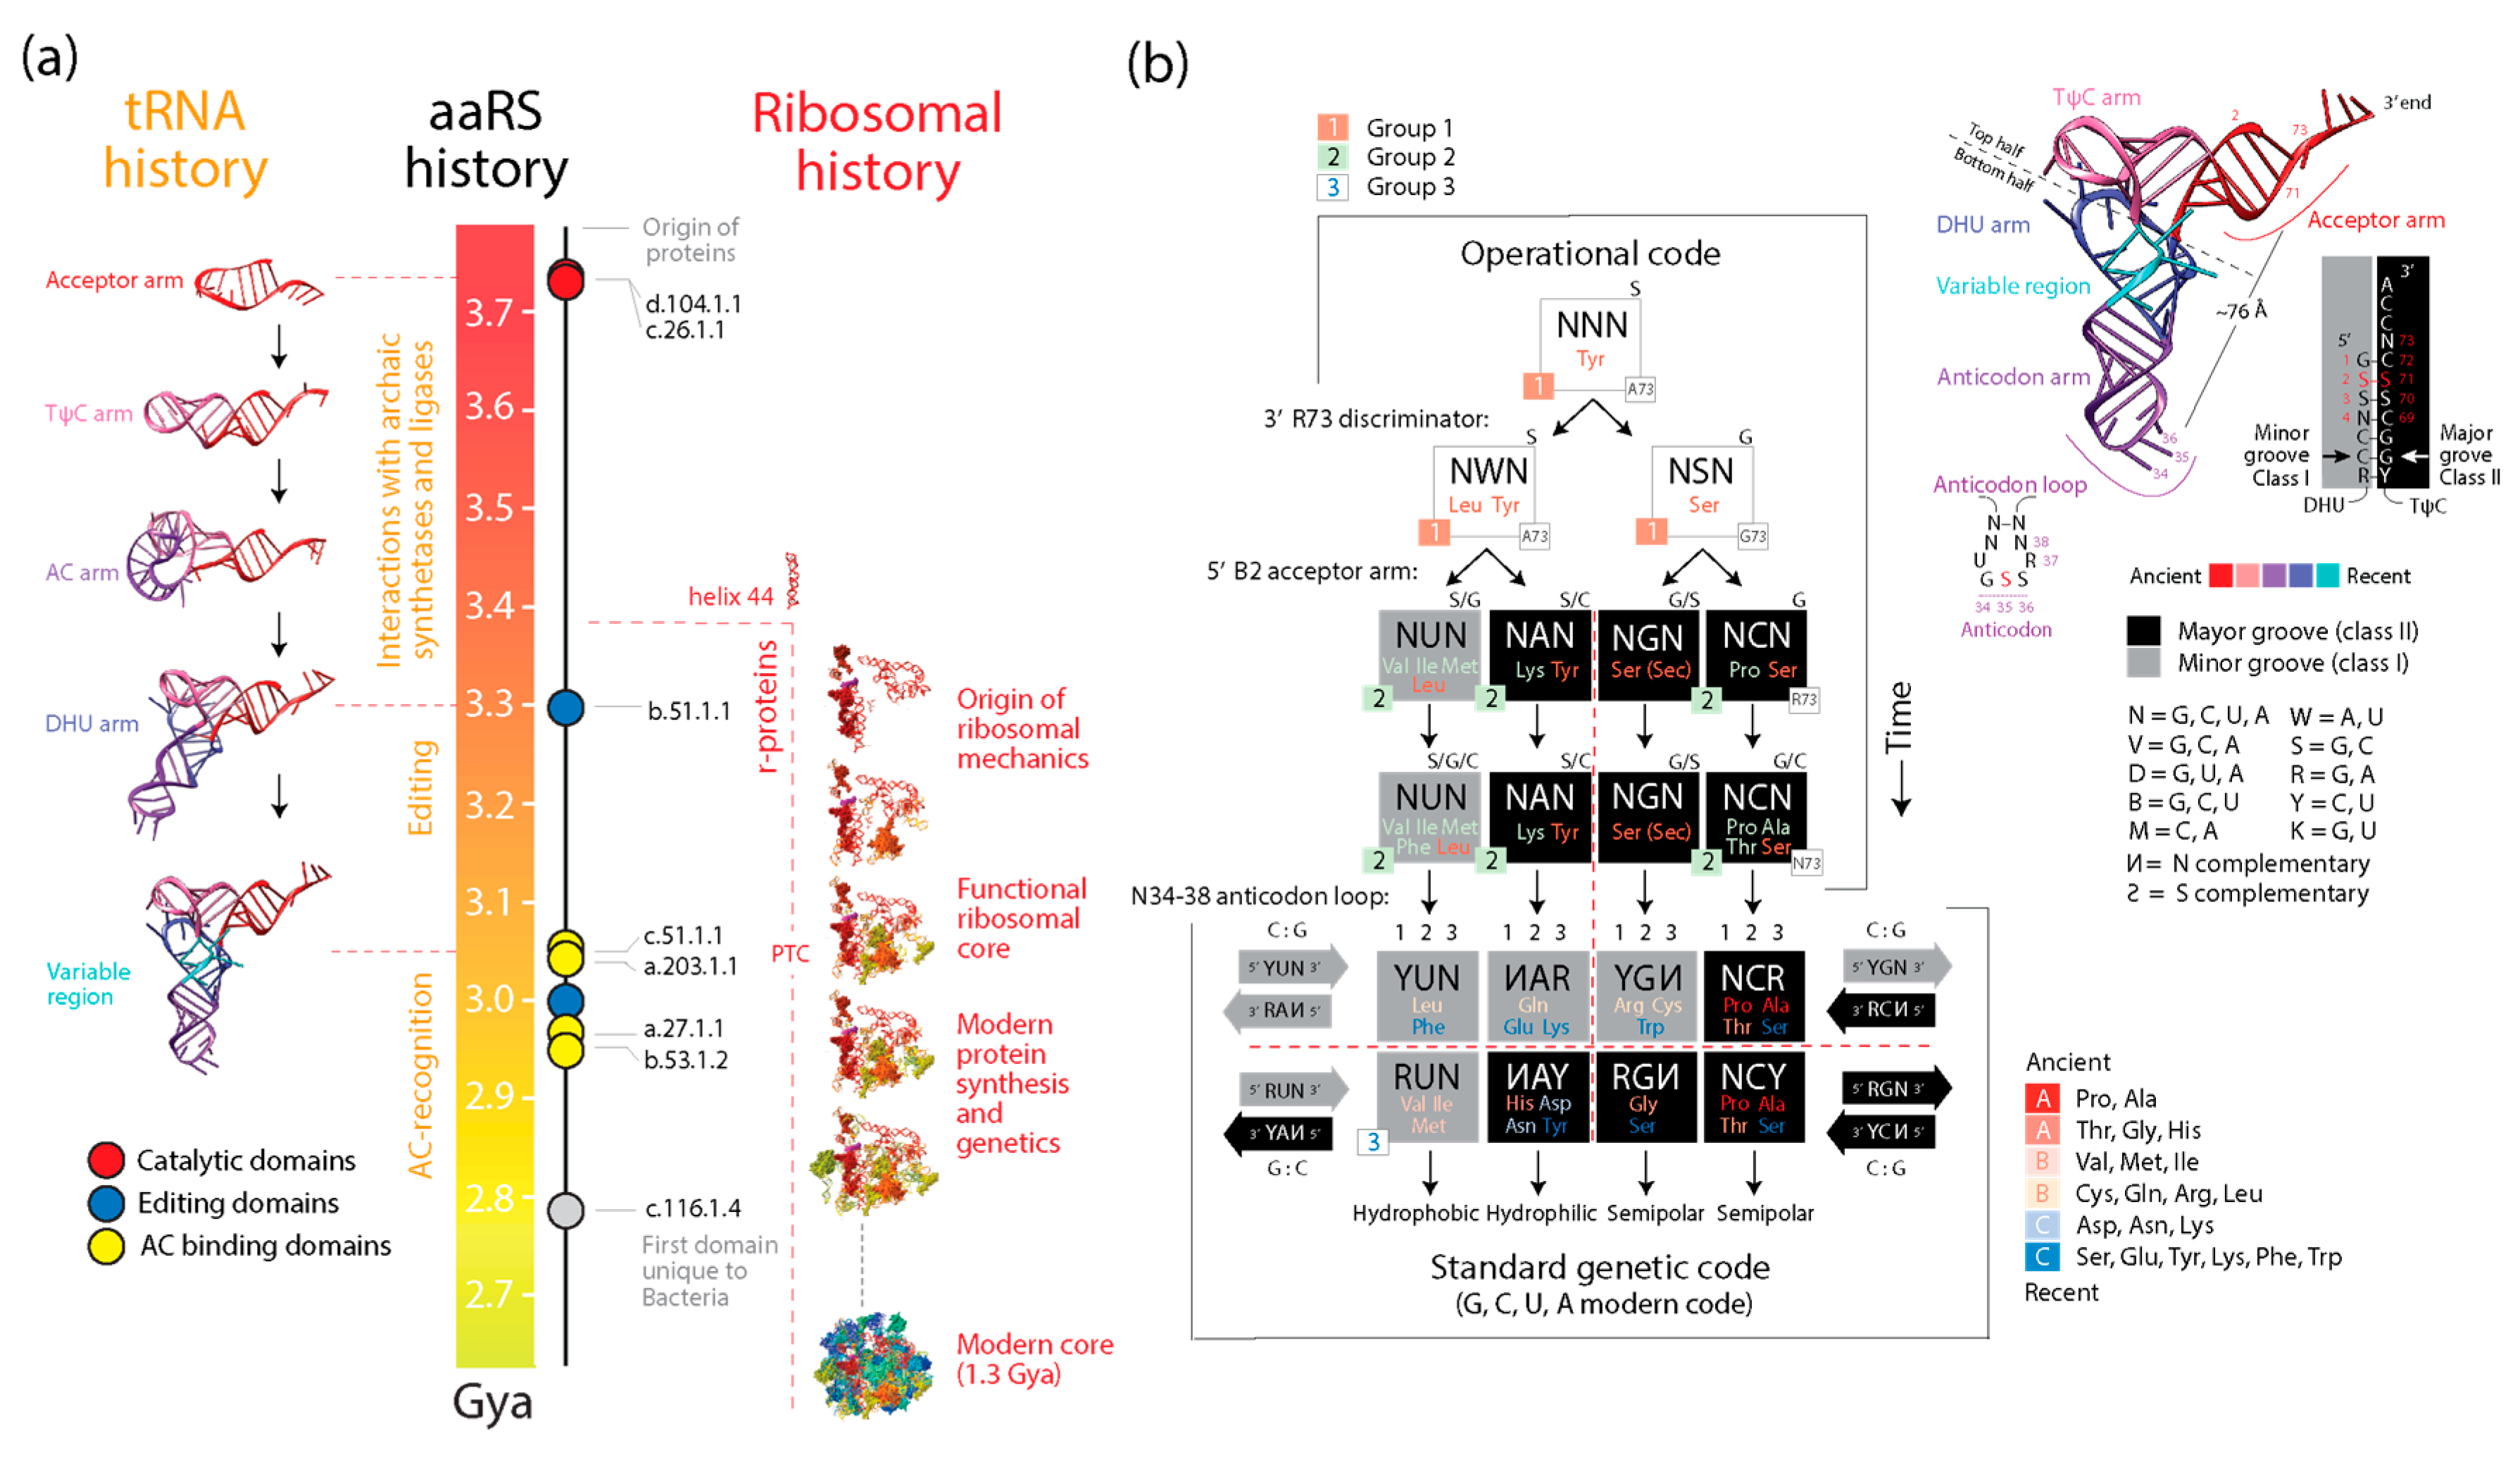

Table 1.
Proteome statistics.
| Superkingdom | Proteomes | Proteins | Dipeptide sequences |
|---|---|---|---|
| Archaea | 114 | 264,171 | 75,577,182 |
| Bacteria | 1,060 | 3,564,350 | 1,145,336,027 |
| Eukarya | 387 | 7,028,620 | 3,069,559,079 |
| Total | 1,561 | 10,857,141 | 4,290,472,288 |
Table 2.
MANOVA results summary1.
| Analysis | Factor | df | Pillai | F-value | num df | den df | p-value |
|---|---|---|---|---|---|---|---|
| (i) | prot | 1 | 0.998 | 1722 | 400 | 1158 | 2.2 x 10⁻¹⁶ |
| dp | 1 | 0.993 | 390 | 400 | 1158 | 2.2 x 10⁻¹⁶ | |
| prot x dp | 1 | 0.974 | 109 | 400 | 1158 | 2.2 x 10⁻¹⁶ | |
| residuals | 1561 | ||||||
| (ii) | nd | 1 | 0.357 | 1.490 | 400 | 1074 | 3.56 x 10⁻⁷ |
| residuals | 1473 |
1 Pillai’s trace was used as test statistic because of its robustness, particularly in cases with unequal group sizes. The columns num df and den df refer to the numerator and denominator degrees of freedom, respectively.
Disclaimer/Publisher’s Note: The statements, opinions and data contained in all publications are solely those of the individual author(s) and contributor(s) and not of MDPI and/or the editor(s). MDPI and/or the editor(s) disclaim responsibility for any injury to people or property resulting from any ideas, methods, instructions or products referred to in the content. |
© 2024 by the authors. Licensee MDPI, Basel, Switzerland. This article is an open access article distributed under the terms and conditions of the Creative Commons Attribution (CC BY) license (http://creativecommons.org/licenses/by/4.0/).
Copyright: This open access article is published under a Creative Commons CC BY 4.0 license, which permit the free download, distribution, and reuse, provided that the author and preprint are cited in any reuse.


