Submitted:
26 December 2024
Posted:
27 December 2024
You are already at the latest version
Abstract
The fruits of Phyllanthus acidus, rich in various secondary metabolites and possessing significant antioxidant activity, have been consumed widely by many Southeast Asian people, including the Thai, Vietnamese, Burmese, Laotians, Cambodians. The extensive investigation on the chemical constituents of the fresh fruits led to the isolation and identification of 17 compounds including four new compounds (1-4). Their structures were elucidated on the basis of the extensive spectroscopic analyses. The absolute configurations of 1, 3, 4 were determined by comparison of their experimental electric circular dichroism (ECD) curves with references and calculated ECD spectra. Notably, the known lignan 13 and phenylpropanoid 15 showed obvious ABTS+ radical scavenging activities with IC50 values of 203.7 and 232.9 uM, respectively, which are comparable to the positive control, Trolox (IC50 = 176.5 ± 2.0 uM). The results indicated that P. acidus fruits can be a promising sources of antioxidant food supplement.
Keywords:
Antioxidant food
; Phyllanthus acidus fruits
; Lignans
; Terpenoids
1. Introduction
Phyllanthus acidus (Linn.) Skeel, a tree belonging to the Phyllanthaceae family, is mainly distributed in Thailand, Vietnam, Myanmar, Laos, and Cambodia. In recent few decades, it has been introduced and cultivated in the Xishuangbanna and Yuanjiang areas of Yunnan Province, China. The fruits, featuring greenish-yellow exterior and white to cream-colored fleshy interior that surround a pit of seeds, are sour with tart taste and have been commercially packaged for sale in Thailand, Vietnam, Myanmar, Laos, and Cambodia, consumed usually with salt and eaten freshly as well. It has been also adapted into various cuisines and used to make syrups, pickles, sweetened dried fruit or combined with other fruits to produce jams, across its various geographic locales. Moreover, the fruit juice is utilized to make beverages and vinegar [1]. Due to the potent antioxidant effects, the fruit could be served to protect cardiovascular and liver health when consumed regularly [2,3,4,5]. So far, researches on P. acidus have mainly focused on the chemical constituents in the leaves, roots and stems, which resulted in the identification of a series of sesquiterpenoids, diterpenoids, triterpenoids and flavonoids [6,7,8,9,10,11]. Among them, sesquiterpenoids exhibited possible anti-HBV effects, with IC50 ranges of 0.8 to 36 μM targeting HBV surface antigen (HBsAg) and HBV excreted antigen (HBeAg). Diterpenoids and triterpenoids showed potential for cytotoxic activities. This fruit, widely consumed in Southeast Asia, has rarely been studied for its chemical composition. Clarifying the chemical constituents of the fruit is vital for its further development and utilization. Our previous investigation on the fresh fruits resulted the isolation of 13 flavonoids with potential α-glucosidase inhibitory activities [12,13]. Further chemical investigation on the fruits led to the isolation of four new (1-4) and 13 known compounds (Figure 1). Their structures were elucidated by extensive analysis of the NMR, HRESIMS, and ECD data. Phenolic compounds 3-4, 10-17 were evaluated for their antioxidant activities, while the terpenoids 1, 5-9 were evaluated for their cytotoxic activity against five human tumor cell lines (HL-60, A549, SMMC-7721, MDA-MB-231, SW480) and two human normal cell lines (BEAS-2B, L02).
2. Materials and Methods
2.1. General Procedure
UV data were obtained on a Shimadzu UV-2401A spectrophotometer (Shimadzu, Kyoto, Japan). 1D and 2D NMR spectra were recorded on Bruker DRX-600 and -800 spectrometers (Bruker, Karlsruhe, Germany) in CD3OD operating at 600 and 800 MHz for 1H, and 150 and 200 MHz for 13C, respectively, with TMS (tetramethylsilane) as internal standard, and chemical shifts (δ) are expressed in ppm with reference to the TMS signal. ESI-MS and HR-ESI-MS analyses were measured on Agilent 1290 UPLC/6540 Q-TOF mass spectrometer. Column chromatography (CC) was performed using silica gel (200-300 mesh, Qingdao Marine Chemical, Inc., Qingdao, China), RP-18 (40-60 μm, Merck, Darmstadt, Germany), Diaion HP20 (Mitsubishi Chemical Corporation, Tokyo, Japan). Semi-preparative HPLC was performed on Waters 600-2487 HPLC with Agilent-C18 column (9.4 mm × 25 cm). CC fractions were monitored by TLC visualized by spraying with 10% H2SO4 in ethanol and heating.
2.2. Plant Material
The fruits of P. acidus were collected from Yuanjiang country (geographical coordinates: 102°E, 23.6°N, altitude: 327 m) in Yunnan Province, People’s Republic of China, in June 2019. The plant material was identified by Dr. En-De Liu, from the Herbarium, Kunming Institute of Botany, Chinese Academy of Sciences. It is mainly determined through careful observation of the overall morphology of plants and their individual parts (root, stem, leaf and flower), along with comparisons to other plants within the same family and genus. A voucher specimen (Kib-18-05-22) has been deposited in the Key Laboratory of Phytochemistry and Natural Medicines, KIB, CAS.
2.3. Extraction and Isolation
The entire extraction, separation, and identification experiment was carried out twice. The first round focused mainly on the higher polar part; however, due to the limited amount of sample available, the research on the less polar part was insufficient. Consequently, additional samples were collected for a second round of study, which focused specifically on the less polar part.
In the first round, the fresh fruits (26 kg) of P. acidus were extracted with 80% aqueous acetone (50 L) at room temperature after removal of kernel. The resulting crude extract (1.6 kg) was then partitioned between H2O and EtOAc, yielding the aqueous (1.2 kg) and EtOAc (50 g) phases. The former was applied to a Diaion HP-20 column chromatography (CC) (18 × 80 cm, MeOH/H2O 0:10, 3:7, 6:4, 8:2, 10:0, v/v, 10 L per concentration) to obtain five fractions, Fr. I-V.
Fr. III (10.0 g) was separated by CC over RP-18 column (MeOH/H2O 1:0-0:1) and silica gel column (chloroform/methanol 100:1-1:1), to yield nine subfractions Fr. III-1- III-9. Fr. III-6 (20 mg) was purified by semi-preparative HPLC to obtain compounds 15 (15% MeCN/H2O, flow rate 3 mL/min, Rt = 15.0 min, 3.0 mg), and 16 (15% MeCN/H2O, flow rate 3 mL/min, Rt = 24.0 min, 3.0 mg). Semi-preparative HPLC purification yielded compounds 17 (12% MeCN/H2O, flow rate 3 mL/min, Rt = 11.4 min, 20.0 mg) from Fr. III-7 (30 mg), and 14 (15% MeCN/H2O, flow rate 3 mL/min, Rt = 18.0 min, 6.0 mg) from Fr. III-8 (15 mg), respectively. Fr. IV (5.0 g) was applied successively over RP-18 and silica gel CC to get the crystalline, compound 11 (22 mg), and compound 1 was purified by further semi-preparative HPLC (13% MeCN/H2O, flow rate 3 mL/min, Rt = 9.5 min, 5.0 mg).
The EtOAc fraction was applied to RP-18 CC (MeOH/H2O 1:9-10:0), yielding six fractions Fr. VI-XI. Fr. IX (2.0 g) was applied to silica gel CC, followed with semi-preparative HPLC (15% MeCN/H2O, flow rate 3 mL/min) to get compound 13 (Rt = 15.0 min, 3.0 mg). Fr. X (2.0 g) was subjected to a silica gel CC to acquire seven sub-fractions, Fr. X-1- X-7. Fr. X-2 was purified by semi-preparative HPLC to yield compounds 2 (60% MeCN/H2O, flow rate 3 mL/min, Rt = 14.4 min, 3 mg), 5 (55% MeCN/H2O, flow rate 3 mL/min, Rt = 22.0 min, 1.5 mg), 7 (55% MeCN/H2O, flow rate 3 mL/min, Rt = 23.2 min, 1.0 mg), and 8 (42% MeCN/H2O, flow rate 3 mL/min, Rt = 14.0 min, 2.0 mg). Fr. X-3 was purified by semi-preparative HPLC to yield compounds 6 (55% MeCN/H2O, flow rate 3 mL/min, Rt = 15.4 min, 5.0 mg), and 9 (48% MeCN/H2O, flow rate 3 mL/min, Rt = 18.5 min, 2.0 mg).
In the second round, the fresh fruits with kernel of P. acidus (100 kg) were crushed and extracted with 80% aqueous acetone (200 L) at room temperature. After removal of the solvent under reduced pressure, the yielded extract (7.0 kg) was partitioned between H2O and EtOAc to get the aqueous (6.1 kg) and EtOAc (630 g) extracts. The later was applied to a silica gel CC (chloroform/methanol 100:1, 50:1, 20:1, 10:1) to obtain four fractions, Fr. I-IV. Fr. II (20 g) was separated by CC over RP-18 (MeOH/H2O 1:0-0:1) and silica gel (petroleum ether/ethyl acetate 100:1-10:1), followed with semi-preparative HPLC to furnish compounds 3 (38% MeCN/H2O, flow rate 3 mL/min, Rt = 15.2 min, 1.7 mg), 4 (38% MeCN/H2O, flow rate 3 mL/min, Rt = 18.0 min, 1.3 mg), and 10 (38% MeCN/H2O, flow rate 3 mL/min, Rt = 16.0 min, 3.5 mg). Fr. III (20 g) was purified using silica gel (petroleum ether/ethyl acetate 100:1-10:1), and preparative HPLC to obtain compounds 12 (35% MeCN/H2O, flow rate 3 mL/min, Rt = 9.6 min, 1.2 mg) and 13 (35% MeCN/H2O, flow rate 3 mL/min, Rt = 11.1 min, 1.3 mg).
2.4.1. Phylanthacidoid V (1)
Light-yellow amorphous powder; -14.63 (c 0.19, MeOH). UV (MeOH) λmax (log ε) 227.0 (0.17) nm, 260.0 (0.52) nm; 1H and 13C NMR data see Table 1; HRESIMS (negative ion mode) m/z 905.2932 [M-H]- (calcd for C39H53O24, 905.2933).
2.4.2. Phyllaciduloid H (2)
Light-yellow amorphous powder; 1H and 13C NMR data see Table 1; HRESIMS (negative ion mode) m/z 311.1660 [M-H]- (calcd for C20H23O3, 311.1653).
2.4.3. 3-[(2R,3S)-2-(4-hydroxyphenyl)-3-(hydroxymethyl)-7-methoxy-2,3-dihydro-1-benzofuran- 5-yl]propyl acetate (3)
Yellowish oil; +15.58 (c 0.05, MeOH). UV (MeOH) λmax (log ε) 196 (0.66) nm, 229 (0.29) nm; 281.5 (0.05) nm; 1H and 13C NMR data see Table 2; HRESIMS (negative ion mode) m/z 371.1495 [M-H]-, (calcd for C21H23O6, 371.1500).
2.4.4. 3-[(2S,3R)-2-(4-hydroxyphenyl)-3-(hydroxymethyl)-2,3-dihydro-1-benzo-furan-5-yl]pro-pyl acetate (4)
Yellowish oil; +4.00 (c 0.12, MeOH). UV (MeOH) λmax (log ε) 196.5 (0.70) nm, 226.5 (0.17) nm, 283.5 (0.05) nm; 1H and 13C NMR data see Table 2; HRESIMS (negative ion mode) m/z 341.1388 [M-H]- (calcd for C20H21O5, 341.1394).
2.5. ECD Computational Details
In general, conformational analyses were carried out via random searching in the Sybyl-X 2.0 using the MMFF94S force field with an energy cutoff of 5 kcal/mol. The results showed four lowest energy conformers for compound 3 and two lowest energy conformers for compound 4. Subsequently, geometry optimizations and frequency analyses were implemented at the B3LYP-D3(BJ)/6-31G* level in PCM methanol using ORCA5.0.1. All conformers used for property calculations in this work were characterized to be stable point on potential energy surface (PES) with no imaginary frequencies. The excitation energies, oscillator strengths, and rotational strengths (velocity) of the first 60 excited states were calculated using the TD-DFT methodology at the PBE0/def2-TZVP level in PCM methanol using ORCA5.0.1 [14]. The ECD spectra were simulated by the overlapping Gaussian function (half the bandwidth at 1/e peak height, sigma = 0.30 for all) [15]. Gibbs free energies for conformers were determined by using thermal correction at B3LYP-D3(BJ)/6-31G* level and electronic energies evaluated at the wB97M-V/def2-TZVP level in PCM methanol using ORCA5.0 [14]. To get the final spectra, the simulated spectra of the conformers were averaged according to the Boltzmann distribution theory and their relative Gibbs free energy (∆G). By comparing the experiment spectra with the calculated model molecules, the absolute configuration of the only chiral center was determined.
2.6. Antioxidant Assay
The ABTS+ radical scavenging test was conducted as reported previously and slightly modified [16]. Specifically, the solvent was replaced with DMSO due to the high volatility of 80% methanol. Trolox was used as positive control. The scavenging activities of Phenolic compounds 3, 4, 10-17 were calculated based on the percentage of ABTS+ radical scavenged using the equation:
Inhibition rate (%) = (A blank – A sample)/ A blank
IC50 values were calculated according to the Reed and Muench method [17].
2.7. Cytotoxicity Assay
Terpenoid (1, 5-9) were evaluated for their cytotoxic activity. Five human tumor cell lines (HL-60, A549, SMCC-7721, MDA-MB-231, SW480) and two human normal cell lines (BEAS-2B, L02) were used in cytotoxic assay, which were obtained from ATCC (Manassas, VA, USA). Cells were cultured in RMPI-1640 or DMEM medium (Biological Industries, Kibbutz Beit-Haemek, Israel) supplemented with 10% fetal bovine serum. Briefly, cells were seeded into each well of a 96-well cell culture plate. After 12-24 h of incubation, the test compounds (40 μM) were added, using DDP and taxol as the positive control. After 48 h of incubation at 37 ℃, cells were subjected to the MTS assay.
3. Results and Discussion
3.1. Identification of Compounds 1-17
The 80% aqueous acetone extract of P. acidus fruits was partitioned between H2O and EtOAc. Further CC over Diaion HP20, RP-18, and silica gel, followed with semi-preparative HPLC, yielded 17 compounds, including four new ones (1-4). The known compounds were determined to be three cleistanthane diterpenes, aspidoptoid D (5) [18], cleistanthol (6) and spruceanol (7) [19], two monoterpenes, 10α-hydroxyamorph-4-en-3-one (8) [20] and hypocreaterpene B (9) [21], one benzofuran lignan, 3-[(2S,3R)-2-(4-hydroxy-3-methoxyphenyl)-3-(hydroxymethyl)-7-methoxy-2,3-dihydro-1-benzofuran-5-yl]propyl acetate (10) [22], three bis-tetrahydrofuran lignans, sesamin (11) [23], (+) epipinoresinol (12) [24] and (-)-pinoresinol (13) [25], one neolignan, 4,7,9-trihydroxy-3,3’-dimethoxy-8-O-4’-neolignan-9’-O-β-D-glucopyranoside (14) [26], and three phenylpro-panoids, trans-caffeic acid (15) [27], methyl-3-(4-O-β-D-glucopyranosylphenyl)propio-nate (16) [28] and syringin (17) [29], respectively, by comparison of their spectroscopic data with those reported in the literature. All of them were isolated from the fruits of P. acidus for the first time.
Phyllanthacidoid V (1) was obtained as a light-yellow amorphous powder. Its molecular formula, C39H54O24, was established by the negative HRESIMS (m/z 905.2932 [M-H]-) and 13C NMR (DEPT) spectroscopic data, corresponding to 13 degrees of unsaturation. The 13C NMR and DEPT spectra revealed the existence of 39 carbon signals, including four quaternary carbons with a ketone (δC 211.8), a carboxyl (δC 175.5), a ketal (δC 109.9) and an oxygen-bearing one (δC 85.5). Moreover, five methine resonances with three oxygen-bearing ones (δC 84.7, 87.5, 71.6), four methylenes with an oxygen-bearing one (δC 65.7), and one methyl (δC 10.8) were observed, in addition to 18 signals arising from a cyclohexan (δC 71.1, 85.4, 75.7, 77.4, 70.0, 35.8) and two hexosyl moieties (δC 104.2, 85.3, 77.6, 70.7, 77.6, 62.4, 106.3, 76.5, 79.0, 71.6, 78.9, 62.8), and seven signals from a p-hydroxybenzoyl unit (δC 132.9×2, 116.4×2, 122.5, 163.8, 167.6) (Table 1). The aforementioned data were quite similar to those of phyllanthacidoid R [10], reported previously from the roots of the titled plant growing in Thailand, suggesting that 1 was a norbisabolane sesquiterpene. The only difference lies in the presence of an additional sugar signal (δC 106.3, 76.5, 79.0, 71.6, 78.9, 62.8) in 1 compared to phyllanthacidoid R. The cyclohexan and two hexosyl moieties were determined to one pentaoxy cyclohexane unit and two glucosyl units, which was consistent with phyllanthanidoid H [10]. An in-depth analysis of the HMBC correlations of H-1’‘‘ (δH 4.76) with C-2’‘ (δC 85.4), H-1’‘‘‘ (δH 4.61) with C-2’‘‘ (δC 85.3), H-3 (δH 3.43) with C-1’‘ (δC 71.1) further revealed that a pentaoxy cyclohexane unit was linked to C-13 through an ester bond (Figure 2). Moreover, the large coupling constants of JH-1’‘‘, H-2’‘‘ (7.8 Hz), JH-1’‘‘‘, H-2’‘‘‘ (7.9 Hz) indicated the configurations of glucose were both β-D. The relative configuration of 1 was further established by the comparison with known compounds, coupling constant analysis and ROESY correlations. The large J value of H-3 (ddd, J = 3.6, 6.6, 11.4 Hz) and small J value of H-5 (t, J = 4.0 Hz) suggested the axial orientation of H-3, and equatorial orientation of H-5. Furthermore, the ROESY correlations of H-3 (δH 3.43) with H-4eq (δH 2.45), and H-5 (δH 4.29) with H-4ax (δH 1.99) suggested that H-3 and H-4eq were on the same side (α- orientation), H-5 and H-4ax were on the opposite side (β-orientation). Ring C possessed the identical relative configuration as phyllanthacidoid R. The ROESY correlation between H-7 and H-9ax permitted H-7 with an α-orientation. In addition, the ROESY cross- peak of H-7 with H-12 confirmed that both H-7 and C-12 were α-oriented. On the basis of the above evidence, the relative configurations of 1 was identical to that of phyllanthacidoid R [10]. Compound 1 generated a strong positive Cotton effect at 300 nm and negative Cotton effect at 250 nm, similar to that of phyllanthacidoid R (Figure 3). Hence, the absolute configuration of compound 1 was determined to 3S,5R,6S,7R,8R,10S, 11R. Thus, compound 1 was named as phylanthacidoid V.
Phyllaciduloid H (2), light-yellow amorphous powder, had a molecular formula of C20H23O3 as deduced from the (-)-HRESIMS ion at m/z 311.1660 [M-H]- (calcd for C20H23O3, 311.1653) with nine degrees of unsaturation. The 13C NMR and DEPT spectra (Table 1) showed a total of 20 carbon signals, including four methyls (δC 29.6, 27.3, 22.0, 13.3), three methylenes (δC 119.8, 29.4, 20.4) with one olefinic, four methines (δC 137.1, 128.5, 110.2, 49.0) with three olefinic, and nine quaternary (δC 201.9, 154.6, 146.6, 144.0, 141.0, 124.6, 121.5, 45.4, 40.0), with one ketone (δC 201.9), six olefinic (δC 154.6, 146.6, 144.0, 141.0, 124.6, 121.5), and two aliphatic carbons (δC 45.4 and 40.0). The above features suggested 2 to be a cleistanthane-type diterpenoid with very similar structure with compound 5. The only difference was that 2 possessed two additional double-bond signals, compared with 5. Moreover, in the HMBC spectrum of 2, correlations of H-1 (δH 6.75) with C-3 (δC 201.9), H-18 (δH 1.22)/H-19 (δH 1.17) with C-3 (δC 201.9), and H-1 with C-2 (δC 146.6) confirmed the connection of C-1/C-2/C-3. The 13C chemical shift of C-2 (δC 146.6) suggested that it was an oxygen-bearing olefinic carbon. This deduction was confirmed by the HMBC correlations of H-1 (δH 6.75) with C-2 (δC 146.6) and C-10 (δC 40.0). Thus, the planar structure of 2 was finally determined. The ROESY correlations (Figure 2) of H-19/H-20 and H-5/H-18 corroborated that H-18 and H-5 were β-orientation, while H-19 and H-20 were α-orientation. On biogenetic grounds, compound 2 was confirmed as an ent-cleistanthane and named as phyllaciduloid H.
Compounds 3 was isolated as a yellowish oil. The molecular formula was determined to be C21H24O6 by the HRESIMS (m/z 371.1495 [M-H]-, calcd for C21H23O6, 371.1500), indicating 10 unsaturation degrees. The 13C NMR and DEPT spectra of 3 revealed the presence/ of 21 carbon signals assignable to a lignan skeleton including two benzene rings (δC 114.2-158.6), one aliphatic (δC 55.5) and one oxygen-bearing (δC 89.0) methine, two aliphatic (δC 33.1, 31.9) and two oxygen-bearing (δC 65.2 × 2) methylenes (Table 2). In addition, the remaining carbons included a methoxy group (δC 56.9) and an acetyl (δC 173.3, 21.0). In the 1H NMR spectrum, the aromatic proton signals at δH 6.72 (H-4, H-6) arising from a benzene system, and at δH 7.20, 6.75 (each 2H, d, J = 8.6 Hz, H-2′/6′, H-3′/5′) corresponding to a 1,4-disubstituted benzene ring, were displayed. A detailed comparison of NMR data between 3 and 10 denoted that their structures were quite similar, with the exception that compound 3 has no methoxy signal at C-5’. The inference was further confirmed by the HMBC and 1H-1H COSY correlations. The cross peaks of H-2’/6’ with H-3’/5’, H-3 with H-2/H-13, H-9 with H-8/H-10 were observed in COSY spectrum. Meanwhile, the HMBC correlations from H-3 (δH 3.45) to C-4 (δC 118.1), H-8 (δH 2.65) to C-5 (δC 136.2)/C-4 (δC 118.1)/C-6 (δC 114.2), H-9 (δH 1.94) to C-5, H-10 (δH 4.07)/H-12 (δH 2.04) to C-11 (δC 173.3), -OCH3 (δH 3.85) to C-7 (δC 145.4) illustrated the planar structure of compound 3. The strong cross peak at H-2/H-13 in the ROESY analysis indicated a trans orientation of H-2 and H-3 (Figure 2). Subsequent ECD calculations were conducted to further identify the absolute configuration of 3, which showed that the calculated ECD spectrum of (2R,3S) was in good agreement with the experimental ECD curve of 3 (Figure 4). Thus, compound 3 was finally named as 3-[(2R,3S)-2-(4-hydroxyphenyl)-3-(hydroxymethyl)-7-methoxy-2,3-dihydro-1-benzofuran-5-yl]propyl acetate.
The molecular formula of 4 was assigned to be C20H22O5 according to its HRESIMS data. The 1D NMR spectra, showing 20 carbon signals, indicated that 4 shares the same structural skeleton as that of 3. The only difference between 3 and 4 is the absence of a methoxy signal in 4. Instead of the 1,3,4,5-tetrasubsituted benzene ring present in 3, 4 features an ABX coupled benzene ring with signals at δH 7.10 (1H, d, J = 1.9 Hz), 7.00 (1H, dd, J = 1.9, 8.1 Hz), and 6.71 (1H, d, J = 8.1 Hz). This was supported by the HMBC correlation from H-7 (δH 6.71) to C-7a (δC 159.7). The relative configurations of 4 were verified as being identical to those of 3 based on the comparable ROESY correlations (Figure 2). The absolute configuration of 4 was verified as shown, by comparing the ECD curve with that of calculation (Figure 4). The structure of 3-[(2S,3R)-2-(4-hydroxyphenyl)-3-(hydroxymethyl)-2,3-dihydro-1-benzofuran-5-yl] propyl acetate (4) was thus assigned as shown.
3.2. Antioxidant Activity
Most of the isolated lignans and phenylpropanoids (3, 4, 10-17) were evaluated for their ABTS+ radical scavenging abilities with Trolox as positive control. Compounds 13 and 15 showed obvious ABTS+ radical scavenging activities with IC50 values ranging from 203.7 to 232.9 μM, which were comparable to the positive control Trolox (IC50 = 176.5 μM) (see Table 3). In addition, 10, 12, 14 showed moderate activities with IC50 values 348.4 to 387.4 μM.
Compounds 10, 12 and 13-15 with more unsubstituted phenolic hydroxyl or carboxyl groups in molecular showed moderate or comparable free radical scavenging activities to the positive control (Trolox). Due to the ability of phenolic hydroxyl and carboxyl groups to terminate radical chain reactions by forming stable resonance structures with free radicals, these compounds exhibit enhanced antioxidant activities.
3.3. Cytotoxic Activity
The terpenoids 1 and 5-9 were evaluated for cytotoxicity against five human tumor (HL-60, A549, SMMC-7721, MDA-MB-231, SW480) and two human normal (BEAS-2B, L02) cell lines. However, all of them showed no significant cytotoxic activities at concentrations up to 40 μM.
4. Conclusions
The fruits of P. acidus are widely consumed in Southeast Asia. However, its chemical composition has rarely been studied. In the present study, four new compounds including one norbisabolane sesquiterpenoid glycoside (1), one cleistanthane diterpenoid (2), and two benzofuran lignans (3, 4), along with 13 known compounds (5-17) were isolated and identified from the fruits of P. acidus for the first time. The isolated phenolic compounds (10, 12 and 13-15) exhibited certain antioxidant activity, while terpenoids (1 and 5-9) showed no cytotoxicity at a concentration of 40 μM, indicating that the fruit can be served as an antioxidant food, safe and non-toxic. Hence, phenylpropanoids and lignans are the chemical basis for the antioxidant properties of the fruits. The result provides a scientific basis for developing P. acidus fruits as an ideal food supplement with antioxidant properties.
Supplementary Materials
The following supporting information can be downloaded at the website of this paper posted on Preprints.org
Author Contributions
Y.X.: Conceptualization, Writing-original draft, Writing-review & editing, Investigation, Funding acquisition. J.X.: Conceptualization, Investigation, Writing-original draft. N.L.: Conceptualization, Investigation, Writing-review & editing. L-Y.Y.: Resources. H-T.Z.: Resources. Y-J.Z.: Supervision, Conceptualization, Formal analysis, Funding acquisition, Writing -review & editing.
Funding
This work is supported by the National Natural Science Foundation of China (32270426, 82074124) and the Science and Technology Research Program of Chongqing Municipal Education Commission of China (Grant No. KJQN202402720).
Data Availability Statement
Data is contained within the article or supplementary material.
Acknowledgments
We are grateful to the staffs of the analytical screening group at the State Key Laboratory of Phytochemistry and Plant Resources in West China, Kunming Institute of Botany, Chinese Academy of Sciences, for measuring the spectroscopic data.
Conflicts of Interest
The authors declare no conflict of interest.
References
- Brooks, R.; Goldson-Barnaby, A.; Bailey, D. Nutritional and medicinal properties of Phyllanthus acidus L. (Jimbilin). Int. J. Fruit Sci. 2020, 20, S1706–S1710. [Google Scholar] [CrossRef]
- Moniruzzaman, M.; Asaduzzaman, M.; Hossain, M. S.; Sarker, J.; Rahman, S. M. A.; Rashid, M.; Rahman, M. M. In vitro antioxidant and cholinesterase inhibitory activities of methanolic fruit extract of Phyllanthus acidus. BMC Complem. Altern. M. 2015, 15, 403. [Google Scholar] [CrossRef] [PubMed]
- Nisar, M. F.; He, J. W.; Ahmed, A.; Yang, Y. X.; Li, M. X.; Wan, C. P. Chemical components and biological activities of the Genus Phyllanthus: A review of the recent literature. Molecules 2018, 23, 2567. [Google Scholar] [CrossRef]
- Pradeep, C. K.; Channarayapatna-Ramesh, S.; Kujur, S.; Basavaraj, G. L.; Madhusudhan, M. C.; Udayashankar, A. C. Evaluation of in vitro antioxidant potential of phyllanthus acidus fruit. RJLBPCS. 2018, 4, 35. [Google Scholar]
- Sulaiman, S. F.; Ooi, K. L. Antioxidant and α-glucosidase Inhibitory activities of 40 tropical juices from malaysia and identification of phenolics from the bioactive fruit juices of barringtonia racemosa and Phyllanthus acidus. J. Agric. Food. Chem. 2014, 62, 9576–9585. [Google Scholar] [CrossRef]
- Duong, T. H.; Beniddir, M. A.; Nguyen, V. K.; Aree, T.; Gallard, J. F.; Mac, D. H.; et al. Sulfonic acid-containing flavonoids from the roots of Phyllanthus acidus. J. Nat. Prod. 2018, 81, 2026–2031. [Google Scholar] [CrossRef] [PubMed]
- Duong, T. H.; Trung, N. T.; Phan, C. T. D.; Nguyen, V.-D.; Nguyen, H.-C.; Dao, T.-B.-N.; et al. A new diterpenoid from the leaves of Phyllanthus acidus. Nat. Prod. Res. 2020, 36, 539–545. [Google Scholar] [CrossRef]
- Geng, H. C.; Zhu, H. T.; Yang, W. N.; Wang, D.; Yang, C. R.; Zhang, Y. J. ; New cytotoxic dichapetalins in the leaves of Phyllanthus acidus: Identification, quantitative analysis, and preliminary toxicity assessment. Bioorg. Chem. 2021, 114, 105125. [Google Scholar] [CrossRef] [PubMed]
- Geng, H. C.; Zhu, H. T.; Yang, W. N.; Wang, D.; Yang, C. R.; Zhang, Y. J. ; Phyllaciduloids E and F, two new cleistanthane diterpenoids from the leaves of Phyllanthus acidus. Nat. Prod. Res. 2021, 2021. 36, 5241–5246. [Google Scholar] [CrossRef]
- Lv, J. J.; Yu, S.; Wang, Y. F.; Wang, D.; Zhu, H. T.; Cheng, R. R.; et al. Anti-Hepatitis B virus norbisabolane sesquiterpenoids from Phyllanthus acidus and the establishment of their absolute configurations using theoretical calculations. J. Org. Chem. 2014, 2014.79, 5432–5447. [Google Scholar] [CrossRef] [PubMed]
- Yuan, Y. R.; Li, Y. W.; Huang, Y. Q.; Liu, Q. F.; Ren, Y. H.; Yue, J. M.; Zhou, B. , Four new diterpenoids from the twigs and leaves of Phyllanthus acidus. Tetrahedron 2021, 91, 132224. [Google Scholar] [CrossRef]
- Xin, Y.; Xu, J. , Li, X. X.; Yang, L. Y.; Zhu, H. T.; Yang, C. R.; Zhang, Y. J., Calcium complexes with sulfonic acid-containing flavonoids from the fruits of Phyllanthus acidus. J. Mol. Struct. 2024, 1310, 138364. [Google Scholar] [CrossRef]
- Xu, J.; Xin, Y.; Zhu, H. T.; Kong, Q. H.; Yang, W. N.; Wang, D.; et al. Flavonoids from the fruits of Phyllanthus acidus (L.) Skeels with anti-α-glucosidase activity. Nat. Prod. Res. 2022, 37, 1986–1992. [Google Scholar] [CrossRef] [PubMed]
- Neese, F. ; The ORCA program system. WIREs. Comput. Mol. Sci. 2011, 2, 73–78. [Google Scholar] [CrossRef]
- Stephens, P. J.; Harada, N. , ECD cotton effect approximated by the Gaussian curve and other methods. Chirality 2009, 22, 229–233. [Google Scholar] [CrossRef]
- Zhu, F.; Cai, Y. Z.; Sun, M.; Ke, J. X.; Lu, D. Y.; Corke, H. ; Comparison of major phenolic constituents and in vitro antioxidant activity of diverse Kudingcha genotypes from Ilex kudingcha, Ilex cornuta, and Ligustrum robustum. J. Agric. Food. Chem. 2009, 57, 6082–6089. [Google Scholar] [CrossRef]
- Reed, L.; J. , Muench, H., A simple method of estimating fifty per cent endpoints. Am. J. Epidemiol. 1938, 27, 493–497. [Google Scholar] [CrossRef]
- Sun, P.; Cao, D.; H. , Xiao, Y. D.; Zhang, Z. Y.; Wang, J. N.; Shi, X. C.; et al. Aspidoptoids A-D: Four new diterpenoids from Aspidopterys obcordata Vine. Molecules 2020, 25, 529. [Google Scholar] [CrossRef] [PubMed]
- Hans, C. K.; Helmut, D.; Shahid, M.; Winfried, B.; Philippe, R.; Mamy, A. chemical composition and antitumor activities from Givotia madagascariensis. Z. Naturforsch. B 2004, 59, 58–62. [Google Scholar]
- Wu, S. J.; Fotso, S.; Li, F.; Qin, S.; Laatsch, H. Amorphane sesquiterpenes from a marine Streptomyces sp. J. Nat. Prod. 2007, 70, 304–306. [Google Scholar] [CrossRef] [PubMed]
- Zhu, H.; Hua, X. X.; Gong, T.; Pang, J.; Hou, Q.; Zhu, P. Hypocreaterpenes A and B, cadinane-type sesquiterpenes from a marine-derived fungus, Hypocreales sp. Phytochem. Lett. 2013, 6, 392–396. [Google Scholar] [CrossRef]
- Chen, J. X.; Huang, S. H.; Wang, L.; Han, W. L.; Wang, Y.; Zhang, D. M.; Ye, W. C. Two pairs of enantiomeric neolignans from Lobelia chinensis. Nat. Prod. Commun. 2010, 5, 1627–1630. [Google Scholar] [CrossRef]
- Jayasinghea, L.; Kumarihamya, B. M. M.; Jayarathnab, K. H. R. N.; Udishanib, N. W. M. G.; Bandarac, B. M. R.; Harad, N.; Fujimotod, Y. Antifungal constituents of the stem bark of Bridelia retusa. Phytochemistry 2003, 62, 637–641. [Google Scholar] [CrossRef] [PubMed]
- Swain, N. A.; Brown, R. C. D.; Bruton, G. A versatile stereoselective synthesis of endo,exo-furofuranones: Application to the enantioselective synthesis of furofuran lignans. J. Org. Chem. 2004, 69, 122–129. [Google Scholar] [CrossRef] [PubMed]
- Hosokawa, A.; Sumino, M.; Nakamura, T.; Yano, S.; Sekine, T.; Ruangrungsi, N.; et al. A new lignan from balanophora abbreviata and inhibition of lipopolysaccharide (LPS)-induced inducible Nitric Oxide synthase (iNOS) expression. Chem. Pharm. Bull. 2004, 52, 1265–1267. [Google Scholar] [CrossRef] [PubMed]
- Matsuda, N.; Kikuchi, M. Studies on the constituents of Lonicera Species. X. neolignan glycosides from the leaves of Lonicera gracilipes var. glandulosa MAXIM. Chem. Pharm. Bull. 1996, 44, 1676–1679. [Google Scholar] [CrossRef]
- Kuhnen, S.; Bernardi, O. J.; Dias, P. F.; Santos, M. D. S.; Ferreira, A. G.; Bonham, C. C.; et al. Metabolic fingerprint of Brazilian maize landraces silk (stigma/styles) using NMR spectroscopy and chemometric methods. J. Agr. Food Chem. 2010, 58, 2194–2200. [Google Scholar] [CrossRef]
- Zhou, Y. Z.; Chen, H.; Qiao, L.; Xu, N.; Cao, J. Q.; Pei, Y. H. Two new compounds from Carthamus tinctorius. J. Asian Nat. Prod. Res. 2008, 10, 429–433. [Google Scholar] [CrossRef]
- Wu, Z. B.; Liu, Y.; Tian, S. S.; Wen, C. Chemical constituents of the stem bark of Fraxinus rhynchophylla. Chem. Nat. Compd. 2013, 49, 1162–1163. [Google Scholar] [CrossRef]
Figure 1.
Compounds 1-17 isolated from the fruits of Phyllanthus acidus.
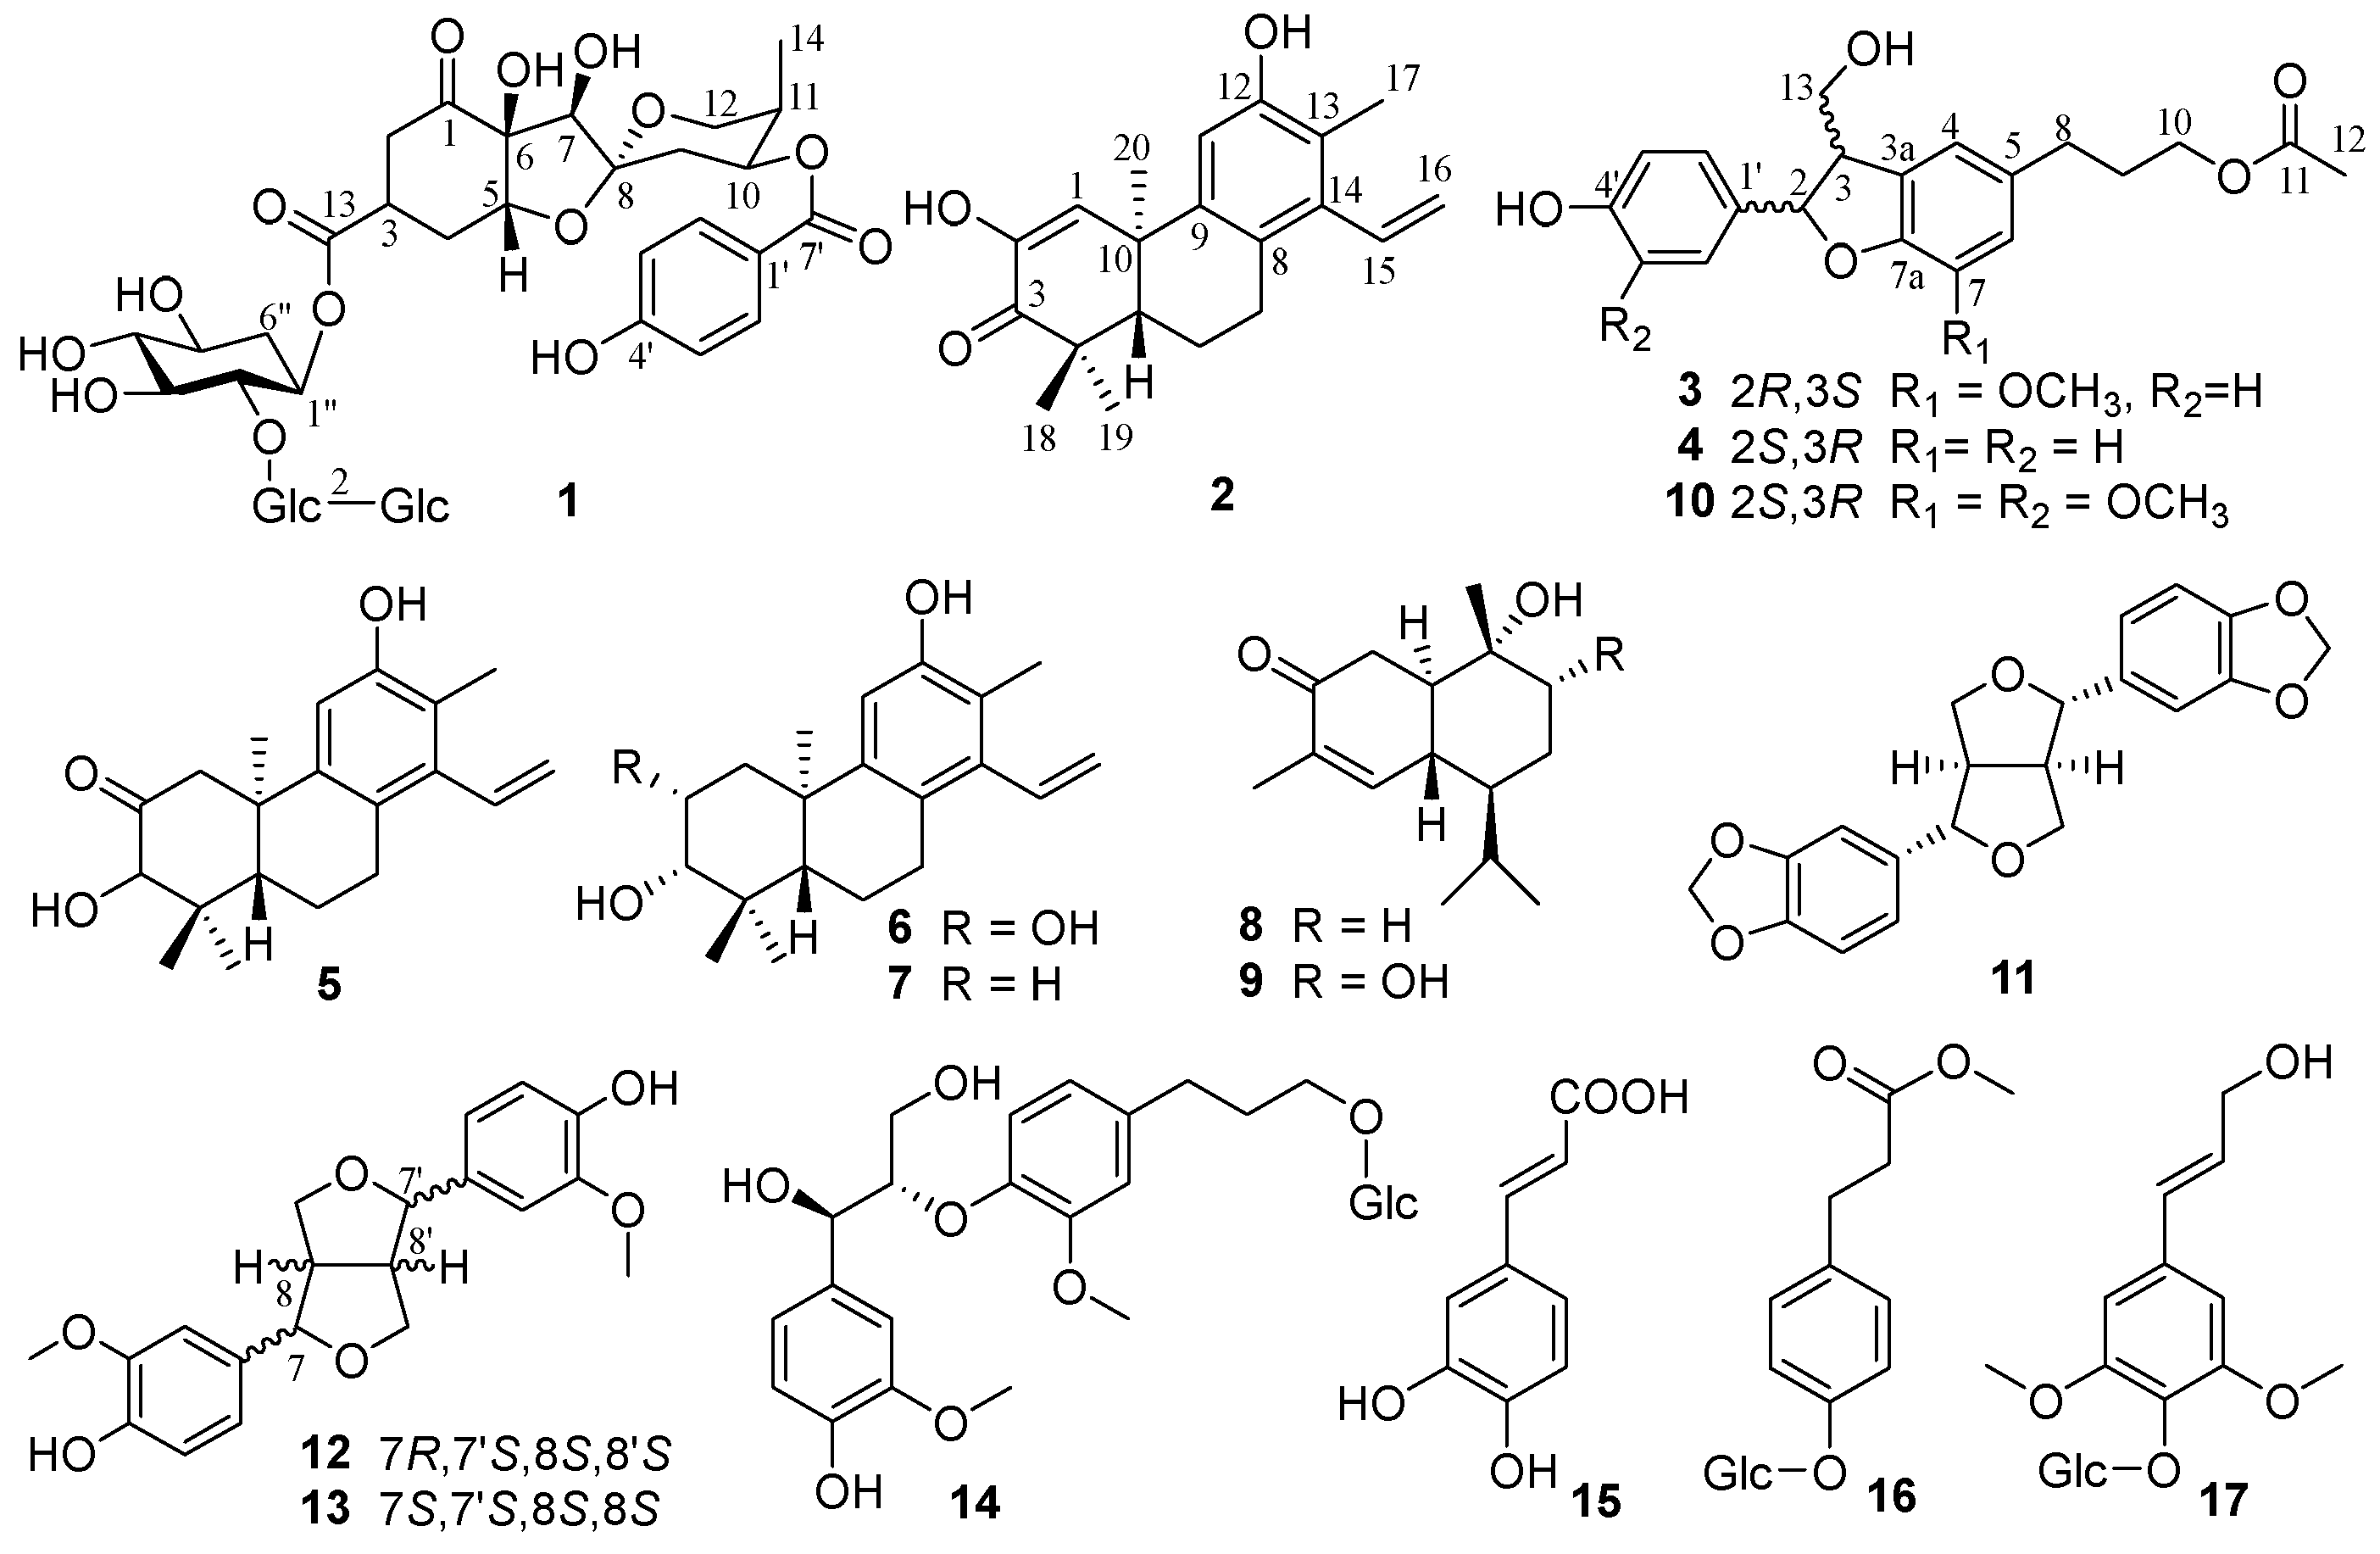
Figure 2.
Key 1H-1H COSY, HMBC and ROESY correlations of compounds 1-4.
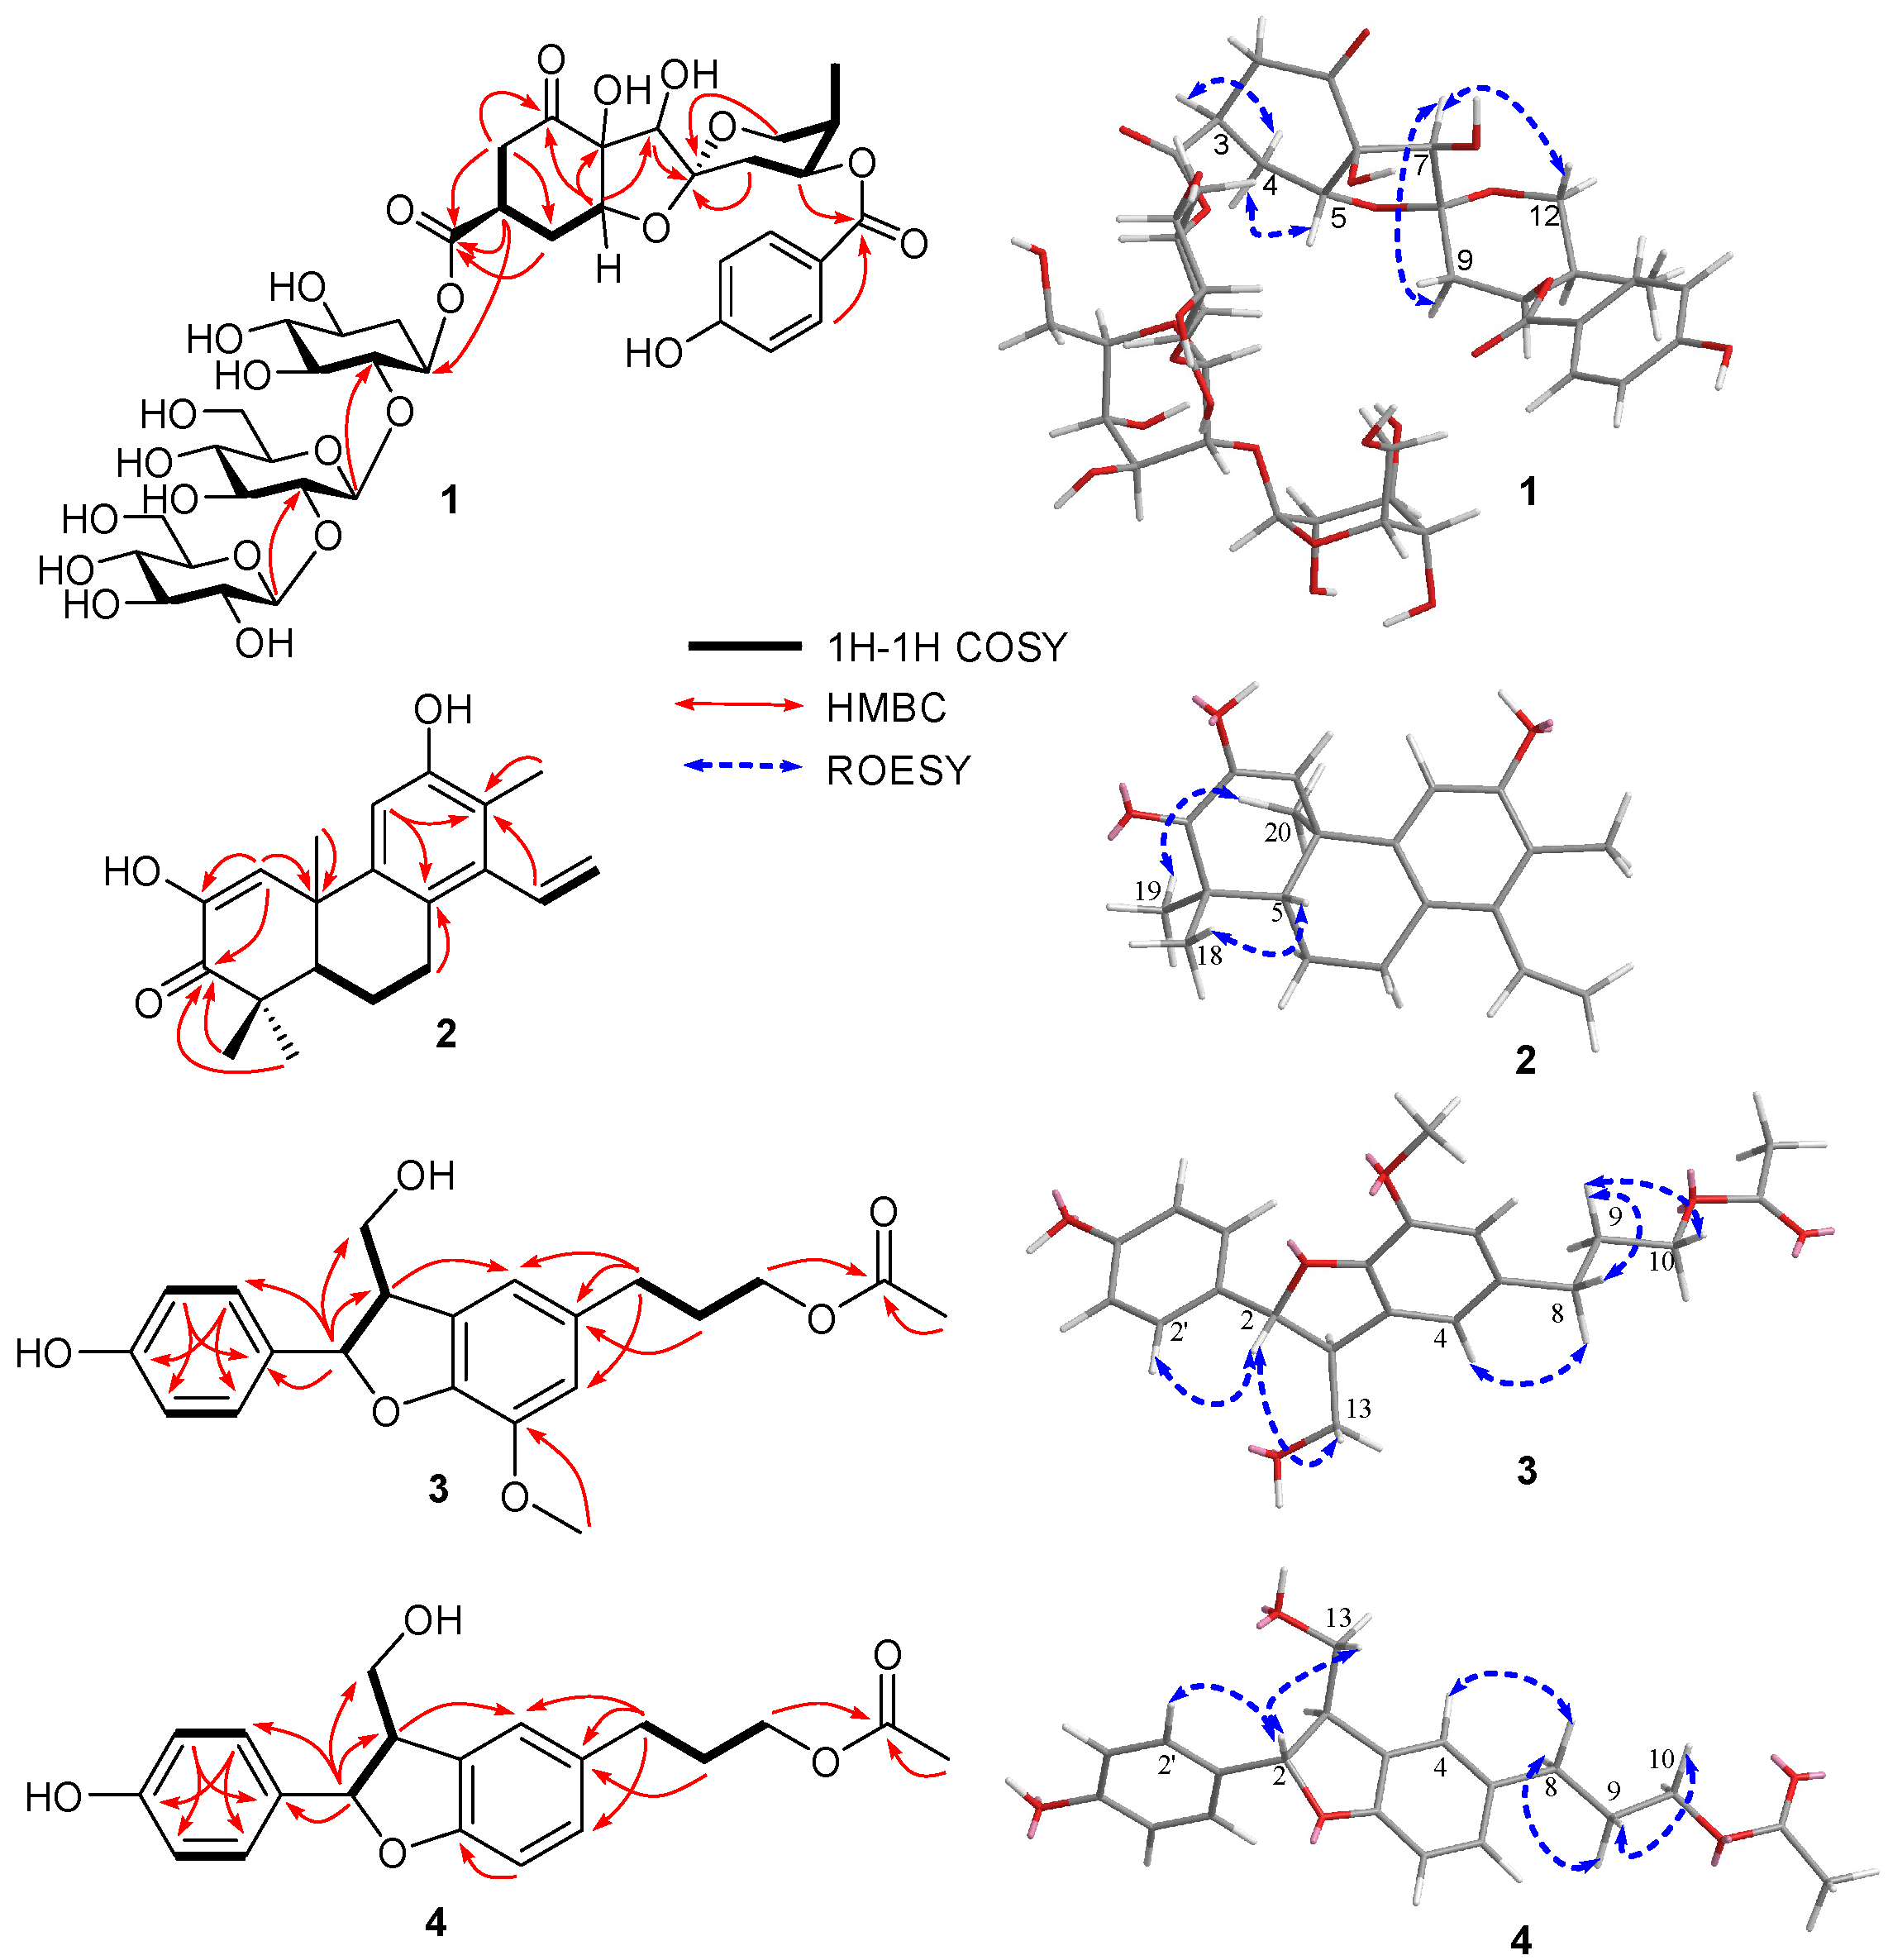
Figure 3.
Experimental ECD curves of 1 and phyllanthacidoid R.
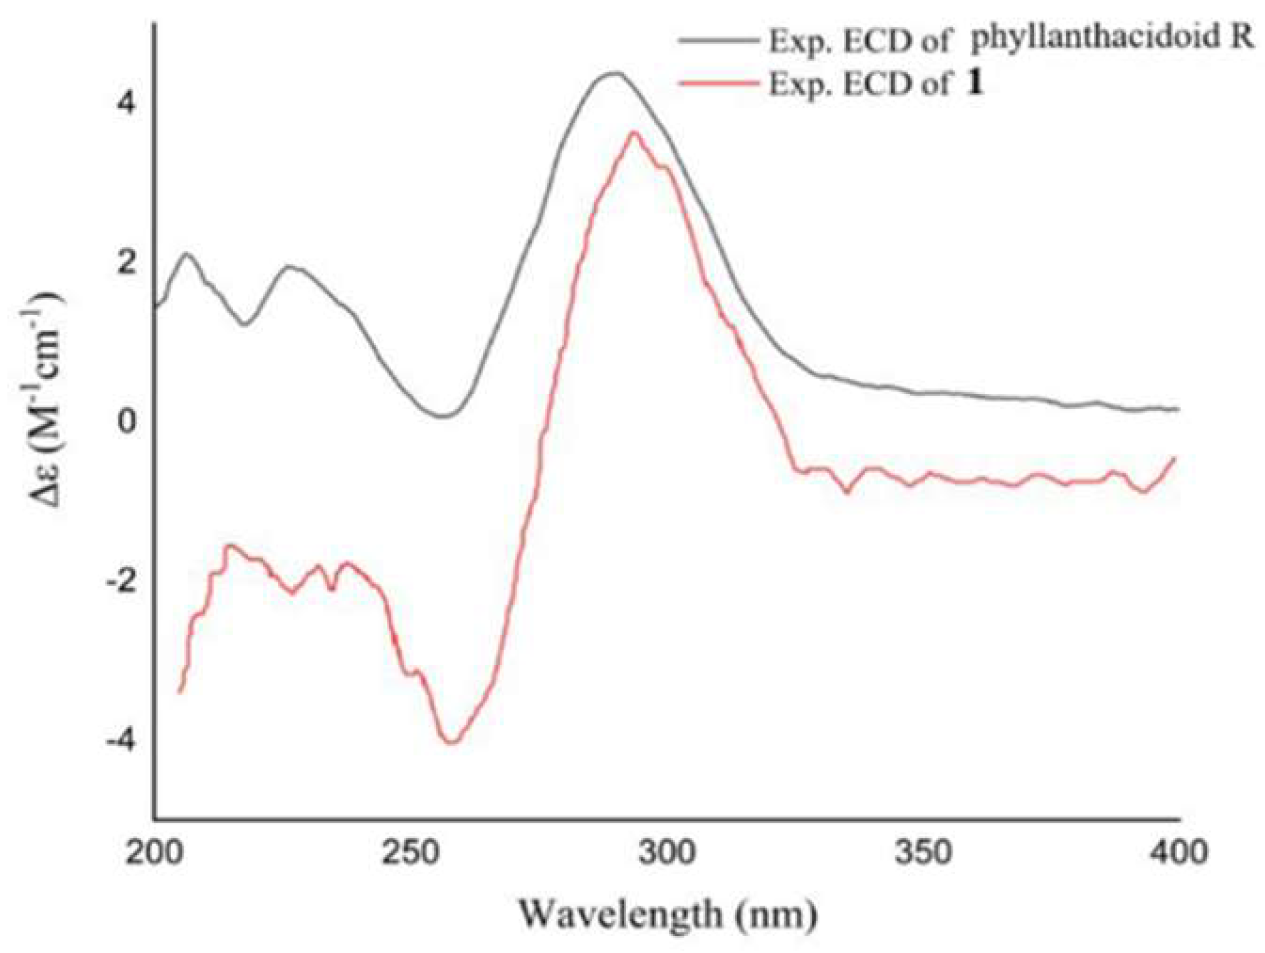
Figure 4.
Experimental and calculated ECD curves of 3 and 4.
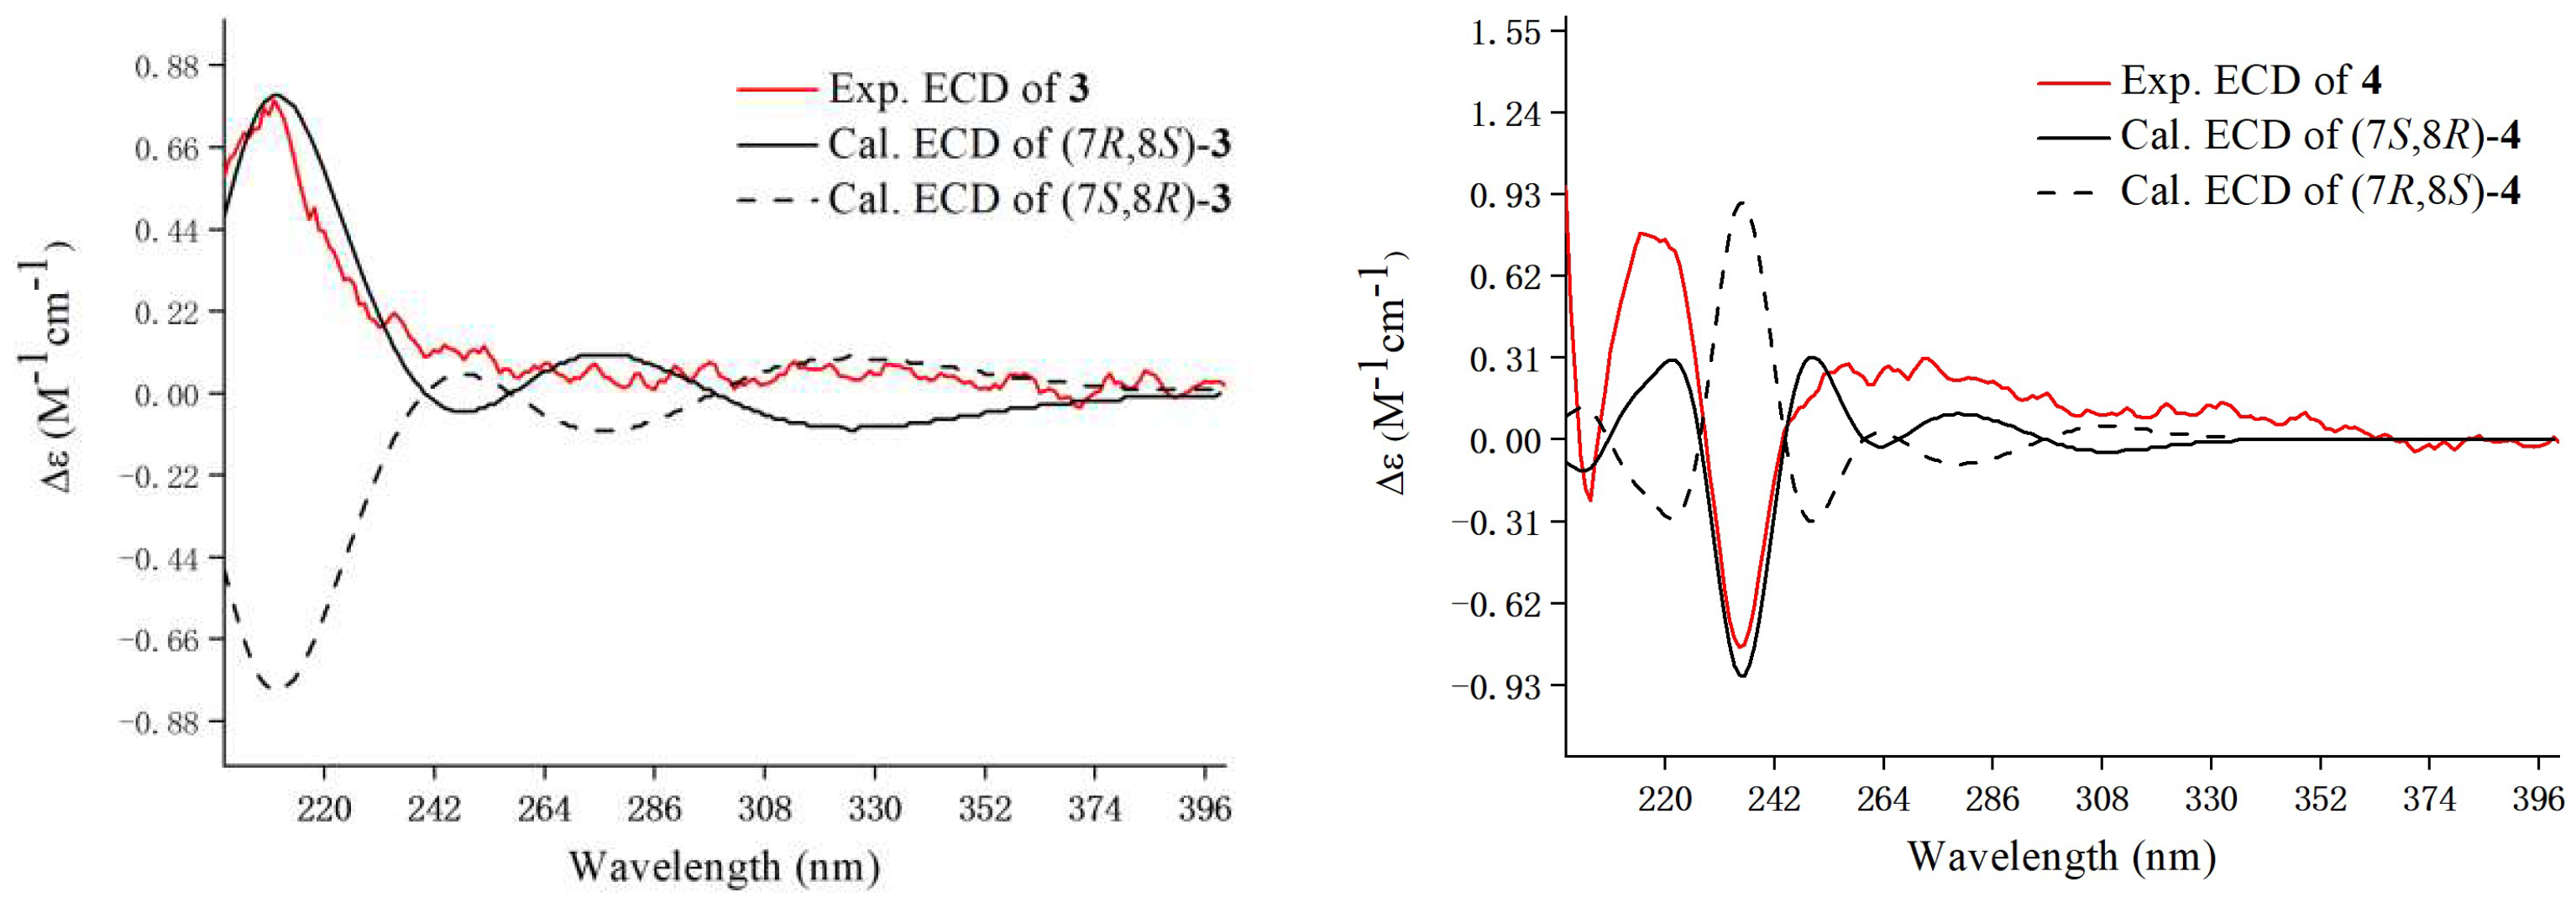

Table 1.
1H (600 MHz) and 13C (150 MHz) data of compounds 1 and 2 in CD3OD (δ in ppm, J in Hz).
| 1 | 2 | |||||||
|---|---|---|---|---|---|---|---|---|
| No. | δC | δH | No. | δC | δH | No. | δC | δH |
| 1 | 211.8 | 7’ | 167.6 | 1 | 128.5 | 6.75 (s) | ||
| 2 | 42.1 | 2.58 (dd, 9.3, 18.4) | 1’‘ | 71.1 | 4.83 d | 2 | 146.6 | |
| 2.73 (dd, 6.8, 18.4) | 2’‘ | 85.4 | 3.26 c | 3 | 201.9 | |||
| 3 | 36.9 | 3.43 (ddd, 3.6, 6.6, 11.4) | 3’‘ | 75.7 | 3.43 c | 4 | 45.4 | |
| 4 | 31.5 | 1.99 a | 4’‘ | 77.4 | 3.34 c | 5 | 49.0 | 1.28 (m) |
| 2.45 (brd, 14.7) | 5’‘ | 70.0 | 3.48 (m) | 6 | 20.4 | 1.87 (m) | ||
| 5 | 84.7 | 4.29 (t, 4.0) | 6’‘ | 35.8 | 1.54 (q, 12.2) | 7 | 29.4 | 2.73 (m) |
| 6 | 85.5 | 2.13 a | 8 | 124.6 | ||||
| 7 | 87.5 | 3.93 b | 1’‘‘ | 104.2 | 4.76 (d, 7.9) | 9 | 144.0 | |
| 8 | 109.9 | 2’‘‘ | 85.3 | 3.28 c | 10 | 40.0 | ||
| 9 | 30.7 | 2.01 a | 3’‘‘ | 77.6 | 3.57 c | 11 | 110.2 | 6.79 (s) |
| 2.13 a | 4’‘‘ | 70.7 | 3.33 c | 12 | 154.6 | |||
| 10 | 71.6 | 5.51 (dt, 5.0, 11.0) | 5’‘‘ | 77.6 | 2.14 (m) | 13 | 121.5 | |
| 11 | 33.7 | 2.23 (m) | 6’‘‘ | 62.4 | 3.40 (m) | 14 | 141.0 | |
| 12 | 65.7 | 3.58 c | 3.56 (m) | 15 | 137.1 | 6.60 (dd, 18.0, 12.0) | ||
| 4.13 (dd, 2.7, 11.9) | 1’‘‘‘ | 106.3 | 4.61 (d, 7.8) | 16 | 119.8 | 5.11 (dd, 11.4, 1.8) | ||
| 13 | 175.5 | 2’‘‘‘ | 76.5 | 3.33 c | 5.51 (dd, 11.4, 1.8) | |||
| 14 | 10.8 | 1.15 (3H, d, 7.0) | 3’‘‘‘ | 79.0 | 3.40 c | 17 | 13.3 | 2.11 (s) |
| 1’ | 122.5 | 4’‘‘‘ | 71.6 | 3.38 c | 18 | 27.3 | 1.22 (s) | |
| 2’/6’ | 132.9 | 7.89 (d, 8.6) | 5’‘‘‘ | 78.9 | 3.39 c | 19 | 22.0 | 1.17 (s) |
| 3’/5’ | 116.4 | 6.84 (d, 8.6) | 6’‘‘‘ | 62.8 | 3.71 c | 20 | 29.6 | 1.37 (s) |
| 4’ | 163.8 | 3.91 (m) | ||||||
a, b, c dSignals were overlapped with each other or by solvents.
Table 2.
1H NMR (600 MHz) and13C NMR data of 3 and 4 in CD3OD (δ in ppm, J in Hz).
| No. | 3 | 4 | ||
|---|---|---|---|---|
| δC | δH | δC | δH | |
| 2 | 89.0 | 5.49 (d, 6.1) | 88.5 | 5.44 (d, 6.0) |
| 3 | 55.5 | 3.45 (m) | 55.1 | 3.43 (m) |
| 3a | 130.2 | 129.2 | ||
| 4 | 118.1 | 6.72 (brs) | 126.0 | 7.10 (d, 1.9) |
| 5 | 136.2 | 135.0 | ||
| 6 | 114.2 | 6.72 (brs) | 129.9 | 7.00 (d, 1.9, 8.1) |
| 7 | 145.4 | 110.0 | 6.71 (d, 8.1) | |
| 7a | 147.9 | 159.7 | ||
| 8 | 33.1 | 2.65 (t, 7.2) | 32.8 | 2.64 (t, 7.6) |
| 9 | 31.9 | 1.94 (m) | 32.0 | 1.92 (m) |
| 10 | 65.2 | 4.07 (t, 6.2) | 65.2 | 4.06 (, 6.5) |
| 11 | 173.3 | 173.2 | ||
| 12 | 21.0 | 2.04 (s) | 21.0 | 2.03 (s) |
| 13 | 65.2 | 3.74 (dd, 5.5, 10.9) | 65.3 | 3.75 (dd, 7.3, 11.0) |
| 3.81 (dd, 7.1, 11.1) | 3.81 (dd, 5.5, 11.0) | |||
| 7-OCH3 | 56.9 | 3.85 (s) | ||
| 1’ | 134.3 | 134.6 | ||
| 2’ | 128.5 | 7.20 (d, 8.5) | 128.4 | 7.18 (d, 8.6) |
| 3’ | 116.3 | 6.75 (d, 8.5) | 116.4 | 6.75 (d, 8.6) |
| 4’ | 158.6 | 158.5 | ||
| 5’ | 116.3 | 6.75 (d, 8.5) | 116.4 | 6.75 (d, 8.6) |
| 6’ | 128.5 | 7.20 (d, 8.5) | 128.4 | 7.18 (d, 8.6) |
Table 3.
Inhibitory activities of compounds 3-4, 10, 12-15 in ABTS+ inhibition activities assay.
| Compd. | Concentration (μM) | Inhibition rate (%) | IC50 (μM) |
|---|---|---|---|
| Trolox | 250 | 57.26 ± 1.38 | 176.5 ± 2.1 |
| 3 | 250 | 31.16 ± 0.38 | - |
| 4 | 250 | 23.71 ± 0.37 | - |
| 10 | 250 | 46.46 ± 0.83 | 348.4 ± 12.2 |
| 12 | 250 | 49.51 ± 1.60 | 387.4 ± 8.0 |
| 13 | 250 | 60.12 ± 0.19 | 203.7 ± 4.7 |
| 14 | 250 | 39.02 ± 1.35 | 361.8 ± 8.4 |
| 15 | 250 | 49.40 ± 0.72 | 232.9 ± 1.9 |
Disclaimer/Publisher’s Note: The statements, opinions and data contained in all publications are solely those of the individual author(s) and contributor(s) and not of MDPI and/or the editor(s). MDPI and/or the editor(s) disclaim responsibility for any injury to people or property resulting from any ideas, methods, instructions or products referred to in the content. |
© 2024 by the authors. Licensee MDPI, Basel, Switzerland. This article is an open access article distributed under the terms and conditions of the Creative Commons Attribution (CC BY) license (http://creativecommons.org/licenses/by/4.0/).
Copyright: This open access article is published under a Creative Commons CC BY 4.0 license, which permit the free download, distribution, and reuse, provided that the author and preprint are cited in any reuse.


