
Submitted:
26 December 2024
Posted:
27 December 2024
You are already at the latest version
Abstract
We report a low-cost, portable biosensor composed of aptamer functionalized nanoporous anodic aluminum oxide (NAAO) membrane and a commercial microcontroller chip-based impedance reader suitable for electrochemical impedance spectroscopy (EIS) based sensing. The biosensor consists of two chambers separated by an aptamer-functionalized NAAO membrane, and the impedance reader is utilized to monitor transmembrane impedance changes. The biosensor is utilized for detecting amodiaquine molecules using an amodiaquine-binding aptamer (OR7) functionalized membrane. Aptamer functionalized membrane is exposed to different concentrations of amodiaquine molecules to characterize the sensitivity of the sensor response. The specificity of the sensor response is characterized by exposure to varying concentrations of chloroquine, which is similar in structure to amodiaquine but does not bind to the OR7 aptamer. A commercial potentiostat is also used to measure the sensor response for amodiaquine and chloroquine. The sensing response measured using both the portable impedance reader and commercial potentiostat showed a similar dynamic response and detection threshold. The specific and sensitive sensing results for amodiaquine demonstrate the efficacy of the low-cost and portable biosensor.
Keywords:
Low-cost impedance reader
; Anodized Alumina
; Aptamer
; Amodiaquine
; Specificity
; Point-of-care diagnostics
1. Introduction
Electrochemical impedance spectroscopy (EIS) is a well-established method for measuring the dielectric and transport properties of materials, exploring the properties of porous electrodes, and investigating surfaces reactions [1]. EIS measurements can monitor surface impedance changes in biosensors due to polarity and ionic transport changes associated with the binding of desired analyte on biorecognition molecule-covered surfaces[2]. Biosensors that rely on EIS have been used for sensing cells [3,4,5], Proteins [6,7,8,9], nucleic acids [10,11,12,13], and single molecules [14,15]. EIS measurement also serves as a valuable tool for characterizing surface modification during the immobilization of biomolecules on glass slides[15,16,17], membranes [9], and graphene[18,19,20]. EIS-based investigations have been used to improve sensor performance in wearable sensors [21,22,23] and micro-arrays [21,22,23]. However, a significant limitation of EIS-based measurements-based biosensors is the high cost of commercial electrochemical potentiostats. A low-cost, portable, and easy-to-use impedance reader is required to apply impedance-based biosensors widely.
Several low-cost and portable impedance monitoring devices for biosensing have been reported and rely on either incorporating signal generators with other electronic peripherals [24,25,26,27,28] or commercially developed impedance measurement devices[29]. However, the performance of the impedance monitoring devices has not been compared to commercial potentiostats commonly used for biosensing research. This paper compares the performance of a commercial potentiostat with a low-cost and portable impedance reader based on an Analog Devices-produced microcontroller unit (MCU) ADuCM350. The ADuCM350 is an integrated meter-on-chip solution with a microcontroller subsystem for signal processing, control, and connectivity. The low cost (around 20 USD) and small size (1cm^2) make ADuCM350 an ideal candidate for a portable impedance monitoring device.
Quinine is found in the bark of trees from the genus Cinchona, and extracts from the bark have been traditionally used in South America to stop shivering, which led to its use as a treatment for malaria [30]. Amodiaquine hydrochloride (AMQ) has a broad therapeutic index[31], and it is a medication used to treat malaria, including uncomplicated Plasmodium falciparum malaria [32]. The side effects of AMQ are generally minor to moderate and are like those of Chloroquine (CHQ), but in rare cases may lead to liver problems or low blood cell levels [31]. Headaches, trouble seeing, seizures, and cardiac arrest are reported as side effects of the AMQ[31]. Additionally, the prevalence of counterfeit malarial medicines due to poor quality control increases the chances of raising drug resistant disease and the treatment of Malaria challenging [33]. Sensors able to accurately sense and confirm the AMQ concentration are required to address these health concerns. Currently, the most common techniques used for sensing AMQ are Isothermal titration calorimetry (ITC)[30], poly(vinyl chloride) (PVC) membrane sensor [34], liquid chromatography[35,36,37], conductometry[38], fluorimetry[39,40], electrochemical sensing [41,42,43,44,45,46,47,48] and spectrophotometry[49,50].
However, these techniques are time-consuming and require expensive apparatus and trained operators. A portable, low-cost biosensor that can sense AMQ with fast turnover time is helpful to address point-of-care sensing needs.
Aptamers are oligonucleotides that are in-vitro selected to recognize high affinity and specificity molecular targets and thus may serve as biorecognition molecules for biosensors[42].A recently reported nucleic acid-based aptamer (OR7) demonstrates a specific nanomolar affinity binding affinity for AMQ but does not bind specifically to CHQ (52,53). The OR7 aptamer may be utilized as a biorecognition molecule for AMQ biosensors because of its nanomolar affinity and high specificity for AMQ.
We report a low-cost, portable biosensor composed of aptamer functionalized nanoporous anodic aluminum oxide (NAAO) membrane and a commercial microcontroller chip-based impedance reader suitable for electrochemical impedance spectroscopy (EIS) based sensing. With the sensing substrate assembled inside the electrochemical cell, impedance changes in the aptamer functionalized membranes on exposure to the target are analyzed by the distribution relaxation time (DRT) method[54,55,56,57]. The impedance measurement and DRT analysis are implemented in the low-cost and portable ADuCM350 MCU-based reader. The performance of the impedance reader is compared to commercial potentiostat-based sensing results.
2. Experiment Section
2.1. Reagents and Apparatus
AMQ binding aptamer (OR7) was obtained from Integrated DNA Technologies (IDT), with the sequence: 5'-C6 Thiol-C AAG GAA AAT CCT TCA ACG AAG TGG G-3'(53). Amodiaquine dihydrochloride dihydrate (AMQ) (CAS Number 6398-98-7) and Chloroquine diphosphate (CHQ) salt (CAS Number 50-63-5) were purchased from Sigma-Aldrich. The solvent for AMQ was 100% Dimethyl sulfoxide (DMSO), purchased from Fisher Scientific. All sensing experiments were conducted in phosphate buffer (PBS buffer: 137 mM NaCl, 2.7 mM KCl, 10 mM Ha2HPO4, 2mM KH2PO4, 5mM MgCl2, pH 7.4 at room temperature) with 3% DMSO. All solutions were prepared using double-distilled water (ddH2O) produced by the Corning Mega-Pure system.
NAAO membranes with an average pore diameter of 20nm and membrane thickness of 50μm, platinum wires, and silver wires were purchased from Sigma-Aldrich. Silver wires were coated with silver chloride following the previously described procedure to fabricate reference electrodes [58]. Analog Devices Inc. evaluation board (EVAL-ADuCM350EBZ) was used to implement the low-cost and portable impedance reader. A commercial Potentiostat (Reference 600+ Gamry Instruments Inc.) was also used for the electrochemical experiments.
2.2. Transducer Fabrication
NAAO membranes were first cleaned twice with ddH2O, ethanol, and isopropanol wash, and an 60 nm thick layer of gold was uniformly coated on the surface of the membrane using a Denton sputter coater. Gold-coated NAAO membranes were washed using ddH2O and ethanol twice each before usage. A scanning electron micrograph of gold-coated NAAO membranes with 60 nm thick gold coating is shown in Figure 1A. The top left of the gold coating in Figure 1A was removed to highlight the contrast between coated and uncoated surfaces. The coating thickness was chosen based on previous work on aptamer-modified sensing experiments [9]. After cleaning, the gold-coated membranes were immersed in 1 µM OR7 aptamer solutions and stored overnight (~17 hours) at 4 °C to immobilize the aptamers on the gold surface using thiol-gold (-S-Au-) bonding. Aptamer-coated membranes were immersed in 3mM Mercaptohexane (MCH) for 1 hour to displace any physisorbed aptamer from the gold surface to minimize nonspecific binding after target introduction. The functionalization steps of the aptasensor are depicted schematically in Figure 1B
2.3. Electrochemical Cell
The aptamer-modified NAAO membrane, Pt wire electrodes, and silver/silver chloride reference electrodes were mounted in the electrochemical cell shown in Figure 1C and exposed to 10 different concentrations of AMQ ranging from 1 to 650 nM. Using a four-electrode arrangement, the potentiostat and ADuCM350-based impedance reader were utilized to monitor the transmembrane impedance change. The aptamer functionalized membrane is assembled inside two parts of Teflon cells with one working and one reference electrode inserted in each. At the beginning of the sensing experiment, both sides of the electrochemical cell were filled with 500uL PBS buffer as the electrolyte. Working and counter electrodes were inserted inside each chamber to measure the current flow through the NAAO membrane. Two reference electrodes were inserted into each chamber to maintain the desired alternative voltage value. AMQ was injected into the half-cell at the gold-coated side. In addition, impedance changes due to membrane exposure to different concentrations of chloroquine molecules that do not specifically bind to the AMQ-binding aptamer were also measured as a control response.
For the sensing experiments with the potentiostat, the four electrodes in the cells were connected to the corresponding ports, and EIS scans were conducted to monitor the impedance changes across the membranes with exposure to 10 different AMQ concentrations. The frequency range of voltage excitation was set between 0.1 – 100,000Hz with 10 points for each decade. Five signal periods were performed at each frequency excitation to minimize any possible signal aliasing. At each AMQ titration, three cycles of frequency scan were conducted to ensure the molecule had enough time to diffuse through the electrolyte. Signals at all cycles were overlaid and observed to ensure a steady state was reached. Each titration took twenty minutes, and the overall EIS measurement was finished within three hours.
For the sensing experiments with the impedance reader, the connections between the impedance reader and the electrochemical cell are shown in Figure 2. Pins #3 and #6 on the EV-ADUCM350-BIO3Z were registered as working and counter electrodes, while pins #4 and #5 were registered as reference electrodes. An alternating voltage was applied through pins #4 and #5, and the corresponding alternating current was measured through pins #3 and #6. The chip Cortex-3 generated the alternating voltage perturbation required for EIS, and an FFT (Fast Fourier transformation) was used to perform the data analysis. The alternating voltage perturbation excitation frequency was varied between 300 – 10,000Hz. The electrochemical current corresponding to the applied excitation voltage was measured and converted to a voltage by an Op-Amplifier. The magnitude and phase data were calculated by comparing the signal from the biosensor to a resistor printed on ADuCM350 with a fixed resistance. The signal measured by the impedance reader was transferred to the laptop using an emulator board with a serial port.
Experimentally measured EIS responses from both the impedance reader and the potentiostat were analyzed using the distribution of relaxation time (DRT) approach (59–61) using the parameters listed in Appendix A.
3. Result and Discussion
3.1. Impedance Changes in Membrane Exposed to AMQ
Typical Bode plots (magnitude and phase components) of the impedance of the OR7 aptamer functionalized membrane before and after exposure to 250 nM of AMQ obtained using commercial Potentiostat are plotted in Figure 3A. The bode plots obtained using the impedance reader for a similar change in AMQ concentration on the aptamer functionalized membrane are plotted in Fig 3B. The bode plots obtained using both potentiostat and impedance reader show a similar magnitude of impedance and increase in the membrane impedance on exposure to AMQ. The frequency range of the impedance reader measurements is limited compared to Gamry Potentiostat. Still, over the measured frequency ranges, both the instruments show a similar magnitude and phase of membrane impedances.
The Bode plots can provide a qualitative comparison of the impedance changes over the measurement frequency range but cannot give a quantitative measure for the sensing response. The measured impedance data were fitted to the distribution of relaxation times (DRT) distribution shown in equation (1)(59,62),
where f is the frequency, G∞ is the solution resistance, G(τ) is the resistance corresponding to relaxation time, τ. The deconvolution of the impedance is conducted to identify the relaxation times that are most sensitive to AMQ/aptamer binding on the membrane. The DRT spectrum [57] corresponding to impedances plotted in Figure 3A,B are plotted in Figure 3C,D, respectively. The DRT plots in Figure 3A,B indicate that the magnitude of the resistance has a peak corresponding to the relaxation time of approximately 0.01s. The magnitude of the peak in the DRT spectrum increases on the exposure of the membrane to 250 nM AMQ concentration for both Figure 3C,D. Hence, the sensing signal was defined according to Equation (2)
where and , are the magnitudes of the DRT peak for membrane exposed to n and zero concentration of AMQ, and is the relaxation time corresponding to the DRT peak. The sensing signal is normalized to ensure that the variations in impedance changes across different membranes do not influence the sensing signal.
The sensing signals corresponding to the exposure of OR7 aptamer functionalized membrane to at least 10 different concentrations of AMQ measured using potentiostat and impedance reader are plotted in Figure 4A and Figure 4B, respectively. The OR7 aptamer binds specifically to AMQ but does not have binding affinity to CHQ molecules[52,53] so CHQ serves as a valuable control for the biosensor response. The sensing signals obtained by exposure of the aptamer functionalized membranes to chloroquine (CHQ) are also plotted in Figure 4A and Figure 4B, respectively. The sensing signal increases with the increase in AMQ concentrations, but the sensing signals are not correlated to changes in CHQ concentrations. The sensing signal generated from the control experiment (CHQ) is between -5% to 0% and is separated from AMQ sensing data. The biosensor-specific response to AMQ over CHQ in Figure 4A and Figure 4B may be attributed to the specific binding between OR7 aptamer and AMQ molecules on the sensing surface. The sensing and control signals measured using potentiostat (Figure 4A) and low-cost impedance reader (Figure 4B) are of similar magnitude and show similar trends with changes in AMQ and CHQ concentrations.
The sensing responses corresponding to different concentrations were fitted to Langmuir isotherm shown in Equation (3),
where Fmax is the maximum sensing response, C is the concentration of the AMQ, and KD is the dissociation constant for binding between OR7 aptamer and AMQ molecules. The fits to the sensing responses and the 95% confidence interval of the fits are plotted along with data measured using potentiostat and impedance reader in Figure 4A and Figure 4B, respectively. In both Figures, the Langmuir fit gives a Fmax value of 10%, indicating that the sensing signal saturates at around 10% with the increase in AMQ concentrations. The dissociation constant (KD) values are 2nM from potentiostat data and 4nM from impedance reader data.
The dynamic range of the AMQ sensing experiment using potentiostat and impedance reader are shown in Figure 4C and Figure 4D, respectively. The goodness-of-fit of linear regression in the dynamic range plots is 96.9% and 99% for data measured by potentiostat and impedance reader. Using the criteria 3.3Sy/S, where Sy represents the standard deviation, and S represents the slope of the curve, the limit of detection (LOD) for the potentiostat is estimated to be 10nM, while for the impedance reader is estimated to be 25nM.
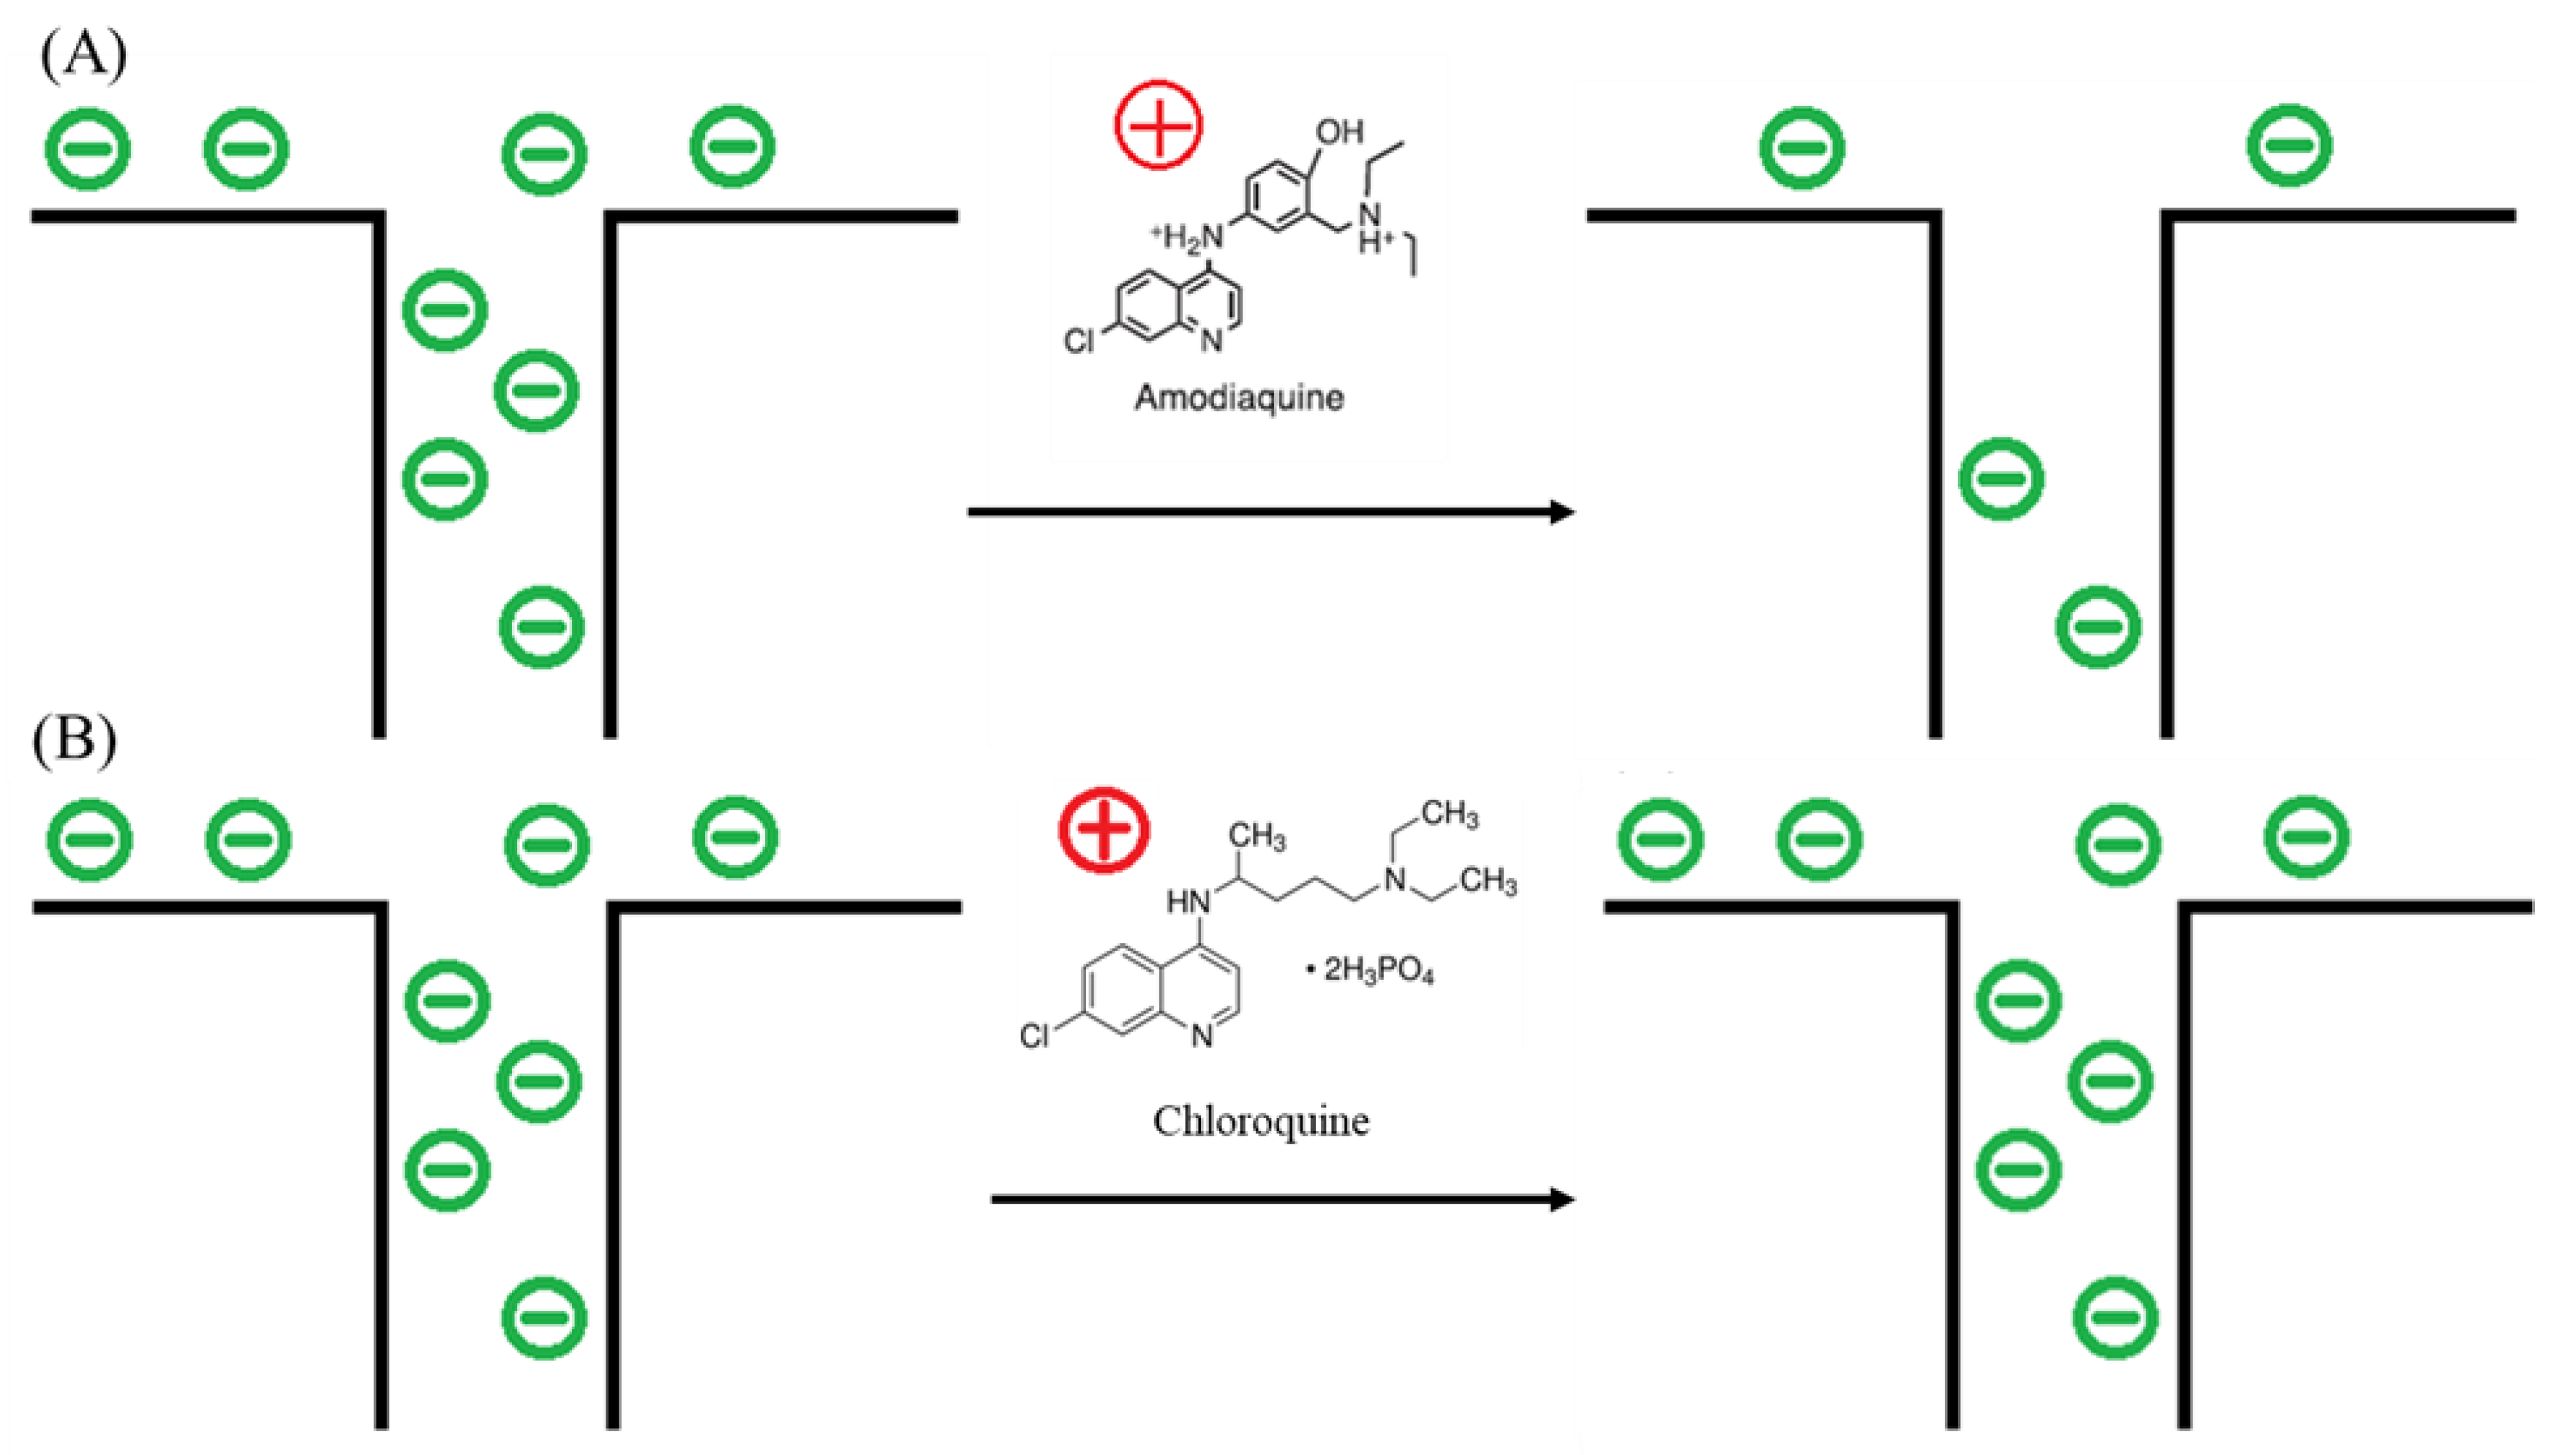
The sensing response or the change in transmembrane impedance depends on the influence of the aptamer/AMQ binding on the transport of ions through the nanoporous structure of NAAO. Steric hindrance and surface charge distribution changes are the dominating mechanisms underlying the sensing response for pore based biosensors. The average pore size of the NAAO membrane is 20 nm, based on the SEM images. The aptamer has 26 bases and is approximately 9nm in diameter. Since AMQ's size is small, the OR7/AMQ complex is expected to be same size as the aptamer and smaller than the NAAO pore size. The small size change in the unbound aptamer and bound aptamer/AMQ complex is unlikely to cause significant change in the steric hindrance to ionic transport through the pore. However, the change in surface charge distribution may result in ionic conductance changes through the pores [63]. The ionic conductance through the pore may be separated into surface-charge-governed or geometry-governed regimes depending on the value of the non-dimensional constant ( ), where σ is surface charge density, n is electrolyte concentration, e is the elementary charge, and h is the channel diameter. The conductance is governed when the non-dimensional ratio of surface charge distribution to electrolyte concentration is less than 1. In the current experiments, surface charge density, σ, due to the self-assembled monolayer of OR7 aptamer, is about -50 mC/m^2(64), n is 0.15 M, and h is 20 nm for the alumina membrane. Thus, ionic conductance through the aptamer-covered pores is dominated by surface charge distribution. The pKa of AMQ in PBS is between 9-10, which means AMQ is positively charged in the PBS buffer (pH~7.0). Binding between the AMQ and aptamer-covered negatively charged surface will likely result in quenching of the negative surface charge and thus decrease ionic conductance through the pores, as schematically represented in Figure 5A. The increase in AMQ concentration results in the increased attenuation of ionic conductance and higher impedance across the membrane. The CHQ molecules with a pKa of 10.1 are also positively charged in the PBS buffer. However, the non-specific interaction between CHQ and aptamer functionalized membrane results in minimal changes in the surface charge distribution and ionic transport, as shown schematically in Figure 5B.
3.2. Impedance Reader.
The dynamic range and LOD for AMQ detection reported in the literature are compared to current measurements in Table 1A, and it shows that current aptasensor-based measurements can achieve a low LOD. Still, the dynamic range is limited due to the high affinity of the OR7 aptamer for AMQ molecules. The performance of the low-cost impedance reader is compared to other low-cost biosensors reported in the literature. The performance of the biosensor is comparable to the other low-cost sensing devices and provides a proof-of-concept for implementing a low-cost, portable impedance reader that may be used to develop point-of-care diagnostic devices.

Table 1.
A. Recent publications about AMQ biosensor.
| Publications | Detection Method | Dynamic Range | Limit of Detection |
|---|---|---|---|
| . Chiwunze et al. (65) | Electrochemical | 100 – 3,500 nM | 89 nM |
| Malongo et al.(34) | Electrochemical | 10 – 3,200 nM | 1200 nM |
| Karakaya et al. (66) | Electrochemical | 500 – 25,000 nM | 160 nM |
| Valente et al. (67) | Electrochemical | x | 9272 nM |
| Potentiostat Based Measurement | Electrochemical | 1-1000 nM | 10 nM |
| Impedance Reader Based Measurement | Electrochemical | 1-1000 nM | 25 nM |
Table 1.
B. Recent publications about portable biosensor.
| Publications | Targets | Dynamic Range | Limit of Detection |
|---|---|---|---|
| Nagabooshanam et al. (68) | chlorpyrifos | 10 to 100ng/L | 6ng/L |
| Sawhney and Conlan (26) | cancer antigen 125 | 0.92– 15.20 ng/μL | 0.24 ng/μL |
| Gupta et al. (69) | Pb(II) | 0.001 - 1,000 nM | 0.81 nM |
| This Work | AMQ | 1 – 1000 nM | 25 nM |
4. Conclusion
We report a low-cost, portable biosensor comprising an aptamer functionalized NAAO membrane and a commercial microprocessor-based impedance reader. The biosensor performance is characterized by sensing AMQ using a specifically binding aptamer (OR7) as a biorecognition element. The low-cost biosensor provides specific detection of AMQ with an LOD of 25 nM and a dynamic range of 1-1000 nM. A commercial potentiostat used with aptamer functionalized membranes for AMQ sensing provides an LOD of 10 nM and a dynamic range of 1-1000 nM, indicating that the low-cost impedance reader can replicate the sensing performance of a commercial potentiostat. The impedance of the aptamer functionalized membrane increases in the presence of specifically binding AMQ but does not change in the presence of CHQ, indicating the response is due to the specific aptamer/AMQ binding on the sensor surface. The sensor performance is comparable to other low-cost and portable sensors and can provide the framework for implementing point-of-care diagnostic devices.
Funding
This research was supported by the U.S. Department of Energy, Office of Science, Biological and Environmental Research (BER) through the Ames Laboratory. The Ames Laboratory is operated for the U.S. Department of Energy by Iowa State University under Contract No. DE-AC02-07CH11358.
Appendix A
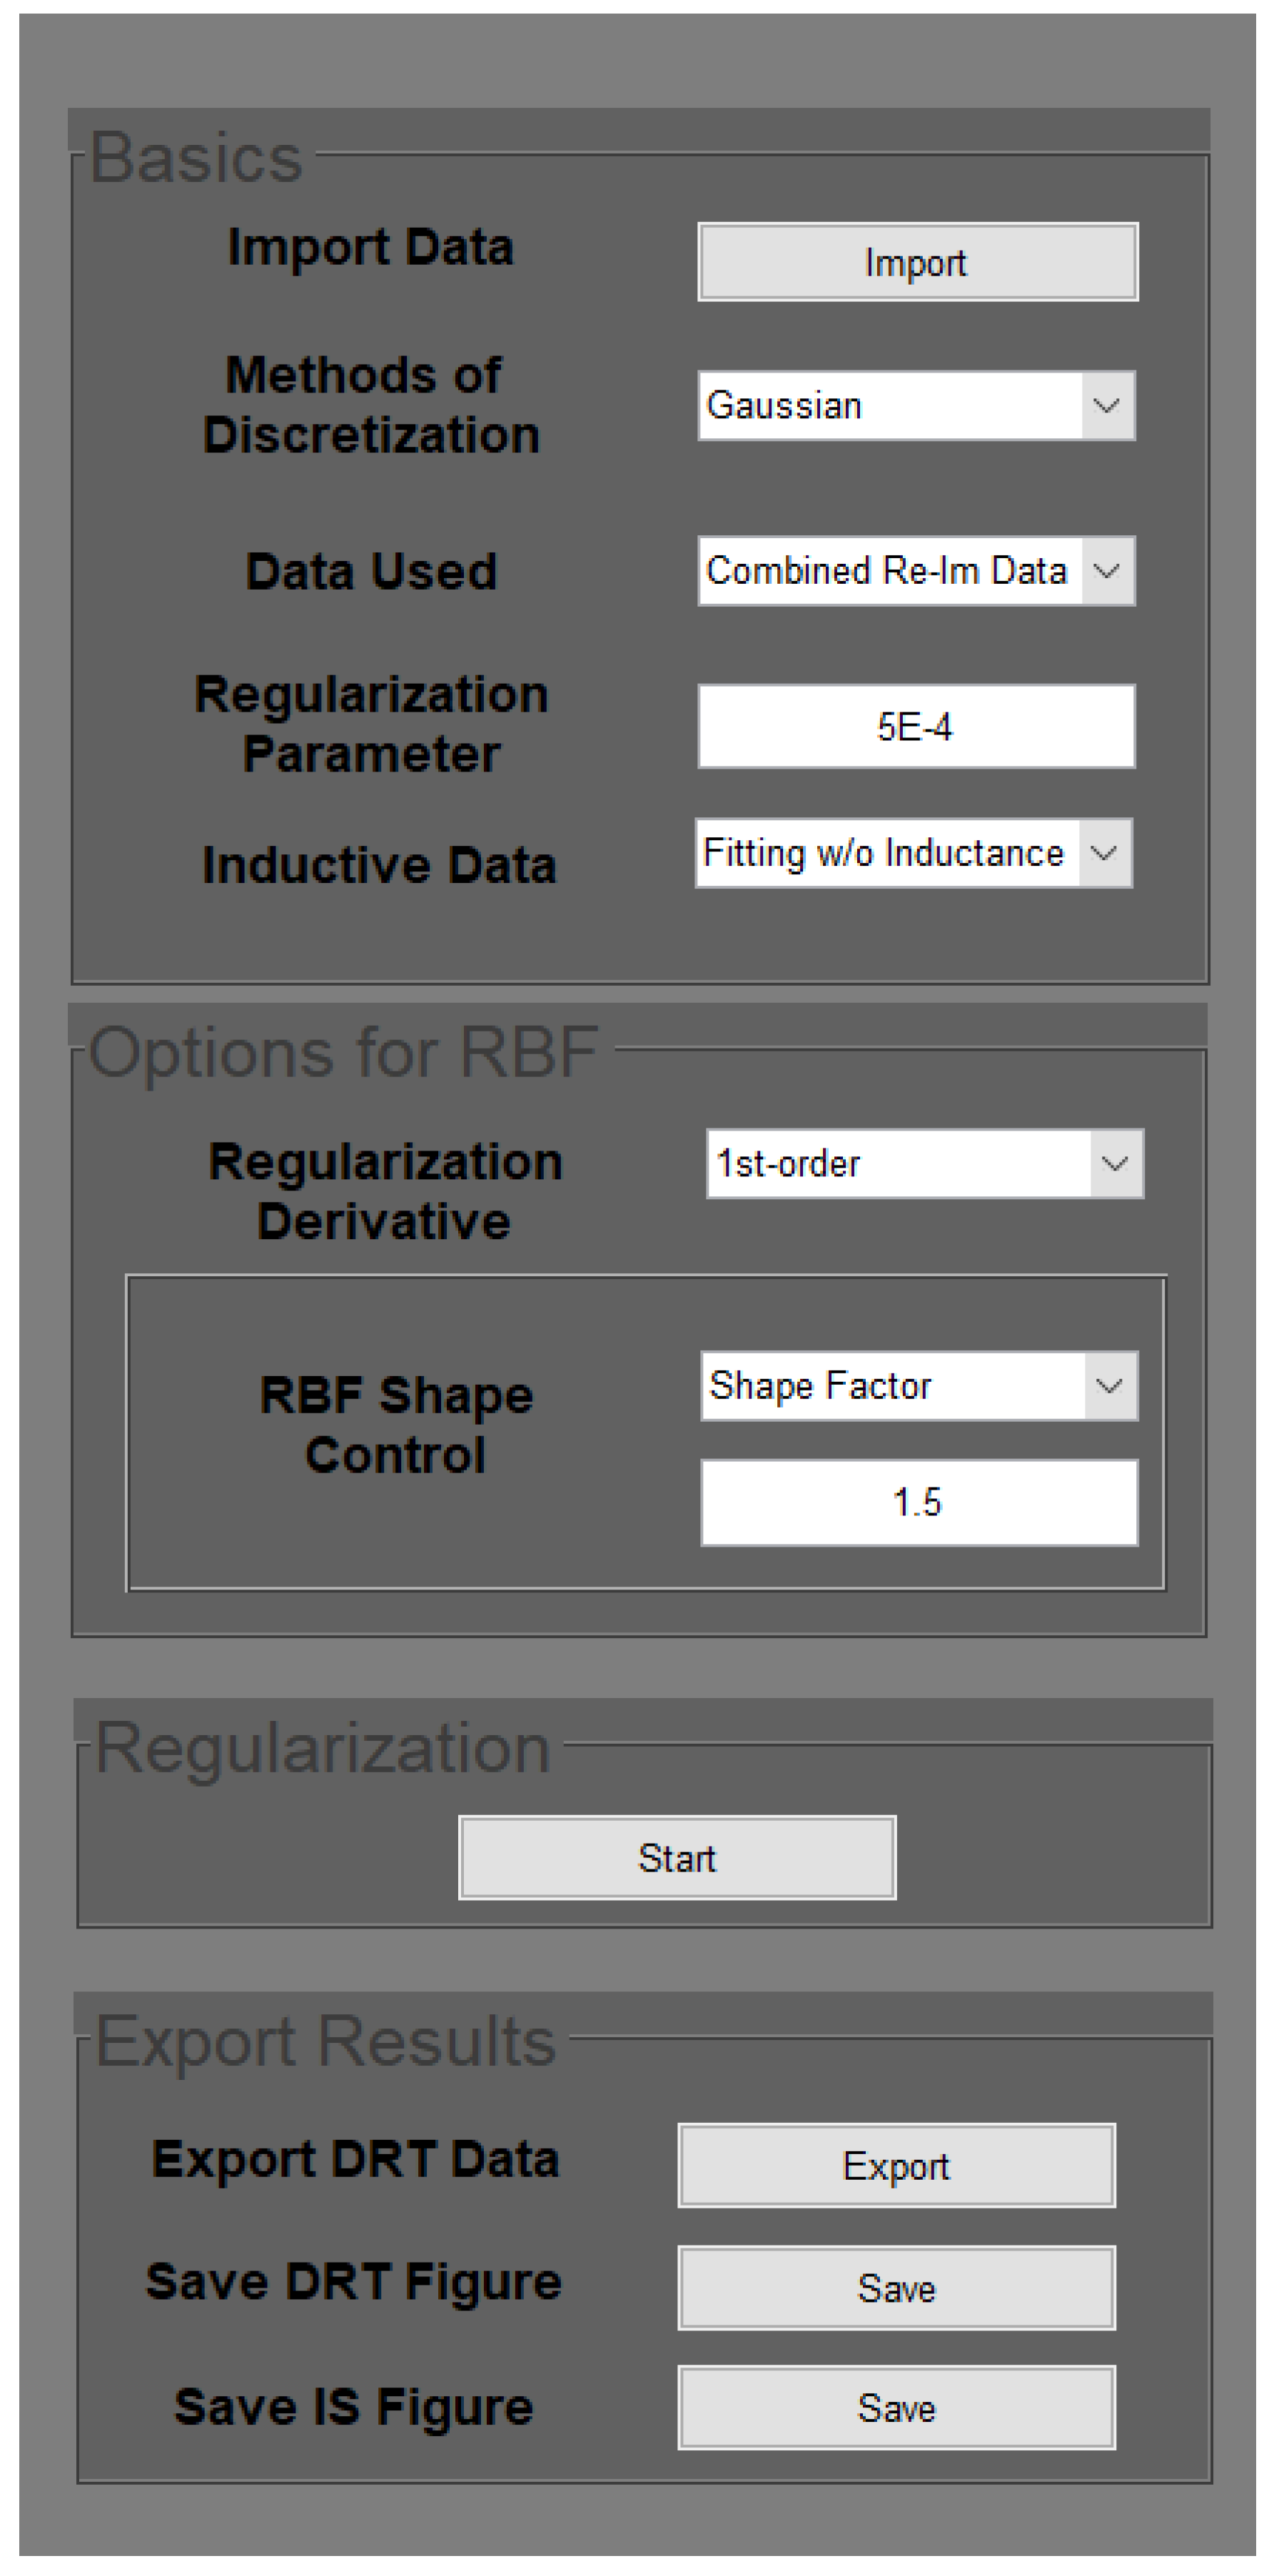
DRT parameters used for the AMQ and CHQ signals:
Figure A1.
DRT parameters setup shown in the MATLAB panel.
References
- MacDonald, D.D. Reflections on the history of electrochemical impedance spectroscopy. Electrochim Acta. 2006, 51, 1376–1388. [Google Scholar] [CrossRef]
- Lisdat, F.; Schäfer, D. The use of electrochemical impedance spectroscopy for biosensing. Anal Bioanal Chem. 2008, 391, 1555–1567. [Google Scholar] [CrossRef] [PubMed]
- K’Owino, I.O.; Sadik, O.A. Impedance spectroscopy: A powerful tool for rapid biomolecular screening and cell culture monitoring. Electroanalysis. 2005, 17, 2101–2113. [Google Scholar] [CrossRef]
- Ma, X.; Du, X.; Li, H.; Cheng, X.; Hwang, J.C.M. Ultra-wideband impedance spectroscopy of a live biological cell. IEEE Trans Microw Theory Tech. 2018, 66, 3690–3696. [Google Scholar] [CrossRef]
- De León, S.E.; Pupovac, A.; McArthur, S.L. Three-Dimensional (3D) cell culture monitoring: Opportunities and challenges for impedance spectroscopy. Biotechnol Bioeng. 2020, 117, 1230–1240. [Google Scholar] [CrossRef]
- Pei, R.; Cheng, Z.; Wang, E.; Yang, X. Amplification of antigen-antibody interactions based on biotin labeled protein-streptavidin network complex using impedance spectroscopy. Biosens Bioelectron. 2001, 16, 355–361. [Google Scholar] [CrossRef]
- Zhang, D.; Lu, Y.; Zhang, Q.; Liu, L.; Li, S.; Yao, Y. , et al. Protein detecting with smartphone-controlled electrochemical impedance spectroscopy for point-of-care applications. Sens Actuators B Chem. 2016, 222, 994–1002. [Google Scholar] [CrossRef]
- Rodriguez, M.C.; Kawde, A.N.; Wang, J. Aptamer biosensor for label-free impedance spectroscopy detection of proteins based on recognition-induced switching of the surface charge. Chemical Communications. 2005, 34, 4267–4269. [Google Scholar] [CrossRef]
- Gosai, A.; Hau Yeah, B.S.; Nilsen-Hamilton, M.; Shrotriya, P. Label free thrombin detection in presence of high concentration of albumin using an aptamer-functionalized nanoporous membrane. Biosens Bioelectron. 2019, 126, 88–95. [Google Scholar] [CrossRef]
- Keighley, S.D.; Estrela, P.; Li, P.; Migliorato, P. Optimization of label-free DNA detection with electrochemical impedance spectroscopy using PNA probes. Biosens Bioelectron. 2008, 24, 906–911. [Google Scholar] [CrossRef]
- Liu, J.; Tian, S.; Neilsen, P.E.; Knoll, W. In situ hybridization of PNA/DNA studied label-free by electrochemical impedance spectroscopy. Chemical Communications. 2005, 23, 2969–2971. [Google Scholar] [CrossRef] [PubMed]
- Meng, T.; Zhao, D.; Ye, H.; Feng, Y.; Wang, H.; Zhang, Y. Construction of an ultrasensitive electrochemical sensing platform for microRNA-21 based on interface impedance spectroscopy. J Colloid Interface Sci. 2020, 578, 164–170. [Google Scholar] [CrossRef] [PubMed]
- Muti, M.; Sharma, S.; Erdem, A.; Papakonstantinou, P. Electrochemical monitoring of nucleic acid hybridization by single-use graphene oxide-based sensor. Electroanalysis. 2011, 23, 272–279. [Google Scholar] [CrossRef]
- Arredondo, B.; Romero, B.; Del Pozo, G.; Sessler, M.; Veit, C.; Würfel, U. Impedance spectroscopy analysis of small molecule solution processed organic solar cell. Solar Energy Materials and Solar Cells. 2014, 128, 351–356. [Google Scholar] [CrossRef]
- Ball, V. Impedance spectroscopy and zeta potential titration of dopa-melanin films produced by oxidation of dopamine. Colloids Surf A Physicochem Eng Asp. 2010, 363, 92–97. [Google Scholar] [CrossRef]
- Ceriotti, L.; Ponti, J.; Colpo, P.; Sabbioni, E.; Rossi, F. Assessment of cytotoxicity by impedance spectroscopy. Biosens Bioelectron. 2007, 22, 3057–3063. [Google Scholar] [CrossRef]
- Manesse, M.; Stambouli, V.; Boukherroub, R.; Szunerits, S. Electrochemical impedance spectroscopy and surface plasmon resonance studies of DNA hybridization on gold/SiOx interfaces. Analyst. 2008, 133, 1097–1103. [Google Scholar] [CrossRef]
- Yen, Y.K.; Chao, C.H.; Yeh, Y.S. A graphene-PEDOT:PSS modified paper-based aptasensor for electrochemical impedance spectroscopy detection of tumor marker. Sensors (Switzerland). 2020, 20, 5. [Google Scholar] [CrossRef]
- Srivastava, S.; Ali, M.A.; Umrao, S.; Parashar, U.K.; Srivastava, A.; Sumana, G. , et al. Graphene Oxide-Based Biosensor for Food Toxin Detection. Appl Biochem Biotechnol. 2014, 174, 960–970. [Google Scholar] [CrossRef]
- Zhu L, Luo L, Wang Z. DNA electrochemical biosensor based on thionine-graphene nanocomposite. Biosens Bioelectron. 2012, 35, 507–511. [Google Scholar] [CrossRef]
- Liu, X.; Li, L.; Mason, A.J. High-Throughput impedance spectroscopy biosensor array chip. Philosophical Transactions of the Royal Society A: Mathematical, Physical and Engineering Sciences 2014, 372, 2012. [Google Scholar] [CrossRef] [PubMed]
- On-Chip_Electrochemical_Impedance_Spectroscopy_for_Biosensor_Arrays.pdf.
- An, L.; Wang, G.; Han, Y.; Li, T.; Jin, P.; Liu, S. Electrochemical biosensor for cancer cell detection based on a surface 3D micro-array. Lab Chip. 2018, 18, 335–342. [Google Scholar] [CrossRef] [PubMed]
- Huang, X.; Chen, H.; Deng, H.; Wang, L.; Liao, S.; Tang, A. A fast and simple electrochemical impedance spectroscopy measurement technique and its application in portable, low-cost instrument for impedimetric biosensing. Journal of Electroanalytical Chemistry. 2011, 657, 158–163. [Google Scholar] [CrossRef]
- Jiang, Z.; Yao, J.; Wang, L.; Wu, H.; Huang, J.; Zhao, T. , et al. Development of a Portable Electrochemical Impedance Spectroscopy System for Bio-Detection. IEEE Sens J. 2019, 19, 5979–5987. [Google Scholar] [CrossRef]
- Sawhney, M.A.; Conlan, R.S. POISED-5, a portable on-board electrochemical impedance spectroscopy biomarker analysis device. Biomed Microdevices. 2019, 21, 3. [Google Scholar] [CrossRef]
- Pruna, R.; Palacio, F.; Baraket, A.; Zine, N.; Streklas, A.; Bausells, J. , et al. A low-cost and miniaturized potentiostat for sensing of biomolecular species such as TNF-α by electrochemical impedance spectroscopy. Biosens Bioelectron. 2018, 100, 533–540. [Google Scholar] [CrossRef]
- Barreiros dos Santos, M.; Queirós, R.B.; Geraldes, Á.; Marques, C.; Vilas-Boas, V.; Dieguez, L. , et al. Portable sensing system based on electrochemical impedance spectroscopy for the simultaneous quantification of free and total microcystin-LR in freshwaters. Biosens Bioelectron. 2019, 142, 111550. [Google Scholar] [CrossRef]
- Sebar, L.E.; Iannucci, L.; Angelini, E.; Grassini, S.; Parvis, M. Electrochemical Impedance Spectroscopy System Based on a Teensy Board. IEEE Trans Instrum Meas. 2021, 70. [Google Scholar] [CrossRef]
- Slavkovic, S.; Churcher, Z.R.; Johnson, P.E. Nanomolar binding affinity of quinine-based antimalarial compounds by the cocaine-binding aptamer. Bioorg Med Chem. 2018, 26, 5427–5434. [Google Scholar] [CrossRef]
- Nair, A.; Abrahamsson, B.; Barends, D.M.; Groot, D.W.; Kopp, S.; Polli, J.E. , et al. Biowaiver monographs for immediate release solid oral dosage forms: Amodiaquine hydrochloride. J Pharm Sci. 2012, 101, 4390–4401. [Google Scholar] [CrossRef]
- Olliaro, P.; Mussano, P. Amodiaquine for treating malaria. Cochrane Database of Systematic Reviews. 2009, (4).
- Nate, Z.; Gill, A.A.S.; Chauhan, R.; Karpoormath, R. A review on recent progress in electrochemical detection of antimalarial drugs. Results Chem. 2022, 4, 100494. [Google Scholar] [CrossRef]
- Malongo, T.K.; Blankert, B.; Kambu, O.; Amighi, K.; Nsangu, J.; Kauffmann, J.M. Amodiaquine polymeric membrane electrode. J Pharm Biomed Anal. 2006, 41, 70–76. [Google Scholar] [CrossRef] [PubMed]
- Mount, D.L.; Patchen, L.C.; Nguyen-Dinh, P.; Barber, A.M.; Schwartz, I.K.; Churchill, F.C. Sensitive analysis of blood for amodiaquine and three metabolites by high-performance liquid chromatography with electrochemical detection. J Chromatogr B Biomed Sci Appl. 1986, 383, 375–386. [Google Scholar] [CrossRef] [PubMed]
- Lindegårdh, N.; Forslund, M.; Green, M.D.; Kaneko, A.; Bergavist, Y. Automated solid-phase extraction for determination of amodiaquine, chloroquine and metabolites in capillary blood on sampling paper by liquid chromatography. Chromatographia. 2002, 55, 5–12. [Google Scholar] [CrossRef]
- Sanghi, S.K.; Verma, A.; Verma, K.K. Determination of amodiaquine in pharmaceuticals by reaction with periodate and spectrophotometry or by high-performance liquid chromatography. Analyst. 1990, 115, 333–335. [Google Scholar] [CrossRef]
- Amin, A.S.; Issa, Y.M. Conductometric and indirect AAS determination of antimalarials. J Pharm Biomed Anal. 2003, 31, 785–794. [Google Scholar] [CrossRef]
- Armour, E.; Sherma, J. Transfer of silica gel TLC screening methods for clarithromycin, azithromycin, and amodiaquine + artesunate to HPTLC–densitometry with detection by reagentless thermochemical activation of fluorescence quenching. J Liq Chromatogr Relat Technol. 2017, 40, 282–286. [Google Scholar] [CrossRef]
- Churchill, F.C.; Patchen, L.C.C.; Campbell, C.; Schwartz, I.K.; Nguyen-Dinh, P.; Dickinson, C.M. Amodiaquine as a prodrug: Importance of metabolite(s) in the antimalarial effect of amodiaquine in humans. Life Sci. 1985, 36, 53–62. [Google Scholar] [CrossRef]
- Kamal, S.K.; Yardım, Y. Voltammetric determination of anti-malarial drug amodiaquine at a boron-doped diamond electrode surface in an anionic surfactant media: Voltammetric determination of amodiaquine. Macedonian Journal of Chemistry and Chemical Engineering. 2022, 41, 163–174. [Google Scholar] [CrossRef]
- Matrouf, M.; Loudiki, A.; Azriouil, M.; Laghrib, F.; Farahi, A.; Bakasse, M. , et al. Recent Advancements in Electrochemical Sensors for 4-Aminoquinoline Drugs Determination in Biological and Environmental Samples. J Electrochem Soc. 2022, 169, 067503. [Google Scholar] [CrossRef]
- Karakaya, S.; Kartal, B.; Dilgin, Y. Development and application of a sensitive, disposable and low-cost electrochemical sensing platform for an antimalarial drug: Amodiaquine based on poly (calcein)-modified pencil graphite electrode. Int J Environ Anal Chem. 2022, 102, 5136–5149. [Google Scholar] [CrossRef]
- Chiwunze, T.E.; Palakollu, V.N.; Gill, A.A.S.; Kayamba, F.; Thapliyal, N.B.; Karpoormath, R. A highly dispersed multi-walled carbon nanotubes and poly (methyl orange) based electrochemical sensor for the determination of an anti-malarial drug: Amodiaquine. Materials Science and Engineering: C. 2019, 97, 285–292. [Google Scholar] [CrossRef] [PubMed]
- Ramadhan, M.R.; Destiny, K.D.; Leoriza, M.D.; Sabriena, N.; Kurniawan, F.; Ismail, A.I. , et al. Electrochemical Behaviour of Amodiaquine Detection Using Boron Doped Diamond Electrodes. Int J Electrochem Sci. 2024, 100913. [Google Scholar]
- Nate, Z.; Gill, A.A.S.; Chauhan, R.; Karpoormath, R. Polyaniline-cobalt oxide nanofibers for simultaneous electrochemical determination of antimalarial drugs: Primaquine and proguanil. Microchemical Journal. 2021, 160, 105709. [Google Scholar] [CrossRef]
- Karakaya, S.; Kartal, B.; Dilgin, Y. Ultrasensitive voltammetric detection of an antimalarial drug (amodiaquine) at a disposable and low cost electrode. Monatshefte für Chemie-Chemical Monthly. 2020, 151, 1019–1026. [Google Scholar] [CrossRef]
- Peter, X.T.; Kuo, C.Y.; Malar, P.; Govindasamy, M.; Rajaji, U.; Yusuf, K. Electrochemical detection of antimalarial drug (Amodiaquine) using Dy-MOF@ MWCNTs composites to prevent erythrocytic stages of plasmodium species in human bodies. Microchemical Journal. 2024, 202, 110790. [Google Scholar] [CrossRef]
- Ramana Rao, G.; Pulla Rao, Y.; Raju, I.R.K. Spectrophotometric determination of amodiaquine hydrochloride in pharmaceutical dosage forms. Analyst. 1982, 107, 776–780. [Google Scholar]
- Mohamed, A.A. Kinetic spectrophotometric determination of amodiaquine and chloroquine. Monatsh Chem. 2009, 140, 9–14. [Google Scholar] [CrossRef]
- Ilgu, M.; Nilsen-Hamilton, M. Aptamers in analytics. Analyst [Internet]. 2016, 141, 1551–1568. [Google Scholar] [CrossRef]
- Reinstein, O.; Yoo, M.; Han, C.; Palmo, T.; Beckham, S.A.; Wilce, M.C.J. , et al. Quinine binding by the cocaine-binding aptamer. thermodynamic and hydrodynamic analysis of high-affinity binding of an off-target ligand. Biochemistry. 2013, 52, 8652–8662. [Google Scholar] [CrossRef]
- Slavkovic, S.; Churcher, Z.R.; Johnson, P.E. Nanomolar binding affinity of quinine-based antimalarial compounds by the cocaine-binding aptamer. Bioorg Med Chem. 2018, 26, 5427–5434. [Google Scholar] [CrossRef] [PubMed]
- Wan, T.H.; Saccoccio, M.; Chen, C.; Ciucci, F. Influence of the Discretization Methods on the Distribution of Relaxation Times Deconvolution: Implementing Radial Basis Functions with DRTtools. Electrochim Acta. 2015, 184, 483–499. [Google Scholar] [CrossRef]
- Spectroscopy, E.I. Distribution of Relaxation Times (DRT): an introduction I – INTRODUCTION II – THEORY EC-Lab - Application Note # 60. EC-Lab Aplication Note #60. 2017, 3–7.
- Ciucci, F.; Chen, C. Analysis of electrochemical impedance spectroscopy data using the distribution of relaxation times: A Bayesian and hierarchical Bayesian approach. Electrochim Acta. 2015, 167, 439–454. [Google Scholar] [CrossRef]
- Quattrocchi, E.; Wan, T.H.; Curcio, A.; Pepe, S.; Effat, M.B.; Ciucci, F. A general model for the impedance of batteries and supercapacitors: The non-linear distribution of diffusion times. Electrochim Acta. 2019, 324, 134853. [Google Scholar] [CrossRef]
- Gosai, A.; Hau Yeah, B.S.; Nilsen-Hamilton, M.; Shrotriya, P. Label free thrombin detection in presence of high concentration of albumin using an aptamer-functionalized nanoporous membrane. Biosens Bioelectron. 2019, 126, 88–95. [Google Scholar] [CrossRef]
- Wan, T.H.; Saccoccio, M.; Chen, C.; Ciucci, F. Influence of the Discretization Methods on the Distribution of Relaxation Times Deconvolution: Implementing Radial Basis Functions with DRTtools. Electrochim Acta. 2015, 184, 483–499. [Google Scholar] [CrossRef]
- Ciucci, F.; Chen, C. Analysis of electrochemical impedance spectroscopy data using the distribution of relaxation times: A Bayesian and hierarchical Bayesian approach. Electrochim Acta. 2015. [CrossRef]
- Saccoccio, M.; Wan, T.H.; Chen, C.; Ciucci, F. Optimal regularization in distribution of relaxation times applied to electrochemical impedance spectroscopy: Ridge and Lasso regression methods - A theoretical and experimental Study. Electrochim Acta. 2014, 147, 470–482. [Google Scholar] [CrossRef]
- Schmidt, J.P.; Berg, P.; Schönleber, M.; Weber, A.; Ivers-Tiffée, E. The distribution of relaxation times as basis for generalized time-domain models for Li-ion batteries. J Power Sources. 2013, 221, 70–77. [Google Scholar] [CrossRef]
- Karnik, R.; Castelino, K.; Fan, R.; Yang, P.; Majumdar, A. Effects of biological reactions and modifications on conductance of nanofluidic channels. Nano Lett. 2005, 5, 1638–1642. [Google Scholar] [CrossRef]
- Devarakonda, S.; Ganapathysubramanian, B.; Shrotriya, P. Impedance-Based Nanoporous Anodized Alumina/ITO Platforms for Label-Free Biosensors. ACS Appl Mater Interfaces. 2022, 14, 1. [Google Scholar] [CrossRef] [PubMed]
- Chiwunze, T.E.; Palakollu, V.N.; Gill, A.A.S.; Kayamba, F.; Thapliyal, N.B.; Karpoormath, R. A highly dispersed multi-walled carbon nanotubes and poly(methyl orange) based electrochemical sensor for the determination of an anti-malarial drug: Amodiaquine. Materials Science and Engineering C. 2019, 97, 285–292. [Google Scholar] [CrossRef] [PubMed]
- Karakaya, S.; Kartal, B.; Dilgin, Y. Development and application of a sensitive, disposable and low-cost electrochemical sensing platform for an antimalarial drug: amodiaquine based on poly(calcein)-modified pencil graphite electrode. Int J Environ Anal Chem [Internet]. 2022, 102, 5136–5149. [Google Scholar] [CrossRef]
- Valente, C.O.; Garcia, C.A.B.; Alves, J.P.H.; Zanoni, M.V.B.; Stradiotto, N.R.; Arguelho, M.L.P. Electrochemical Determination of Antimalarial Drug Amodiaquine in Maternal Milk Using a Hemin-Based Electrode. ECS Trans [Internet]. 2012, 43, 297–304. [Google Scholar] [CrossRef]
- Nagabooshanam, S.; Roy, S.; Mathur, A.; Mukherjee, I.; Krishnamurthy, S.; Bharadwaj, L.M. Electrochemical micro analytical device interfaced with portable potentiostat for rapid detection of chlorpyrifos using acetylcholinesterase conjugated metal organic framework using Internet of things. Sci Rep. 2019, 9, 1–9. [Google Scholar] [CrossRef]
- Gupta, A.K.; Khanna, M.; Roy, S.; Pankaj Nagabooshanam, S.; Kumar, R. , et al. Design and development of a portable resistive sensor based on α-MnO2/GQD nanocomposites for trace quantification of Pb(II) in water. IET Nanobiotechnol [Internet]. 2021, 15, 505–511. [Google Scholar] [CrossRef]
Figure 1.
(A) SEM image of the gold-coated membrane, (B) Teflon cells for electrochemical experiments and the four electrodes setup, (C) sensor structure with the process of aptamer immobilization and the impedance measurement.
Figure 1.
(A) SEM image of the gold-coated membrane, (B) Teflon cells for electrochemical experiments and the four electrodes setup, (C) sensor structure with the process of aptamer immobilization and the impedance measurement.
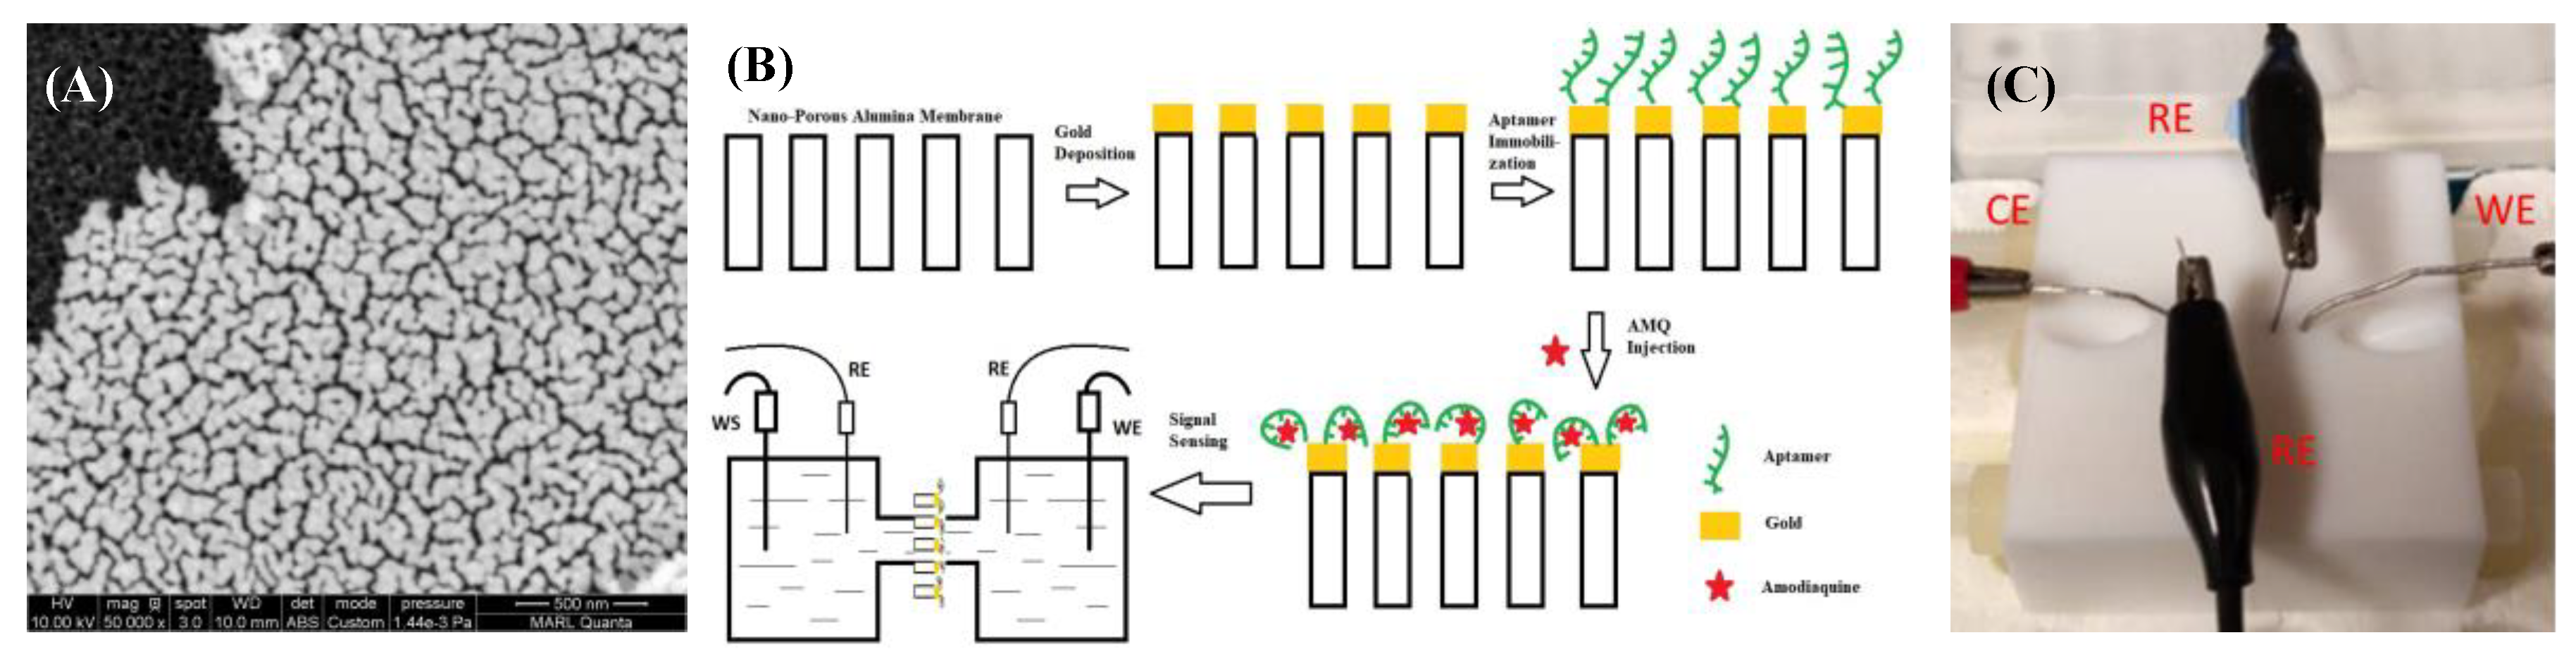
Figure 2.
Evaluation kit of ADuCM350-based impedance reader and the connection between the reader and the electrochemical cell.
Figure 2.
Evaluation kit of ADuCM350-based impedance reader and the connection between the reader and the electrochemical cell.
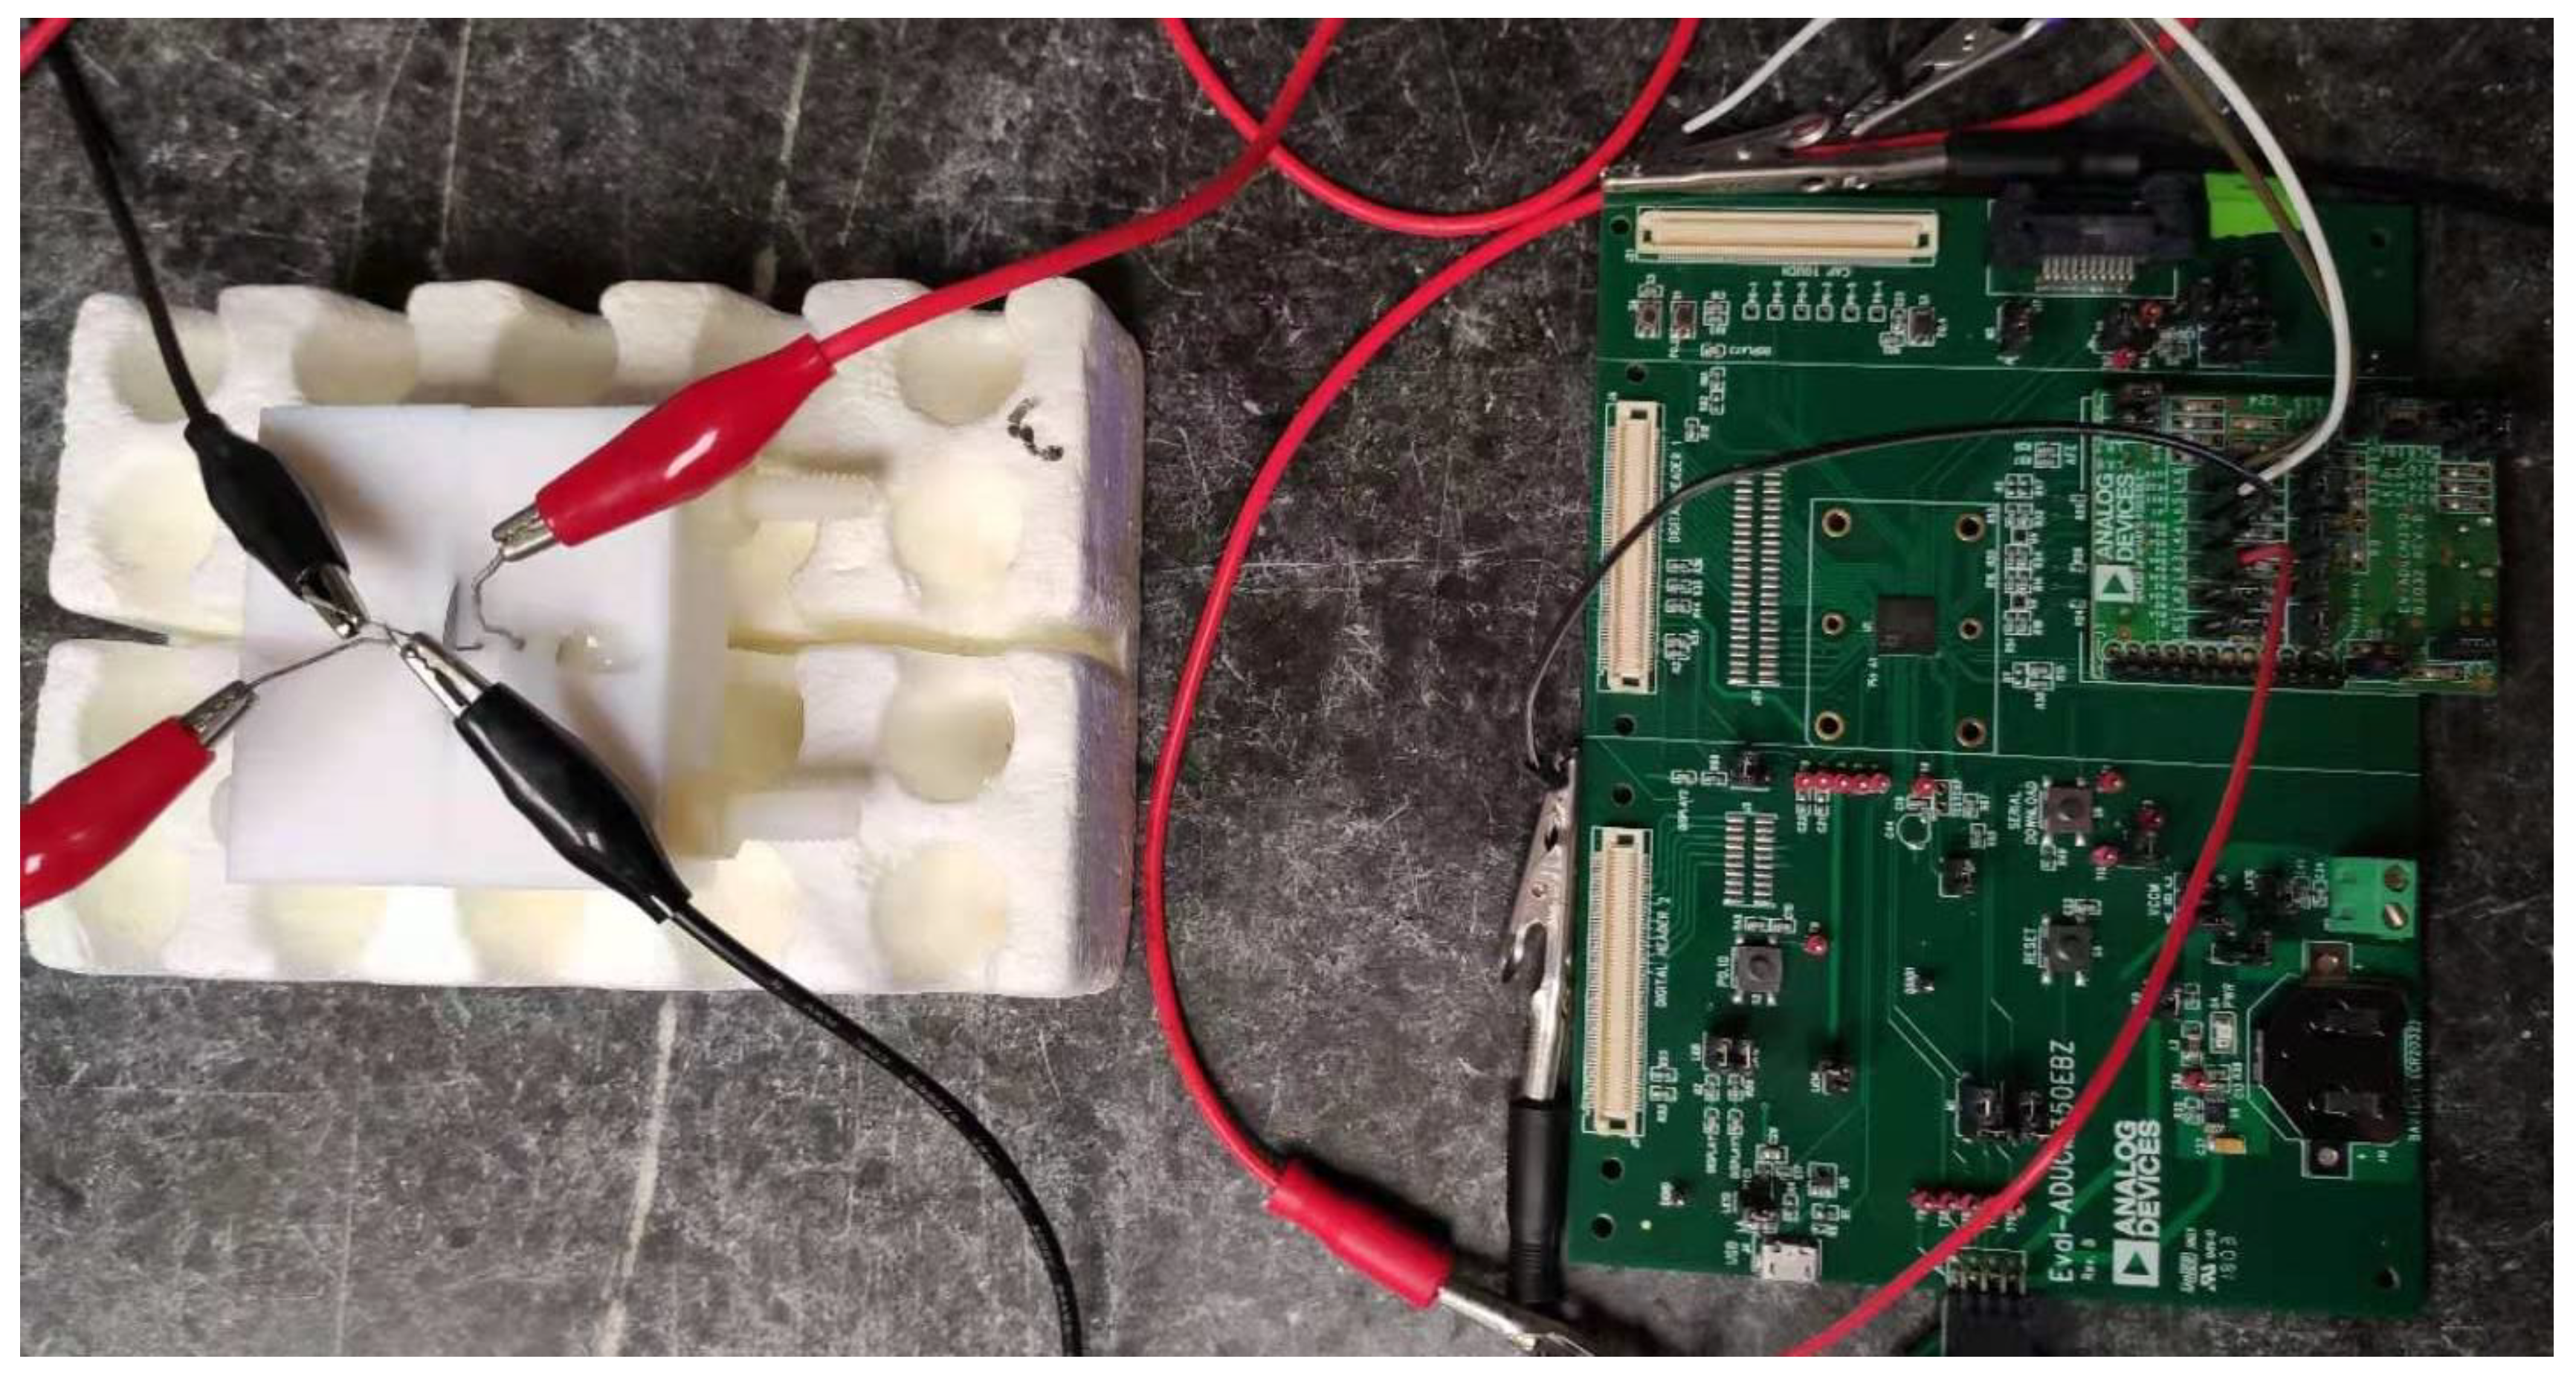
Figure 3.
Impedance of the OR7 functionalized membrane exposed to noAMQ and 250nM AMQ inside the electrochemical cell: (A) Bode plot measured using commercial Potentiostat, (B) Bode plot measured using low-cost impedance reader, (C) DRT deconvolution of the Bode plot in 3A, and (D) DRT deconvolution of the Bode plot in 3B.
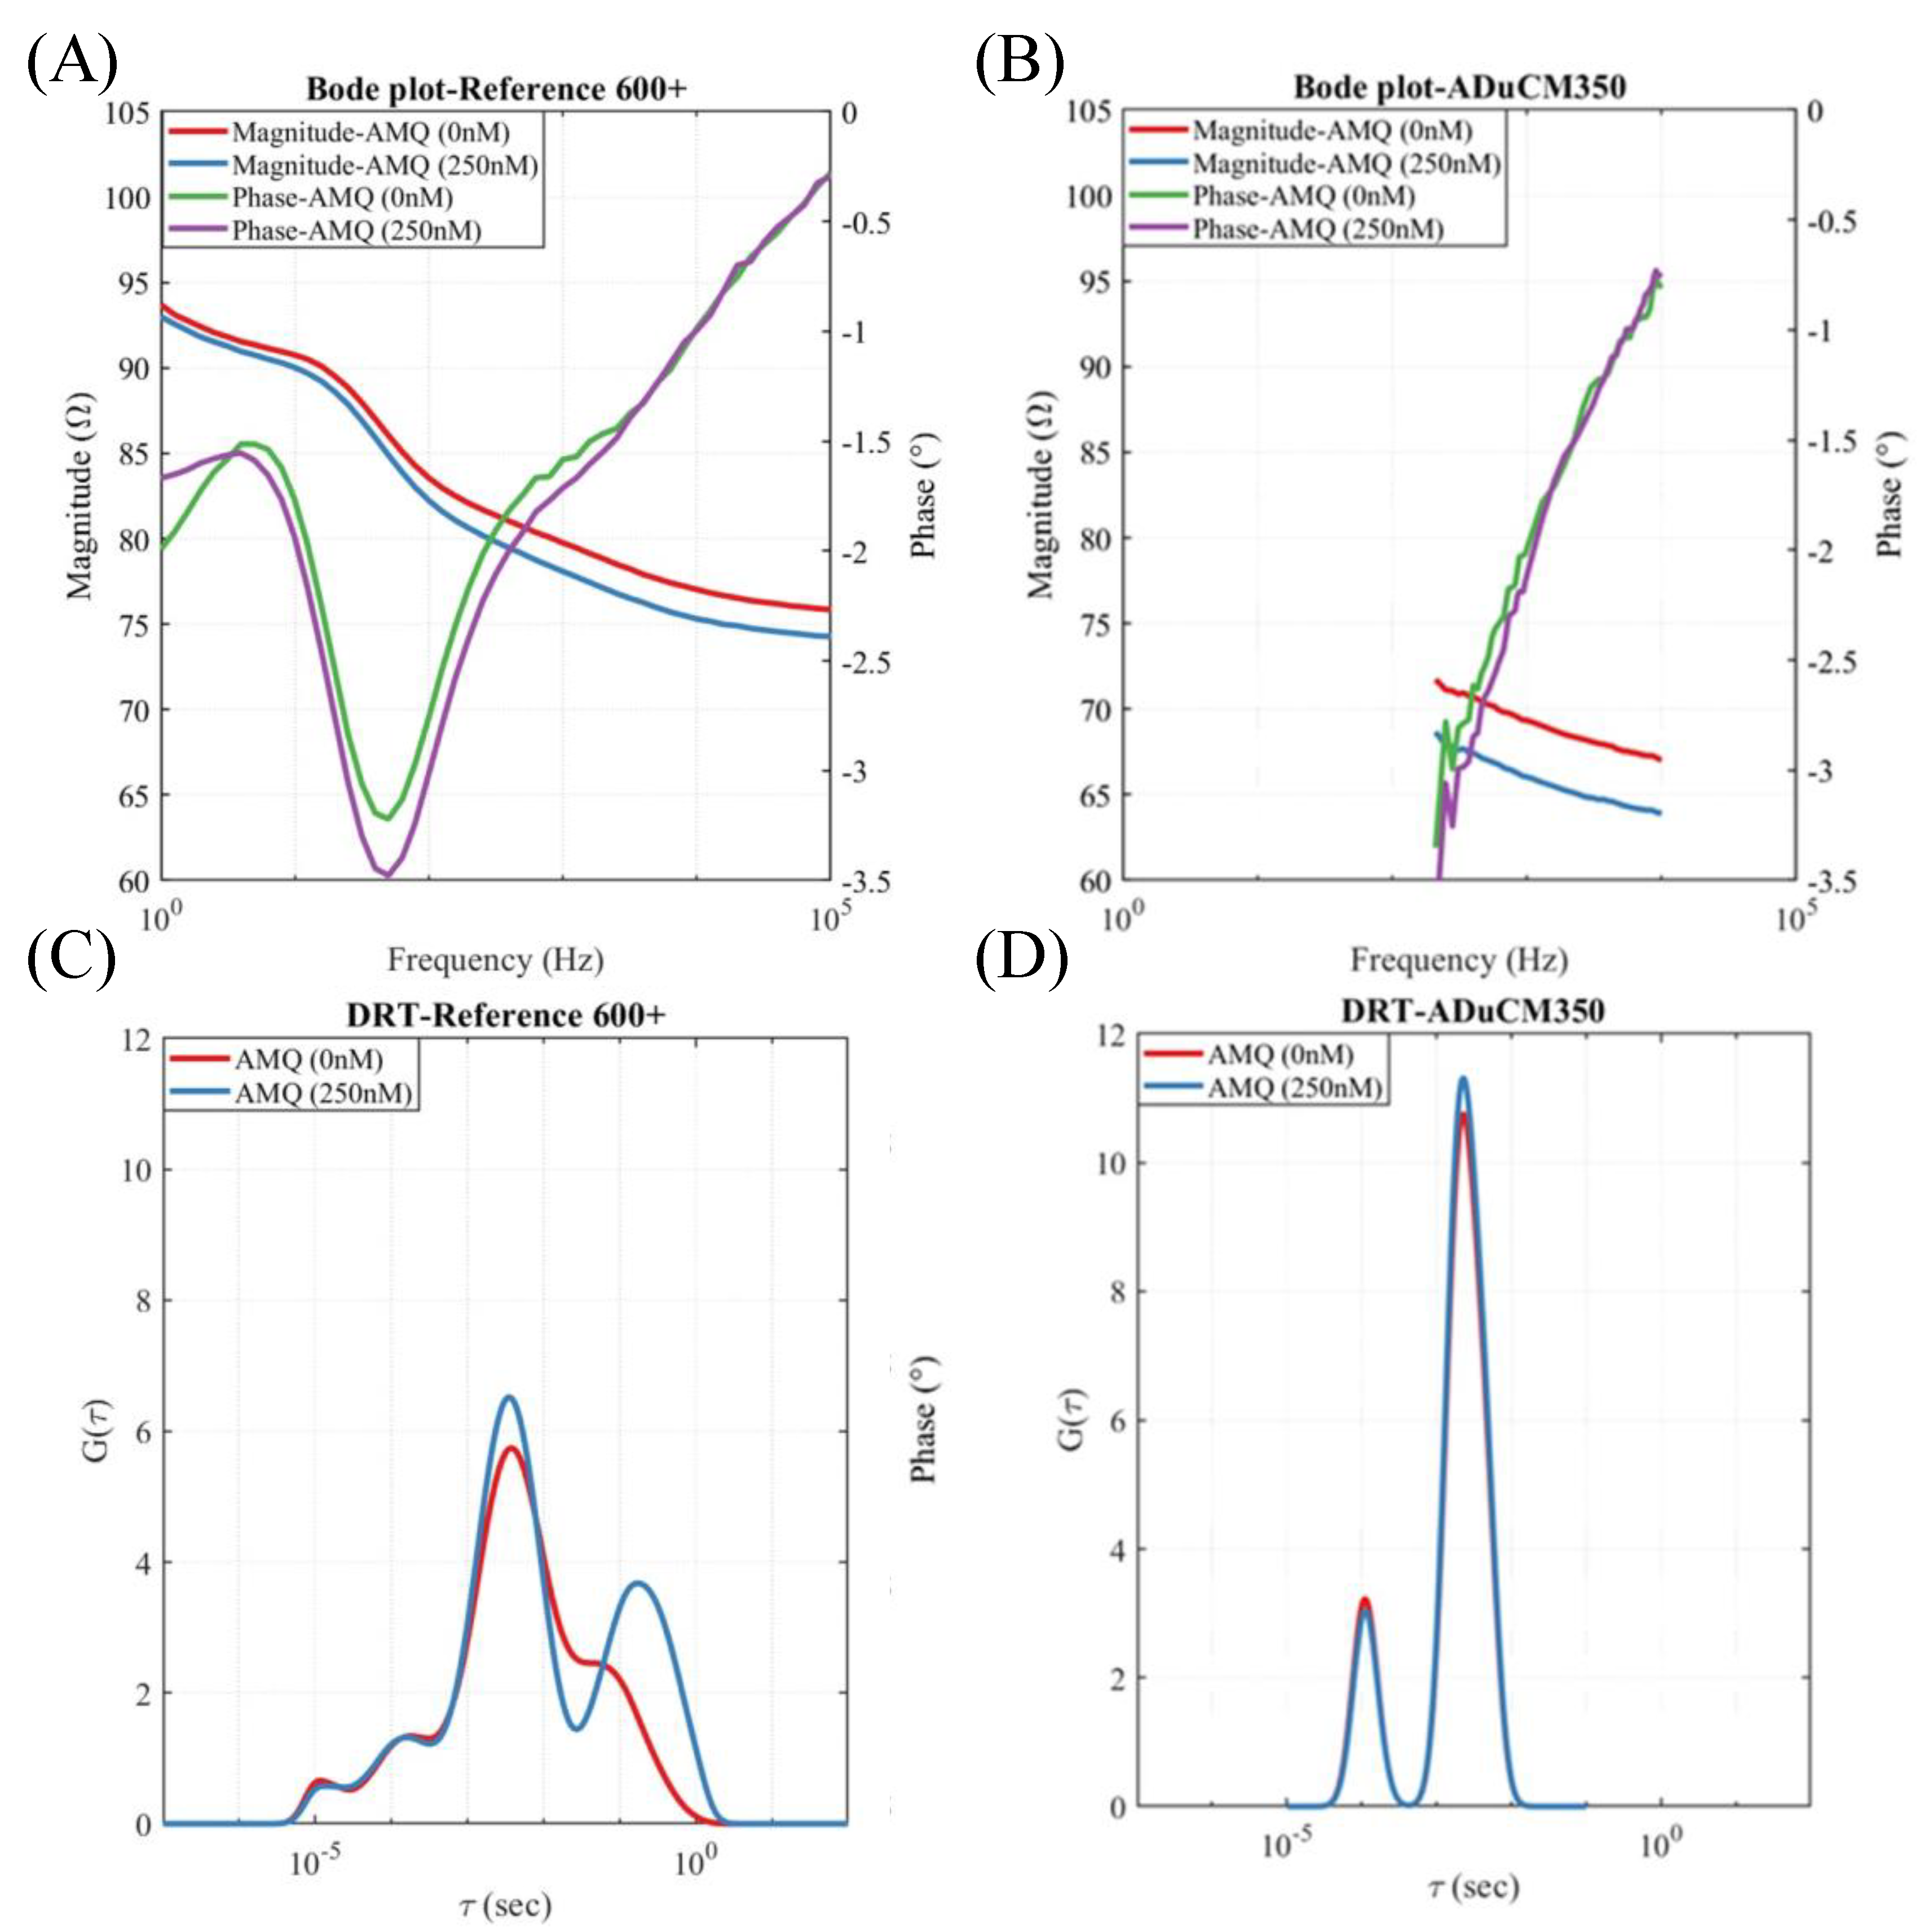
Figure 4.
Sensing Result of AMQ using both (A) potentiostat Reference 600+ and (B) ADuCM350-based impedance reader. AMQ LOD uses (C) potentiostat 600+ and (D) ADuCM350-based.
Figure 4.
Sensing Result of AMQ using both (A) potentiostat Reference 600+ and (B) ADuCM350-based impedance reader. AMQ LOD uses (C) potentiostat 600+ and (D) ADuCM350-based.
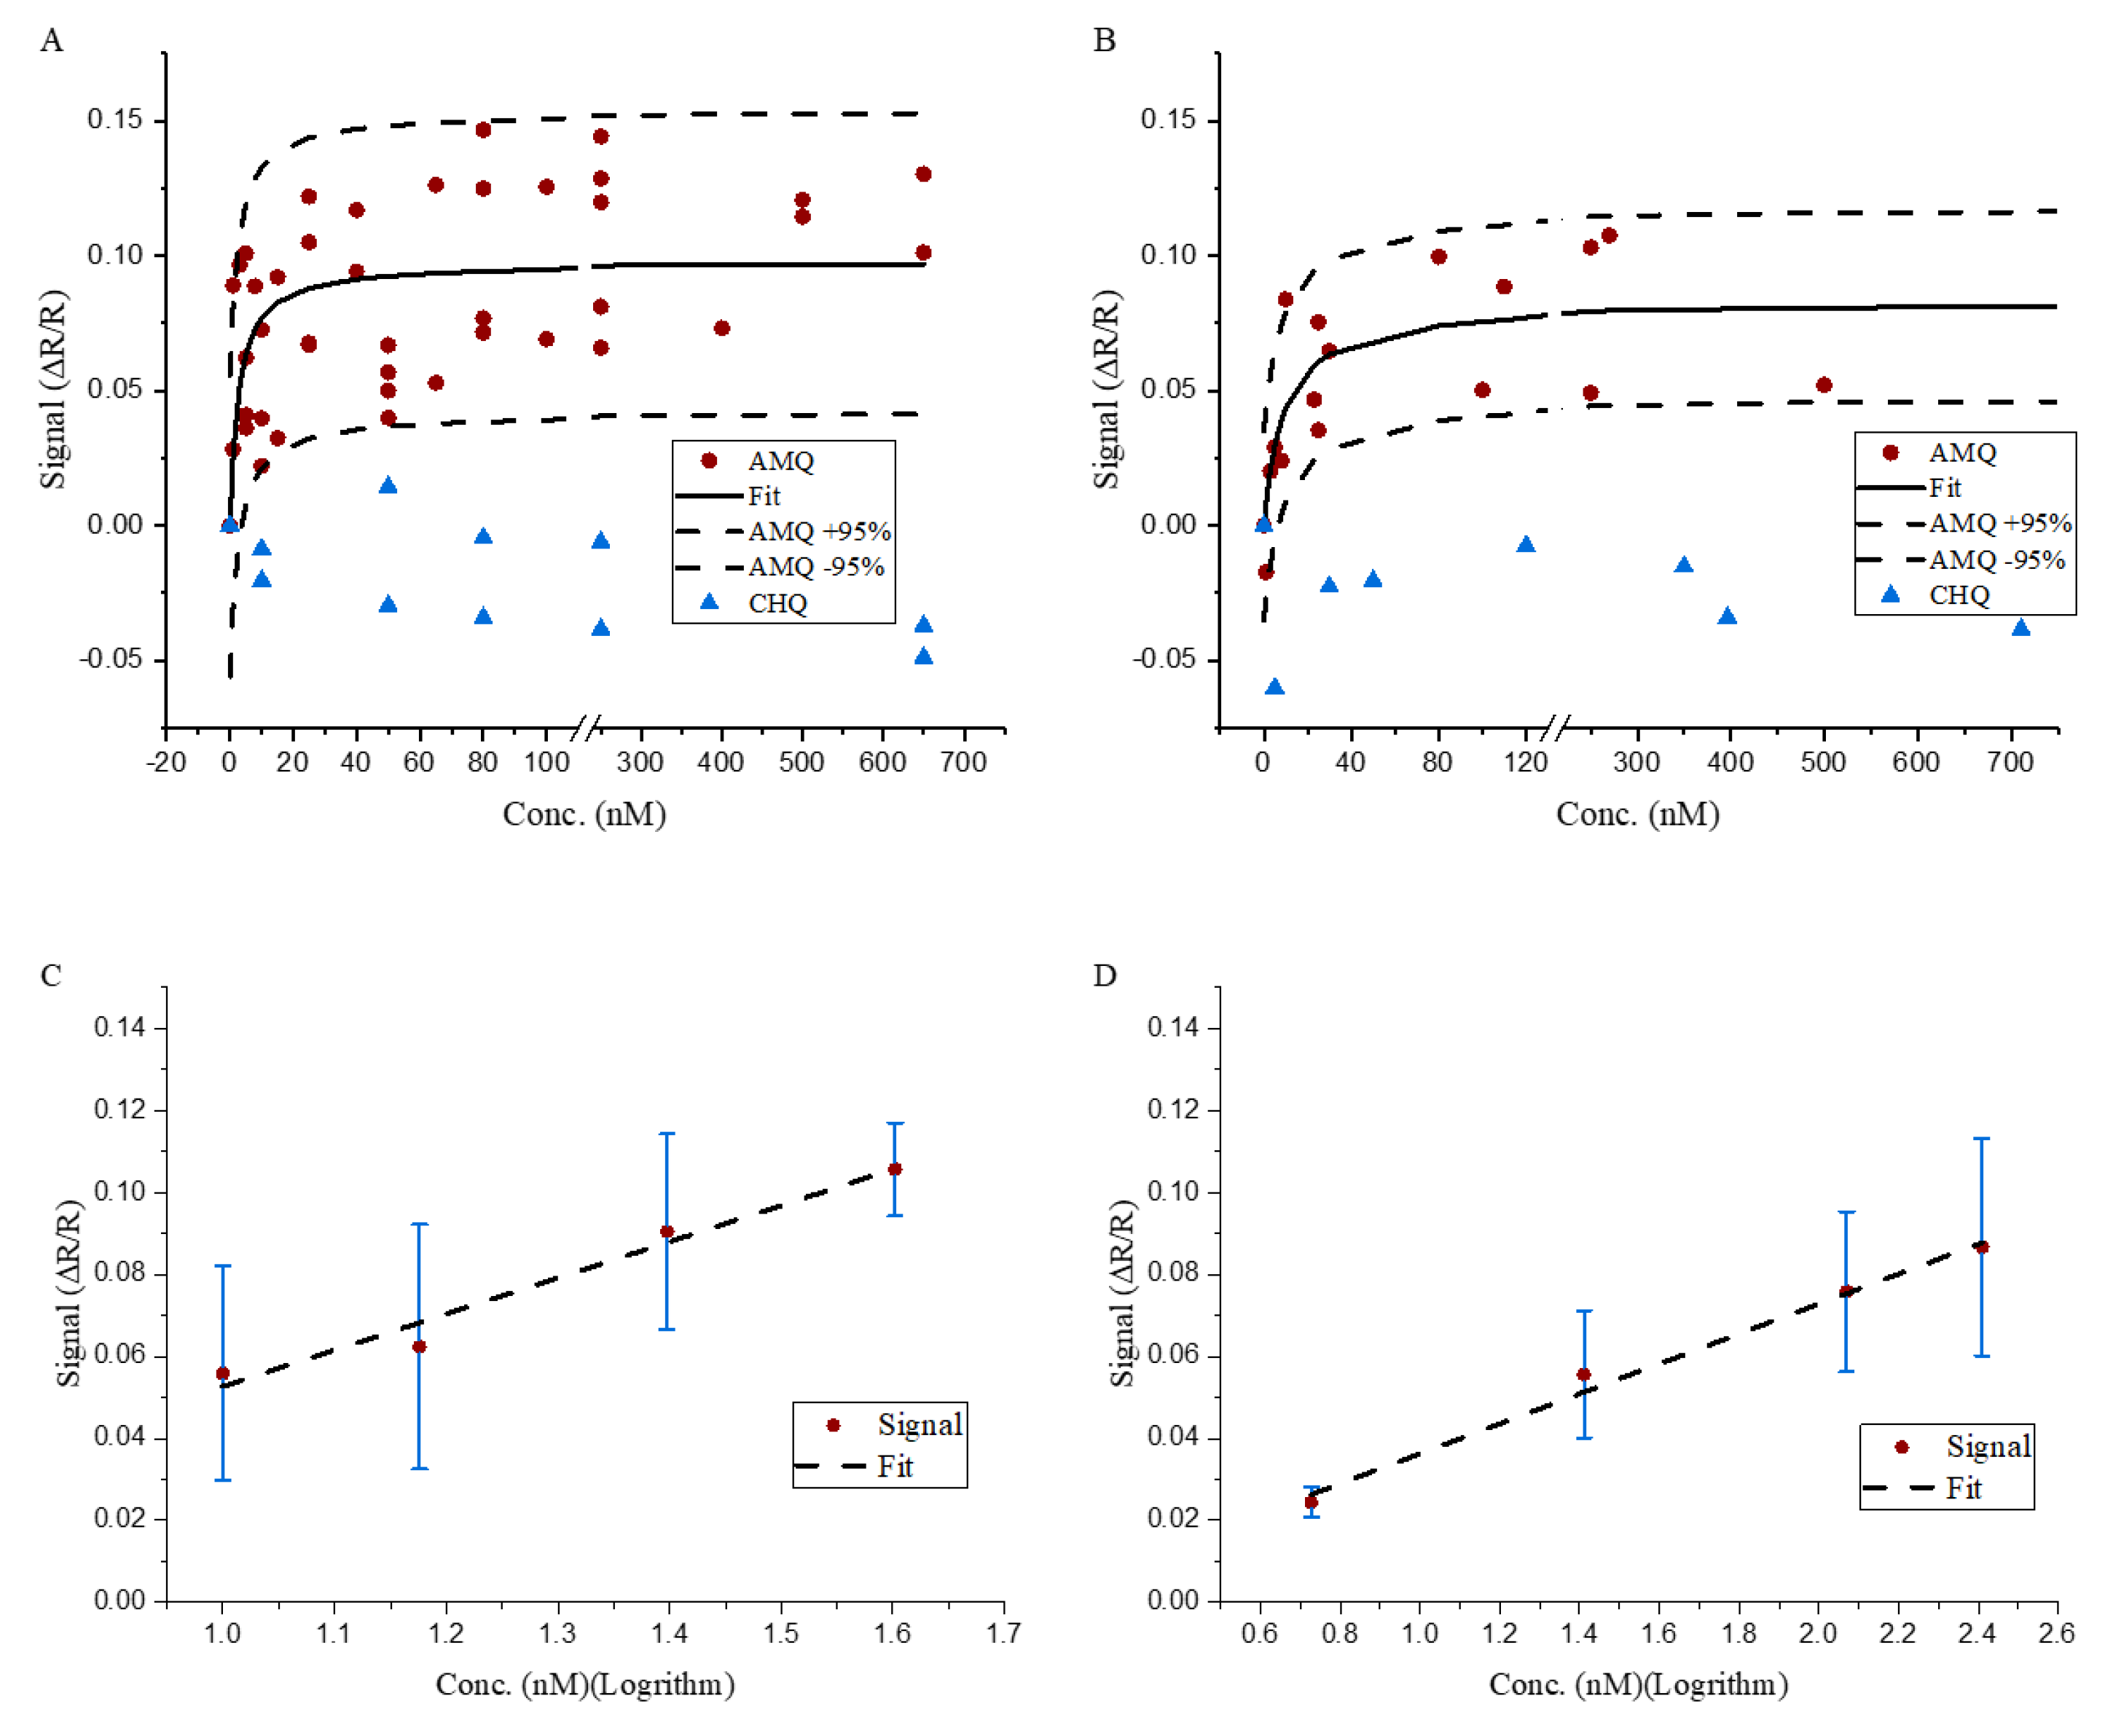
Figure 5.
(A) Quenching mechanism of AMQ binding with OR7, (B) charge accumulation of CHQ physisorption onto NAAO membrane surface.
Figure 5.
(A) Quenching mechanism of AMQ binding with OR7, (B) charge accumulation of CHQ physisorption onto NAAO membrane surface.
Disclaimer/Publisher’s Note: The statements, opinions and data contained in all publications are solely those of the individual author(s) and contributor(s) and not of MDPI and/or the editor(s). MDPI and/or the editor(s) disclaim responsibility for any injury to people or property resulting from any ideas, methods, instructions or products referred to in the content. |
© 2024 by the authors. Licensee MDPI, Basel, Switzerland. This article is an open access article distributed under the terms and conditions of the Creative Commons Attribution (CC BY) license (http://creativecommons.org/licenses/by/4.0/).
Copyright: This open access article is published under a Creative Commons CC BY 4.0 license, which permit the free download, distribution, and reuse, provided that the author and preprint are cited in any reuse.


