Preprint
Article

This version is not peer-reviewed.

Cheese Whey, Buttermilk and Dairy Wastewater to Promote Mixotrophic Metabolism in Arthrospira (Spirulina) platensis: Effect on Biomass Composition, Phycocyanin Content, and Fatty Acids Methyl Ester Profile

A peer-reviewed article of this preprint also exists.

Submitted:

26 December 2024

Posted:

27 December 2024

You are already at the latest version

Abstract

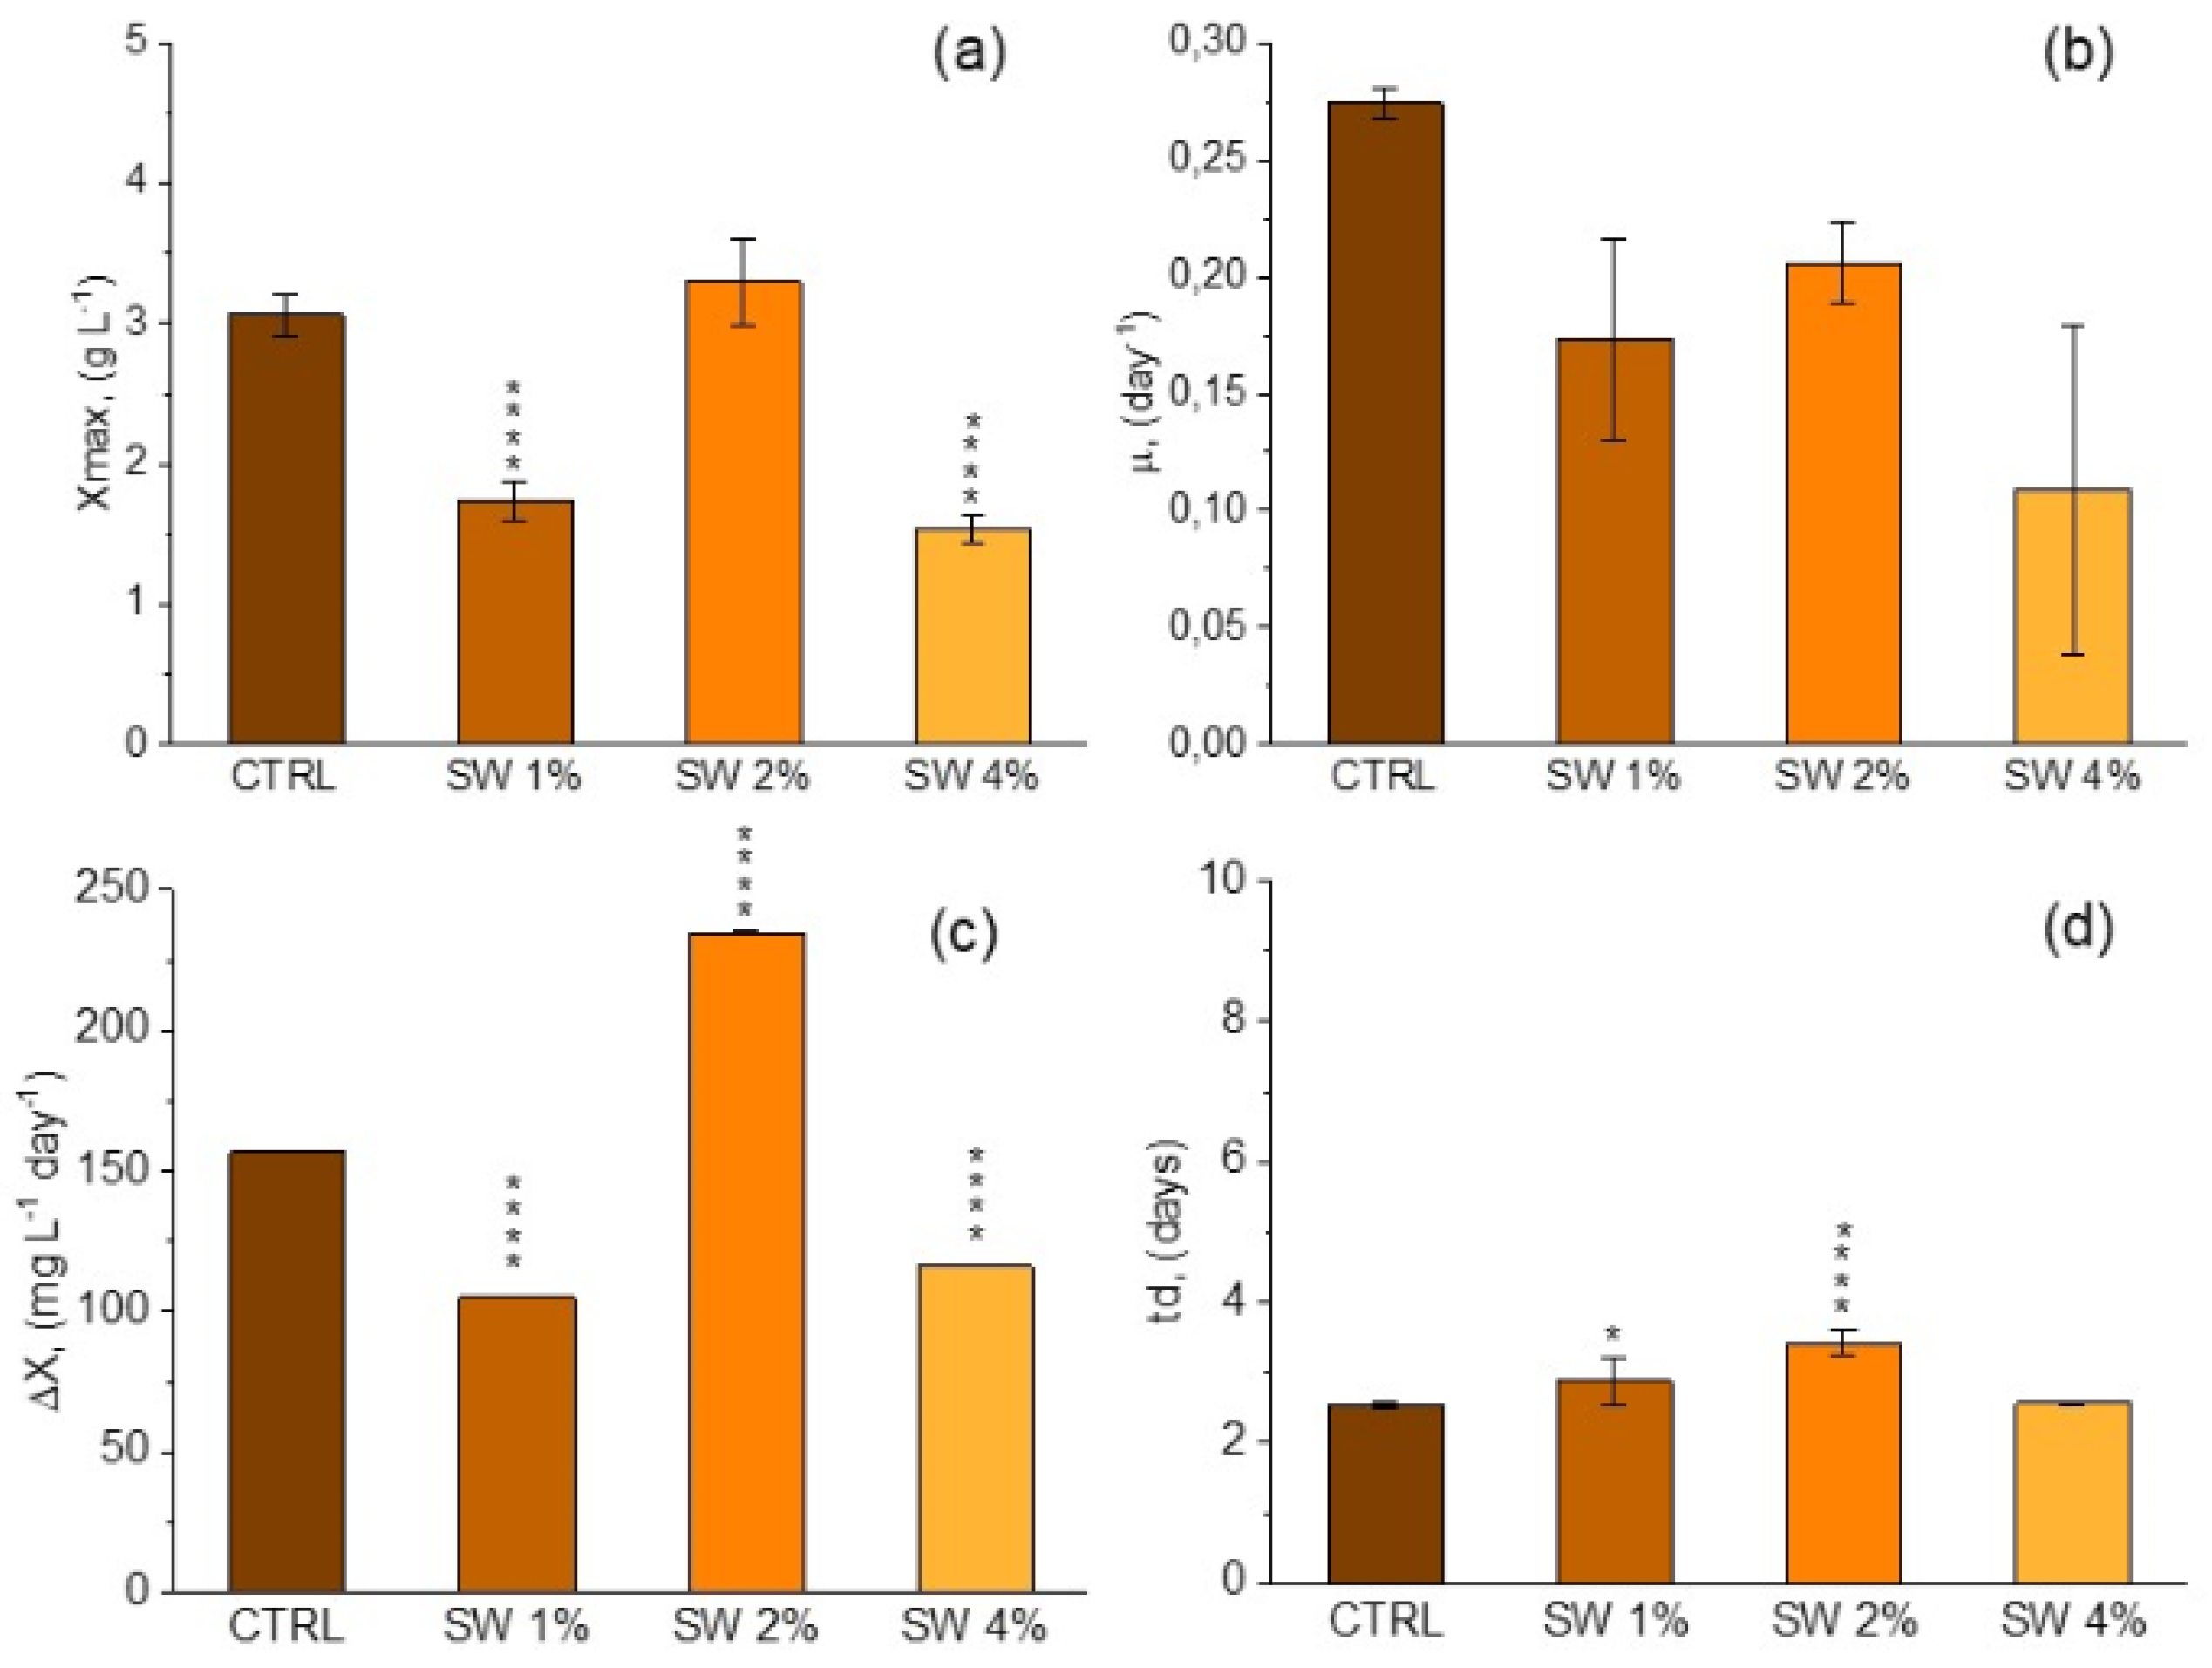
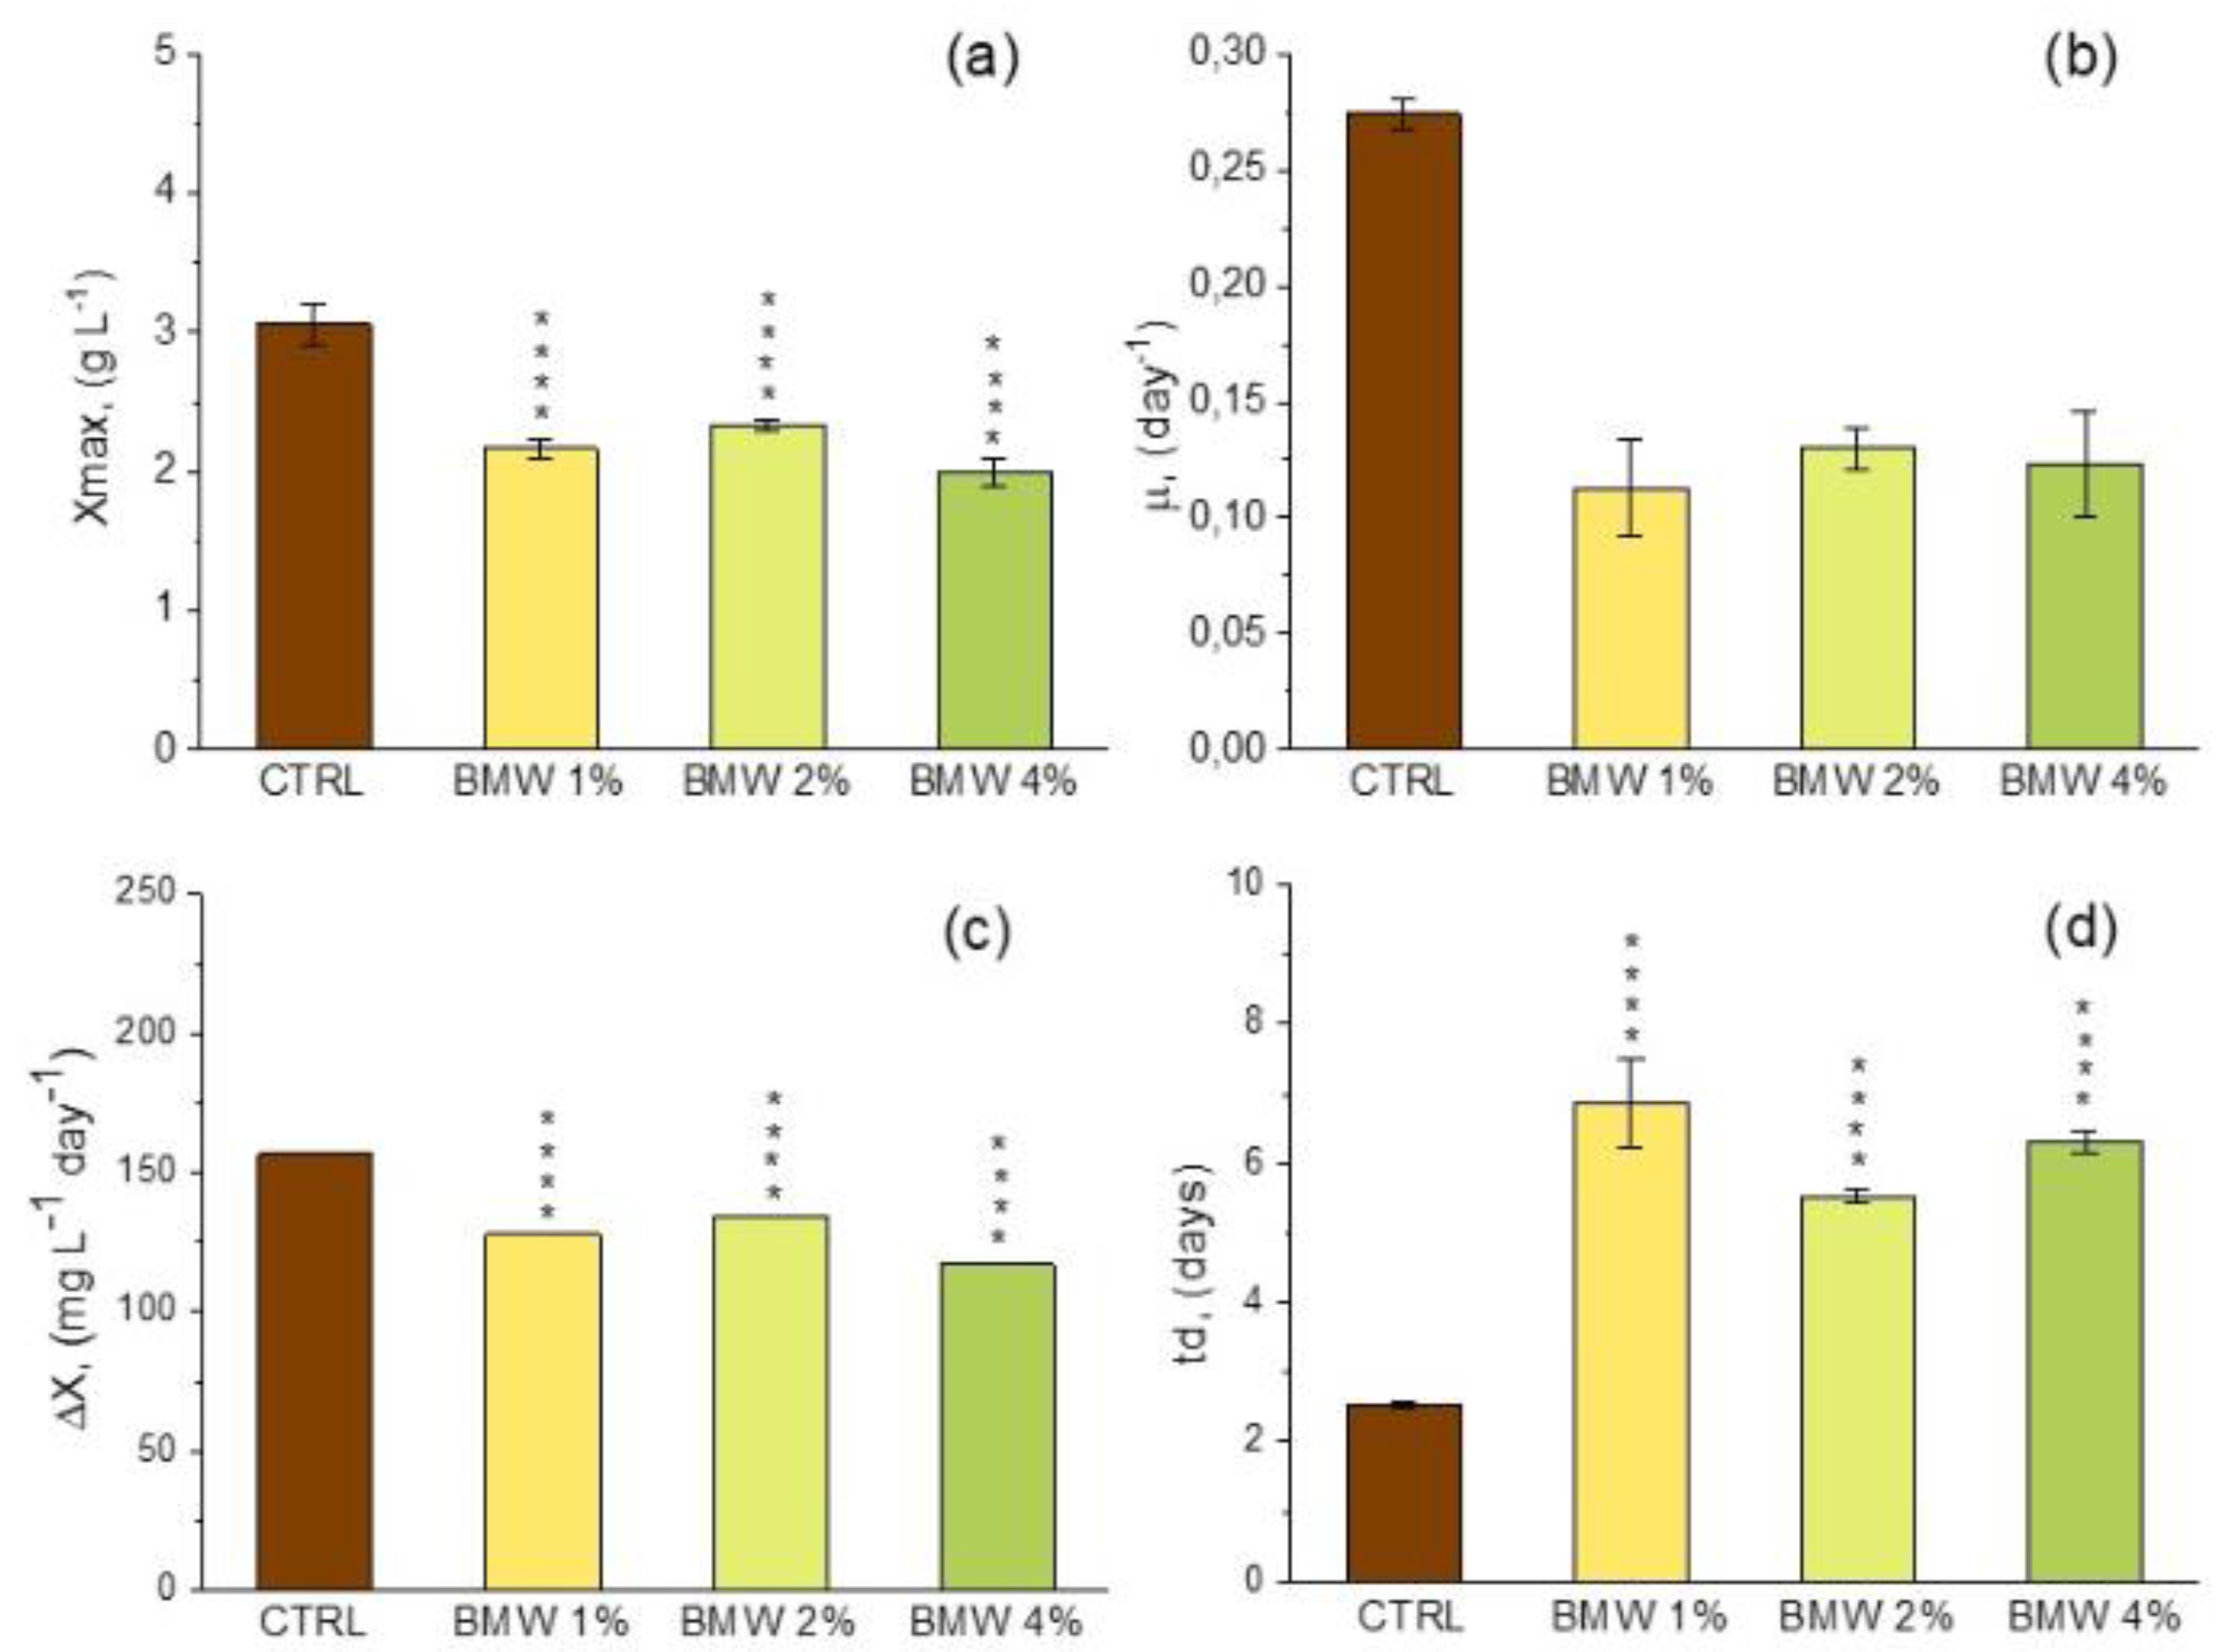
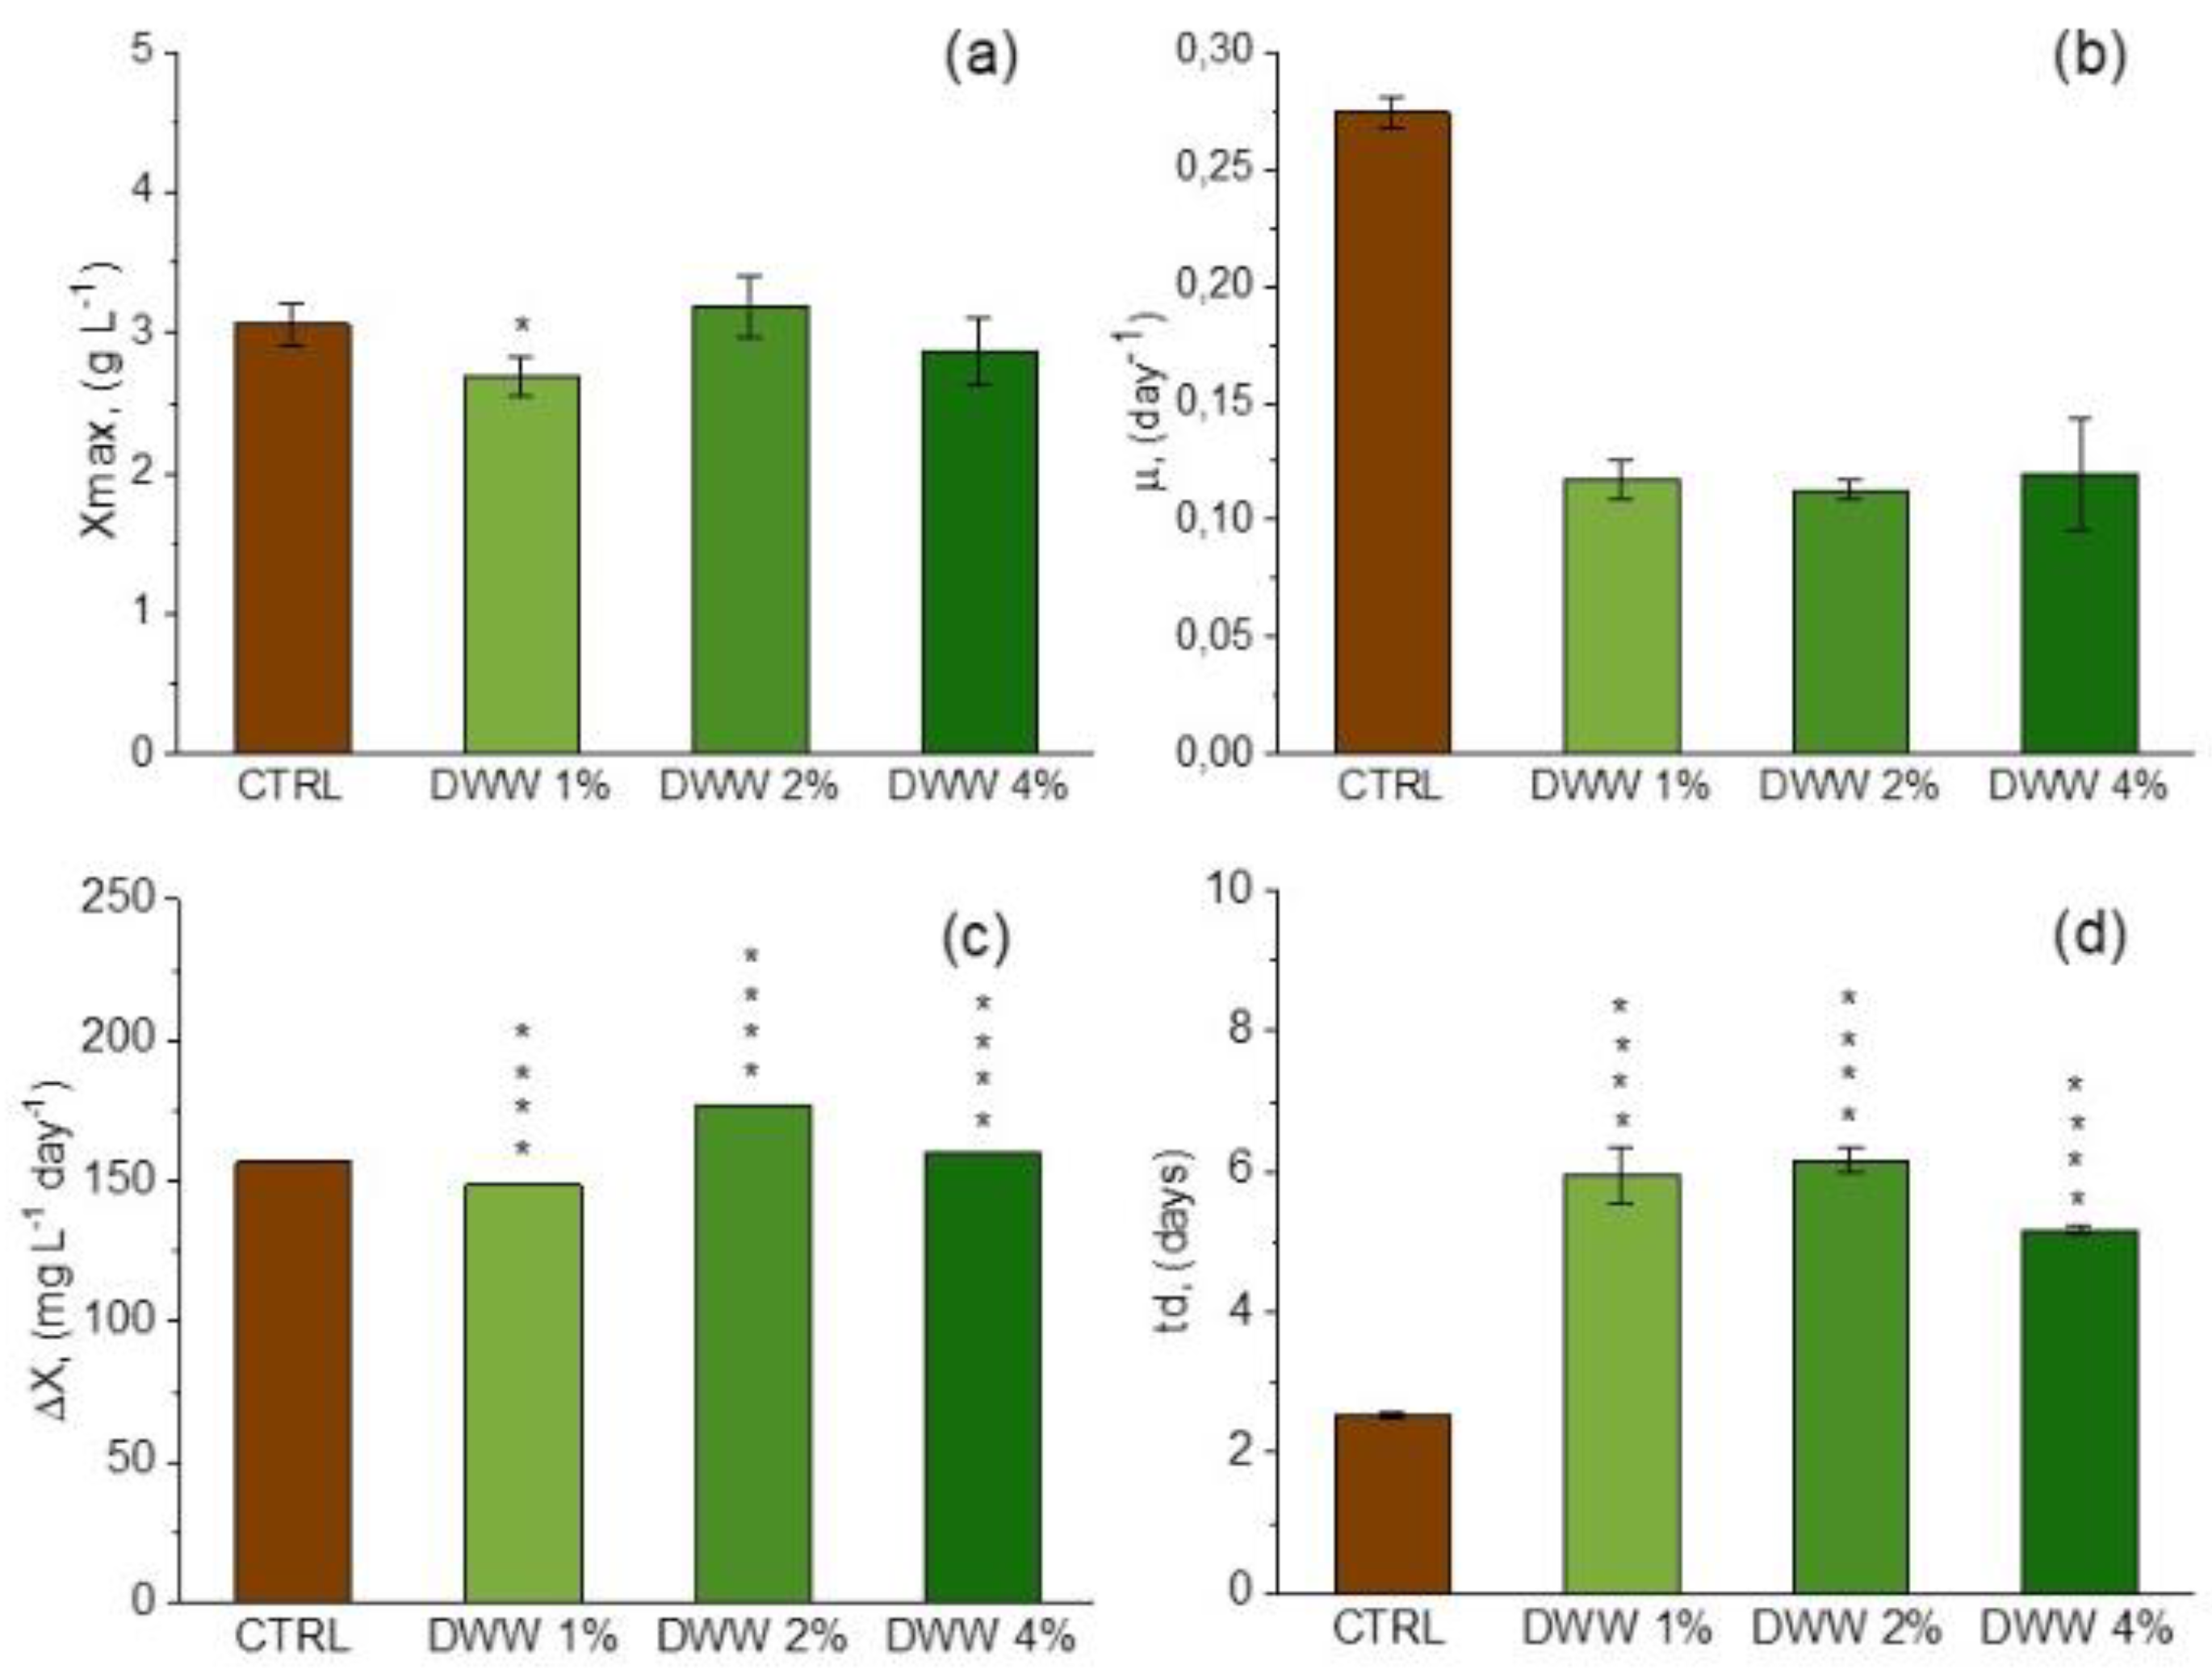
This study explores the mixotrophic cultivation of Arthrospira platensis using dairy byproducts, specifically scotta whey (SW), buttermilk wastewater (BMW), and dairy wastewater (DWW), to promote biomass production and enhance the composition of bioactive compounds. By assessing various concentrations (1%, 2%, and 4% v v-1) of these byproducts in a modified growth medium, the research aims to evaluate their effect on A. platensis growth, phycocyanin (C-PC) content, and fatty acid methyl ester (FAME) profiles. The results show that the optimal biomass production was achieved with 2% scotta and dairy wastewater, reaching maximum concentrations of 3.30 g L⁻¹ and 3.19 g L⁻¹, respectively. Mixotrophic cultivation led to increased C-PC yields, especially in buttermilk and dairy wastewater treatments, highlighting the potential for producing valuable pigments. Additionally, the FAME profiles indicated minimal changes compared to the control, with oleic and γ-linolenic acids being dominant in mixotrophic conditions. These findings support the viability of utilizing dairy byproducts for sustainable A. platensis cultivation, contributing to a circular bio-economy while producing bioactive compounds of nutritional and commercial interest.

Keywords: 
;  ;  ;  ;  ;  

1. Introduction

Microalgae are a valuable and abundant source of numerous biologically active compounds, such as proteins, lipids, carbohydrates, vitamins, pigments, enzymes, fatty acids (FAs), polyphenols, peptides, bioplastics and biofertilizers. These diverse substances hold significant potential for use in a wide range of industries [1,2]. These photosynthetic organisms are widely known for their potent antioxidant, immune-enhancing, antiviral, and antimicrobial properties, attributed to their bioactive compounds [3,4]. Antioxidants are essential for maintaining human health, as they help inhibit or reduce the oxidation of sensitive molecules, shielding the body from the damaging effects of free radicals [5]. Key antioxidant compounds found in microalgae include polyphenols, carotenoids (such as ß-carotene, astaxanthin, fucoxanthin, and lutein), polyunsaturated fatty acids (PUFAs), polysaccharides, and phycobiliproteins [1,6]. The lipid composition of microalgae is highly varied, with substantial research emphasizing their long-chain polyunsaturated fatty-acids (LC-PUFAs), particularly omega-3 FAs (ω3-PUFA) like docosahexaenoic acid (DHA, C22:6 ω3) and eicosapentaenoic acid (EPA, C20:5 ω3), which are renowned for their health-promoting properties. The production of EPA and DHA varies across microalgal species, depending on the type and cultivation conditions [7].
For over ten years, large-scale cultivation of various microalgae strains, including the cyanobacterium Spirulina sp., has been actively pursued, yielding protein-rich biomass known for its valuable bioactive and functional compounds [8,9]. The global nutraceutical market, valued USD 200.2 billion in 2017, is projected to grow at a 6.8% Compound Annual Growth rate (CAGR), reaching USD 317.3 billion by 2024 [10]. Based on this growth rate, the market is estimated to have reached USD 278.2 billion in 2022 and USD 297.1 billion in 2023. By 2029, the nutraceutical market is forecast to expand further to approximately USD 440.9 billion. These projections align with existing growth trends in the nutraceutical sector, driven by rising consumer interest in health and wellness products [11]. In the European market, microalgae are crucial to these industries, where species like Chlorella sp. and Spirulina are widely used as dietary supplements in the food sector due to their high levels of digestible protein, balanced amino acid profile, and abundant vitamins, polysaccharides, and PUFAs [12]. These microalgae species significantly boost the nutritional quality of food products and animal feed by providing essential nutrients and valuable bioactive extracts [13,14,15]. Recent research has highlighted the strong antioxidant properties of Spirulina platensis, demonstrated both in vivo [16] and in vitro [17,18], emphasizing its ability to reduce oxidative stress. Additionally, Spirulina extracts, particularly phycobiliproteins, have shown promising anticancer and anti-inflammatory properties [19]. Despite the vast industrial potential of microalgae, the high cultivation costs remain a barrier to widespread commercialization [20]. One promising approach is to integrate the production of high-value biomass with agro-industrial waste treatment, as microalgae can efficiently remove pollutants such as nitrogen (N), phosphorous (P) and organic carbon from wastewater (WW), helping to lower cultivation costs [21,22,23]. Mixotrophic cultivation, favored by the presence of organic sources found in agro-industrial wastes, enhance microalgae biomass production [24]. However, this method is prone to contamination, making closed, sterilized photobioreactors (PBRs) more suitable than open ponds [8]. Although more costly PBRs improve both biomass yield and the quality of microalgal biomass under mixotrophic conditions compared to autotrophic growth [9].
The dairy industry produces significant byproduct like scotta (SW), buttermilk (BMW), and residual dairy wastewater (DWW), residues generated during the production of various dairy goods including ricotta, butter, and general dairy processing [25,26]. Rich in lactose, which acts as a key carbon source, proteins and fats, these byproducts represent potential substrates for mixotrophic cultivation of microalgae [22,24]. Historically regarded as waste with environmental implications, these byproducts – especially DWW – pose challenges due to the large volumes generated, which often exceed four times that of processed milk [27]. Recent studies have shown that microalgae can be cultivated in mixotrophic cultures using dairy byproducts, providing essential nutrients and reducing the need for costly chemical supplements [28,29].
A. platensis was grown under mixotrophic conditions with varying concentrations of cheese whey [22]. At a concentration of 0.8% v v−1 of this effluent this cyanobacterium demonstrated accelerated growth, indicating its potential for rapid biomass production. Under these conditions, significantly higher levels of phycocyanin were produced compared to photoautotrophic conditions (3.52 mg mL−1 vs. 2.55 mg mL−1). The fatty acid methyl esters (FAME) profile in mixotrophic conditions showed only minor changes in FAs compared to the control. Notably mixotrophic cultivation led to an increase in the % of γ-linolenic fatty acid ω-6. Chlorella protothecoides was grown in ricotta cheese whey (scotta) to assess the viability of this dairy byproduct as a cost-effective substrate [30]. The mixotrophic cultures yielded greater biomass compared to the autotrophic ones; however, the latter exhibited higher cellular concentrations of chlorophyll and carotenoids. Nonetheless, the stress strategy implemented promoted carotenogenesis, facilitating the accumulation of astaxanthin and lutein/zeaxanthin. These findings indicate that by employing an appropriate stress strategy, it is possible to effectively regulate carotenogenesis, leading to the production of substantial quantities of valuable high-value compounds. Buttermilk was utilized as a carbon source to investigate the growth of the polyextremophile red microalga Galdieria sulphuraria under mixotrophyc and heterotrophyc conditions in laboratory-scale flasks and a 13 L photobioreactor [31]. Experiments conducted in flasks under mixotrophic conditions with varying dilutions of buttermilk indicated that a dilution ratio of 40% v v-1 was optimal for biomass production. When G. sulphuraria was cultivated at this optimal dilution in a 13 L photobioreactor, the highest biomass productivity of 0.55 g L−1 d−1 was achieved under mixotrophic conditions. This study overall highlights the potential of lactose-containing substrates, such as buttermilk, as effective growth medium of microalgae while revalorizing an industrial effluent.
Considering the large-scale production of dairy byproducts and their potential environmental consequences, as well as the high market demand for phycobiliproteins in nutraceutical and pharmaceutical industries, this study seeks to investigate the production of phycobiliproteins and lipids from A. platensis cultivated under mixotrophic conditions using different concentrations of scotta, buttermilk, and residual DWW.

2. Materials and Methods

2.1. Inoculums and Culture Media Preparation

The Arthrospira platensis strain SAG 21.99 used in this research was sourced from the culture collection of algae at the Gottingen University, Germany [32]. The cells were cultivated in a modified Jourdan Medium (JM), with the following composition per liter: 5 g NaHCO3; 1.6 g KOH, 5 g NaNO3; 0.027 g CaCl2·2H2O g; 0.4 g K2SO4, 2 g K2HPO4; 1 g NaCl; 0.4 g MgSO4·7H2O; 0.16 g EDTA-Na2; 0.01 g FeSO4·7H2O; and 1 mL of Trace elements. The Trace elements solution was prepared per liter with: 250 mg EDTA-Na2; 57 mg H3BO3; 110 mg ZnSO4·7H2O; 25.3 mg MnCl2·4H2O; 8.05 mg CoCl2·6H2O; 7.85 mg CuSO4·5H2O; 5.5 mg Mo7O24 (NH4)6·4H2O. The original JM formulation is referenced in Jourdan [33]. For cultivation, 150 ml Erlenmeyer flasks were filled with 50 ml of JM medium, inoculated with 10 ml of microalgae, and covered with cotton caps. The culture were illuminated continuously at room temperature using white fluorescent lamps (Model T8 36 W IP20, CMI, Germany) with a light intensity of 50 µmol m-2 s-1, measured by a luxmeter (Model HD 2302.0, Delta OHM, Padua, Italy). The inoculum was cultivated for around one week until the late exponential growth phase before used for the experiments. Cheese whey (CW) samples were obtained from MAIL Industria Casearia, a dairy facility in Bellizzi, SA, Italy. The main chemical and physical parameters of the CW are detailed in Table 1. After collection, the CW was stored at 4 ºC, filtered using glass microfiber filters (GF/CTM 47 mm diameter, Whatman, Incofar Srl, Modena, MO, Italy) to remove solids, and sterilized at 121 ºC and 0.1 MPa for 20 min before use in microalgae cultivation.

2.2. Cultivation Conditions and Experimental Setup

Spirulina was cultivated in 1L flasks (thereafter named PBRs) with a working volume of 600 mL. Each PBR was covered with a cotton cup, and filtered compressed air (containing 0.03% CO2 v v-1) was supplied using an air pump (GIS Air Compressor, Carpi, MO, Italy). The PBRs were manually shaken daily at room temperature and exposed to a 12 h light / 12 h dark photoperiod using white fluorescent lamps that provided a light intensity of 50 µmol m-2 s-1. Growth tests were conducted to assess cell growth, biomass production, and phicobiliproteins (PBPs) according to the experimental setup outlined in Table 2. Three types of CW were tested in the experiments: scotta whey (SW), buttermilk wastewater (BMW), and final dairy wastewater (DWW). For each type of CW, three different concentrations (1%, 2%, and 4%) were evaluated, with JM serving as the control. All tests were performed in triplicate over 18-day period. Microalgal growth was monitored by measuring optical density and biomass concentration. After cultivation, the final dry weight (g L-1) and PBPs content (mg g-1DW) were determined. In all the experiments, the initial inoculum concentration was set as 0.1 g L-1.

2.3. Cell Growth and Dry Weight Determination

The growth of A. platensis was tracked by measuring the absorbance (ABS) of the culture at 680 nm using a spectrophotometer (model ONDA V30 SCAN – UV VIS, ZetaLab, Padua, Italy). A regression equation correlating the dried biomass concentration with ABS was determined. The dry biomass concentration was assessed gravimetrically through the following steps: a) a 10 mL sample of culture (V) was taken from the PBRs, b) the sample was filtered through a pre-weighted (W1) glass microfiber filter (GF/CTM 55 mm diameter, Whatman, Incofar Srl., Modena, Italy), and the biomass retained on the filter was dried at 105 °C overnight until a constant weight (W2) was achieved, c) the filter paper had been previously dried in a forced-air oven (model 30, Memmert Gmbh, Scwabach, Germany) at 105 °C for 2 h, then cooled in a desiccator to room temperature, and weighed using an analytical balance (model M, Bel Engineering Srl, Monza, MI, Italy).
The cell concentration (dry weight), Xdw (g L−1), was calculated using the following formula:
Xdw = (W2 - W1) / V
where, W = weight (g) of dried algal biomass, and V = volume (L) of the algae culture used for the test.
The average biomass productivity (∆X) was expressed as:
(∆X) = max Xdw / tmax
where, max Xmax = maximum biomass (g L−1) obtained at (tmax).
The specific growth rate (μ) was calculated according to the following equation:
μ = (ln X2 − ln X1) / (t2 − t1)
where, X2 and X1 = dry biomass concentration (g L−1) at time t2 and t1, respectively.
The pH of culture suspensions was measured by a pHmeter (model HI 2210, Hanna Instruments, Woonsocket, RI, USA).

2.4. Phycobilinproteins Extraction and Spectrophotometric Determination

The extraction of PBPs was performed using an aqueous saline solution as described by Herrera et al. [34]. Specifically, 10 g of frozen A. platensis biomass was placed in 50 mL of an aqueous buffer solution containing 1% calcium dichloride (10 g L-1), and subjected to repeated freezing and thawing until complete cell disruption occurred break. The mixture was stirred for 30 to 45 min. This extraction process was repeated twice, and the resulting phycobilin solution was separated by centrifugation at 8000 rpm for 10-15 min. The blue supernatant obtained was then used for optical measurement using a spectrophotometer. The concentration of different PBPs, including C-phycocyanin (PC), allophycocyanin (APC), and phycoerythrin (PE), were determined by measuring the absorbance of the extract at three specific wavelengths: 565nm, 620nm and 650nm.
The concentration of these PBPs, as mg ml-1 extract, was then determined from the equations established by Bryant et al. [35].
[ PC ] = A 620 0,72 A 652 6,29
[ APC ] = A 652 0,191 A 620 5,79
[ PE ] = A 565 2 , 41 P C 1 , 40 [ A P C ] 13 , 02
The concentration of total PBPs was determined as the sum of PE, PC, and APC in mg ml-1 of the extracted supernatant as follows:
[PBPs] = [PC] + [APC] + [PE]
The extraction yield, estimated by relating the concentrations (expressed in terms of mg ml-1) to the biomass of A. platensis used (in terms of mg of dry weight), was obtained as follows:
PBP = ([PBPs] (mg ml-1 of extract) * volume of extract)) / wet biomass * 10%
The pycocyanins (PC and APC) purity was calculated according to the following equations:
PC Purity = A620 / A280
APC Purity = A650 / A280

2.5. FAMEs and Healthy Parameters Determination

The analysis of fatty acids methyl ester (FAME) profile in this study followed the method outlined by Breuer et al. [36]. Briefly, 10 mg of lyophilized biomass were weighted into a glass tube and suspended in 4 mL mixture of methanol/chloroform mixture (4:5 v v-1) containing the internal standard tritridecanoin (TAG 39:0, 13:0/13:0/13:0) at a concentration of 50 mg L-1. The samples underwent eight rounds of vortexing for 60 sec each, followed by 15 min of sonication in an ultrasonic bath at 5 °C. Afterward, 2.5 ml of MilliQ water containing 50 mM of 2-Amino-2-hydroxymethyl-propane-1,3-diol (Tris) and 1 M NaCl (pH adjusted to 7.0 with HCl) were added, and the samples were sonicated for an additional 10 min at 5 °C. The mixture was then centrifuged at 177 rcf for 10 min at 5 °C, and the chloroform phase was carefully transferred to a glass tube. The remaining sample was re-extracted with 1 mL of chloroform, sonicated for another 10 min at 5 °C, and centrifuged again. The collected chloroform phases were combined and dried under a gentle N stream. To obtain FAMEs, FAs were trans-esterified by adding 3 ml of methanol containing 5% sulfuric acid (v v-1) to the tube containing the dried lipids. The samples were incubated for 3 h at 70 °C, then cooled. After cooling, 3 mL of MilliQ and 3 mL of n-hexane were added. The samples were vortexed three times for 1 min every 10 min over a 30-min period and centrifuged at 177 rcf for 10 min at 5 °C. For each sample, 2 mL of the hexane phase was collected and washed twice with 2 mL of MilliQ water. The hexane phase containing FAMEs was transferred into glass vials tube for GC-MS analysis. The analysis was performed using a gas chromatography Trace 1300 system equipped with a triple quadrupole mass spectrometer (TSQ 9000), a fused silica capillary column (Agilent HP-5, 30 m x 0.32 i.d, 0.25 μm film thickness), and an automatic sampler (AI 1310) with a split-splitless injector (Waltham, Massachusetts, USA). The injector was set at 250 °C, and helium was used as the carrier gas at a flow rate of 1.5 mL min-1. The oven temperature was programmed as follows: 50 °C for 1 min, then ramped to 175 °C at 10 °C min-1, held at 175 °C for 10 min, increased to 210 °C at 5 °C min-1, held at 210 °C for 10 min, then increased to 230 °C at 5 °C min-1, held at 230 °C for 9.5 min, and finally increased to 300 °C at 10 °C min-1. Samples were injected in split mode (0.4 μL) with a split ratio of 1:20. The transfer line and ion source temperatures were set at 250 °C and 300 °C, respectively. Electron ionization was performed at 70 eV, and ions were detected at 1.5 scans s-1 over the mass range m z-1 50 to 550. Peak identification was based on the comparison of retention time with the Supelco 37 component FAME Mix (Sigma Aldrich). The data are expressed as a mg g-1 of dry weight (mean ± standard deviation) and were calculated using the equation provided by Breuer et al. [36]:
F A m g g = I S   a d d e d ( A r e a   o f   i n d i v i d u a l   F A M E ) ( A r e a   o f   C 13 : 0 F A M E R e l . R e s p . F a c t o r   i n d i v i d u a l   F A M E ) g   o f   b i o m a s s   a d d e d
The relative abundance of each FA was calculated by dividing the concentration of each FA by the total FA content.
Based on the unsaturated FAs, the atherogenic (AI), thrombogenic (TI) and hypocholesterolemic/hypercholesterolemic indexes (h/H) werecalculated.
AI and TI were obtained using the formula proposed by [37], as follows:
AI = [C12:0 + 4] x [(C14:0 + C16:0] / [∑MUFA + ∑(n – 6) + (n – 3)]
TI = [C14:0 + C16:0 + C18:0] / [0.5 x ∑MUFA + 0.5 x ∑(n – 6) + 3 x ∑(n – 3)] + (∑(n – 6)/ ∑(n – 3)]
The h/H ratio was calculated according to the equation suggested by Fernandez et al. [38]:
h/H = [(Σ (C18:1n - 9, C18:1n - 7, C18:2n - 6, C18:3n - 6, C18:3n - 3, C20:3n - 6,C20:4n - 6, C20:5n - 3, C22:4n - 6, C22:5n - 3 and C22:6n - 3) / Σ (C14:0 and C16:0)].

2.6. Statistical Analysis

Each experimental condition was examined in triplicate. Statistical analysis on biomass, specific growth rate, and FAME profile was conducted using MetaboAnalysts 5.0 platform, developed by the McGill University, Montreal, Canada. Differences between groups was assessed through one-way analysis of variance (ANOVA), followed by Tukey’s Honestly Significance Different (HSD) test. Results were considered statistically significant at 95% confidence level, with a probability threshold of 0.05.

3. Results

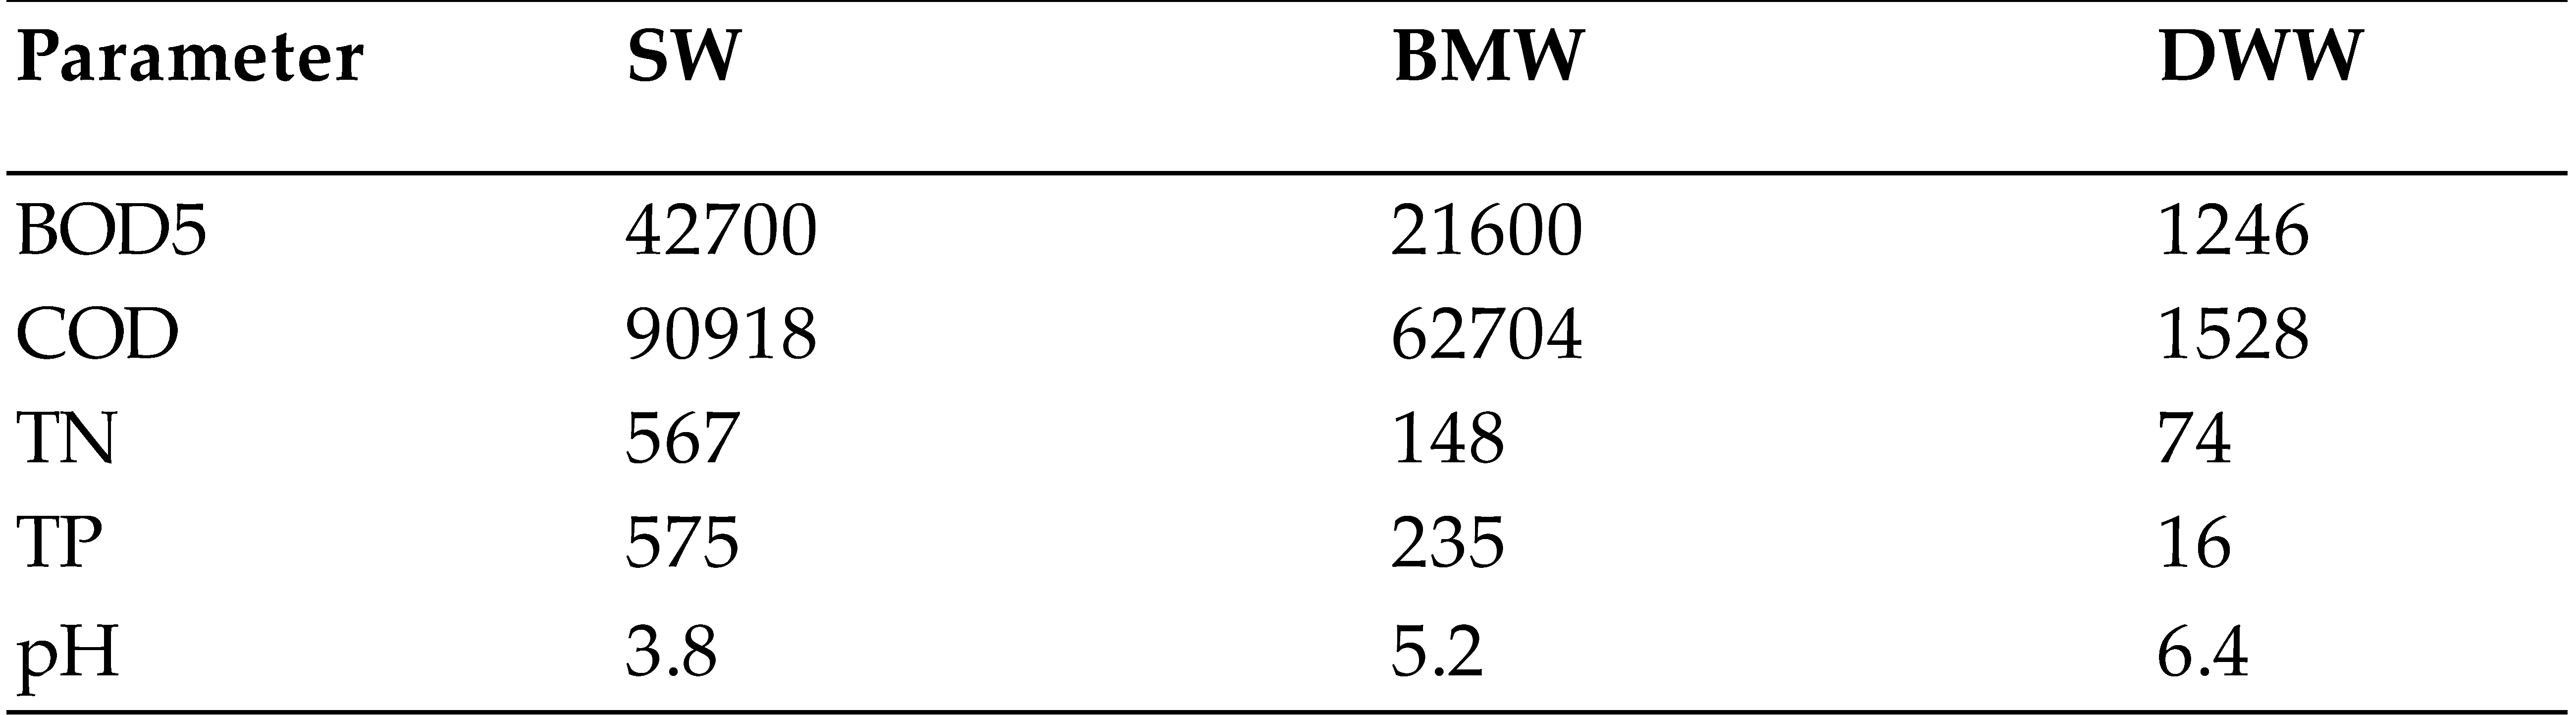
3.1. Cheese Effluents Composition

Cheese whey (CW), also known as ricotta cheese or scotta, is a thin and watery white to yellow/green opalescent liquid obtained during the cheese-making process by coagulating and separating casein proteins from milk. The composition of CW vary based on its type (acid or sweet), the milk source (cow, sheep, bovine, buffalo milk etc), the animal’s feed, cheese processing methods, the time of the year, and the lactation stage [39]. CW contains suspended solids and can comprise roughly 55% of the nutrients found in milk, making it a by-products rich in organic matter and exhibiting substantial potential for mixotrophic and heterotrophic microalgae cultivation. Lactose represents nearly 75% of the total solid percentage in whey, serving as the primary source of available carbon, complemented by the presence of proteins and fats in smaller proportion [25]. SW proteins, such as β-lactoglobulin, α-lactalbumin, immunoglobulins and serum albumin, have an amino acid composition distinct from caseins, primarily due to their higher levels of sulphur-containing amino acids. These amino acids not only act as precursors to the antioxidant glutathione but also play a role in supporting metabolic health in animals. The elevated presence of these amino acids in SCW proteins compared to caseins could have important nutritional implications [40].
Despite milk being a nutritional source, providing energy through carbohydrates (mainly in terms of lactose), N from proteins, and a rich calcium content, it’s noteworthy that whey was historically considered waste. SW, due to its high organic load, exhibit much higher levels of Biochemical Oxygen Demand (BOD) and Chemical Oxygen Demand (COD) compared to urban WW. As a result, it presents an environmental challenge and creates a significant cost burden for cheese production facilities when it comes to disposal [40]. It was commonly discarded, used as fertilizer by spraying on fields, or, alternatively, dried into CW powder for animal feed applications. Table 1 presents the fundamental physical-chemical characteristics of the three CW utilized in this work: the scotta (SW) that is the effluent resulting from the production of ricotta, the buttermilk effluent (BMW) typically generated by butter or cream production, and the final dairy wastewater (DWW). It can be inferred how the loads of organic matter in terms of organic carbon were consistent in SW (BOD5 > 43 g L-1 and COD > 91 g L-1), being this effluent obtained from the first step of cheese making, therefore still retaining most of its original charge of organic matter. On the other hand, BMW and DWW, which represent subsequent steps of the dairy process, are characterized by a progressive pauperization of carbon content. Similarly, also the N and P content was progressively reduced according to the extent of cheese effluent treatment. It should be considered that, despite cheese effluents may exhibit different chemical compositions, based on the technological steps employed for manufacturing dairy products, these effluents are usually characterized by the presence of d-Lactose, soluble proteins, lipids and salts able to sustain microalgae growth [30]. Their typical organic content, in terms of BOD and COD, can vary from 0.1 to 100 g L-1 [41]. As reference of their rich organic loads, 1 kg of lactose, protein, and fat corresponds to 1.13, 1, and 3 kg of COD, respectively [42]. A common procedure to allow microalgae growth inside a culture medium with a huge organic content, such that of a DWW, is its physical and chemical pre-treatment [43]. The decision to employ extremely low whey concentrations (cfr. Table 2) was influenced by the elevated TOC content in this effluent. Previous research has indicated that the ideal concentration of CW for mixotrophic cultivation of microalgae is 3.0% v v-1, whit higher concentrations (ranging from 5 to 100% v v-1) leading to suboptimal conditions for cells growth and to inhibition [29]. In similar studies, Salla et al. [44] investigated CW concentrations ranging from 1.25 to 2.5% to support Spirulina growth, while Pereira et al. [45] demonstrated that S. platensis can thrive in Zarrouk's medium supplemented with 2.5% to 10% CW, with the 2.5% concentration particularly effective for biomass productivity, and with higher concentrations (5% and 10%) reducing protein synthesis and growth. Furthermore, when analyzing the N:P molar ratio in CW, based on TN and TP values in SW and BMW (excluding DWW), it was found to be significantly lower than the approximately 5:1 ratio reported for DWWs by Gramegna et al. [46] and for CW by Kiani et al. [47]. Additionally, this ratio falls below the Redfield ratio (N:P of 16:1), indicating that CW acts as a N-limited medium for microalgae growth.

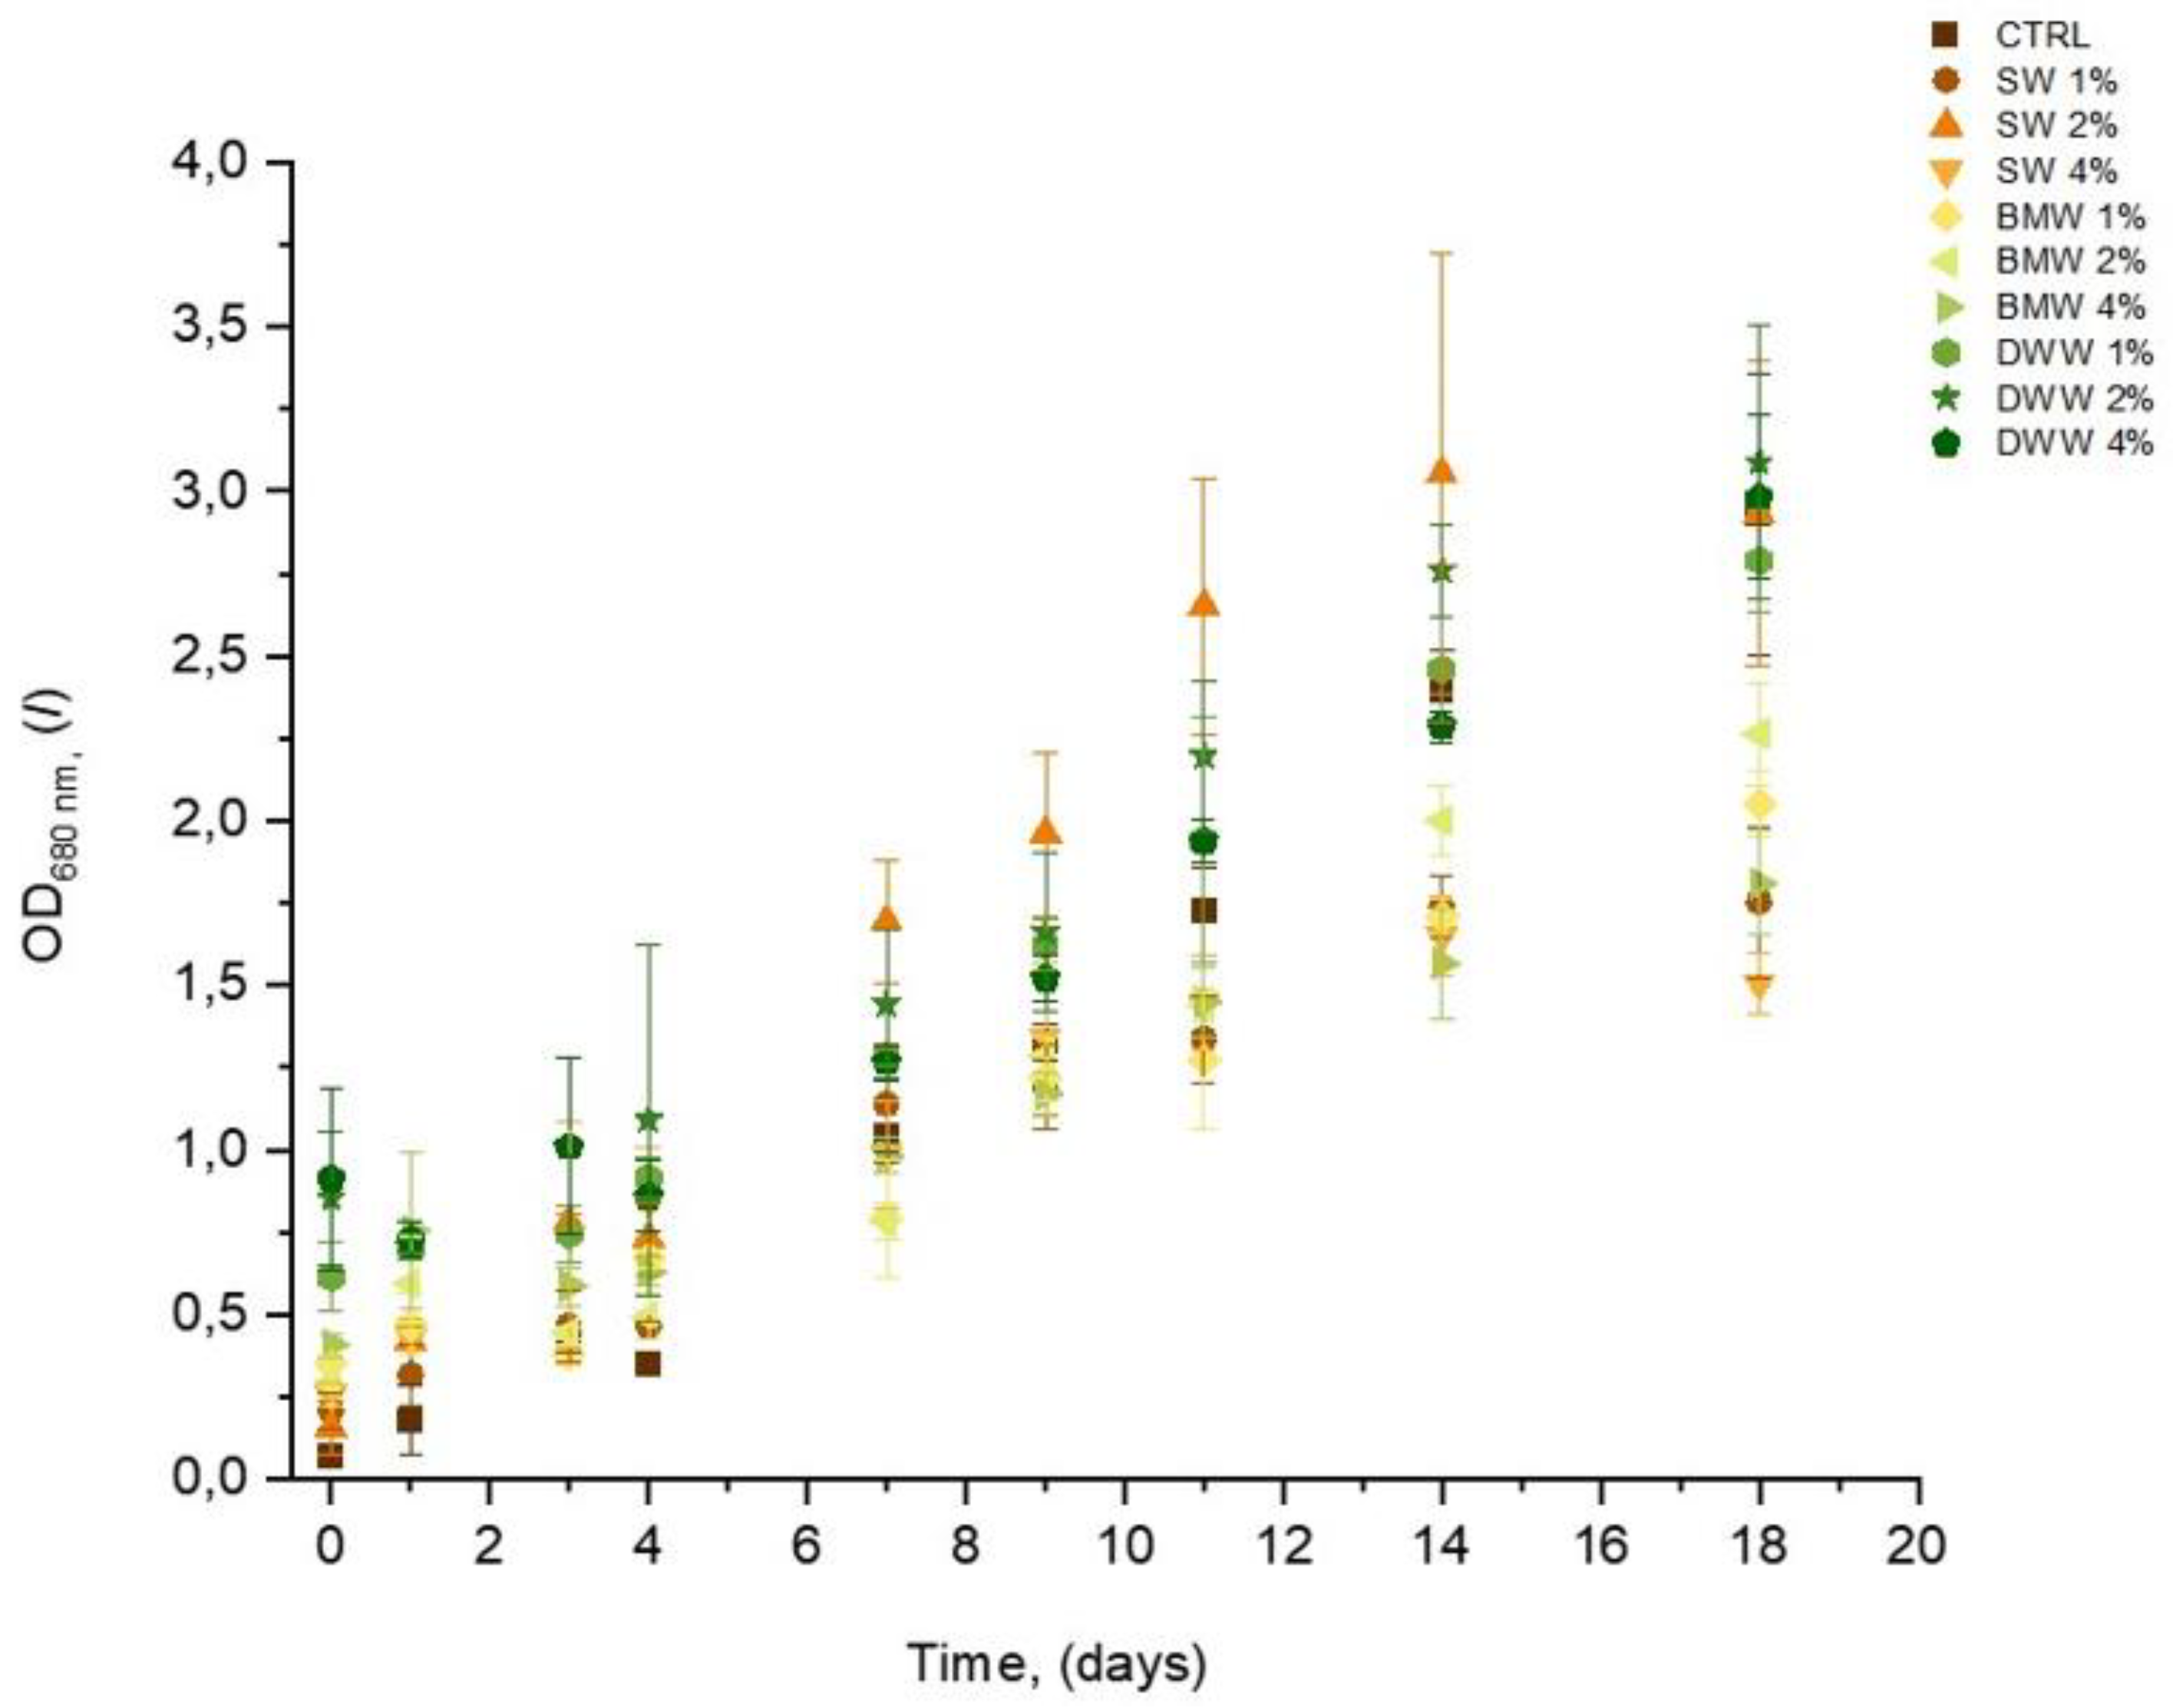
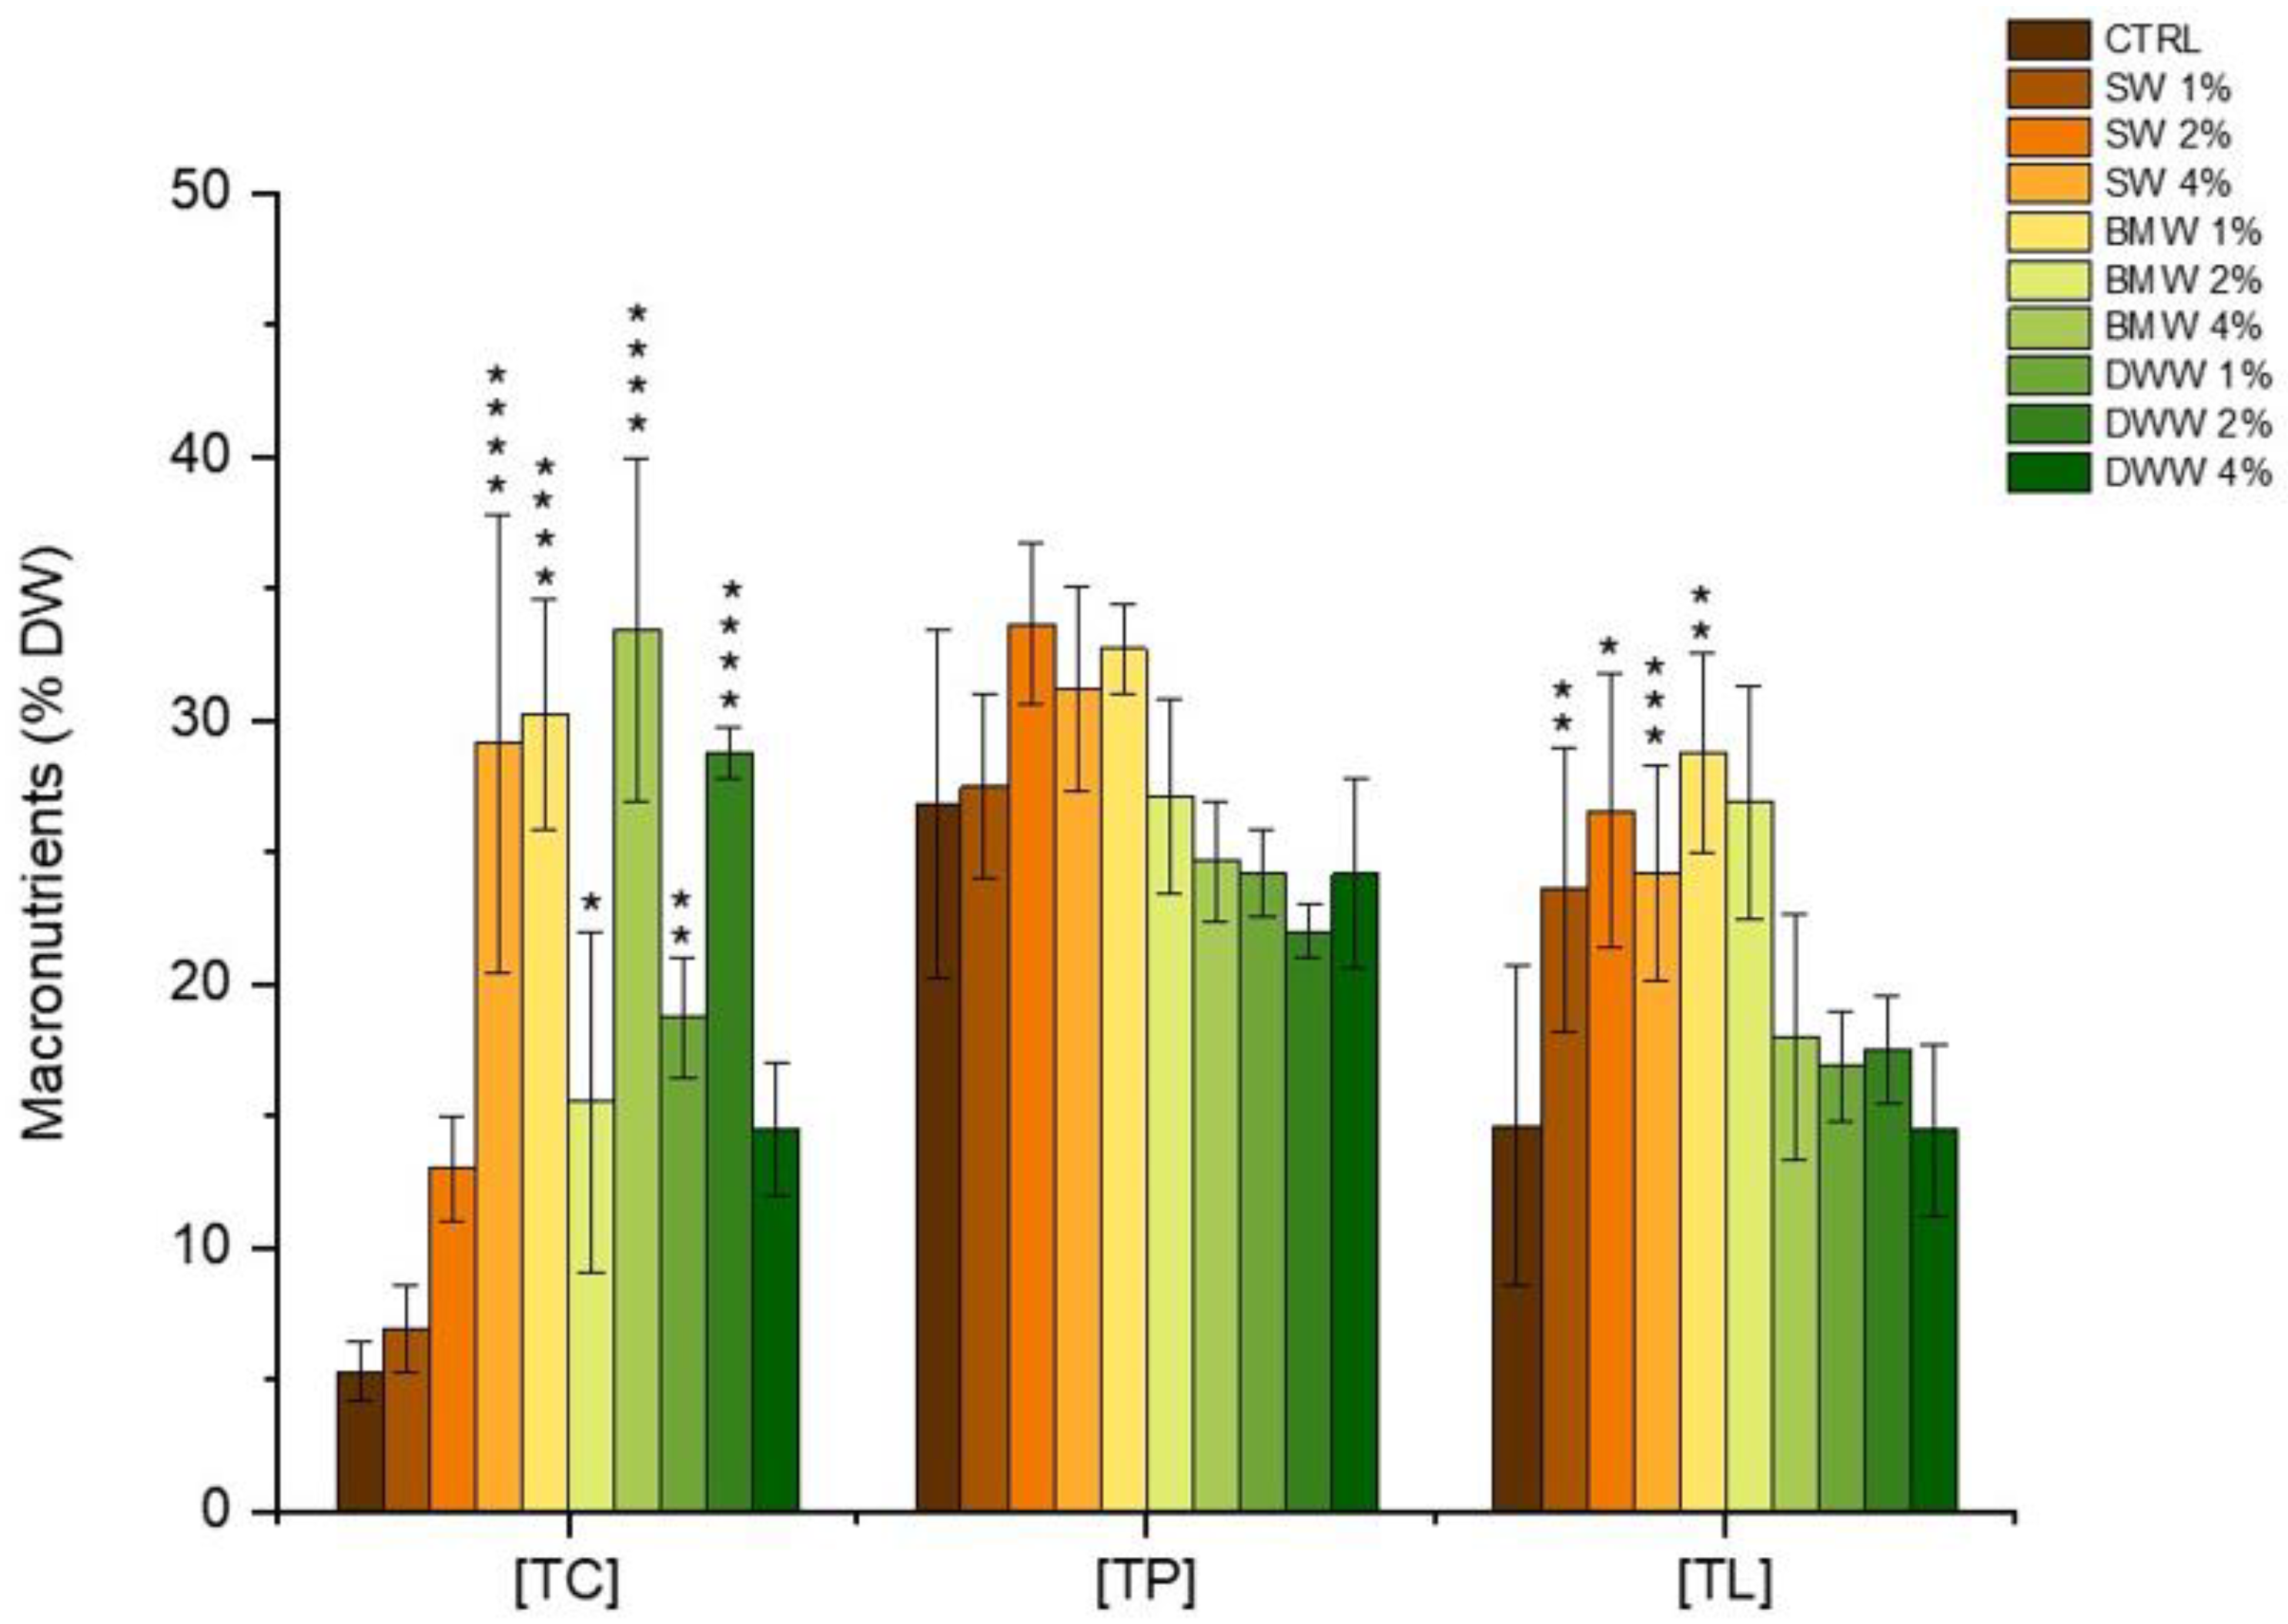
3.2. Growth Profile and Biomass Composition of A. platensis Using CW

A. platensis was cultivated under both photoautotrophic and mixotrophic conditions using CW as an organic substrate. Three distinct cheese effluents, varying in their organic carbon and CW content (refer to Table 1), were utilized for the experiments. A. platensis was grown in three different concentrations of each of effluent, ranging from 1 to 4 v v-1, over a period of 18 days until it reached the early stationary growth phase. The objective of this study was to evaluate essential kinetic parameters, including maximum biomass concentration (Xmax), average biomass productivity (∆X), doubling time (td), and specific growth rate (µ).
Figure 1 illustrates the growth curves of A. platensis under both mixotrophic and photoautotrophic (CTRL) conditions. In all the mixotrophic systems, a lag phase persisted at approximately 72 to 96 hours, whereas no lag phase was evident in the CTRL conditions. A similar trend was reported in previous studies involving the cultivation of A. platensis [45] and of Chlorella vulgaris [48] using CW.
In our study, the extended adaptation phase was mainly attributed to the time needed by A. platensis to adjust to the now growth conditions represented by the addition of CW to the CTRL. It is important to note that CW content in the three effluents varies based on the cheese processing stage, with the % of CW being most stable in SW and gradually decreasing in BMW and DWW. Acclimation is a crucial stage in the adaptation of cyanobacteria and significantly influences the overall performance of the culture. Following this phase, the exponential growth phase across all samples lasted up to 14 days, displaying different growth patterns. Around the midpoint of the cultivation period (9 days), all systems recorded OD680nm ranging from 1 to 2. By the end of the cultivation period, the DWW-2% and DWW-4% systems surpassed the control, with DWW-2% system continuing to show increasing OD values of the 18th day.
Figure 2 illustrates the four key kinetic parameters measured during the cultivation of A. platensis with the addition of scotta whey to JM. The maximum biomass concentration reached 3.30 g L-1 with SW-2%, which was comparable to the control (CTRL) at 3.06 g L-1 and nearly double that of SW-1% (1.74 g L-1) and SW-4% (1.54 g L-1) (Figure 2a).
In Figure 2b, it is evident that the specific growth rate for the three SW systems (ranging from 0.11 to 0.21 day) were lower than that of the CTRL (0.27 day). Furthermore, SW-2% exhibited the highest average biomass productivity at 235 mg L-1 day-1, representing over a 50% increase compared to SW-1% (105 mg L-1 day-1) and SW-4% (116 mg L-1 day-1), as shown in Figure 2c.
As the CW content decreased in BMW (see Figure 3) and more significantly in DWW (see Figure 4), three of the four kinetic parameters, including µ, ΔX, and td, showed inconsistent effects. Conversely, Xmax achieved higher values than those recorded with SW, except for SW-2%. Utilizing buttermilk as an organic carbon source, the highest Xmax of 2.33 g L-1 was attained with BMW-2% (Figure 3a), while µ were in the range of 0.11 to 0.12 day (Figure 3b), and ΔX ranged from 117 to 128 mg L-1 day-1 (Figure 3c). A similar trend was noted when A. platensis was cultivated in DWW, with the highest Xmax of 3.19 g L-1 achieved with DWW-2% (Figure 4a). In this organic effluent, Xmax values exceeded 2.5 g L-1, specifically 2.69 g L-1 for DWW-1% and 2.87 g L-1 for DWW-4%. µ displayed a similar trend as observed in BMW (Figure 4b), while ΔX demonstrated an improved range of 149 to 177 mg L-1 day-1 (Figure 4c).
The impact of mixotrophc conditions on the biomass composition of A. platensis regarding macronutrients, such as total carbohydrates (TC), total proteins (TP) and total lipids (TP), is illustrated in Figure 5. The distinct characteristics of the three CW effluents, particularly in terms of organic load and composition, appear to significantly influence the TC component, while the effect on TL is less pronounced. Conversely, variations in TP among the three mixotrophic systems are more consistent. TP constitutes the largest fraction, followed by TL and TC in both photoautothropic and mixotrophic conditions. Specifically, under mixotrophy, TP ranged from 22% in DWW-2% to 33.63% in SW-2%, compared to the control (CTRL) at 26.80%. Regarding the TL component, A. platensis grown in SW and BMW systems demonstrated higher TL values compared to the CTRL and DWW systems. Notably, BMW-1% and BMW-2% recorded TL values of 28.79% and 26.89%, respectively, while TL in SW systems ranged from 23.58% to 26.55%, compared to the CTRL value of 14.63%.
The distribution of TC displayed a contrasting trend across the three mixotrophic systems, with values ranging from 6.95% to 33.41%, but following different patterns. In SW the highest TC content was observed with 4% of CW (29.11%), whereas in BMW and DWW, the peak occurred with 4% CW (33.41%) and with 2% CW (28.46%). In all three mixotrophic systems, the lowest TC values were higher than the control, with SW-1% only slightly higher (6.95%), and BMW-2% (15.53%) and DWW-4% (14.50%) three times higher compared to the control (5.31%).
This macronutrients distribution, particularly the elevated lipid fraction and the low carbohydrates fraction as for the SW systems, deviates significantly from the typical chemical composition of A. platensis, which generally comprises 15–25% carbohydrates, 55–70% proteins, and 4–7% lipids, as reported by to Markou et al. [49]. Growth conditions, whether batch or continuous, affect not only microalgae growth and biomass productivity but also their biochemical composition [50]. Under mixotrophic conditions, compared to photoautothropy, a substantial shift in proteins and lipids composition was observed. The addition of CW from three different sources led to an increase in terms of TC, TP, and TL even though in a different extent and with a different behavior based on the organic source. SW and BWM produced an increase in all the three component compared to the control. Conversely, the inclusion of CW in DWW caused a notable increase in TC, but slightly reduced TP fraction and increased TL fraction, respectively.

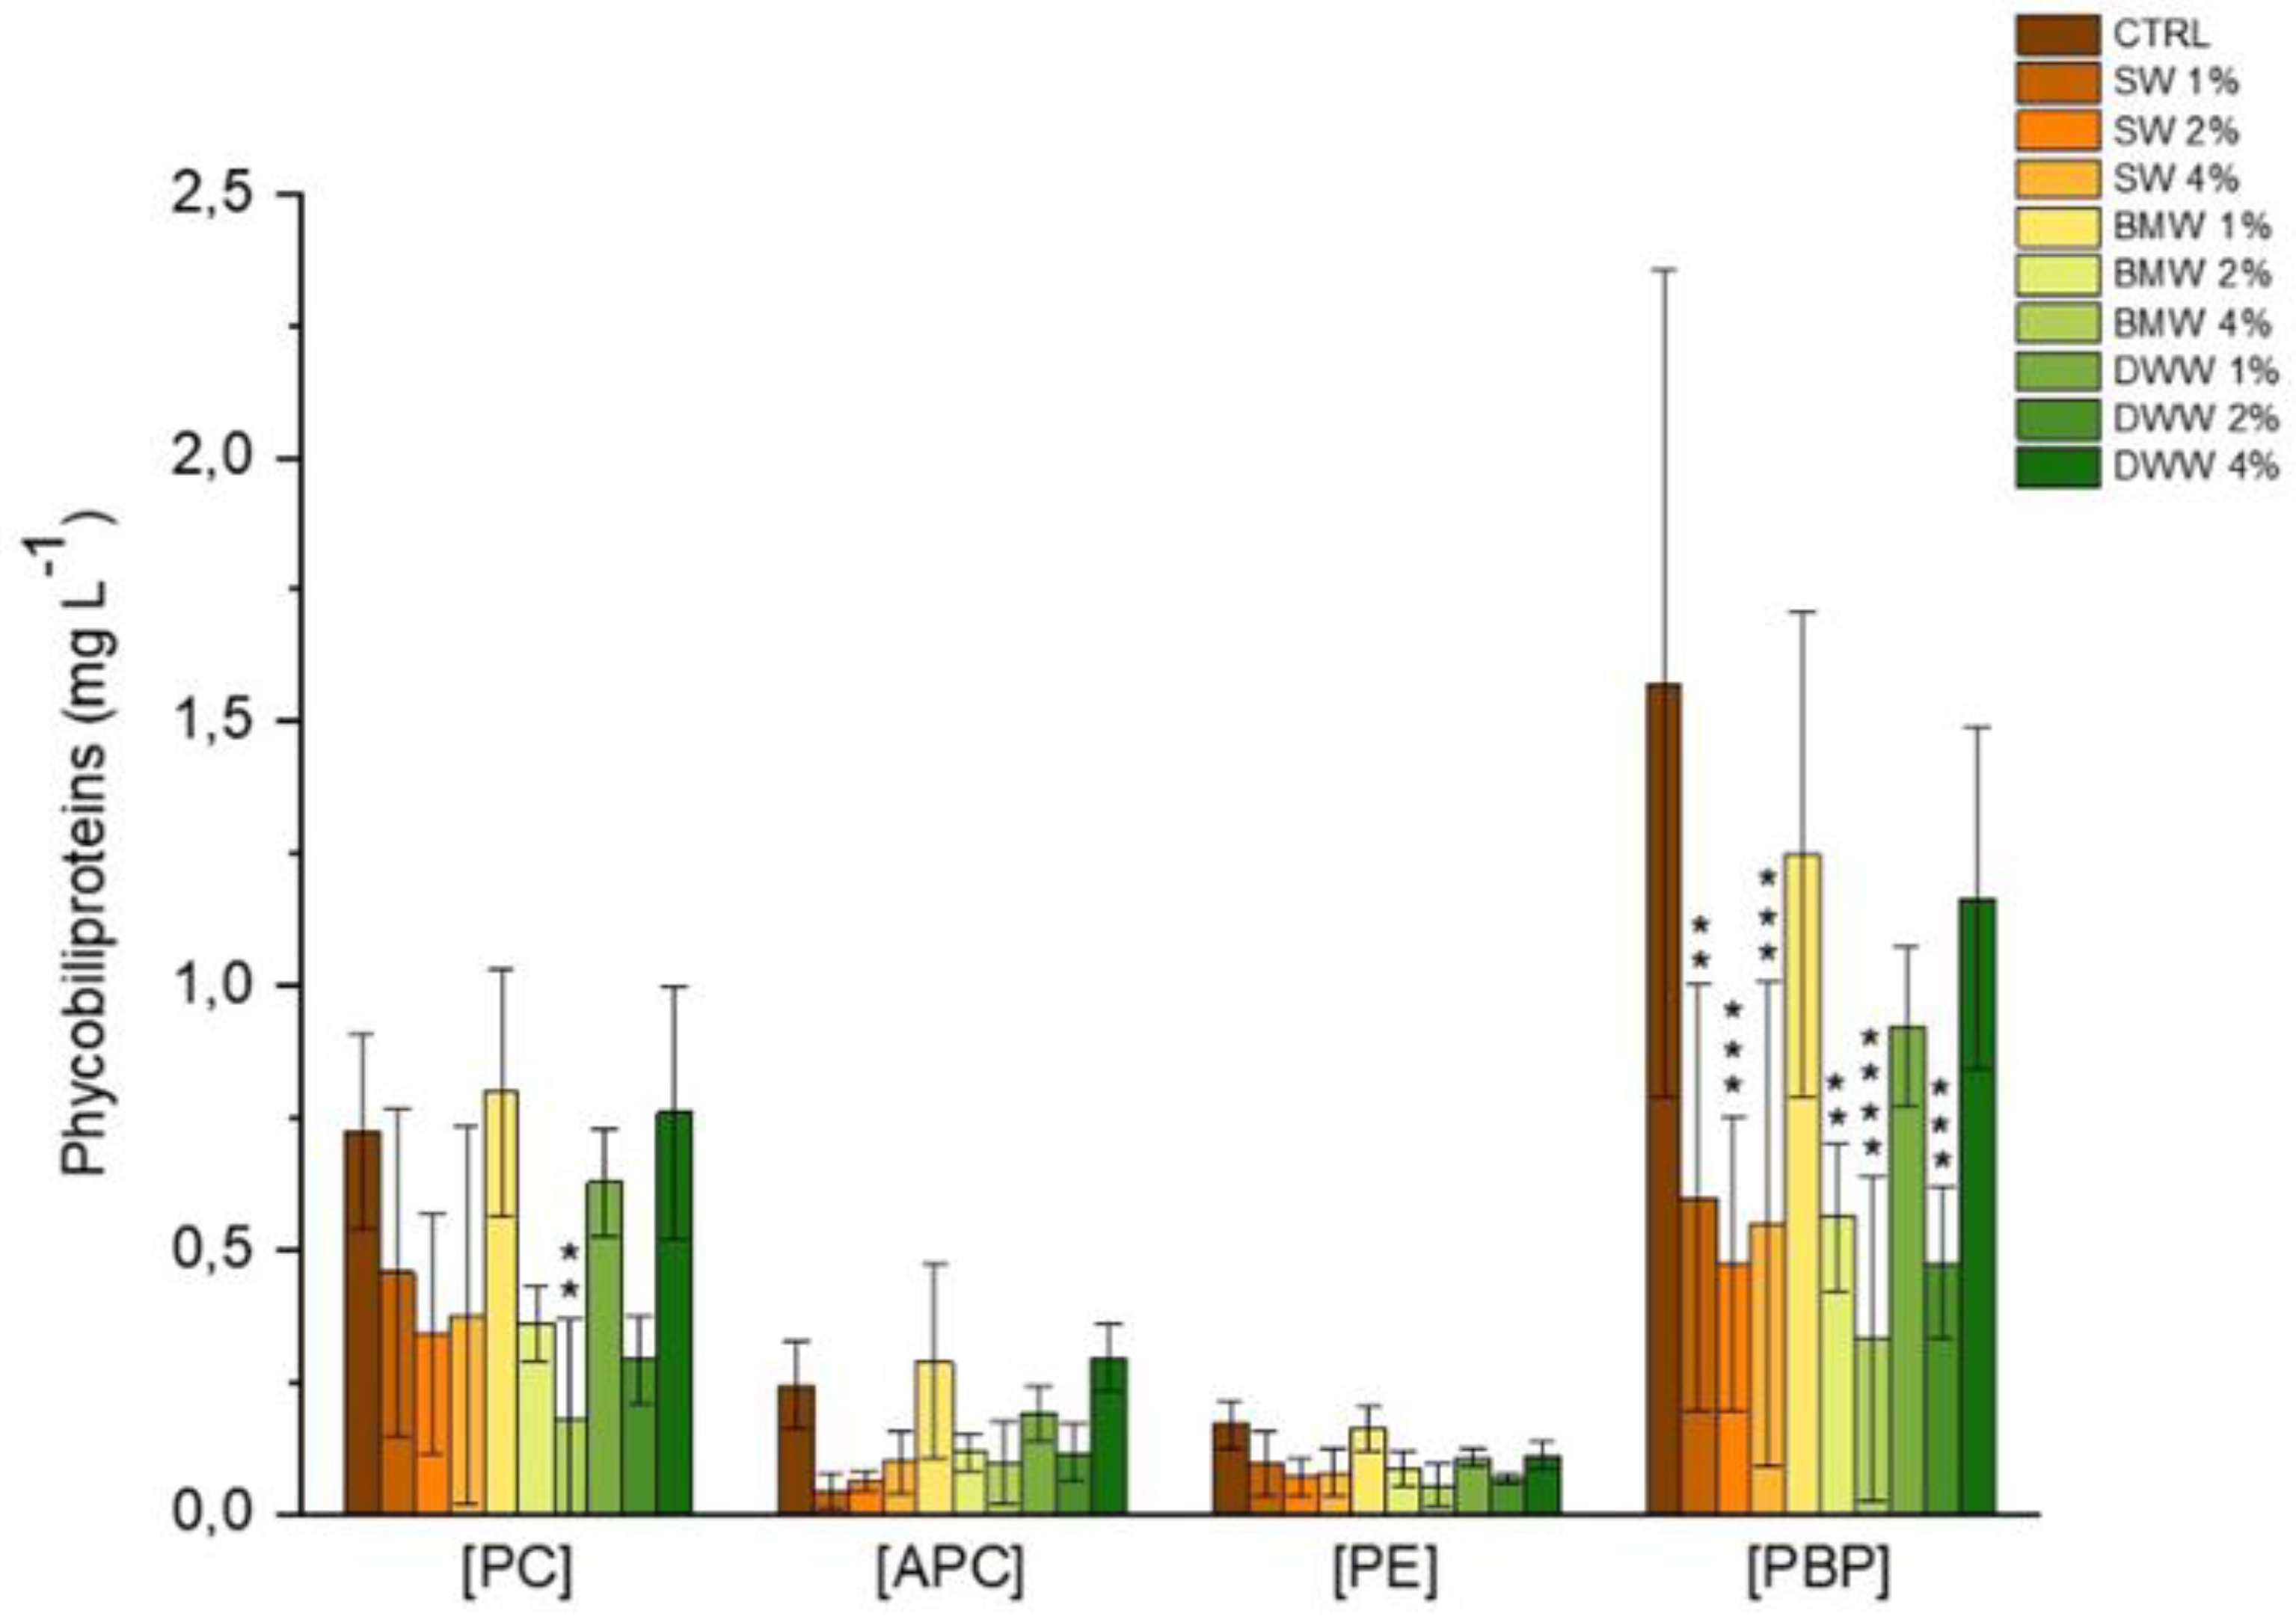
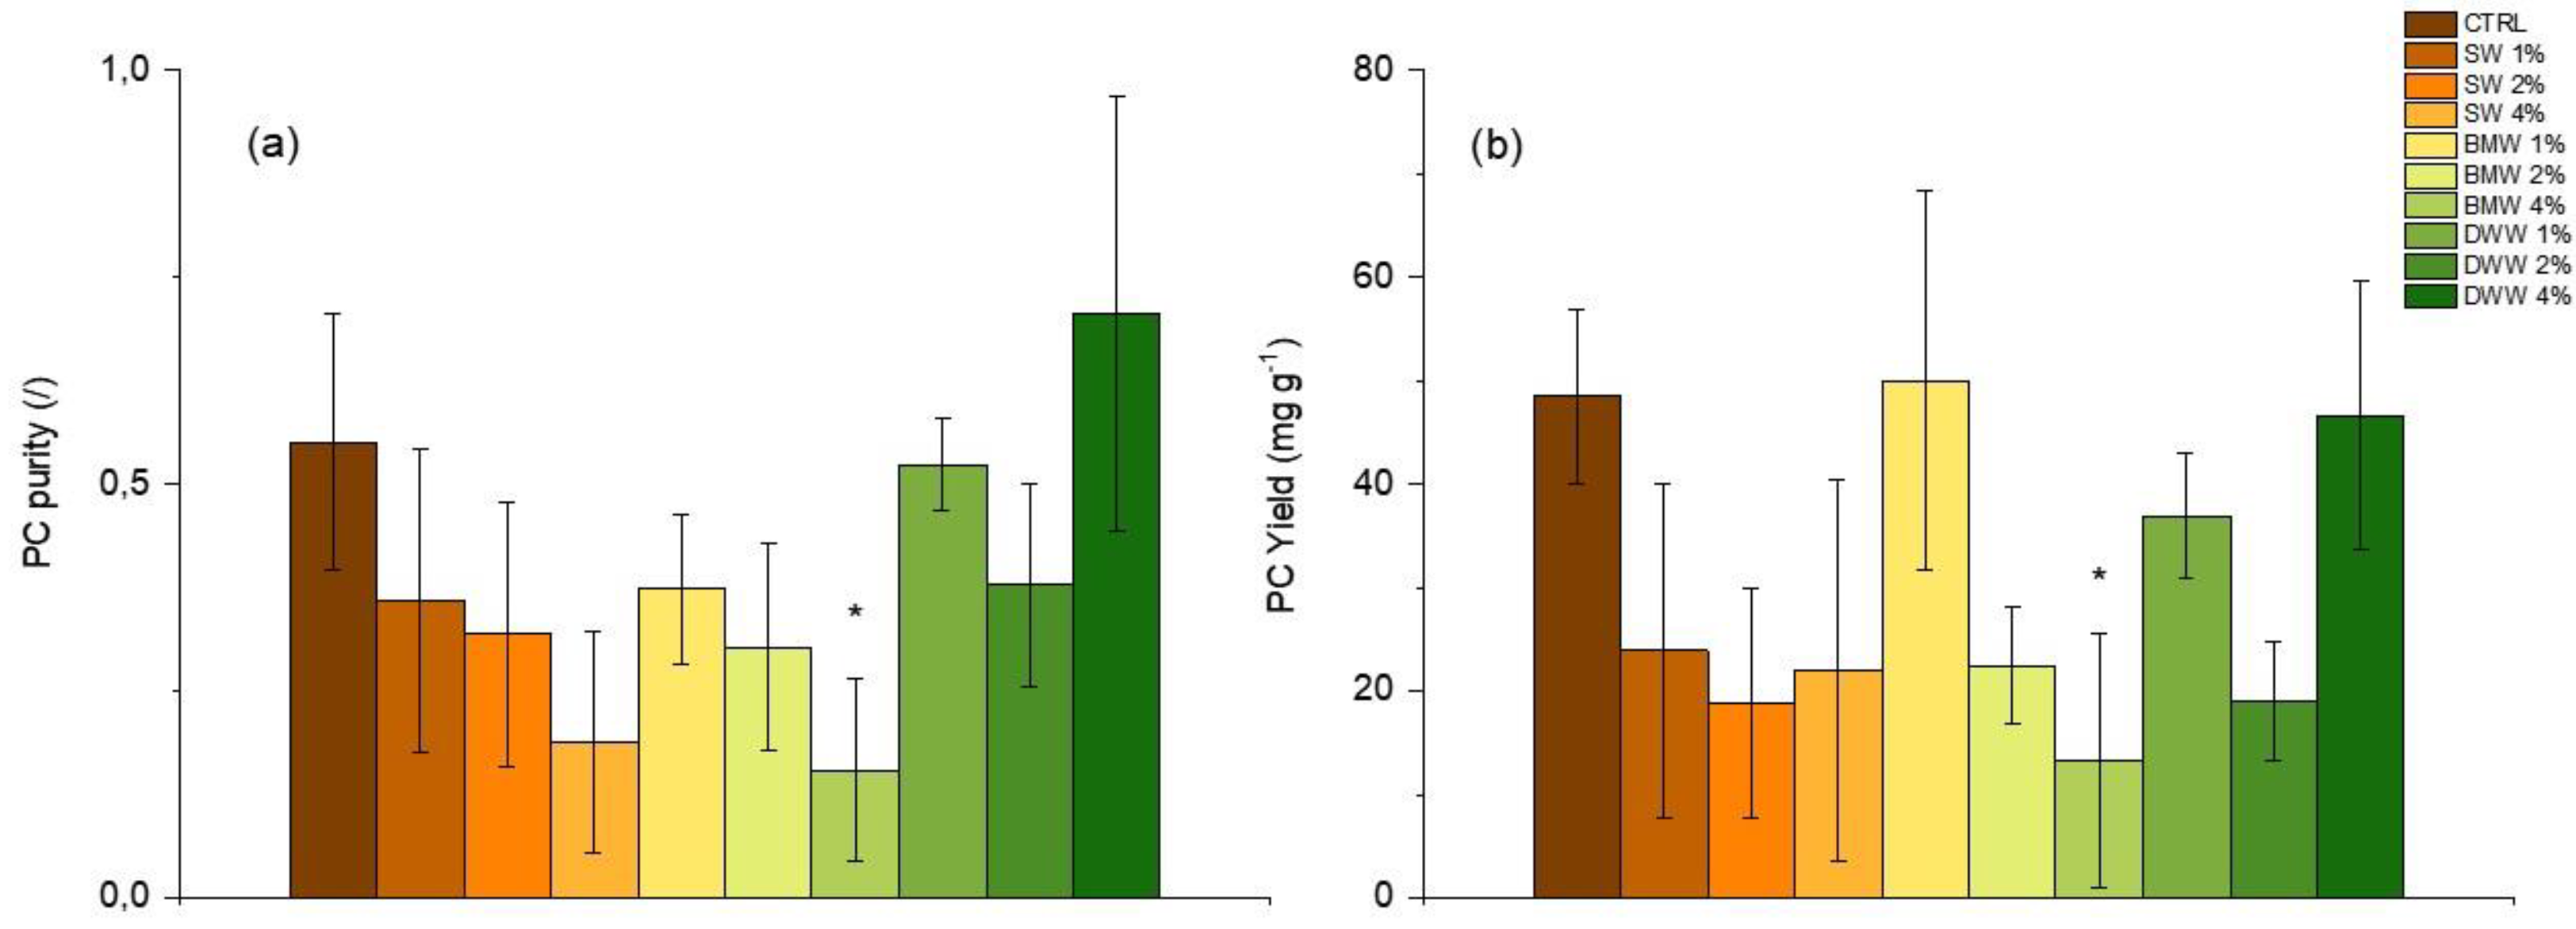
3.3. Phycobiliproteins Production by A. platensis Under Mixotrophic Conditions

Figure 6 illustrates the concentration of PC, APC, PE, and total phycobiliproteins (PBPs) in extracts from A. platensis biomass grown under both photoautotrophic and mixotrophic conditions. The mixotrophic cultures were supplemented with cheese whey (SW), buttermilk (BMW), and dairy wastewater (DWW).
The data showed that pigment concentrations were generally higher under photoautotrophic conditions, while in mixotrophic cultivation, the results varied depending on the type of dairy effluent used. Among the effluent, SW produced the lowest pigments levels, with PBPs ranging from 0.47 to 0.60 mg L-1 and PC from 0.34 to 0.46 mg L-1. In contrast, BMW-1% led to a significant increase in PC production, reaching 0.80 mg L-1 - more than double the values observed with SW. A similar pattern was observed for PBRs in these conditions. As for APC and PE, the highest concentrations were achieved using BMW-1% and DWW-4%, with values of 0.29 mg L-1 and with BMW-1% with a value of 0.16 mg L-1, respectively, compared to the control values of 0.32 mg L-1 and 0.17 mg L-1.
Previous studies indicate that PC production is driven by a complex interplay of factors, including the composition of the growth medium, the presence of organic carbon sources, and the physiological responses of microalgae to specific culture conditions (such as an appropriate addition of N source), which create a stress environment conductive to PC synthesis [51]. However, in this study, the mixotrophic cultures did not exhibit a notable rise in total PBP concentrations compared to the photoautotrophic control. This outcome contrasts with earlier observations in A. platensis grown mixotrophically using CW as an organic carbon source, where a positive correlation between organic load and PBP content was demonstrated in larger-scale processes [22]. Similarly, higher PC levels compared than those observed in the conventional control Zarrouk medium were reported for A. platensis cultivated in tofu WW under mixotrophic conditions [52], and for Galdieria sulphuraria grown in media containing buttermilk [31].
In the current study, PC purity under mixotrophy conditions was found to have an EP ranging from 0.2 to 0.4 with SW, from 0.2 to 0.45 with BMW, and from 0.45 to 0.70 with DWW, compared to 0.55 in the control (Figure 7a). The highest level of purity (0.70) was reported by DWW-4%. Correspondingly, the PC yields were ranging from 20 to 24 mg g-1 for SW, from 18 to 50 mg g-1 for BMW, and from 20 to 48 mg g-1 for DWW cultures, respectively, compared to 49 mg g-1 in the control (Figure 7b). The highest yields, 50 mg g-1 and 48 mg g-1, were exhibited by BMW-1% and DWW-4%, respectively. These findings are in part consistent with recent research carried out by Russo et al. [53] and by Cavallini et al. [22], which demonstrate that an organic source such as dairy WW in low concentrations (0.5-2% v v-1) can enhance PC synthesis in mixotrophic cultures of A. platensis.

3.4. FAME Profile by A. platensis Under Mixotrophy

The fatty acid methyl ester (FAME) composition of A. platensis grown under mixotrophic conditions using three different CW sources, in comparison to the control (CTRL), is presented in Table 3. No notable differences were observed in the FAME profile among the mixotrophic systems, although significant variations emerged when compared with the photoautotrophic system. Specifically, higher concentrations of myristic acid (C14:0), palmitic acid (C16:0), hexadecenoic acid (C16:1), elaidic acid (C18:1 trans), oleic acid (C18:1 cis), linoleic acid (C18:2), and y-linolenic acid n-6 (C18:3) were found under mixotrophy, whereas heptadecanoic acid (C17:0), stearic acid (C18:0), α-Linolenic acid (C18:3), and 8,11,14-eicosatrienoic acid (C20:3) were lower.
In the control group CTRL, C16:0 was the most dominant FA at 40.09%, followed by C18:0 (26.81%), C18:3 n-6 (10.60%), and C18:2 (7.26%). Similarly, in the SW group, C16:0 ranged from 40.35% to 42.77%, followed by C18:0 (15.53%-19.71%), C18:3 n-6 (13.33%-15.66%), and C18:2 (8.40%-9.18%). In the BMW group, C16:0 was also the most prevalent at 40.88%-41.81%, trailed by C18:0 (14.99%-18.56%), C18:3 n-6 (14.48%-15.70%), and C18:2 (8.58%-9.75%). Lastly, the DWW group exhibited a similar hierarchy, with C16:0 (41.83%-42.25%) leading, followed by C18:0 (19.63%-22.35%), C18:3 n-6 (12.63%-13.65%), and C18:2 (7.55%-8.39%).
C16:0 emerged as the dominant FA across all cultivation systems, and the total percentage of C16-C18 FAs in A. platensis showed only slight variation between photoautotrophic (96.33%) and mixotrophic conditions, which ranged from 95.33% in DWW-1% to 96.41% in SW-1%. These results align with Cavallini et al. [22], who reported a similar FAs distribution pattern in A. platensis grown under both autotrophic and mixotrophic conditions with CW supplementation. Similarly, Russo et al. [53] found comparable trends when cultivating A. platensis in autotrophic and mixotrophic systems using brewery WW under salt stress induced by seawater addition. This study also highlighted notable changes in saturated (SFAs), monounsaturated (MUFAs), and polyunsaturated fatty acids (PUFAs) levels between photoautotrophy (CTRL) and mixotrophy. Additionally, the mixotrophic response varied based on CW concentration. Specifically, a gradual increase in CW concentration in SW resulted in higher UFAs and a concomitant decline in SFAs compared to CTRL. Conversely, the BMW group exhibited the opposite trend, with an increase in SFAs and a drop in UFAs. The DWW group partially mirrored the SW trend, though the increase in UFAs and decrease in SFAs did not scale directly with CW concentrations. The highest percentage of polyunsaturated fatty acids (PUFAs) was observed in BMW-1% (27.32%), while SW-4% had the highest proportion of monounsaturated fatty acids (MUFAs) (16.57%).
The Thrombogenicity Index (TI), Atherogenicity Index (AI), and hypocholesterolemic/hypercholesterolemic (h/H) ratios were calculated from FAs profile to assess the nutritional index and the potential health benefits of A. platensis compared to those of other microalgae grown under different organic sources and conditions (Table 4). These three parameters are critical in evaluating the potential cardiovascular health impacts of microalgae, particularly in food and nutraceutical applications. In particular, the h/H ratio is a crucial indicator in cholesterol metabolism, with higher h/H values considered more beneficial for cardiovascular health. These values are thought to provide a clearer reflection of the potential impact on cardiovascular disease risk. In our study, A. platensis exhibited an h/H ratio of 0.64 under photoautotrophic conditions, while the ratios under mixotrophic conditions with the addition of CW to JM medium ranged from 0.62 to 0.81. The highest value (0.81) was observed with the use of scotta (SW-4%) (Table 3). The h/H ratios under mixotrophic conditions with SW (0.74-0.81), BMW (0.69-0.80), and DWW-1% (0.69) were higher than the values (0.60-0.66) reported for A. platensis by other researchers under photoautotrophy (Table 4). However, several freshwater microalgae strains reported in this table exhibited a wide range of h/H values when grown under mixotrophic conditions, ranging from 0.74 to 4.22. To interpret this wide variability between different microalgae, it is important to note that differences in oil extraction methods (including the types of solvents used) from microalgae cells are not consistently reported in the literature.
The highest values of 0.86 and 0.97 for AI and TI indices, respectively, were obtained for A. platensis grown in SW-4%. The wide variability in terms of AI ad TI values exhibited by A. platensis compared to the other microalgae can be explained considering that these microalgae belong to different phylum (Bacillariophyta, Cyanobacteria, and Ochrophyta) and that the different origin of the organic source used in the culture medium (brewery, dairy, molasses, glucose) may have a significant impact on the enzymatic apparatus involved in the FA metabolism.

4. Discussion

Mixotrophic cultures demonstrate faster growth rates than both photoautotrophic and heterotrophic cultures. Their capacity to utilize multiple growth substrates, combined with the ability to perform photosynthesis, confer them a degree of autonomy. This is beneficial because the acetyl-CoA pool remains available for both CO2 fixation via the Calvin cycle and the synthesis of extracellular organic carbon [54]. The ability of DWW to stimulate mixotrophic metabolism in microalgae and cyanobacteria has been investigated in various studies.
Athanasiadou et al. [55] utilized untreated, non-aseptic CW at concentrations of 2.5%, 5%, and 10% to cultivate A. platenisis under both continuous and halved (12-h) illumination. The highest biomass concentration, 1.06 g L-1, was achieved on the 14th day of the experiment under alternating 12 hour light and dark conditions. Miotti et al. grew Chlorella vulgaris in DWW containing different glycerol concentrations under autotrophic, heterotrophic and mixotrophic conditions [23]. Under mixotrophic conditions, C. vulgaris produced a significantly greater biomass yield (1.72 g L-1) compared to autotrophic growth (1.08 g L-1). The analysis of the FAME profile showed that, relative to the autotrophic control, mixotrophy led to increased MUFA across the range of glycerol concentrations tested. In our study, A. platensis exhibited different behaviour, with the highest biomass yields achieved under photoautrophic conditions rather than mixotrophic ones (except for SW-2% and DWW-2%). This may be due to the fact that lactose, the primary sugar found in scotta, buttermilk and dairy products, is a disaccharide that A. platensis cannot directly assimilate. Unlike some Chlorella species, which can metabolize lactose, A. platensis relies on simple sugars like glucose and sucrose since it lacks the enzymatic capability to break down lactose [49]. However, its ability to grow in dairy waste could be supported by the presence of other simple sugars (like glucose and fructose), proteins and vitamins [45].
The findings regarding the composition of A. platensis cultivated under mixotrophic conditions with CW indicate considerable variations in TC, TP, and TL across different dilution ratios. When compared to other research involving A. platensis and other microalgae that utilize DWW, these results reveal both similarities and differences. For instance, higher dilution ratios of CW led to increased TC, especially in the SW-4% and BMW-4% treatments, which suggests that these concentrations enhance nutrient availability. This observation is consistent with studies showing that elevated levels of dairy substrates can boost pigment production, although there can be a decrease in protein, as seen in the DWW1-4% treatments. Desmodesmus sp. was mixotrophically grown in a growth medium composed of CW only and CW supported with Bold’s basal medium (BBM) for 14 days. Under 15% CW and 50% BMM conditions, Desmodesmus sp. significantly improved its growth (303%), productivity (325%), and accumulation of cell metabolites, mainly lipids (3.89%), and carbohydrates (1.95%) [56]. Salati et al. [57] demonstrated that mixotrophic cultivation of Chlorella using agro-foods byproducts, including CW, represents a promising strategy for boosting algal production, particularly regarding protein yield. Conversely, other microalgae, such as Tetradesmus obliquus and Cyanothece sp. have exhibited stable protein retention across various CW concentrations, suggesting that different species may respond differently to similar substrates [29]. These two alkaliphilic microalgae were grown under mixotrophic conditions with CW ranging from 0.5% to 4.5%. At 3.5% CW (v v-1) concentration, T. obliquus achieved productivities of 48.69, 20.64, 7.02, and 10.97 mg L−1 day−1 for biomass, lipid, carbohydrates, and protein, respectively. Meanwhile, Cyanothece produced 52.78 mg L−1 day−1 of biomass, 11.42 mg L−1 day−1 of lipids, 4.31 mg L−1 day−1 of carbohydrates, and 7.89 mg L−1 day−1 of protein at a 4.5% CW (v v-1) concentration. Overall, the study by Youssef et al. [29] highlights the potential of dairy byproducts as a valuable nutrient source for maximizing bioactive compounds in microalgal cultivation, with the effectiveness depending on the specific strain and dilution ratios utilized.
The suitability of PC for various uses is primarily influenced by its level of purity, which is commonly assessed through an absorbance ratio. This ratio compares PC’s absorbance at 620 nm (A620) to that of other proteins at 280 nm (A280). The A620/A280 ratio, known as extraction purity (EP), play a critical role in determining PC’s classification. If the EP is 0.7 or higher, as is the case of this study, the PC is considered food grade, making it suitable for use as a food additive or a natural blue colorant in cosmetics. When the EP falls between 0.7 and 3.9, it is classified as reagent grade, with EP values of 1.5 or more being appropriate for cosmetic applications. An EP of 4 or higher qualifies PC as analytical grade, suitable for pharmaceutical applications [58].
The purity of PC is strongly influenced by the extraction techniques employed, which depends on various physical and chemical parameters such as temperature, pH, solvent type, biomass-to-solvent ratio, and whether the biomass is dried or fresh. The commercial value of PC is highly dependent on its purity level. According to the literature, the cost of PC rises with its purity, especially in industries like cosmetics, agro-chemistry, and food [59]. Analytical-grade PC with a purity level above 4 can indeed cost as much as 4,500 US$ g-1, particularly for high-purity applications such as pharmaceuticals, therapeutic, biomedicine and cosmetics [60]. Moreover, PC used in commercial food products or as biocolorant, with lower purity levels, is generally priced around 0.35 US$ g-1, reflecting its lower production costs and less stringent purity requirements [61]. The global PC market is projected to grow to $245.5 million by 2027 and $279.6 million by 2030 [62]. These high prices are primarily due to the challenges involved in the extraction and purification processes, making PC an expensive protein pigment [19].
The data presented in Figure 7 indicates how varying concentrations of SW, BMW, and DWW impact the purity and yield of C-PC. The relatively low C-PC purity in SW-treated groups (1% and 2%) suggests that the introduction of CW may have increased the turbidity of the medium. Turbidity can result from suspended particles and organic compounds, which scatter light and reduce its penetration into the culture [63].
This reduction in light limits the photosynthetic efficiency of microalgae, decreasing C-PC production. The yield of C-PC under SW conditions is also comparatively low, reinforcing the idea that the nutrient profile and increased opacity may not induce significant stress or nutrient availability that supports higher pigment synthesis [52]. Lower light availability limits the photosynthetic activity needed for C-PC accumulation. For BMW, the purity of C-PC is also modest across the concentrations, with yields varying. The 2% BMW condition shows relatively high C-PC yield, potentially because the moderate concentration provides enough nutrients to sustain microalgal growth without overwhelming the system. However, higher concentrations (4%) may introduce excessive organic load or N, which can lead to nutrient oversaturation, reducing the physiological stress required to trigger high pigment production. Excess nutrients reduce the need for microalgae to synthesize accessory pigments like C-PC, which are typically downregulated under stress conditions like nutrient limitation [64]. The DWW-treated groups, especially DWW 4%, show the highest C-PC purity. This result could be attributed to a balance between nutrient availability and stress. DWW likely contains a mix of organic carbon, N, and other micronutrients. At higher concentrations (like 4%), the culture might experience mild stress conditions, such as nutrient fluctuations or pH imbalances, that enhance C-PC purity. The higher yields seen in DWW treatments, particularly at 4%, suggest that the stress induced by DWW’s composition may be optimal for enhancing C-PC synthesis. DWW might introduce specific stressors, such as oxidative stress from organic matter degradation, that stimulate secondary metabolite production, including C-PC. In this case, moderate nutrient stress could enhance both photosynthetic and protective pigments in the algae, boosting C-PC output [65]. The variations in C-PC purity and yield across different concentrations of SW, BMW, and DWW can be largely explained by differences in term of stress response of the microalgae, as previous studies indicate. Higher turbidity in SW and BMW reduces light availability, lowering C-PC production, while the nutrient composition of DWW, particularly at 4%, appears to create a stress environment that optimizes both purity and yield. These findings align with existing research indicating that microalgal C-PC production is strongly influenced by environmental stressors, nutrient availability, and light conditions [66].​
Overall, the findings from this study on PC yield and purity provide valuable insights for developing algal cultivation strategies that optimize the production of bioactive compounds while supporting sustainable and eco-friendly practices.
C16:0 is a crucial energy source in infant nutrition, as it constitutes 20%-30% of breast milk. Elevated levels of free SFAs, particularly C16:0 and, to a lesser extent, C18:0, are associated with an increased risk of cardiovascular disease in adults [67]. This link is largely attributed to vascular endothelial dysfunctions caused by oxidative stress, which results from increased mitochondrial uncoupling [68]. Research in medicine and pharmaceuticals underscores the need to maintain normal or non-elevated levels of C16:0 and C18:0 to avoid oxidative stress in the vascular endothelium [69]. As it can be observed in Table 3, C16 levels remained almost unchanged across all the mixotrophic conditions investigated compared to the CTRL, while C18 levels resulted considerably decreased under mixotrophy.
Olive oil is rich in beneficial MUFAs, which are well-known for their positive effects against cardiovascular disease and for mitigating various risk factors. Specifically, oleic acid (C18:1) comprises approximately 70%-80% of its total FAs content and is confers to olive oil its healthy effects [70]. The FAME profile in this study shows that the C18:1 content in A. platensis grown under mixotrophic conditions was enhanced using the three types of CW, especially with scotta, buttermilk, and dairy effluent at 1% concentration. Moreover, mixotrophic conditions led to a higher expression of SFAs compared to PUFAs and MUFAs. Therefore, it can be proposed that regular consumption of A. platensis biomass, where the levels of C16:0 and C18:0 levels remain within physiological limits and MUFA C18:1 levels are exalted, may help protect cells from endothelial dysfunction [68].
α-linolenic acid (ALA, C18:3 ω-3) and γ-linolenic acid (GLA, C18:3 ω-6) are two PUFAs commonly present in oil derived from microalgae and cyanobacteria [71]. In line with our findings, several studies have demonstrated that GLA is the primary isomer of this FA produced by A. platensis [72]. A recent review by [73] explored various culture conditions, such as temperature, light intensity, nitrogen cell concentration, growth phase, and light/dark cycle, that promote lipids and GLA synthesis in Spirulina. It was observed that both lipid content and GLA levels are higher in mixotrophic environments compared to autotrophic ones. This study support these conclusions, as the addition of CW to the JM culture medium led to an increase in GLA content under all mixotrophic conditions tested. The more notable results was achieved with buttermilk at 1% (15.70%) and 2% (15.34%), and scotta at 2% (15.66%), compared to the photoautotrophic control, who showed a GLA content of 10.60%.
The amount of ALA in A. platensis is tipically minimal compared to GLA. In our study, the ALA content decreased significantly with the addition of CW in all the mixotrophic system compared the CTRL (1.24%). ALA serves a critical biologic role, primarily as a precursor for the synthesis of eicosapentaenoic acid (EPA, C20:5 ω-3) and docosahexaenoic acid (DHA, C22:6 ω-3). As one of two essential FAs, ALA must obtain through the diet because the human body cannot synthesize it. The body convert ALA into EPA and DHA, which are vital for maintaining the proper function of key organs. However, this conversion is relatively inefficient, with about 5% to 10% of consumed ALA being converted into EPA, and roughly 1% of this EPA being further converted into DHA [74].
The ratio of PUFA to SFA is a key indicator of the nutritional quality of foods and its influence on cardiovascular health. PUFAs are known to reduce low-density lipoprotein cholesterol (LDL-C) and total serum cholesterol, while SFAs tend to elevate cholesterol levels. Therefore, a higher PUFA ratio is considered advantageous [75] The British Department of Health recommends a PUFA ratio above 0.45 in the human diet, and the WHO/FAO guidelines suggest a balanced diet should maintain a PUFA ratio greater than 0.4, as this thought to reduce the risk of cardiovascular and other chronic diseases [76]. In this study, the PUFA ratio surpassed 0.4 in four of the nine mixotrophic systems where A. platensis was grown, specifically in SW-4% (0.42), SW-2% (0.43), BMW-2% (0.44), and BMW-1% (0.46), compared to CTRL (0.29).
Analyzing the TI index, it can be observed a significant variation across microalgae species and cultivation methods. For example, Scenedesmus dimorphus grown on glucose shows the highest TI (4.0), indicating a higher risk of promoting thrombosis, which could pose cardiovascular concerns. In contrast, Tribonema aequale grown on glucose has a notably low TI (0.183), suggesting a lower risk of blood clot formation, making it potentially safer for cardiovascular health. Within A. platensis, differences based on the organic source are apparent. When grown on brewery residues, the TI is relatively high (3.51), whereas cultivation on dairy sources results in much lower values, as 0.86 in this study (Table 4). This underscores the impact that cultivation media can have on the thrombogenic potential of microalgae, suggesting that dairy byproducts are particularly indicated in promoting the production of beneficial FA for the overall human health [77].
Similarly, the AI index, which measures the potential of a food to contribute to the buildup of fats in the arteries, also shows considerable variability. High AI values are often associated with a greater risk of atherosclerosis, so species like Scenedesmus dimorphus (AI = 1.68) and Chlorella kessleri (AI = 1.64) could pose a moderate risk. On the other hand, species like Chromocloris zofingensis, which show much lower AI values (0.23 when grown on molasses and 0.215 when grown on dairy), could be seen as more favorable for cardiovascular health, as their potential to contribute to artery plaque formation is reduced. Once again, the organic source used in cultivation has a significant influence on these health-related indices [77].
The h/H ratio provides insight into the nutritional quality of the microalgae, particularly in terms of FA composition. A higher h/H ratio indicates a greater proportion of UFAs, which are beneficial for heart health [78]. Chlorella vulgaris shows particularly high h/H ratios, with values reaching 2.67 and 2.8 when grown on molasses and glucose, respectively. This suggests a high content of UFAs, making it a valuable candidate for functional foods or dietary supplements aimed at promoting heart health. In contrast, A. platensis generally has lower h/H ratios, ranging between 0.6 and 1.07 depending on the cultivation conditions, indicating a lower unsaturated fat content and, potentially, a less beneficial FA profile.
Overall, the data reported in Table 4 highlight how the cardiovascular health potential of microalgae varies significantly depending on species and cultivation conditions. Those with high h/H ratios and lower TI and AI values show the most promise for use in food and nutraceuticals aimed at improving heart health. Conversely, microalgae with higher TI or AI may require more careful consideration or specific cultivation strategies to optimize their nutritional profiles. This underscores the importance of selecting appropriate cultivation methods to enhance both the health benefits and safety of microalgae for a wide range of applications.

5. Conclusions

This study demonstrates the efficacy of using dairy byproducts, including scotta whey (SW), buttermilk wastewater (BMW), and dairy wastewater (DWW), as substrates for the mixotrophic cultivation of Arthrospira platensis. The results showed that a 2% (v v-1) concentration of SW and DWW enhanced biomass production, achieving maximum concentrations of 3.30 g L⁻¹ and 3.19 g L⁻¹, respectively, compared to the control condition (3.06 g L⁻¹). In terms of growth kinetics, A. platensis cultivated in SW-2% exhibited the highest average biomass productivity of 235 mg L⁻¹ d⁻¹ and a specific growth rate (μ) of 0.21 d⁻¹, compared to 0.27 d⁻¹ in the control.
Phycocyanin production was also enhanced under mixotrophic conditions, particularly in the BMW-1% treatment, which yielded 50 mg g⁻¹ of dry weight, approaching the control's 49 mg g⁻¹. Moreover, the highest phycocyanin purity was achieved in DWW-4% cultures, with an extraction purity (EP) of 0.70, making it suitable for food-grade applications.
The FAME profiles showed consistent dominance of hexadecanoic acid (C16:0), ranging from 40.35% to 42.77%, across all mixotrophic conditions, similar to the control (40.09%). However, there were notable increases in PUFAs under mixotrophy, with the highest PUFA content of 27.32% recorded in BMW-1%. Additionally, the hypocholesterolemic/hypercholesterolemic (h/H) ratio improved under mixotrophic conditions, reaching a peak of 0.81 in SW-4%, compared to 0.64 in the control, indicating potential cardiovascular health benefits.
These findings underscores the potential of integrating dairy effluents into A. platensis production systems, offering a sustainable approach to both waste management and the generation of nutritionally and economically valuable biomass. This approach aligns with the goals of a circular bio-economy, offering a cost-effective and environmentally friendly alternative to traditional cultivation methods.

Author Contributions

Conceptualization, Luca Baraldi, Serenella Torre and Giovanni Antonio Lutzu; Data curation, Luca Usai, Giacomo Fais, Debora Dessì, Mattia Casula, Giovanni Antonio Lutzu and Alessandro Concas; Formal analysis, Giacomo Fais, Debora Dessì, Mattia Casula; Investigation, Luca Baraldi; Methodology, Luca Usai and Giovanni Antonio Lutzu; Supervision, Paola Nieri, Giovanni Antonio Lutzu and Alessandro Concas; Writing – original draft, Giovanni Antonio Lutzu and Alessandro Concas; Writing – review & editing, Giovanni Antonio Lutzu, Giacomo Fais and Alessandro Concas. All authors have read and agreed to the published version of the manuscript.

Funding

Not applicable.

Institutional Review Board Statement

Not applicable.

Data Availability Statement

Data will be available upon request.

Acknowledgments

The authors would to thanks dr. Maurizio Giordano from Check Lab, Salerno, Italy, for performing the analysis on the extraction and purity of phycocyanin. Dr. Lidia Ciccone from the Department of Pharmacy at the University of Pisa, Italy, is also acknoledged for its contribution to the discussion of health related lipid indices.

Conflicts of Interest

The authors declare no conflicts of interest.

References

  1. Yang, N.; Zhang, Q.; Chen, J.; Wu, S.; Chen, R.; Yao, L.; Li, B.; Liu, X.; Zhang, R.; Zhang, Z. Study on bioactive compounds of microalgae as antioxidants in a bibliometric analysis and visualization perspective. Front. Plant Sci. 2023, 14, 1144326. [CrossRef]
  2. Siddhnath; Surasani, V. K.R.; Singh, A.; Singh, S.M.; Hauzoukim, Narasimha Murthy, L.; Kirankumar Gopalbhai, B. Bioactive compounds from micro-algae and its application in foods: a review. Discov. Food, 2024; 4, 27. [Google Scholar] [CrossRef]
  3. Pereira, L.; Cotas, J.; Valado, A. Antioxidants from microalgae and their potential impact on human well-being. Explor. Drug Sci. 2024; 2, 292–321. [Google Scholar] [CrossRef]
  4. Naik, B.; Mishra, R.; Kumar, V.; Mishra, S.; Gupta, U.; Rustagi, S.; Kumar Gupta, A.; Preet, M.S.; Bhatt, S.C.; Rizwanuddin, S. Micro-algae: Revolutionizing food production for a healthy and sustainable future. J. Agric. Food Res. 2024, 15, 100939. [CrossRef]
  5. Chaudhary, P.; Janmeda, P.; Docea, A.O.; Yeskaliyeva, B.; Abdull Razis, A.F., Modu, B.; Calina, D.; Sharif-Rad, J. Oxidative stress, free radicals and antioxidants: potential crosstalk in the pathophysiology of human diseases. Front. Chem. 2023, 11, 1158198. [CrossRef]
  6. Eze, C.N.; Onyejiaka, C.K.; Ihim, S.A.; Ayoka, T.O.; Aduba, C.C.; Ndukwe, J.K.; Nwaiwu, O.; Onyeaka, H. Bioactive compounds by microalgae and potentials for the management of some human disease conditions. AIMS Microbiol. 2023, 9(1), 55-74. [CrossRef]
  7. Udayan, A.; Pandey, A.K.; Sirohi, R.; Sreekumar, N.; Sang, B-I.; Sim, S.J.; Kim, S.H.; Pandey, A. Production of microalgae with high lipid content and their potential as sources of nutraceuticals. Phytochem. Rev. 2023, 22, 833–860. [CrossRef]
  8. Novoveská, L.; Nielsen, S.L.; Eroldoğan, O.T.; Haznedaroglu, B.Z.; Rinkevich, B.; Fazi, S.; Robbens, J.; Vasquez, E.H. Overview and Challenges of Large-Scale Cultivation of Photosynthetic Microalgae and Cyanobacteria. Mar. Drugs. 2023, 21(8), 445. [CrossRef]
  9. Qin, S.; Wang, K.; Gao, F.; Ge, B.; Cui, H.; Li, W. Biotechnologies for bulk production of microalgal biomass: from mass cultivation to dried biomass acquisition. Biotechnol. Biofuels 2023, 16, 131. [CrossRef]
  10. Kiran, B.R.; Mohan, S.V. Microalgal cell biofactory-therapeutic, nutraceutical and functional food applications. Plants 2021, 10(5), 836. [CrossRef]
  11. Grand View Research. https://www.grandviewresearch.com/industry-analysis/nutraceuticals-market. Accessed on September 15th 2024.
  12. Abreu, A.P.; Martins, R.; Nunes, J. Emerging applications of Chlorella sp. and Spirulina (Arthrospira) sp. Bioeng. 2023, 10(8), 955. [CrossRef]
  13. Alagawany, M.; Taha, A.E.; Noreldin, A.; El-Tarabily, K.A.; Abd El-Hack, M.E. Nutritional applications of species of Spirulina and Chlorella in farmed fish: A review. Aquaculture 2021, 542, 736841. [CrossRef]
  14. Gonçalves Bortolini, D.; Maciel, G.M.; de Andrade Arruda Fernandes, I.; Pedro, A.C.; Thaís Vieira Rubio, F.; Branco, I.G.; Haminiuk, C.W.I. Functional properties of bioactive compounds from Spirulina spp.: Current status and future trends. Food Chem. Mol. Sci. 2022, 5, 100134. [CrossRef]
  15. Su, M.; Bastiaens, L.; Verspreet, J.; Hayes, M. Applications of Microalgae in Foods, Pharma and Feeds and Their Use as Fertilizers and Biostimulants: Legislation and Regulatory Aspects for Consideration. Foods. 2023, 12(20), 3878. [CrossRef]
  16. Gheda, S.; Abd El-Zaher, E.H.F.; Abou-Zeid, A.M.; Bedair, N.A.; Pereira, L. Potential activity of Arthrospira platensis as antioxidant, cytotoxic and antifungal against some skin diseases: Topical cream application. Mar. Drugs 2023, 21(3), 160. [CrossRef]
  17. Villaró, S.; Jiménez-Márquez, S.; Musari, E.; Bermejo, R.; Lafarga, T. Production of enzymatic hydrolysates with in vitro antioxidant, antihypertensive, and antidiabetic properties from proteins derived from Arthrospira platensis. Food Res. Int. 2023, 163, 112270. [CrossRef]
  18. Htoo, N.Y.M.; Kraseasintra, O.; Buncharoen, W.; Kaewkod, T.; Pekkoh, J.; Tragoolpua, Y.; Khoo, K.S.; Chaipoot, S.; Srinuanpan, S.; Pumas, C. In vitro immunomodulation activity of protein hydrolysate from Spirulina (Artrospira platensis): the ingredient of future foods. Front. Mar. Sci. 2024, 11, 1303025. Doi.10.3389/fmars.2024.13030325.
  19. Citi, V.; Torre S.; Flori, L.; Usai, L.; Aktay, N.; Dunford N.T.; Lutzu G.A.; Nieri P. Nutraceutical features of the phycobiliprotein C-phycocyanin: evidence from Arthrospira platensis (Spirulina). Nutrients 2024, 16(11), 1767. DOI: 10.3390/nu16111767.
  20. Guieysse, B.; Plouviez, M. Microalgae cultivation: closing the yield gap from laboratory to field scale. Front. Bioeng. Biotechnol. 2024, 12, 1359755. [CrossRef]
  21. Vitali L.; Lolli V.; Sansone F.; Concas A.; Lutzu G.A. Lipid content and fatty acids methyl esters profile by Chromochloris zofingiensis under chemical and metabolic stress. Biomass Convers Bioref 2023. [CrossRef]
  22. Cavallini, A.; Torre, S.; Usai, L.; Casula, M.; Fais, G.; Nieri, P.; Concas, A.; Lutzu, G.A. Effect of Cheese Whey on Phycobiliproteins Production and FAME Profile by Arthrospira platensis (Spirulina): Promoting the Concept of a Circular Bio-Economy. Sustain. Chem. Pharm. 2024, 40, 101625. [CrossRef]
  23. Miotti, T.; Sansone, F.; Lolli, V.; Concas, A.; Lutzu G.A. Mixotrophic and heterotrophic metabolism in brewery wastewater by Chlorella vulgaris: Effect on growth, FAME profile and biodiesel properties. Chem. Eng. Trans. 2024, 109, 97-102. [CrossRef]
  24. Miotti, T.; Sansone, F.; Lolli, V.; Concas, A.; Lutzu, G.A. Dairy wastewater to promote mixotrophic and heterotrophic metabolism in Chlorella vulgaris: Effect on growth and FAME profile. Chem. Eng. Trans. 2023, 98, 81-86. [CrossRef]
  25. Sales, D.C.; Rangel, A.H.N.; Urbano, S.A.; Freitas, A.R.; Tonhati, H.; Novaes, L.P.; Pereira, M.I.B.; Borba, L.H.F. Relationship between mozzarella yield and milk composition, processing factors, and recovery of whey constituents. J. Dairy Sci. 2017, 100(6), 4308–4321. [CrossRef]
  26. Adesra, A.; Srivastava, V.K.; Varjani, S. Valorization of Dairy Wastes: Integrative Approaches for Value Added Products. Indian J. Microbiol. 2021, 61(3), 270-278. [CrossRef]
  27. Ramsuroop, J.; Gutu, L.; Ayinde, W.B.; Basitere, M.; Manono, M.S. A Review of Biological Processes for Dairy Wastewater Treatment and the Effect of Physical Parameters Which Affect Their Efficiency. Water 2024, 16, 537. [CrossRef]
  28. Nham, Q.; Mattson, L.; Legrand, C.; Lindehoff, E. Whey permeate as a phosphorous source for algal cultivation. Water Environ. Res. 2023, 95, e10865. [CrossRef]
  29. Youssef, A.M.; Gomaa, M.; Mohamed, A.K.S.H.; El-Shanawany, A-R.A. Enhancement of biomass productivity and biochemical composition of alkaliphilic microalgae by mixotrophic cultivation using cheese whey for biofuel production. Environ. Sci. Pollut. Res. 2024, 31, 42875–42888. [CrossRef]
  30. Santos Ribeiro, J.E.; Martini, M.; Altomonte, I.; Salari, F.; Nardoni, S.; Sorce, C.; da Silva, F.L.H.; Andreucci, A. Production of Chlorella protothecoides biomass, chlorophyll and carotenoids using the dairy industry by-product scotta as a substrate. Biocatal. Agric. Biotechnol. 2017, 11, 207-213. [CrossRef]
  31. Occhipinti, P.S.; Del Signore, F.; Canziani, S.; Caggia, C.; Mezzanotte, V.; Ferrer-Ledo, N. Mixotrophic and heterotrophic growth of Galdieria sulphuraria using buttermilk as a carbon source. J. Appl. Phycol. 2023, 35, 2631–2643. [CrossRef]
  32. SAG. The Culture Collection of Algae at the University of Gottingen. Germany. Available on-line: https://sagdb.uni-goettingen.de/ (accessed on 26 January 2024).
  33. Jourdan, J-P. Cultivez Votre Spiruline - Manuel de Culture Artisanale de la Spirulina Publication Antenna Technologies. 1996.
  34. Herrera, A.; Boussiba, S.; Napoleone, V.; Hohlberg, A. Recovery of C-phycocyanin from the cyanobacterium Spirulina maxima. J. Appl. Phycol. 1989, 1, 325–331. [CrossRef]
  35. Bryant, D.A.; Glazer, A.N.; Eiserling, F.A. Characterization and structural properties of the major biliproteins of Anabaena sp. Arch. Microbiol. 1976, 110, 61–75. [CrossRef]
  36. Breuer, G.; Evers, W.A.C.; de Vree, J.H.; Kleinegris, D.M.M.; Martens, D.E.; Wijffels, R.H.; Lamers, P.P. Analysis of fatty acid content and composition in microalgae. J. Vis. Exp. 2013, 80, e50628. [CrossRef]
  37. Ulbricht, T.L.V.; Southgate, D.A.T. Coronary heart disease: Seven dietary factors. Lancet 1991, 338, 985–992.
  38. Fernández, M.; Ordóñez, J.; Cambero, I.; Santos, C.; Pin, C.; Hoz, L. Fatty acid compositions of selected varieties of Spanish dry ham related to their nutritional implications. Food Chem. 2007, 101, 107-112. [CrossRef]
  39. Asunis, F.; De Gioannis, G.; Dessì, P.; Isipato, M.; Lens, P.N.L.; Muntoni, A.; Polettini, A.; Pomi, R.; Rossi, A.; Spiga, D. The dairy biorefinery: integrating treatment processes for cheese whey valorization. J. Environ. Manag. 2020, 276, 111240. [CrossRef]
  40. Fancello, F.; Zara, G.; Hatami, F.; Scano, E.A.; Mannazzu, I. Unlocking the potential of second cheese whey: a comprehensive review on valorisation strategies. Rev. Environ. Sci. Biotechnol. 2024, 23, 411–441. [CrossRef]
  41. Kolev Slavov, A. Dairy wastewaters – general characteristics and treatment possibilities – a review. Food Technol. Biotechnol. 2017, 55, 14–28. [CrossRef]
  42. Ahmad, T.; Aadil, T.R.M.; Ahmed, H.; Rahman, U.Ur.; Soares, B.C.V.; Souza, S.L.Q.; Pimentel, T.C.; Scudino, H.; Guimarães, J.T.; Esmerino, E.A.; Freitas, M.Q.; Almada, R.B.; Vendramel, S.M.R.; Silva, M.C.; Cruz, A.G. Treatment and utilization of dairy industrial waste: a review. Trends Food Sci. Technol. 2019, 88, 361–372. [CrossRef]
  43. Sar, T.; Harirchi, S.; Ramezani, M.; Bulkan, G.; Akbas, M.Y.; Pandey, A.; Taherzadeh, M.J. Potential utilization of dairy industries by-products and wastes through microbial processes: a critical review. Sci. Total Environ. 2022, 810, 152253. [CrossRef]
  44. Salla, A.C.V.; Margarites, A.C.; Seibel, F.I.; Holz, L.C.; Briao, V.B.; Bertolin, T.E.; Colla, L.M.; Vieira Costa, J.A. Increase in the carbohydrate content of the microalgae Spirulina in culture by nutrient starvation and the addition of residues of whey protein concentrate. Bioresour. Technol. 2016, 209, 133–141. [CrossRef]
  45. Pereira, M.I.B.; Chagas, B.M.E.; Sassi, R., Medeiros, G.F.; Aguiar, E.M.; Borba, L.H.F.; Silva, E.P.E.; Andrade Neto, J.C.; Rangel, A.H.N. Mixotrophic cultivation of Spirulina platensis in dairy wastewater: Effects on the production of biomass, biochemical composition and antioxidant capacity. PLoS ONE 2019, 14(10), e0224294. [CrossRef]
  46. Gramegna, G.; Scortica, A.; Scafati, V.; Ferella, F.; Gurrieri, L.; Giovannoni, M.; Bassi, R.; Sparla, F.; Mattei, B.; Benedetti, M. Exploring the potential of microalgae in the recycling of dairy wastes. Bioresour. Technol. Rep. 2020, 12, 100604. [CrossRef]
  47. Kiani, H.; Ma, Q.; Xiao, M.; Li, Y.; Brooke, F.J.; Mulcahy, S.; Miros, S.; Halim, R. Growth and fatty acid profile of Nannochloropsis oceanica cultivated on nano-filtered whey permeate. J. Appl. Phycol. 2024. [CrossRef]
  48. Sánchez-Zurano, A.; Villaró-Cos, S.; Ciardi, M.; Acién-Fernández, F.G.; Fernández-Sevilla, J.M.; Lafarga, T. Assessment of the mixotrophic production of Chlorella vulgaris using milk whey as a nutrient source. J. Appl. Phycol. 2024, 36, 87–100. [CrossRef]
  49. Markou, G.; Kougia, E.; Arapoglou, D.; Chentir, I.; Andreou, V.; Tzovenis, I. Production of Arthrospira platensis: Effects on Growth and Biochemical Composition of Long-Term Acclimatization at Different Salinities. Bioengineering 2023, 10(2), 233. [CrossRef]
  50. Arahou, F.; Hassikou, R.; Arahou, M.; Rahzi, L.; Wahby, I. Influence of culture conditions on Arthrospira platensis growth and valorization of biomass as input for sustainable agriculture. Aquacult. Int. 2021, 29, 2009–2020. [CrossRef]
  51. Wang, J.; Qin, S.; Lin, J.; Wang, Q.; Li, W.; Gao, Y. Phycobiliproteins from microalgae: research progress in sustainable production and extraction processes. Biotechnol Biofuels 2023, 16, 170. [CrossRef]
  52. Nur, M.M.A.; Rahmawati, S.D.; Sari, I.W.; Achmad, Z.; Setyoningrum, T.M.; Jaya, D.; Murni, S.W.; Djarot, I.N. Enhancement of phycocyanin and carbohydrate production from Spirulina platensis growing on tofu wastewater by employing mixotrophic cultivation condition. Biocatal. Agric. Biotechnol. 2023, 47, 102600. [CrossRef]
  53. Russo, N.P.; Ballotta, M.; Usai, L.; Torre, S.; Giordano, M.; Casula, M.; Fais, G.; Dessi, D.; Nieri, P.; Damergi, E.; Concas, A.; Lutzu, G.A. Mixotrophic cultivation of Arthrospira platensis (Spirulina) under salt stress: Effect on biomass composition, FAME profile, and phycocyanin content. Mar. Drugs 2024, 22(9), 381. [CrossRef]
  54. Pavan, M.; Reinmets, K.; Garg, S.; Mueller, A.P.; Marcellin, E.; Köpke, M.; Valgepea, K. Advances in Systems Metabolic Engineering of Autotrophic Carbon Oxide-Fixing Biocatalysts towards a Circular Economy. Metab. Eng. 2022, 71, 117-141. [CrossRef]
  55. Athanasiadou, V.; Klontza, E.E.; Dimitriou-Christidis, P.; Fountoulakis, M.; Lekkas, D.F. Evaluation of Arthrospira (Spirulina) platensis growth on cheese whey in the context of circular economy. Sustain. Chem. Pharm. 2023, 34, 101173.
  56. Salah, A.; Sany, H.; El-Sayed, A.EK.B; El-Bahbohy, R.M.; Mohamed, H.I.; Amin, A. Growth Performance and Biochemical Composition of Desmodesmus sp. Green Alga Grown on Agricultural Industries Waste (Cheese Whey). Water Air Soil Pollut. 2023, 234, 770. [CrossRef]
  57. Salati, S.; D'Imporzano, G.; Menin, B.; Veronesi, D.; Scaglia, B.; Abbruscato, P.; Mariani, P.; Adani, F. Mixotrophic cultivation of Chlorella for local protein production using agro-food by-products. Bioresour. Technol. 2017, 230, 82-89. [CrossRef]
  58. Soni, B.; Sudhakar, K. Phycocyanin production, extraction and purification techniques: A review. Algal Res. 2021, 59, 102486. [CrossRef]
  59. Lauceri, R.; Cavone, C.; Chini Zittelli, G.; Kamburska, L.; Musazzi, S.; Torzillo, G. High purity grade phycocyanin recovery by decoupling cell lysis from the pigment extraction: an innovative approach. Food Bioprocess Technol. 2023, 16(1), 111–121. [CrossRef]
  60. da Silva Figuera, F.; Costa Moraes, C.; Juliano Kalil, S. C-Phycocianin purification: Multiple processes for different applications. Braz. J. Chem. Eng. 2018, 35 (3). [CrossRef]
  61. Kurpan, D.; Idà, A.; Körner, F.; Lauceri, R.; Rocculli, P.; Phillips, R.; Scievano, A. Pilot-scale concentration and partial purification of food-grade phycocyanin from Arthrospira platensis via cross flow filtration: From biomass to final product. J. Appl. Phycol. 2023, 35, 2709–2718. [CrossRef]
  62. MRFB – 104430. Phycocyanin Market Size, Share, Forecast, and Trends Analysis by Form (Powder, Liquid), Grade (Food-grade, Reagent grade, Cosmetic-grade Phycocyanin), Category (Non-Organic), Application (Food and Beverages, Pharaceuticals) – Global Forecast to 2031. 2024, Pag. 194.
  63. Ali, S.S.; Hassan, L.H.; El-Sheekh, M. Microalgae-mediated bioremediation: current trends and opportunities-a review. Arch. Microbiol. 2024, 206, 343. [CrossRef]
  64. Maroneze, M.M.; Dias, R.R.; Severo, I.A.; Queiroz, M.I. Microalgae-Based Processes for Pigments Production. In: Pigments from Microalgae Handbook; Jacob-Lopes, E., Queiroz, M., Zepka, L., Eds.; Springer, Cham. 2020. [CrossRef]
  65. Lu, X.; Zhao, W.; Wang, J.; He, W.; Yang, S.; Sun, H.A comprehensive review on the heterotrophic production of bioactive compounds by microalgae. World J. Microbiol. Biotechnol. 2024, 40, 210. [CrossRef]
  66. Devi, A.; Kalwani, M.; Patil, K.; Kumari, A.; Tyagi, A.; Shukla, P.; Pabbi, S. Microalgal Bio-pigments: Production and Enhancement Strategies to Enrich Microalgae-Derived Pigments. In: Cyanobacterial Biotechnology in the 21st Century; Neilan, B.; Passarini, M.R.Z.; Singh, P.K.; Kumar, A., Eds.; Springer, Singapore. 2023. [CrossRef]
  67. Perna, M.; Hewlings, S. Saturated Fatty Acid Chain Length and Risk of Cardiovascular Disease: A Systematic Review. Nutrients 2023, 15, 30. [CrossRef]
  68. Palomino, O.M.; Giordani, V.; Chowen, J.; Alfonso, S.F.; Goya, L. Physiological Doses of Oleic and Palmitic Acids Protect Human Endothelial Cells from Oxidative Stress. Molecules 2022, 27(16), 5217. [CrossRef]
  69. Delcheva, G.; Stefanova, K.; Stankova, T. Ceramides—Emerging Biomarkers of Lipotoxicity in Obesity, Diabetes, Cardiovascular Diseases, and Inflammation. Diseases 2024, 12, 195. [CrossRef]
  70. Cicerale, S; Lucas, L.; Keast, R.S.J. Biological Activities of Phenolic Compounds Present in Virgin Olive Oil. Int. J. Mol. Sci. 2010, 11(2), 458-479. [CrossRef]
  71. Maltsev, Y.; Maltseva, K. Fatty Acids of Microalgae: Diversity and Applications. Rev. Environ. Sci. Biotechnol. 2021, 20(2), 515. [CrossRef]
  72. Khannapho, C.; Phodee, A.; Paithoonrangsarid, K.; Hongstongh, A.; Meechai, A.; Cheevadhanarah, S.; Tanticharoen, M. Effect of dilution rate in continuous cultures of Arthrospira (Spirulina) platensis C1 on nutrient use efficiency and macromolecular- and elemental compositions. J. Appl. Phycol. 2021, 33, 743–754. [CrossRef]
  73. Prete, V.; Abate, A.C.; Di Pietro, P.; De Lucia, M.; Vecchione, C.; Carrizzo, A. Beneficial Effects of Spirulina Supplementation in the Management of Cardiovascular Diseases. Nutrients 2024, 16, 642. [CrossRef]
  74. Delgado-Lista, J.; Perez-Martinez, P.; Lopez-Miranda, J.; Perez-Jimenez, F. Long chain omega-3 fatty acids and cardiovascular disease: a systematic review. Br. J. Nutr. 2012, 107(2), S201-13. [CrossRef]
  75. Zhong, N.; Han, P.; Wang, Y.; Zheng, C. Associations of polyunsaturated fatty acids with cardiovascular disease and mortality: a study of NHANES database in 2003–2018. BMC Endocr. Disord. 2023, 23, 185. [CrossRef]
  76. Zock, P.L.; Blom, W.A.M.; Nettleton, J.A.; Hornstra, G. Progressing Insights into the Role of Dietary Fats in the Prevention of Cardiovascular Disease. Curr. Cardiol. Rep. 2016, 18, 111. [CrossRef]
  77. Silva, F.A.; Medeiros, V.P.B.; Costa, W.K.A., dos Santos, R.L., Somera, T.; Pimentel, T.C.; Magnani, M. Challenges and Perspectives for Alternative Media in Microalgae Cultivation: Main Substrates and Approaches and Potential of Alternative Derived Biomasses as Source of Bioactives. In: Microalgal Bioengineering; Costa, J.A.V.; Mitchell, B.G.; Benemann, J., Eds. Springer, Cham. 2024. [CrossRef]
  78. Liu, Y.; Ren, X.; Fan, C.; Wu, W.; Zhang, W.; Wang, Y. Health Benefits, Food Applications, and Sustainability of Microalgae-Derived N-3 PUFA. Foods 2022, 11, 1883. [CrossRef]
  79. Conde, T.A.; Neves, B.F.; Couto, D.; Melo, T.; Neves, B.; Costa, M.; Silva, J.; Domingues, P.; Domingues, M.R. Microalgae as Sustainable Bio-Factories of Healthy Lipids: Evaluating Fatty Acid Content and Antioxidant Activity. Mar. Drugs 2021, 19(7), 357. [CrossRef]
  80. Matos, Â.P.; Feller, R.; Moecke, E.H.S.; de Oliveira, J.V.; Junior, A.F.; Derner, R.B.; Sant’Anna, E.S. Chemical Characterization of Six Microalgae with Potential Utility for Food Application. J. Am. Oil Chem. Soc. 2016, 93, 963-972. [CrossRef]
  81. Centeno da Rosa., A.P.; Moraes, L.; de Morais, E.G.; Costa, J.A.V. Fatty Acid Biosynthesis from Chlorella in Autotrophic and Mixotrophic Cultivation. Braz. Arch. Biol. Technol. 2020, 63, e20180534. [CrossRef]
  82. Laraib, N.; Manzoor, M.; Javid, A.; Jabeen, F.; Bukhari, S.M.; Ali, W.; Hussain A. Mixotrophic cultivation of Chlorella vulgaris in sugarcane molasses preceding nitrogen starvation: Biomass productivity, lipid content, and fatty acid analyses. Environ. Prog. Sustain. Energy. 2021; 40, e13625. [CrossRef]
  83. Yun, H.S., Kim, Y.S., Yoon, H.S. Effect of Different Cultivation Modes (Photoautotrophic, Mixotrophic, and Heterotrophic) on the Growth of Chlorella sp. and Biocompositions. Front Bioeng Biotechnol. 2021; 9, 774143. [CrossRef]
  84. Ogbonna, K.E.; Ogbonna, J.C.; Njoku, O.U.; Yamada, K.; Suzuki, I. Effect of organic carbon sources on growth, lipid production and fatty acid profile in mixotrophic culture of Scenedesmus dimorphus (Turpin) Kützing, The Microbe, Volume 3, 2024. [CrossRef]
  85. Mansouri, H.; Nezhad, S. Improvement in biochemical parameters and changes in lipid profile of Scenedesmus obliquus by plant growth regulators under mixotrophic condition. Biomass Bioenergy. 2020, 140. 105708. 10.1016/j.biombioe.2020.105708.
  86. Přibyl, P.; Cepák, V. Screening for heterotrophy in microalgae of various taxonomic positions and potential of mixotrophy for production of high-value compounds. J. Appl. Phycol. 2019, 31. 10.1007/s10811-019-1738-9.
Figure 1. Time evolution of optical density at 680 nm in SW (a), BMW (b) and DWW (c) media containing different percentages of CW.
Preprints 144211 g001
Figure 2. Comparison of growth performance indicators maximum biomass concentration (Xmax) (a), specific growth rate (µ) (b), average biomass productivity (ΔX) (c), and doubling time (td) (d) in SW media with different CW percentages. Mean differences were compared using ordinary one-way ANOVA and two-way ANOVA with Dunnett’s corrections for multiple comparisons (n = 3; **** indicates p < 0.0001).
Preprints 144211 g002
Figure 3. Comparison of growth performance indicators maximum biomass concentration (Xmax) (a), specific growth rate (µ) (b), average biomass productivity (ΔX) (c), and doubling time (td) (d) in BMW media with different CW percentages. Mean differences were compared using ordinary one-way ANOVA and two-way ANOVA with Dunnett’s corrections for multiple comparisons (n = 3; **** indicates p < 0.0001).
Preprints 144211 g003
Figure 4. Comparison of growth performance indicators maximum biomass concentration (Xmax) (a), specific growth rate (µ) (b), average biomass productivity (ΔX) (c), and doubling time (td) (d) in DWW media with different CW percentages. Mean differences were compared using ordinary one-way ANOVA and two-way ANOVA with Dunnett’s corrections for multiple comparisons (n = 3; **** indicates p < 0.0001).
Preprints 144211 g004
Figure 5. Total carbohydrates (TC), total lipids (TL), and total proteins (TP) obtained in SW, BMW, and DWW media under three different CW contents. Mean differences were compared using Tukey’s test (n = 3; *** indicates p < 0.001).
Preprints 144211 g005
Figure 6. Concentration of phycocyanin (PC), allophycocyanin (APC), phycoerythrin (PE), and total phycobiliproteins (PBPs) in extracts of A. platensis grown in SW (a), BMW (b), and DWW (c) media under three different CW content. Mean differences were compared using Tukey’s test (n = 3, ** p < 0.01; *** p < 0.001; **** indicates p < 0.0001).
Preprints 144211 g006
Figure 7. Purity (a) and yield (b) of phycocyanin (PC) in extracts of A. platensis grown in SW, BMW, and DWW media under three different CW content. Mean differences were compared using Tukey’s test (n = 3, * p < 0.05).
Preprints 144211 g007
Table 1. Composition of cheese whey used in this study.
Preprints 144211 i001
Note: SW = scotta whey, the remaining liquid after the production of ricotta, BMW = buttermilk wastewater, DWW = final cheese whey wastewater, BOD5 = biological oxygen demand, COD = chemical organic demand. All the concentrations are expressed in terms of mg L-1.
Table 2. Experimental setup.
Preprints 144211 i002
Table 3. Impact of various growth media on FAME composition. Data are presented as mean% ± standard deviation (n = 6). The percentages is to the total dry weight of the FAMEs.
FAMEs C:N$ CTRL SW-1% SW-2% SW-4% BMW-1% BMW-2% BMW-4% DWW-1% DWW-2% DWW-4%
Myristic acid 14:00 1.80 ± 0.16 1.96 ± 1.07 2.32 ± 0.87 2.60 ± 0.74 2.57 ± 0.34 2.58 ± 0.44 2,16 ± 0.18 2.90 ± 0.20⁕⁕ 2.74 ± 0.32⁕ 2.72 ± 0.11⁕
Hexadecanoic acid 16:00 40.09 ± 4.77 42.77 ± 1.54 41.74 ± 1.07 40.35 ± 1.11 40.88 ± 0.58 41.48 ± 0.50 41.81 ± 0.64 41.83 ± 0.56 42.55 ± 0.53 42.15 ± 0.45
Hexadecenoic acid 16:01 3.79 ± 0.70 4.56 ± 0.71 4.36 ± 0.46 5.65 ± 1.00 6.00 ± 1.29 5.28 ± 0.38 6.43 ± 0.22 4.07 ± 0.24 3.77 ± 0.37 4.08 ± 0.91
Heptadecanoic acid 17:00 0.22 ± 0.08 0.18 ± 0.07 0.15 ± 0.03 0.20 ± 0.03 0.14 ± 0.02 0.15 ± 0.01 0.14 ± 0.00 0.13 ± 0.02 0.12 ± 0.01 0.12 ± 0.02
10-Heptadecenoic acid 17:1 cis 0.27 ± 0.04 0.31 ± 0.14 0.31 ± 0.03 0.36 ± 0.15 0.28 ± 0.01 0.25 ± 0.06 0.20 ± 0.01 0.22 ± 0.02 0.17 ± 0.07 0.21 ± 0.05
Stearic acid 18:00 26.81 ± 2.35 19.71 ± 7.37 17.11 ± 2.31 15.53 ± 4.34 14.99 ± 0.33 16.18 ± 2.11 18.56 ± 1.62 19.63 ± 0.15 22.35 ± 1.71 20.93 ± 1.97
Elaidic acid 18:1 trans 0.63 ± 0.24 0.78 ± 0.08 1.54 ± 0.37 3.80 ± 1.17 1.37 ± 0.27 1.13 ± 0.32 1.53 ± 0.18⁕ 1.21 ± 0.10 1.23 ± 0.07 0.87 ± 0.12
Oleic acid 18:1 cis 5.91 ± 0.48 6.29 ± 1.77 5.59 ± 0.50 6.19 ± 0.88 6.05 ± 0.27 5.98 ± 1.48 4.63 ± 0.29 6.18 ± 1.38 5.00 ± 1.03 5.97 ± 0.17
Linoleic acid 18:02 7.26 ± 0.31 8.40 ± 2.04 8.82 ± 0.22 9.18 ± 2.29 9.75 ± 0.55 9.45 ± 0.84 8.58 ± 0.72 8.39 ± 0.79 7.55 ± 0.77 8.06 ± 0.91
α-Linolenic acid 18:3 ω-3 1.24 ± 0.05 0.57 ± 0.61 0.83 ± 0.74 0.36 ± 0.22 0.69 ± 0.42 0.56 ± 0.04 0.21 ± 0.09 0.40 ± 0.06 0.52 ± 0.15 0.49 ± 0.28
y-Linolenic acid 18:3 ω-6 10.60 ± 0.51 13.33 ± 3.17 15.66 ± 1.12 14.33 ± 2.63⁕ 15.70 ± 0.95 15.34 ± 0.93 14.48 ± 1.32⁕⁕ 13.65 ± 0.71 12.63 ± 1.02 13.11 ± 1.07
8,11,14-Eicosatrienoic acid 20:03 1.19 ± 0.12 0.96 ± 0.30 0.99 ± 0.25 0.89 ± 0.23 1.18 ± 0.23 1.21 ± 0.19 0.88 ± 0.04 1.05 ± 0.23 1.03 ± 0.20 1.03 ± 0.15
13-Docosenoic acid 22:01 0.19 ± 0.02 0.19 ± 0.08 0.58 ± 0.32 0.57 ± 0.21 0.40 ± 0.05 0.41 ± 0.05 0.39 ± 0.03 0.34 ± 0.05 0.35 ± 0.05 0.24 ± 0.05
Σ SFAs / 68.92 64.62 61.32 58.68 59.78 60.39 62.67 64.49 67.76 65.92
Σ UFAs / 31.08 35.39 38.68 41.33 41.02 39.61 37.33 35.51 32.25 34.06
Σ MUFAs / 10.79 12.13 12.38 16.57 13.7 13.05 13.18 12.02 10.52 11.37
Σ PUFAs / 20.29 23.26 26.30 24.76 27.32 26.56 24.15 23.49 21.73 22.69
PUFA:SFA / 0.29 0.36 0.43 0.42 0.46 0.44 0.38 0.36 0.32 0.34
C16-C18 / 96.33 96.41 95.65 95.39 95.43 95.40 96.23 95.36 95.60 95.66
h/H / 0.64 0.74 0.76 0.81 0.80 0.76 0.69 0.69 0.62 0.66
Note: $ represents the C ratio, referring to the number of carbon atoms (C) and double bonds (N). CTRL = control, SW = scotta wastewater, BMW = buttermilk wastewater, DWW = dairy wastewater, SFA = saturated fatty acids, UFA = unsaturated fatty acids, MUFA = monounsaturated fatty acids, PUFA = polyunsaturated fatty acids, h/H = hypocholesterolemic/hypercholesterolemic ratio. Mean differences were analyzed using two-way ANOVA. The absence of an asterisk indicates a p-value > 0.05; * denotes p-value < 0.05; ** denotes p-value < 0.01; **** denotes p-value < 0.0001.
Table 4. Effect of mixotrophy on Thrombogenicity Index (TI), Atherogenicity Index (AI), and hypocholesterolemic/hypercholesterolemic (h/H) ratio by various microalgae strains.
Microalgae Organic source TI AI h/H ratio Reference
Arthrospira platensis dairy 0.86 0.97 0.81 This work
Arthrospira platensis photoautotrophy 1.60 0.70 0.60 [79]
Arthrospira platensis photoautotrophy 1.46 1.1 0.66 [80]
Arthrospira platensis dairy 0.94 0.84 1.07 [22]
Arthrospira platensis brewery 3.51 1.76 0.74 [24]
Chlorella kessleri glucose 1.51 1.64 1.47 [81]
Chlorella vulgaris molasses 0.79 0.71 2.67 [82]
Chlorella vulgaris glucose 0.42 0.40 2.80 [81]
Chlorella vulgaris glucose 0.38 0.39 2.36 [83]
Chlorella vulgaris brewery 0.48 1.21 2.55 [23]
Chlorella vulgaris dairy 0.59 1.77 1.86 [24]
Chlorella sorokiniana glucose 0.31 0.45 1.76 [83]
Chlorella sorokiniana glucose 0.42 0.49 2.00 [83]
Chromocloris zofingensis molasses 0.40 0.23 3.73 [21]
Chromocloris zofingensis dairy 0.40 0.21 4.22 [21]
Nannochloropsis oceanica photoautotrophy 0.30 0.60 1.44 [79]
Scenedesmus dimorphus glucose 4.00 1.68 1.07 [84]
Scenedesmus obliquus sodium acetate - - 2.09 [85]
Tetraselmis chui photoautotrophy 0.20 0.40 1.04 [79]
Tribonema aequale glucose 0.18 1.02 3.70 [86]
Disclaimer/Publisher’s Note: The statements, opinions and data contained in all publications are solely those of the individual author(s) and contributor(s) and not of MDPI and/or the editor(s). MDPI and/or the editor(s) disclaim responsibility for any injury to people or property resulting from any ideas, methods, instructions or products referred to in the content.
Copyright: This open access article is published under a Creative Commons CC BY 4.0 license, which permit the free download, distribution, and reuse, provided that the author and preprint are cited in any reuse.
Prerpints.org logo

Preprints.org is a free preprint server supported by MDPI in Basel, Switzerland.

Subscribe

Disclaimer

Terms of Use

Privacy Policy

Privacy Settings

© 2025 MDPI (Basel, Switzerland) unless otherwise stated