Submitted:
25 December 2024
Posted:
26 December 2024
You are already at the latest version
Abstract
This paper provides a comprehensive overview of tomography and the various tomographic imaging modalities available today. Its primary aim is to offer readers a foundational understanding of these imaging techniques, focusing on how imaging is conducted, the underlying principles of operation, and their practical applications. Instead of going in-depth into the mathematical theories behind each modality, the paper is intended to present the information in a clear and accessible manner for the benefit of a broad audience. The imaging modalities discussed are categorized based on the physics and math behind their image formation. The paper begins by introducing the general concept of tomography and then explores specific modalities in detail, including Computed Tomography (CT), Ultrasound Imaging, Magnetic Resonance Imaging (MRI), Electrical Impedance Tomography, Photoacoustic Tomography (PAT), and Positron Emission Tomography (PET). In addition, the paper examines two emerging imaging modalities, Diffuse Optical Spectroscopic Tomography (DOST) and functional Near-infrared Spectroscopy (fNIRS), offering a review of their fundamentals and potential applications. This structured approach ensures readers gain a solid conceptual understanding of a wide range of imaging technologies.
Keywords:
Medical Imaging
; Tomography
; Electrical Impedance Tomography
; Computed Tomography
; Diffuse Optical Spectroscopic Tomography
; Magnetic Resonance Imaging
; Photoacoustic Tomography
; Functional nearinfrared spectroscopy
; Positron Emission
1. Introduction
The term "Tomography" originates from the Greek words "Tomos," meaning a cross-section, and "graph," referring to imaging. In its modern context, tomography involves reconstructing a higher-dimensional object from its measured projections onto a lower-dimensional space. This process typically involves acquiring information about an object’s internal properties using a probing method, such as light or X-rays. The collected data, combined with a mathematical model, is then used to solve an inverse problem to generate an image that represents the object’s internal properties.
The concept of tomography dates back to 1914, when Karol Mayer first proposed the idea [1]. Building on this foundational concept, researchers such as Bocage, Grossman, and Vallebona developed equipment to advance the field [2]. In 1931, Ziedses des Plantes conducted an in-depth study and published detailed findings on tomography [3]. However, the field took a significant leap in 1972 when Sir Godfrey Hounsfield developed and commercialized the first axial computed tomography (CT) scanner. This groundbreaking invention allowed for the reconstruction of 3-D images of body parts from 2-D X-ray projections [4,5] and became one of the most impactful innovations in medical radiology since the discovery of X-rays.
The tomography process begins with the use of a probing beam, such as X-rays or light, to interact with the object. The propagation and interaction of the beam through the object are described using mathematical equations. These equations help estimate the object’s projections onto a lower-dimensional space. Instruments designed to measure these projections are referred to as "tomographs," and the resulting reconstructed images are called "tomograms."
In the specific case of computed tomography, the mathematical model employed for X-ray propagation through the body is based on the integral form of Beer’s law, which provides a closed-form solution for the X-ray absorption coefficient distribution. In contrast, refraction tomography uses the eikonal equation to describe optical ray paths. Unlike Beer’s law, the eikonal equation lacks a closed-form inversion formula, necessitating iterative methods for image reconstruction. These mathematical frameworks highlight the sophistication and precision required in tomography, making it an essential tool in modern imaging science.
2. Medical Imaging Techniques
The choice of imaging modality in tomography is determined by the type of probing beam used, leading to a wide variety of techniques tailored to specific applications. Tomograms are generated through the use of different physical phenomena, including X-rays, nuclear magnetic resonance, positron-electron annihilation reactions, gamma rays, electrons, ultrasound waves, ions, and light. Each of these phenomena provides unique insights into the internal properties of an object, enabling the reconstruction of detailed cross-sectional images. Tomographic techniques are further categorized based on the arrangement of the source and detector, as well as the nature of the interaction with the object. There are three primary types of tomography:
- Reflection Tomography: In this approach, both the source and detector are positioned outside the object. The probing beam interacts with the object and is reflected back to the detector, allowing the reconstruction of the internal structure.
- Transmission Tomography: Here, the source and detector remain external to the object, but the beam passes through the object, and the transmitted signal is captured by the detector. This method is particularly effective in revealing internal absorption or density variations.
- Emission Tomography: In contrast to the other two types, the source in emission tomography is located within the object itself. The emitted signals, often from radioactive tracers or other internal phenomena, are measured by external detectors to create an image.
Each of these tomographic modalities is designed to measure distinct physical quantities, making them suited to different imaging requirements. This paper provides an overview of these various imaging techniques, emphasizing their principles and applications. Moreover, the paper highlights modern imaging methods, such as Diffuse Optical Spectroscopic Tomography (DOST) and functional Near-Infrared Spectroscopy (fNIRS). These advanced techniques offer significant advantages, including non-invasive operation and the ability to probe functional and structural information. The discussion focuses on their growing relevance and potential in the field of cross-sectional imaging, reflecting the evolution of tomographic technology toward innovative and versatile applications.
2.1. Computed Tomography (CT)
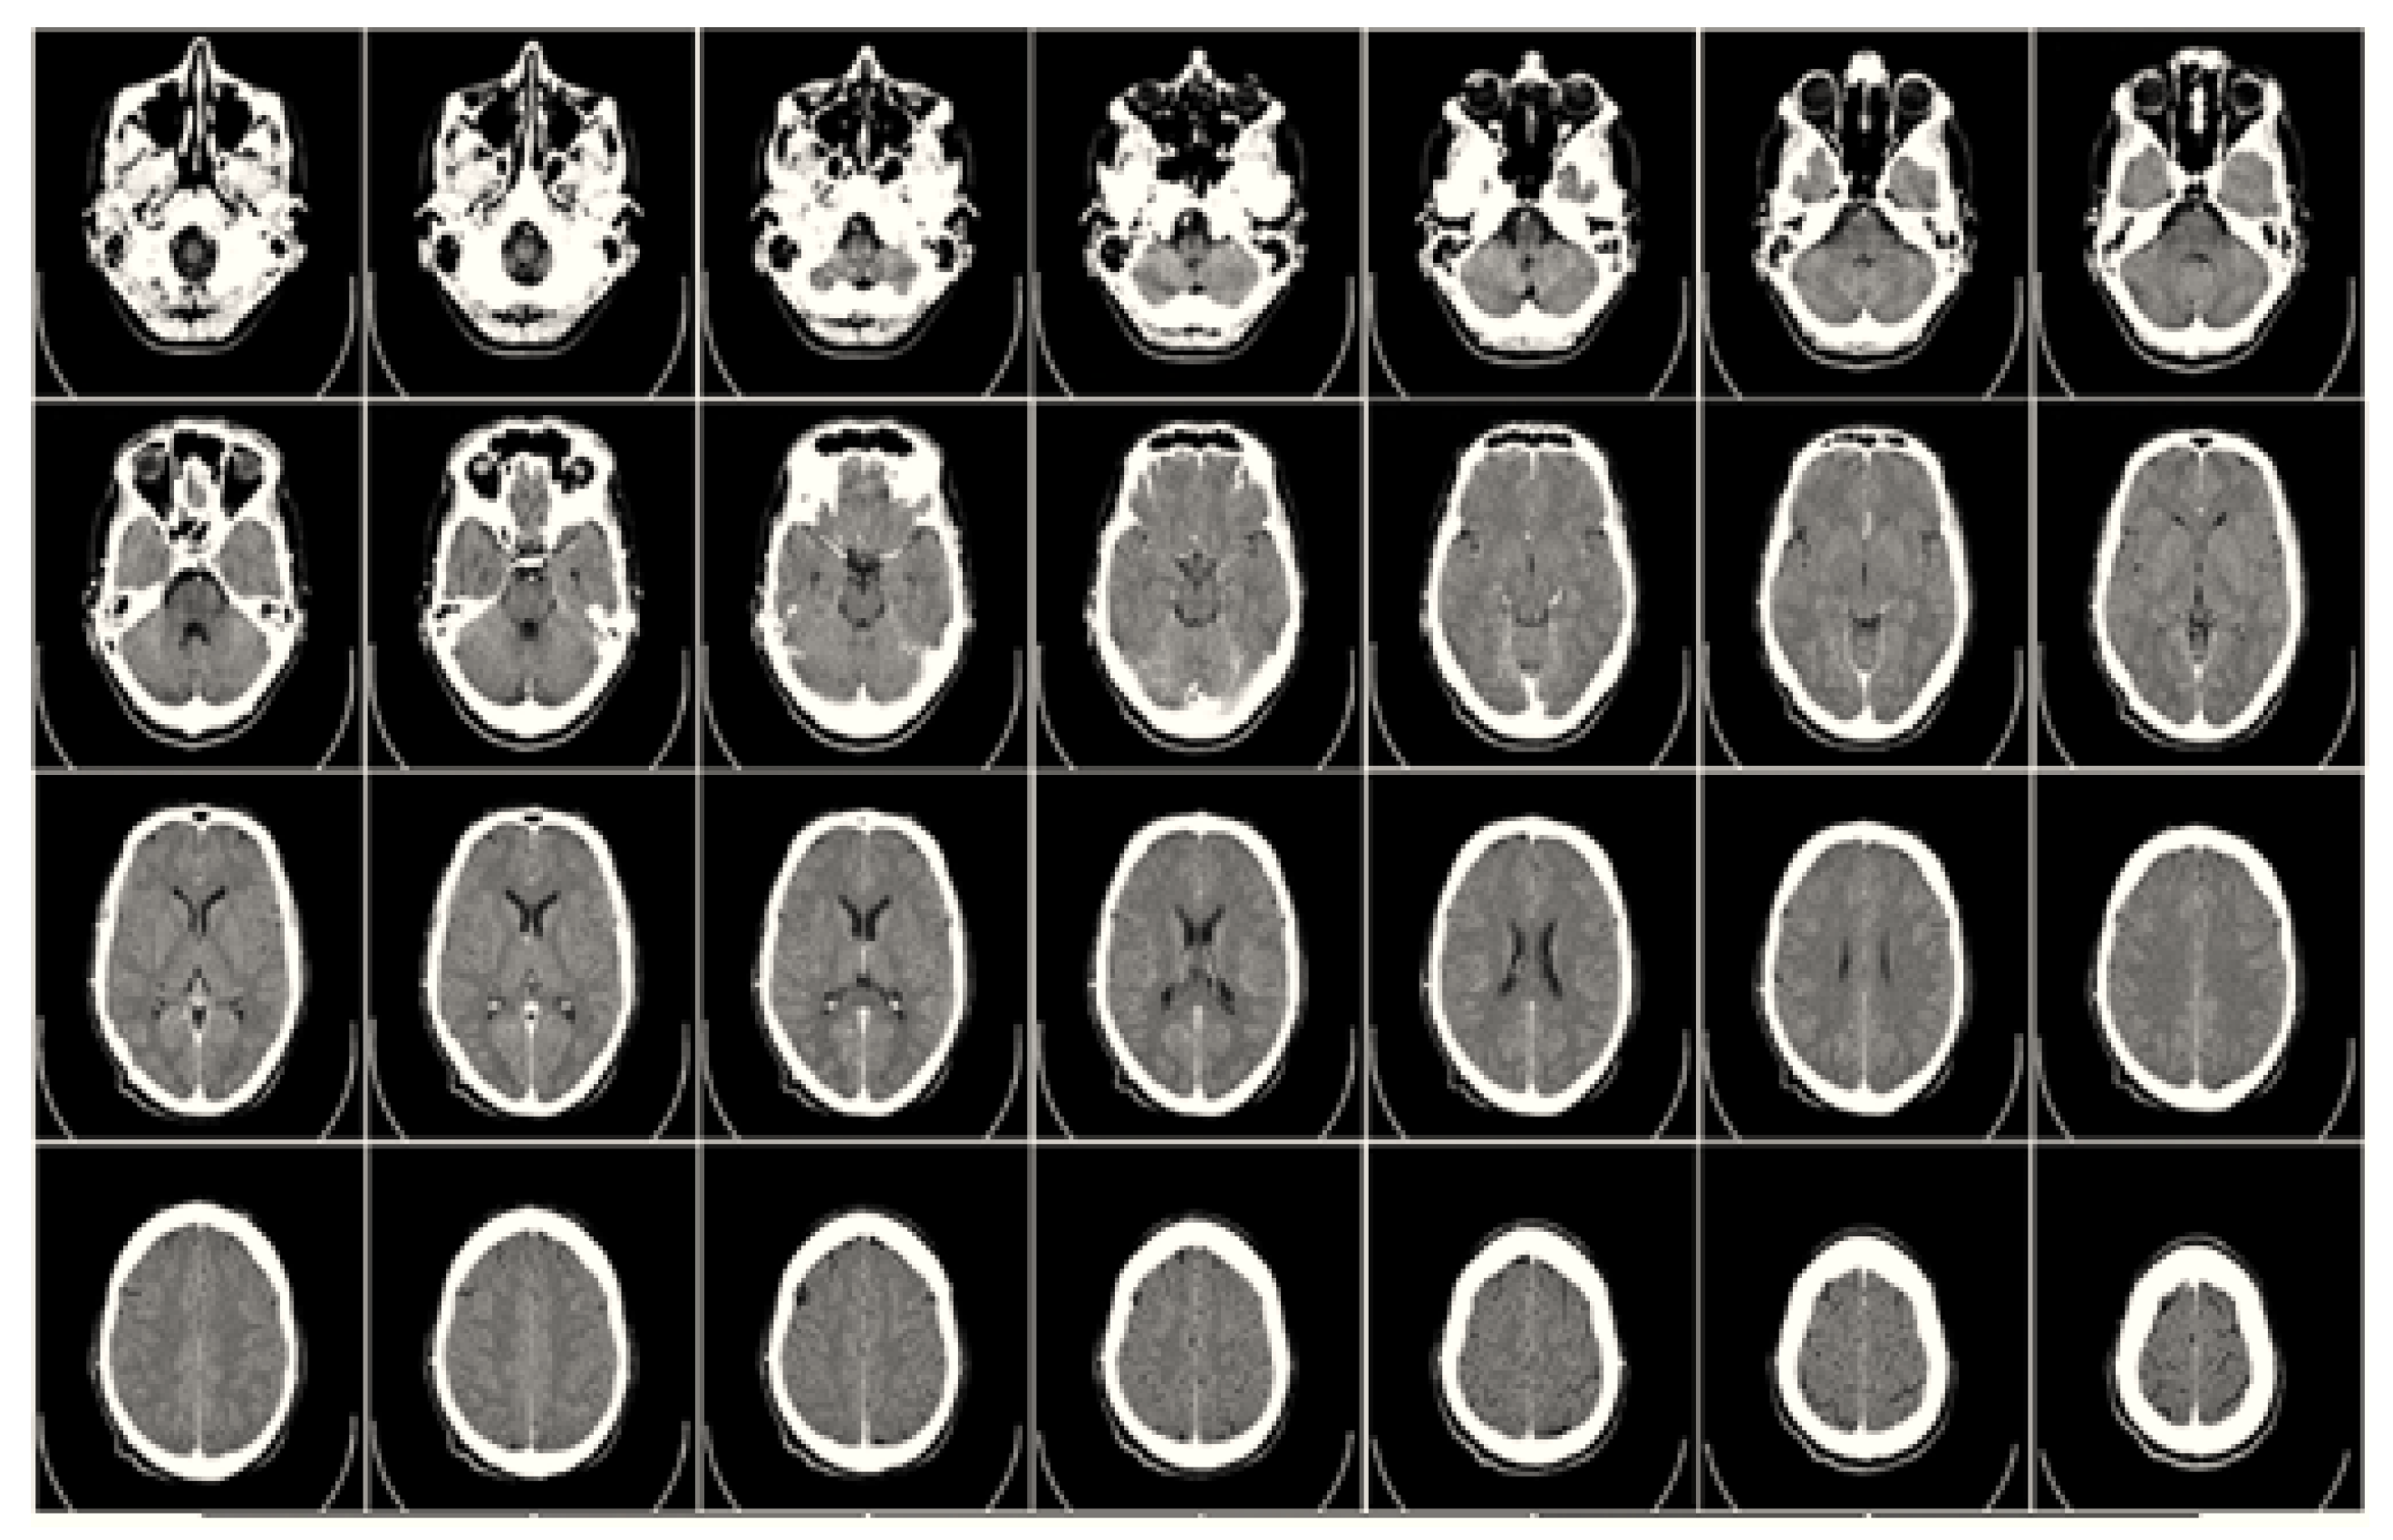
Computed Tomography (CT) is a sophisticated imaging technique capable of non-destructively generating both two-dimensional cross-sectional images and three-dimensional volumetric images of the human body or other objects using X-rays. This technology is based on the principle proposed by Johann Radon in 1917, which states that a three-dimensional object can be reconstructed from a finite number of its two-dimensional projections [6]. The first functional CT scanner was developed in 1972 and patented by Godfrey N. Hounsfield [7]. This groundbreaking innovation laid the foundation for modern CT imaging systems. During a CT scan, the object to be imaged is placed on a rotating platform located between an X-ray source and a series of detectors. The stage’s rotation, along with the precise movement and alignment of the detectors, is controlled by a computer. This setup ensures that the X-ray images captured at various angles correspond accurately to the object’s spatial orientation. The imaging system initially generates a two-dimensional shadowgraph of the object, akin to a conventional radiograph. However, the real power of CT lies in its ability to process these images using advanced mathematical models. This processing reconstructs highly detailed cross-sectional images of the object, providing a clear view of its internal structures. Moreover, CT can produce volumetric data that can be manipulated through techniques like windowing, enabling clinicians to focus on specific tissues or structures. CT imaging is renowned for its ability to produce high-contrast images, capable of distinguishing tissues that differ in density by as little as 1%. This precision makes CT invaluable for a wide range of medical applications. It is commonly used to obtain detailed images of the brain, spine, chest, and abdomen. CT scans aid in diagnosing diseases, guiding surgical procedures, assisting in biopsies, locating tumors and cancerous growths, and examining blood vessels. Its versatility, clarity, and diagnostic accuracy have established CT as a cornerstone of modern medical imaging.
Figure 1.
Human brain computed tomography (CT) image.
2.2. Ultrasound Imaging Technique
Ultrasound imaging, also known as sonography, is a widely used medical imaging technique that utilizes high-frequency sound waves to create images of the internal structures of the body. The process involves a small handheld device, called a probe, equipped with ultrasound transducers. A special gel is applied to the skin to eliminate air gaps and ensure efficient transmission of sound waves between the probe and the body. These sound waves propagate through the tissues, and their reflections are captured to form detailed images [8]. The concept of ultrasound imaging is rooted in the principles of SONAR (Sound Navigation and Ranging), a technology originally inspired by nature, particularly the echolocation mechanism employed by bats to navigate and track objects in their environment. Ultrasound imaging falls under the category of reflection tomography because it relies on the reflection of sound waves from different tissue interfaces to generate images. The use of ultrasound for medical purposes has its origins in the work of physicists who studied the energy and propagation of sound waves. The pioneering contributions of researchers such as Wild and Reid in the 1950s marked the beginning of ultrasound’s application in medical imaging [9]. Their groundbreaking research laid the foundation for the development of this non-invasive and versatile diagnostic tool, which continues to play a vital role in modern medicine.
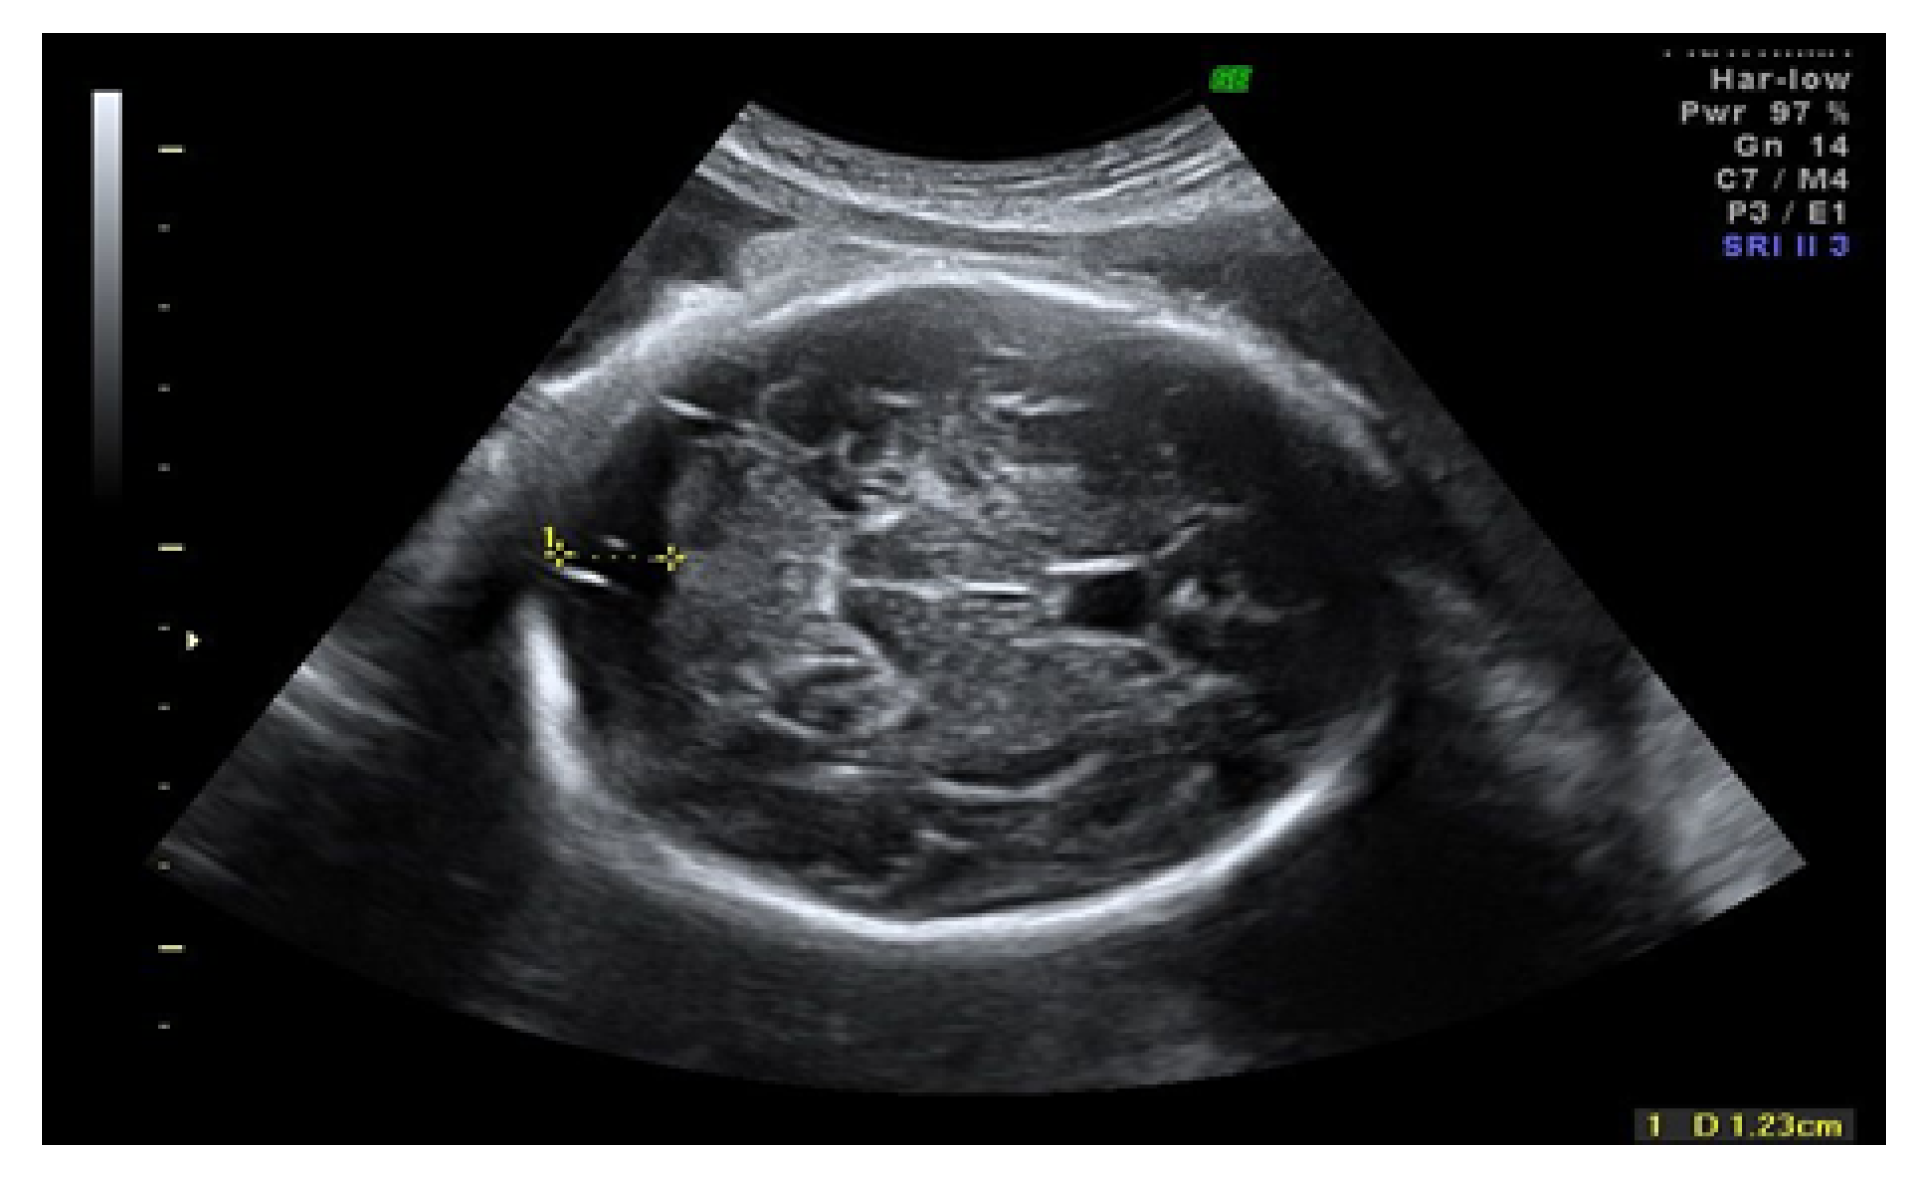
In an ultrasound scanning procedure, a small device known as a transducer is carefully placed on the skin directly above the area of interest. This transducer serves a dual purpose: it emits high-frequency ultrasound waves into the body and simultaneously detects the waves that are reflected back from internal structures. When the sound waves encounter boundaries between different types of tissues such as fluid and soft tissue, or soft tissue and bone—some waves are reflected back to the transducer, while others continue deeper into the body until they encounter another boundary, where additional reflections occur. The returning sound waves, also called echoes, are collected by the transducer and processed to create images displayed on a monitor. These images are two-dimensional representations of the internal structures and are reconstructed by analyzing changes in the frequency and intensity of the reflected sound signals, as well as measuring the time it takes for the waves to travel to and from the tissues (known as the time of flight). Ultrasound imaging has been extensively used in the medical field for more than three decades and is recognized for its exceptional safety record. Unlike imaging modalities that rely on ionizing radiation, such as X-rays, ultrasound employs non-ionizing sound waves, making it a risk-free diagnostic technique. This characteristic makes ultrasound particularly suitable for applications where safety is paramount, such as imaging during pregnancy in obstetrics. In addition to its safety, ultrasound is valued for its simplicity, speed, and cost-effectiveness. It is a widely accessible and reliable method for examining soft tissues and is commonly used to visualize organs, detect abnormalities, and monitor fetal development during pregnancy. Its versatility and ease of use have established it as a cornerstone of modern medical imaging.
Figure 2.
Fetus ultrasound image.
2.3. Magnetic Resonance Imaging (MRI)
Magnetic Resonance Imaging (MRI) is an advanced imaging technology that operates on the principle of Nuclear Magnetic Resonance (NMR). This technique uses a powerful magnetic field to create detailed images of the body’s internal structures. Since the human body is primarily composed of water, MRI is particularly effective for imaging hydrogen atoms found in water molecules. The concept of MRI was brought to life in 1972 by Raymond Vahan Damadian, a physician at Downstate Medical Center in Brooklyn, who demonstrated the world’s first MRI machine [10]. MRI is widely used in medical diagnostics, including tumor imaging. For enhanced visualization of specific tissues, paramagnetic contrast agents are often injected into the patient. These agents have a high affinity for tumor cells, increasing the contrast between normal and abnormal tissues, making it easier to identify and analyze tumors. The MRI process begins with the patient lying inside a cylindrical chamber surrounded by a powerful magnet. This magnet aligns the magnetic moments of atomic nuclei, primarily hydrogen atoms, within the body. A radiofrequency pulse is then applied, temporarily altering the alignment of these magnetic moments. As the nuclei return to their original alignment, they emit signals that are detected by the scanner. The emitted signals vary depending on the magnetic field gradients applied, which cause nuclei at different spatial locations to rotate at different frequencies. By applying these gradients in various orientations, spatial information is encoded. Fourier analysis of the recorded signals allows for the reconstruction of detailed two-dimensional or three-dimensional images of the scanned area.
MRI is renowned for its exceptional image quality, offering high-resolution views of soft tissues. Additionally, it can provide functional information when external contrast agents are used. Despite its advantages, MRI does have some limitations. Continuous real-time monitoring is not feasible due to the time required for contrast agents to distribute within target organs. Furthermore, the equipment’s reliance on superconducting magnets and fixed gantries to generate strong magnetic fields makes MRI scanners bulky and less portable compared to other imaging modalities. Despite these challenges, MRI remains a cornerstone of modern medical imaging, offering unparalleled insights into the human body.
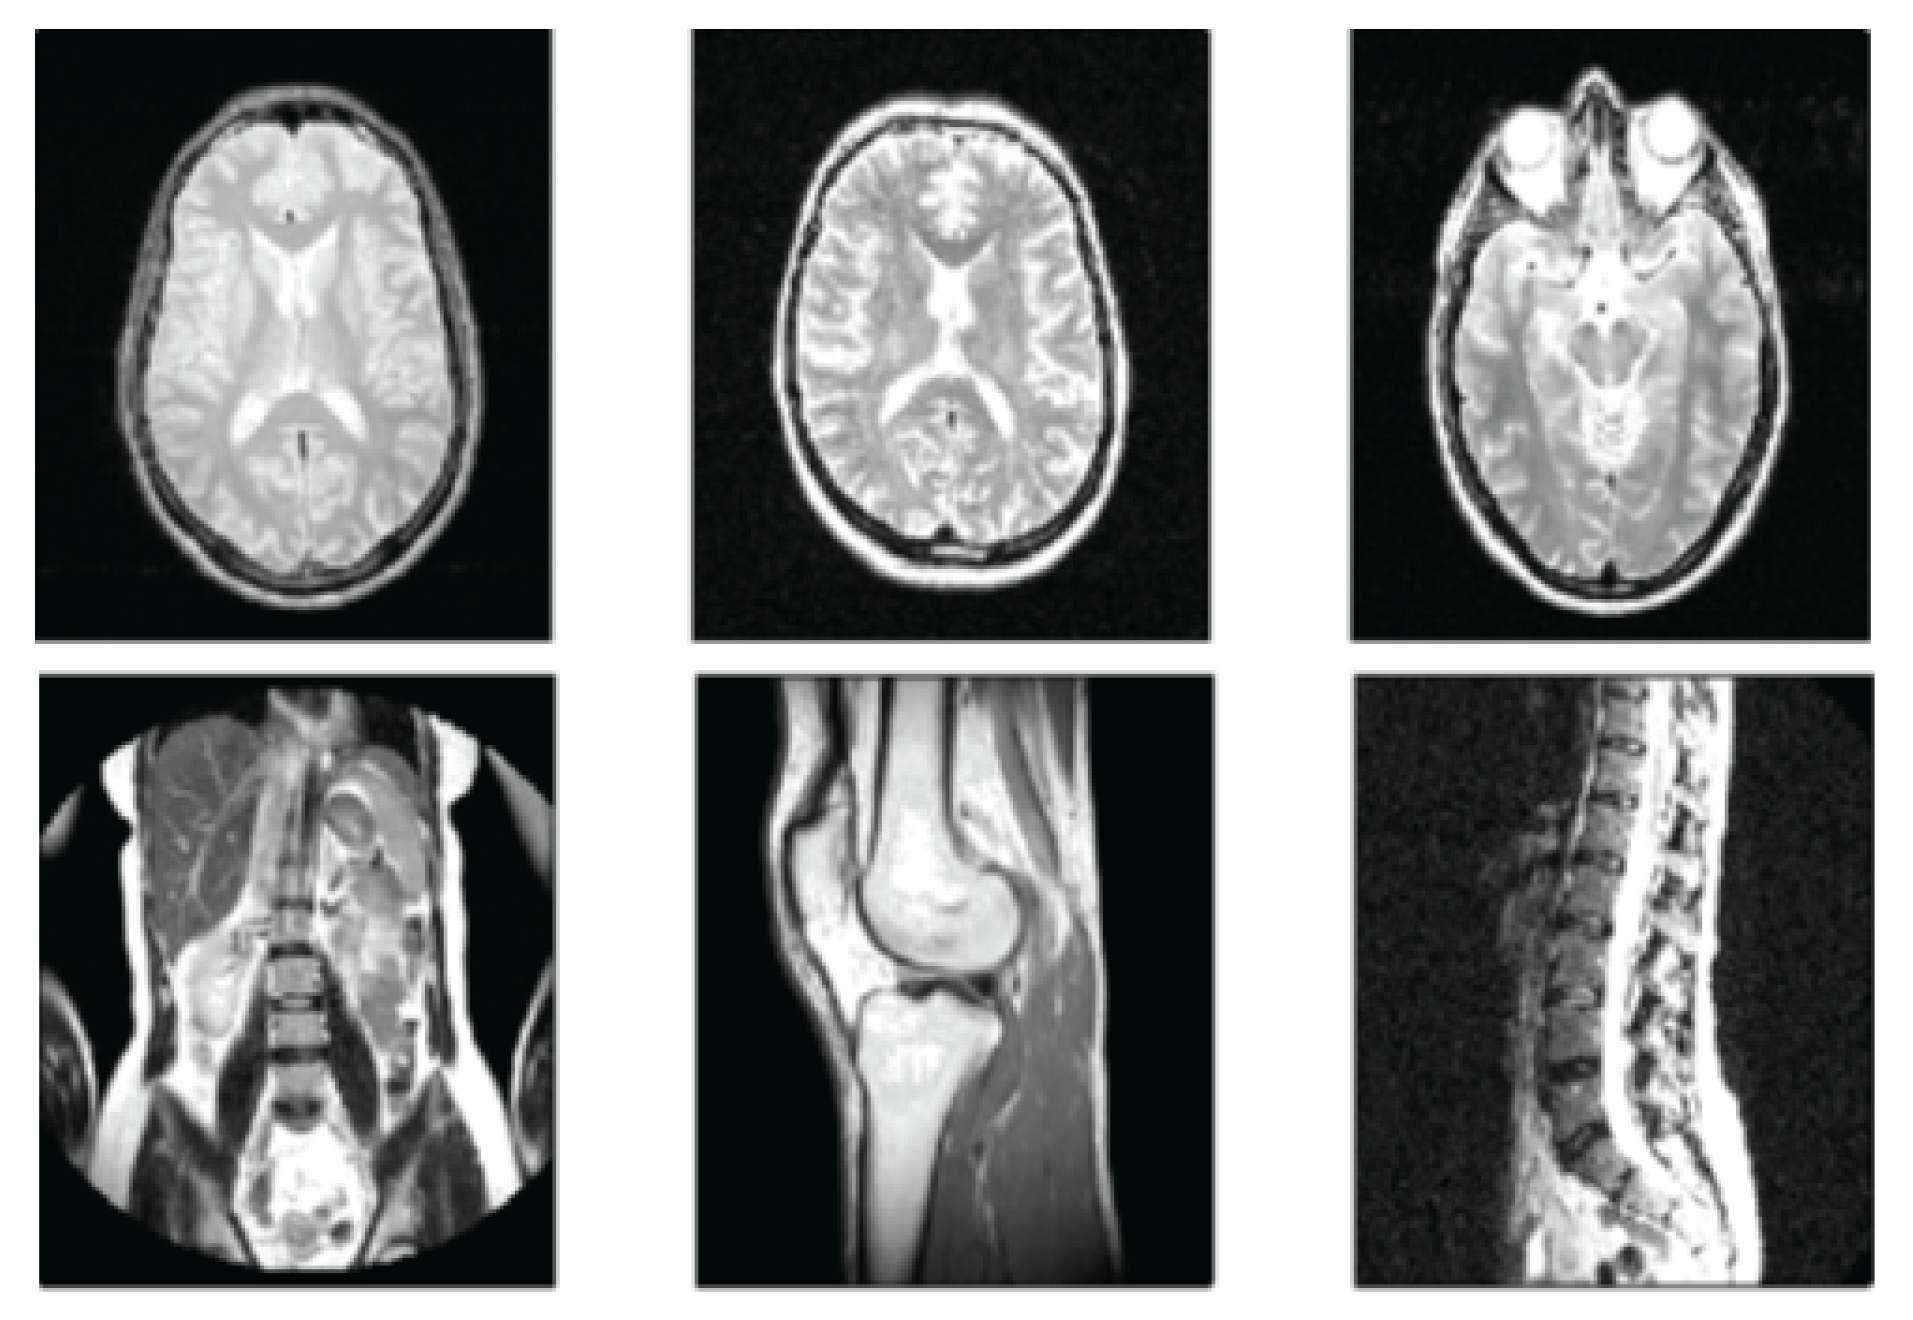
Figure 3.
Magnetic Resonance Imaging (MRI) images showcasing different regions of the human body, highlighting its ability to produce high-quality images of tissues.
Figure 3.
Magnetic Resonance Imaging (MRI) images showcasing different regions of the human body, highlighting its ability to produce high-quality images of tissues.
2.4. Electrical Impedance Tomography
Electrical Impedance Tomography (EIT) is a non-invasive medical imaging technique designed to reconstruct the distribution of conductivity and/or permittivity within biological tissues. This method is particularly useful for visualizing physiological changes in the body by analyzing how these changes affect the electrical impedance properties of tissues. EIT operates on the principle that injecting a small, constant current into the body and measuring the resulting voltage distribution on its surface provides insights into the internal impedance distribution. In practice, EIT employs low-frequency alternating currents to perform imaging. Adhesive electrodes are placed on the skin at specific locations around the area of interest. A few milliamperes of alternating current, typically with a frequency range of 5–120 kHz, are applied between selected pairs of electrodes [11,12]. Simultaneously, the voltages across multiple electrode pairs are measured. The recorded voltages are processed using a computer, which employs mathematical algorithms to reconstruct and display EIT images that represent the impedance distribution within the body. The concept of EIT as a medical imaging method was introduced by John G. Webster, whose pioneering work was published in 1978 [13]. However, it was not until 1984 that the first practical application of EIT in medical imaging was demonstrated by David C. Barber and Brian H. Brown [14]. Their work marked a significant milestone in establishing EIT as a viable tool for clinical applications.
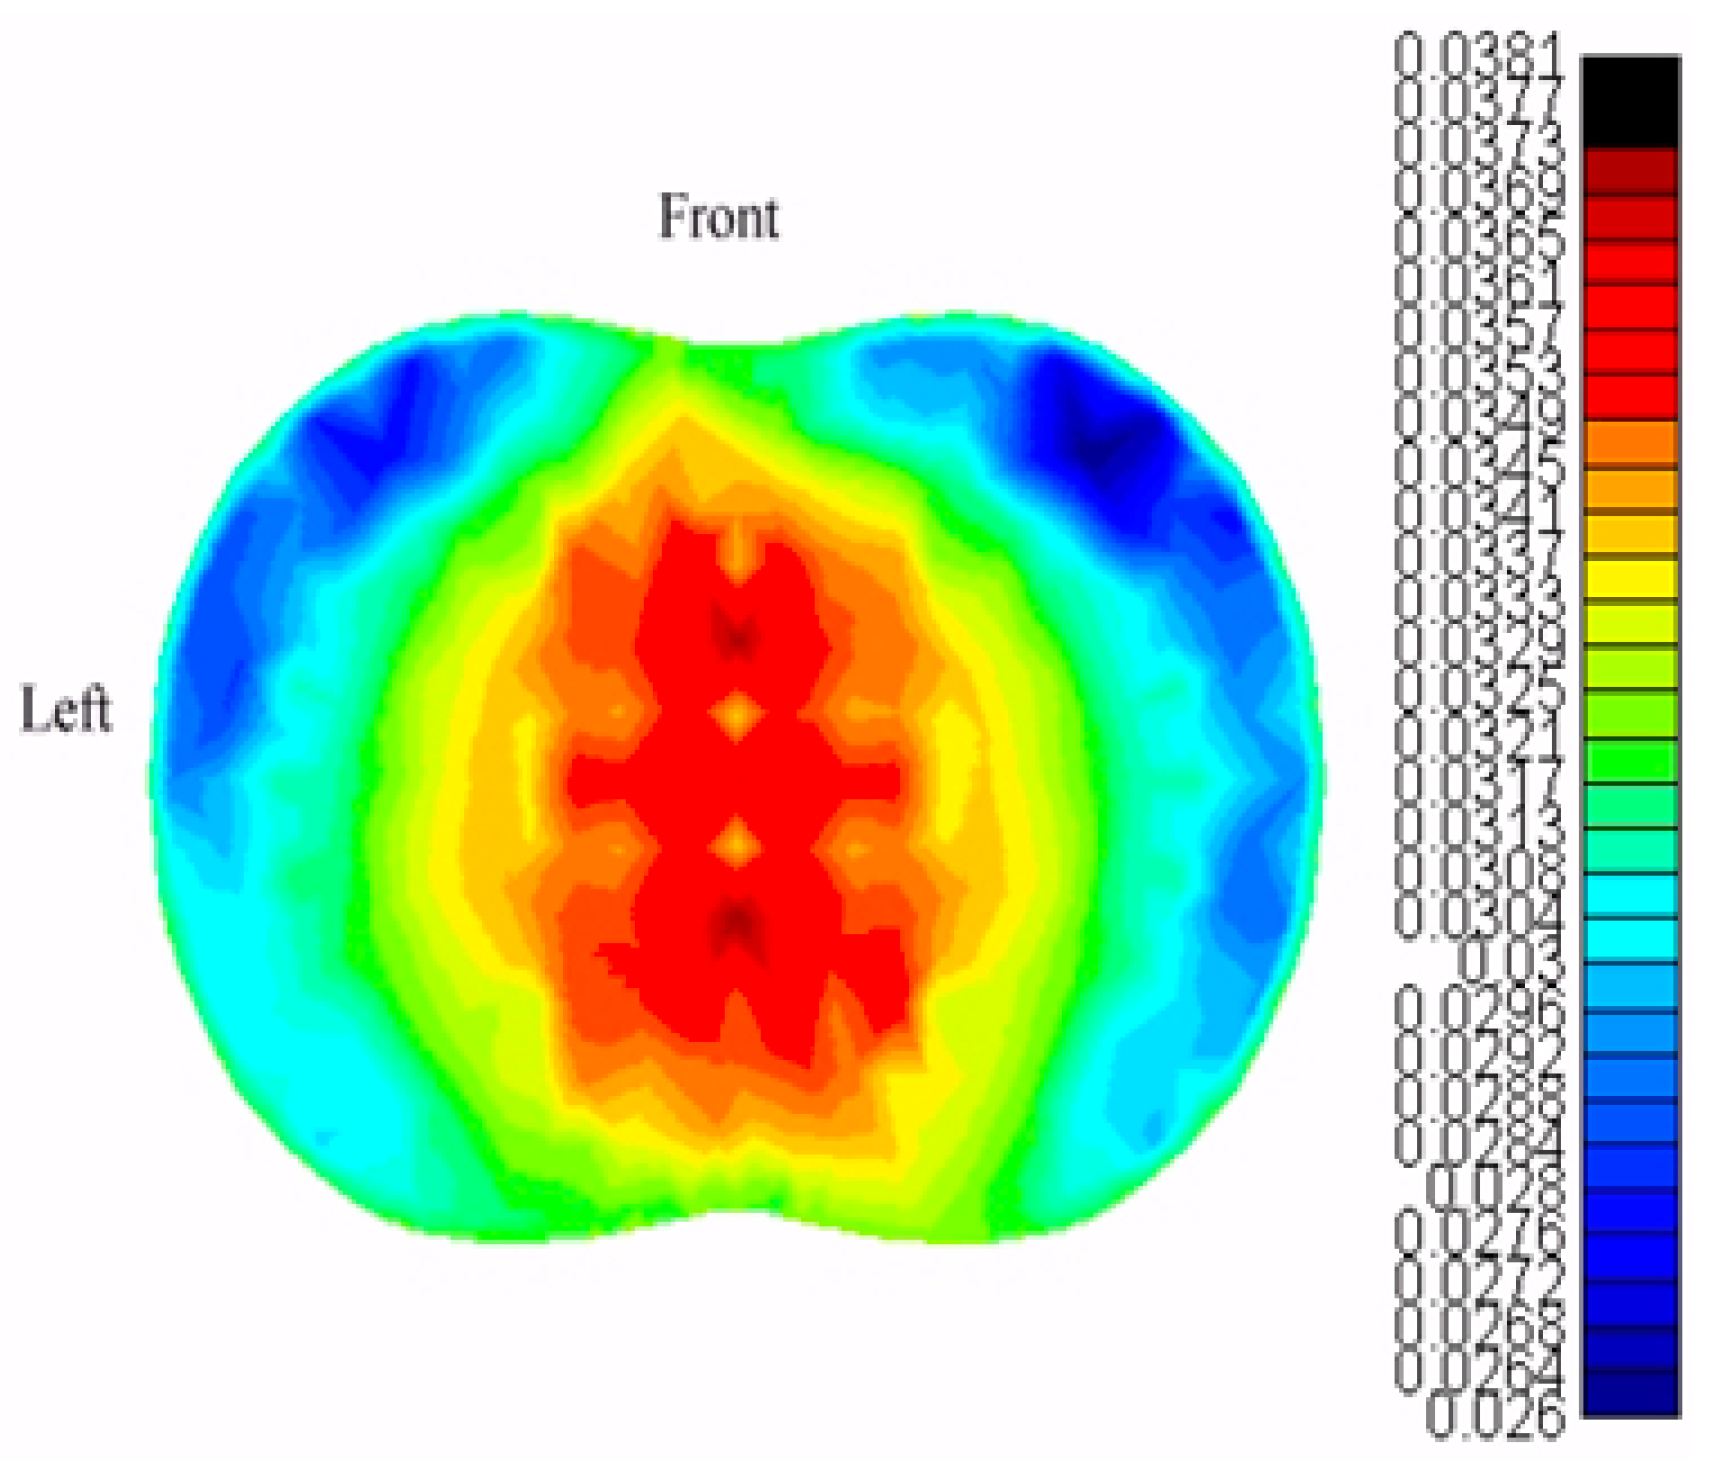
Figure 4.
A time-averaged cross-sectional image of the human chest using Electrical Impedance Tomography (EIT).
Figure 4.
A time-averaged cross-sectional image of the human chest using Electrical Impedance Tomography (EIT).
EIT offers several advantages in medical imaging. It is non-invasive, portable, and cost-effective, making it an attractive option for various diagnostic and monitoring purposes. Notable applications of EIT include monitoring lung functionality, detecting conditions such as skin cancer and breast cancer, tracking hyperthermia during treatment, and imaging brain activity. These capabilities make EIT a versatile and valuable imaging modality in the field of healthcare.
2.5. Photoacoustic Tomography
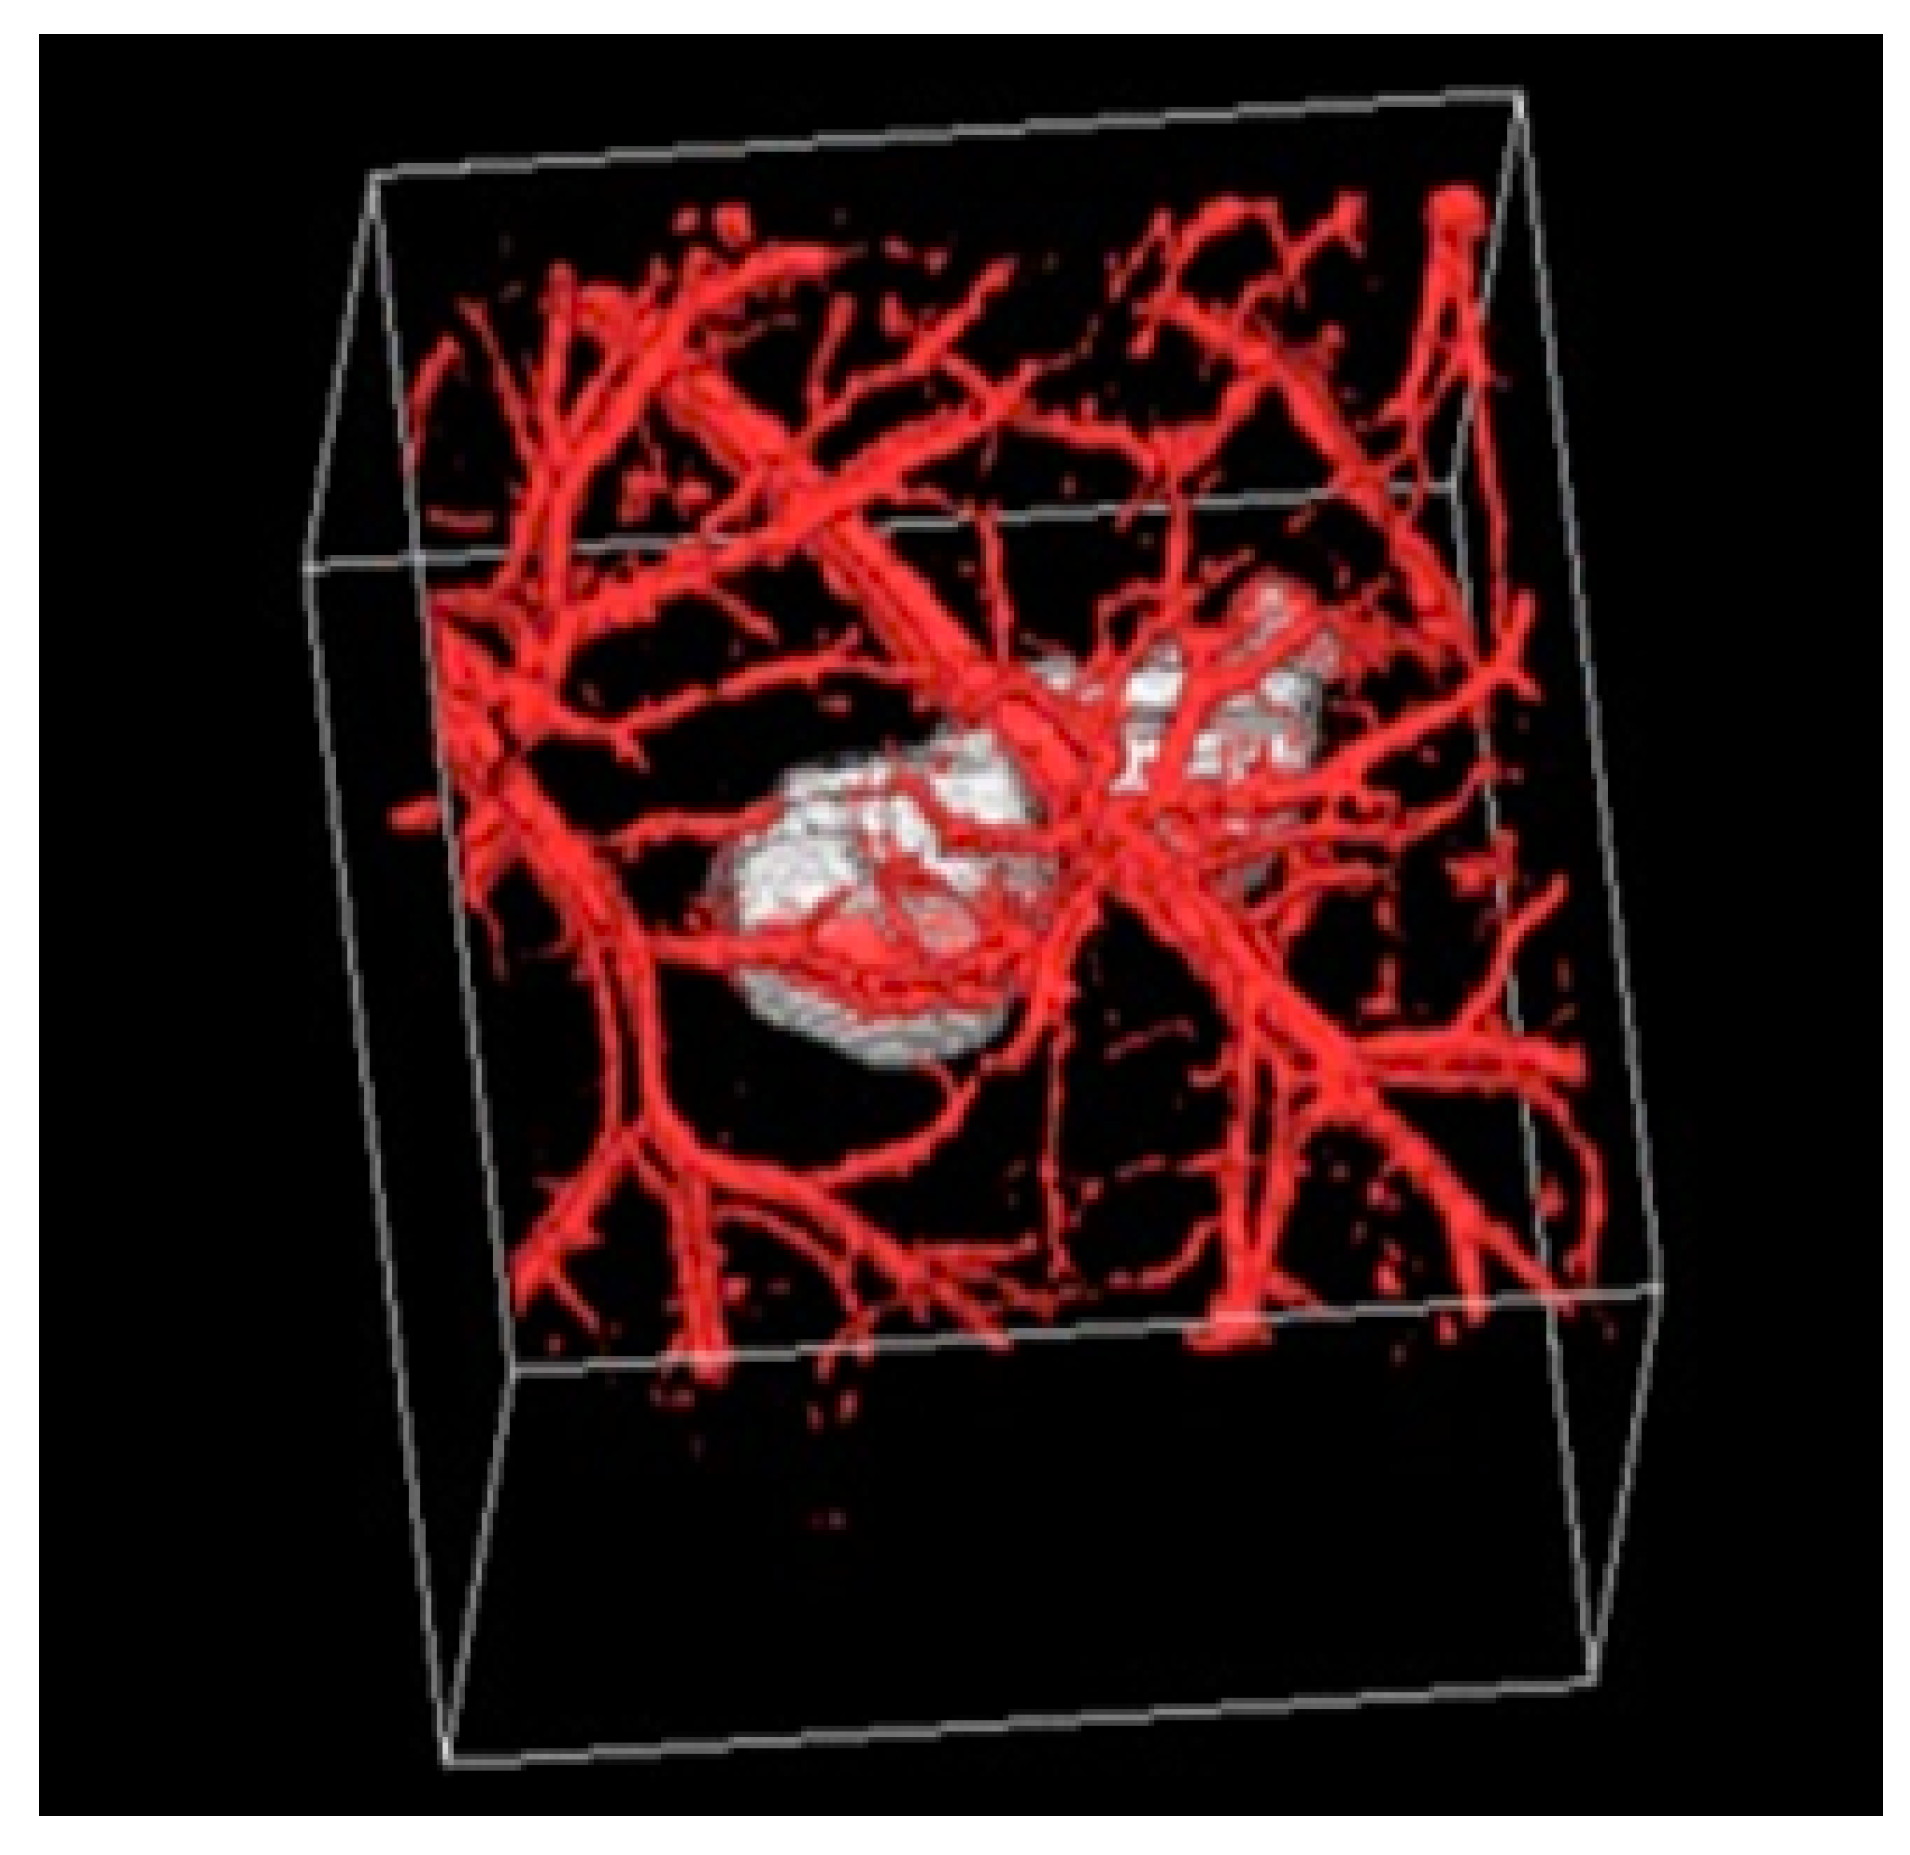
Photoacoustic Tomography (PAT) is a non-invasive, non-ionizing imaging technique that reconstructs the spatial distribution of photoacoustic sources within the body. This is done by capturing measurements of acoustic signals recorded by ultrasound detectors placed on the surface of the body. The concept of the photoacoustic effect, which forms the basis of PAT, was first described by Alexander Graham Bell in 1880. The photoacoustic effect occurs when electromagnetic energy (such as optical or radiofrequency energy) is absorbed by tissue, resulting in the generation of acoustic waves [15]. PAT merges the strengths of high-resolution ultrasound imaging and strong optical contrast, making it a unique and powerful modality. It is capable of providing high-resolution images that reveal functional, structural, and molecular details of tissues in vivo, particularly in biological tissues that scatter light. One of the significant advantages of PAT is its ability to overcome the challenge of light scattering within biological tissue, which limits the penetration of optical imaging techniques. This is accomplished through the photoacoustic effect, which allows deeper tissue imaging by generating sound waves from light absorption. In a typical PAT procedure, the tissue of interest is irradiated with a short-pulsed laser beam. This laser light is absorbed by the tissue, and the absorbed energy is converted into heat. This localized heating causes a rapid thermal expansion of the tissue, creating an increase in pressure. The pressure rise generates an ultrasonic wave that travels through the tissue. The amplitude of this wave depends on the local optical absorption, as well as other thermal and mechanical properties of the tissue. The photoacoustic waves produced are then detected by ultrasound transducers placed on the surface of the tissue. These signals are converted into electrical signals, which are amplified and digitized for further processing. A computer system then reconstructs the photoacoustic image from the collected data. PAT imaging relies on both scattered and unscattered absorbed photons, which contribute to the generation of photoacoustic signals as the tissue relaxes thermally after absorbing the electromagnetic energy. By combining the benefits of optical imaging and ultrasound, PAT provides a powerful tool for visualizing tissue structures and functions with high resolution and depth penetration, making it a promising technique for various medical applications, including cancer detection, tissue characterization, and functional imaging.
Figure 5.
Photoacoustic (PAT) image of skin carcinoma.
2.6. Positron Emission Tomography
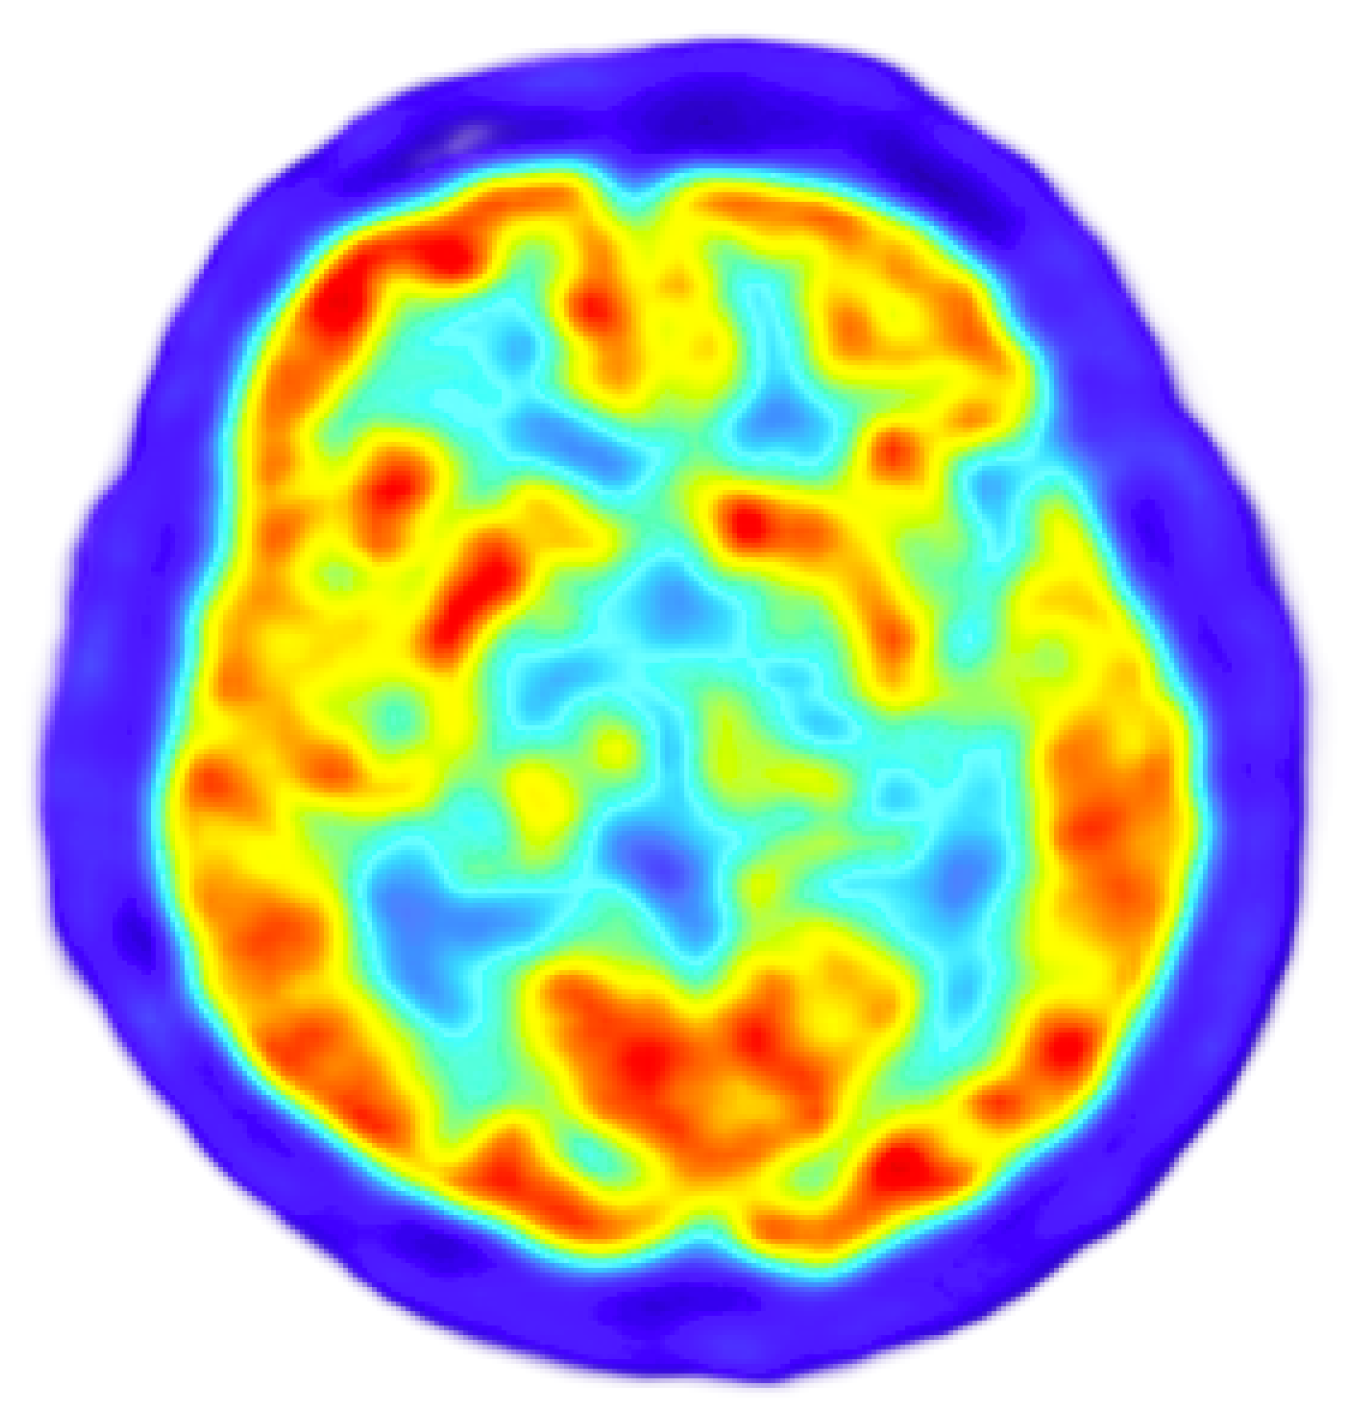
Positron Emission Tomography (PET) is a sophisticated imaging technique that utilizes a radioactive isotope, known as a tracer, which is injected into the body [16]. This tracer undergoes radioactive decay, emitting a positron in the process. PET is categorized as a transmission tomography method. When the emitted positron interacts with an electron in the surrounding tissue, they annihilate each other, resulting in the production of two photons. These photons travel in opposite directions, each carrying equal momentum. The PET imaging system detects these pairs of gamma rays that are indirectly emitted as a result of positron decay. The tracer, which contains a positron-emitting radionuclide, is injected into the patient prior to imaging. The radioactive isotopes used for PET tracers are typically short-lived, with isotopes such as carbon-11 (11C), oxygen-15 (15O), and nitrogen-13 (13N) being commonly employed. These isotopes decay rapidly, releasing positrons, which are then detected during the scan. The gamma photons produced by positron-electron annihilation are simultaneously detected by a ring of specialized detectors, which consist of scintillator crystals and photomultiplier tubes. These detectors capture the precise moment of photon emissions and use this information to create detailed tomographic images. The PET system processes this data to reconstruct a three-dimensional distribution map of the tracer within the body, revealing areas of high metabolic activity, such as those found in tumors, inflamed tissue, or other abnormal growths. PET imaging is widely used in clinical settings to assess brain function, diagnose cancer, evaluate heart conditions, and monitor brain disorders. It is also invaluable in determining the progression of cancer, including its spread to other parts of the body, and in visualizing blood flow and volume in the heart. However, despite its capabilities, PET imaging is expensive, mainly due to the short half-life of the isotopes used in the tracers and the need for a bulky cyclotron to produce them. As a result, PET scanners are generally not available for bedside use in routine clinical settings.
Figure 6.
Brain’s Positron Emission Tomography (PET) image.
2.7. Diffuse Optical Spectroscopic Tomography (DOST)
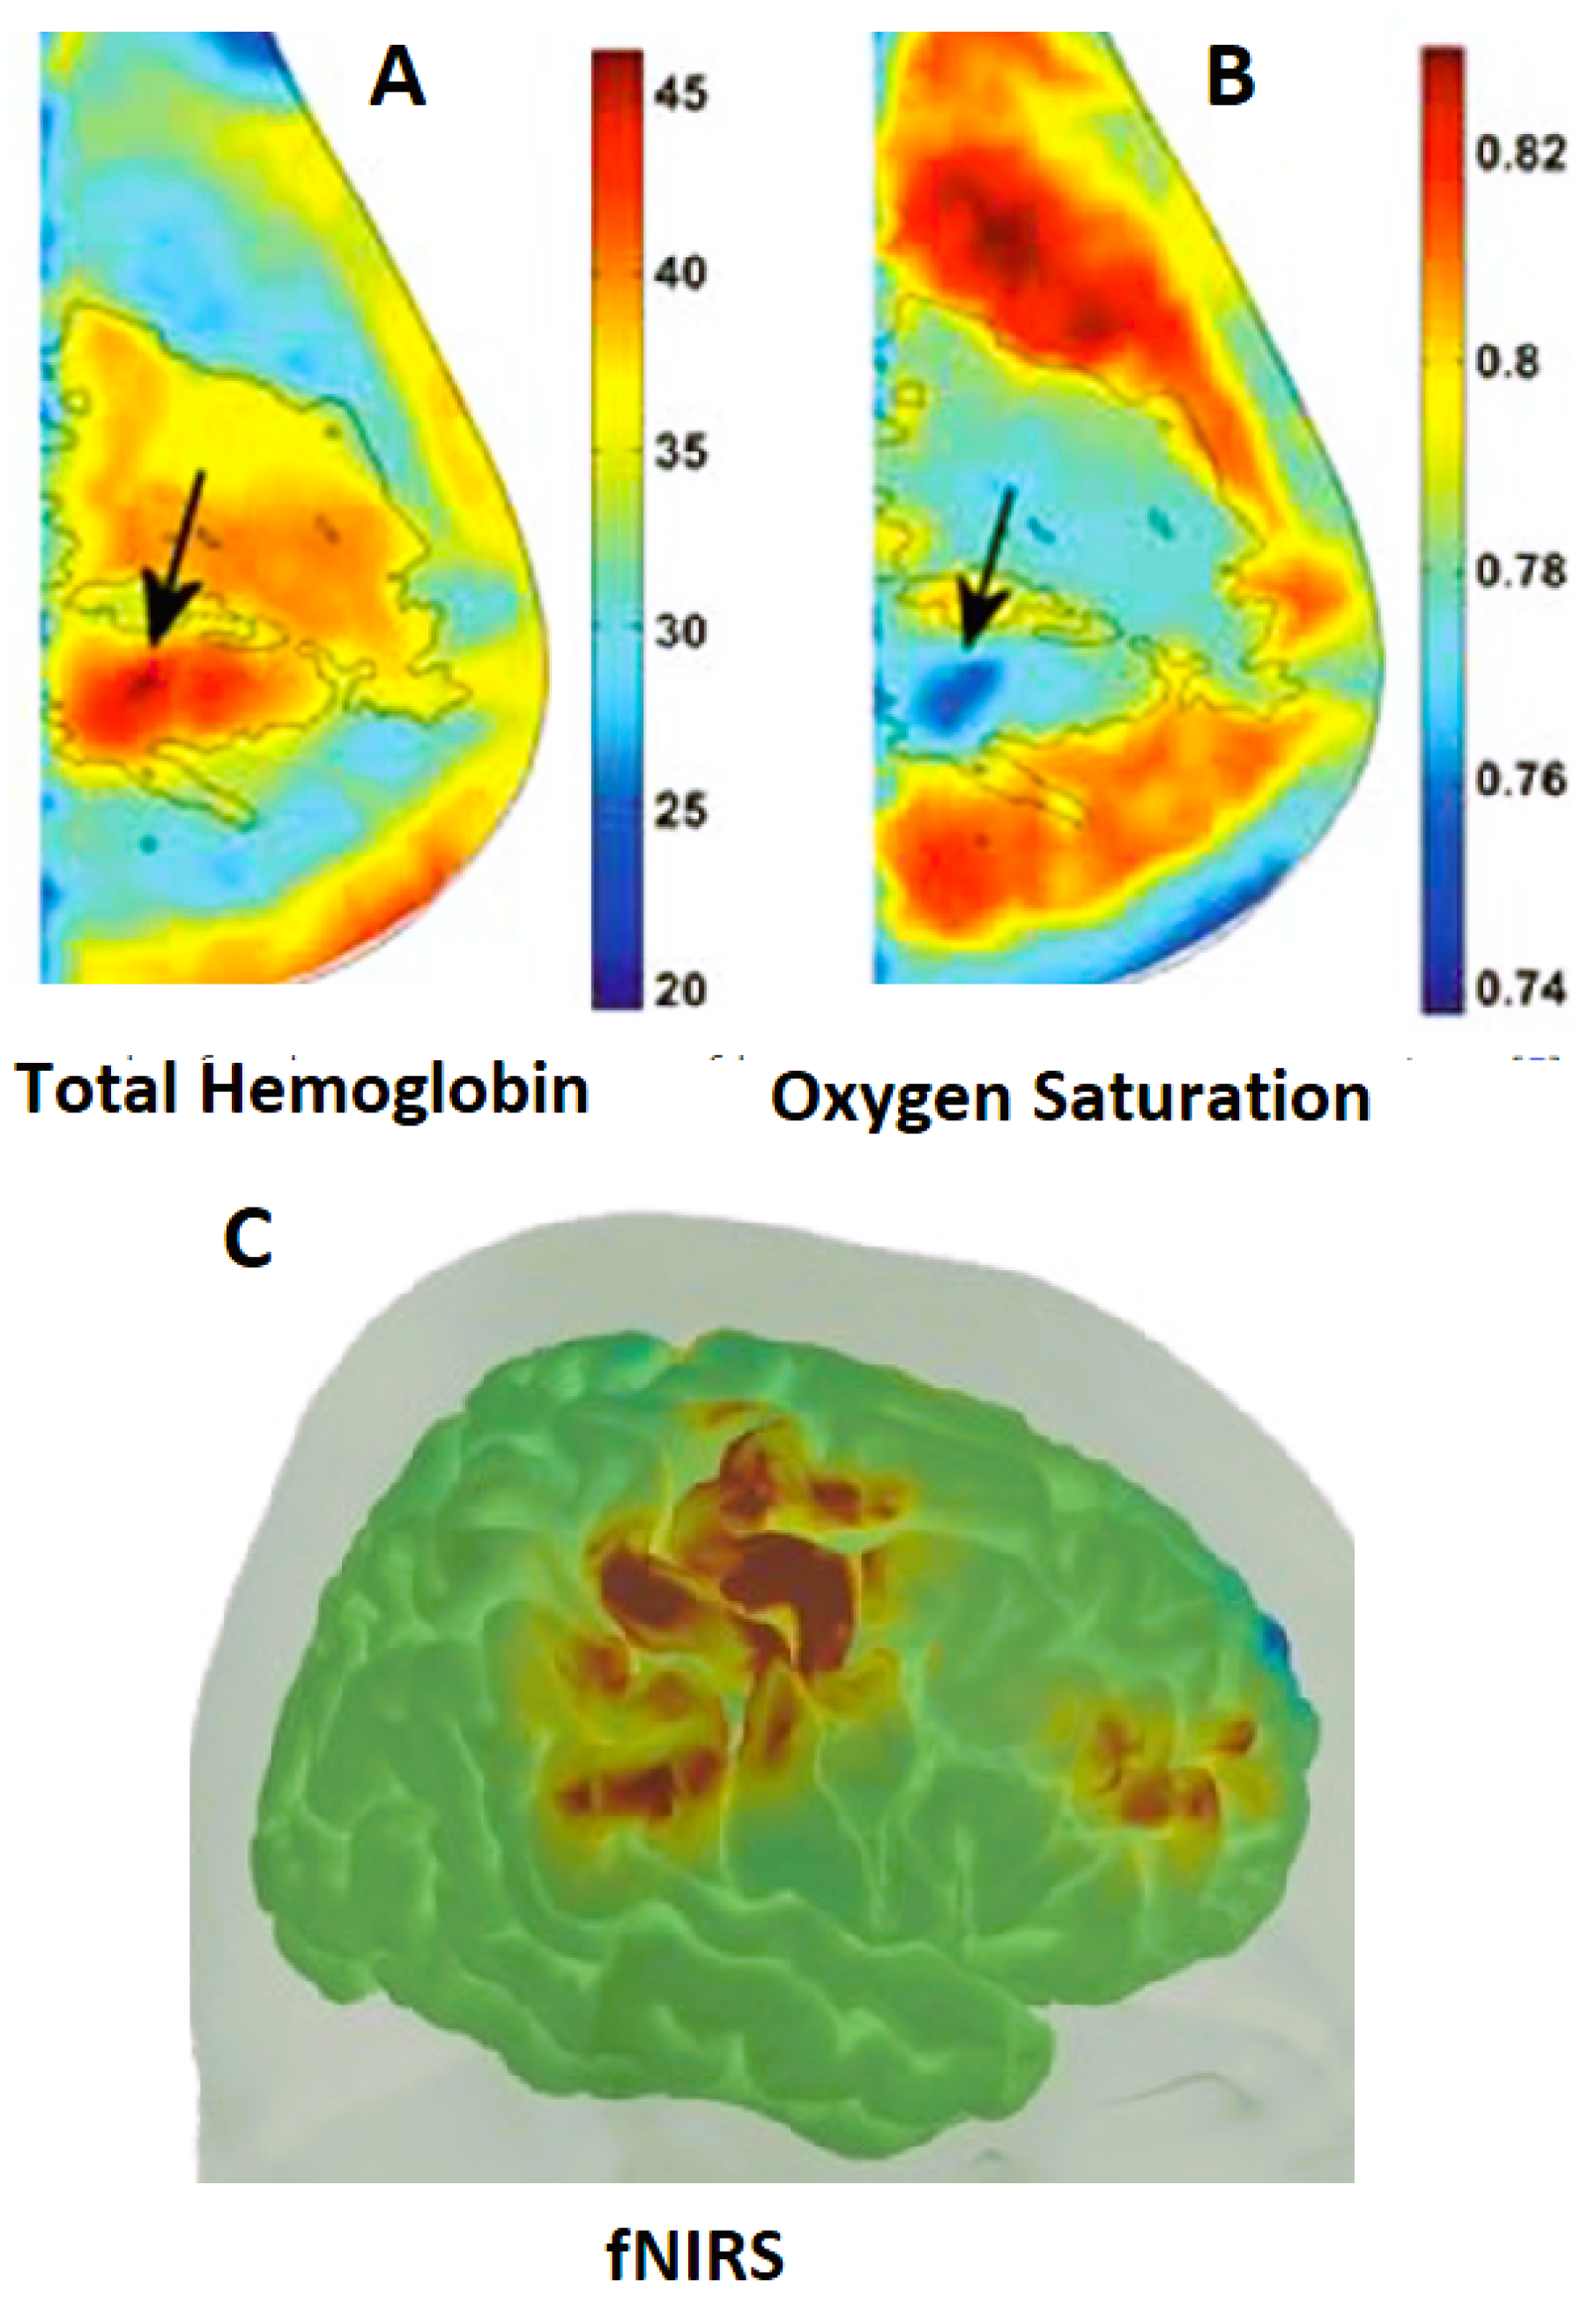
Diffuse Optical Spectroscopic Tomography (DOST) is a new imaging technique that employs light to create detailed maps of both the structural and functional properties of tissues within the body [17,18]. This modality utilizes a model-based image reconstruction approach, which allows for the measurement of various tissue parameters, including hemoglobin concentration, water levels, and lipid content [19,20]. The core principle of DOT involves shining Near-Infrared (NIR) light onto deep tissues and detecting the transmitted or reflected light to probe the optical characteristics of the tissue being imaged [21,22]. To enhance the speed and efficiency of data acquisition, DOT employs multiplexing techniques, which enable rapid switching of light sources and detectors. Furthermore, the system undergoes hardware calibration to correct any potential errors or inaccuracies in the measurements [23]. Using data collected from the skin surface, DOT can reconstruct images that represent the spatial distribution of the tissue’s optical properties. The process of deriving these spatial distributions from surface measurements is known as solving the "inverse problem." During a DOT scan, harmless NIR light is directed at the tissue, and the scattered light that exits the tissue is measured using several detectors positioned at the boundary. These measurements are then used in an image reconstruction model, which generates images that localize the optical properties of the tissue. One of the significant advantages of DOT is its ability to produce functional images of tissue. This is because light absorption by the tissue’s constituents varies depending on the wavelength of the light. By using multiple light sources with different wavelengths within the non-ionizing NIR range (600-1000 nm) [18,24], DOT can measure changes in the concentration of various tissue components. DOT has shown considerable promise in specific applications such as brain imaging and breast tissue imaging. However, there are challenges involved, particularly in estimating the internal optical properties of the tissue based on limited measurements taken from the boundary [17,25]. Due to the highly scattering nature of NIR light within tissues, this estimation process (the inverse problem) is often nonlinear, ill-posed, and sometimes even underdetermined [17]. Despite these challenges, DOT remains a valuable tool for non-invasive tissue imaging, offering a unique way to obtain functional and structural insights into tissues without the need for ionizing radiation.
Figure 7.
(A-B) Diffuse Optical Spectroscopic Tomography imaging hemoglobin content of breast, and (C) functional near-infrared spectroscopy (fNIRS).
Figure 7.
(A-B) Diffuse Optical Spectroscopic Tomography imaging hemoglobin content of breast, and (C) functional near-infrared spectroscopy (fNIRS).
Significant advancements have been made in the development of algorithms for high-speed three-dimensional (3D) Diffuse Optical Spectroscopic Tomography (DOST) image reconstruction [19,26,27]. These algorithms have been further optimized through the use of Graphics Processing Units (GPUs) and even multiple GPUs, allowing for faster image reconstruction, thus improving the overall performance of DOT systems [28,29,30]. Efforts have also been made to enable real-time DOT imaging, with various techniques being explored to achieve this goal [31,32]. Furthermore, novel methods have been proposed to scan specific regions of tissue for high-speed screening, allowing for quicker and more efficient tissue examination [33,34]. However, despite these advancements, DOT instruments are still relatively bulky and slow. To address these limitations, researchers have been focusing on reducing the overall cost of DOT systems by incorporating cost-effective technologies such as Light Emitting Diodes (LEDs) and photodetectors [35,36]. Additionally, it has been demonstrated that DOT has the potential to serve as a point-of-care imaging system, providing a non-invasive, portable solution for clinical use [35,37,38,39]. Some of these DOT systems have also been developed specifically for educational purposes, offering a valuable tool for teaching and training in the field of medical imaging [40]. During the data collection process, one of the challenges faced in DOT is the presence of noise from the superficial layers of tissue, which can interfere with the signal from the deeper tissue that is of primary interest [41]. To mitigate this issue, an empirical method for reducing superficial noise has been developed, improving the accuracy and clarity of DOT images [42]. These ongoing efforts highlight the potential for DOT to become a more efficient, affordable, and widely accessible imaging modality for a variety of medical and educational applications.
Another simplified approach to imaging, based on Diffuse Optical Spectroscopic Tomography (DOST), is functional near-infrared spectroscopy (fNIRS) [43]. Unlike DOT, which requires full tomographic image reconstruction, fNIRS involves observing channel-wise measurements. This technique has gained significant popularity in brain imaging, particularly for assessing mental workload and cognitive functions [44]. One of the advantages of fNIRS is that it can be implemented with relatively limited hardware compared to more complex imaging modalities. For example, fNIRS patches designed for brain imaging have been successfully demonstrated [45,46,47,48], highlighting the simplicity and versatility of the system. Functional near-infrared spectroscopy can be combined with Electroencephalogram (EEG) [49,50]. In fNIRS, the light sources and detectors are referred to as "optodes," [51] and the quality of the signals obtained from these optodes is crucially dependent on their design [52,53]. This highlights the importance of developing efficient and well-optimized optodes for accurate and reliable measurements. Additionally, there has been significant interest in portable fNIRS systems, which have been widely studied for their potential in various clinical and research applications [37]. These portable systems are particularly beneficial for real-time monitoring and on-the-go brain imaging. Recent advancements have also introduced new technologies, such as Internet-of-Things (IoT) based architectures, into the development of fNIRS systems. These innovations enable better integration, communication, and data processing, making the systems more efficient and accessible [54,55,54]. Furthermore, machine learning techniques have been applied to fNIRS data, enabling the automatic classification of brain functions in real time [56]. This opens up exciting possibilities for real-time monitoring and analysis of brain activity [57,58,59]. The wearable EEG and fNIRS also can be used to create human digital twins [60]. While the application of fNIRS for brain imaging is still in its early stages, research in this area is growing rapidly. As the technology continues to evolve and new applications emerge, fNIRS has great potential for advancing our understanding of brain function and offering non-invasive, portable solutions for both clinical and research purposes.
References
- The history of tomography - Agency for Health Technology Assessment and Tariff System.
- Seynaeve, P.C.; Broos, J.I. [The history of tomography]. Journal belge de radiologie 1995, 78, 284–288. [Google Scholar] [PubMed]
- van Gijn, J.; Gijselhart, J.P. [Ziedses des Plantes: inventor of planigraphy and subtraction]. Nederlands tijdschrift voor geneeskunde 2011, 155, A2164. [Google Scholar] [PubMed]
- LANZA DE CRISTOFORIS, E.K. CT Effective Dose in Critical Patients: Comparison between Deep Learning Image Reconstruction (DLIR), Filtered Back Projection (FBP) and Iterative Algorithms 2023.
- Richmond, C. Sir Godfrey Hounsfield., 2004.
- Avill, R.; Mangnall, Y.; Bird, N.; Brown, B.; Seagar, A.; Johnson, A.; Read, N.; et al. Applied potential tomography: A new noninvasive technique for measuring gastric emptying. Gastroenterology 1987, 92, 1019–1026. [Google Scholar] [CrossRef]
- Bhattacharyya, K.B. Godfrey Newbold Hounsfield (1919-2004): The man who revolutionized neuroimaging. Annals of Indian Academy of Neurology 2016, 19, 448–450. [Google Scholar] [CrossRef] [PubMed]
- Jensen, J.A. Medical ultrasound imaging. Progress in biophysics and molecular biology 2007, 93, 153–165. [Google Scholar] [CrossRef] [PubMed]
- Watts, G. John Wild. BMJ 2009, 339. [Google Scholar] [CrossRef]
- Damadian, R. Tumor detection by nuclear magnetic resonance. Science (New York, N.Y.) 1971, 171, 1151–1153. [Google Scholar] [CrossRef] [PubMed]
- Li, J.; Jiang, D.; Wu, Y.; Neshatvar, N.; Bayford, R.; Demosthenous, A. An 89.3% Current Efficiency, Sub 0.1% THD Current Driver for Electrical Impedance Tomography. IEEE Transactions on Circuits and Systems II: Express Briefs, 2023. [Google Scholar]
- Bera, T.K.; Saikia, M.; Nagaraju, J. A battery-based constant current source (Bb-CCS) for biomedical applications. In Proceedings of the 2013 4th International Conference on Computing, Communications and Networking Technologies, ICCCNT 2013. 2013. [Google Scholar] [CrossRef]
- Henderson, R.P.; Webster, J.G. An Impedance Camera for Spatially Specific Measurements of the Thorax. IEEE Transactions on Biomedical Engineering, 1978; BME-25, 250–254. [Google Scholar] [CrossRef]
- D C Barber. ; B H Brown. Applied potential tomography. Journal of Physics E: Scientific Instruments 1984, 17, 723. [Google Scholar] [CrossRef]
- Park, J.; Choi, S.; Knieling, F.; Clingman, B.; Bohndiek, S.; Wang, L.V.; Kim, C. Clinical translation of photoacoustic imaging. Nature Reviews Bioengineering, 2024; 1–20. [Google Scholar]
- Sammartino, A.M.; Bonfioli, G.B.; Dondi, F.; Riccardi, M.; Bertagna, F.; Metra, M.; Vizzardi, E. Contemporary Role of Positron Emission Tomography (PET) in Endocarditis: A Narrative Review. Journal of Clinical Medicine 2024, 13, 4124. [Google Scholar] [CrossRef]
- Arridge, S.R. Optical tomography in medical imaging. Inverse Problems 1999, 15, R41. [Google Scholar] [CrossRef]
- Saikia, M.J. A spectroscopic diffuse optical tomography system for the continuous 3D functional imaging of tissue -a phantom study. IEEE Transactions on Instrumentation and Measurement, 2021; 1. [Google Scholar] [CrossRef]
- Okawa, S.; Hoshi, Y. A review of image reconstruction algorithms for diffuse optical tomography. Applied Sciences 2023, 13, 5016. [Google Scholar] [CrossRef]
- Saikia, M.J. Design and development of a functional diffuse optical tomography probe for real-time 3D imaging of tissue. In Proceedings of the Optical Tomography and Spectroscopy of Tissue XIV. International Society for Optics and Photonics, SPIE. 2021; 11639, 213–218. [Google Scholar]
- Sukowski, U.; Schubert, F.; Grosenick, D.; Rinneberg, H.H. Diffusely scattering phantoms for optical tomography. In Proceedings of the Photon Propagation in Tissues. SPIE. 1995; 2626, 92–102. [Google Scholar]
- Poorna, R.; Kanhirodan, R.; Saikia, M.J. Square-waves for frequency multiplexing for fully parallel 3D diffuse optical tomography measurement. In Proceedings of the Optical Tomography and Spectroscopy of Tissue XIV; Fantini, S.; Taroni, P., Eds. International Society for Optics and Photonics, SPIE. 2021; 11639, 219–226. [Google Scholar] [CrossRef]
- Saikia, M.J. An embedded system based digital onboard hardware calibration for low-cost functional diffuse optical tomography system. In Proceedings of the Optics and Biophotonics in Low-Resource Settings VII. International Society for Optics and Photonics, SPIE. 2021; 11632, 1–8. [Google Scholar] [CrossRef]
- Gibson, A.P.; Hebden, J.C.; Arridge, S.R. Recent advances in diffuse optical imaging. Physics in Medicine & Biology 2005, 50, R1. [Google Scholar]
- Arridge, S.R.; Hebden, J.C. Optical imaging in medicine: II. Modelling and reconstruction. Physics in Medicine & Biology 1997, 42, 841. [Google Scholar]
- Das, T.; Dutta, P.K.; Saikia, M.J. Gaussian Distributed Semi-Analytic Reconstruction Method for Diffuse Optical Tomographic Measurement. IEEE Sensors Journal 2023. [Google Scholar] [CrossRef]
- Saikia, M.J.; Kanhirodan, R.; Mohan Vasu, R. High-speed GPU-based fully three-dimensional diffuse optical tomographic system. International Journal of Biomedical Imaging 2014, 2014. [Google Scholar] [CrossRef] [PubMed]
- Dale, R.; Zheng, B.; Orihuela-Espina, F.; Ross, N.; O’Sullivan, T.D.; Howard, S.; Dehghani, H. Deep learning-enabled high-speed, multi-parameter diffuse optical tomography. Journal of Biomedical Optics 2024, 29, 076004–076004. [Google Scholar] [CrossRef] [PubMed]
- Saikia, M.J.; Kanhirodan, R. High performance single and multi-GPU acceleration for Diffuse Optical Tomography. In Proceedings of the Proceedings of 2014 International Conference on Contemporary Computing and Informatics, IC3I 2014. Institute of Electrical and Electronics Engineers Inc., jan 2014; pp. 20141320–1323. [CrossRef]
- Saikia, M.J.; Kanhirodan, R.; Mohan Vasu, R. High-Speed GPU-Based Fully Three-Dimensional Diffuse Optical Tomographic System. International Journal of Biomedical Imaging 2014, 2014, 376456. [Google Scholar] [CrossRef]
- Applegate, M.; Istfan, R.; Spink, S.; Tank, A.; Roblyer, D. Recent advances in high speed diffuse optical imaging in biomedicine. APL Photonics 2020, 5. [Google Scholar] [CrossRef]
- Saikia, M.J.; Rajan, K.; Vasu, R.M. 3-D GPU based real time Diffuse Optical Tomographic system. In Proceedings of the Souvenir of the 2014 IEEE International Advance Computing Conference, IACC 2014. IEEE Computer Society. 2014; 1099–1103. [Google Scholar] [CrossRef]
- Saikia, M.J.; Kanhirodan, R. Development of DOT system for ROI scanning. In Proceedings of the International Conference on Fibre Optics and Photonics, 2014. Optical Society of America (OSA), dec. 2014; T3A.4. [Google Scholar] [CrossRef]
- Saikia, M.J.; Kanhirodan, R. Region-of-interest diffuse optical tomography system. Review of Scientific Instruments 2016, 87, 013701. [Google Scholar] [CrossRef]
- Fishell, A.K.; Arbeláez, A.M.; Valdés, C.P.; Burns-Yocum, T.M.; Sherafati, A.; Richter, E.J.; Torres, M.; Eggebrecht, A.T.; Smyser, C.D.; Culver, J.P. Portable, field-based neuroimaging using high-density diffuse optical tomography. NeuroImage 2020, 215, 116541. [Google Scholar] [CrossRef]
- Saikia, M.; Manjappa, R.; Kanhirodan, R. A cost-effective LED and photodetector based fast direct 3D diffuse optical imaging system. In Proceedings of the Progress in Biomedical Optics and Imaging - Proceedings of SPIE. 2017; 10412. [Google Scholar] [CrossRef]
- Saikia, M.; Besio, W.; Mankodiya, K. WearLight: Toward a Wearable, Configurable Functional NIR Spectroscopy System for Noninvasive Neuroimaging. IEEE Transactions on Biomedical Circuits and Systems 2019, 13. [Google Scholar] [CrossRef] [PubMed]
- Saikia, M.J.; Kanhirodan, R. Development of handheld near-infrared spectroscopic medical imaging system. In Proceedings of the Biophotonics Congress: Optics in the Life Sciences Congress 2019 (BODA,BRAIN,NTM,OMA,OMP). Optical Society of America. 2019; DS1A.6. [Google Scholar]
- Saikia, M.J.; Mankodiya, K.; Kanhirodan, R. A point-of-care handheld region-of-interest (ROI) 3D functional diffuse optical tomography (fDOT) system. In Proceedings of the Optical Tomography and Spectroscopy of Tissue XIII; Fantini, S.; Taroni, P.; Tromberg, B.J.; Sevick-Muraca, E.M., Eds., Saikia-2019-1, mar. 2019; 10874, 90. [Google Scholar] [CrossRef]
- Saikia, M.J.; Kanhirodan, R. A tabletop Diffuse Optical Tomographic (DOT) experimental demonstration system. In Proceedings of the Optics and Biophotonics in Low-Resource Settings V; Levitz, D.; Ozcan, A., Eds. SPIE, feb. 2019; 10869, 11. [Google Scholar] [CrossRef]
- Saikia, M.J.; Manjappa, R.; Mankodiya, K.; Kanhirodan, R. Depth sensitivity improvement of region-of-interest diffuse optical tomography from superficial signal regression. volume Part F99-C, page CM3E. 5. OSA-The Optical Society, 6.
- Saikia, M.J.; Manjappa, R.; Mankodiya, K.; Kanhirodan, R. Depth sensitivity improvement of region-of-interest diffuse optical tomography from superficial signal regression. In Proceedings of the Optics InfoBase Conference Papers. OSA - The Optical Society, jun 2018, Vol. Part F99-C, p. CM3E.5. [CrossRef]
- Phillips, Z.; Canoy, R.J.; Paik, S.h.; Lee, S.H.; Kim, B.M. Functional near-infrared spectroscopy as a personalized digital healthcare tool for brain monitoring. Journal of clinical neurology (Seoul, Korea) 2023, 19, 115. [Google Scholar] [CrossRef] [PubMed]
- Saikia, M.J.; Besio, W.G.; Mankodiya, K. The Validation of a Portable Functional NIRS System for Assessing Mental Workload. Sensors 2021, 21, 3810. [Google Scholar] [CrossRef] [PubMed]
- Abtahi, M.; Cay, G.; Saikia, M.J.; Mankodiya, K. Designing and testing a wearable, wireless fNIRS patch. In Proceedings of the Proceedings of the Annual International Conference of the IEEE Engineering in Medicine and Biology Society, EMBS. Institute of Electrical and Electronics Engineers Inc., oct 2016, Vol. 2016-Octob; pp. 20162016–6298. [CrossRef]
- Saikia, M.J.; Cay, G.; Gyllinsky, J.V.; Mankodiya, K. A configurable wireless optical brain monitor based on internet-of-things services. In Proceedings of the 2018 International Conference on Electrical, Electronics, Communication, Computer, and Optimization Techniques (ICEECCOT). IEEE, 2018. 42–48.
- Saikia, M.J.; Mankodiya, K. A Wireless fNIRS Patch with Short-Channel Regression to Improve Detection of Hemodynamic Response of Brain. In Proceedings of the 3rd International Conference on Electrical, Electronics, Communication, Computer Technologies and Optimization Techniques, ICEECCOT 2018. Institute of Electrical and Electronics Engineers Inc., dec 2018. 90–96. [CrossRef]
- Saikia, M.J.; Mankodiya, K. A wireless fnirs patch with short-channel regression to improve detection of hemodynamic response of brain. In Proceedings of the 2018 International Conference on Electrical, Electronics, Communication, Computer, and Optimization Techniques (ICEECCOT). IEEE, 2018. 90–96.
- Li, B.; Li, M.; Xia, J.; Jin, H.; Dong, S.; Luo, J. Hybrid Integrated Wearable Patch for Brain EEG-fNIRS Monitoring. Sensors (Basel, Switzerland) 2024, 24, 4847. [Google Scholar] [CrossRef]
- Flanagan, K.; Saikia, M.J. Consumer-grade electroencephalogram and functional near-infrared spectroscopy neurofeedback Technologies for Mental Health and Wellbeing. Sensors 2023, 23, 8482. [Google Scholar] [CrossRef]
- Saikia, M.J.; Mankodiya, K. 3D-printed human-centered design of fNIRS optode for the portable neuroimaging. In Proceedings of the Design and Quality for Biomedical Technologies XII. SPIE, Vol. 10870; 2019; pp. 86–92. [Google Scholar]
- Akila, V.; John Victor, A.C. Design of Wearable Four Channel Near-Infrared Spectroscopy System. Design of Wearable Four Channel Near-Infrared Spectroscopy System.
- Saikia, M.; Mankodiya, K. 3D-printed human-centered design of fNIRS optode for the portable neuroimaging. In Proceedings of the Progress in Biomedical Optics and Imaging - Proceedings of SPIE, Saikia2018-1, 2019; Vol. 10870. [CrossRef]
- Saikia, M.J.; Cay, G.; Gyllinsky, J.V.; Mankodiya, K. A Configurable Wireless Optical Brain Monitor Based on Internet-of-Things Services. In Proceedings of the 3rd International Conference on Electrical, Electronics, Communication, Computer Technologies and Optimization Techniques, ICEECCOT 2018, Saikia-2018-2, dec 2018. 42–48. [CrossRef]
- Saikia, M.J. Internet of things-based functional near-infrared spectroscopy headband for mental workload assessment. In Proceedings of the Optical Techniques in Neurosurgery, Neurophotonics, and Optogenetics. International Society for Optics and Photonics, SPIE. 2021; 11629, 143–150. [Google Scholar] [CrossRef]
- Saikia, M.J. K-means clustering machine learning approach reveals groups of homogeneous individuals with unique brain activation, task, and performance dynamics using fNIRS. IEEE Transactions on Neural Systems and Rehabilitation Engineering 2023, 31, 2535–2544. [Google Scholar] [CrossRef] [PubMed]
- Karmakar, S.; Kamilya, S.; Dey, P.; Guhathakurta, P.K.; Dalui, M.; Bera, T.K.; Halder, S.; Koley, C.; Pal, T.; Basu, A. Real time detection of cognitive load using fNIRS: A deep learning approach. Biomedical Signal Processing and Control 2023, 80, 104227. [Google Scholar] [CrossRef]
- Saikia, M.J.; Kuanar, S.; Borthakur, D.; Vinti, M.; Tendhar, T. A machine learning approach to classify working memory load from optical neuroimaging data. 2021, p. 69. [CrossRef]
- Saikia, M.J.; Brunyé, T.T. K-means clustering for unsupervised participant grouping from fNIRS brain signal in working memory task. In Proceedings of the Optical Techniques in Neurosurgery, Neurophotonics, and Optogenetics. International Society for Optics and Photonics, SPIE. 2021; 11629, 159–164. [Google Scholar] [CrossRef]
- Johnson, Z.; Saikia, M.J. Digital Twins for Healthcare Using Wearables. Bioengineering 2024, 11, 606. [Google Scholar] [CrossRef]
Disclaimer/Publisher’s Note: The statements, opinions and data contained in all publications are solely those of the individual author(s) and contributor(s) and not of MDPI and/or the editor(s). MDPI and/or the editor(s) disclaim responsibility for any injury to people or property resulting from any ideas, methods, instructions or products referred to in the content. |
© 2024 by the authors. Licensee MDPI, Basel, Switzerland. This article is an open access article distributed under the terms and conditions of the Creative Commons Attribution (CC BY) license (http://creativecommons.org/licenses/by/4.0/).
Copyright: This open access article is published under a Creative Commons CC BY 4.0 license, which permit the free download, distribution, and reuse, provided that the author and preprint are cited in any reuse.


