
Submitted:
25 December 2024
Posted:
26 December 2024
You are already at the latest version
Abstract
Meiofauna are frequently overlooked in biodiversity assessments, resulting in a lack of understanding regarding their current status, the potential impact of anthropogenic activities, and climate change. This study on the intertidal zone of the Small Beach of Ostend marks a new effort to characterize meiofaunal communities along the Belgian coast. Sampling was carried out on five separate occasions throughout the year, with abiotic data collected during each event. Collected specimens were sorted according to their taxonomic group, resulting in a retrieval of 1,742 organisms. Among these, Platyhelminthes and Nematoda were most abundant. Through metabarcoding of the 18S ribosomal region, a biodiversity assessment was conducted, yielding a total of 106 Amplicon Sequence Variants (ASVs). After filtering out rare reads, 65 metazoan ASVs were retained: 18 representing Platyhelminthes, 16 Nematoda, 15 Copepoda, 12 Polychaeta, and four Acoela. Identification of the ASVs through blasting generated 23 unique species-level identifications. The highest species richness was observed among Proseriata and Nematoda, each comprising six different species. Additionally, four different species of Polychaeta and Copepoda, two species of Acoela, and one species of Rhabdocoela were identified. Compared to findings of similar beaches at the Belgian coast from about 40 years ago, the meiofaunal communities on this beach exhibit an overall low species richness. Finding fewer and other species might be linked to the potential impact of beach nourishments, human trampling, and climate change. However, confirming this hypothesis requires future research.
Keywords:
Biodiversity
; Ostend
; Metabarcoding
; 18S rDNA
; Invertebrates
1. Introduction
A group that is often neglected in biodiversity assessments is meiofauna, a highly diverse and abundant assemblage of animals with an important role in global ecosystems [1,2,3,4]. Their high species richness and rapid response to environmental change make them promising targets for ecological and biomonitoring studies, which is particularly important in times of high anthropogenic pressure and climate change [5,6,7]. Schratzberger and Ingles [8] investigated empirical evidence on the roles of meiofauna in benthic ecosystems using a conceptual model that links the supply of an ecosystem service, the ecosystem processes that contribute to that service, and the meiofaunal activities that regulate these processes. Meiofaunal activities modify a series of physical, chemical, and biological sediment properties. They often do so simultaneously by, for example, displacing sediment grains during burrow construction, and displacing organic matter and microorganisms within the sediment matrix during feeding. These modifications can directly or indirectly, and positively or negatively affect various ecosystem services including sediment stabilization, biogeochemical (nutrient) cycling, waste removal, and food web dynamics, at various spatial and temporal scales [8,9,10].
Meiofauna measure roughly between 0.045 and 1 mm in size, but no fixed size definition exists [11,12,13]. The organisms typically reside in the space between sediment grains [1,10]. Meiofauna encompass representatives of almost all major taxa, and can be exceptionally abundant and diverse [10,12].
Meiofauna, especially ‘soft-bodied’ meiofauna, are often overlooked because of insufficient and ‘unadapted’ collection methods, and the difficulties associated with sample processing [14]. For instance, biodiversity assessments of sandy beaches often report nematodes and copepods as prime components of meiofaunal communities, while there is no mention about soft-bodied taxa [15,16,17,18]. Another example can be found in the final report of the ‘Agentschap Maritieme Dienstverlening en Kust’ (MDK) “Studie over de impact van zandsuppleties op het ecosystem” [19]. The study of the MDK provides a meiofaunal assessment of the beach of De Panne [16]. In this report the authors only focus on hard-bodied meiofauna (e.g. Polychaeta, Copepoda, and Nematoda) and soft-bodied meiofauna (e.g. turbellarian flatworms) are neglected. The report demonstrates that meiofaunal densities increase from the high littoral to the low littoral zone. However, they only provide information about ‘the dominant meiofaunal taxa’ being Nematoda and Copepoda, and other hard-bodied meiofaunal groups [16]. There is no data about soft-bodied meiofauna at all [16]. Thus, the statement they make about ‘meiofaunal densities’ is biased towards hard-bodied meiofauna once again. Furthermore, expertise in meiofauna taxonomy is limited by a number of factors, including the large number of unknown species (Linnean shortfall) and the lack of researchers in the field, combined with the lack of studies on individual meiofaunal taxa (Prestonian shortfall) [3,20,21,22].
About 40 years ago, Jouk [23] studied (free-living) Platyhelminthes (‘Turbellaria’) from sandy beaches at the Belgian coast and adjacent areas. He conducted various studies starting in the 1980s, providing a detailed overview of their species composition, diversity, distribution, and ecology [23,24,25,26]. Jouk [26] also studied the diversity of Gastrotricha, another lesser known soft-bodied meiofaunal taxon, from the Belgian coast. Until now, no such studies have been conducted again. Because of this, we have no knowledge about the current status of Platyhelminthes or any other meiofaunal group in this area. Much may have changed over the past 40 years: species that were very abundant then could be absent on the beaches now, and diversity and species richness parameters may have changed dramatically. Armonies [27] conducted a similar study on the tidal inlets of the northern Wadden Sea. In this study the species composition of selected taxa of the small benthos is compared to a study performed about 35 years before. They used the same methods and sampling sites [27]. This is what we plan to do on the Belgian Coast as well, by comparing future findings from our studies with findings of Jouk [23] from about 40 years ago. The short length of the Belgian coastline (± 65 km) renders this location bordering the North Sea one of the best known in the world today [26]. Even though research on meiofaunal diversity at the Belgian coast was conducted in the past, it is clear that our knowledge is still very limited.
The aim of this study is to document on the diversity and abundance of all major meiofaunal groups present at the Belgian coast. For the purpose of this project, the meiofaunal communities at the intertidal zone of a sheltered, heavily visited beach of Ostend will serve as a case study. Abiotic data, such as the exact location (coordinates), time, weather conditions (wind and temperature), water-level, and an estimate of the total number of algae present on the beach will be collected to facilitate future exploration of associations between diversity, abundance, and these environmental parameters. Also, to ensure that both soft-bodied and hard-bodied meiofauna are included, soft-body friendly collection methods were employed, addressing a common oversight in previous studies.
Many Belgian as well as foreign tourists visit the Belgian coast every year [28]. For instance, In 2023 alone, 2.2 million tourists visited the coastal communities [29], with Ostend being the most popular of them with 442.000 arrivals [29]. We already know that people on beaches, more specific human trampling, has an effect on meiofaunal communities [30], but we have no data about the potential impact of other anthropogenic activities such as beach nourishments. Also, meiofauna have the potential to be used as indicators of the impacts of environmental change. However, in order to do so, one of the needs is to better understand the functional implications of shifts in the community composition and interactions [31]. The primary goal of this pilot study is to document and report on the diversity and abundance of meiofaunal communities present on the Small Beach of Ostend. The first part of this research involved repeated sampling efforts at the Belgian coast. This study serves as a pilot for future perspectives, for which we aim to discover a clear connection between meiofaunal distribution patterns, abundance, diversity, the potential impact of anthropogenic activities, and climate change. Therefore, we have chosen a specific area of the Ostend Beach as a case study; the Small Beach.
2. Materials and Methods
2.1. Sampling and Identification of Meiofauna
Sampling took place in the intertidal zone of the Small Beach (Figure 1). This beach is part of the beach of Ostend, one of the major coastal communities of Belgium [28]. As mentioned in the introduction, about 442.000 tourists visited Ostend [29], including the Small Beach. The Small Beach is located between the Westerstaketsel and the Western Strekdam (51.2362532, 2.9186196), is about 400 meters long, and an average of 130 meters wide [28]. Because of its demarcated location and many visitors every year, the Small Beach of Ostend was selected as a case study for this pilot research.
Meiofaunal samples were collected once a month, starting from late summer and continuing until mid-winter of 2022. Five sampling campaigns were conducted, beginning with a pilot sampling in July (12/07/2022), followed by official samplings in August (30/08/2022), September (30/09/2022), November (12/11/2022), and December (10/12/2022). The pilot sampling served as a first exploration of the study locality, and to check whether the methodology to collect meiofauna is still valid for this location. Its results are not included here. All samples were collected during low tide with limited exposure to the waves. Sampling date and time were selected to maintain a maximum water-level difference of 0.15 meters. Location coordinates, time, weather conditions (wind and temperature), water-level, and an estimate of the percentage of algae covering the sampling area of the beach were recorded for each sampling (Table 1, Results).
During the first official sampling in August, six sand samples were collected, starting from the low-water line, and progressing at five-meter intervals. Each subsequent sample was positioned five meters more inland than the previous one. To make sure as many organisms as possible were included, the sand samples were taken at positions with coarse sand and a lot of organic matter, where meiofauna would be expected to occur [32,33]. This way collecting ‘empty’ samples was prevented. Upon processing the August samples, it became apparent that a higher concentration of meiofaunal organisms was recorded in the samples collected farthest away from the sea. Consequently, in the subsequent three sampling sessions, the decision was made to increase the number of samples from six to eight, including samples from a greater distance from the sea.
Collected samples were transported to the lab on campus Diepenbeek (Hasselt University) and meiofauna were extracted using the MgCl2 method, as illustrated in Figure 2 [34]. Collected specimens were sorted under a stereomicroscope according to their taxonomic group, with Platyhelminthes divided into two major taxonomic groups; Rhabdocoela and Proseriata, as was done in previous studies. This yielded pooled samples of Proseriata, Rhabdocoela, Acoela, Copepoda, Nematoda, Polychaeta, and Isopoda (Figure 3A). In case taxonomic identification was not clear under the stereomicroscope, organisms were examined under a Leica DM2500 LED microscope and photo-vouchered using the manufacturer’s software LAS X. Samples were fixated in liquid nitrogen and stored in the -80°C freezer for metabarcoding.
2.2. DNA Extractions, Library Preparation, and Sequencing
DNA extractions were performed following a salting-out protocol [35]. First, the tissue was submerged in 195 µl TNES buffer and 5 µl proteinase K, and short-spinned to remove droplets. Samples were incubated at 55°C overnight to ensure lysis was completed. Next, (InvitrogenTM) yeast tRNA, 65 µl 5M NaCl and 290µl 96% EtOH were added. The samples were stored at -20°C for at least one hour and then centrifuged (spinned down) for 15 minutes at 18.000 rcf. The supernatant was removed and replaced with 1 ml chilled 70% EtOH, and spinned 5 minutes again at 18.000 rcf. This ethanol rinse was repeated one more time, after which the supernatant was removed. The tube was then left uncapped to allow the pellet to dry, after which elution buffer (0.1X TE with 0.02% TweenTM 20 Surfact-AmpsTM Detergent Solution) could be added. DNA was then resuspended at 4°C overnight. DNA concentrations were evaluated on a Qubit 2.0 fluorometer. One sample (S7, Isopoda, November) did not digest during the DNA extraction and was therefore excluded from downstream work.
Amplicon libraries for Illumina MiSeq Sequencing were prepared. For this preparation, the manufacturer’s guidelines of Illumina were followed, and the PCR products Q5® of New England Biolabs were used. Two primer pairs were selected for metabarcoding, targeting 18S (SSU-F04; (SSU)R22mod) and COI (mICOIintF; LoboR1) regions [7]. As the COI primers did not yield sufficient results for any of the collected samples, downstream sequencing was performed only for ribosomal regions.
After index PCR, all samples were pooled. Sequencing was carried out on an in-house MiSeq machine, following manufacturer’s instructions. After sequencing, the guidelines of DADA2 for big data were followed. Taxonomy was blasted against the SILVA v132 dada2 formatted 18S ‘train set’ [36]. Species identification is based on, and limited by, the database available on GenBank.
3. Results
3.1. Morphological Results
In the following section, the results of a total of four sampling efforts in Ostend are summarized. The data from the pilot sampling in July are not included, since this was not an official sampling effort. Table 1 lists the recorded environmental conditions during the different samplings. During the first real sampling in August samples were taken at 0 m, 5 m, 10 m, 15 m, 20 m, and 25 m from the sea. As observations while processing suggested that abundance increases with distance from the sea, the following samplings also included measuring points at 30 m and 35 m away from the coastline.
In August, only six samples were taken, while eight samples were taken during the other sampling periods (September, November, and December). In order to easily compare all the different sampling periods, the number of organisms counted during August was corrected for eight samples. A total of 1,742 organisms were retrieved. The highest abundance usually occurred in samples 6 and 7, which correspond to distances of 25 m and 30 m from the sea. The highest diversity, on the other hand, was always found in samples located closer to the low-water line, mostly in samples 3 and 4, i.e. at 10 m and 15 m from the low-water line.
Microscopic pictures of collected organisms representing the different taxonomic groups are displayed in Figure 3A. Figure 3B displays the total number of organisms collected per sampling effort, organized according to their taxonomic group. The peak number of organisms was observed in August, whereas the lowest count was recorded in December. The majority of Platyhelminthes was recovered in December, and this included primarily proseriates. Throughout all the sampling trips, only one specimen of Rhabdocoela was identified in December. No other platyhelminth group was detected. In August, Acoela and Nematoda displayed the highest abundance, while Polychaeta was the dominant group in November. Copepods reached a peak abundance in December, whereas isopods exhibited their highest abundance in September and November. Among all the organisms encountered during the samplings, proseriates were the most frequently observed. Isopods were the least commonly found organisms throughout the sampling period.
3.2. Molecular Results
DNA concentrations of bulk extractions are listed in Table S1. Gel electrophoresis revealed that the chosen COI primer pair did not amplify any of the collected samples, even after several optimization steps were undertaken. The selected 18S rDNA fragment was amplified successfully. The control DNA was visible during gel electrophoresis, but after sequencing (see further), it was determined that the control DNA did not contain any Amplicon Sequence Variants (ASVs) with significant reads.
For some taxa, only a subset of organisms identified during the morphological part of this study was selected for molecular sequencing. For instance, although a large number of nematodes were detected morphologically, only a portion of these were included in the molecular sequencing due to their very high abundance.
Figure 4 shows the number of different species per taxon for all samplings from September until December based on SSU-metabarcoding. A total of 106 Amplicon Sequence Variants (ASVs) were identified, 77 of which were assigned to Metazoa. Tables S2–S8 show the full list of ASVs per taxa. After filtering out rare (insignificant) reads, 65 metazoan ASVs were retained: 12 representing Polychaeta, 17 Proseriata (Platyhelminthes), 15 Copepoda, 4 Acoela, 16 Nematoda and 1 representing Rhabdocoela (Platyhelminthes). Identification of the ASVs through blasting yielded 23 unique species identifications (Table S9). The highest species richness was observed among Proseriata and Nematoda, each comprising six different species. Additionally, four different species of Polychaeta and Copepoda, two species of Acoela, and one species of Rhabdocoela were identified.
4. Discussion
In the following section, the observed meiofaunal diversity and abundance patterns are discussed in relation to previous reports, various characteristics of the beach, and other abiotic circumstances. The focus of this discussion will primarily be on the quantification of abundances based on the morphological aspects of this study and the diversity captured by the metabarcoding effort. No quantitative sequence data of the organisms under study are available yet, and the ASVs derived from the molecular sequence data (Tables S2–S8) represent the number of unique contigs, rather than actual specimen numbers.
4.1. Meiofaunal Diversity and Abundance in Light of Beach Nourishments and Seasonal Patterns
The final report of the MDK “Studie over de impact van zandsuppleties op het ecosysteem” [19] provides a baseline about the state of the Belgian beaches before the start of this project. The report states that on the beach of De Panne, the meiofauna densities increase from the high littoral to the low littoral zone. Lower in the intertidal zone, meiofauna species richness is higher, but densities are lower than in the high intertidal community [37]. In this report, the authors focus solely on hard-bodied meiofauna (e.g., Polychaeta, Copepoda, and Nematoda). This highlights the importance of our present study, which also includes soft-bodied organisms.
Like the MDK study, this research focuses on interstitial meiofauna. The report indicates that diversity increases from the high littoral to the low littoral zone on the beach of De Panne. On the Small Beach of Ostend, a similar trend was observed. Furthermore, the report states that lower in the intertidal zone, meiofauna species richness (diversity) is higher, but densities are lower compared to the high intertidal communities [37]. During our present study at the “Small Beach”, the highest abundance was mostly recorded in samples 6 and 7, which corresponds to 25 m and 30 m from the low-water line. The highest diversity was usually seen in samples 3 and 4, which corresponds to 10 m and 15 m from the low-water line. This matches the findings of the report of the MDK; the lower in the intertidal zone, the higher the diversity, with the inverse being true for abundance. Abundance, in fact, increased from the low littoral to the high littoral zone. In August and September, the lowest abundance was found in the samples located closest to the low-water line and the highest abundance in samples located furthest from the low-water line. For the sampling in November abundance decreased again after sample 7, and thus 30 m from the low-water line. For the sampling in December this already happened after sample 6, and thus 25 m from the low-water line. A study on the horizontal distribution of Platyhelminthes on the nearby beach of Mariakerke found highest species numbers in the upper mid-littoral zone, and lowest diversity at the low tide mark [24]. An intermediate number of species was encountered both at the high tide mark and the lower mid littoral zone. Platyhelminth densities were also highest in the upper mid littoral, and somewhat lower at high tide level. A much lower density was noted at low tide level, and in the lower mid littoral.
Nematodes were the most abundant taxon, with almost equal absolute densities over the whole tidal zone. For copepods, highest densities were encountered at the hight tide mark, and gradually decreased towards low tide level. Similar to Platyhelminthes, Gastrotricha reached highest densities in the upper littoral [38]. This coïncides with the findings in other beaches with a slow drainage and a high-water table, that meiofauna tends to be concentrated in the upper levels of the tidal zone [39]. Furthermore, platyhelminth diversity at the Belgian coast is higher in beaches with clean, fine to medium sands than in those with fine, silt-rich sediments [40]. The semi-sheltered Small Beach in Ostend showed a diversity that was only slightly lower as the more exposed sandy beaches of the Belgian coast, but that was still much higher as in the fine, silt-rich sheltered beach of Heist.
The report of the MDK highlights that the zonation patterns of several species are seasonal [41,42], implying that the presence of certain organisms may vary according to the different sampling periods (personal communication Francis Kerckhof, VLIZ,). Indeed, Figure 3B illustrates some fluctuations in the number of specimens during the various sampling sessions and thus during the various months. It is important to note that due to the limited number of data points available, formal statistical analysis to assess these trends is not feasible at this stage. Nonetheless, we can discuss some observed patterns based on the available data.
The highest overall abundance of organisms was observed in the warmest month, August, while the least overall abundances were recorded in the coldest month, December. This is well exemplified by the situation in Acoela. During the first sampling in August 47 specimens, corrected for eight samples, were found (35 specimens were counted for six samples). This number decreased to 30 in September, declined further to 18 in November, and finally reached 9 in December. Accordingly, the environmental temperature decreased from August until December (Table 1).
Accordingly, for all taxonomic groups, except for Platyhelminthes and Copepoda, the least organisms were found in December. As illustrated in Figure 3B, the highest numbers of Acoela and Nematoda were found in August, the highest numbers of Isopoda were found in September and November, the most polychaetes were also recorded in November and the highest numbers of Platyhelminthes and Copepoda were observed in December.
This observation may be attributed to the seasonal zonation patterns of certain organisms, as suggested by the MDK. It is possible that these organisms exhibit variations in distribution based on the changing seasons. Another explanation could be predator-prey relationships or incompatibility among different species, preventing them from coexisting in high numbers [41,42]. To gain a better understanding of these patterns, further investigation is required to explore the underlying ecological factors influencing the observed variations in abundance among different taxa.
A final group worth discussing here is Rhabdocoela. A previous sampling effort by members of our research group in 2019 at Ostend beach, retrieved these organisms in high numbers. However, our new sampling efforts only retrieved a single species, represented by one specimen, of Rhabdocoela in December. SSU-metabarcoding identified this species as Litucivis serpens Ax & Heller, 1970. Litucivis serpens has not yet been recorded on the Small Beach of Ostend, but this species has been found at the Belgian east coast (Bredene-Dutch border) [43].
A possible explanation for this decrease could be the recent supplementation works performed on the Small Beach of Ostend (last nourishment before this research: February 2022). Supplementation works on the beaches of Ostend are carried out on behalf of the MDK, and are used for beach nourishments. A thin layer of sand (< 30 cm) is scraped from the beach using a variety of heavy machinery. The impact of these nourishments might explain the lower number of rhabdocoels observed in this study compared to the research conducted four years ago, when no supplementation works had been carried out. Another explanation could be that meiofaunal communities suffer from human passage. Martínez et al. [30] suggest that the effect of the presence of people could primarily be attributed to trampling. Other potential effects might be indirectly related to human presence, such as the amount of sunscreen and fecal-related bacteria entering the water, which are likely proportional to the number of tourists [30]. It is important to monitor meiofaunal communities because similar impacts may be affecting other taxa as well.
4.2. Molecular Findings: Varying Amplification Yields
For this study, two primer pairs were selected, targeting 18S (SSU-F04; (SSU)R22mod) and COI (mICOIintF; LoboR1) [7]. However, only the 18S primers yielded sufficient results, while the COI primers, which were successful in other studies [7], failed for all samples in this instance. This failure may be attributed to the higher substitution rate of COI compared to 18S [44], causing greater sequence divergence among organisms in the samples. Indeed, a recent study comparing COI and 18S rRNA genes for identifying marine nematodes demonstrates that 18S is more readily amplified compared to COI, with amplification success rates of 57% versus 43%, and sequencing success rates of 61% versus 39% [45]. For platyhelminths specifically, Vanhove et al. (2013) [46] also demonstrated how high molecular variability and contamination problems limit the possibilities for barcoding using standard COI-based protocols.
4.3. Diversity Assessed by 18S Metabarcoding
Species identification is based on the database available on GenBank. We assume GenBank is correct, but species identification is oncertain to the level that this is limited to the species available on GenBank. Sequences will be matcht to the the most identical species available in the database of GenBank. This does not necissarily mean it is in fact this species that has been found, but rather that it could be this specimen or another species that is not yet available on GenBank. For more certainty about the species identification, morphological research is required. This also shows why, in the future, it is important to combine molecular and morphologic species identification. This way, databases, such as GenBank, can be completed.
Tables S2–S8 show all metazoan ASVs identified through metabarcoding of the 18S ribosomal region. After filtering out rare reads, 65 significant reads remained, belonging to Acoela, Proseriata, Rhabdocoela, Nematoda, Copepoda, and Polychaeta. This sequencing effort also revealed traces of some additional organisms, belonging to one of the following taxa: Nemertea, Macrostomida and Gastropoda. However, there were no significant ASVs for either of these taxa.
Taxonomy was blasted against the SILVA v132 dada2 formatted 18S ‘train set’ [36]. However, meiofaunal taxonomy is constrained by several factors, including a high number of unknown species, limited expertise in the field, and a paucity of studies on individual meiofaunal taxa. Consequently, meiofaunal species databases are relatively underdeveloped. While ASVs can be matched to the most plausible species, these identifications may be subject to uncertainty. Therefore, morphological analysis remains essential for accurate species identification in meiofaunal research [47].
In this study, six proseriate species were identified: Archiloa rivularis de Beauchamp, 1910; Archotoplana holotricha Ax, 1956; Coelogynopora axi Sopott, 1972; Nematoplana coelogynoporoides Meixner, 1938; Parotoplana renatae Ax, 1956; and Parotoplana sp. GDG-2010. Archotoplana holotricha and Archiloa rivularis were not found in the assessment conducted in the 1980s. Nematoplana coelogynoporoides had not previously been recorded in Ostend, but has been observed at multiple other sampling locations along the Belgian coast [23]. Parotoplana renatae was not found in Ostend during the research by Jouk [23], but Parotoplana papii was found back then. Coelogynopora axi was found by Jouk [23] during his research, but only in Knokke and ‘Het Zwin’. This species could also have spread to the Small Beach of Ostend.
For Rhabdocoela, only a single species was identified: Litucivis serpens. This species was also recorded during the 1980’s sampling effort, but only in ‘Het Zwin’ and Zeebrugge, never in Ostend.
For Acoela two different species were identified: Haplogonaria sp. ’schillingi’ UJ-2011 and Simplicomorpha gigantorhabdis. Neither species was recorded in the research of 40 years ago. Conversely, Paratomella rubra, a species commonly encountered in this previous study, was not detected in the current research.
5. Conclusions
The primary goal of this study was to document the biodiversity and abundance of the major meiofaunal groups at the Belgian coast, specifically on the Small Beach of Ostend, through a combination of morphological and molecular methods. A morphological assessment yielded abundance data, and 18S ribosomal RNA metabarcoding was used to assess meiofaunal diversity. However, it is important to note that, given that metabarcoding studies depend heavily on available databases, it remains crucial to invest in alpha taxonomical research and continued development of sequence databases. Various environmental conditions were recorded on the investigated beach, including geolocation, time, weather, water-level, and the presence of algae. The now available data suggest a potential seasonal trend in meiofaunal communities, which requires statistical validation from a more comprehensive dataset in future work. Sand granulometry was not examined in this study, but this is recognized as an important factor shaping meiofaunal habitats, and may be considered in future investigations. The present study indicates that meiofaunal communities are not thriving on the studied beach, with an overall lower species richness and abundance. However, to fully understand the interrelationships between meiofaunal abundance, diversity, and environmental factors, additional data points are required. In particular, we encourage future researchers to investigate the impacts of ongoing beach nourishments, human activity, and anthropogenic climate change on meiofaunal communities.
Supplementary Materials
The following supporting information can be downloaded at: www.mdpi.com/xxx/s1, Table S1: Results of Qubit measurement from all the samples kept from September, November and December. The Isopoda sample of November (S7) did not dissolve during DNA extractions and was excluded from downstream work.; Table S2: Metazoan ASVs belonging to Polychaeta identified through metabarcoding of the 18S ribosomal region. Insignificant reads are marked in red and were excluded from the results.; Table S3: Metazoan ASVs belonging to Copepoda identified through metabarcoding of the 18S ribosomal region. Insignificant reads are marked in red and were excluded from the results.; Table S4: Metazoan ASVs belonging to Proseriata identified through metabarcoding of the 18S ribosomal region. Insignificant reads are marked in red and were excluded from the results.; Table S5: Metazoan ASVs belonging to Rhabdocoela identified through metabarcoding of the 18S ribosomal region. There were no insignificant reads fort his taxon.; Table S6: Metazoan ASVs belonging to Acoela identified through metabarcoding of the 18S ribosomal region. Insignificant reads are marked in red and were excluded from the results.; Table S7: Metazoan ASVs belonging to Nematoda identified through metabarcoding of the 18S ribosomal region. Insignificant reads are marked in red and were excluded from the results.; Table S8: Other metazoan ASVs identified through metabarcoding of the 18S ribosomal region. All these reads are insignificant (marked in red) and were excluded from the results.; Table S9: Summary of the metabarcoding results from tables 3 until 9.
Author Contributions
“Conceptualization, Prof. Dr. Marlies Monnens, Dr. Sofie Thijs; methodology, Prof. Dr. Marlies Monnens and Dr. Sofie Thijs; software, Thomas Van Dijck and Jill Monnissen; validation, Prof. Dr. Marlies Monnens, Dr. Philippe Jouk, Prof. Dr. Tom Artois, Dr. Sofie Thijs, and Jill Monnissen; formal analysis, Thomas Van Dijck and Jill Monnissen; investigation, Jill Monnissen; resources, Prof. Dr. Marlies Monnens, Dr. Philippe Jouk.; data curation, Jill Monnissen; writing—original draft preparation, Jill Monnissen; writing—review and editing, Prof. Dr. Marlies Monnens, Prof. Dr. Tom Artois, Dr. Philippe Jouk, Dr. Sofie Thijs; visualization, Emma van de Reydt and Jill Monnissen; supervision, Prof. Dr. Marlies Monnens; project administration, Jill Monnissen and Prof. Dr. Marlies Monnens; funding acquisition, Prof. Dr. Marlies Monnens, Prof. Dr. Tom Artois. All authors have read and agreed to the published version of the manuscript.”
Funding
The research leading to results presented in this publication was carried out with infrastructure funded by EMBRC Belgium — FWO project GOH3817N.
Institutional Review Board Statement
Not applicable.
Data Availability Statement
Sequence data generated will be deposited and made publicly available on GenBank.
Acknowledgments
Natascha Steffanie and Julie Claes helped with DNA extractions and the library prep for Illumina Miseq Sequencing. Vincent Drouard (Toerisme Oostende) and Christel Van Hoorebeke (MDK) provided information about the Small Beach of Ostend and the supplementation works that are performed on this beach. Ria Vanderspikken is acknowledged for administrative support.
Conflicts of Interest
The authors declare no conflicts of interest. The funders had no role in the design of the study; in the collection, analyses, or interpretation of data; in the writing of the manuscript; or in the decision to publish the results.
References
- Snelgrove, P.V.R. Getting to the Bottom of Marine Biodiversity: Sedimentary Habitats: Ocean bottoms are the most widespread habitat on Earth and support high biodiversity and key ecosystem services. Biosci. Rep. 1999, 49, 129-138. [CrossRef]
- Balsamo, M.; Albertelli, G.; Ceccherelli, V.; Coccioni, R.; Colangelo, M.A.; Galletti, M.C.; Danovaro, R.; D’Addabbo, R. De Leonardis, C.; Fabiano, M.; et al. Meiofauna of the Adriatic Sea: Present knowledge and future perspectives. Chem. Ecol. 2010, 26, 45-63. [CrossRef]
- Sinniger, F.; Pawlowski, J.; Harii, S.; Gooday, A.; Yamamoto, H.; Chevaldonné, P.; Cedhagen, T.; Carvalho, G.; Creer, S. Worldwide Analysis of Sedimentary DNA Reveals Major Gaps in Taxonomic Knowledge of Deep-Sea Benthos. Front. Mar. Sci. 2016, 3. [CrossRef]
- Armonies, W.; Asmus, H.; Buschbaum, C.; Lackschewitz, D.; Reise, K.; Rick, J. Microscopic species make the diversity: A checklist of marine flora and fauna around the Island of Sylt in the North Sea. Helgol. Mar. Res. 2018, 72, 11. [CrossRef]
- Semprucci, F.; Sbrocca, C.; Rocchi, M.; Balsamo, M. Temporal changes of the meiofaunal assemblage as a tool for the assessment of the ecological quality status. JMBA. 2015, 95, 247-254. [CrossRef]
- Zeppilli, D.; Sarrazin, J.; Leduc, D.; Martinez Arbizu, P.; Fontaneto, D.; Fontanier, C.; Gooday, A.; Kristensen, R.; Ivanenko, V.; Sørensen, M.; et al. Is the meiofauna a good indicator for climate change and anthropogenic impacts? Mar. Biodivers. 2015, 45. [CrossRef]
- Gielings, R.; Fais, M.; Fontaneto, D.; Creer, S.; Costa, F.; Renema, W.; Macher, J.N. DNA Metabarcoding Methods for the Study of Marine Benthic Meiofauna: A Review. Front. Mar. Sci. 2021, 8, 1429. [CrossRef]
- Schratzberger, M.; Ingels, J. Meiofauna matters: The roles of meiofauna in benthic ecosystems. J. Exp. Mar. Bio. Ecol. 2018, 502, 12-25. [CrossRef]
- Montagna, P. In situ measurement of meiobenthic grazing rates on sediment bacteria and edaphic diatoms. Mar. Ecol. Prog. 1984, 18, 119-130. [CrossRef]
- Coull, B. Role of meiofauna in estuarine soft-bottom habits. Aust. J. Ecol. 1999, 24, 327-343. [CrossRef]
- Higgins, R.P.; Thiel, H. Introduction to the study of meiofauna; Smithsonian Institution Press: Washington, 1988; pp. 488. ISBN 0-87474-488-1.
- Balsamo, M.; Semprucci, F.; Frontalini, F.; Coccioni, R. Meiofauna as a tool for marine ecosystem biomonitoring. InTech Publisher 2012. [CrossRef]
- Brannock, P.M.; Halanych, K.M. Meiofaunal community analysis by high-throughput sequencing: Comparison of extraction, quality filtering, and clustering methods. Mar. Genomics. 2015, 23, 67-75. [CrossRef]
- Hughes, A.; Orr, M.; Ma, K.; Costello, M.; Waller, J.; Provoost, P.; Yang, Q.; Zhu, C.D.; Qiao, H. Sampling biases shape our view of the natural world. Ecography. 2021, 44. [CrossRef]
- Raffaelli, D. An assessment of the potential of major meiofauna groups for monitoring organic pollution. Mar. Environ. Res. 1982, 7, 151-164. [CrossRef]
- McLachlan, A.J. Sandy Beach Ecology — A Review. 1983.
- Heip, C.H.R.; Vincx, M.; Vranken, G. The ecology of marine nematodes. Oceanogr. Mar. Biol. 1985, 23, 399-489.
- Lastra, M.; López, J. Meiofauna distribution along a gradient of sandy beaches in northern Spain. Estuar. Coast. Shelf Sci. 2003, 58, 63–69. [CrossRef]
- Speybroeck, J.; Bonte, D.; Courtens, W.; Gheskiere, T.; Grootaert, P.; Maelfait, J.P.; Mathys, M.; Provoost, S.; Sabbe, K.; Stienen, E.; et al. Studie over de impact van zandsuppleties op het ecosysteem: eindrapport; Natuurbehoud/Kbin/Universiteit, A.W.K.I.v., Ed.; 2004; p. 201.
- Cardoso, P.; Erwin, T.; Borges, P.; New, T. The seven impediments in invertebrate conservation and how to overcome them. Biol. Conserv. 2011, 144, 2647-2655. [CrossRef]
- Appeltans, W.; Ahyong, S.; Anderson, G.; Angel, M.; Artois, T.; Bailly, N.; Bamber, R.; Barber, A.; Bartsch, I.; Berta, A.; et al. The Magnitude of Global Marine Species Diversity. Curr. Biol. 2012, 22, 2189-2202. [CrossRef]
- Ridall, A. Guide to the identification of marine meiofauna, Schmidt-Rhaesa, Andreas (Ed.) Verlag Dr. Friedrich Pfeil, Munich, Germany, 2020. 608 pp. Invertebr. Biol. 2020, 139, e12304. [CrossRef]
- Jouk, P.E.H.; Martens, P.M.; Schockaert, E.R. Horizontal distribution of the Plathelminthes in a sandy beach of the Belgian coast. Fortschr. Zool. 1988, 36. [CrossRef]
- Jouk, P.E.H. Studie naar de Ecologie van de Vrijlevende Plathelminthes (Turbellaria) van de Zandstranden van de Belgische Kust. 1992.
- Schockaert, E.R.; Jouk, P.E.H.; Martens, P.M. Free-living Plathelminthes from the Belgian coast and adjacent areas. In Invertebraten van België = Invertébrés de Belgique: Verhandelingen van het Symposium "Invertebraten van België" = Comptes rendus du Symposium "Invertébrés de Belgique" = Proceedings of the Symposium "Invertebrates of Belgium"; Koninklijk Belgisch Instituut voor Natuurwetenschappen: Brussel: Brussel, 1989; pp. 19-25.
- Jouk, P.E.H; Hummo, W.D.; Hummon M.R.; Roidou, E. Marine Gastrotricha from the Belgian coast: species list and distribution. 1992.
- Armonies, W. Analysing long-term change in small benthos: Geomorphological dynamics affects method selection. Helgol. Mar. Res. 2020; 74(1):1. [CrossRef]
- Oostende municipality official website – “Strand”. Available online: https://oostende.org/nl/strand.php#:~:text=Het%20strand%20is%20het%20drukste,een%20stuk%20minder%20druk%20bezocht (accessed on 31 October 2024).
- Aankomsten door verblijfstoeristen. Available online: https://www.vlaanderen.be/statistiek-vlaanderen/toerisme/aankomsten-door-verblijfstoeristen (accessed on 31 October 2024).
- Martínez, A.; Eckert, E.; Artois, T.; Careddu, G.; Casu, M.; Curini Galletti, M.; Gazale, V.; Gobert, S.; Ivanenko, V.; Jondelius, U.; et al. Human access impacts biodiversity of microscopic animals in sandy beaches. Commun. Biol. 2020, 3, 175. [CrossRef]
- Moens, T.; Sroczynska, K.; Adão, H. Meiofauna in a changing world. Ecol. Indic. 2022, 138, 108769. [CrossRef]
- Kotwicki, L.; De Troch, M.; Urban-Malinga, B.; Gheskiere, T.; Weslawski, J. Horizontal and vertical distribution of meiofauna on sandy beaches of the North Sea (The Netherlands, Belgium, France). Helgol. Mar. Res. 2005, 59, 255-264. [CrossRef]
- Wang, X.; Liu, X.; Xu, J. Distribution Patterns of Meiofauna Assemblages and Their Relationship With Environmental Factors of Deep Sea Adjacent to the Yap Trench, Western Pacific Ocean. Front. Mar. Sci. 2019. [CrossRef]
- Schockaert, E. Turbellarians. 1996, 212-225.
- Laumer, C. Picogram input multimodal sequencing (PiMmS). protocols io. 2023. [CrossRef]
- Morien, E.; Parfrey, L.W. SILVA v128 and v132 dada2 formatted 18s ’train sets’. 2018. [CrossRef]
- Degraer, S.; Volckaert, A.; Vincx, M. Macrobenthic zonation patterns along a morphodynamical continuum of macrotidal, low tide bar/rip and ultra-dissipative sandy beaches. Estuar. Coast. Shelf Sci. 2003, 56, 459-468. [CrossRef]
- Jouk, P.E.H. Distribution of the meiofauna in a sandy beach on the Belgian coast. Ann. Soc. r. zool. Belg. 1988, 118, 103-103.
- McLachlan, A.D. Analysis of periodic patterns in amino acid sequences: collagen. Biopolymers 1977, 16, 1271–1297. [CrossRef]
- Jouk, P. E. H.; Schockaert, E. Species composition and diversity of free-living Plathelminthes (Turbellaria) from sandy beaches at the Belgian coast. Bulletin de l’Institut Royal des Sciences Naturelles de Belgique - Bulletin van het Koninklijk Belgisch Instituut voor Natuurwetenschappen. 2002, 72, 35-41.
- Grober, L.E. The ecological effects of beach replenishment. Duke University: Durham, 1992.
- Degraer, S.; Mouton, I.; Neve, L.D.; Vincx, M. Community structure and intertidal zonation of the macrobenthos on a macrotidal, ultra-dissipative sandy beach: Summer-winter comparsion. Estuaries. 1999, 22, 742-752.
- Wouters, K.; Baert, L. Invertebraten van België = Invertébrés de Belgique: Verhandelingen van het Symposium "Invertebraten van België" = Comptes rendus du Symposium "Invertébrés de Belgique" = Proceedings of the Symposium "Invertebrates of Belgium"; Wouters, K., Ed.; Koninklijk Belgisch Instituut voor Natuurwetenschappen: Brussel. : Brussel, 1988.
- Wu, S.; Xiong, J.; Yu, Y. Taxonomic resolutions based on 18S rRNA genes: a case study of subclass Copepoda. PLoS. One. 2015, 10, e0131498. [CrossRef]
- Eche, C. Comparative Analysis of Mitochondrial COI and 18S rRNA Genes in the Identification of Marine Nematodes. 2021, 1, 53-68.
- Vanhove, M.P.; Tessens, B.; Schoelinck, C.; Jondelius, U.; Littlewood, D.T.; Artois, T.; Huyse, T. Problematic barcoding in flatworms: A case-study on monogeneans and rhabdocoels (Platyhelminthes). Zookeys. 2013, 355-379. [CrossRef]
- Leasi, F.; Sevigny, J.L.; Laflamme, E.M.; Artois, T.; Curini-Galletti, M.; de Jesus Navarrete, A.; et al. Biodiversity estimates and ecological interpretations of meiofaunal communities are biased by the taxonomic approach. Commun. Biol. 2018, 1(1), 112. [CrossRef]
Figure 1.
Sampling location Small Beach, Ostend (51.2362532, 2.9186196).
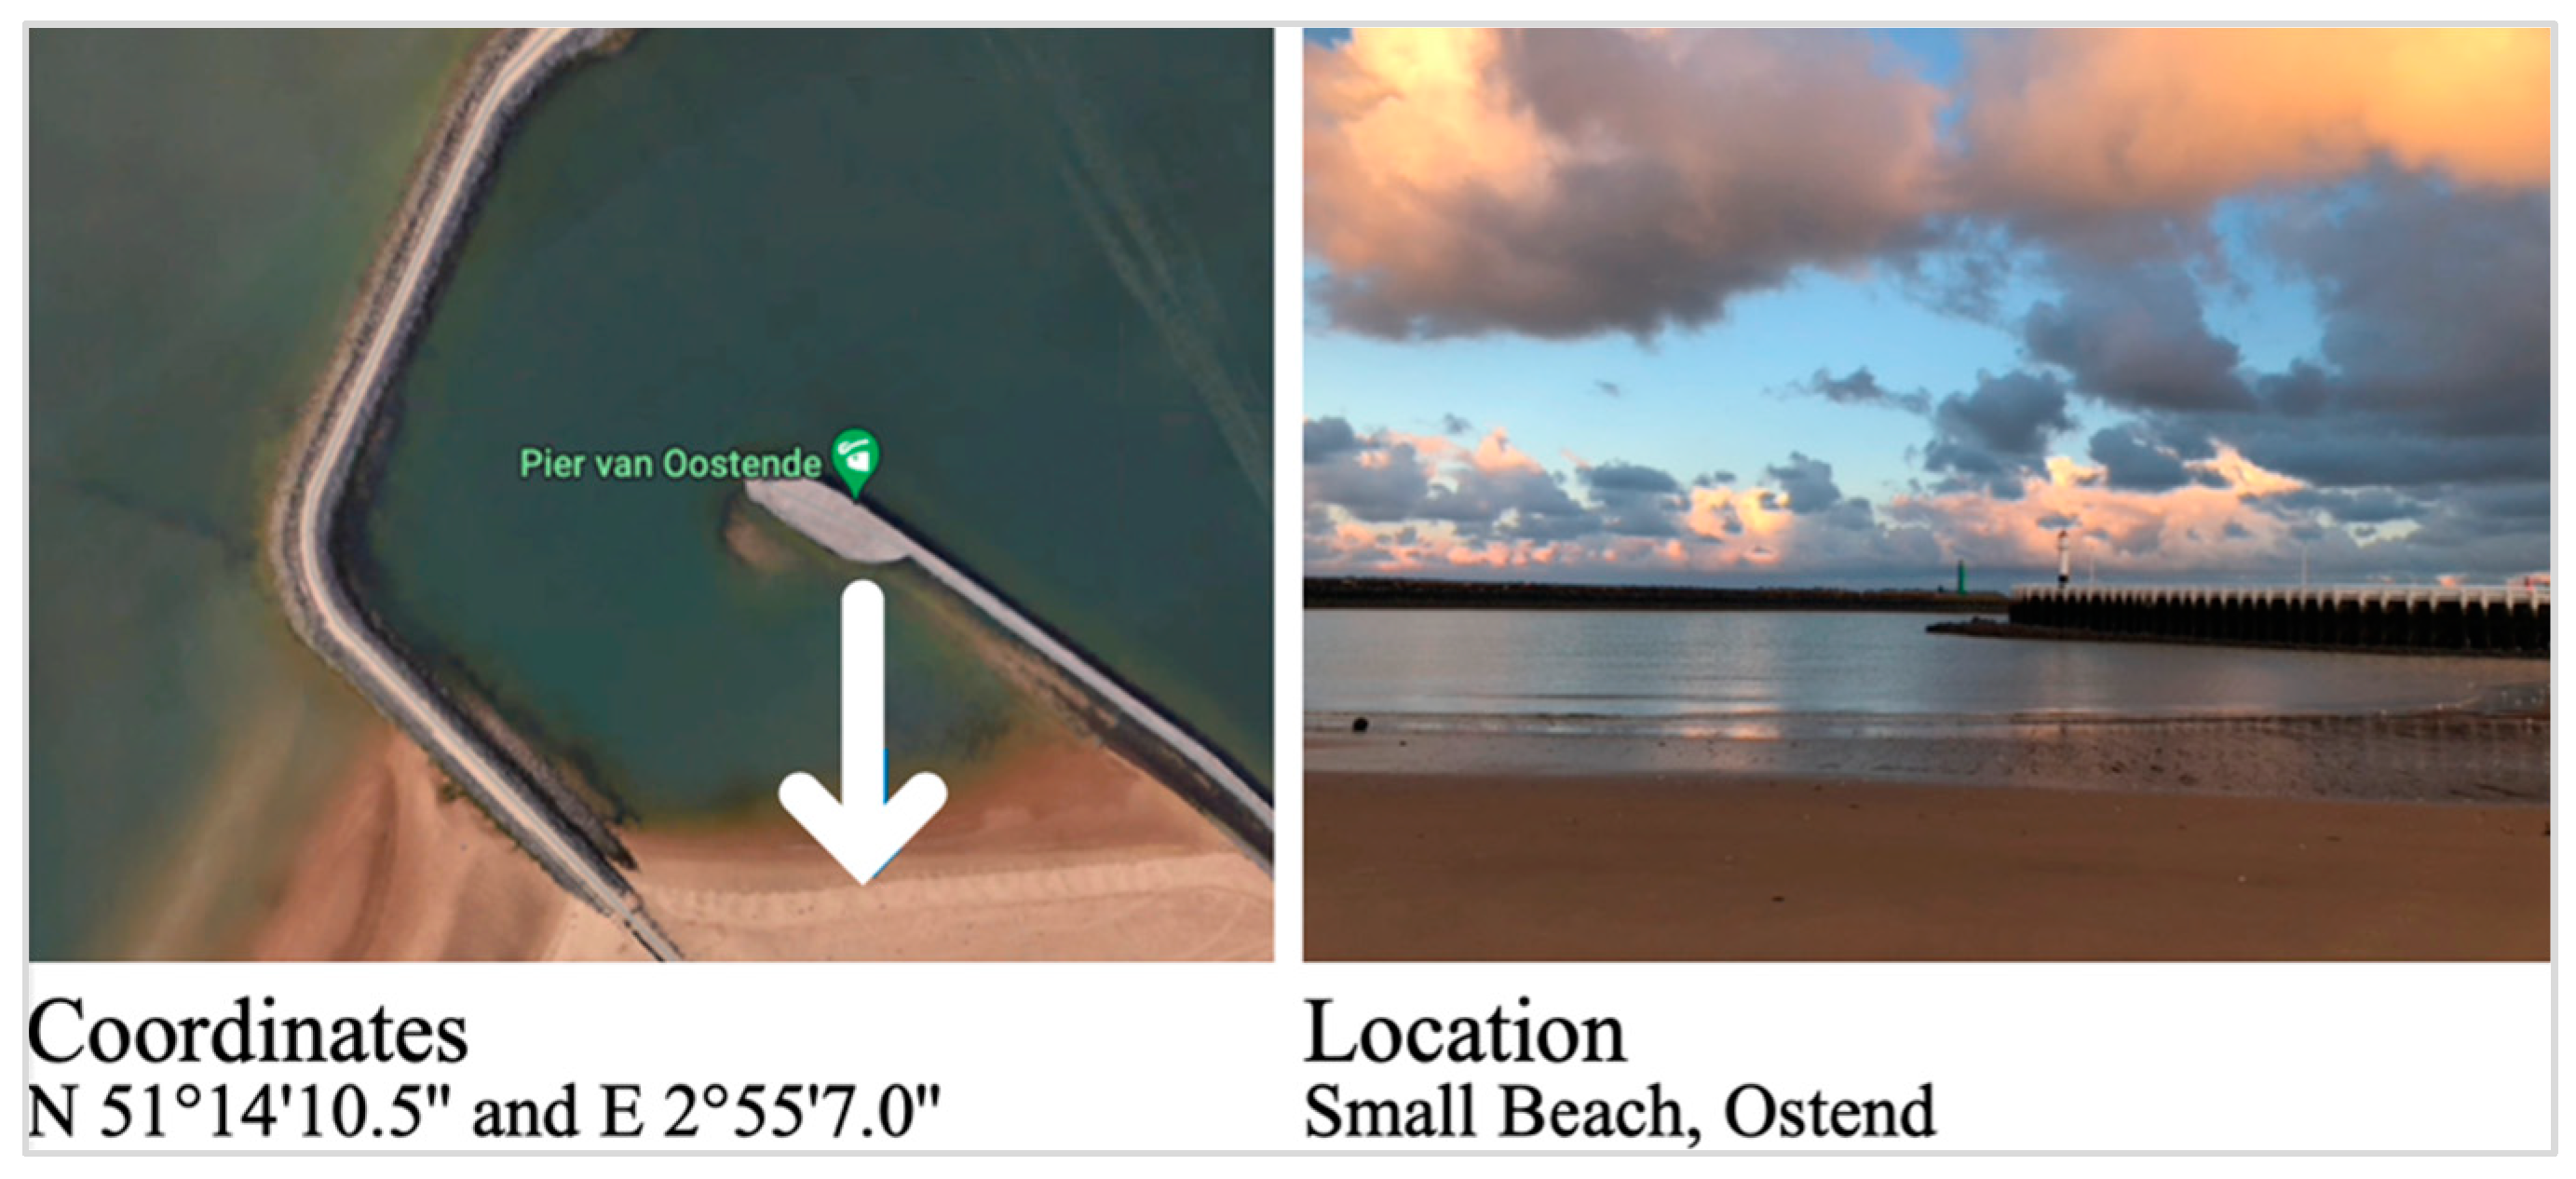
Figure 2.
MgCl2 extraction method protocol. An Isotonic MgCl2-solution was prepared, as described by Schockaert [34]. Salinity was checked using a refractometer. Subsequently, the top layer of sand was added into the solution and stirred firmly for about 1 minute. Reduced pieces of sand, recognizable by their black color, were avoided. Next, the solution was left alone for about 10 minutes. After this, the sand was stirred gently and decanted twice: first through a net with a 200µm mesh and secondly through a net with an 80µm mesh. The nets were transferred to a Petri dish containing some seawater and left there for another 10 minutes. After that, the nets were transferred to a new Petri dish and the first Petri dishes were ready to be observed with a binocular (stereo)microscope.
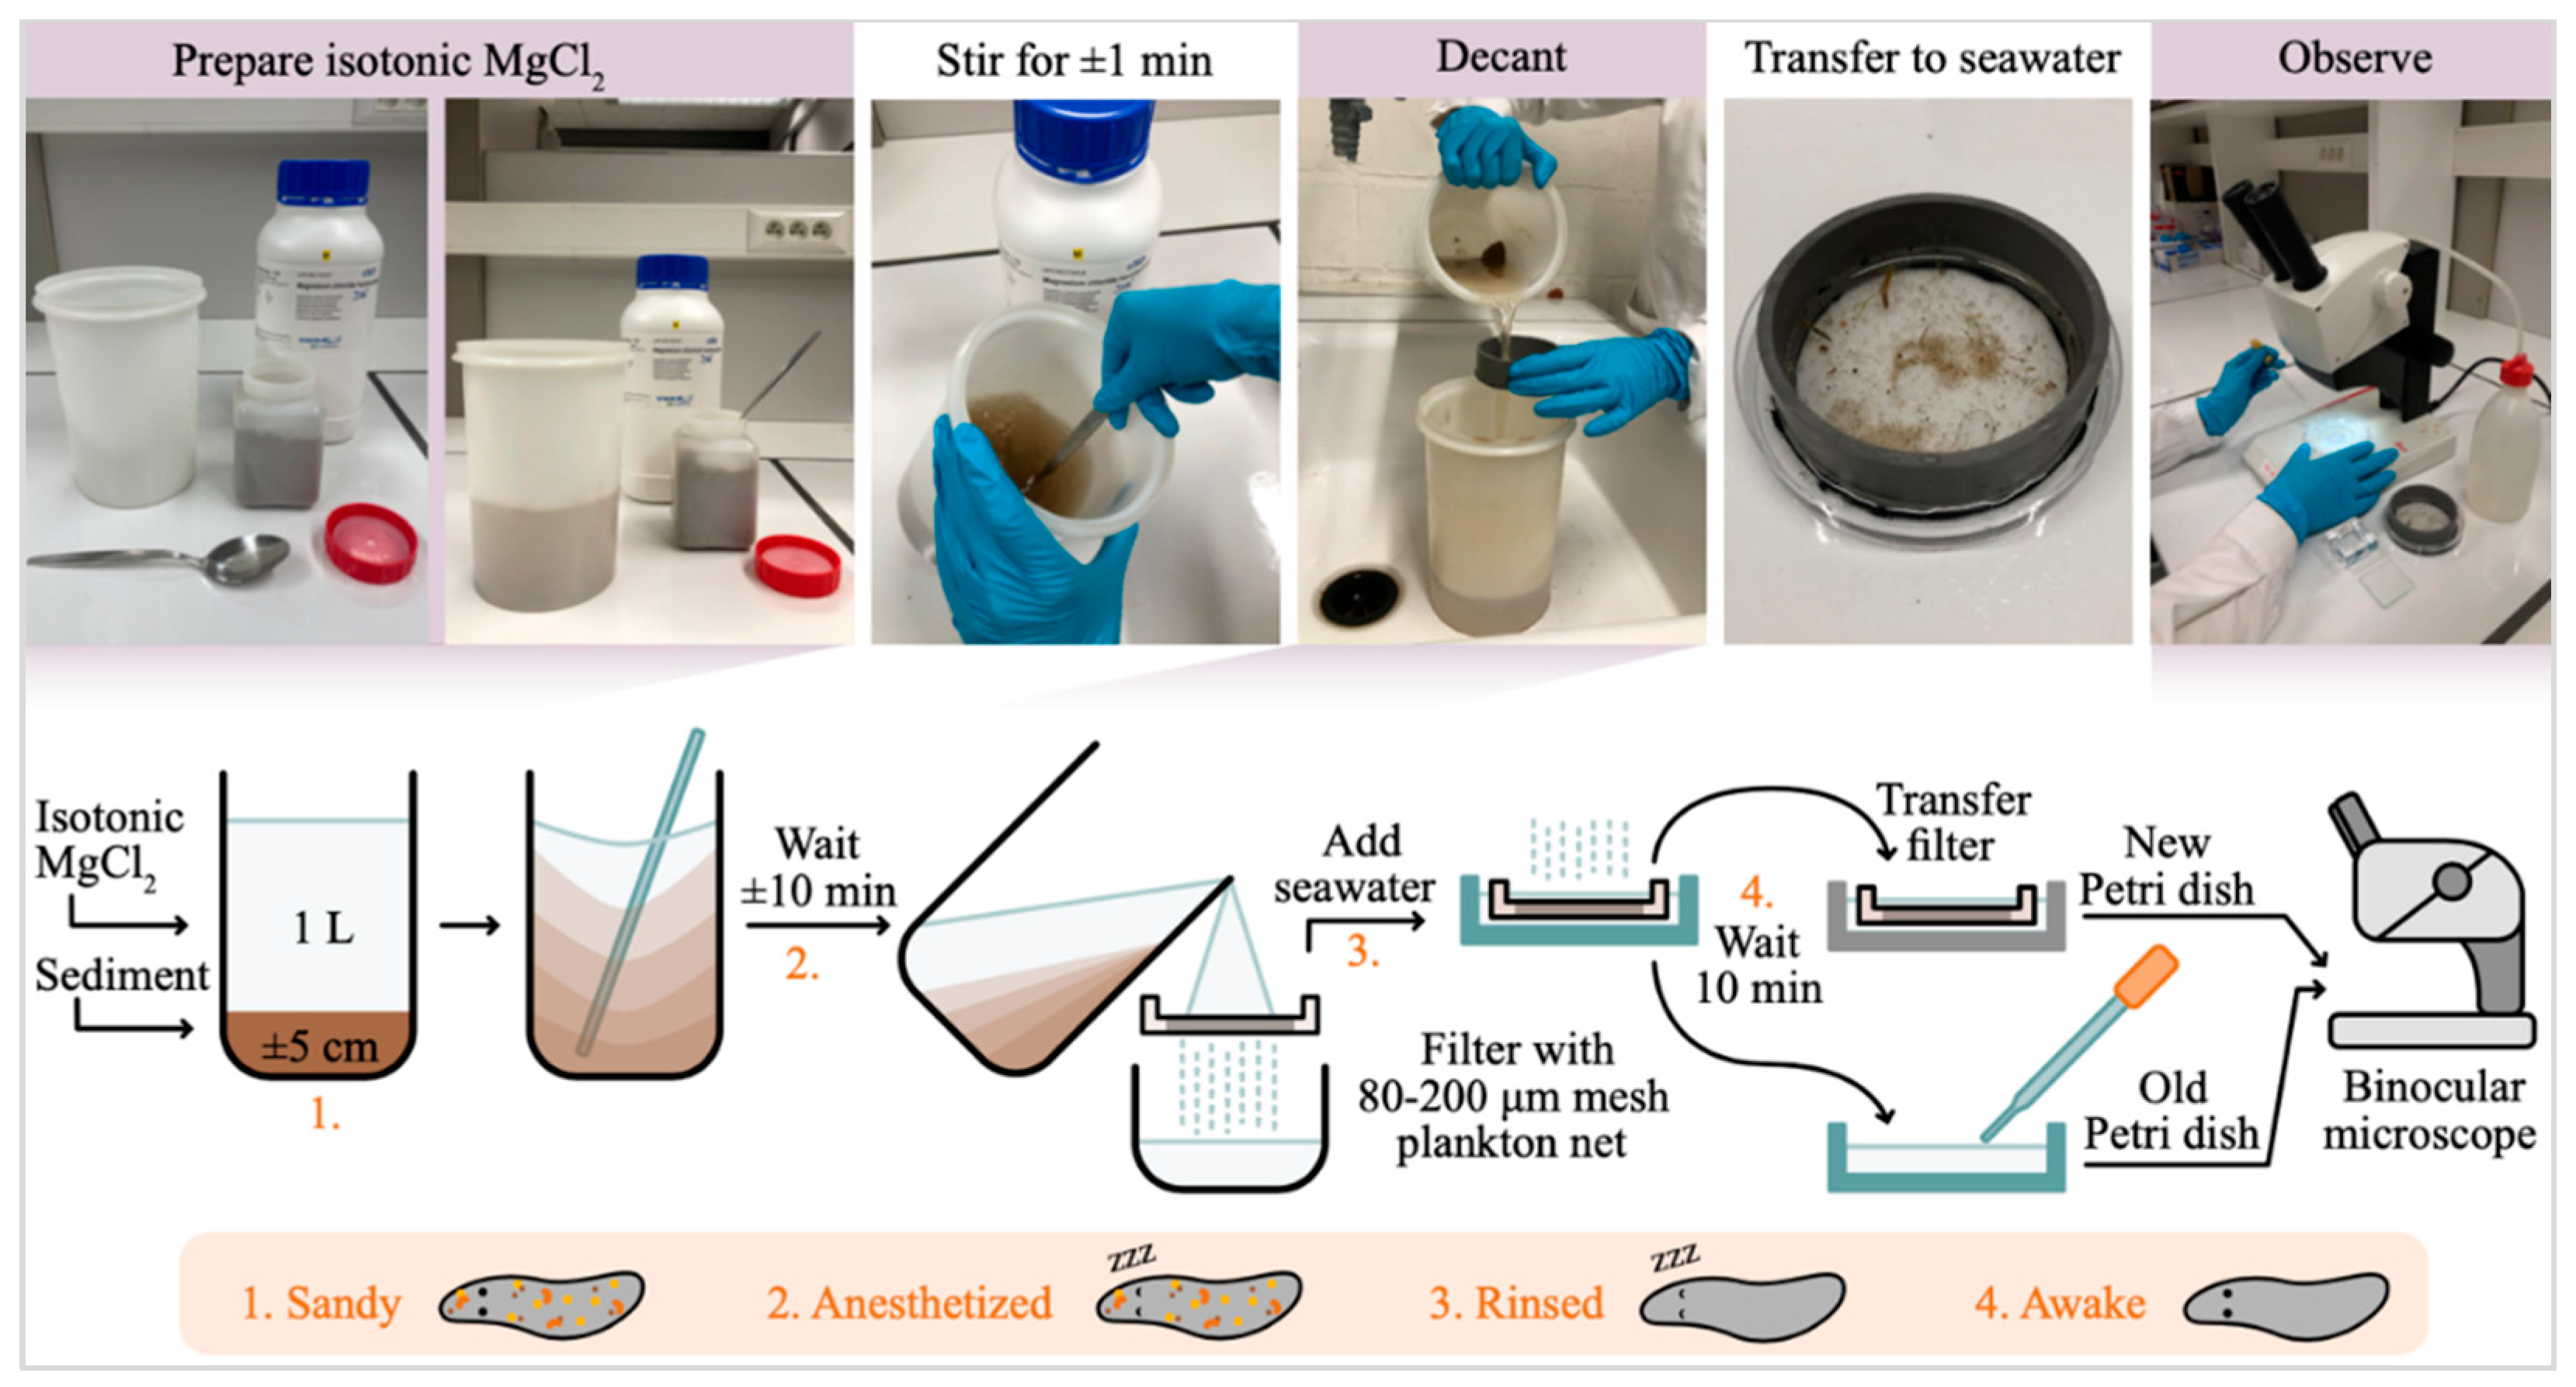
Figure 3.
Collected specimens from each sampling effort, organized according to their taxonomic group. A: Microscopic pictures taken from some organisms of different taxonomic groups. B: Total number of organisms collected per sampling effort (August, September, November, December), organized according to their taxonomic group. The number of organisms counted in August were corrected for eight samples, in order to easily compare all different sampling efforts.
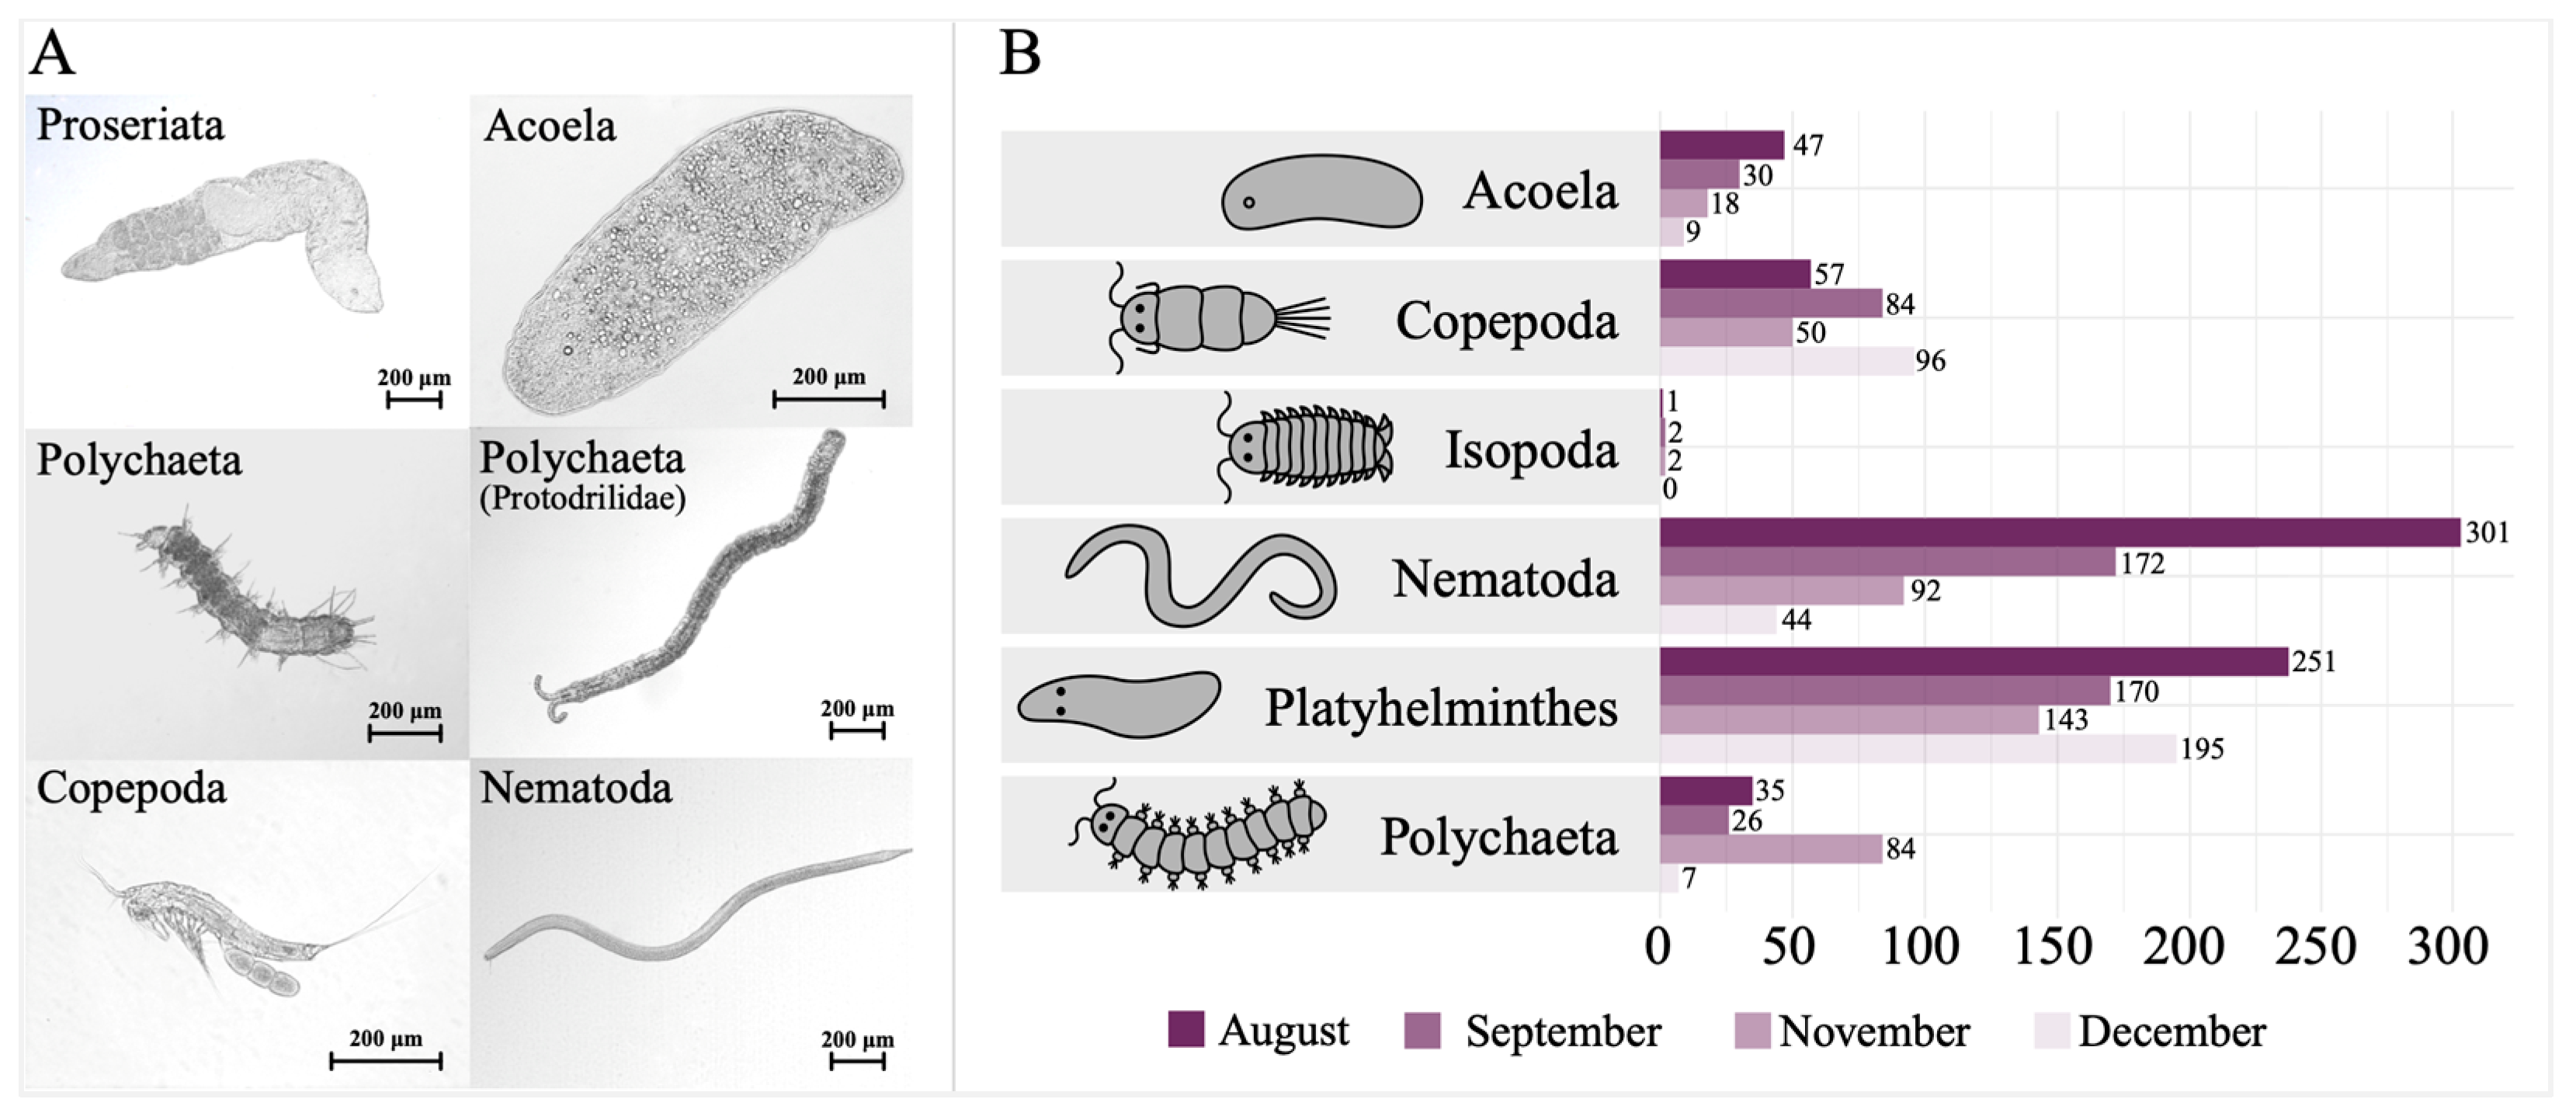
Figure 4.
Preliminary biodiversity assessment of the Small Beach of Ostend based on metabarcoding of the 18S ribosomal region. A total of 106 Amplicon Sequence Variants (ASVs) were identified, including 77 metazoan reads. After filtering out rare reads, 65 metazoan ASVs were retained. These reads belonged to Polychaeta, Proseriata, Rhabdocoela, Copepoda, Acoela and Nematoda. A total of 23 different species were identified: six different species of Proseriata and Nematoda, four different species of Polychaeta and Copepoda, two different species of Acoela, and one species of Rhabdocoela. After sequencing, the guidelines of DADA2 for big data were followed. Taxonomy was blasted against the SILVA v132 dada2 formatted 18S ‘train set’.
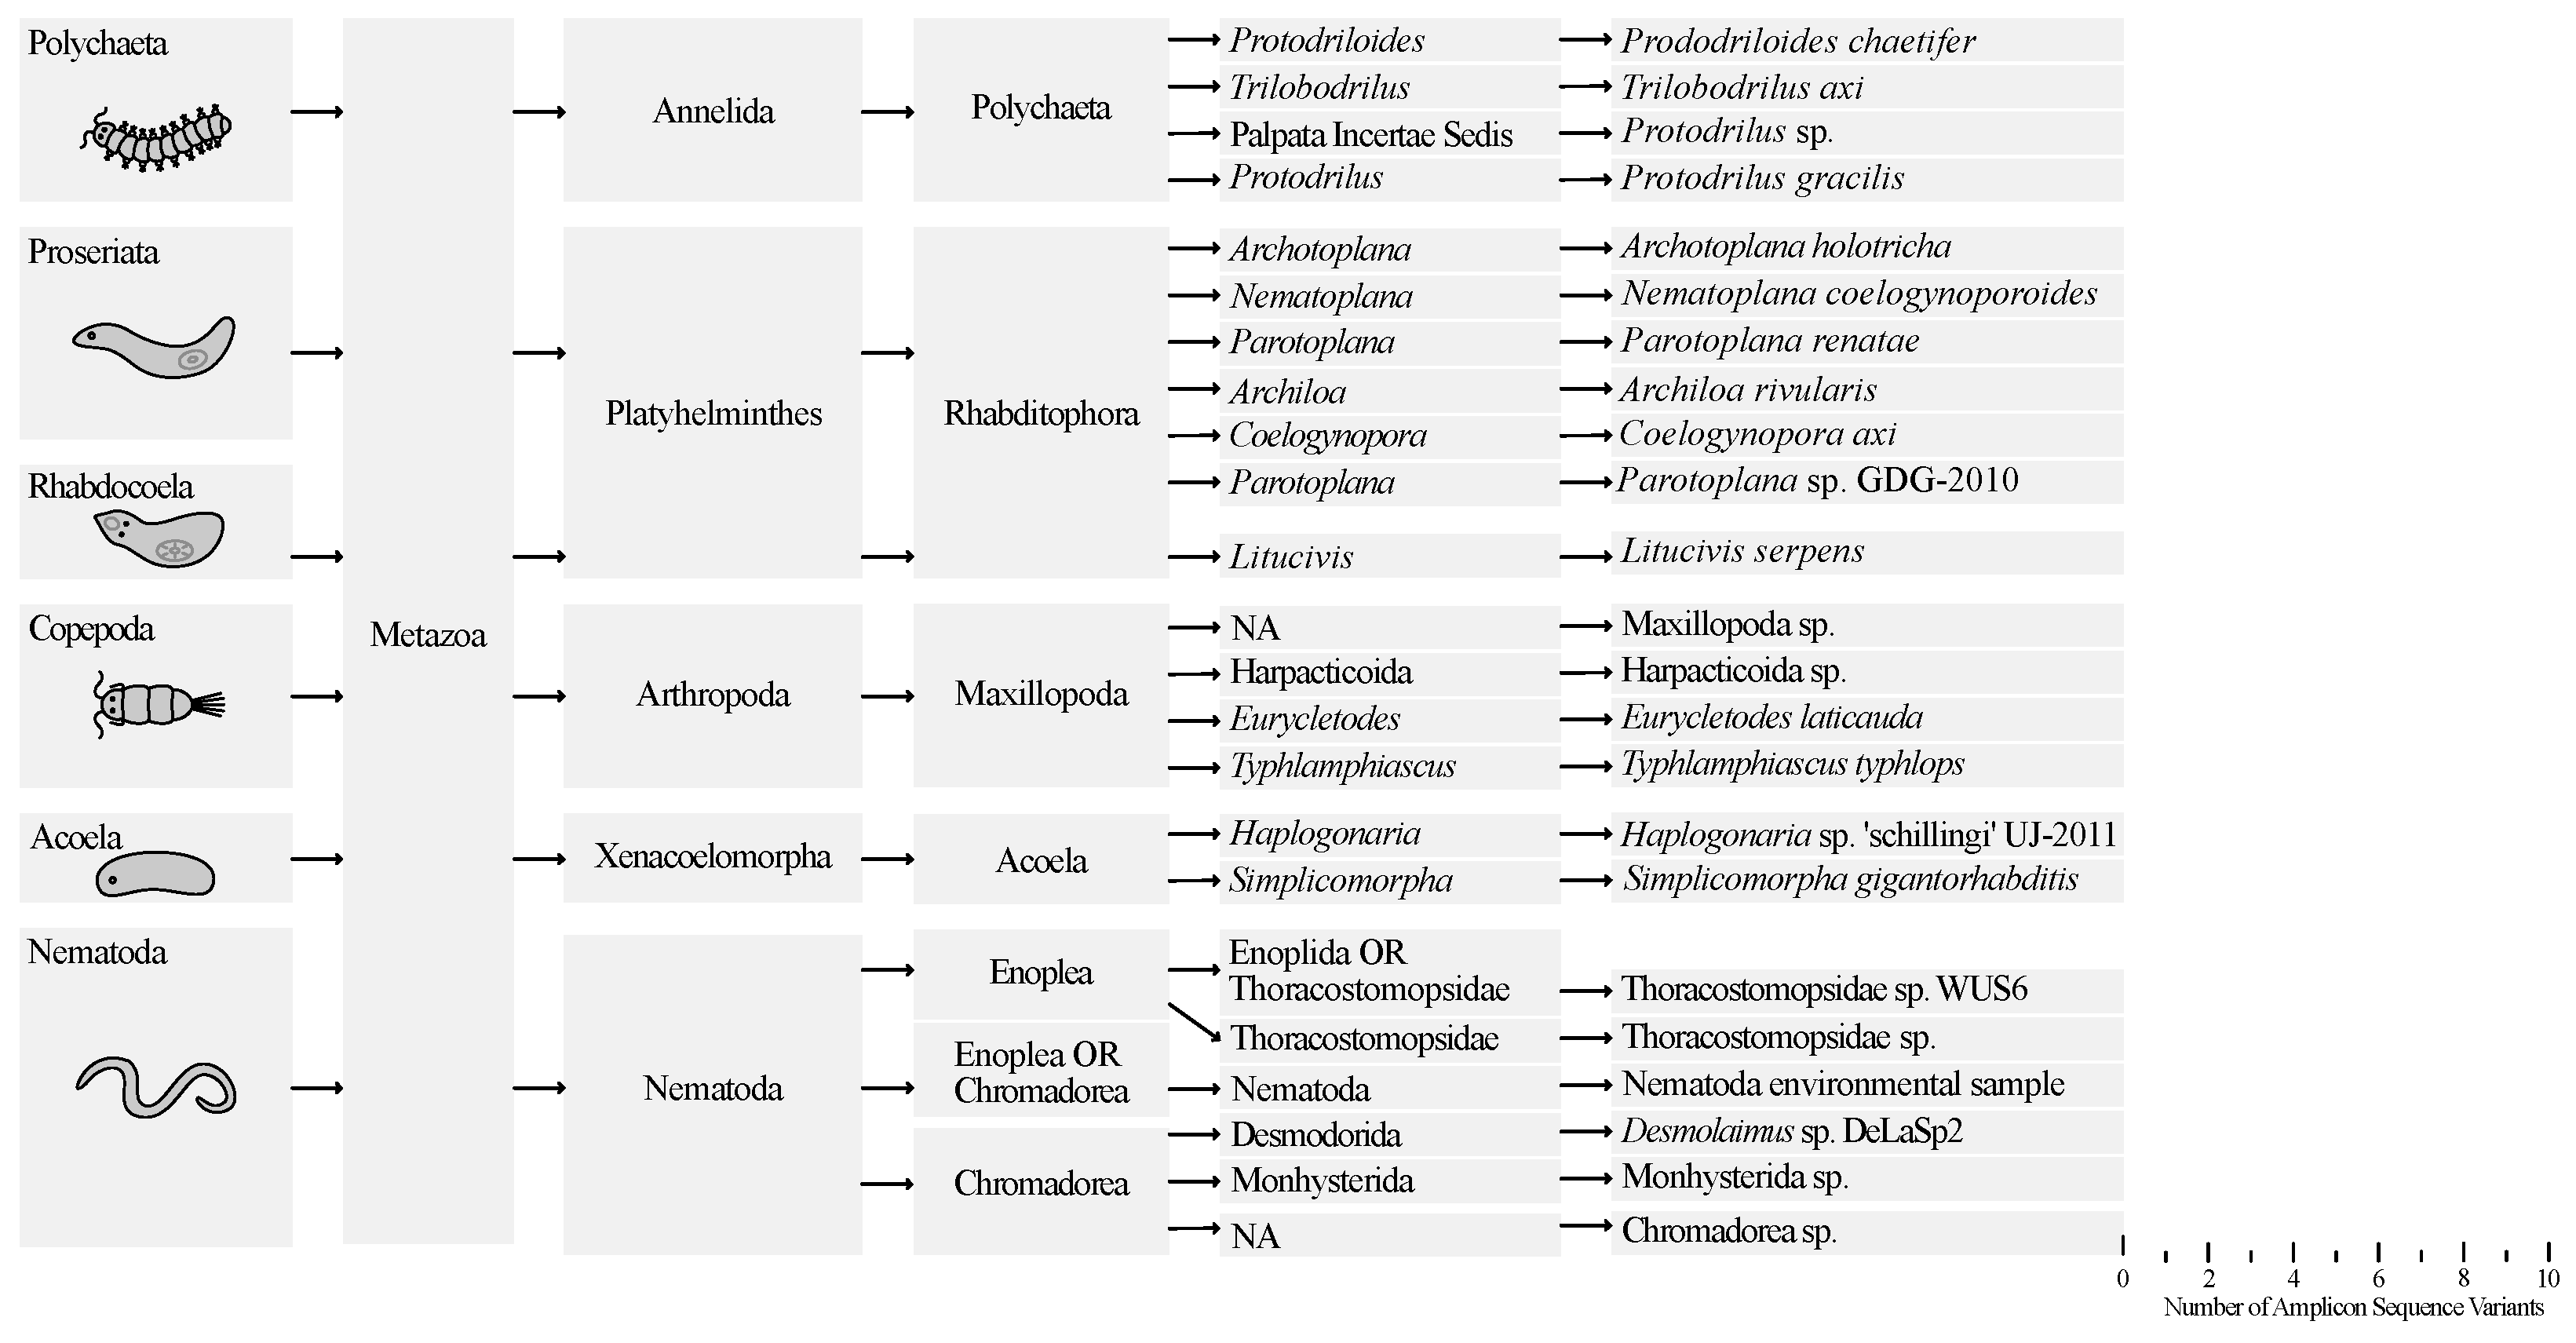

Table 1.
Circumstances during the different sampling campaigns from August until December. All samples were taken at the same location: The Small Beach of Ostend (51.2362532, 2.9186196). ‘Time’ indicates the start of each sampling event. Algae: + + indicates more than 50% of the sampling area of the beach was covered in algae, + - indicates less than 50% of the sampling area of the beach was covered in algae, 0 indicates there were no algae present on the beach.
| Date | Time | Water level | Wind | Temperature | Algae | Other |
|---|---|---|---|---|---|---|
| August 30/08/2022 |
||||||
| 10:13 h | Low tide 0.24 m |
NE 16 km/h |
Actual 19 °C Apparent 18 °C |
+ + | / | |
| September 30/09/2022 |
||||||
| 11:10 h | Low tide 0.25 m |
SW 21 km/h |
Actual 13 °C Apparent 13 °C |
+ - | Seal on beach | |
| November 12/11/2022 |
||||||
| 09:27 h | Low tide 0.39 m |
ZE 15 km/h |
Actual 8 °C Apparent 6 °C |
0 | Many seabirds |
|
| December 10/12/2022 |
||||||
| 08:40 h | Low tide 0.37 m |
W 13 km/h |
Actual 1 °C Apparent -2 °C |
+ - | Beach is frozen | |
Disclaimer/Publisher’s Note: The statements, opinions and data contained in all publications are solely those of the individual author(s) and contributor(s) and not of MDPI and/or the editor(s). MDPI and/or the editor(s) disclaim responsibility for any injury to people or property resulting from any ideas, methods, instructions or products referred to in the content. |
© 2024 by the authors. Licensee MDPI, Basel, Switzerland. This article is an open access article distributed under the terms and conditions of the Creative Commons Attribution (CC BY) license (http://creativecommons.org/licenses/by/4.0/).
Copyright: This open access article is published under a Creative Commons CC BY 4.0 license, which permit the free download, distribution, and reuse, provided that the author and preprint are cited in any reuse.


