
Submitted:
24 December 2024
Posted:
25 December 2024
You are already at the latest version
Abstract
Infections by the major opportunistic pathogen of human Candida albicans are commonly treated with echinocandin (ECN) drugs. However, C. albicans can adapt to grow in the presence of certain amounts of ECNs. Prior studies by several laboratories have defined multiple genes, as well as mechanisms involving induced aneuploidy, that can govern this. Still, mechanisms of ECN adaptation are not fully understood. Here, we use genome-wide profiling of chromatin accessibility by ATAC-seq to determine if ECN adaptation is reflected in changes in the chromatin landscape in the absence of aneuploidy. We find that drug adaptation is coupled with multiple changes in chromatin accessibility genome-wide, which occur predominantly in gene promoter regions. Areas of increased accessibilities in promoters are enriched with the binding motifs for at least two types of transcription factors: zipfinger and b-zipfinger. We also find that chromatin changes are often associated with differentially-expressed genes including genes with functions relevant to the ECN-adapted phenotype, such as cell wall biosynthesis. Consistent with this, we find that the cell wall is remodeled in ECN-adapted mutants, with chitin up and glucan down and increased cell surface exposure. Full understanding of ECN adaptation processes is of critical importance for prevention of clinical resistance.
Keywords:
Candida albicans
; ATAC-seq
; echinocandin adaptation
1. Introduction
The occurrence of invasive fungal diseases is increasing worldwide, particularly among immunocompromised individuals (reviewed in [1,2,3]). Candida species responsible for invasive candidiasis are a major contributor to overall human fungal infections [4,5]. The opportunistic human pathogen Candida albicans is the leading cause of systemic fungal infections in North America and is included in the list of Fungal Priority Pathogens by the World Health Organization (reviewed in [6,7]).
The front-line echinocandin (ECN) drugs caspofungin, anidulafungin, micafungin, and rezafungin act by interfering with biosynthesis of the cell wall of C. albicans via inhibition of 1,3-β-D-glucan synthase [8,9]. As the use of ECN drugs has increased in the last decade, the occurrence of clinical resistance in C. albicans has also increased [5,8,10,11,12]. Clinical resistance of C. albicans to ECNs is generally due to point mutations in the FKS1 (orf19.2929) gene residing on chromosome 1 (Ch1) that codes for a catalytic subunit of 1,3-β-D-glucan synthase [13]. However, multiple C. albicans clinical isolates that lack FKS1 resistance mutations nevertheless display a wide range of ECN minimum inhibitory concentrations (MICs), up to the clinical breakpoint (reviewed in [14,15]). This physiological state, which can be characterized with in vitro assays by increased ECN MICs in the absence of FKS1 mutations, we hereafter refer to as adaptation.
Mechanisms involved in decreasing the susceptibility of C. albicans to ECNs are of considerable importance, and are likely to provide critical steps in the evolution of clinical resistance [16]. Prior studies from different laboratories have identified multiple genes involved in ECN susceptibility, with some shown to be relevant in clinical isolates [17]; (reviewed in [14,18]). In addition, aneuploidy of C. albicans Ch2 or Ch5 was shown to represent some mechanisms of adaptation (reviewed in [18]). Direct evidence of small decreases in susceptibility preceding clinical resistance due to FKS mutation was provided using a related C. glabrata [19,20]. Still, the full range of molecular mechanisms involved in adaptation, leading up to clinical ECN resistance, remains to be defined.
We have previously generated caspofungin-adapted mutants that model clinical isolates exhibiting elevated MICs in the absence of FKS1 mutations [21]. Aneuploidy – loss of one Ch5 or formation of iso-chromosome of Ch5 having two right arms – was observed in many of these mutants. Most isolated mutants, however, adapted via aneuploidy-independent mechanism. In the mutants from all of the above classes, we identified point mutations including mutational hot spots, sometimes shared, as well as other changes to genomic DNA, along with multiple differentially expressed genes (DEGs) [14,22], suggesting that the mechanisms of adaptation could be complex. Notably, in fission yeast, increased resistance to drugs is often associated with changes in gene expression that are accomplished via epigenetic, chromatin-mediated mechanisms [23].
To address the possible role of chromatin structure in mechanisms contributing to adaptation to ECNs in C. albicans, we employed the Assay for Transposase-Accessible Chromatin with high-throughput sequencing (ATAC-seq) and determined the relationship between changes in chromatin accessibility and adaptation to ECN drugs in aneuploidy-independent adapted mutants.
2. Results
Genome-wide changes in chromatin accessibility in ECN-adapted mutants. We asked whether changes in chromatin accessibility occurred in C. albicans cells that have adapted to ECN drugs in the absence of aneuploidy. We performed ATAC-seq analysis with two euploid adapted mutants, JMC200-2-5 and JMC160-2-5, which were derived from the parental strain JRCT1 by independent mutational events on solid medium supplemented with caspofungin [21]. These mutants became adapted to all three ECNs tested (caspofungin, anidulafungin and micafungin) [24]; Materials and Methods).
By using MACS2, DiffBind and ChIPseeker packages (Materials and Methods), we found a large number of areas of increased or decreased read coverage genome-wide in both mutants. Such areas indicate increase or decrease of chromatin accessibility and are usually associated with gained or lost peaks [25,26]. According to the MACS2 peak threshold applied, the JMC200-2-5 strain exhibits 890 differential peaks, while JMC160-2-5 exhibits 4,121, as compared to the parental strain (Figure 1A, Table 1; Tables S1–S4). In JMC200-2-5, 417 peaks are gained, while 473 are lost, while in JMC160-2-5, substantially more peaks are gained, 2,464, than lost, 1,657. In both strains, differential ATAC-seq peaks are distributed in a non-biased manner across all eight C. albicans chromosomes (Figure 1A, Table 1).
Peaks called from ATAC-seq datasets can be classified as either Narrow or Broad, as determined by MACS2 (Materials and Methods). Notably, ATAC-seq peaks associated with transcription factor (TF) binding generally appear as narrow peaks, while peaks associated with posttranslational histone modifications exhibit broader peaks [27]. Interestingly, JMC160-2-5 loses a large number of narrow peaks (734), unlike JMC200-2-5, which loses only 26 narrow peaks (Table 1). Notably, however, these changes were quantitative, and not reflected in complete gain or loss of individual peaks. Examples of peaks that exhibited quantitative changes in intensity sufficient to be called as “gained” or “lost” are shown in Figure 1B, while Figure 2 summarizes the differential peaks, including Broad and Narrow categories in both mutants.
To address the distribution of significant ATAC-seq peaks genome-wide, we used the ChIPseeker Bioconductor package “annotatePeaks” function, an approach that was previously applied to a study of C. albicans under oxidative stress ([28]; Materials and Methods). This method identifies significant changes of chromatin landscape in such regions as Promoter, 1st Exon, Other Exon, Downstream (≤300 bp) or Distal intergenic. We found that ATAC-seq peaks are distributed non-randomly, with most located at gene promoter regions (Figure 3).
Differential ATAC-seq peaks are associated with differentially expressed genes (DEGs). Our initial ATAC-seq analysis indicates that the two ECN-adapted C. albicans mutant strains exhibit changes in chromatin accessibility genome-wide as compared to the parental strain. We next compared these changes to changes in gene expression, using our previously published transcriptional profiles of JMC200-2-5 and JMC160-2-5 (Materials and Methods; Tables S5 and S6) [14]. We find a general correlation between the number of differential ATAC-seq peaks and DEGs. JMC160-2-5 harbors a larger number of DEGs (3,135 out of 6,182 genes, ~51% of total genes) and a larger number of differential ATAC-seq peaks (4,121), while JMC200-2-5 harbors smaller number of DEGs (2,664, ~43%) and differential peaks (890) (Table 2).
To further probe the relationship between differential ATAC-seq peaks and DEGs, we used the ChIPseeker Bioconductor package “annotatePeaks” function (tssRegion = c(-1000, 200), genomicAnnotationPriority = c('Promoter', '5UTR', '3UTR', 'Exon', 'Intron', 'Downstream', 'Intergenic') (Material and Methods) that annotates peaks to the nearest gene based on proximity to the transcriptional start site (TSS). We then looked for associations between differential ATAC-seq peaks and DEGs that changed in the same direction (both filtered for p-adj < .05). This was done with a simple command 'intersect' command in R. We find that 216 of 890 differential ATAC-seq peaks (24.26%) in the JMC160-2-5 mutant and 965 of 4,121 peaks (23.41%) in the JMC200-2-5 mutant occur in proximity to and change in the same direction as DEGs (Table 2).
Analysis of accessibility changes at or near transcriptional start sites (TSSs). In order to better assess accessibility changes at or near promoter regions, we continued analyzing our data with an approach used for C. albicans previously [28]. We performed K-means clustering of all promoter regions (-1000/+200 bp around the TSS) based on their differential read coverage profile compared to the parental strain. This analysis generates four clusters in both mutants (Figure 4). For both mutants, Cluster 1 consists of promoters that exhibit a generalized increase in accessibility across the entire region, while Cluster 2 consists of promoters that exhibit a generalized, but moderate decrease in accessibility. In the JMC200-2-5 strain, promoters grouped into Cluster 2 also exhibit a localized increase in accessibility at approximately -200 bp. Cluster 3 is defined by a dramatic decrease of chromatin accessibility localized to the region of 200 bp upstream of TSS, while Cluster 4 consists of promoters exhibiting a dramatic decrease of chromatin accessibility throughout the 1kb upstream of the TSS, except at 200 bp.
We find 740 (~61%) genes in common between the two adapted mutants in Cluster 1 (out of a total of 1223 or 1218 genes in the mutants JMC200-2-5 or JMC160-2-5, respectively). Approximately 13% of these (98) are grouped in the pathway of response to stress according to the Process term of Gene Ontology (GO) Slim Mapper analysis (http://candidagenome.org/cgi-bin/GO/goTermMapper). Additionally, 7.0% are for the response to chemical and 2.7% are for cell wall organization (Table S7).
In Clusters 2, 3, and 4, we find ~50%, 49%, and ~55% of genes, respectively, are common between the two adapted mutants. Approximately 14%, 15%, and 11% of shared genes in Clusters 2, 3, and 4, correspondingly, are grouped in the pathway of response to stress (GO Slim Mapper analysis) (Tables S8–S10). Also, ~8%, 9%, and 8% are for the response to chemical challenge and ~2%, 2%, and 3% are for cell wall organization. Taken together, these data indicate that changes in chromatin accessibility occur at genes with functions that are potentially relevant to drug response.
DEGs in adapted mutants that exhibit similar changes in accessibility reveal functions important for adaptation. We reasoned that peak-associated differential DEGs that are shared between 2 independently derived mutant strains will be more likely to include genes that comprise the basis of adaptation. By using ChIPseeker Bioconductor package “annotatePeaks” function (Material and Methods), we find that among the ATAC-seq peaks that differ from the parental strain, 629 are shared between the adapted mutants JMC200-2-5 and JMC160-2-5 (Figure 5A, Tables S11–S14). These include peaks defined both as “broad” and “narrow,” and that differ from the parental strain by gain or loss of accessibility. We find that 122 of these 629 shared differential peaks are found in proximity to 116 DEGs that are similarly changed in the two adapted mutants. Moreover, in each pairing of ATAC-seq peak and DEG, change from the parent strain occurs in the same direction in both adapted mutants, as well as the peaks are predominantly identical in both adapted mutants (Figure 5B, Tables S15–S18).
We asked how these 116 DEGs that change in the same direction in both mutants are distributed across the K-means clustering of promoters (Figure 4 and Figure 6). As presented in Table 3, we find that 71 of these DEGs appear in the same cluster in each mutant strain: 25 in Cluster 1, 13 in Cluster 2, 14 in Cluster 3, and 19 in Cluster 4. In Cluster 1, all 25 of the shared DEGs are upregulated and 6 of these are involved in cell wall synthesis (BMT7 and ATC1) or sphingolipid transport (HET1); or encode fluconazole-downregulated GPI-anchored gene (PGA25); MAP kinase (MKC1) and scaffold of MAP kinase cascade (CST5) (Tables S5 and S6). All 25 shared DEGs could be important for ECN adaptation ([20,29,30,31,32,33,34,35,36]; CGD).
In contrast to Cluster 1, all DEGs in Cluster 4, with or without known function, are downregulated in both mutants. Among DEGs with assigned functions, UTP15, APN2 or THR1 are involved with anticandidal drugs from other classes than ECN, while HRR25 is involved with response of cell wall to stress [37,38,39].
In Clusters 2 and 3, we find a mixture of upregulated and downregulated DEGs with assigned functions (Table S19). Among these several (PPH21, SEC7, NMD5, FLU1; ECM21, CAN2, ERG13) are involved in response to caspofungin or azole drugs, to flucytosine, as well as to amphotericin B (CGD).
Overall, functions have been assigned to 74 out of the 116 shared DEGs. We find that these DEGs include some genes potentially important for drug adaptation, including 4 cell membrane-anchored glycosylphosphatidylinositol (GPI) genes (IFF6, PGA25, PGA53 and PGA63) and four genes encoding TFs (CTF1, HAP41, CUP9 and TRY6) (Tables S15–S18). In addition, 16 (~14%) of the shared DEGs are implicated in either caspofungin response (9 DEGs) or cell wall synthesis (8 DEGs) according to CGD (Candida Genome Database) (http://www.candidagenome.org/) (Tables 4 and S20). This suggests that these 116 shared DEGs are likely to be enriched for functions related to adaptation to ECN drugs.
We compiled a list of DEGs associated with caspofungin response and/or cell wall synthesis, and compared the quantity of differential peaks that occur over or near these genes to the average number of differential peaks associated with genes across the genome (Table 5). We found that genes associated with caspofungin response and/or cell wall synthesis harbor ~3.5-fold more differential peaks per gene, as compared to the rest of the genome.
Analysis of stress-response pathways in ECN-adapted mutants. We investigated six signaling pathways that are involved in the response to stress by ECN drugs: protein kinase C cell wall integrity (PKC), high osmolality (hog1), cek1, Ca2+ - calmodulin-activated protein phosphatase calcineurin, molecular chaperone heat shock protein 90, and cAMP-dependent protein kinase A (cAMP-PKA) [40,41,42]. There are 32 genes in the above 6 pathways of which 16 genes are upregulated in each adapted mutant, with 1 gene downregulated in JMC200-2-5 and 4 in JMC160-2-5 (Table S21). There are multiple upregulated genes in all pathways, except the heat shock protein pathway (Table S21). This suggests, as expected, that stress-responsive pathways are upregulated in ECN-adapted mutants.
A total of 16 kinases can be found in 4 stress response pathways listed above (also Table S21). Importantly, a total of 10 out of 16 kinases are upregulated; expression of remaining kinases not changing. For example, upregulated and associated with the same peak at TSS, in both adapted mutants, is MAP kinase MKC1 (Table S21). MKC1 is responsible for cell wall structure and maintenance, caspofungin response, and cell wall stress ([42,43]; CGD). Another example is FUN31, a putative serine/threonine protein kinase, which is involved in cell wall damage response (CGD). Still other example is BCY1, which is a regulatory subunit of protein kinase A, which physically interacts with Tpk1p and is required for nuclear localization of Tpk1p, a catalytic subunit of cAMP-PKA (CGD). BCY1 and FUN31 have peaks at TSS and at -259 bp downstream of TSS, respectively, in both mutants (Table S21).
Of several TFs that are known to be activated by stress-response pathways to control cell wall integrity [42], CRZ1 (orf19.7359) is upregulated in JMC200-2-5, while RIM101 (orf19.7247) is upregulated in JMC160-2-5 (Tables S5–S6). Both of these TFs are known to mediate calcium fluctuation in response to alkaline stress [44], and are associated with ATAC-seq peaks (Figure S1F), but the relationship between expression and chromatin accessibility change is not simple.
CRZ1 encodes a C2H2 zinc finger protein, which is regulated by calcineurin and is involved with drug resistance and cell wall integrity in various fungi [45]. Expression changes of CRZ1 have been previously demonstrated to be involved in ECN drug tolerance in C. albicans [19]. Importantly, CRZ1 is an auxiliary regulator of the white-opaque phenotypic switch, associated with change in chromatin accessibility (reviewed in [46]). We previously reported that CRZ1 is one of only three mutational hot spots found in both adapted mutants, which share three identical CRZ1 mutations [22].
Analysis of TF motifs in regions of differential accessibility. We used HOMER software to search for TF binding motifs in differentially accessible regions in our two mutants (Materials and Methods). For this purpose, we examined only narrow peaks that change significantly in the mutants as compared to the parental strain, since narrow peaks are believed to be associated with TF binding [27]. We used the reference strain SC5314 as a background to determine significance of candidate motifs. This analysis revealed distinct motifs, three in JMC200-2-5 and two in JMC160-2-5, in regions of increased accessibility (Figure 7, Table 6), along with a single motif enriched in regions of decreased accessibility in JMC200-2-5. The motifs associated with increased accessibility are recognized by zinc finger (Zf) and basic leucine zipper (bZIP) factors.
The binding motif associated with decreased accessibly in JMC200-2-5 corresponds to S. cerevisiae Pho4p, a (bHLH) family TF previously shown to be regulated by chromatin accessibility (https://www.yeastgenome.org/locus/S000001930; [47]). In C. albicans, Pho4p is involved in stress resistance ([48]; CGD: http://www.candidagenome.org/cgi-bin/locus.pl?locus=pho4&organism=C_albicans_SC5314;).
Remodeling of cell walls in ECN-adapted mutants. The C. albicans cell wall consists of three major polysaccharides: chitin, glucan, and mannan (Figure 8A). We asked if chromatin accessibility is correlated with expression of genes involved in biosynthesis and remodeling of the cell wall. These include glucan, chitin and mannan synthesis genes, as well as regulatory genes on Ch2 and Ch5 (Table 7) [14,15,35,49,50,51,52,53,54,55,56]. We curated a list of 52 genes known to be involved in cell wall biosynthesis. Among these, we find that 39 and 48 are DEGs in JMC200-2-5 and JMC160-2-5, respectively. A total of 35 (67%) are shared.
In JMC200-2-5 and JMC160-2-5, among the 52 cell wall-associated genes, 11 and 28, respectively, were identified as DEGs that are associated with ATAC-seq peaks which differ significantly in intensity compared to the parent strain (Table 7). Eight of these (CHS1, CHS3, PMT1, PMT2, MNS1, BMT1, BMT7, and HAS1) are common to both mutants. We note that for BMT7, MNS1 and HAS1 there is a similar correlation between accessibility and expression change in both mutants.
BMT1, which is downregulated in both mutants, and BMT7, which is upregulated in both mutants, each correlate with 2 associated ATAC-seq peaks; HAS1, which is downregulated on Ch5 in both mutants, correlates with 1 broad peak. A more complex association with peaks is observed in CHS3: the direction of change in CHS3 expression correlates with changes in a broad peak in JMC160-2-5, but not in JMC200-2-5. Interestingly, Chs3p synthesizes the majority of chitin in yeast (>50%) and hyphal (>60%) C. albicans [57]. We do not have a simple explanation for the complexity of this enzyme regulation, which will require more study in the future.
As ECN-adapted mutants harbor multiple DEGs that are associated with cell wall (Table 7), we asked whether adaptation to ECNs is coupled with remodeling of cell wall. We measured the amount of chitin, glucan, and mannan in JMC200-2-5 and JMC160-2-5 vs their parental strain (Materials and Methods) and found significant changes. Specifically, glucan decreased and chitin increased in both mutants, while mannan decreased in JMC160-2-5 (Figure 8B).
We also determined the cell surface exposure of the pathogenic epitope glucan and found that its exposure significantly increased (Figure 8C,D). Previous studies showed that CHT2, RPS25B, UAP1, URA7, HAS1, CKS1 and orf19.4149.1 that are DEGs in both mutants, act to increase glucan exposure, i.e. unmasking glucan [15]. Two out of 7 of these DEGs are associated with ATAC-seq peaks: HAS1 has a broad peak at TSS in both mutants, while CHT2 has a broad peak at TSS in JMC160-2-5. Of note, transcriptional and epigenetic changes in HAS1 correlate.
Overall, we find significant cell wall remodeling in ECN-adapted mutants, and that DEGs controlling increase of glucan cell surface exposure are associated with changes in chromatin accessibility.
3. Discussion
In C. albicans, chromatin accessibility has previously been implicated in yeast-to-hyphae transition, biofilm formation, response to oxidative stress, nitrogen assimilation and virulence [28,58,59,60]. We previously reported the underlying mutagenesis and multiple genome-wide expression changes that accompany adaptation to ECN drugs [14,22]. In this study, we asked if chromatin accessibility similarly contributes to adaptation of C. albicans to ECN drugs in two independently-derived euploid mutants by employing ATAC-seq. We find that drug adaptation is coupled with quantitative genome-wide changes in chromatin accessibility, as reflected in differential increases or decreases in peak intensities in the adapted mutants, as compared to the parental strain. Our results are similar to those of a previous study [28] which found that adaptation to oxidative stress in C. albicans resulted in genome-wide alterations in chromatin accessibility.
We also find strong correlations between changes in chromatin accessibility in ECN-adapted mutants and differential gene expression as determined by RNA-seq. We find that regions of differential accessibility occur predominantly at promoter regions, a substantial number of which are associated with DEGs. As reported in other studies, however [28,61,62], not all DEGs are associated with changes in promoter-proximal chromatin accessibility, which could reflect regulatory function from a distance [63], changes in post-transcriptional regulation, or other stages of regulation independent of chromatin structure as measured by ATAC-seq.
More evidence for the contribution of chromatin accessibility to ECN drug adaptation comes from the association of ATAC-seq peaks with genes that are involved with drug adaptation and are shared between both adapted mutants. In 16 peak-associated DEGs that are involved in either caspofungin response or cell wall synthesis, each DEG contains the associated peak at the identical position in both adapted mutants, despite independent origins of the mutant strains. Similarly, the positions of shared peaks and correlation of changes between ATAC-seq peak and DEG are also found among DEGs from other groups of genes, including MKC1, FUN31 and BCY1 that are involved in stress-response pathways or BMT1, BMT7 and HAS1 that are responsible for cell wall biosynthesis and remodeling.
ECN drugs target the cell wall of C. albicans. Both of the adapted mutants we have analyzed exhibit similarly remodeled cell walls, including increased chitin – potentially via cell wall salvage [40] – and decreased glucan with increased cell surface exposure – potentially controlled via adaptive changes in expression of 15 genes residing on Ch2 or Ch5 and acting in concert [14,15]. While there are similarities in changed gene expression between the mutant strains that correlate with this, there are also differences, which suggest that while the resulting phenotypic changes that underlie drug adaptation are common between strains, the precise alterations in gene expression that achieve those changes can vary in complicated ways.
Our ATAC-seq datasets reveal substantial differences in chromatin accessibility in ECN-adapted mutant strains of C. albicans, but these are entirely quantitative in nature, involving changes in peak intensity as opposed to peak location or occurrence. Combined with similarly quantitative changes that emerge from the RNA-seq datasets, this suggests that drug adaptation in the mutants we have analyzed entails broad-based but not absolute changes in gene expression, correlated with underlying changes in the efficiency of chromatin remodeling at gene promoters. Insofar as such changes ultimately originate with DNA mutations in the adapted strains, it seems likely that mutations in transcription factors or cofactors that alter but do not eliminate TF function should underlie the adapted phenotype. Among the mutations we have previously characterized in these adapted strains, those that occur in known or predicted TFs in both strains, such as CRZ1, and in particular those that further correlate with DNA binding motifs associated with differentially accessible regions, will therefore be of particular interest in future studies.
4. Materials and Methods
Strains, medium and growth conditions.C. albicans ECNs-adapted mutants, JMC200-2-5 and JMC160-2-5 used in the study, were generated by exposing a parental strain JRCT1 to caspofungin added to solid medium in independent parallel experiments using two different concentrations of caspofungin (200 ng/mL and 160 ng/mL) as reflected in mutants’ names [21]. The genome wide DNA changes by DNA-seq and transcription profile by RNA-seq were published for these mutants [14,22], but transcriptional profiles were reanalyzed here (see below). Cells were stored, maintained and grown using standardized approach to prevent induction of chromosome instability [64,65]. Briefly, cells were stored in a 25% (vol/vol) glycerol solution at −80°C to interrupt metabolism and routinely grown at 37°C.
YPD medium contained 1% yeast extract, 2% peptone, and 2% dextrose [66].
RNA-seq analysis. RNA-seq fastq files were downloaded from GSE217094. Quality filtering and adapter removal are performed using FastP version 0.23.1 with the following parameters: "--length_required 35 --cut_front_window_size 1 --cut_front_mean_quality 13 --cut_front --cut_tail_window_size 1 --cut_tail_mean_quality 13 --cut_tail -y –r" [67]. Processed and cleaned reads were then mapped to the C. albicans SC5314 Assembly 22 using STAR_2.7.9a with the following parameters: "—twopass Mode Basic --runMode alignReads --outSAMtype BAM Unsorted – outSAMstrandField intronMotif --outFilterIntronMotifs RemoveNoncanonical –outReadsUnmapped Fastx" [68,69]. Gene level read quantification was derived using the subread-2.0.1 package (featureCounts) with a GTF annotation file (SC5314 Assembly 22) and the following parameters for stranded RNA libraries "-s 2 -t exon -g gene_id" [70]. Differential expression analysis was performed using DESeq2-1.34.0 with a P-value threshold of 0.05 within R version 3.5.1 (https://www.R-project.org/) [71].
Nuclei preparation for ATAC-seq.C. albicans grown in YPD were used for nuclei preparation based on published protocol with minor modifications [28]. The cells of the mutants JMC200-2-5 and JMC160-2-5 and of parental JRCT1 were streaked on YPD agar plates and incubated at 37°C till young colonies of approximate size 1 × 10⁵ to 3 × 10⁵ cells per colony grew up. The colonies were picked, suspended in sterile water and cells were counted with the help of hemacytometer. A total of 2 × 10⁶ cells were inoculated in 10 ml of YPD medium and incubated at 37°C, 220 rpm for 4.5 hours in incubator-shaker. The cells were harvested, washed with 1X sorbitol buffer [1.4 M sorbitol, 40 mM HEPES-KOH pH 7.5, 0.5 mM MgCl2, 10 mM DTT (dithiothreitol)] and counted with aid of hemacytometer. A total of 3 x 10⁷ cells were pooled and suspended in 330 µl of sorbitol buffer of which 192 µl transferred in fresh microcentrifuge tube, added 8 µL of 50 mg/mL of 100T zymolyase (U.S. Biological, Swampscott, MA, USA) and microcentrifuge tube was incubated at 30°C for 10 min on mixer.
The spheroplasting efficiency was observed by measuring the OD600 of 10 µL of zymolyase-treated cells suspended in 1 mL of water. More than 90% drop in OD600 as compared to control suggests good spheroplasting efficiency. The spheroplasts were harvested at 5000g at 4°C for 10 minutes and washed with 1X ice-cold sorbitol buffer (without DTT). The pellet was gently suspended in 500 µL of 1X sorbitol buffer (without DTT) and counted. A total of 5 x 10⁶ spheroplasts were transferred in fresh microcentrifuge tube, centrifuged at 5000g at 4°C for 10 minutes and subjected to tagmentation.
Genomic DNA (gDNA) isolation from parental JRCT1. The parental strain JRCT1 was inoculated in a 50 mL Falcon tube containing 10 mL of YPD medium and grown at 37°C for 16 hours with shaking at 220 rpm. The cells from 1.5 mL cultures were harvested and washed twice with water following centrifugation at 5000 rpm for 3 minutes. The cells were resuspended in 500 µL of 1X buffer (0.9 M sorbitol, 0.1 M EDTA pH 7.5) in which 10 µL of 10 mg/mL zymolyase was added and incubated at 37°C for 90 minutes. The suspension was centrifuged at 13000 rpm for 2 minutes and the pellet was resuspended in 350 µL 1X Tris-EDTA buffer (50 mM Tris-HCl pH 7.5, 20 mM EDTA) and 40 µL of 10% SDS. The cell lysate was vortexed and incubated at 65°C for 30 minutes, 100 µL of 5M KOAc was added and the sample was incubated at 4°C for 10 minutes. The sample was centrifuged at 13000 rpm for 10 minutes at room temperature and the supernatant was transferred in fresh microcentrifuge tube. A twice the volume of supernatant, 100% ethanol was added and the sample was centrifuged at 4°C for 10 minutes at 13000 rpm. The gDNA pellet was treated with 5 µL of RNase A (10 mg/mL) (Sigma-Aldrich, St. Louis, MO, USA) at 37°C for 30 minutes, precipitated again with 100 µL of 5M KOAc and 1 mL of 100% ethanol. The gDNA pellet was resuspended in 200 µL nuclease free water and concentration was measured with nanodrop spectrophotometer (Thermo Fisher Scientific, Waltham, MA, USA) as per manufacturer’s instruction.
Tagmentation. Illumina tagment DNA TDE1 enzyme and buffer kit (Illumina, San Diego, CA, USA) was used for tagmentation. A total of 50 µL tagmentation reaction was prepared by adding 25 µL TD buffer (Tagment DNA buffer) (2X), 4 µL of TDE1 (Tagment DNA enzyme 1), 0.5 µL of 1% digitonin, 1 µL of protease inhibitor (50X) and 19.5 µL of nuclease free water. A total of 5 million spheroplasts of each JMC200-2-5 and JMC160-2-5, and parental JRCT1 was re-suspended in 50 µL of tagmentation reaction, as well as 300 ng (1 µL) of control naked gDNA was re-suspended in 49 µL of tagmentation reaction. The samples were mixed gently by pipetting and incubated at 37°C for 30 minutes with agitation on mixer. To stop the reaction, 300 µL of ERC buffer (Elute Reaction Cleanup buffer) (Qiagen, Hilden, Germany) was added. Samples were stored at -20°C before transferring to University of Rochester Genomic Research Center (URGRC) where tagmentation reaction was purified using MinElute reaction cleanup kit (Qiagen, Hilden, Germany).
ATAC-seq library amplification, size selection and next-generation sequencing. Three independent cell cultures of parental JRCT1 and ECNs-adapted mutants JMC200-2-5 and JMC160-2-5 were grown and used to prepare ATAC-seq libraries as three biological replicates. Tagmented DNA was isolated with the Qiagen MinElute Reaction Cleanup kit and eluted in 20 μL. An aliquot of 10μL was used to perform an initial 5 cycles of library PCR amplification using Illumina RNA/DNA Unique Dual index primers, with the following cycling conditions: 98◦C 45s enzyme activation; 98◦C 15 s, 63◦C 30 s, 72◦C 1 min for 5 cycles; and a final hold step at 4◦C. A 5μL aliquot of the PCR reaction was used to perform quantitative polymerase chain reaction (qPCR) on a QuantStudio 12K Flex (Thermo Fisher, Waltham, MA, USA) to determine how many additional cycles of PCR amplification should be performed on each sample [72]. Following qPCR, PCR amplification of the libraries continued for the calculated number of additional cycles using the cycling parameters above. ATAC-seq libraries in this study were amplified within a range of 8 – 17 total PCR cycles. The amplified ATAC-seq libraries were immediately purified and size selected with a double-sided solid-phase reversible immobilization (SPRI) approach (0.5X/1.4X) using AMPure XP beads (Beckman Coulter, Indianapolis, IN, USA). Library quantity and quality were assessed by Qubit and Bioanalyzer (Agilent, Santa Clara, CA, USA) assays, respectively with paired-end 50nt sequencing performed on NovaSeq 6000 (Illumina, San Diego, CA, USA) at URGRC [72].
ATAC-seq data analysis workflow.
a. Pre-processing and read alignment. Raw reads generated from the Illumina basecalls were demultiplexed using bcl2fastq version 2.19.1. Quality filtering and adapter removal was performed using FastP version 0.23.2 with the following parameters “--trim_poly_g -x --cut_window_size 4 -3 -l 35” [67]. Processed/cleaned reads were then mapped to the Assembly 22 of the C. albicans reference strain SC5314 (https://www.ncbi.nlm.nih.gov/datasets/taxonomy/237561) using bowtie2 2.4.4 (-x ${REF} -X 2000 -p ${CPUS} -1 ${FASTQ1} -2 ${FASTQ2} -S ${SAM}) [73]. Insert sizes were determined using Picard (2.17.0) CollectInsertSizeMetrics (Picard Toolkit, Broad Institute, 2019). Read fragments less than 100bp were filtered for using Deeptools (3.1.3) alignmentSieve “--ignoreDuplicates --minMappingQuality 10 --minFragmentLength 0 --maxFragmentLength 100” and were considered to be nucleosome free regions for potential binding of TSs [74]. Replicate bam files were merged with samtools (1.9) merge and bigWigs were created using Deeptools (3.1.3) bamCoverage “--binSize 1 --normalizeUsing CPM” [75].
b. Genomic coverage of ATAC-seq signals, and heatmap clustering. Deeptools “bamCompare” was used to compute the log2Ratio of mutant compared to control. The bigwigs were then used in Deeptools “computeMatrix” (“--referencePoint TSS -b 1000 -a 200”) to compute scores for each gene. The output matrix was subsequently used to generate a profile plot using Deeptools “plotProfile” (“--kmeans 4”) and a cluster heatmap using Deeptools “plotHeatmap” (“--zMin -1 --zMax 1 --kmeans 4”).
c. Peak calling. Narrow peak enrichments for nucleosome free regions were called with MACS2 2.2.7.1 using ATAC-seq specific parameters “--nomodel --shift -100 --extsize 200” for individual samples. To determine broad peaks, MACS2 was called using the “-- broad” parameter [76].
d. Analysis of differential ATAC-seq peaks and genomic annotation of ATAC-seq peaks. Differential chromatin accessibility between mutants and controls was determined using DiffBind and DESeq2 packages [71,77]. Regions with a p-adjusted value < 0.05 were considered to be significant. PCA (principal component analysis) plots (Figure S2) and heatmaps were created within the DiffBind package. Volcano plots were generated using GraphPad Prism 9.5.0. A GTF file for C. albicans SC5314 Assembly 22 was downloaded from NCBI and TxDb object was created using the “makeTxDbFromGFF” function in GenomicFeatures [78]. Peaks were annotated using ChIPseeker “annotatePeaks” function (tssRegion = c(-1000, 200), genomicAnnotationPriority = c('Promoter', '5UTR', '3UTR', 'Exon', 'Intron', 'Downstream', 'Intergenic') [79]. Pie charts for annotated regions were created in ChIPseeker.
e. Motif Analysis. Motif analysis was conducted with HOMER findMotifs using the differential accessible bed files from DiffBind (“${BED} ${FASTA} ${OUTPUT} -size given -mask) (http://homer.ucsd.edu/homer/motif/). HOMER software is designed to analyze sequence motifs of various organisms including mammals, as well as S. cerevisiae. Known motifs were considered significant with a p-adjusted value <0.05.
Determination of glucan content in the cell wall. Cell wall glucan was determined by an aniline blue assay [14]. Briefly, cells were grown at 37°C for 19 h on YPD plates from -80°C stock for independent colonies. Cells were collected from YPD plates and counted with a haemocytometer. A total of 106 cells from each strain were further processed for glucan solubilization. Cell wall glucan were solubilized by 1M NaOH at 80°C for 30 min. Aniline blue mixture [0.03% aniline blue, 0.18 M HCl, 0.49 M glycine-NaOH (pH 9.5)] was added to the solubilized glucan and incubated for 50°C for 30 min and then 30 min at room temperature. Fluorescence was measured in a plate reader (Spectra Max; Molecular Devices Corp., Sunnyvale, CA, USA) at an excitation wavelength of 400 nm and an emission wavelength of 469 nm, with a cutoff of 455 nm.
Determination of chitin content in the cell wall. Cell wall chitin was determined by measuring glucosamine released by acid hydrolysis of dry cell wall as described previously [14]. Briefly, cells were grown from -80°C stock on YPD plates at 37°C for 19 h. Cells were harvested, washed with water and suspended in sorbitol lysis buffer [1 M sorbitol, 0.1 M EDTA (pH 7.4)]. Cells were disrupted by vortexing with 0.5 mm glass beads. The cell lysate (pellet) was washed 5 times with 1M NaCl. Remaining cell wall proteins were removed with SDS-mercaptoethanol extraction buffer (50 mM Tris, 2% SDS, 0.3 M mercaptoethanol) by incubation at 100°C for 10 min. The cell wall pellet was washed with distilled water, air dried and weighed. Dry cell wall was incubated with 1mL of 6M HCl at 100°C for 17 h. The acid hydrolysates were dried by incubating at 65°C for 25 h. The hydrolysate was dissolved in 1ml of distilled water. One hundred μL of each sample was mixed with 100 μL of 1.5 M Na2CO3 in 4% acetyl acetone and incubated at 100°C for 20 min. In the next step, 700 μL of 96% ethanol and 100 μL of a p-dimethylaminobenzaldehyde solution in a 1:1 mixture of ethyl alcohol and concentrated HCl were added. The mixture was incubated at room temperature for 1 h. The absorbance at 520 nm was measured in a plate reader (Spectra Max; Molecular Devices Corp., Sunnyvale, CA, USA). Glucosamine (Sigma-Aldrich, St. Louis, MO, USA) was used to prepare the standard curve for chitin measurement. The chitin level was calculated as a percentage of the cell wall dry weight for each sample.
Determination of mannan content in the cell wall. Cell wall mannan measurements were performed with alcian blue staining method [14]. Briefly, cells were grown from a -80°C stock on YPD plates at 37°C for 19 h. Cells were collected and counted with a haemocytometer. Approximately 1.4 × 10⁷ cells were collected and washed with distilled water. Next, cells were suspended in 1 mL of 30 μg/mL of alcian blue (Sigma-Aldrich, St. Louis, MO, USA) in 0.02 M HCl (pH 3.0) and incubated at room temperature for 10 min with orbital shaking. After incubation, cell suspension was centrifuged and the supernatant was collected. The absorbance at 620 nm was measured for 100 μL of the supernatants collected from each sample using a plate reader (Spectra Max; Molecular Devices Corp., Sunnyvale, CA, USA). Standard curve was plotted to determine the concentration of alcian blue. Alcian blue binding per cell [picogram (pg) per cell] was calculated according to the formula x = [(u − v)/n] × 106, where x is the bound alcian blue (pg/cell), u is the original alcian blue concentration used for staining (µg/ml), v is the alcian blue concentration in the supernatant (µg/ml), and n is the number of cells used for staining.
Determination of glucan surface exposure by Fluorescence-Activated Cell Sorting (FACS). Glucan exposure was performed as described previously [15]. Cells were grown from a -80 °C stock on YPD plates at 37 °C for 19 h. Briefly, cells were collected and counted with a haemocytometer. Approximately, 3.5 × 10⁶ cells were collected and washed twice with 1× PBS (phosphate-buffered saline). Next, primary staining of cells were performed with 0.5 µg/mL of hDectin-1a (catalog no. fc-hdec1a) (InvivoGen, San Diego, CA, USA) at 25°C for 1 h with shaking. Cells were washed twice with 1× PBS. Secondary staining of cells was performed by incubating 4 mg/mL of goat raised Anti-human IgG antibody (catalog no. A-21445) (Invitrogen, Waltham, MA, USA) conjugated with Alexa Fluor 647 at 25°C for 30 min in the dark with shaking. Cells were washed thrice with 1× PBS to remove any unbound antibody. After washing, cells were suspended in 1 ml of 1× PBS for FACS analysis. FACS data collected from LSRII/Fortessa/Symphony A1 (Becton, Dickinson and Company, NJ, USA) were analyzed by software FCS Express 7. FACS data were recorded from three biorepeats, and each repeat contained of 30,000 events. The singlet population of at least 20,000 cells was selected for further analysis of glucan exposure.
Author Contributions
Conceptualization was done by J.J.H, E.R and S.K.S.; methodology was done by S.K.S., T.S. and A.Y.; investigation was done by S.K.S., T.S. and A.Y.; visualization was done by S.K.S. and T.S.; funding acquisition was done by E.R.; supervision was done by E.R.; writing-original draft was done by E.R., S.K.S., A.Y. and T.S.; writing-review and editing was done by J.J.H., E.R., M.B. and S.K.S.; formal analysis was done by S.K.S., T.S., M.B. and E.R.
Funding
This work was supported by National Institutes of Health grants RO1AI141884 to E.R, R01GM052426 to J.J.H.
Acknowledgments
We wish to thank Paula Vertino for stimulating discussions and intellectual input.
Conflicts of Interest
The authors declare no conflict of interest.
References
- Fisher, M.C.; Gurr, S.J.; Cuomo, C.A.; Blehert, D.S.; Jin, H.; Stukenbrock, E.H.; Stajich, J.E.; Kahmann, R.; Boone, C.; Denning, D.W.; et al. Threats Posed by the Fungal Kingdom to Humans, Wildlife, and Agriculture. mBio 2020, 11. [Google Scholar] [CrossRef] [PubMed]
- Kainz, K.; Bauer, M.A.; Madeo, F.; Carmona-Gutierrez, D. Fungal infections in humans: the silent crisis. Microb Cell 2020, 7, 143–145. [Google Scholar] [CrossRef] [PubMed]
- Almeida, F.; Rodrigues, M.L.; Coelho, C. The Still Underestimated Problem of Fungal Diseases Worldwide. Front Microbiol 2019, 10, 214. [Google Scholar] [CrossRef] [PubMed]
- Fisher, M.C.; Denning, D.W. The WHO fungal priority pathogens list as a game-changer. Nat Rev Microbiol 2023, 21, 211–212. [Google Scholar] [CrossRef]
- Lee, Y.; Puumala, E.; Robbins, N.; Cowen, L.E. Antifungal Drug Resistance: Molecular Mechanisms in Candida albicans and Beyond. Chem Rev 2021, 121, 3390–3411. [Google Scholar] [CrossRef]
- Puumala, E.; Fallah, S.; Robbins, N.; Cowen, L.E. Advancements and challenges in antifungal therapeutic development. Clin Microbiol Rev 2024, 37, e0014223. [Google Scholar] [CrossRef]
- Yiu, B.; Robbins, N.; Cowen, L.E. Interdisciplinary approaches for the discovery of novel antifungals. Trends Mol Med 2024, 30, 723–735. [Google Scholar] [CrossRef]
- Perlin, D.S. Echinocandin resistance, susceptibility testing and prophylaxis: implications for patient management. Drugs 2014, 74, 1573–1585. [Google Scholar] [CrossRef]
- Thompson, G.R., 3rd; Soriano, A.; Honore, P.M.; Bassetti, M.; Cornely, O.A.; Kollef, M.; Kullberg, B.J.; Pullman, J.; Hites, M.; Fortun, J.; et al. Efficacy and safety of rezafungin and caspofungin in candidaemia and invasive candidiasis: pooled data from two prospective randomised controlled trials. Lancet Infect Dis 2024, 24, 319–328. [Google Scholar] [CrossRef]
- Arendrup, M.C.; Perlin, D.S. Echinocandin resistance: an emerging clinical problem? Curr. Opin. Infect. Dis. 2014, 27, 484–492. [Google Scholar] [CrossRef]
- Pfaller, M.A.; Messer, S.A.; Woosley, L.N.; Jones, R.N.; Castanheira, M. Echinocandin and triazole antifungal susceptibility profiles for clinical opportunistic yeast and mold isolates collected from 2010 to 2011: application of new CLSI clinical breakpoints and epidemiological cutoff values for characterization of geographic and temporal trends of antifungal resistance. J. Clin. Microbiol. 2013, 51, 2571–2581. [Google Scholar] [CrossRef] [PubMed]
- Grossman, N.T.; Chiller, T.M.; Lockhart, S.R. Epidemiology of echinocandin resistance in Candida. Curr Fungal Infect Rep 2014, 8, 243–248. [Google Scholar] [CrossRef] [PubMed]
- Perlin, D.S. Mechanisms of echinocandin antifungal drug resistance. Ann. N. Y. Acad. Sci. 2015, 1354, 1–11. [Google Scholar] [CrossRef] [PubMed]
- Sah, S.K.; Bhattacharya, S.; Yadav, A.; Husain, F.; Ndiaye, A.; Kruppa, M.D.; Hayes, J.J.; Rustchenko, E. Multiple Genes of Candida albicans Influencing Echinocandin Susceptibility in Caspofungin-Adapted Mutants. Antimicrob Agents Chemother 2022, 66, e0097722. [Google Scholar] [CrossRef]
- Sah, S.K.; Yadav, A.; Kruppa, M.D.; Rustchenko, E. Identification of 10 genes on Candida albicans chromosome 5 that control surface exposure of the immunogenic cell wall epitope beta-glucan and cell wall remodeling in caspofungin-adapted mutants. Microbiol Spectr 2023, 11, e0329523. [Google Scholar] [CrossRef]
- Healey, K.R.; Perlin, D.S. Fungal Resistance to Echinocandins and the MDR Phenomenon in Candida glabrata. J Fungi 2018, 4, E105. [Google Scholar] [CrossRef]
- Yadav, A.; Sah, S.K.; Perlin, D.S.; Rustchenko, E. Candida albicans Genes Modulating Echinocandin Susceptibility of Caspofungin-Adapted Mutants Are Constitutively Expressed in Clinical Isolates with Intermediate or Full Resistance to Echinocandins. J Fungi (Basel) 2024, 10. [Google Scholar] [CrossRef]
- Sah, S.K.; Hayes, J.J.; Rustchenko, E. The role of aneuploidy in the emergence of echinocandin resistance in human fungal pathogen Candida albicans. PLoS Pathog 2021, 17, e1009564. [Google Scholar] [CrossRef]
- Singh, S.D.; Robbins, N.; Zaas, A.K.; Schell, W.A.; Perfect, J.R.; Cowen, L.E. Hsp90 governs echinocandin resistance in the pathogenic yeast Candida albicans via calcineurin. PLoS Pathog 2009, 5, e1000532. [Google Scholar] [CrossRef]
- Hassoun, Y.; Aptekmann, A.A.; Keniya, M.V.; Gomez, R.Y.; Alayo, N.; Novi, G.; Quinteros, C.; Kaya, F.; Zimmerman, M.; Caceres, D.H.; et al. Evolutionary dynamics in gut-colonizing Candida glabrata during caspofungin therapy: Emergence of clinically important mutations in sphingolipid biosynthesis. PLoS Pathog 2024, 20, e1012521. [Google Scholar] [CrossRef]
- Yang, F.; Zhang, L.; Wakabayashi, H.; Myers, J.; Jiang, Y.; Cao, Y.; Jimenez-Ortigosa, C.; Perlin, D.S.; Rustchenko, E. Tolerance to Caspofungin in Candida albicans Is Associated with at Least Three Distinctive Mechanisms That Govern Expression of FKS Genes and Cell Wall Remodeling. Antimicrob Agents Chemother 2017, 61. [Google Scholar] [CrossRef] [PubMed]
- Zuber, J.; Sah, S.K.; Mathews, D.H.; Rustchenko, E. Genome-Wide DNA Changes Acquired by Candida albicans Caspofungin-Adapted Mutants. Microorganisms 2023, 11. [Google Scholar] [CrossRef] [PubMed]
- Torres-Garcia, S.; Yaseen, I.; Shukla, M.; Audergon, P.; White, S.A.; Pidoux, A.L.; Allshire, R.C. Epigenetic gene silencing by heterochromatin primes fungal resistance. Nature 2020, 585, 453–458. [Google Scholar] [CrossRef] [PubMed]
- Husain, F.; Yadav, A.; Sah, S.K.; Hayes, J.J.; Rustchenko, E. Candida albicans Strains Adapted to Caspofungin Due to Aneuploidy Become Highly Tolerant under Continued Drug Pressure. Microorganisms 2022, 11. [Google Scholar] [CrossRef]
- Wang, J.; Zibetti, C.; Shang, P.; Sripathi, S.R.; Zhang, P.; Cano, M.; Hoang, T.; Xia, S.; Ji, H.; Merbs, S.L.; et al. ATAC-Seq analysis reveals a widespread decrease of chromatin accessibility in age-related macular degeneration. Nat Commun 2018, 9, 1364. [Google Scholar] [CrossRef]
- Yue, J.; Hou, X.; Liu, X.; Wang, L.; Gao, H.; Zhao, F.; Shi, L.; Shi, L.; Yan, H.; Deng, T.; et al. The landscape of chromatin accessibility in skeletal muscle during embryonic development in pigs. J Anim Sci Biotechnol 2021, 12, 56. [Google Scholar] [CrossRef]
- Wilbanks, E.G.; Facciotti, M.T. Evaluation of algorithm performance in ChIP-seq peak detection. PLoS ONE 2010, 5, e11471. [Google Scholar] [CrossRef]
- Jenull, S.; Tscherner, M.; Mair, T.; Kuchler, K. ATAC-Seq Identifies Chromatin Landscapes Linked to the Regulation of Oxidative Stress in the Human Fungal Pathogen Candida albicans. J Fungi (Basel) 2020, 6. [Google Scholar] [CrossRef]
- Mille, C.; Bobrowicz, P.; Trinel, P.A.; Li, H.; Maes, E.; Guerardel, Y.; Fradin, C.; Martinez-Esparza, M.; Davidson, R.C.; Janbon, G.; et al. Identification of a new family of genes involved in beta-1,2-mannosylation of glycans in Pichia pastoris and Candida albicans. J Biol Chem 2008, 283, 9724–9736. [Google Scholar] [CrossRef]
- Pedreno, Y.; Maicas, S.; Arguelles, J.C.; Sentandreu, R.; Valentin, E. The ATC1 gene encodes a cell wall-linked acid trehalase required for growth on trehalose in Candida albicans. J Biol Chem 2004, 279, 40852–40860. [Google Scholar] [CrossRef]
- Noble, S.M.; French, S.; Kohn, L.A.; Chen, V.; Johnson, A.D. Systematic screens of a Candida albicans homozygous deletion library decouple morphogenetic switching and pathogenicity. Nat Genet 2010, 42, 590–598. [Google Scholar] [CrossRef] [PubMed]
- Copping, V.M.; Barelle, C.J.; Hube, B.; Gow, N.A.; Brown, A.J.; Odds, F.C. Exposure of Candida albicans to antifungal agents affects expression of SAP2 and SAP9 secreted proteinase genes. J Antimicrob Chemother 2005, 55, 645–654. [Google Scholar] [CrossRef] [PubMed]
- Wiederhold, N.P.; Kontoyiannis, D.P.; Prince, R.A.; Lewis, R.E. Attenuation of the activity of caspofungin at high concentrations against candida albicans: possible role of cell wall integrity and calcineurin pathways. Antimicrob Agents Chemother 2005, 49, 5146–5148. [Google Scholar] [CrossRef] [PubMed]
- Wagner, A.S.; Lumsdaine, S.W.; Mangrum, M.M.; Reynolds, T.B. Caspofungin-induced beta(1,3)-glucan exposure in Candida albicans is driven by increased chitin levels. mBio 2023, 14, e0007423. [Google Scholar] [CrossRef]
- Han, Q.; Wang, N.; Pan, C.; Wang, Y.; Sang, J. Elevation of cell wall chitin via Ca(2+) -calcineurin-mediated PKC signaling pathway maintains the viability of Candida albicans in the absence of beta-1,6-glucan synthesis. Mol Microbiol 2019, 112, 960–972. [Google Scholar] [CrossRef]
- Yi, S.; Sahni, N.; Daniels, K.J.; Lu, K.L.; Huang, G.; Garnaas, A.M.; Pujol, C.; Srikantha, T.; Soll, D.R. Utilization of the mating scaffold protein in the evolution of a new signal transduction pathway for biofilm development. mBio 2011, 2, e00237–00210. [Google Scholar] [CrossRef]
- Xu, D.; Jiang, B.; Ketela, T.; Lemieux, S.; Veillette, K.; Martel, N.; Davison, J.; Sillaots, S.; Trosok, S.; Bachewich, C.; et al. Genome-wide fitness test and mechanism-of-action studies of inhibitory compounds in Candida albicans. PLoS Pathog 2007, 3, e92. [Google Scholar] [CrossRef]
- Liu, T.T.; Lee, R.E.; Barker, K.S.; Lee, R.E.; Wei, L.; Homayouni, R.; Rogers, P.D. Genome-wide expression profiling of the response to azole, polyene, echinocandin, and pyrimidine antifungal agents in Candida albicans. Antimicrob Agents Chemother 2005, 49, 2226–2236. [Google Scholar] [CrossRef]
- Lee, Y.; Liston, S.D.; Lee, D.; Robbins, N.; Cowen, L.E. Functional analysis of the Candida albicans kinome reveals Hrr25 as a regulator of antifungal susceptibility. iScience 2022, 25, 104432. [Google Scholar] [CrossRef]
- Walker, L.A.; Gow, N.A.R.; Munro, C.A. Fungal echinocandin resistance. Fungal Genet. Biol. 2010, 47, 117–126. [Google Scholar] [CrossRef]
- Chen, T.; Wagner, A.S.; Reynolds, T.B. When Is It Appropriate to Take Off the Mask? Signaling Pathways That Regulate ss(1,3)-Glucan Exposure in Candida albicans. Front Fungal Biol 2022, 3. [Google Scholar] [CrossRef] [PubMed]
- Iyer, K.R.; Robbins, N.; Cowen, L.E. The role of Candida albicans stress response pathways in antifungal tolerance and resistance. iScience 2022, 25, 103953. [Google Scholar] [CrossRef] [PubMed]
- Navarro-Garcia, F.; Alonso-Monge, R.; Rico, H.; Pla, J.; Sentandreu, R.; Nombela, C. A role for the MAP kinase gene MKC1 in cell wall construction and morphological transitions in Candida albicans. Microbiology (Reading) 1998, 144 ( Pt 2) Pt 2, 411–424. [Google Scholar] [CrossRef]
- Wang, H.; Liang, Y.; Zhang, B.; Zheng, W.; Xing, L.; Li, M. Alkaline stress triggers an immediate calcium fluctuation in Candida albicans mediated by Rim101p and Crz1p transcription factors. FEMS Yeast Res 2011, 11, 430–439. [Google Scholar] [CrossRef] [PubMed]
- Thewes, S. Calcineurin-Crz1 signaling in lower eukaryotes. Eukaryot Cell 2014, 13, 694–705. [Google Scholar] [CrossRef]
- Qasim, M.N.; Valle Arevalo, A.; Nobile, C.J.; Hernday, A.D. The Roles of Chromatin Accessibility in Regulating the Candida albicans White-Opaque Phenotypic Switch. J Fungi (Basel) 2021, 7. [Google Scholar] [CrossRef]
- Zhou, X.; O'Shea, E.K. Integrated approaches reveal determinants of genome-wide binding and function of the transcription factor Pho4. Mol Cell 2011, 42, 826–836. [Google Scholar] [CrossRef]
- Ikeh, M.A.; Kastora, S.L.; Day, A.M.; Herrero-de-Dios, C.M.; Tarrant, E.; Waldron, K.J.; Banks, A.P.; Bain, J.M.; Lydall, D.; Veal, E.A.; et al. Pho4 mediates phosphate acquisition in Candida albicans and is vital for stress resistance and metal homeostasis. Mol Biol Cell 2016, 27, 2784–2801. [Google Scholar] [CrossRef]
- Douglas, C.M. Fungal beta(1,3)-D-glucan synthesis. Med Mycol 2001, 39 Suppl 1, 55–66. [Google Scholar] [CrossRef]
- Mio, T.; Adachi-Shimizu, M.; Tachibana, Y.; Tabuchi, H.; Inoue, S.B.; Yabe, T.; Yamada-Okabe, T.; Arisawa, M.; Watanabe, T.; Yamada-Okabe, H. Cloning of the Candida albicans homolog of Saccharomyces cerevisiae GSC1/FKS1 and its involvement in beta-1,3-glucan synthesis. J Bacteriol 1997, 179, 4096–4105. [Google Scholar] [CrossRef]
- Lussier, M.; Sdicu, A.M.; Shahinian, S.; Bussey, H. The Candida albicans KRE9 gene is required for cell wall beta-1, 6-glucan synthesis and is essential for growth on glucose. Proc Natl Acad Sci U S A 1998, 95, 9825–9830. [Google Scholar] [CrossRef]
- Hall, R.A.; Gow, N.A. Mannosylation in Candida albicans: role in cell wall function and immune recognition. Mol Microbiol 2013, 90, 1147–1161. [Google Scholar] [CrossRef] [PubMed]
- Kruppa, M.; Jabra-Rizk, M.A.; Meiller, T.F.; Calderone, R. The histidine kinases of Candida albicans: regulation of cell wall mannan biosynthesis. FEMS Yeast Res 2004, 4, 409–416. [Google Scholar] [CrossRef] [PubMed]
- Lenardon, M.D.; Munro, C.A.; Gow, N.A. Chitin synthesis and fungal pathogenesis. Curr Opin Microbiol 2010, 13, 416–423. [Google Scholar] [CrossRef]
- Walker, L.A.; Munro, C.A.; de Bruijn, I.; Lenardon, M.D.; McKinnon, A.; Gow, N.A.R. Stimulation of chitin synthesis rescues Candida albicans from echinocandins. PLoS Pathog. 2008, 4, e1000040. [Google Scholar] [CrossRef]
- Ren, Z.; Chhetri, A.; Guan, Z.; Suo, Y.; Yokoyama, K.; Lee, S.Y. Structural basis for inhibition and regulation of a chitin synthase from Candida albicans. Nat Struct Mol Biol 2022, 29, 653–664. [Google Scholar] [CrossRef]
- Mio, T.; Yabe, T.; Sudoh, M.; Satoh, Y.; Nakajima, T.; Arisawa, M.; Yamada-Okabe, H. Role of three chitin synthase genes in the growth of Candida albicans. J Bacteriol 1996, 178, 2416–2419. [Google Scholar] [CrossRef]
- Iracane, E.; Vega-Estevez, S.; Buscaino, A. On and Off: Epigenetic Regulation of C. albicans Morphological Switches. Pathogens 2021, 10. [Google Scholar] [CrossRef]
- Jenull, S.; Mair, T.; Tscherner, M.; Penninger, P.; Zwolanek, F.; Silao, F.S.; de San Vicente, K.M.; Riedelberger, M.; Bandari, N.C.; Shivarathri, R.; et al. The histone chaperone HIR maintains chromatin states to control nitrogen assimilation and fungal virulence. Cell Rep 2021, 36, 109406. [Google Scholar] [CrossRef]
- Lopes da Rosa, J.; Kaufman, P.D. Chromatin-mediated Candida albicans virulence. Biochim Biophys Acta 2012, 1819, 349–355. [Google Scholar] [CrossRef]
- Miao, W.; Ma, Z.; Tang, Z.; Yu, L.; Liu, S.; Huang, T.; Wang, P.; Wu, T.; Song, Z.; Zhang, H.; et al. Integrative ATAC-seq and RNA-seq Analysis of the Longissimus Muscle of Luchuan and Duroc Pigs. Front Nutr 2021, 8, 742672. [Google Scholar] [CrossRef] [PubMed]
- Ding, M.; Huang, W.; Liu, G.; Zhai, B.; Yan, H.; Zhang, Y. Integration of ATAC-Seq and RNA-Seq reveals FOSL2 drives human liver progenitor-like cell aging by regulating inflammatory factors. BMC Genomics 2023, 24, 260. [Google Scholar] [CrossRef] [PubMed]
- Clark, S.J. Action at a distance: epigenetic silencing of large chromosomal regions in carcinogenesis. Hum Mol Genet 2007, 16 Spec No 1, R88–95. [Google Scholar] [CrossRef]
- Rustchenko-Bulgac, E.P. Variations of Candida albicans electrophoretic karyotypes. J. Bacteriol. 1991, 173, 6586–6596. [Google Scholar] [CrossRef]
- Rustchenko, E. Chromosome instability in Candida albicans. FEMS Yeast Res. 2007, 7, 2–11. [Google Scholar] [CrossRef]
- Sherman, F. Getting started with yeast. Methods Enzymol 2002, 350, 3–41. [Google Scholar] [CrossRef]
- Chen, S.; Zhou, Y.; Chen, Y.; Gu, J. fastp: an ultra-fast all-in-one FASTQ preprocessor. Bioinformatics 2018, 34, i884–i890. [Google Scholar] [CrossRef]
- Frankish, A.; Diekhans, M.; Jungreis, I.; Lagarde, J.; Loveland, J.E.; Mudge, J.M.; Sisu, C.; Wright, J.C.; Armstrong, J.; Barnes, I.; et al. Gencode 2021. Nucleic Acids Res 2021, 49, D916–D923. [Google Scholar] [CrossRef]
- Dobin, A.; Davis, C.A.; Schlesinger, F.; Drenkow, J.; Zaleski, C.; Jha, S.; Batut, P.; Chaisson, M.; Gingeras, T.R. STAR: ultrafast universal RNA-seq aligner. Bioinformatics 2013, 29, 15–21. [Google Scholar] [CrossRef]
- Liao, Y.; Smyth, G.K.; Shi, W. The R package Rsubread is easier, faster, cheaper and better for alignment and quantification of RNA sequencing reads. Nucleic Acids Res 2019, 47, e47. [Google Scholar] [CrossRef]
- Love, M.I.; Huber, W.; Anders, S. Moderated estimation of fold change and dispersion for RNA-seq data with DESeq2. Genome Biol 2014, 15, 550. [Google Scholar] [CrossRef] [PubMed]
- Buenrostro, J.D.; Wu, B.; Chang, H.Y.; Greenleaf, W.J. ATAC-seq: A Method for Assaying Chromatin Accessibility Genome-Wide. Curr Protoc Mol Biol 2015, 109, 21–29. [Google Scholar] [CrossRef] [PubMed]
- Langmead, B.; Salzberg, S.L. Fast gapped-read alignment with Bowtie 2. Nat Methods 2012, 9, 357–359. [Google Scholar] [CrossRef] [PubMed]
- Ramirez, F.; Ryan, D.P.; Gruning, B.; Bhardwaj, V.; Kilpert, F.; Richter, A.S.; Heyne, S.; Dundar, F.; Manke, T. deepTools2: a next generation web server for deep-sequencing data analysis. Nucleic Acids Res 2016, 44, W160–165. [Google Scholar] [CrossRef] [PubMed]
- Danecek, P.; Bonfield, J.K.; Liddle, J.; Marshall, J.; Ohan, V.; Pollard, M.O.; Whitwham, A.; Keane, T.; McCarthy, S.A.; Davies, R.M.; et al. Twelve years of SAMtools and BCFtools. Gigascience 2021, 10. [Google Scholar] [CrossRef]
- Zhang, Y.; Liu, T.; Meyer, C.A.; Eeckhoute, J.; Johnson, D.S.; Bernstein, B.E.; Nusbaum, C.; Myers, R.M.; Brown, M.; Li, W.; et al. Model-based analysis of ChIP-Seq (MACS). Genome Biol 2008, 9, R137. [Google Scholar] [CrossRef]
- Brown, R.S.a.G. DiffBind: differential binding analysis of ChIP-Seq peak data., 3.2; 2011.
- Lawrence, M.; Huber, W.; Pages, H.; Aboyoun, P.; Carlson, M.; Gentleman, R.; Morgan, M.T.; Carey, V.J. Software for computing and annotating genomic ranges. PLoS Comput Biol 2013, 9, e1003118. [Google Scholar] [CrossRef]
- Yu, G.; Wang, L.G.; He, Q.Y. ChIPseeker: an R/Bioconductor package for ChIP peak annotation, comparison and visualization. Bioinformatics 2015, 31, 2382–2383. [Google Scholar] [CrossRef]
Figure 1.
Characteristics of significant ATAC-seq peaks in ECN-adapted mutants JMC200-2-5 and JMC160-2-5 vs parental strain JRCT1. A. Distribution of ATAC-seq peaks throughout chromosomes. Red and blue tracks represent gain or loss of peaks as indicated. B. Snapshot showing an example of IGV- track with gain of narrow peak in promoter area of PPH21 and C7_01510W_A (red) in both adapted mutants. Presented are mutants JMC160-2-5 and JMC200-2-5, parental JRCT1, and control gDNA, as indicated. See Figure S1 for the examples of gain of broad peaks, as well as loss of narrow and broad peaks in PGA25, PGA63, LSP1, ECM21, PHO87, CAN2, GLC3, BMT7, MKC1, FUN31, CRZ1, RIM101, CUP9, and CHS1.
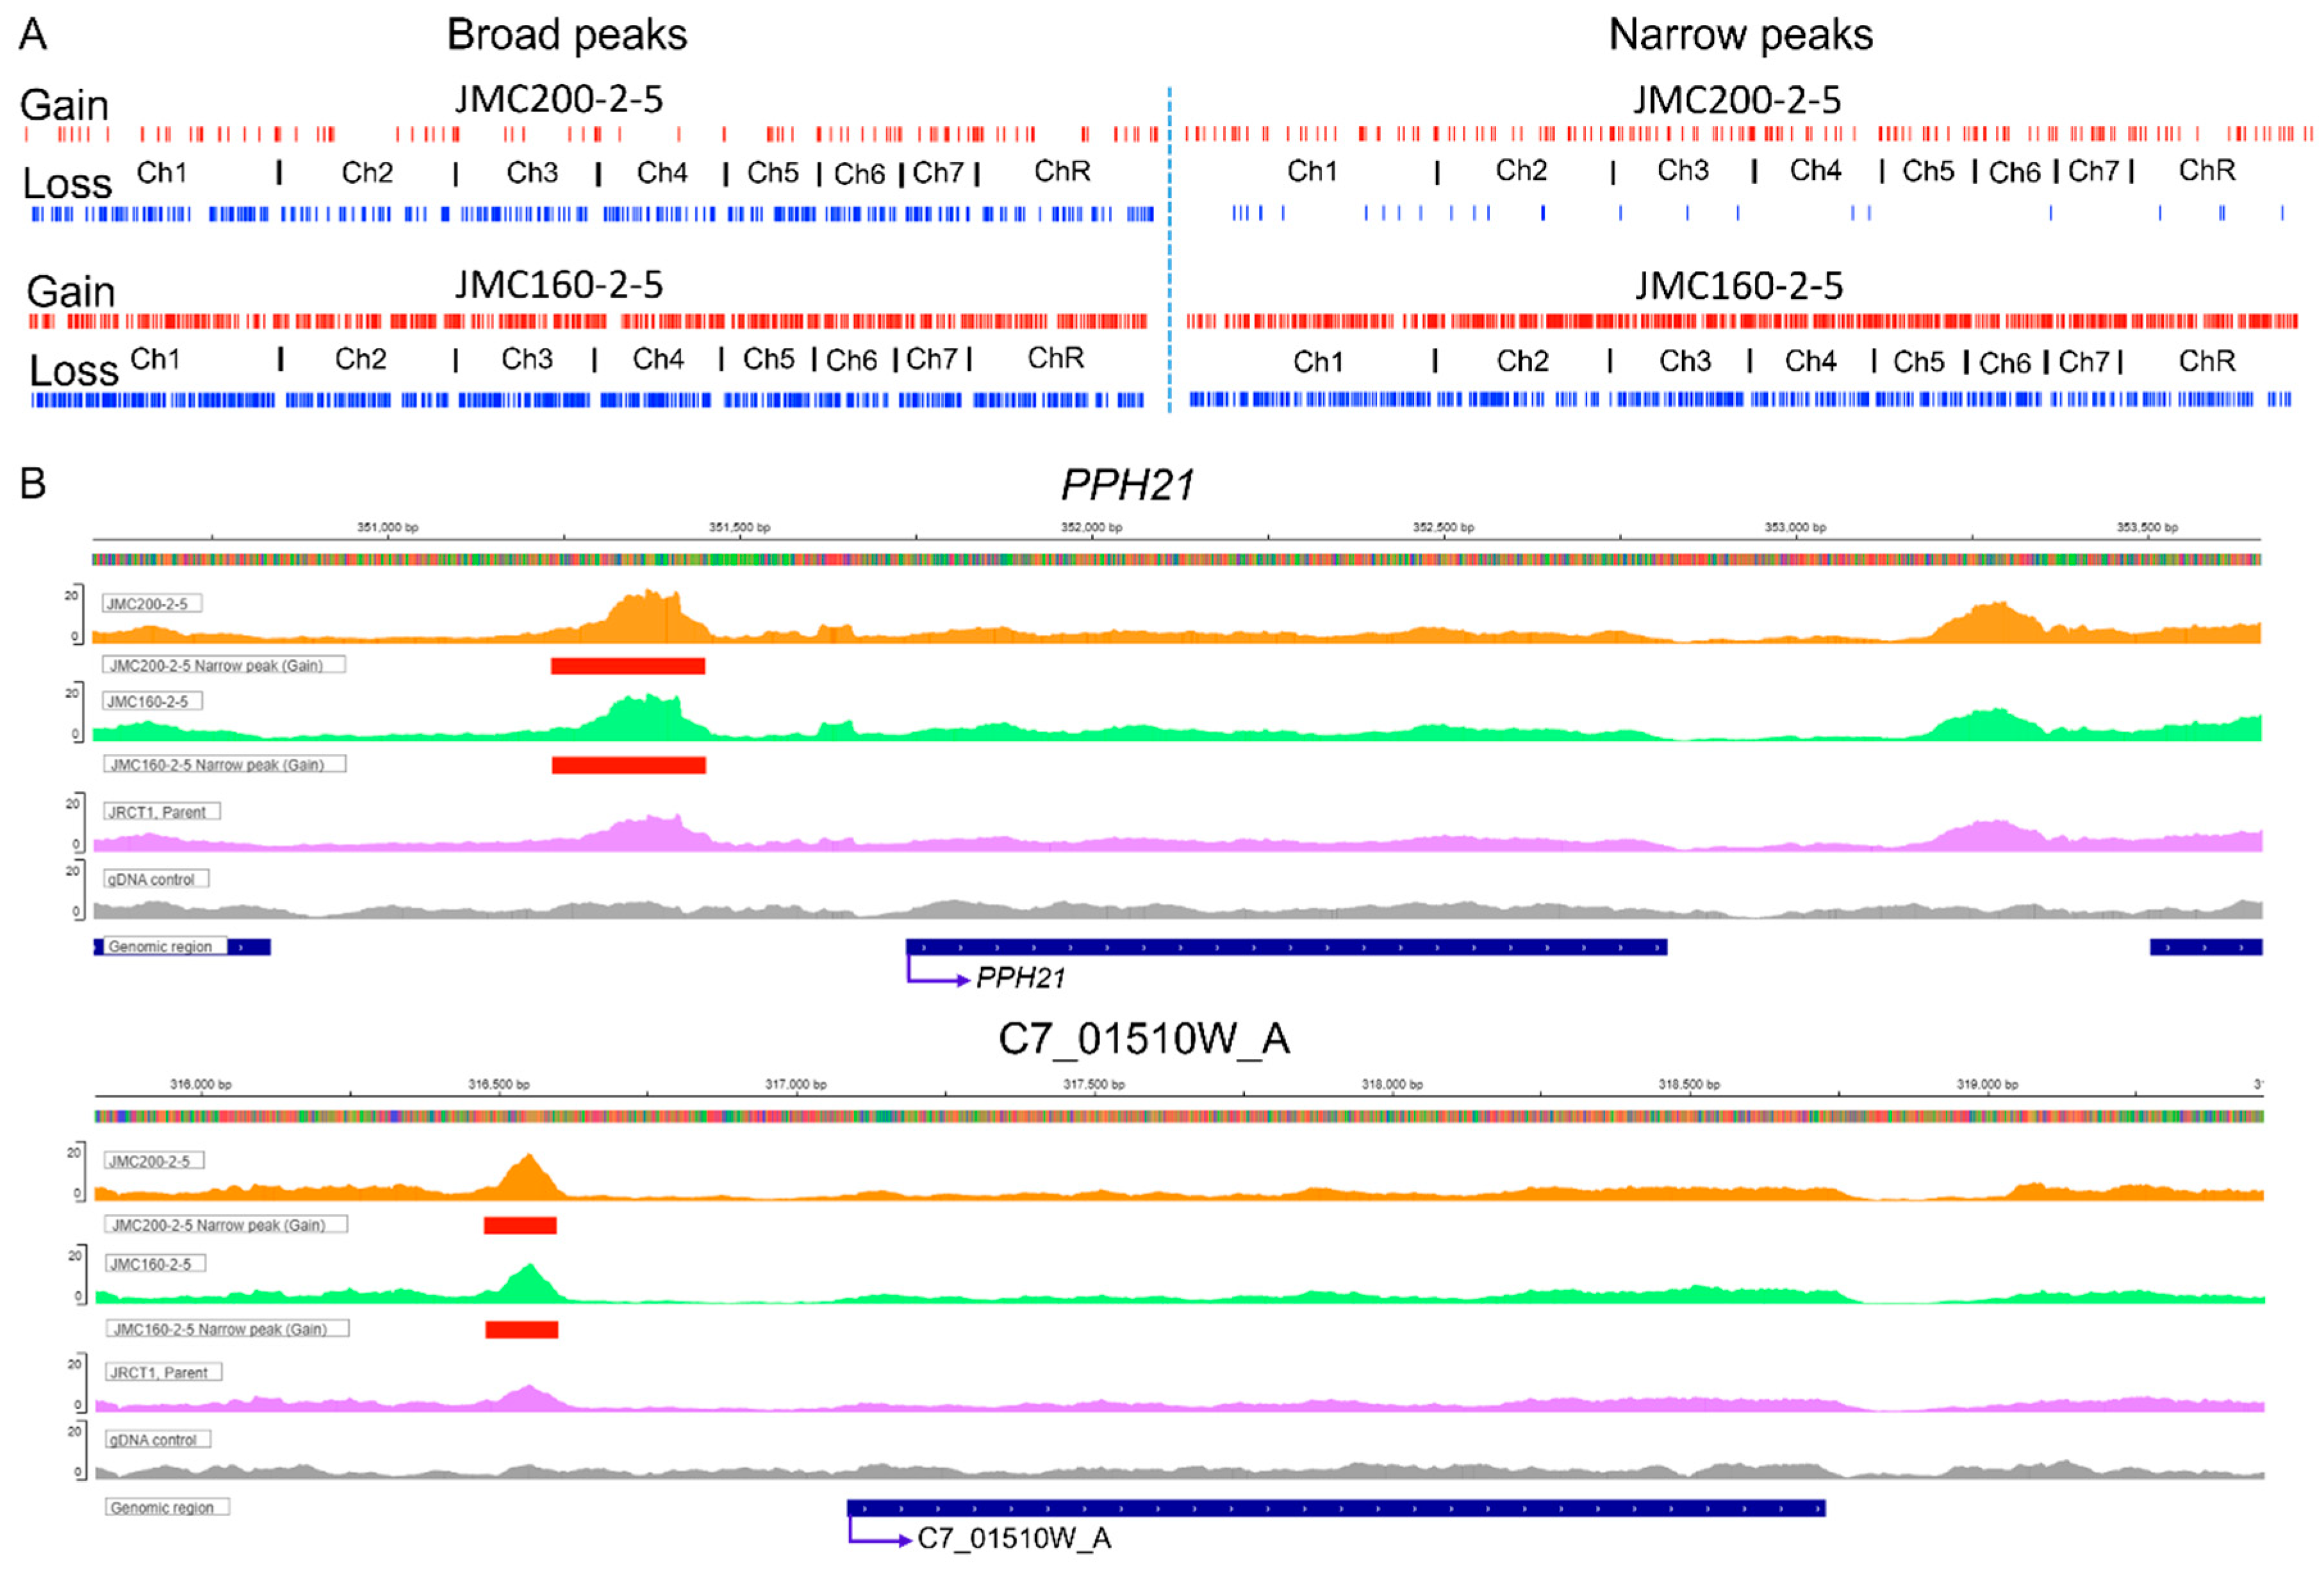
Figure 2.
Volcano plots of Narrow and Broad ATAC-seq peaks in ECN-adapted mutants JMC200-2-5 and JMC160-2-5 vs parental strain JRCT1, as indicated. The y-axis represents the negative log10 adjusted p-values (false discovery rate, FDR). The x-axis represents the log2 fold change between parent and mutant. The horizontal dashed line indicates FDR equal to 0.05. Each dot represents a peak annotated to the nearest gene. Red stands for lost peaks, while green stands for gained peaks. Black dots indicate 16 caspofungin responsive and cell wall build genes. Images were generated using GraphPad Prism version 9.5.0 for Windows.
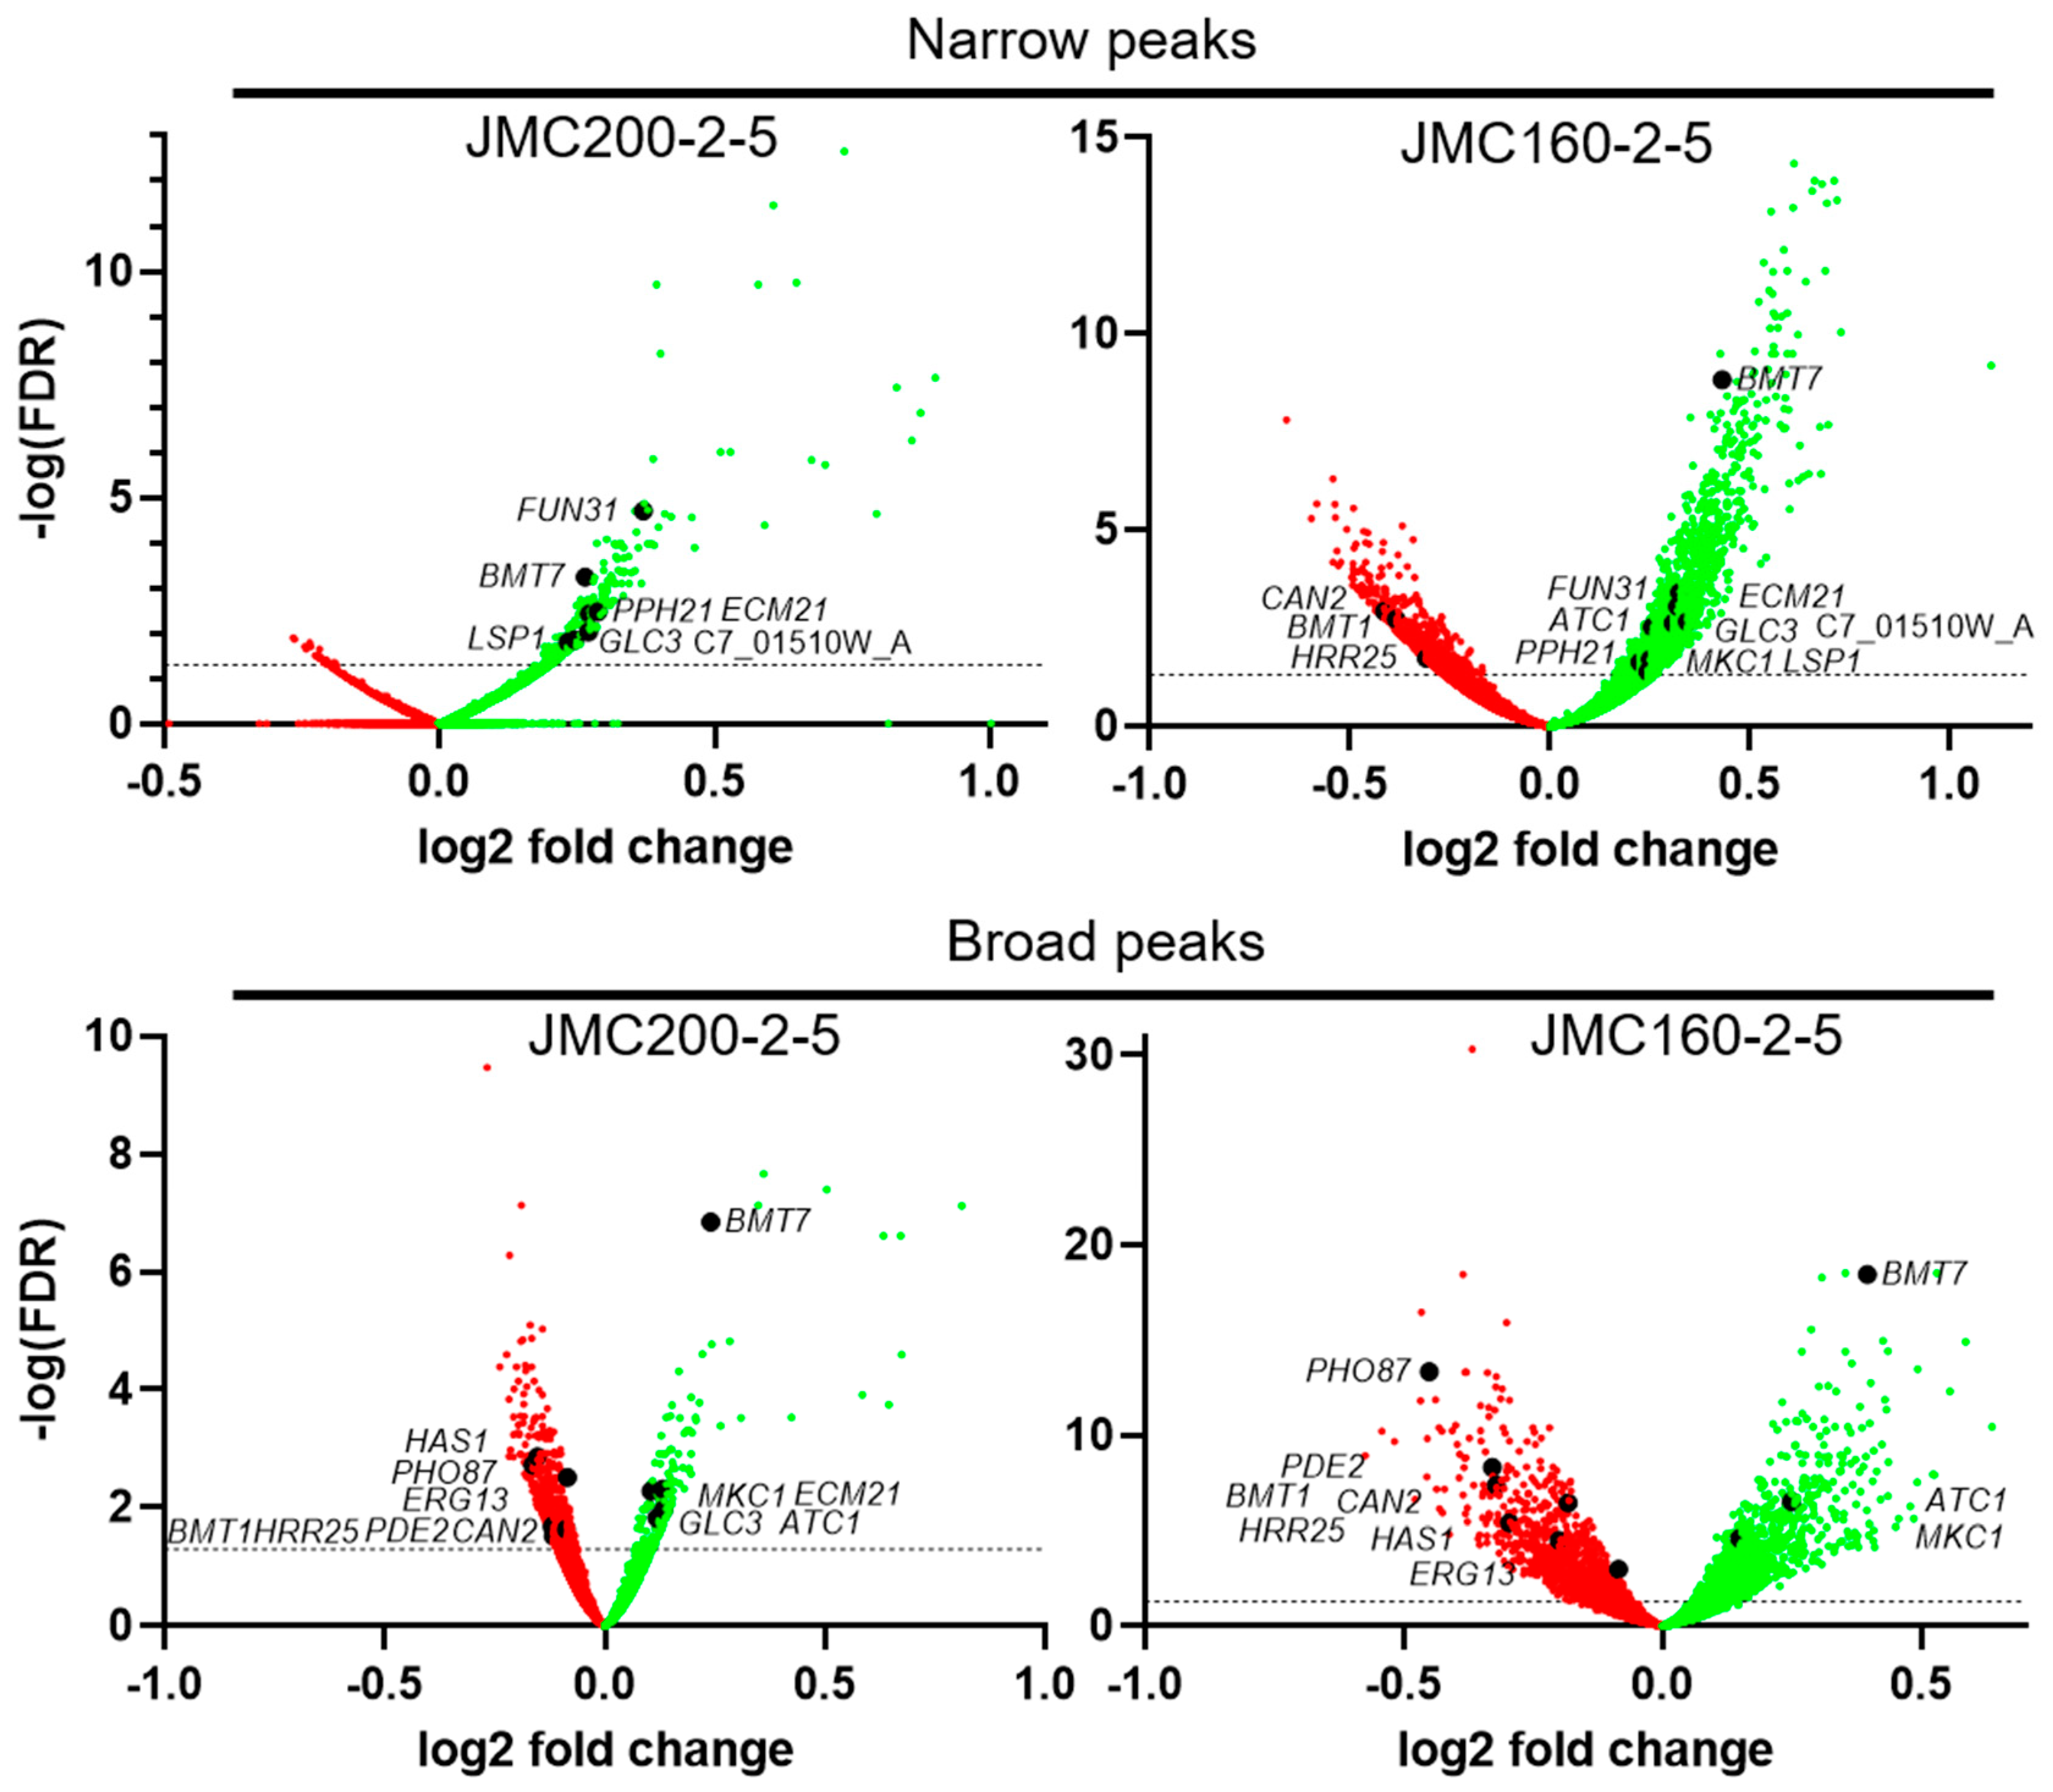
Figure 3.
Pie chart showing distribution of significant ATAC-seq peaks over different genomic regions according to program ChIPSeeker (see Materials and Methods).
Figure 3.
Pie chart showing distribution of significant ATAC-seq peaks over different genomic regions according to program ChIPSeeker (see Materials and Methods).
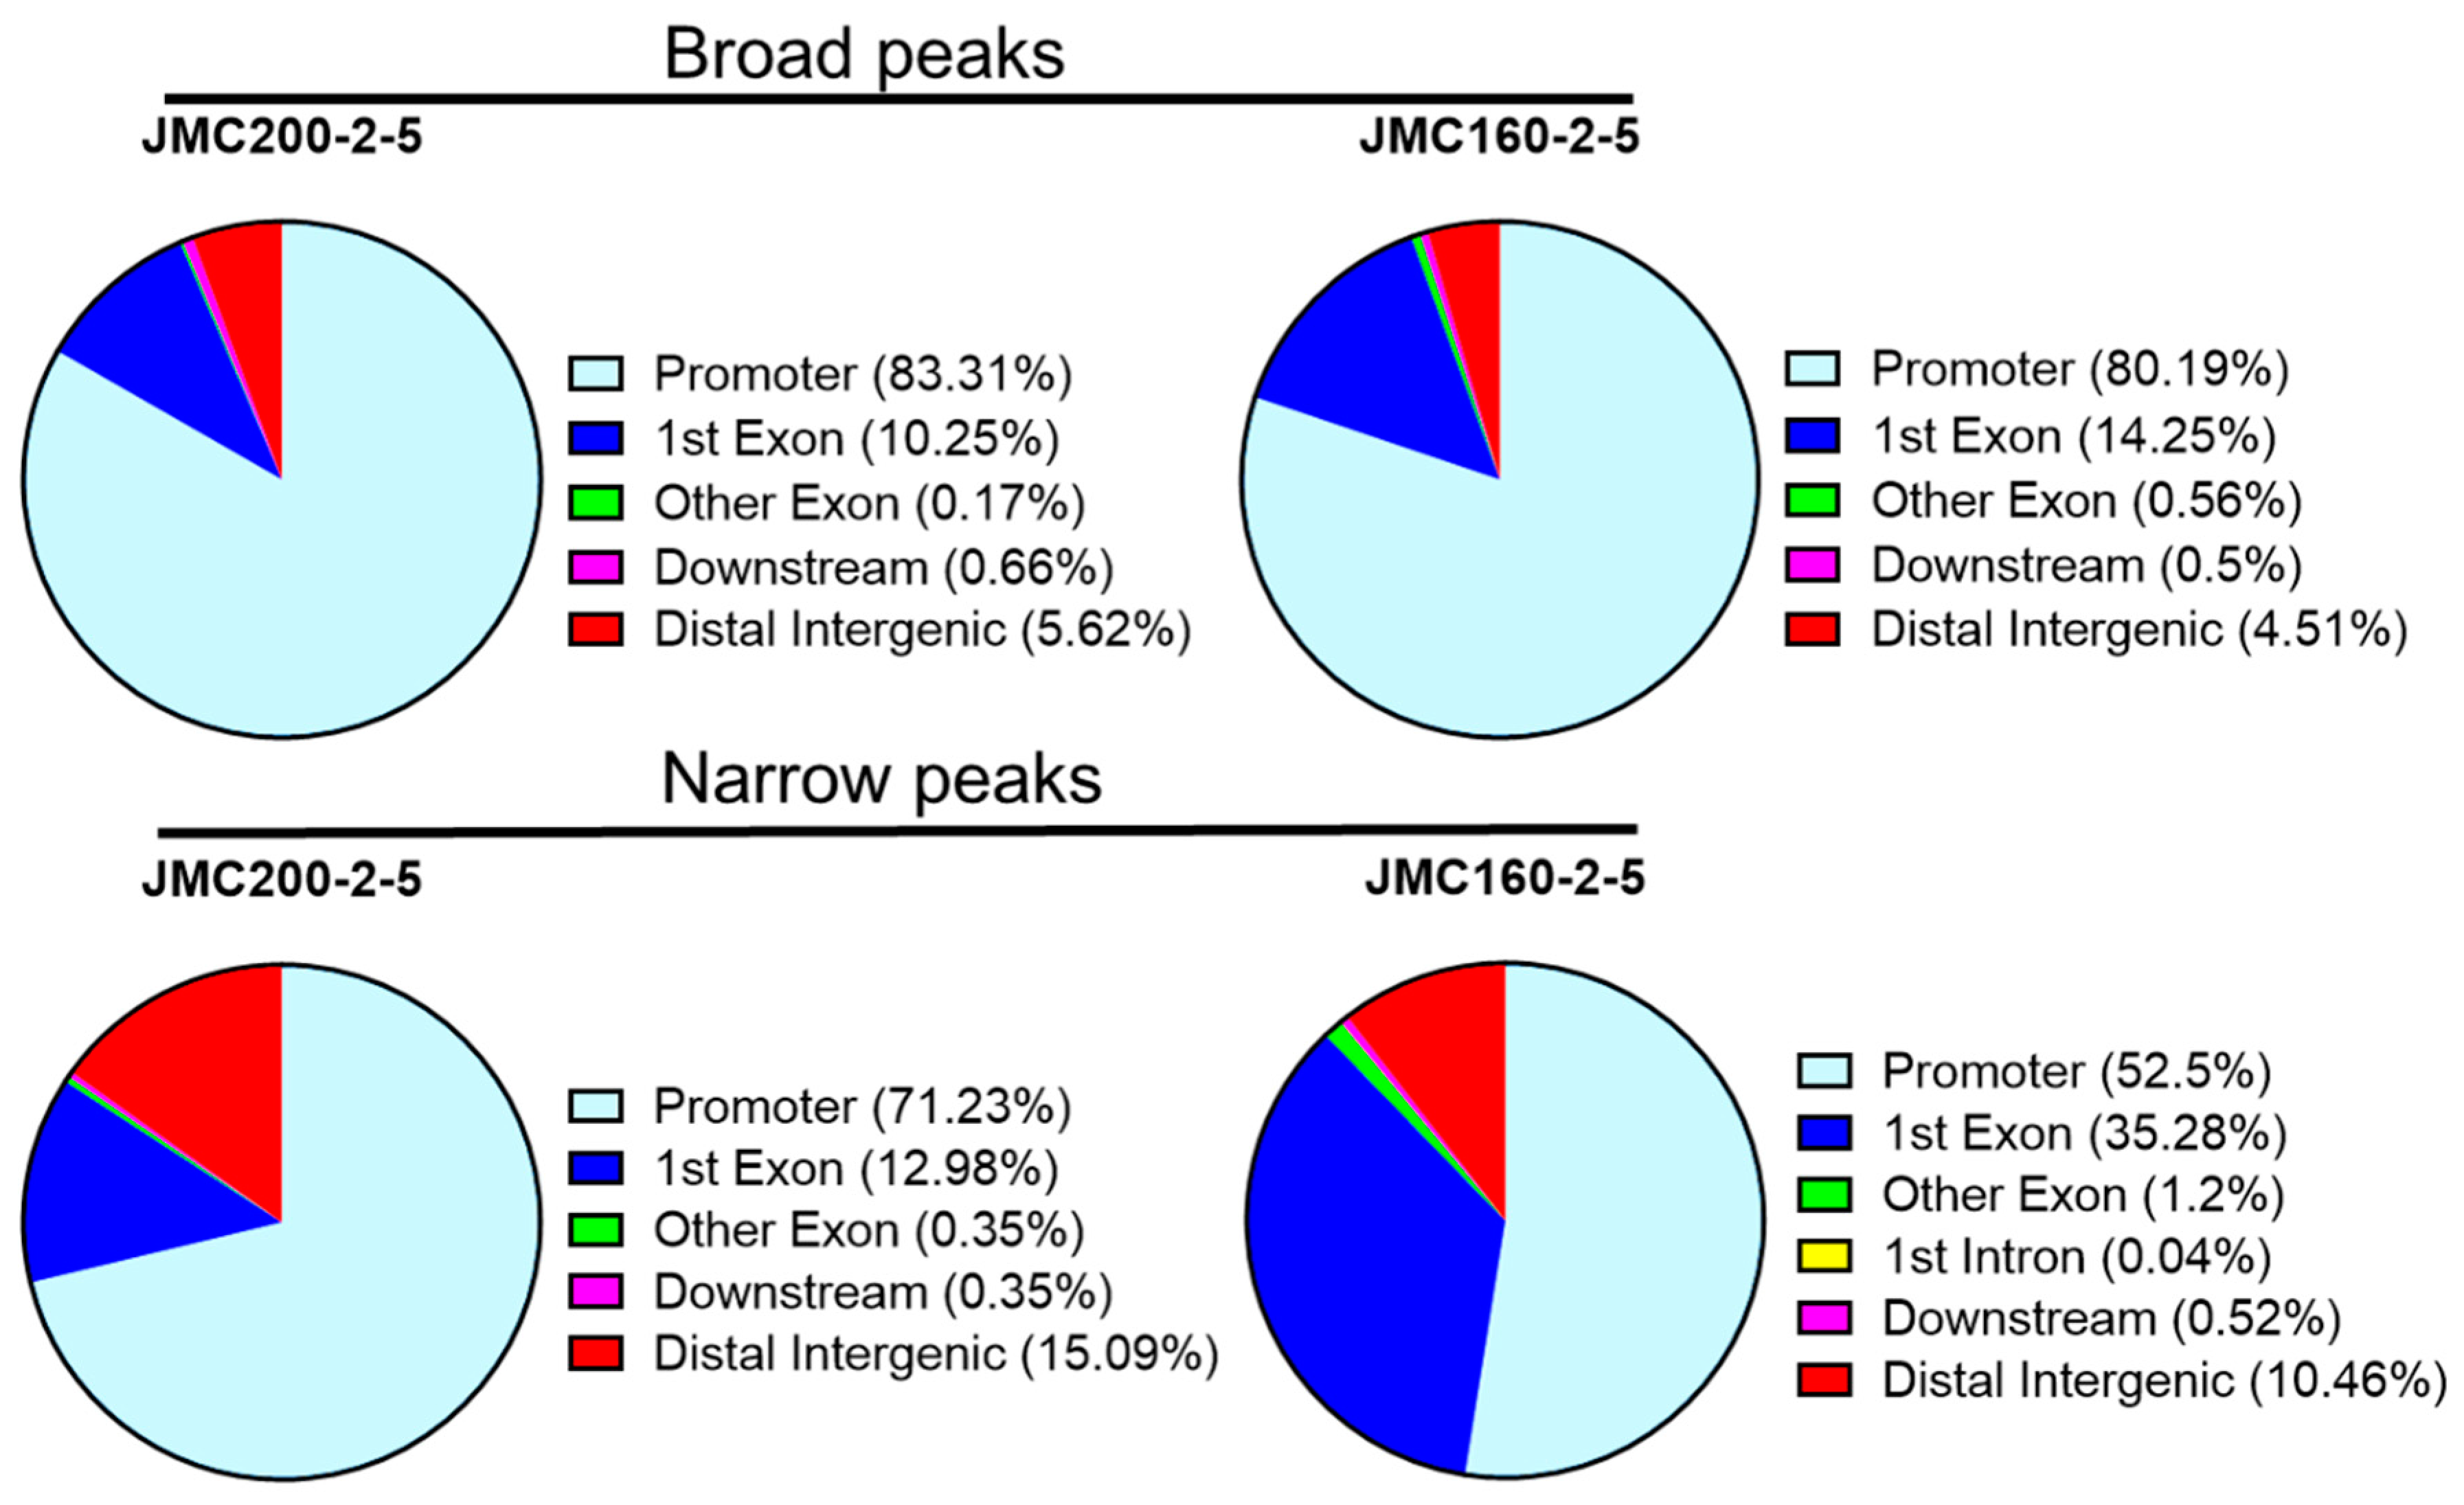
Figure 4.
Characteristics of ATAC-seq peaks that are found in all promoter regions of ECN-adapted mutants JMC200-2-5 and JMC160-2-5 vs parental strain JRCT1. A. Heat maps of all peaks according to program deepTools (see Materials and Methods) within the range of -1000/+200 bp relative to TSS. Shown are gain (red) and loss (blue) of peaks that are clustered according to K-means clustering of differential ATAC-seq nucleosome-free read coverage (log2-fold change). Note that ATAC-seq reads are split into clusters 1, 2, 3 and 4 of which the top cluster is enriched with gain of peaks. B. Average plot of each cluster of both mutants.
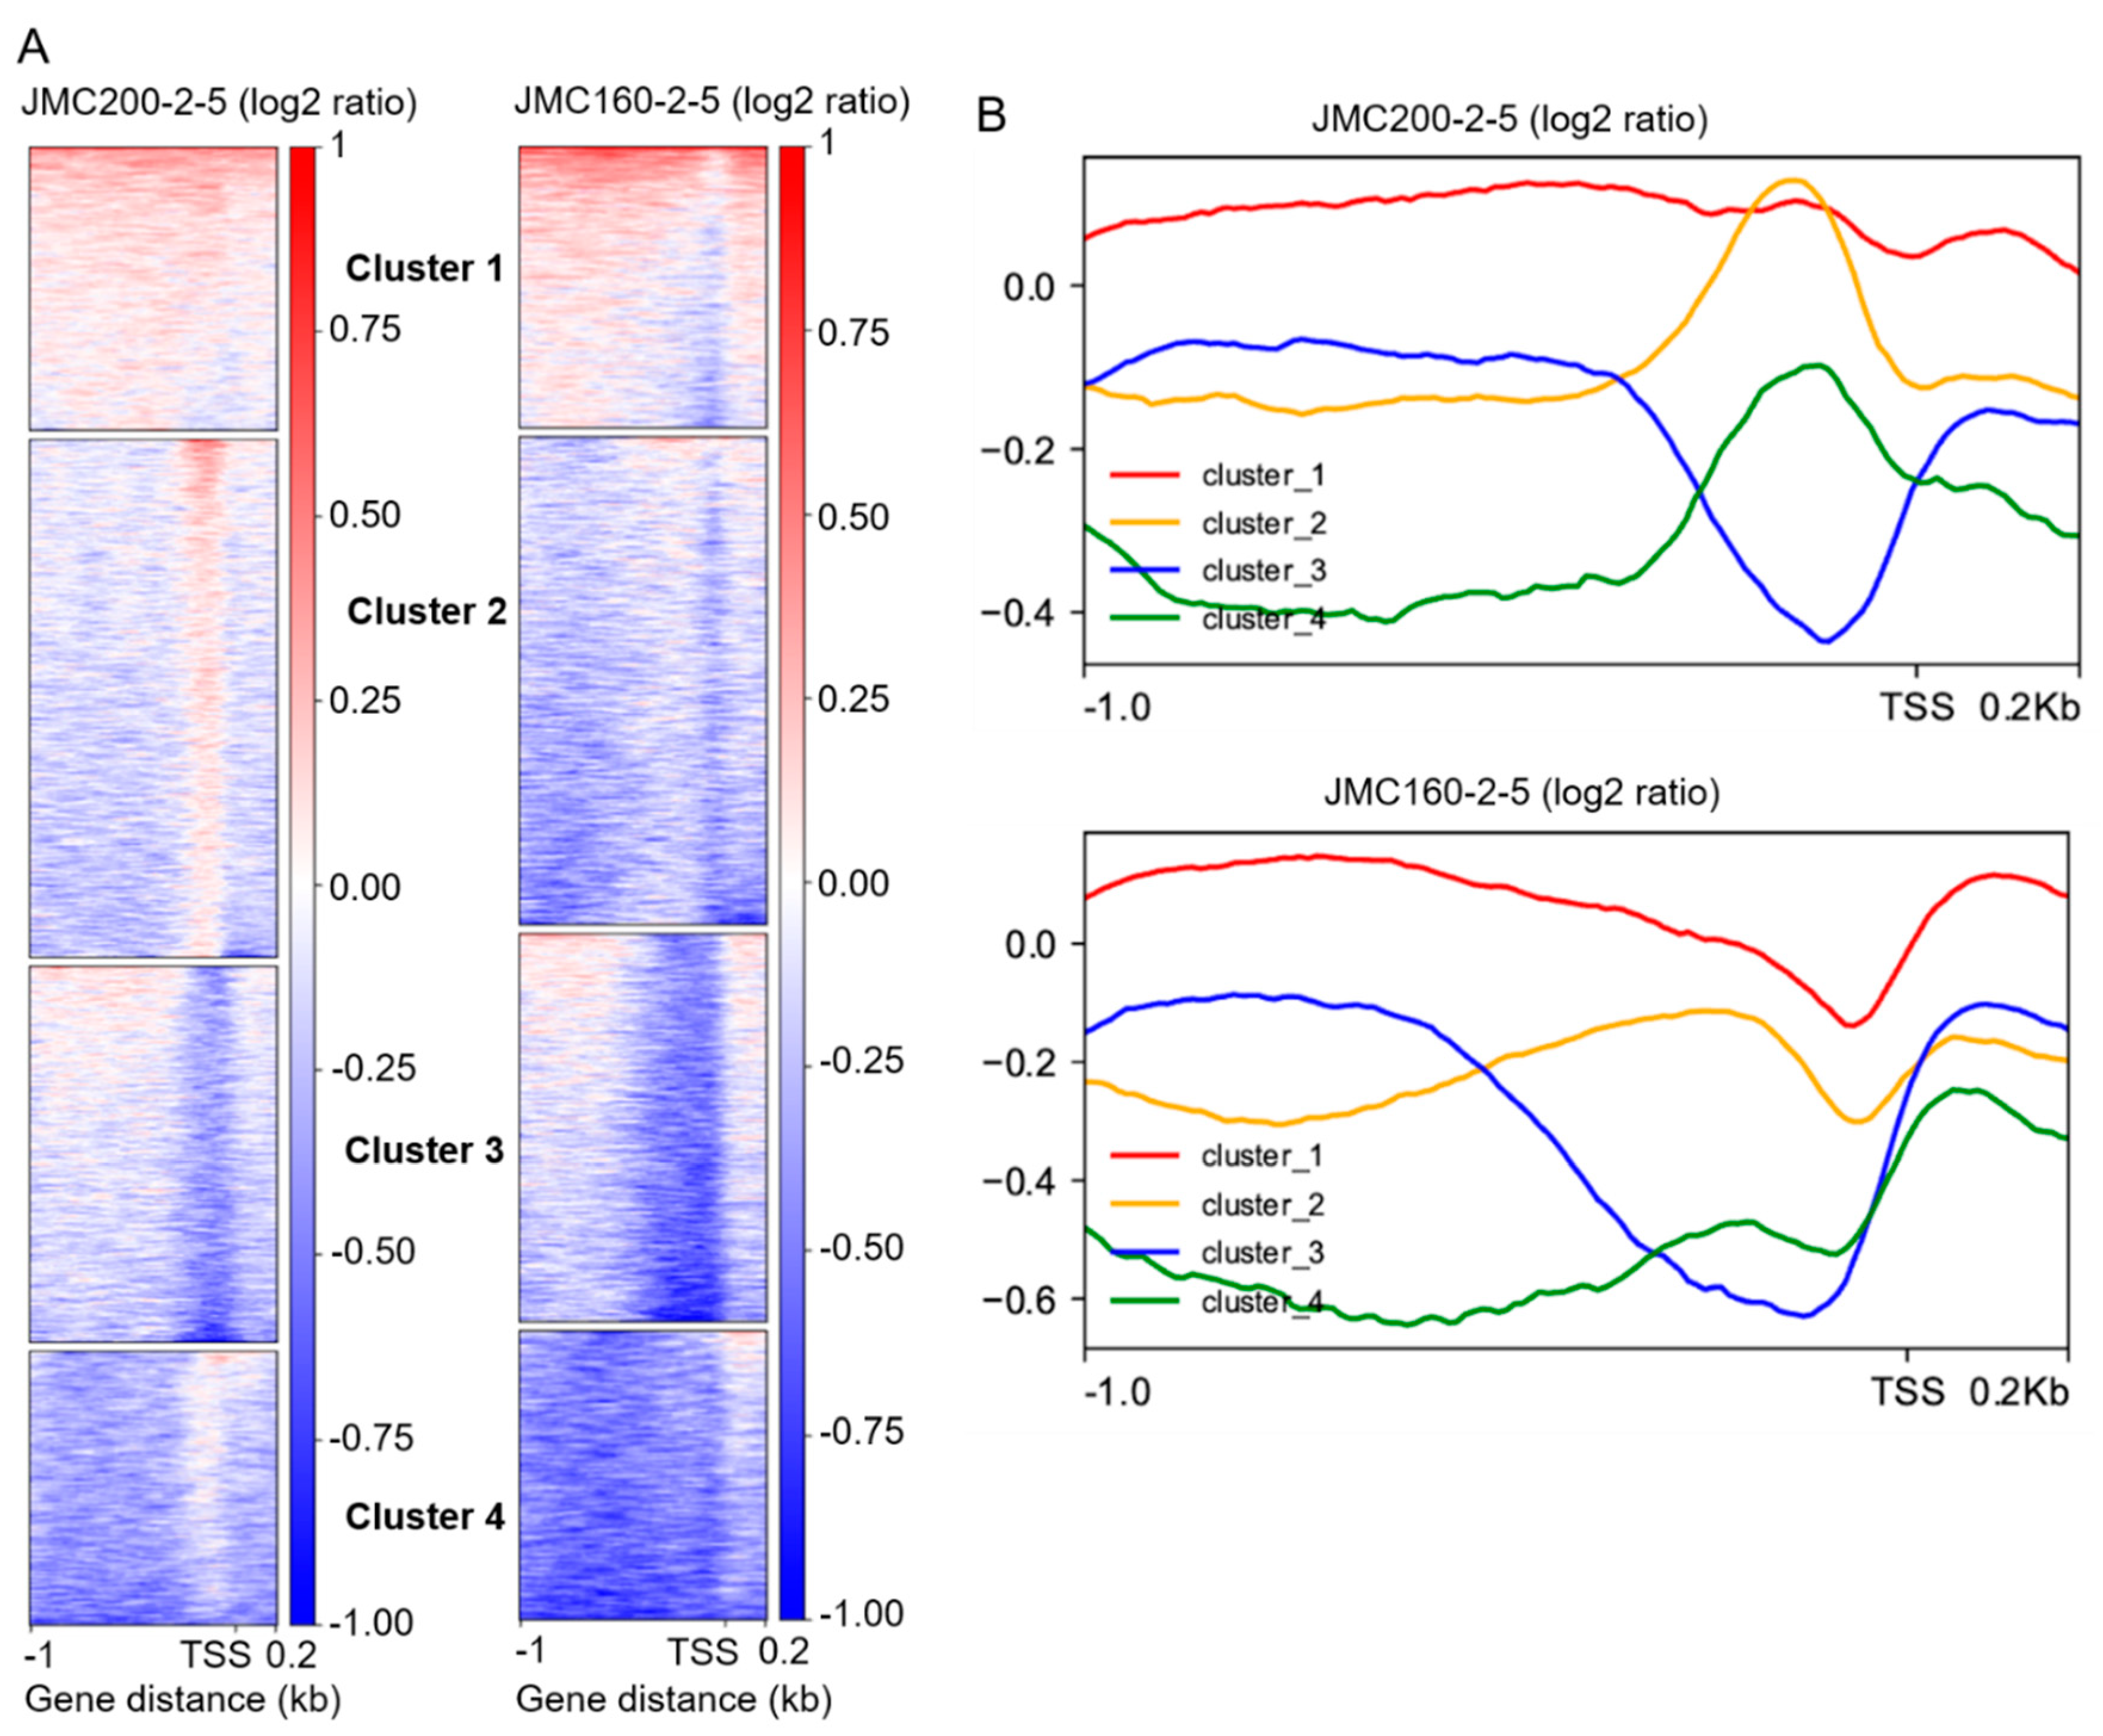
Figure 5.
Mutants JMC200-2-5 and JMC160-2-5 share 116 DEGs having 122 ATAC-seq peaks. Shown are Venn diagrams for a total of 629 shared peaks between two mutants (A) and 122 shared peaks that correspond to 116 shared DEGs (B). In B, intersection areas of diagrams present numbers of shared genes that have peaks. See also Table S15–S18 for 116 DEGs having 122 ATAC-seq peaks.
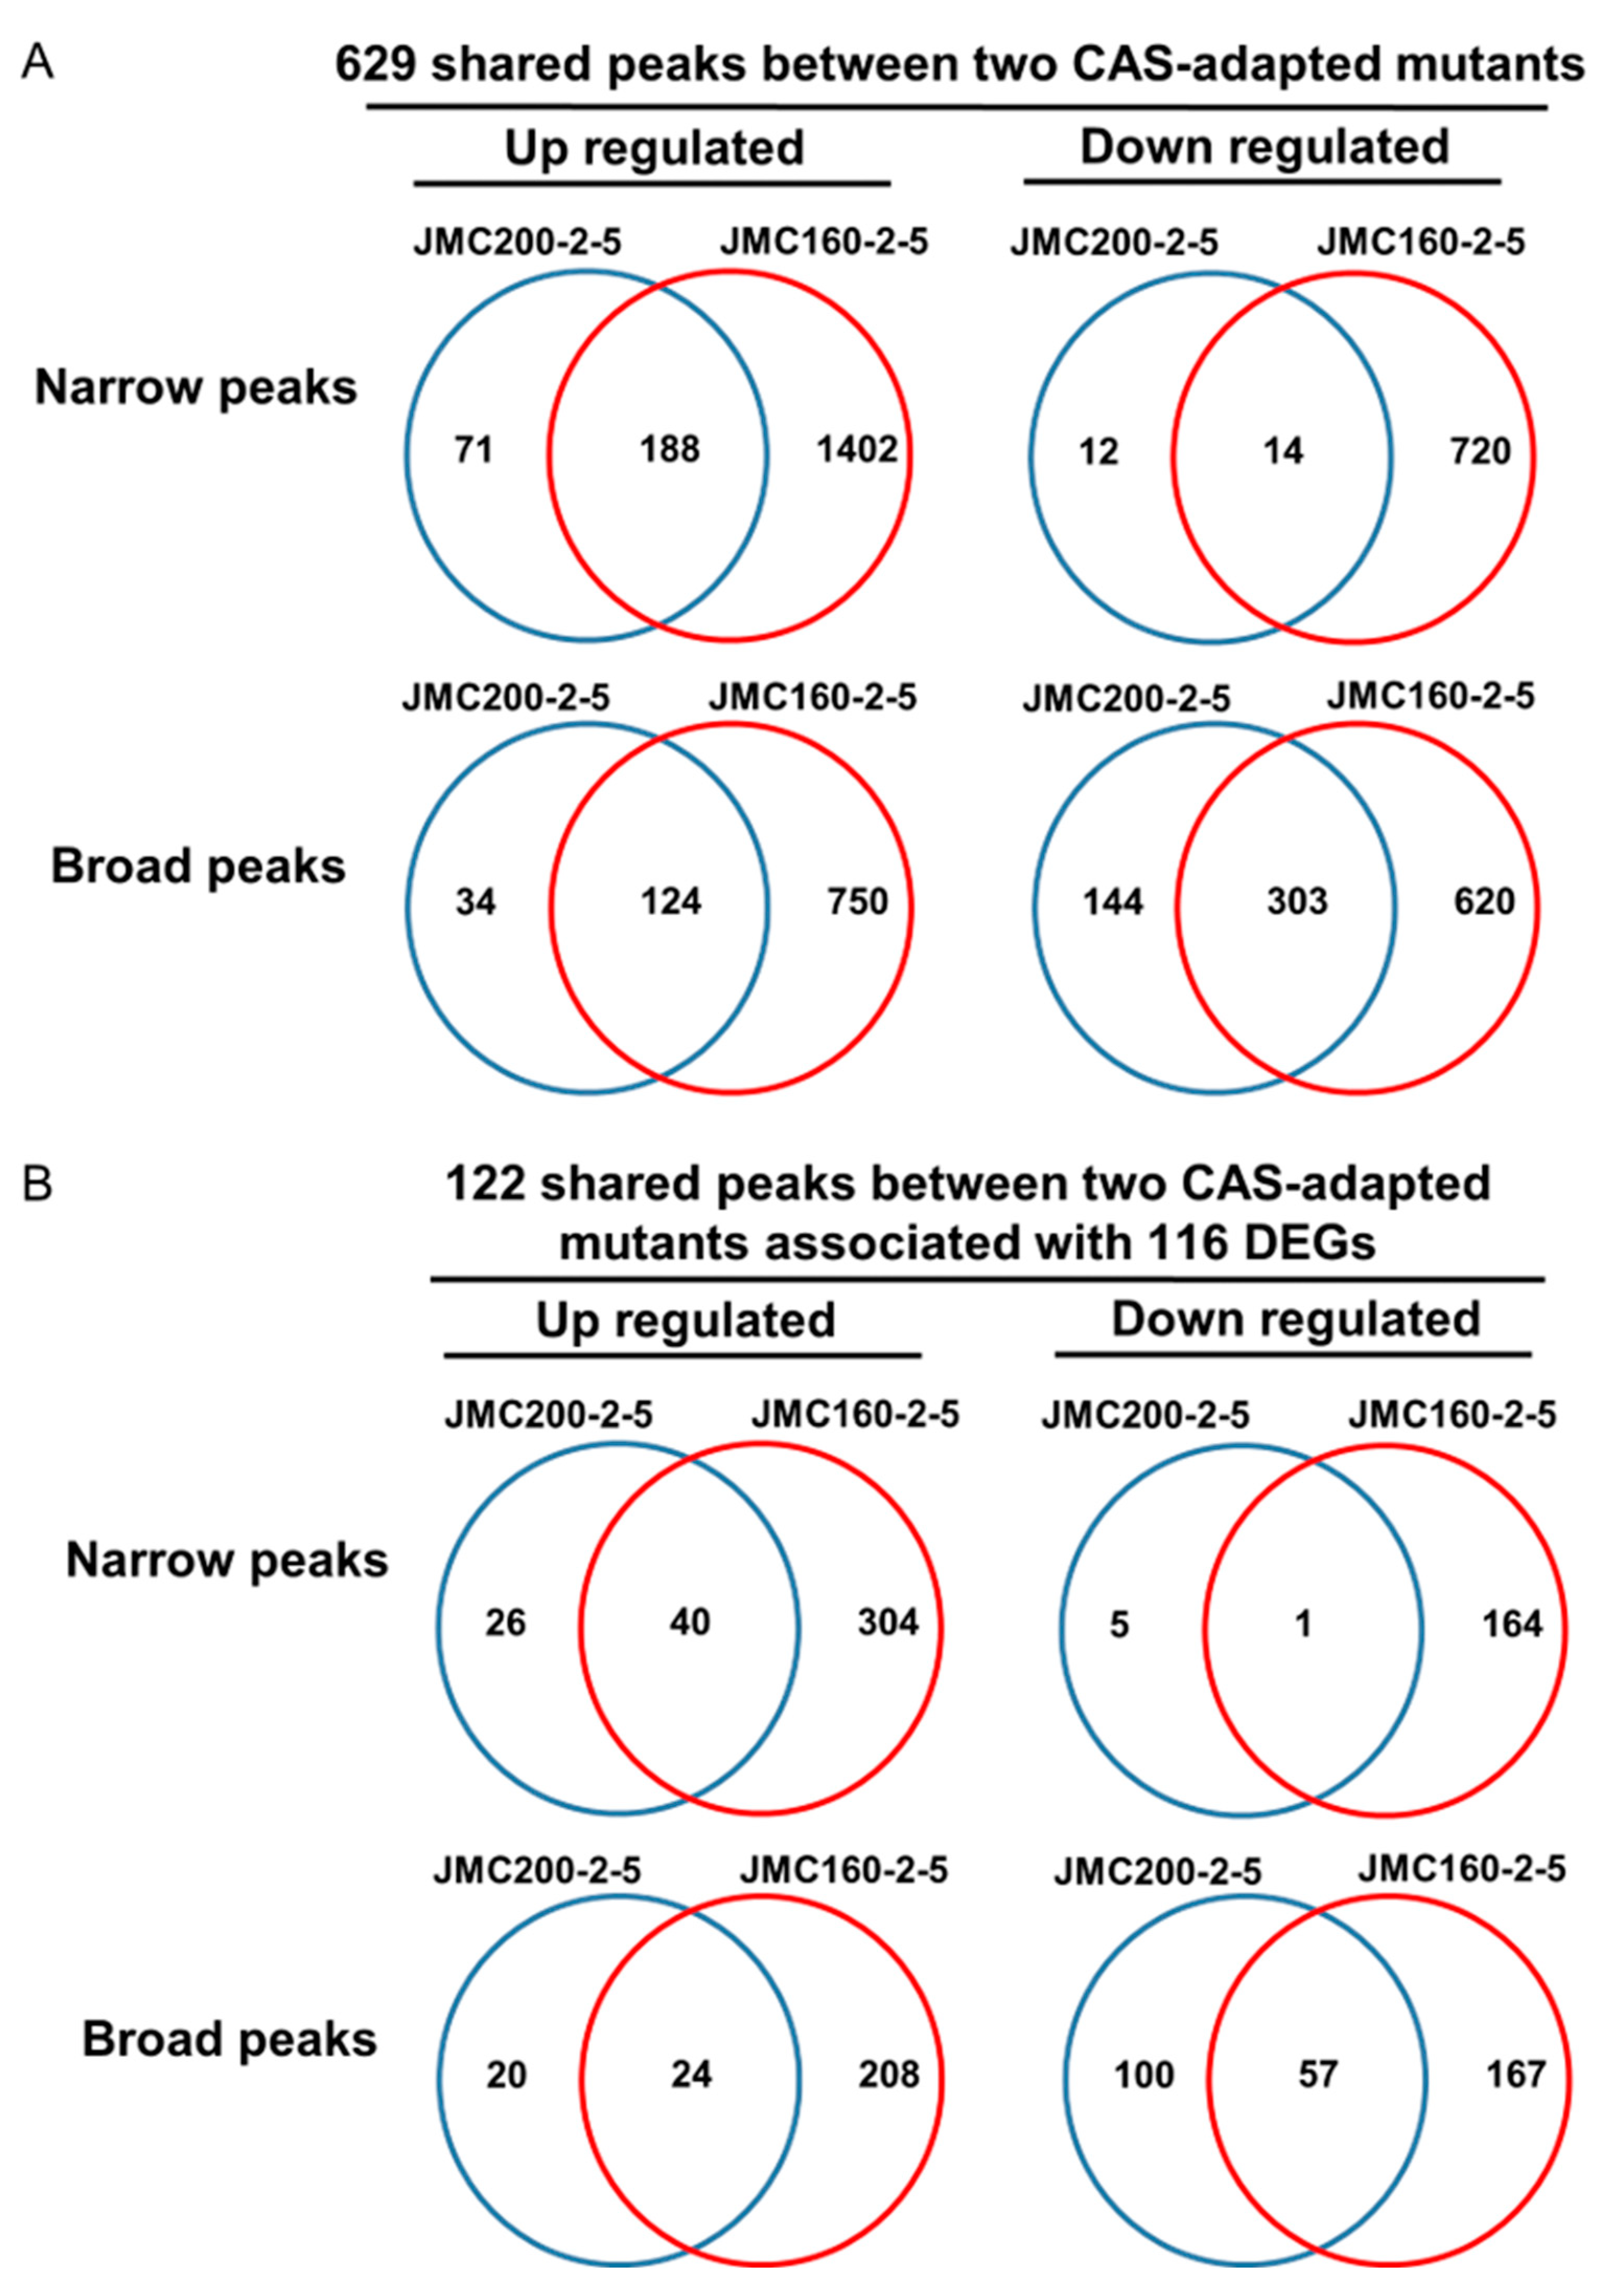
Figure 6.
(A) Pie charts depict the distribution of 122 ATAC-seq peaks that are found in 116 DEGs common between CAS-adapted mutants JMC200-2-5 and JMC160-2-5. (B) Distribution of peaks corresponds to 16 DEGs involve in caspofungin and cell wall remodeling. Note that peaks are found in each DEG, as presented in Table S15–S18. Some DEGs have multiple peaks. Shown is distribution of Narrow and Broad peaks over five regions: transcription start site (TSS), up to 1kb upstream and downstream of TSS and more than 1 kb up or downstream od TSS. Note substantial difference in distribution between Narrow and Broad peaks. While the majority of Narrow peaks originate at up to 1kb upstream of TSS, the majority of Broad peaks originate at TSS.
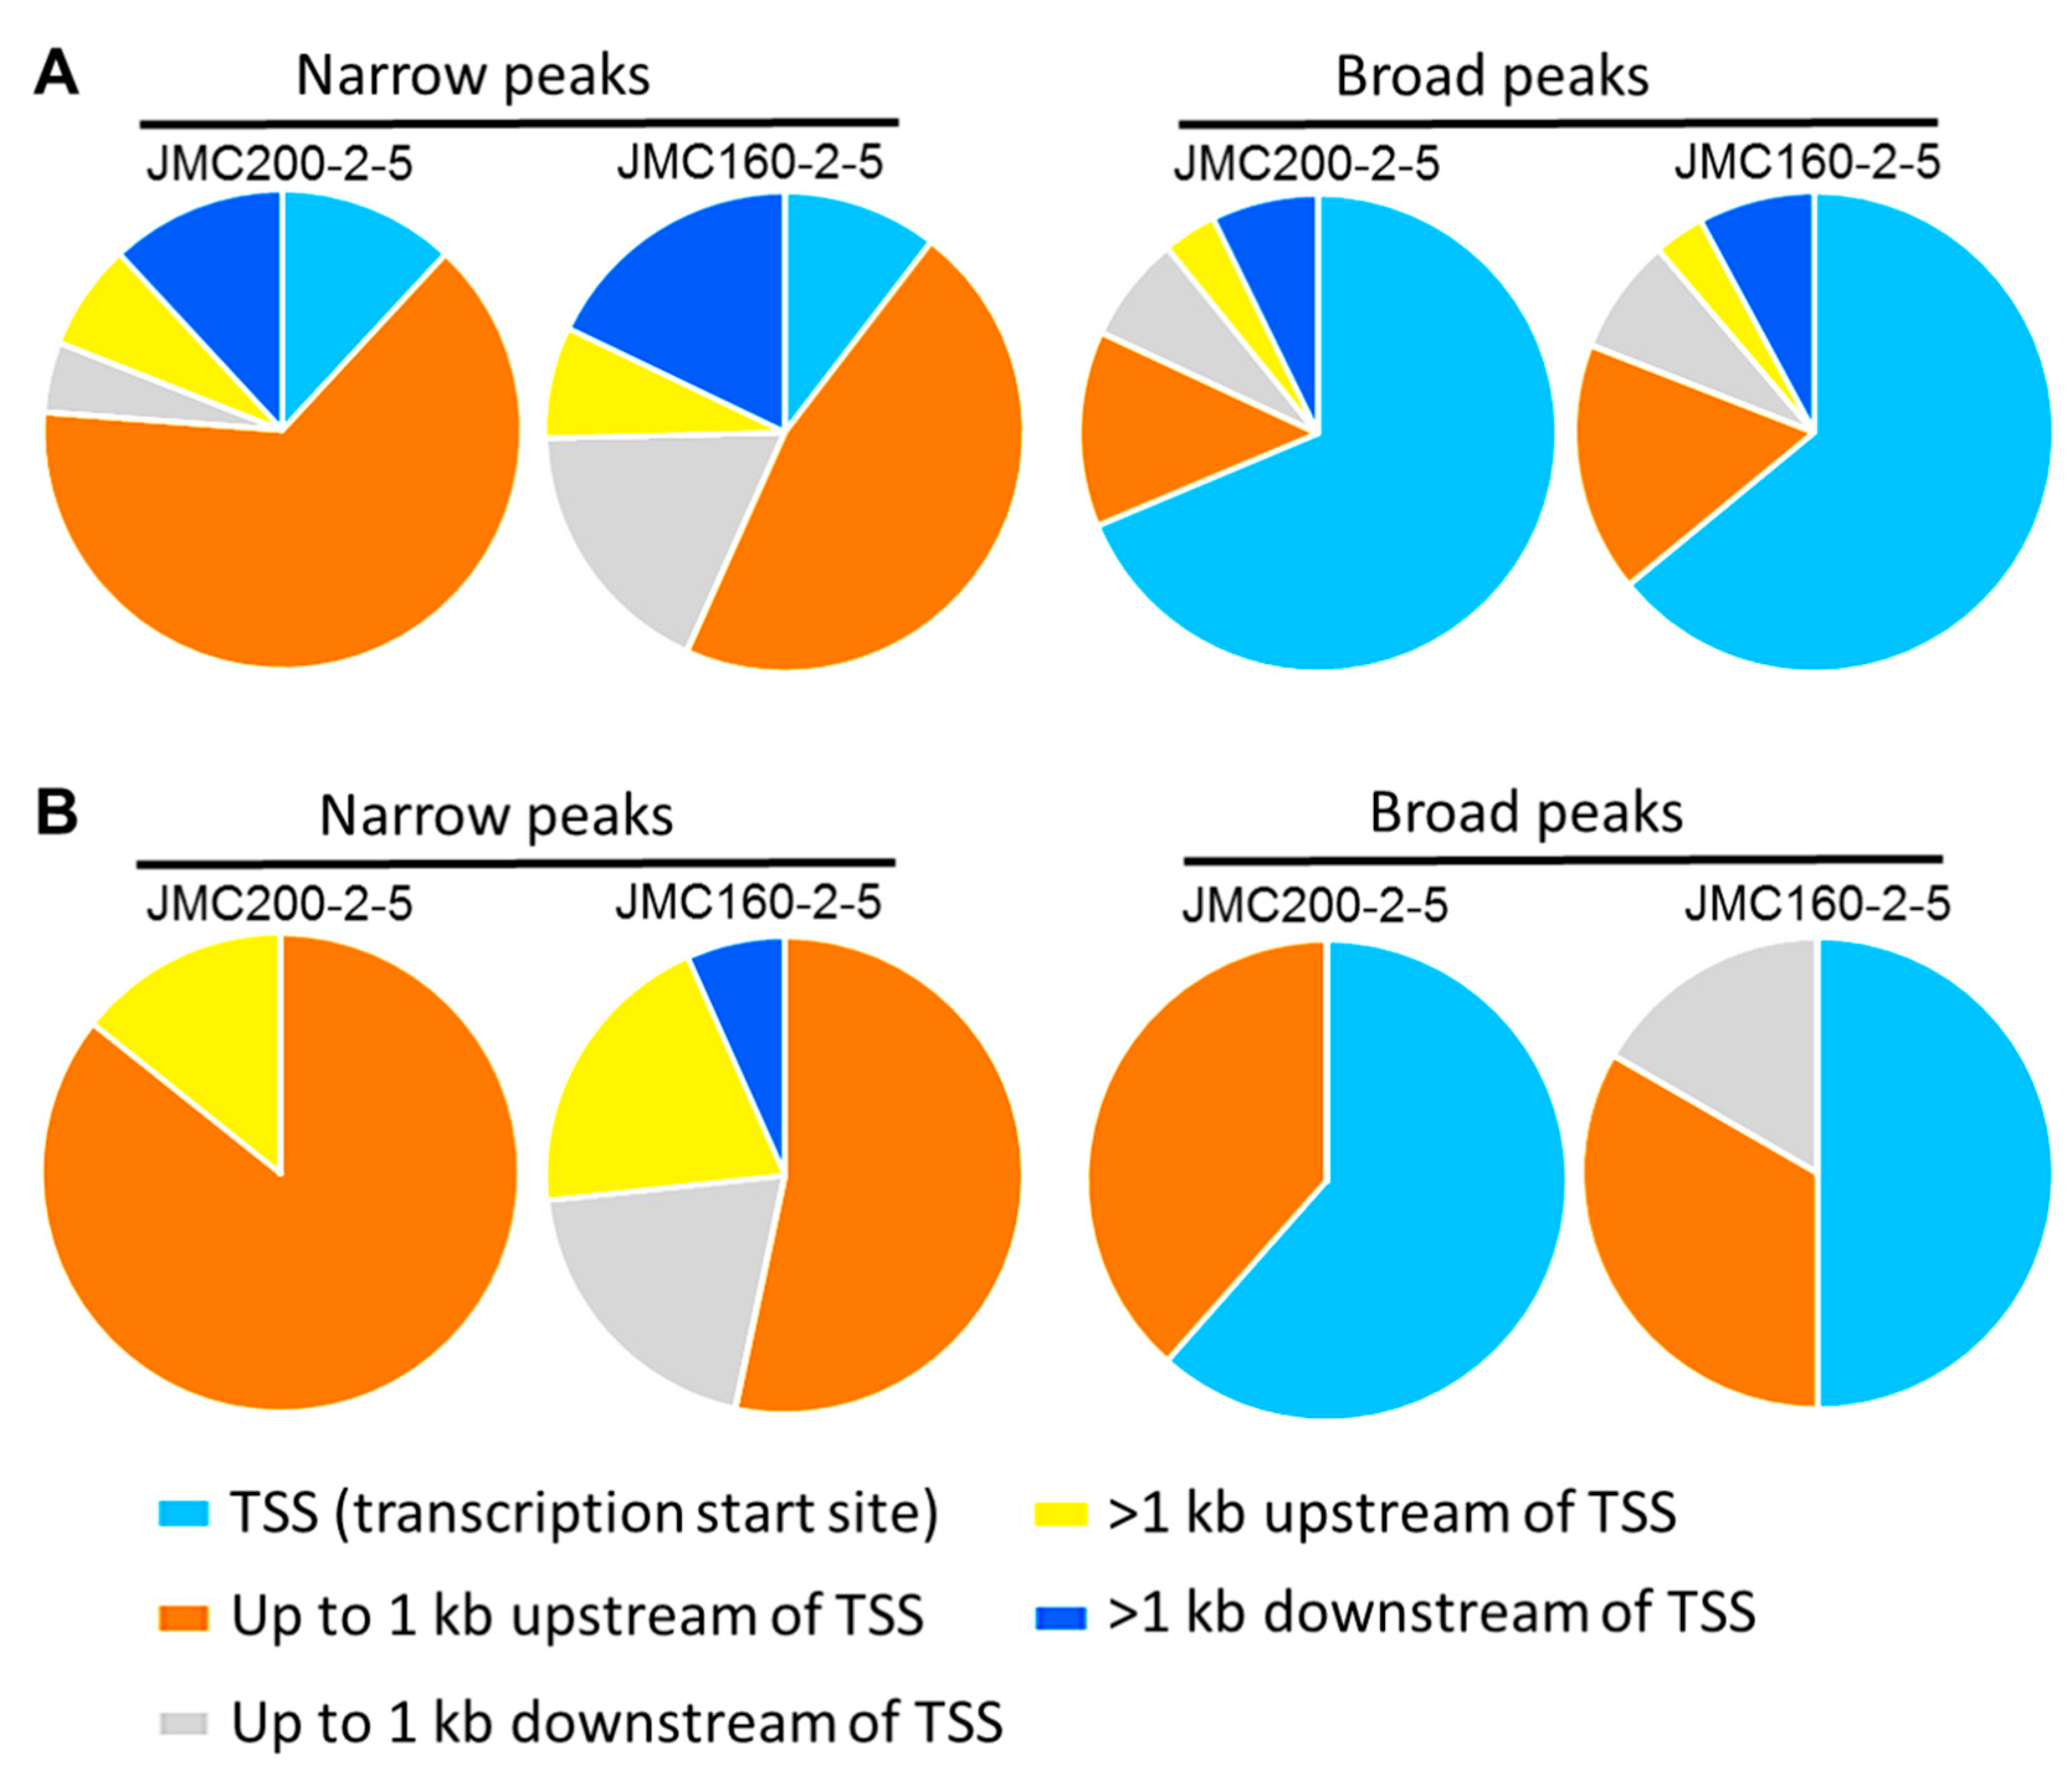
Figure 7.
Logos of position weight matrices showing motifs binding sites enriched in differentially accessible TF binding regions from narrow peak in JMC200-2-5 and JMC160-2-5. The number of matched target sequence as well as the q-value (Benjamini) is indicated in each motif. Top panel increased accessibility and bottom panel decreased accessibility as indicated.
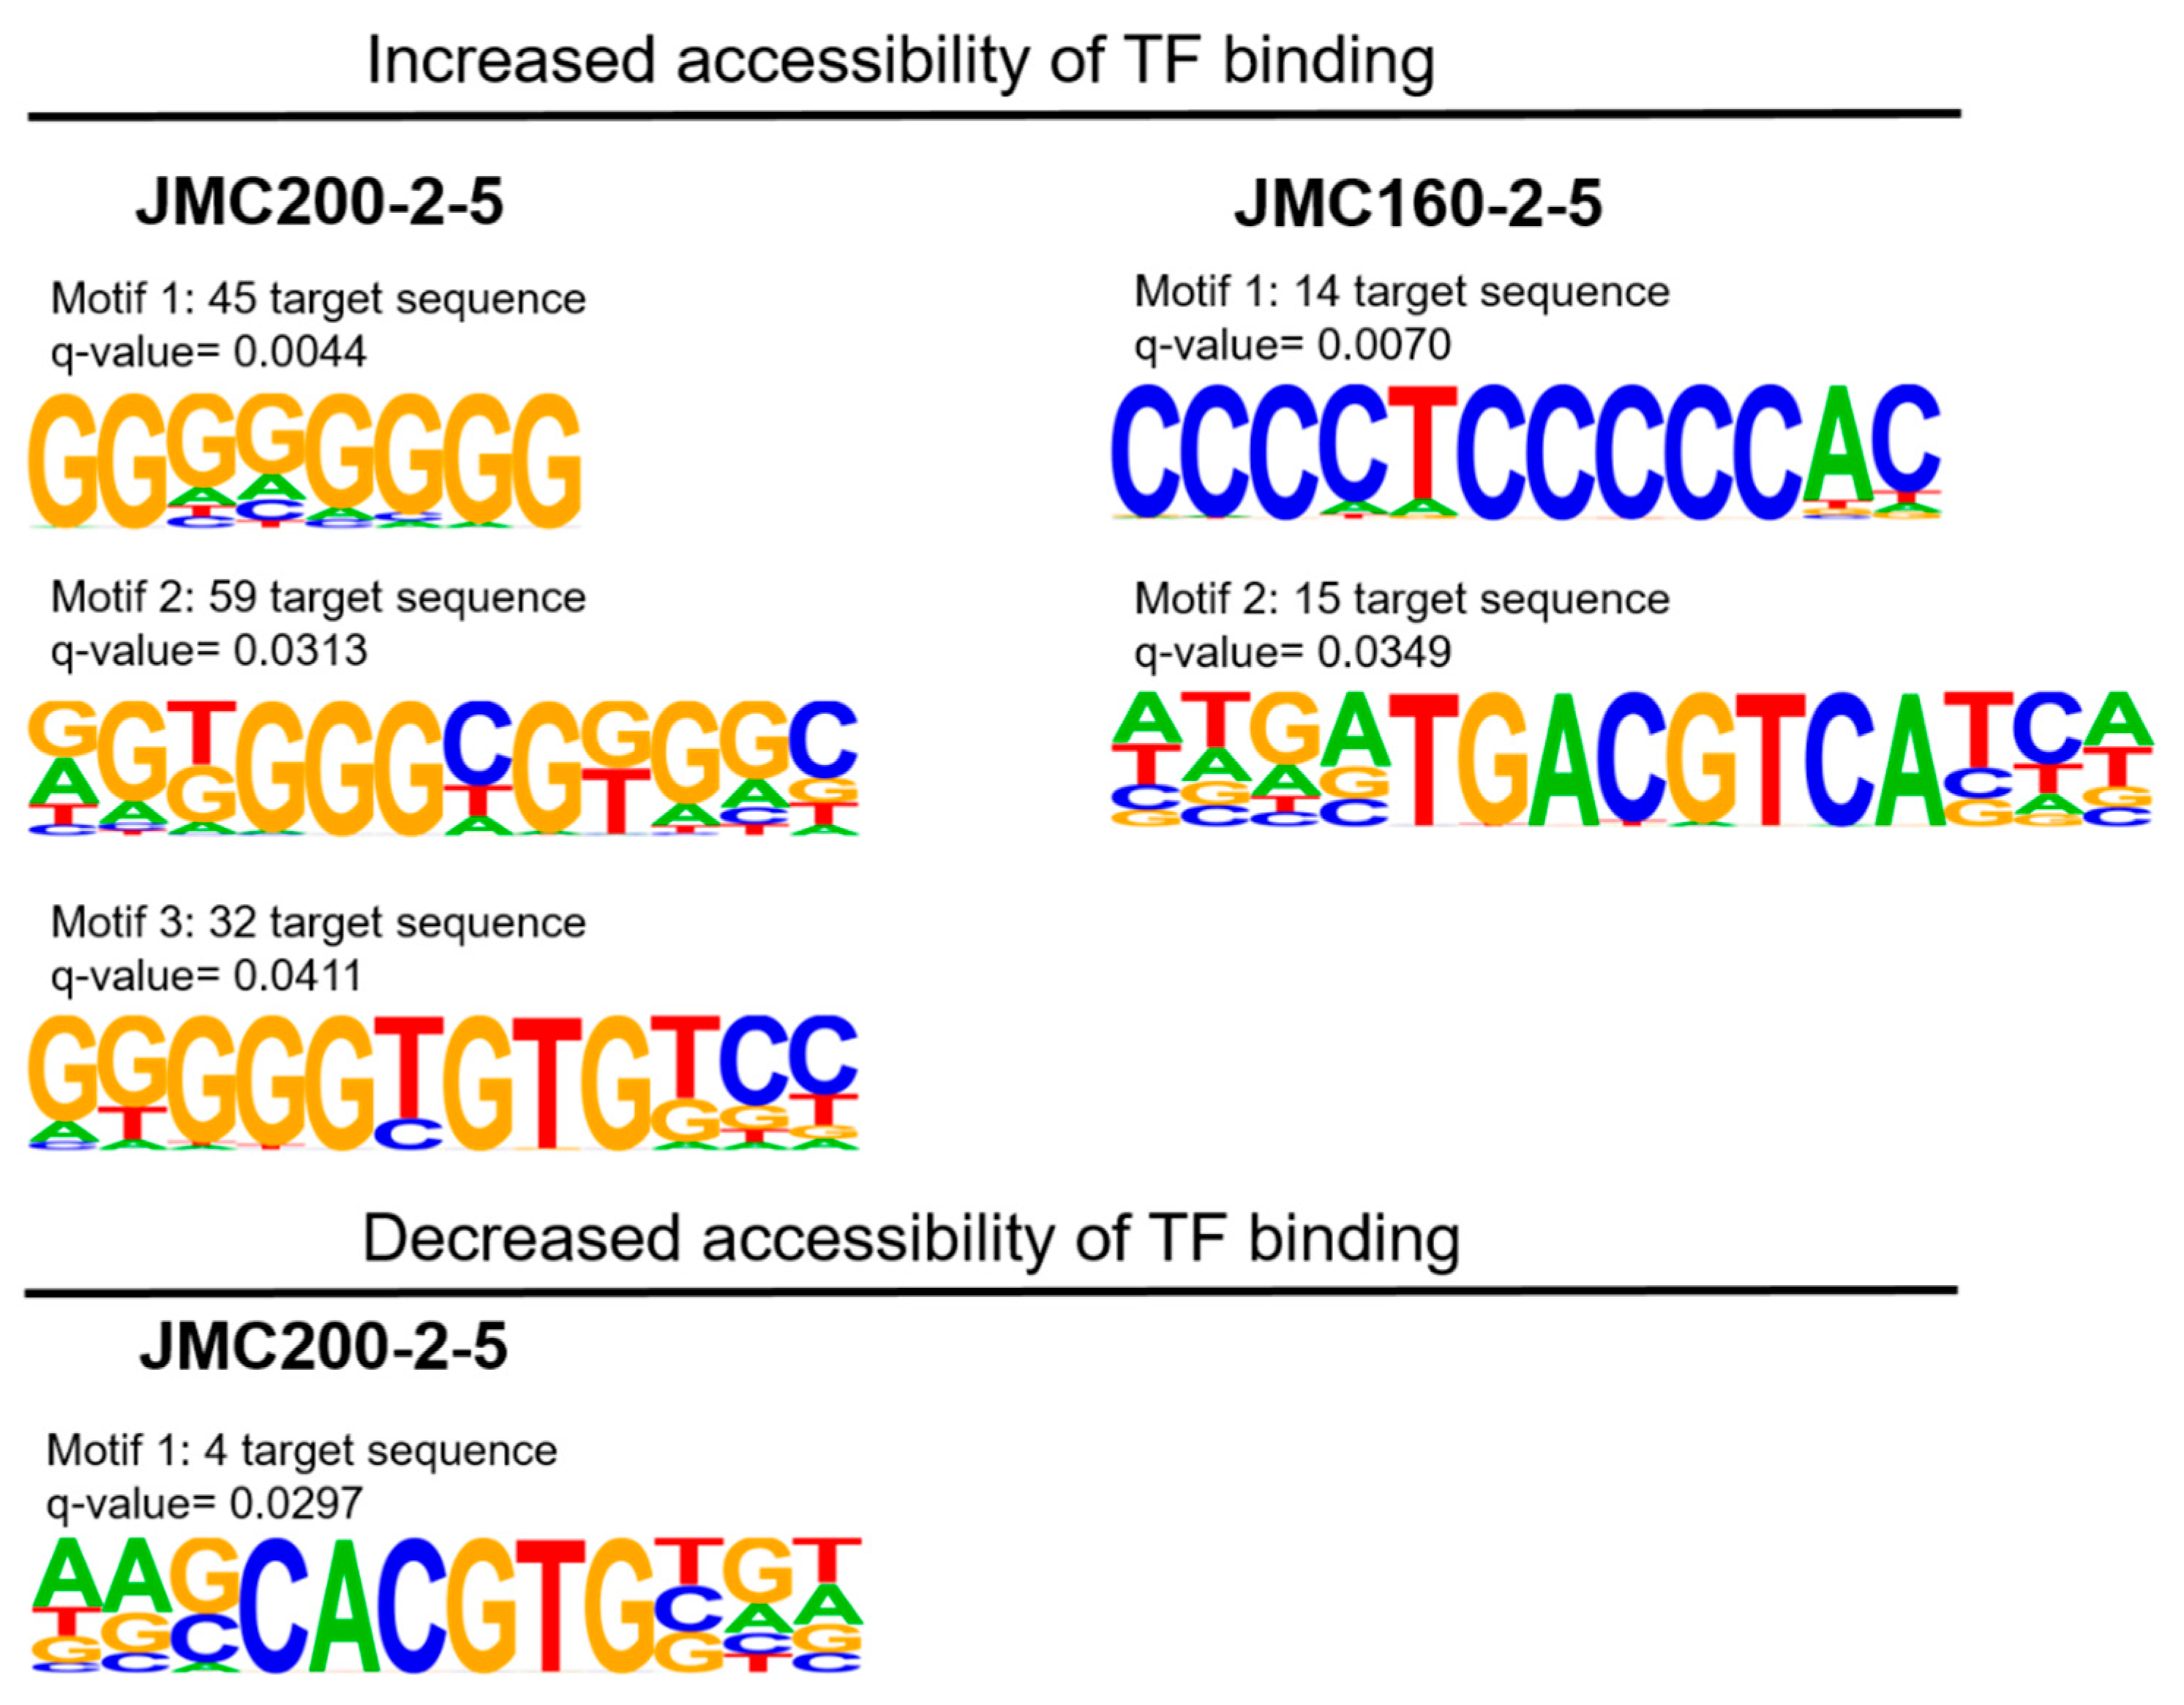
Figure 8.
ECN-adapted mutants have remodeled cell wall. A. Cartoon showing three major components of cell wall: mannan, glucan and chitin. B. Changes of mannan, glucan and chitin amounts of cell wall in ECN-adapted mutants. Measurements were performed with at least two biological replicates, each replicates with two technical replicates. The amount of glucan, mannan, and chitin in parental strain is set as 100%. The asterisks indicate a P value of <0.01 (**), or <0.001 (***), as determined using Student’s t-test. C. Increased glucan surface exposure in ECN-adapted mutants was measured with FACS using hDectin-1a and anti-IgG antibody conjugated with Alexa Fluor 647. Shown is a representative histogram of at least 104 singlet population of caspofungin-adapted mutants in red C channel. JRCT1 UN stands for unstained control. Note that peaks of both mutants JMC200-2-5 and JMC160-2-5 shifted to the right indicating increased fluorescence as compared with parental JRCT1. D. Bar graph presentation of median fluorescence intensity of each mutant from three biological repeats. The asterisks indicate a P value of <0.001 (***), as determined using Student’s t-test.
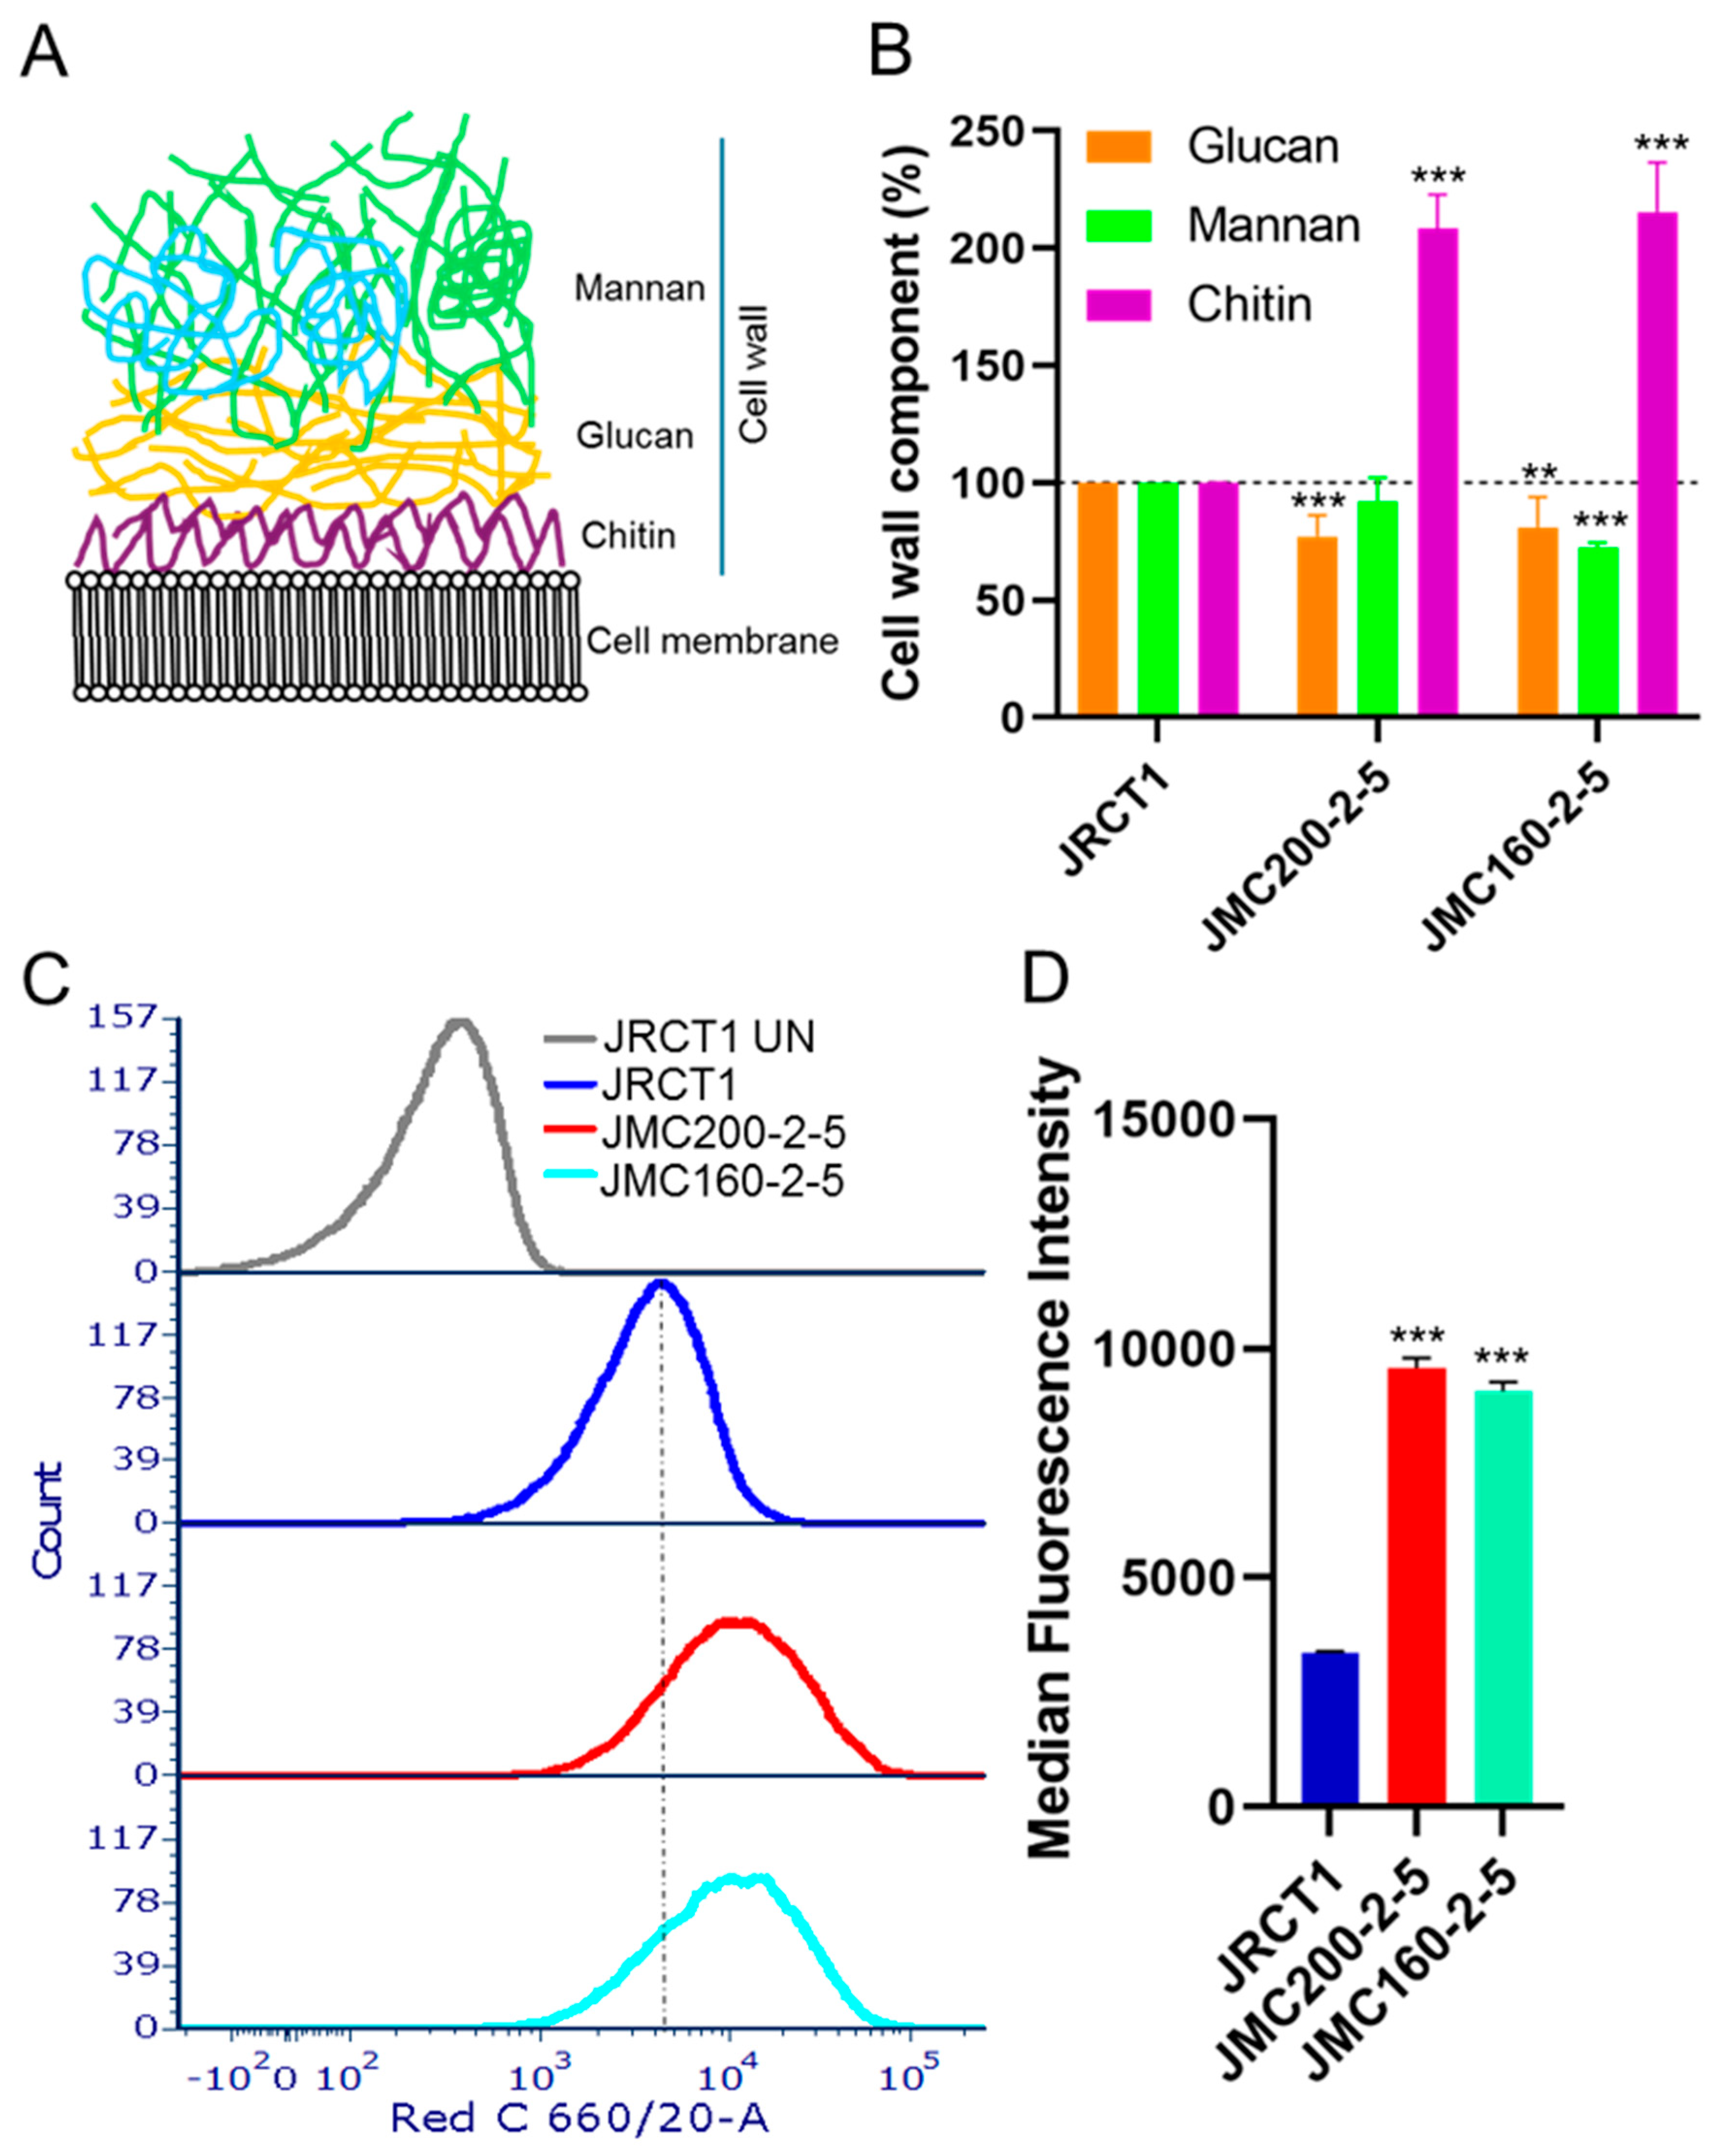

Table 1.
Distribution of significant ATAC-seq peaks over chromosomes in ECN-adapted mutants JMC200-2-5 and JMC160-2-5.
Table 1.
Distribution of significant ATAC-seq peaks over chromosomes in ECN-adapted mutants JMC200-2-5 and JMC160-2-5.
| Ch | Peaks in JMC200-2-5 | Peaks in JMC160-2-5 | ||||||
|---|---|---|---|---|---|---|---|---|
| Broad | Narrow | Broad | Narrow | |||||
| Gain | Loss | Gain | Loss | Gain | Loss | Gain | Loss | |
| 1 | 34 | 115 | 48 | 10 | 179 | 233 | 300 | 191 |
| 2 | 22 | 47 | 32 | 5 | 140 | 133 | 243 | 98 |
| 3 | 15 | 59 | 39 | 4 | 106 | 129 | 205 | 102 |
| 4 | 6 | 47 | 26 | 2 | 89 | 97 | 173 | 78 |
| 5 | 12 | 53 | 26 | 0 | 71 | 79 | 144 | 66 |
| 6 | 19 | 35 | 22 | 1 | 68 | 63 | 131 | 67 |
| 7 | 21 | 29 | 26 | 0 | 61 | 57 | 125 | 37 |
| R | 29 | 62 | 40 | 4 | 160 | 132 | 269 | 95 |
| Total in column | 158 | 447 | 259 | 26 | 874 | 923 | 1590 | 734 |
| Total | 605 | 285 | 1797 | 2324 | ||||
Table 2.
Percent of ATAC- seq peaks that are associated with DEGs and changing in the same direction as DEGs in ECN-adapted mutants JMC200-2-5 and JMC160-2-5.
Table 2.
Percent of ATAC- seq peaks that are associated with DEGs and changing in the same direction as DEGs in ECN-adapted mutants JMC200-2-5 and JMC160-2-5.
| Mutant | Total DEGs | Total ATAC-seq peaks | % peaks and associated DEGs changing in same direction | |
|---|---|---|---|---|
| JMC200-2-5 | 2664 | 890 | 24.26 | |
| JMC160-2-5 | 3135 | 4121 | 23.41 |
Table 3.
Distribution of 71 shared and peaks-associated DEGs over Clusters 1-4 in caspofungin-adapted mutants JMC200-2-5 and JMC160-2-5.
Table 3.
Distribution of 71 shared and peaks-associated DEGs over Clusters 1-4 in caspofungin-adapted mutants JMC200-2-5 and JMC160-2-5.
| Cluster | JMC200-2-5 | JMC160-2-5 | DEGs in common | |
|---|---|---|---|---|
| Total | With function/No function | |||
| 1 | 33 | 27 | 25 | 11/14 |
| 2 | 22 | 35 | 13 | 9/4 |
| 3 | 32 | 21 | 14 | 10/4 |
| 4 | 22 | 33 | 19 | 13/6 |
Table 4.
List of 9 caspofungin-responsive genes and 8 genes involved in cell wall synthesis that carry ATAC-seq peaks and are shared DEGs in ECN-adapted mutants JMC200-2-5 and JMC160-2-5. Shown are expression changes by RNA-seq and changes of associated ATAC-seq peaks, as determined by ratio mutant/parent.
| Standard name | Assembly 19/21Identifier | Systematic name | RNA-seq ratio | ATAC-seq peak ratio | ||||
|---|---|---|---|---|---|---|---|---|
| JMC200-2-5 | JMC160-2-5 | JMC200-2-5 | JMC160-2-5 | |||||
| Narrow | Broad | Narrow | Broad | |||||
| Caspofungin responsive genes | ||||||||
| NA* | orf19.6578 | C7_01510W_A | 2.52 | 3.12 | 1.21 | NA | 1.27 | NA |
| ECM21 | orf19.4887 | C1_10180C_A | 2.03 | 1.63 | 1.21 | 1.1 | 1.25 | NA |
| LSP1 | orf19.3149 | C2_06730W_A | 1.28 | 1.25 | 1.18 | NA | 1.17 | NA |
| PPH21 | orf19.1683 | C3_01600W_A | 1.66 | 2.06 | 1.22 | NA | 1.19 | NA |
| MKC1** | orf19.7523 | CR_00120C_A | 1.46 | 1.72 | NA | 1.08 | 1.18 | 1.11 |
| HAS1 | orf19.3962 | C5_04750C_A | 0.56 | 0.35 | NA | 0.9 | NA | 0.87 |
| CAN2† | orf19.111 | C6_01060C_A | 0.36 | 0.36 | NA | 0.94 | 0.750.83 | 0.88 |
| PHO87 | orf19.2454 | C1_05940W_A | 0.76 | 0.49 | NA | 0.89 | NA | 0.73 |
| ERG13 | orf19.7312 | CR_09160C_A | 0.39 | 0.37 | NA | 0.94 | NA | 0.94 |
| Cell wall synthesis genes | ||||||||
| GLC3 | orf19.5622 | C6_03340C_A | 1.93 | 2.20 | 1.19 | 1.1 | 1.24 | NA |
| BMT7 | orf19.342 | C3_03450C_A | 2.18 | 1.91 | 1.2 | 1.18 | 1.35 | 1.32 |
| FUN31 | orf19.7451 | C3_06620W_A | 1.89 | 1.54 | 1.29 | NA | 1.25 | NA |
| MKC1** | orf19.7523 | CR_00120C_A | 1.46 | 1.72 | NA | 1.08 | 1.18 | 1.11 |
| ATC1 | orf19.6214 | C1_06940C_A | 1.57 | 1.92 | NA | 1.09 | 1.19 | 1.19 |
| PDE2‡ | orf19.2972 | C1_02840W_A | 0.64 | 0.72 | NA | 0.92 | NA | 0.81.17 |
| HRR25 | orf19.3476 | C6_02340W_A | 0.78 | 0.67 | NA | 0.92 | 0.81 | 0.81 |
| BMT1† | orf19.6782 | C3_07180C_A | 0.40 | 0.38 | NA | 0.92 | 0.770.83 | 0.8 |
* NA stands for Not Applicable. ** MKC1 belongs to both categories of genes according to CGD. † Stands for two narrow peaks in JMC160-2-5. ‡ Stands for two broad peaks in JMC160-2-5.
Table 5.
Ratio differential peaks/genes in 16 caspofungin-responsive and cell wall synthesis genes versus the entire genome in caspofungin-adapted mutants JMC200-2-5 and JMC160-2-5.
Table 5.
Ratio differential peaks/genes in 16 caspofungin-responsive and cell wall synthesis genes versus the entire genome in caspofungin-adapted mutants JMC200-2-5 and JMC160-2-5.
| Mutant | Number of peaks | Number of genes | Ratiopeaks/genes |
|---|---|---|---|
| Caspofungin-responsive and cell wall synthesis genes | |||
| JMC200-2-5 | 19 | 16 | 1.2 |
| JMC160-2-5 | 25 | 16 | 1.6 |
| Entire genome in C. albicans caspofungin-adaptedmutants | |||
| JMC200-2-5 | 890 | 6182 | 0.1 |
| JMC160-2-5 | 4121 | 6182 | 0.7 |
Table 6.
Summary table of significant motifs analyzed from Homer software.
| Name* | q-value by Benjamini method | Number of target sequences with Motif | % of target sequences with motif | Number of background sequences with motif | % of background sequences with motif |
|---|---|---|---|---|---|
| JMC200-2-5, increased chromatin accessibility due to gain of Narrow peak Total target sequences=259, total background sequences=29604 | |||||
| Maz (Zf) | 0.0044 | 45 | 17.37 | 2534.1 | 8.56 |
| Klf14 (Zf) | 0.0313 | 59 | 22.78 | 4082.4 | 13.79 |
| Klf10 (Zf) | 0.0411 | 32 | 12.36 | 1801.9 | 6.09 |
| JMC160-2-5, increased chromatin accessibility due to gain of Narrow peakTotal target sequences=1591, total background sequences=30200 | |||||
| Zfp281 (Zf) | 0.007 | 14 | 0.88 | 60.4 | 0.2 |
| Tga3 (bZIP) | 0.0349 | 15 | 0.94 | 84.7 | 0.29 |
| JMC200-2-5, decreased chromatin accessibility due to loss of Narrow peak Total target sequences=26, total background sequences=40522 | |||||
| Pho4 (bHLH) | 0.0297 | 4 | 15.38 | 297.6 | 0.69 |
| JMC160-2-5, decreased chromatin accessibility due to loss of Narrow peakTotal target sequences=728, total background sequences=44211 | |||||
| NS | NS | NS | NS | NS | NS |
* Name of a protein with motif according to HOMER database. NS stands for No Significant motifs. Zf stands for zinc finger. bZIP stands for basic leucine zipper. bHLH stands for basic helix-loop-helix.
Table 7.
A list of DEGs that are involved with synthesis or control of cell wall components. Presented are expression changes by RNA-seq calculated as mutant to parent ratio. Note that all shared genes have expression change in same direction in two adapted mutants except for three genes.
Table 7.
A list of DEGs that are involved with synthesis or control of cell wall components. Presented are expression changes by RNA-seq calculated as mutant to parent ratio. Note that all shared genes have expression change in same direction in two adapted mutants except for three genes.
| StandardName | Assembly 19/21Identifier | Ch | RNS-seq | Common DEG | ATAC-seq | ||||||
|---|---|---|---|---|---|---|---|---|---|---|---|
| JMC200-2-5 | JMC160-2-5 | JMC200-2-5 | JMC160-2-5 | ||||||||
| Ratiomutant/parent | FDR | Ratio mutant/parent | FDR | Narrow | Broad | Narrow | Broad | ||||
| Glucan synthesis genes | |||||||||||
| FKS1 | orf19.2929 | 1 | NS | NS | 0.7 | 0.03 | NS | NS | 1.2 | 0.9 | |
| FKS3 | orf19.2465 | 1 | 1.8 | 0.00 | 1.5 | 0.03 | FKS3 | NS | NS | NS | NS |
| Chitin synthesis genes | |||||||||||
| CHS1 | orf19.5188 | 7 | 0.6 | 0.01 | 0.2 | 0.00 | CHS1† | 1.2 | 1.1 | 2.1 | 1.3 |
| CHS2 | orf19.7298 | R | 2.8 | 0.00 | 1.5 | 0.00 | CHS2 | NS | 0.9 | NS | NS |
| CHS3* | orf19.4937 | 1 | 1.3 | 0.00 | 0.8 | 0.00 | CHS3† | NS | 0.9 | NS | 0.9 |
| CHS5 | orf19.807 | 2 | 1.6 | 0.00 | 1.6 | 0.00 | CHS5 | NS | NS | NS | 1.1 |
| CHS7 | orf19.2444 | 1 | 1.4 | 0.01 | NS | NS | NS | NS | NS | NS | |
| CHS8 | orf19.5384 | 3 | NS | NS | 0.4 | 0.00 | NS | NS | NS | NS | |
| CHT4 | orf19.1515 | 2 | NS | NS | 1.6 | 0.02 | NS | NS | NS | 1.1 | |
| Mannan synthesis genes | |||||||||||
| PMT1 | orf19.5171 | 7 | 1.4 | 0.01 | 1.7 | 0.00 | PMT1† | NS | 0.9 | NS | 0.77 |
| PMT2 | orf19.6812 | 3 | 1.7 | 0.00 | 2.2 | 0.00 | PMT2† | NS | 0.9 | NS | 0.88 |
| PMT4 | orf19.4109 | 2 | NS | NS | 1.7 | 0.00 | NS | NS | 1.2 | NS | |
| PMT6 | orf19.3802 | 4 | 0.7 | 0.02 | 0.6 | 0.00 | PMT6 | NS | NS | NS | NS |
| MNT1 | orf19.1665 | 3 | NS | NS | 1.6 | 0.00 | NS | NS | NS | 0.88 | |
| CWH41 | orf19.4719 | 4 | NS | NS | 1.5 | 0.00 | NS | NS | NS | NS | |
| MNS1 | orf19.1036 | 1 | 1.6 | 0.00 | 2.4 | 0.00 | MNS1† | NS | 0.9 | NS | 0.95 |
| MNN1 | orf19.4279 | 5 | NS | NS | 0.7 | 0.00 | NS | NS | NS | NS | |
| MNN2 | orf19.2347 | 1 | 0.6 | 0.00 | 0.6 | 0.00 | MNN2 | NS | NS | 1.2 | 1.12 |
| MNN4 | orf19.2881 | 4 | 0.7 | 0.01 | NS | NS | 0.9 | NS | 0.8 | 0.86 | |
| MNN12 | orf19.4900 | 1 | 2.3 | 0.00 | 2.6 | 0.00 | MNN12 | NS | NS | NS | NS |
| MNN14 | orf19.6996 | 3 | 0.3 | 0.00 | 0.5 | 0.00 | MNN14 | NS | NS | NS | NS |
| MNN15 | orf19.753 | 1 | NS | NS | 0.6 | 0.00 | NS | NS | NS | NS | |
| MNN22 | orf19.3803 | 4 | 0.6 | 0.00 | 0.3 | 0.00 | MNN22 | NS | 0.96 | NS | NS |
| MNN24 | orf19.1995 | 2 | 3.5 | 0.00 | 3.3 | 0.00 | MNN24 | NS | NS | 0.8 | NS |
| MNN26 | orf19.6692 | 7 | 0.7 | 0.02 | NS | NS | NS | NS | NS | 0.91 | |
| BMT1 | orf19.6782 | 3 | 0.4 | 0.00 | 0.4 | 0.00 | BMT1† | NS | 0.92 | 0.8 | 0.8 |
| RHD1 | orf19.54 | 1 | NS | NS | 0.6 | 0.00 | NS | NS | NS | NS | |
| BMT3 | orf19.3282 | R | 2.4 | 0.00 | 1.7 | 0.00 | BMT3 | NS | NS | 0.8 | NS |
| BMT4 | orf19.5612 | 6 | NS | NS | 0.6 | 0.00 | NS | 0.92 | 0.8 | 0.77 | |
| BMT5 | orf19.1464 | 2 | 1.8 | 0.00 | NS | NS | NS | NS | NS | NS | |
| BMT6* | orf19.5602 | 6 | 1.4 | 0.01 | 0.6 | 0.00 | BMT6 | NS | NS | NS | NS |
| BMT7 | orf19.342 | 3 | 2.2 | 0.00 | 1.9 | 0.00 | BMT7† | 1.2 | 1.2 | 1.3 | 1.32 |
| MNT3 | orf19.1010 | R | 0.6 | 0.01 | 0.5 | 0.00 | MNT3 | NS | NS | 1.2 | NS |
| ALG1 | orf19.4410 | 4 | 1.5 | 0.04 | 1.8 | 0.00 | ALG1 | NS | NS | NS | NS |
| ALG6 | orf19.1843 | R | NS | NS | 2.1 | 0.00 | NS | NS | NS | 0.87 | |
| ALG7 | orf19.2187 | 2 | NS | NS | 0.7 | 0.04 | NS | NS | NS | 1.09 | |
| ALG11 | orf19.3468 | 6 | 0.4 | 0.00 | 0.6 | 0.01 | ALG11 | NS | NS | NS | NS |
| CHK1* | orf19.896 | 2 | 1.4 | 0.01 | 0.7 | 0.01 | CHK1 | NS | NS | NS | NS |
| Regulatory genes on Ch2 and Ch5 | |||||||||||
| CHT2 | orf19.3895 | 5 | 0.3 | 0.00 | 0.2 | 0.00 | CHT2 | NS | NS | NS | 1.1 |
| URA7 | orf19.3941 | 5 | 0.4 | 0.00 | 0.2 | 0.00 | URA7 | NS | NS | NS | NS |
| RPO26 | orf19.2643 | 5 | 0.4 | 0.00 | 0.2 | 0.00 | RPO26 | NS | NS | NS | 0.9 |
| HAS1 | orf19.396 | 5 | 0.6 | 0.00 | 0.3 | 0.00 | HAS1† | NS | 0.9 | NS | 0.9 |
| DUS4 | orf19.966 | 5 | 0.7 | 0.01 | 0.4 | 0.00 | DUS4 | NS | NS | 1.2 | NS |
| RPS25B | orf19.6663 | 5 | 0.6 | 0.00 | 0.5 | 0.00 | RPS25B | NS | NS | NS | NS |
| UAP1 | orf19.4265 | 5 | 0.6 | 0.00 | 0.5 | 0.00 | UAP1 | NS | NS | NS | NS |
| CKS1 | orf19.1282 | 5 | 0.5 | 0.00 | 0.6 | 0.00 | CKS1 | NS | NS | NS | NS |
| NS | orf19.4149.1 | 5 | 0.5 | 0.00 | 0.5 | 0.00 | Orf19.4149.1 | NS | NS | NS | NS |
| NS | orf19.970 | 5 | NS | NS | 0.5 | 0.00 | NS | NS | NS | NS | |
| ECS1 | orf19.1766 | 2 | 2.1 | 0.03 | 2.1 | 0.03 | ECS1 | NS | NS | NS | NS |
| ECS3 | orf19.5833 | 2 | 1.3 | 0.01 | 1.6 | 0.00 | ECS3 | NS | NS | 0.8 | NS |
| PR26 | orf19.5793 | 2 | 1.4 | 0.00 | 1.9 | 0.00 | PR26 | NS | NS | NS | 1.1 |
| LEU42 | orf19.1375 | 2 | 1.5 | 0.01 | 1.6 | 0.00 | LEU42 | NS | NS | 1.1 | NS |
* Genes that changed their expression in opposite direction in two adapted mutants. † Common DEGs having peaks in both adapted mutants. NS stands for Not Significant.
Disclaimer/Publisher’s Note: The statements, opinions and data contained in all publications are solely those of the individual author(s) and contributor(s) and not of MDPI and/or the editor(s). MDPI and/or the editor(s) disclaim responsibility for any injury to people or property resulting from any ideas, methods, instructions or products referred to in the content. |
© 2024 by the authors. Licensee MDPI, Basel, Switzerland. This article is an open access article distributed under the terms and conditions of the Creative Commons Attribution (CC BY) license (http://creativecommons.org/licenses/by/4.0/).
Copyright: This open access article is published under a Creative Commons CC BY 4.0 license, which permit the free download, distribution, and reuse, provided that the author and preprint are cited in any reuse.


