resolution frames for large-scale application. Subsequently, a novel crop canopy organ level object detection dataset (
https://huggingface.co/datasets/Nirvana123/CCOD-Dataset) was created by interactive annotation with SAHI-YOLOv10n, featuring 3,986 images and 410,910 annotated boxes. The proposed fusion method demonstrated feasibility for detecting small objects at the organ level in three large-scale in-field farmlands, potentially benefiting future wide-range applications.
1. Introduction
Precision agriculture technologies have significantly enhanced crop production efficiency and resource utilization [
1]. UAV-based monitoring is a key tool in precision agriculture, offering high-resolution imagery and non-destructive data collection [
2,
3]. Using photogrammetry techniques like Structure-from-Motion and Multi-View Stereo (SfM-MVS) [
4], enhancing georeferenced analysis in computer vision methods for large-scale crop health and distribution assessments [
5].
Traditional computer vision methods face challenges such as being labor-intensive and lacking generalizability in large-scale, diversified agricultural phenotypic analyses. For example, feature detection methods like Scale-Invariant Feature Transform (SIFT) [
6], Speeded-Up Robust Features (SURF) [
7], and Oriented FAST and Rotated BRIEF (ORB) [
8] have limited robustness to image noise, occlusion, and complex backgrounds. Template matching techniques [
9] rely on pixel-by-pixel similarity but are sensitive to rotation, scaling, and lighting variations. Edge detection methods like Canny and Sobel [
10], extract object contours but are prone to false detections in complex backgrounds.
With the rapid development from traditional computer vision to deep learning, object detection algorithms had transformed complex algorithm design processes to "data-driven" model training workflows [
11]. Unlike traditional methods, which relied heavily on manually designed features. The performance of deep learning depended on diverse, high-quality annotated datasets (e.g., bounding boxes and class labels) [
12]. Deep learning can extract multi-level features, from low-level information such as edges and colors to high-level semantic features like crop health and disease detection [
13]. By leveraging diverse and extensive datasets, combined with optimized model architectures and regularization strategies, deep learning achieves significant improvements for large-scale and diverse agricultural phenotyping tasks[
14]. Additionally, the emergence of manual and semi-automated annotation methods had facilitated data processing for deep learning [
15,
16]. Despite these advancements, accurately detecting organ level crop features, such as canopy flowers and fruits, remain technically challenging.
Integrating raw images and DOM for organ level object detection has advanced, but challenges remain in balancing detection precision [
17] and geolocating [
18]. This study tackles three key issues to enhance agricultural target detection precision and efficiency for small objects:
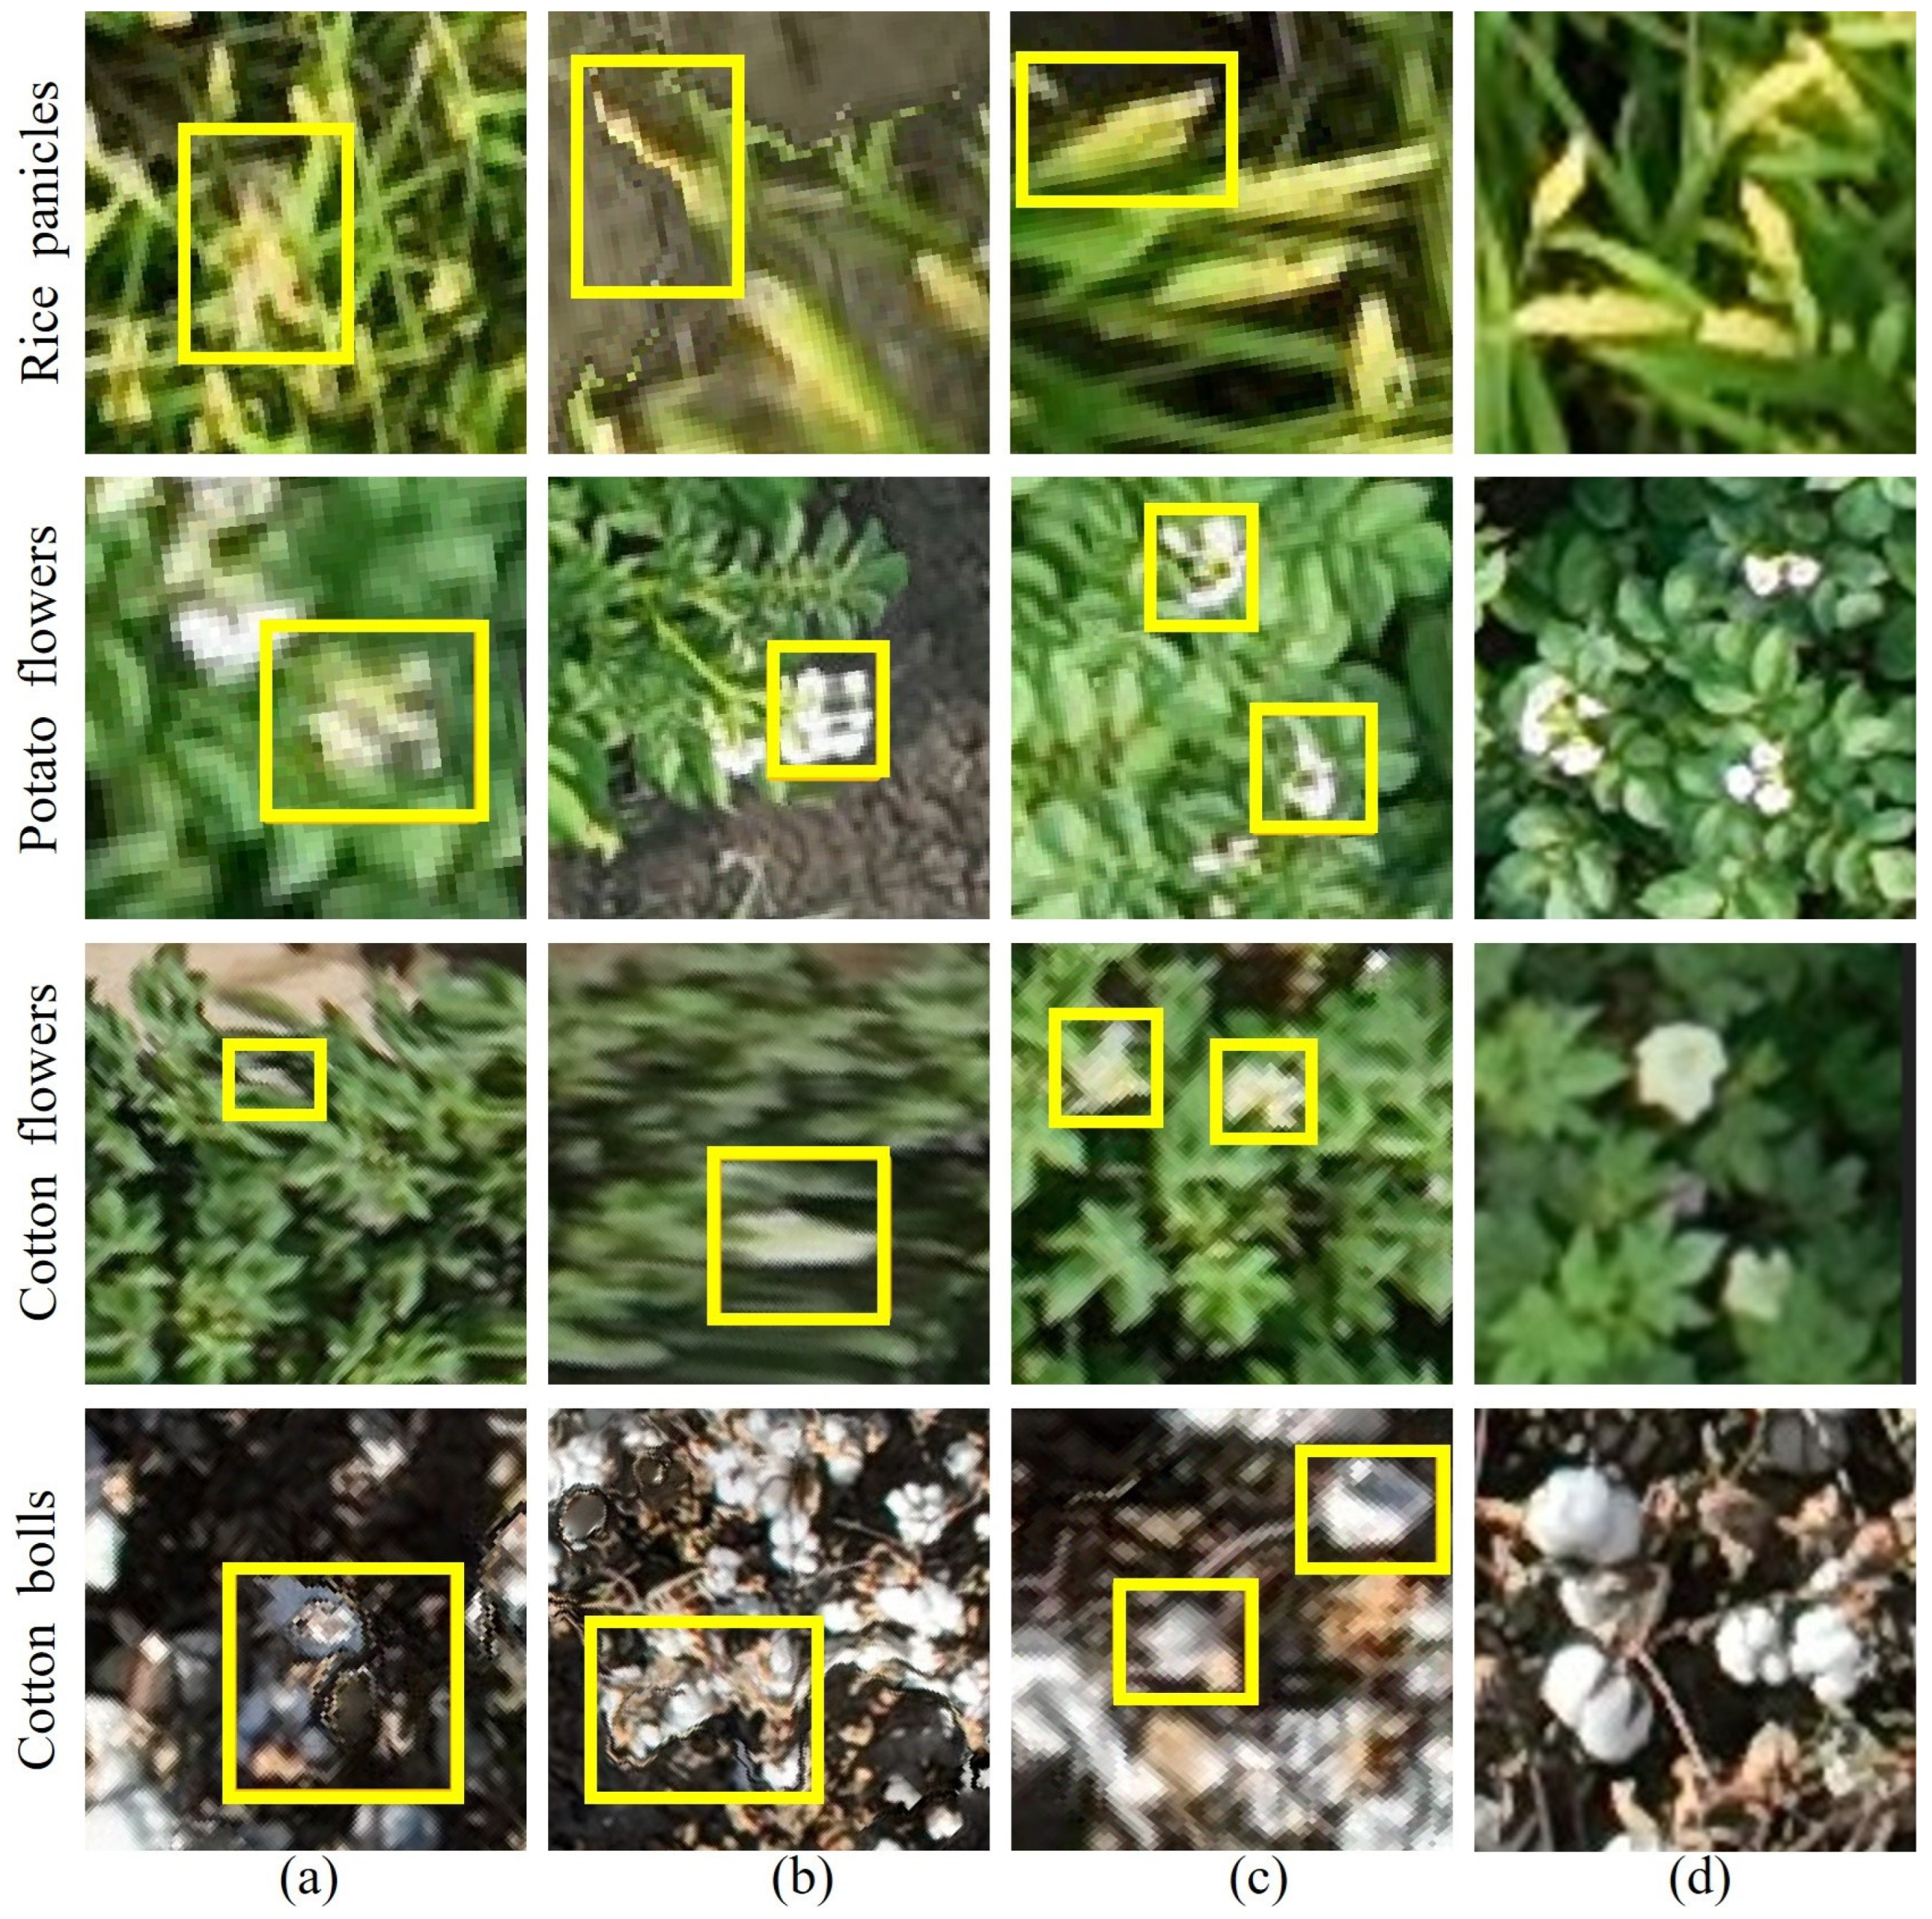
(1) Low quality issues of DOM: DOM provides macro-level insights into the georeferenced distribution of crops [
19,
20], but it suffers from limitations inherent to the reconstruction process. Blurred edges, seamline distortions, and low resolution often arise due to the use of low-angle images and the geometric corrections requiring interpolation during reconstruction [
21,
22,
23], as shown in
Figure 1(a) to (c) with yellow circles. While prior studies have enhanced DOM resolution using preprocessing methods such as super-resolution [
24,
25] and Histogram Equalization [
26,
27], these approaches demand extensive data and often produce unsatisfactory results for small objects [
28].
(2) Efficiency optimization for detection model within raw images: UAV raw images provide higher resolution than DOM, but organ level objects like flowers and fruits occupy only a few pixels [
29,
30], making feature extraction challenging. While some studies have tailored algorithms for small objects [
31,
32,
33], these adjustments often forgo pretrained weights, requiring training from scratch. Oversampling small objects with segment-wise annotations [
34] is incompatible with standard object detection datasets. Cropping and enlarging small-object areas improves detection but increases computational costs. For instance, Yu et. al., [
35] achieved 3.06 mm georeferencing resolution using a DJI M600-Pro drone with a Sony 7αII camera but at the cost of higher computational demands, reducing practicality. Moreover, agricultural UAV surveys produce thousands of large images, further straining computational and memory resources [
36]. Optimizing raw image detection for organ level objects remains necessary to enhance accuracy and efficiency.
(3) Missing geolocation information on raw images: UAV raw images lack precise geolocation, making it difficult to accurately map detected objects to actual field position. Yang et. al., [
37] detected potato canopy leaves in specific areas by manually operating UAV to capture image at 2 meters above the canopy to improve image distribution, but this limits raw images incapable of covering specific areas and hindered 3D reconstruction from 2D images. Such methods hinder the practical applicability of detection results in agricultural management [
38]. Establishing an effective mapping between DOM and UAV raw image is essential for improving locating precision [
39], enabling georeferencing on ortho maps and reverse-geocoding for raw images, thus directly linking detection results to georeferencing information [
40,
41].
To address the current challenges in detecting organ level objects within crop canopies, this study proposes an innovative approach that combines UAV raw image with DOM. By precisely mapping organ level objects detected in UAV image to georeferencing within DOM, this method significantly enhances detection precision and ensures precise localization of organ level features. This approach not only improves detection precision but also provides a robust geolocation mapping strategy, offering technical support and practical significance for crop growth monitoring in precision agriculture. The specific novelties of this paper are as follows:
1. Detecting small objects on raw images with higher quality to guarantee the accuracy and fusing with ortho maps to obtain the missing geolocations;
2. Using SAHI to accelerate the model inferencing for large scale applications;
3. Using interactive labeling to decrease the workload of data annotation and releasing a small object detection dataset.
The structure of the remaining parts of this paper is organized as follows:
Section 2 covers the collection of aerial imagery of crop canopy objects, the creation of the CCOD-Dataset, and the framework for the fusion of DOM and UAV raw image.
Section 3 presents and analyzes the training results of the CCOD-Dataset and evaluates the effectiveness of mapping the detected crop canopy objects from the raw images back to the DOM.
Section 4 discusses the detection and mapping results of more complex scenarios involving cotton bolls and rice panicles back to the DOM.
Section 5 concludes the paper.
2. Materials and Methods
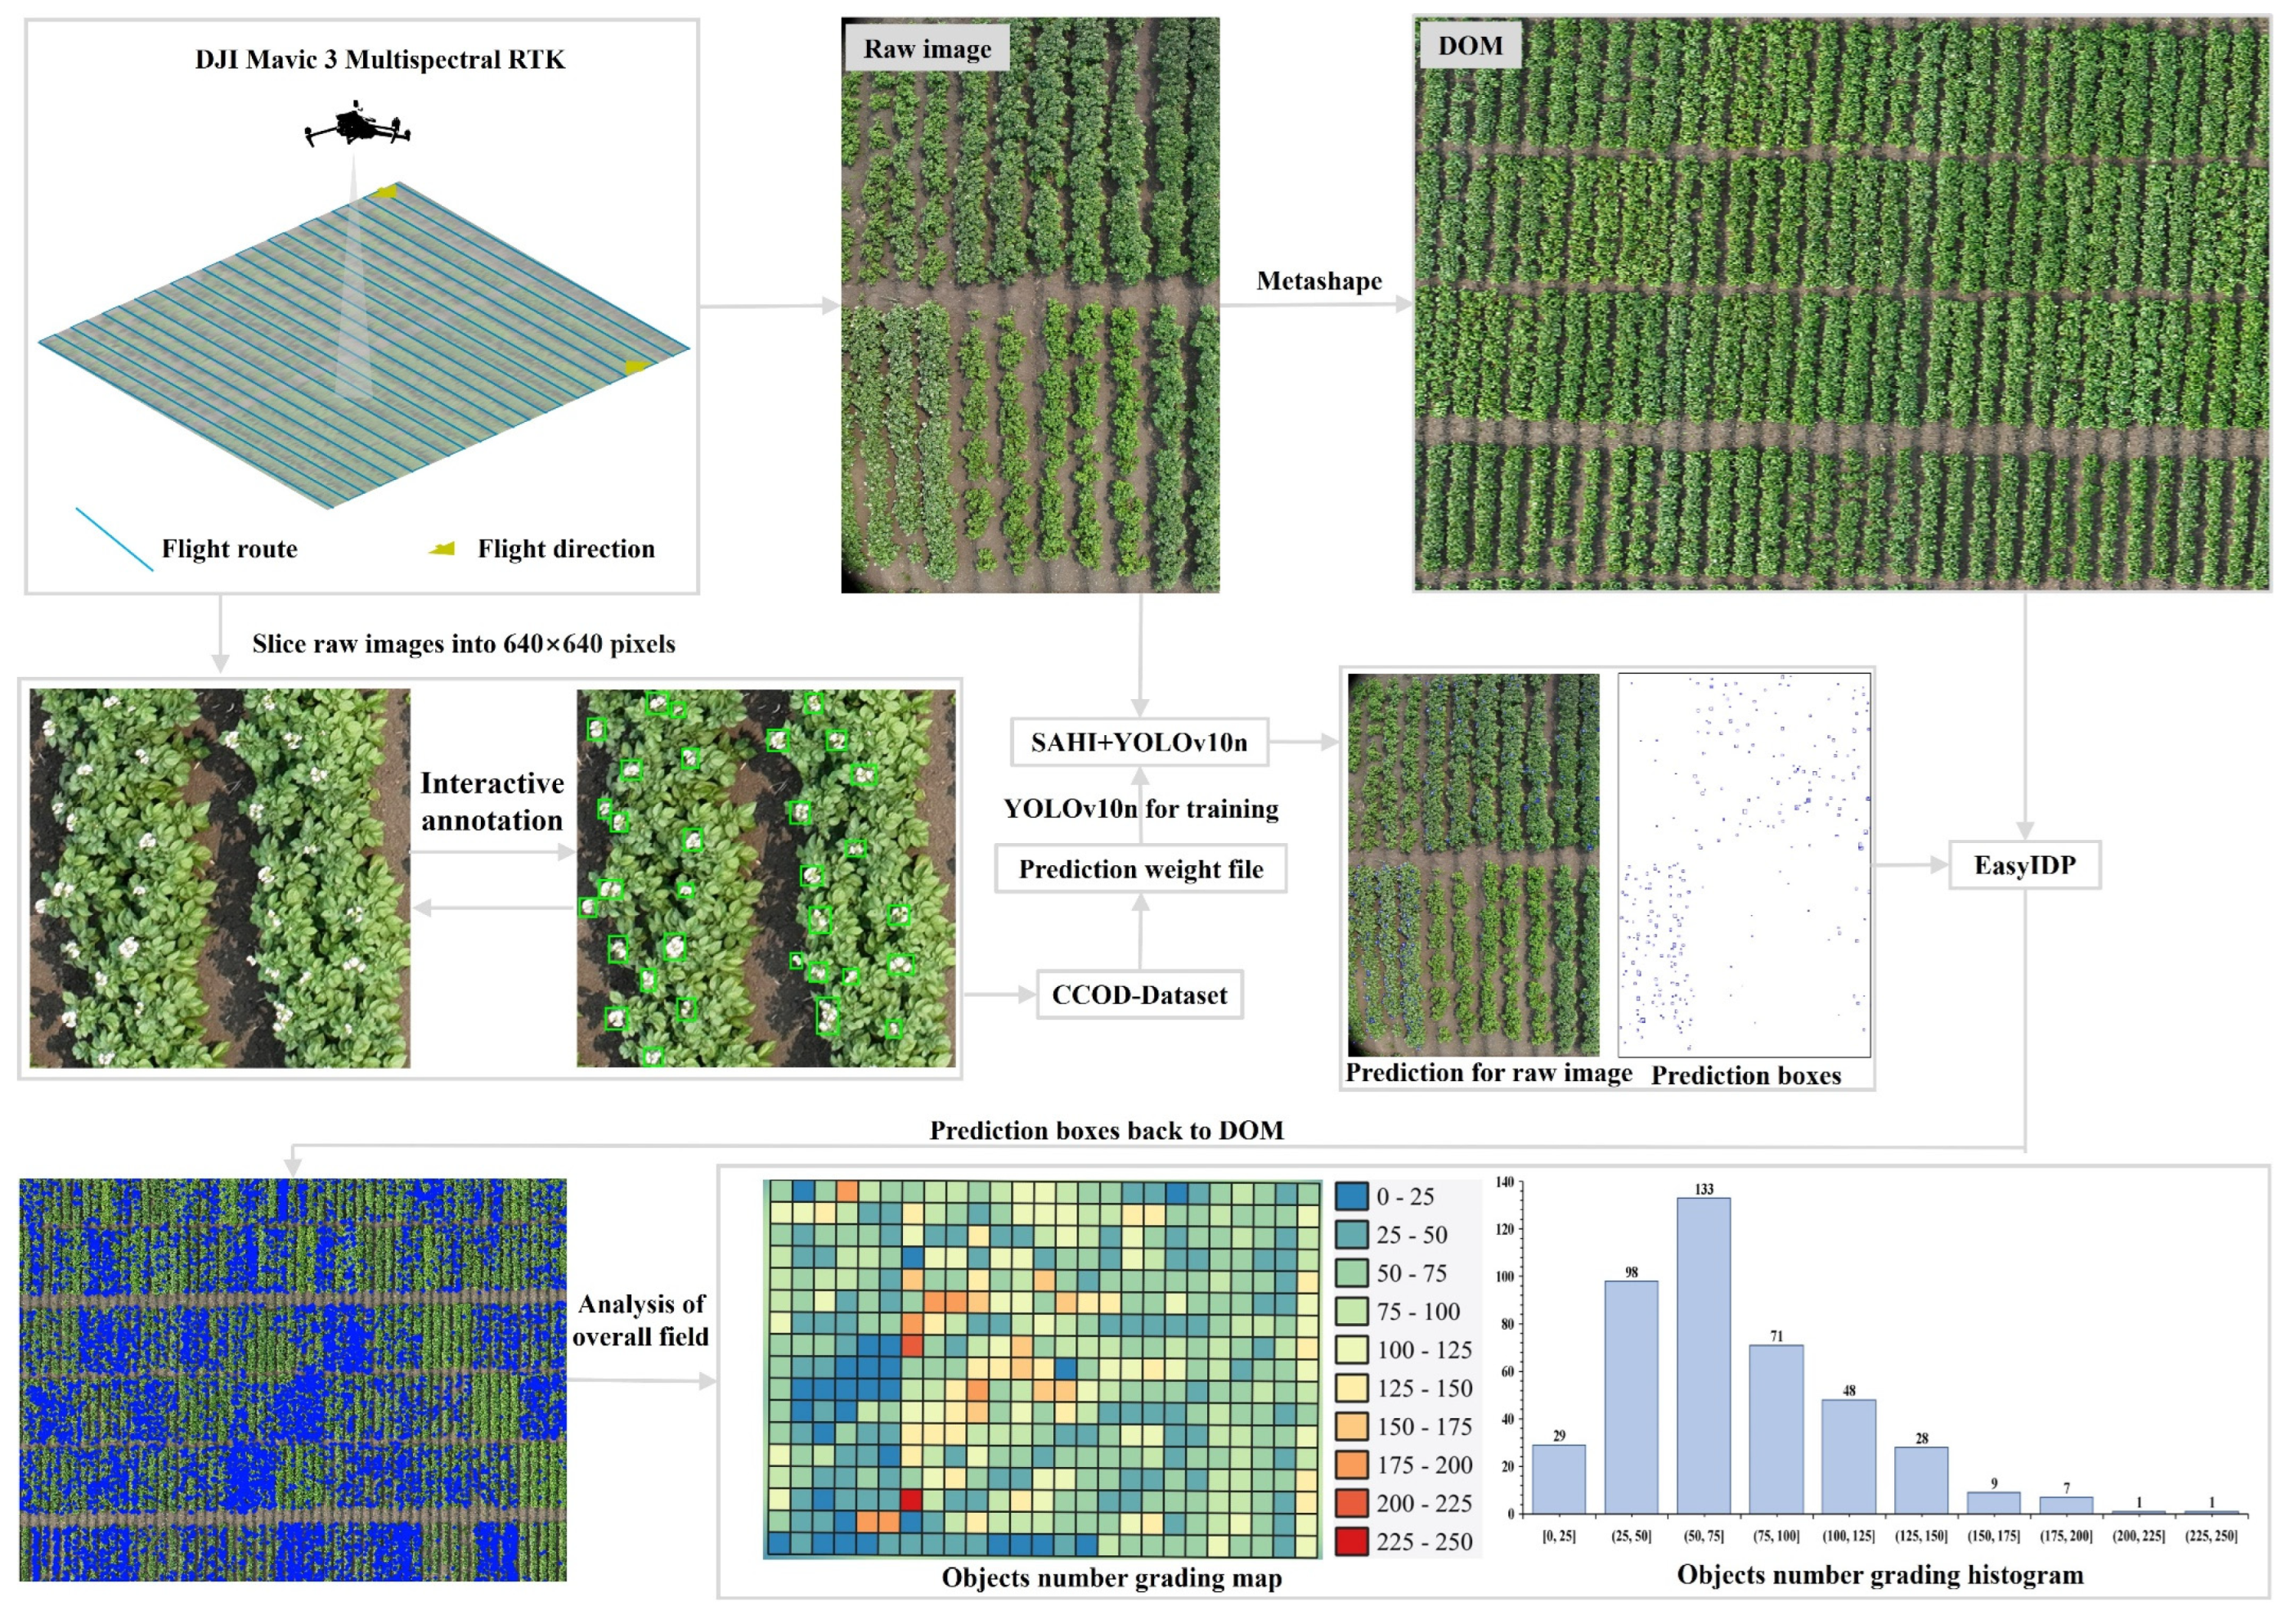
The proposed method detects and localizes organ level agricultural objects by integrating DOM and UAV raw image. UAV raw image is acquired following automated flight planning and processed into DOM and DEM. as shown in
Figure 2, Interactive annotation techniques are then applied to create the CCOD-Dataset, reducing labeling workload, and a YOLOv10n (
https://github.com/THU-MIG/yolov10) model is trained for object detection. During prediction, the SAHI (
https://github.com/Nirvana557/SAHI_YOLOv10) framework [
42] enhances detection precision while optimizing computational efficiency. Finally, EasyIDP (
https://github.com/UTokyo-FieldPhenomics-Lab/EasyIDP) [
43,
44] enables bidirectional mapping between raw image and the DOM, allowing for precise georeferencing localization of detected objects and distribution analysis on the DOM.
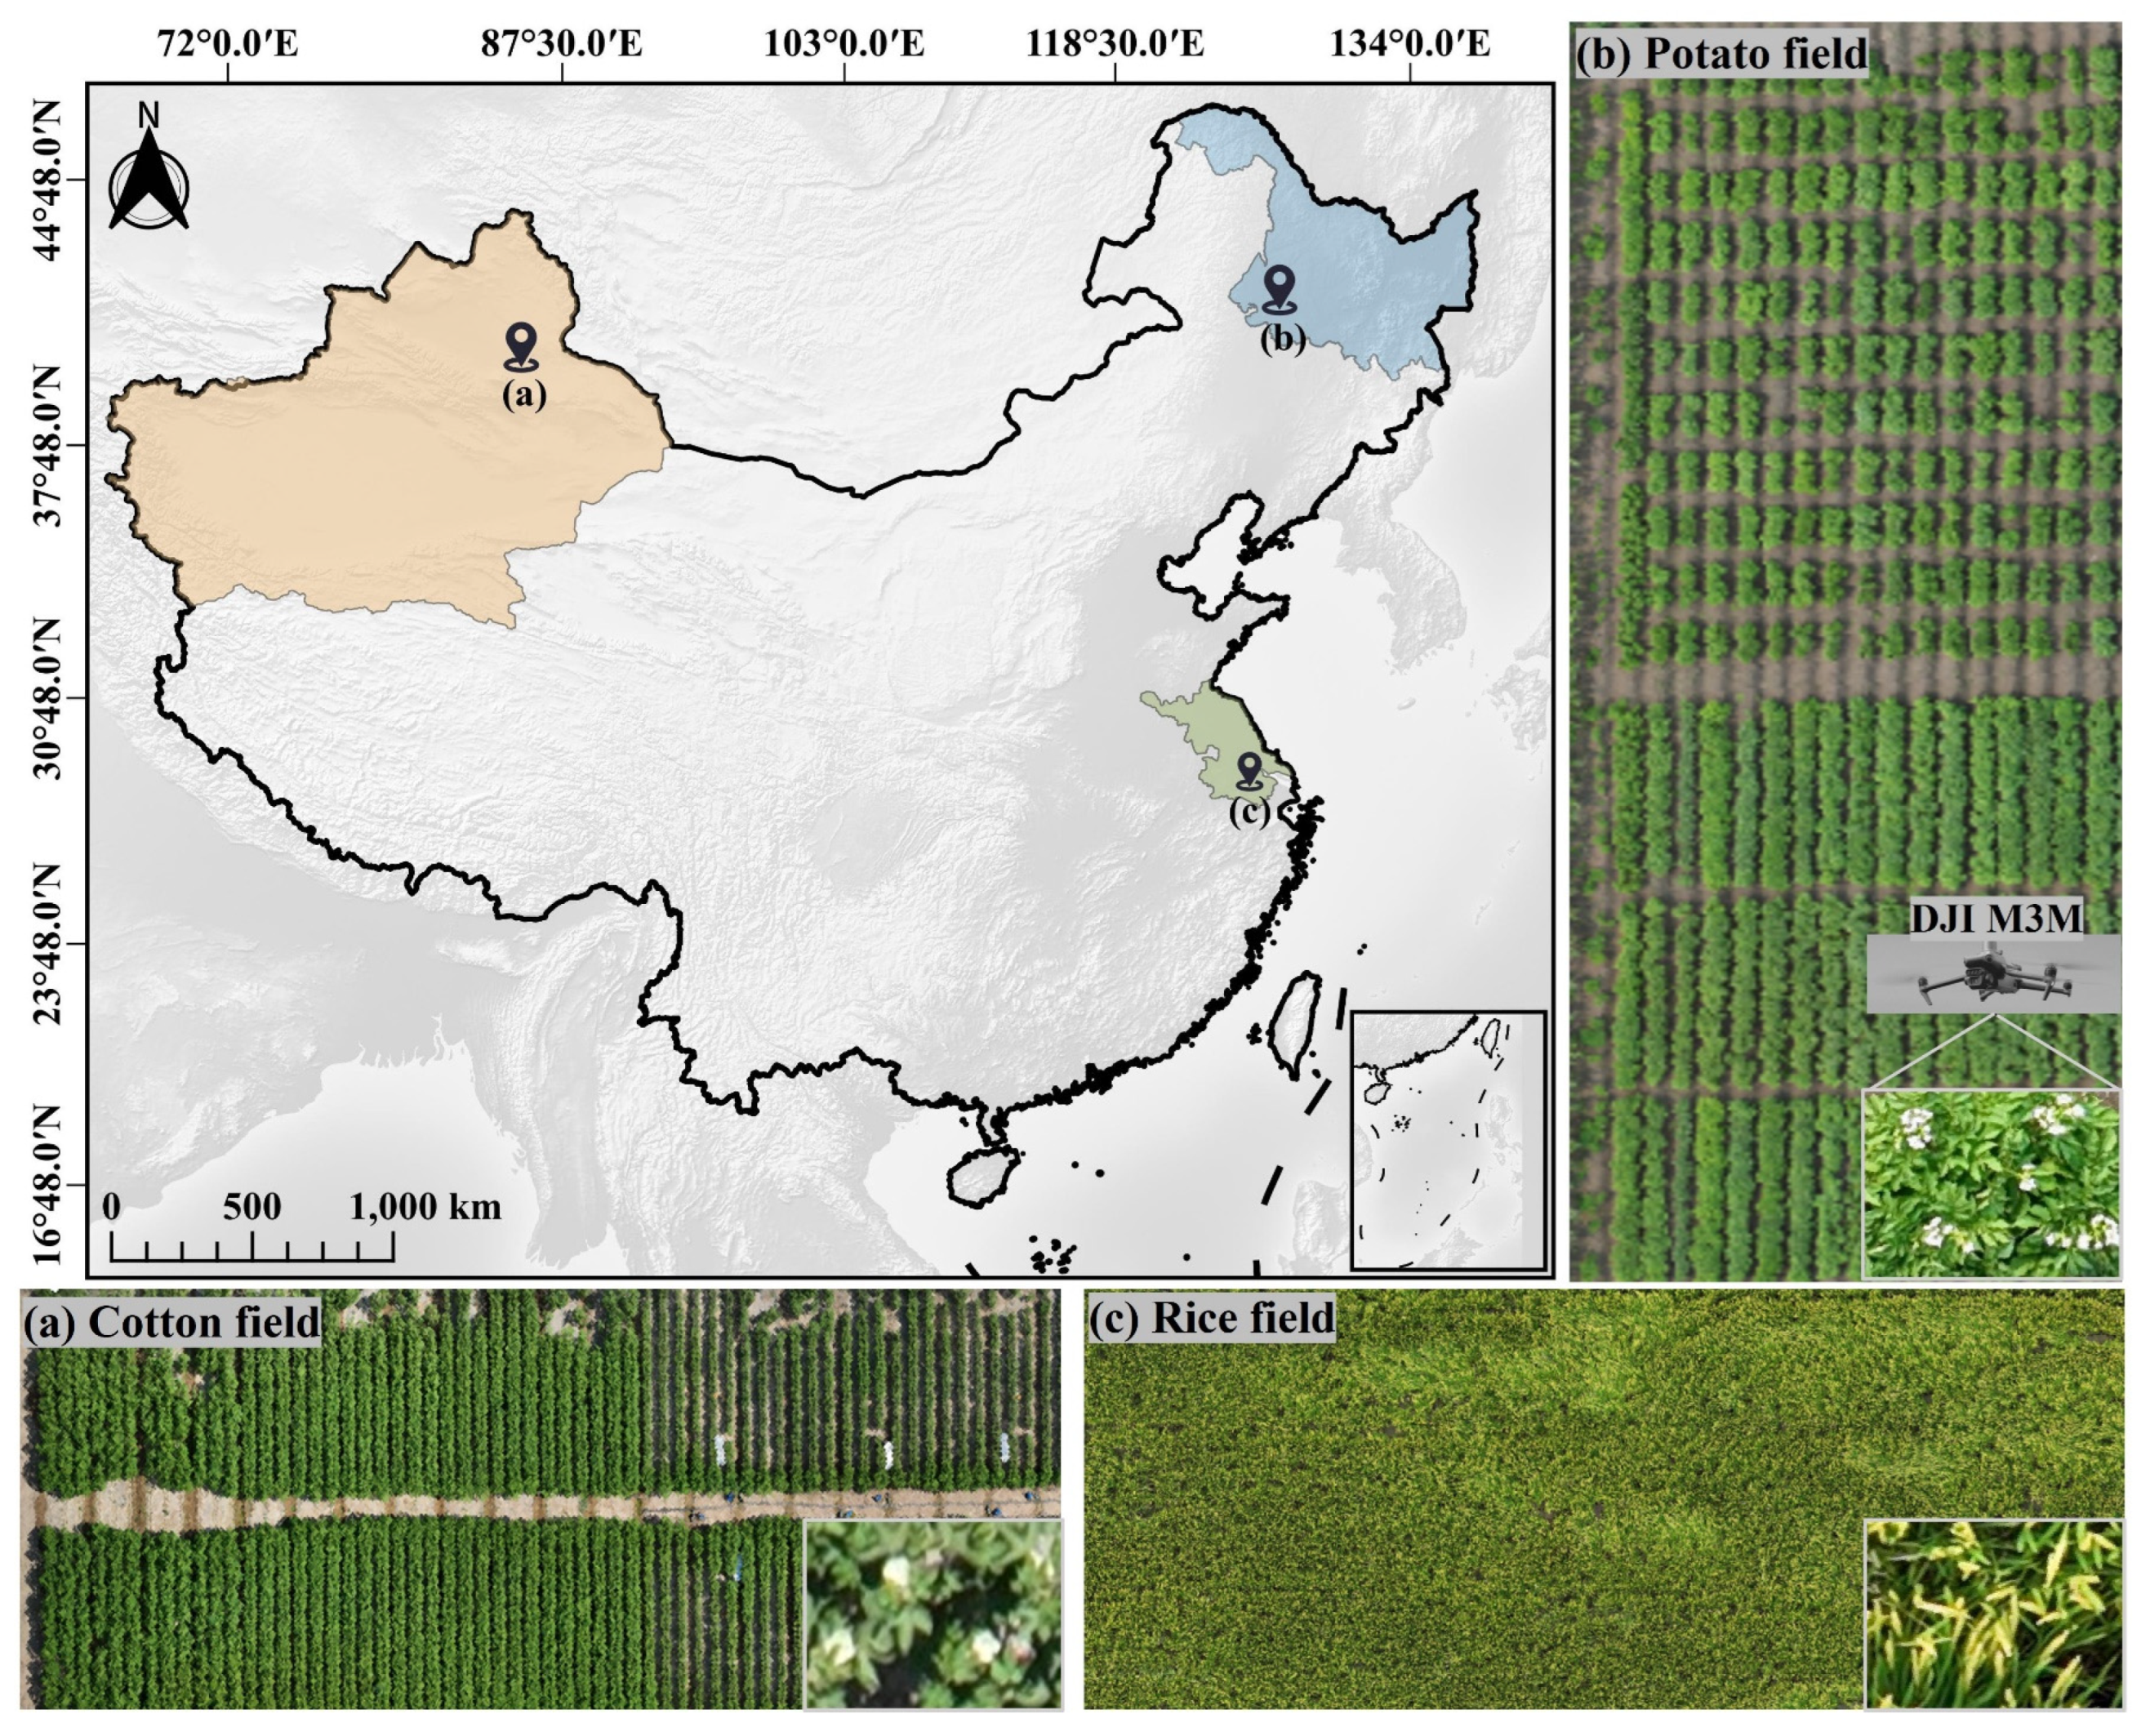
2.1. Experimental field
The experiments utilized data from three kinds of crop canopy: cotton, potato, and rice. Rice panicle images were collected at the Future Smart Pastoral in Luja, Kunshan, Suzhou, Jiangsu, China (longitude 120.976E, latitude 31.386N,
Figure 3c) to validate the method proposed in this study. All data were collected in 2024, specifically, cotton canopy flowers and cotton canopy bolls were gathered in the Xinjiang Uygur Autonomous Region, China (44.263N, 87.332E,
Figure 3a), while potato canopy flowers were collected at the Keshan Farm in Heilongjiang, China (48.033N, 125.864E,
Figure 3b).
2.2. Data acquisition and processing
The data acquisition locations are shown in
Figure 3. The equipment used was a quadcopter unmanned aerial vehicle (DJI Mavic 3 Multispectral RTK, DJI M3M), equipped with a 20-megapixel RGB camera. The flight altitude was set at 12 meters, with frontal and lateral overlaps adjusted to 85% and 75%, respectively. The flight routes were automatically planned using DJI Pilot 2, and during the flight, the DJI M3M camera remained perpendicular to the target surfaces. The orthophoto image covered 2.67 hectares of cotton, 1.06 hectares of potato, and 1.12 hectares of rice. After acquiring the raw UAV image, the images were stitched into a DOM using Metashape software (Agisoft LLC, St. Petersburg, Russia).
2.3. Interactive annotating of CCOD-Dataset
To save annotation resources, The rice panicles data is from a DRPD dataset [
45] collected in 2021 and 2022 which was used as training data, In order to realize the study of crop canopy organs detection, this paper constructs the first CCOD-Dataset based on aerial image by interactive annotating the collected data and DRPD dataset.
First, we cropped the aerial orthophotos of the crop canopy organs into
pixels image. After screening, we ultimately collected 3,986 high-quality images. Subsequently, the CCOD-Dataset is annotated using an interactive approach similar to weakly supervised learning, but more simplistic [
46,
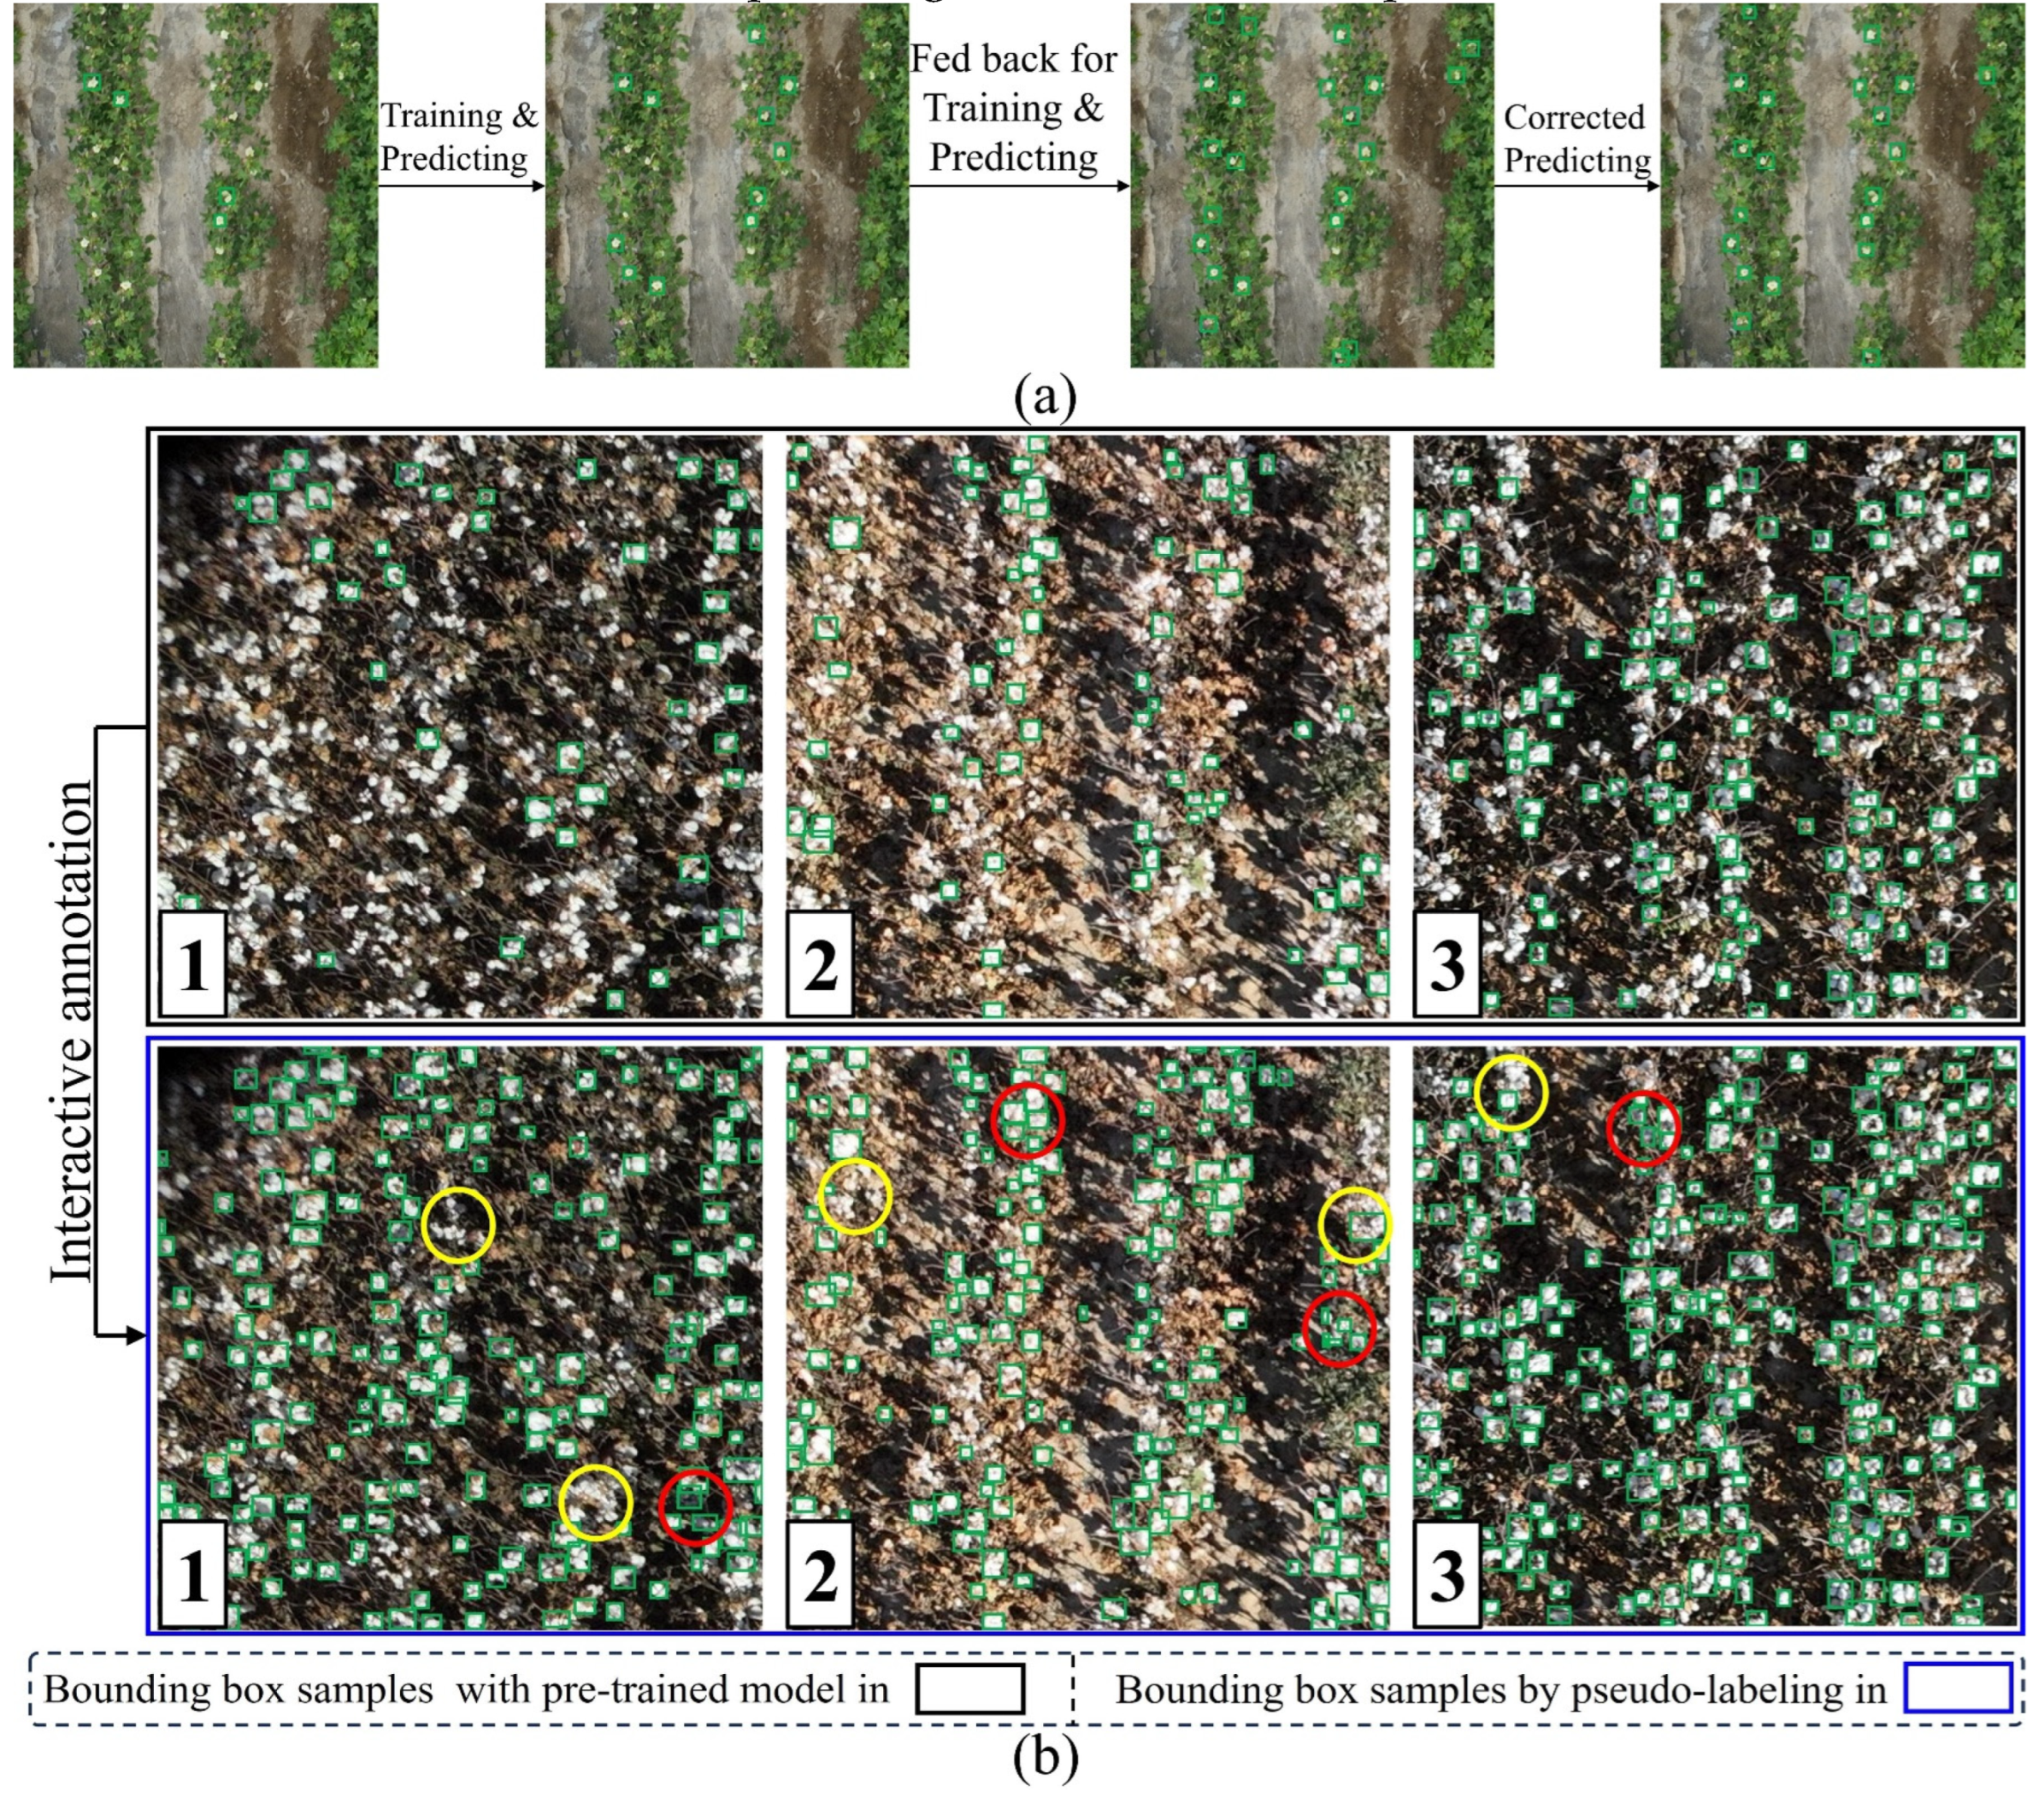
47]. As is shown in
Figure 4(a), some images in the CCOD-Dataset were initially annotated using Labelme (
https://github.com/wkentaro/labelme) [
48] for training purposes. The trained model was then used to predict unannotated images, after which the predicted bounding boxes were corrected and fed back into the model for further training. This process was repeated, doubling the number of annotated images in each cycle.
To further streamline annotation, we used a pre-trained model based on a publicly available dataset containing a small number of cotton boll samples(
https://github.com/linzhe67/Cotton_Boll_Counting), and then repeated the aforementioned prediction, correction, and feedback process. This allowed the annotation of a large quantity of cotton boll data in only two cycles. The examples 1 to 3 in the black box in
Figure 4(b) illustrate the cotton bolls annotations achieved with the pre-trained model, while examples 1 to 3 in the blue box in
Figure 4(b) demonstrate the predictions made after training on these annotated cotton boll data. With minimal effort, an initial set of annotated samples was obtained. We then refined examples 1 to 3 in the light green box in
Figure 4(b) by correcting annotation errors indicated by red circles and omissions indicated by yellow circles, ultimately yielding high-quality annotated data. Compared to manual annotation, this method decreases the annotation time from 1.5h per image/frame to 15 mins per item.
Through this iterative approach, we obtained annotations for all images with minimal manual effort. Finally, we obtained an CCOD-Dataset which contains 410910 bounding boxes. We divided the CCOD-Dataset into a training set, validation set, and testing set in a 7:2:1 ratio for training and validation purposes. The information of the CCOD-Dataset is shown in
Table 1.
2.4. Base detection model selection
In recent years, the development of object detection algorithms has significantly improved the precision of small objects detection. The YOLO series, as a representative of classic object detection algorithms, showcases the effectiveness of this progress. Specifically, the YOLOv8 series adopts multi-scale detection layers, enhancing the algorithm's ability to recognize objects of different sizes. In contrast, the YOLOv10 series utilizes large-kernel depth wise convolutions in CIB and structural reparameterization techniques within deep layers, demonstrating superior performance in detecting organ level objects [
49,
50]. To optimize the detection performance of organ level objects in crop canopies, this study systematically compares the differences in detection precision and computational resource requirements between the YOLOv8 and YOLOv10 series models, selecting the model with the best balance of precision and efficiency as the foundational detection algorithm.
2.5. Evaluation metrics
To comprehensively assess detection performance, this research introduces classical metrics as shown in equations (1) to (3). Specifically, Precision (P) measures the precision of detected objects, Recall (R) focuses on assessing the model's ability to identify actual objects, and mean Average Precision (mAP) provides a comprehensive metric that quantifies detection precision by averaging the precision values across multiple recall levels, offering an overall assessment of the model's performance in detecting objects across different confidence thresholds. The specific formulas for these metrics are as follows:
In the above metrics, K stands for crop canopy objects types, True Positive (TP) indicates the number of positive samples correctly detected by the model, reflecting the precision of target recognition. False Negative (FN) represents the number of objects missed by the model, indicating the extent of actual target omission. True Negative (TN) denotes the number of negative samples correctly identified by the model, showcasing its ability to recognize instances that do not belong to the target class. Conversely, False Positive (FP) refers to the number of negative samples incorrectly identified as positive, highlighting instances where the model mistakenly identifies a target.
In this paper, “Ground truth” represents the annotated reference values, “Prediction” indicates the number of predicted bounding boxes, “Omission” denotes undetected objects, and “Error” refers to incorrect detections. Based on the definitions, Ground truth satisfies Equation (4), TP conforms to Equation (5), FP corresponds to Error, FN equals Omission, and TN, being nonexistent, is uniformly set to 0.
2.6. Crop organ detection by SAHI
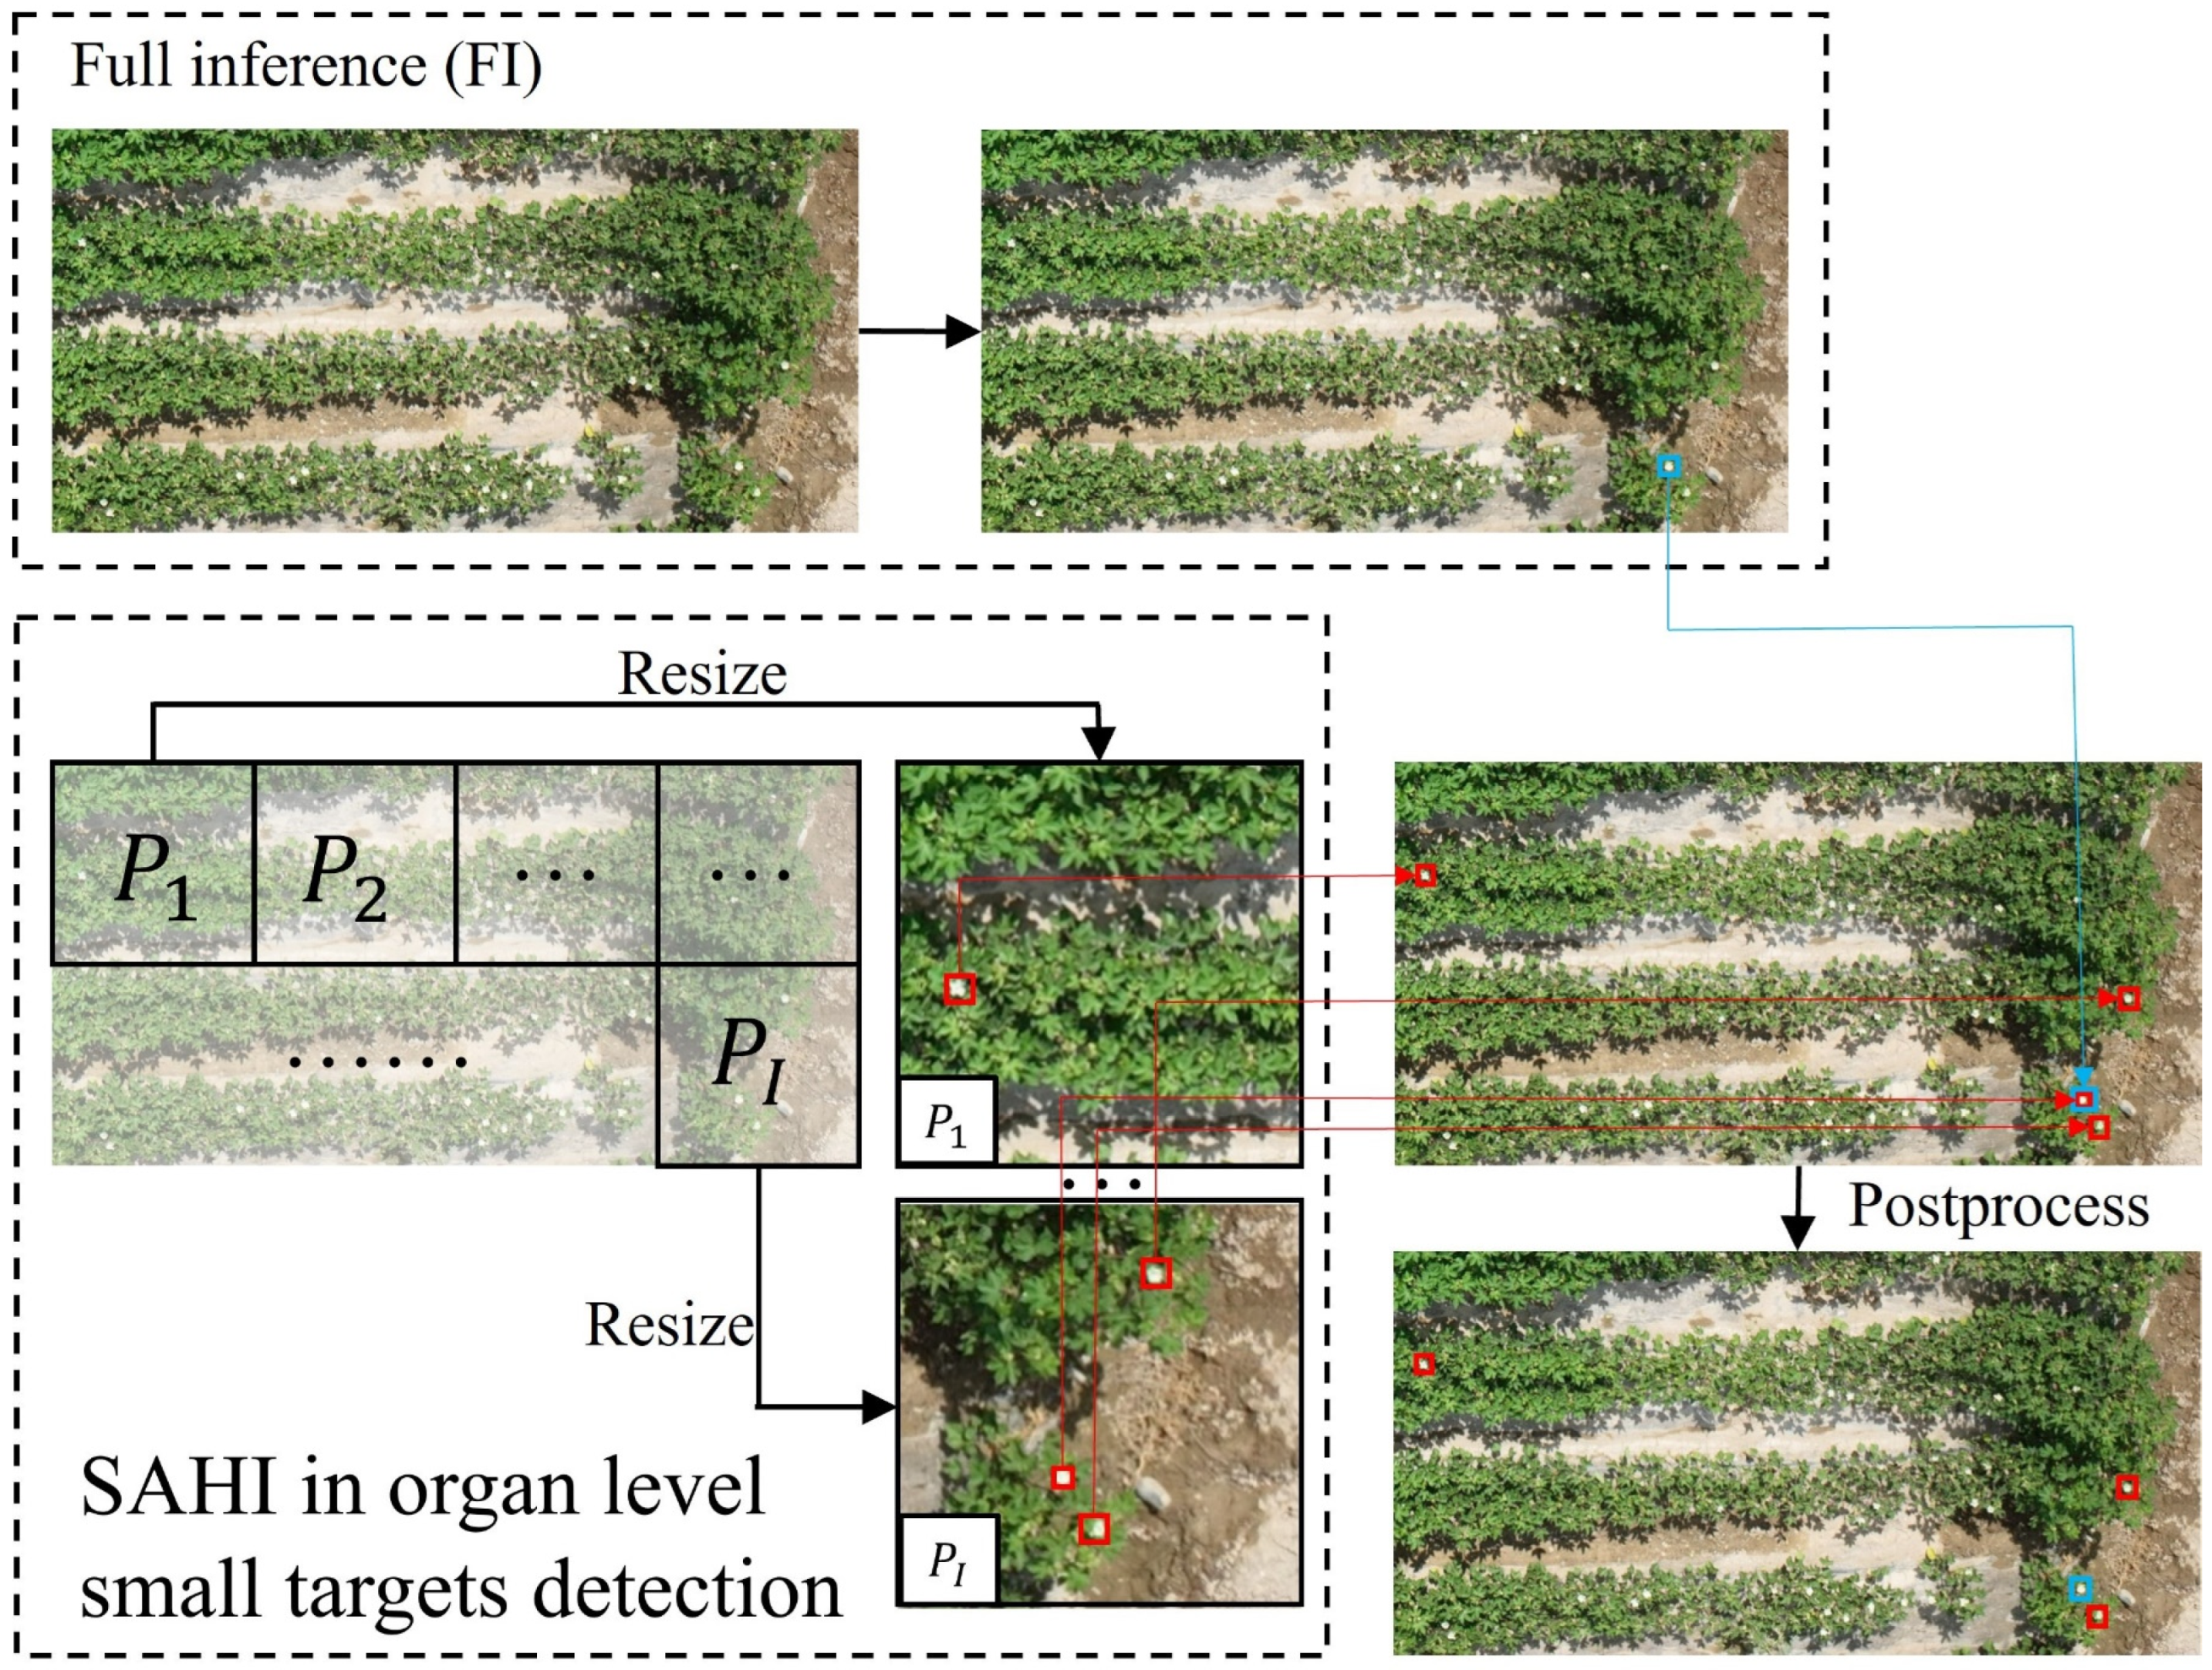
To address the issues of reduced detection precision and high computational costs, SAHI was employed as an auxiliary tool for detecting organ level objects within UAV image of crop canopies. As illustrated in
Figure 6, the original query image
was first sliced into
overlapping patches of size
, represented as
,
, … ,
, and each patch was resized while preserving the aspect ratio. An object detection forward pass was then independently applied to each overlapping patch. An optional full inference (FI) could be applied to the raw image to detect larger objects. Finally, the overlapping predictions, along with FI results if used, were merged back to the original size using Non-Maximum Suppression (NMS). During NMS, boxes with Intersection over Union (IoU) ratios exceeding the predefined matching threshold
were matched, and for each match, detections with probabilities below the threshold
were removed.
2.7.Geo-mapping of detections
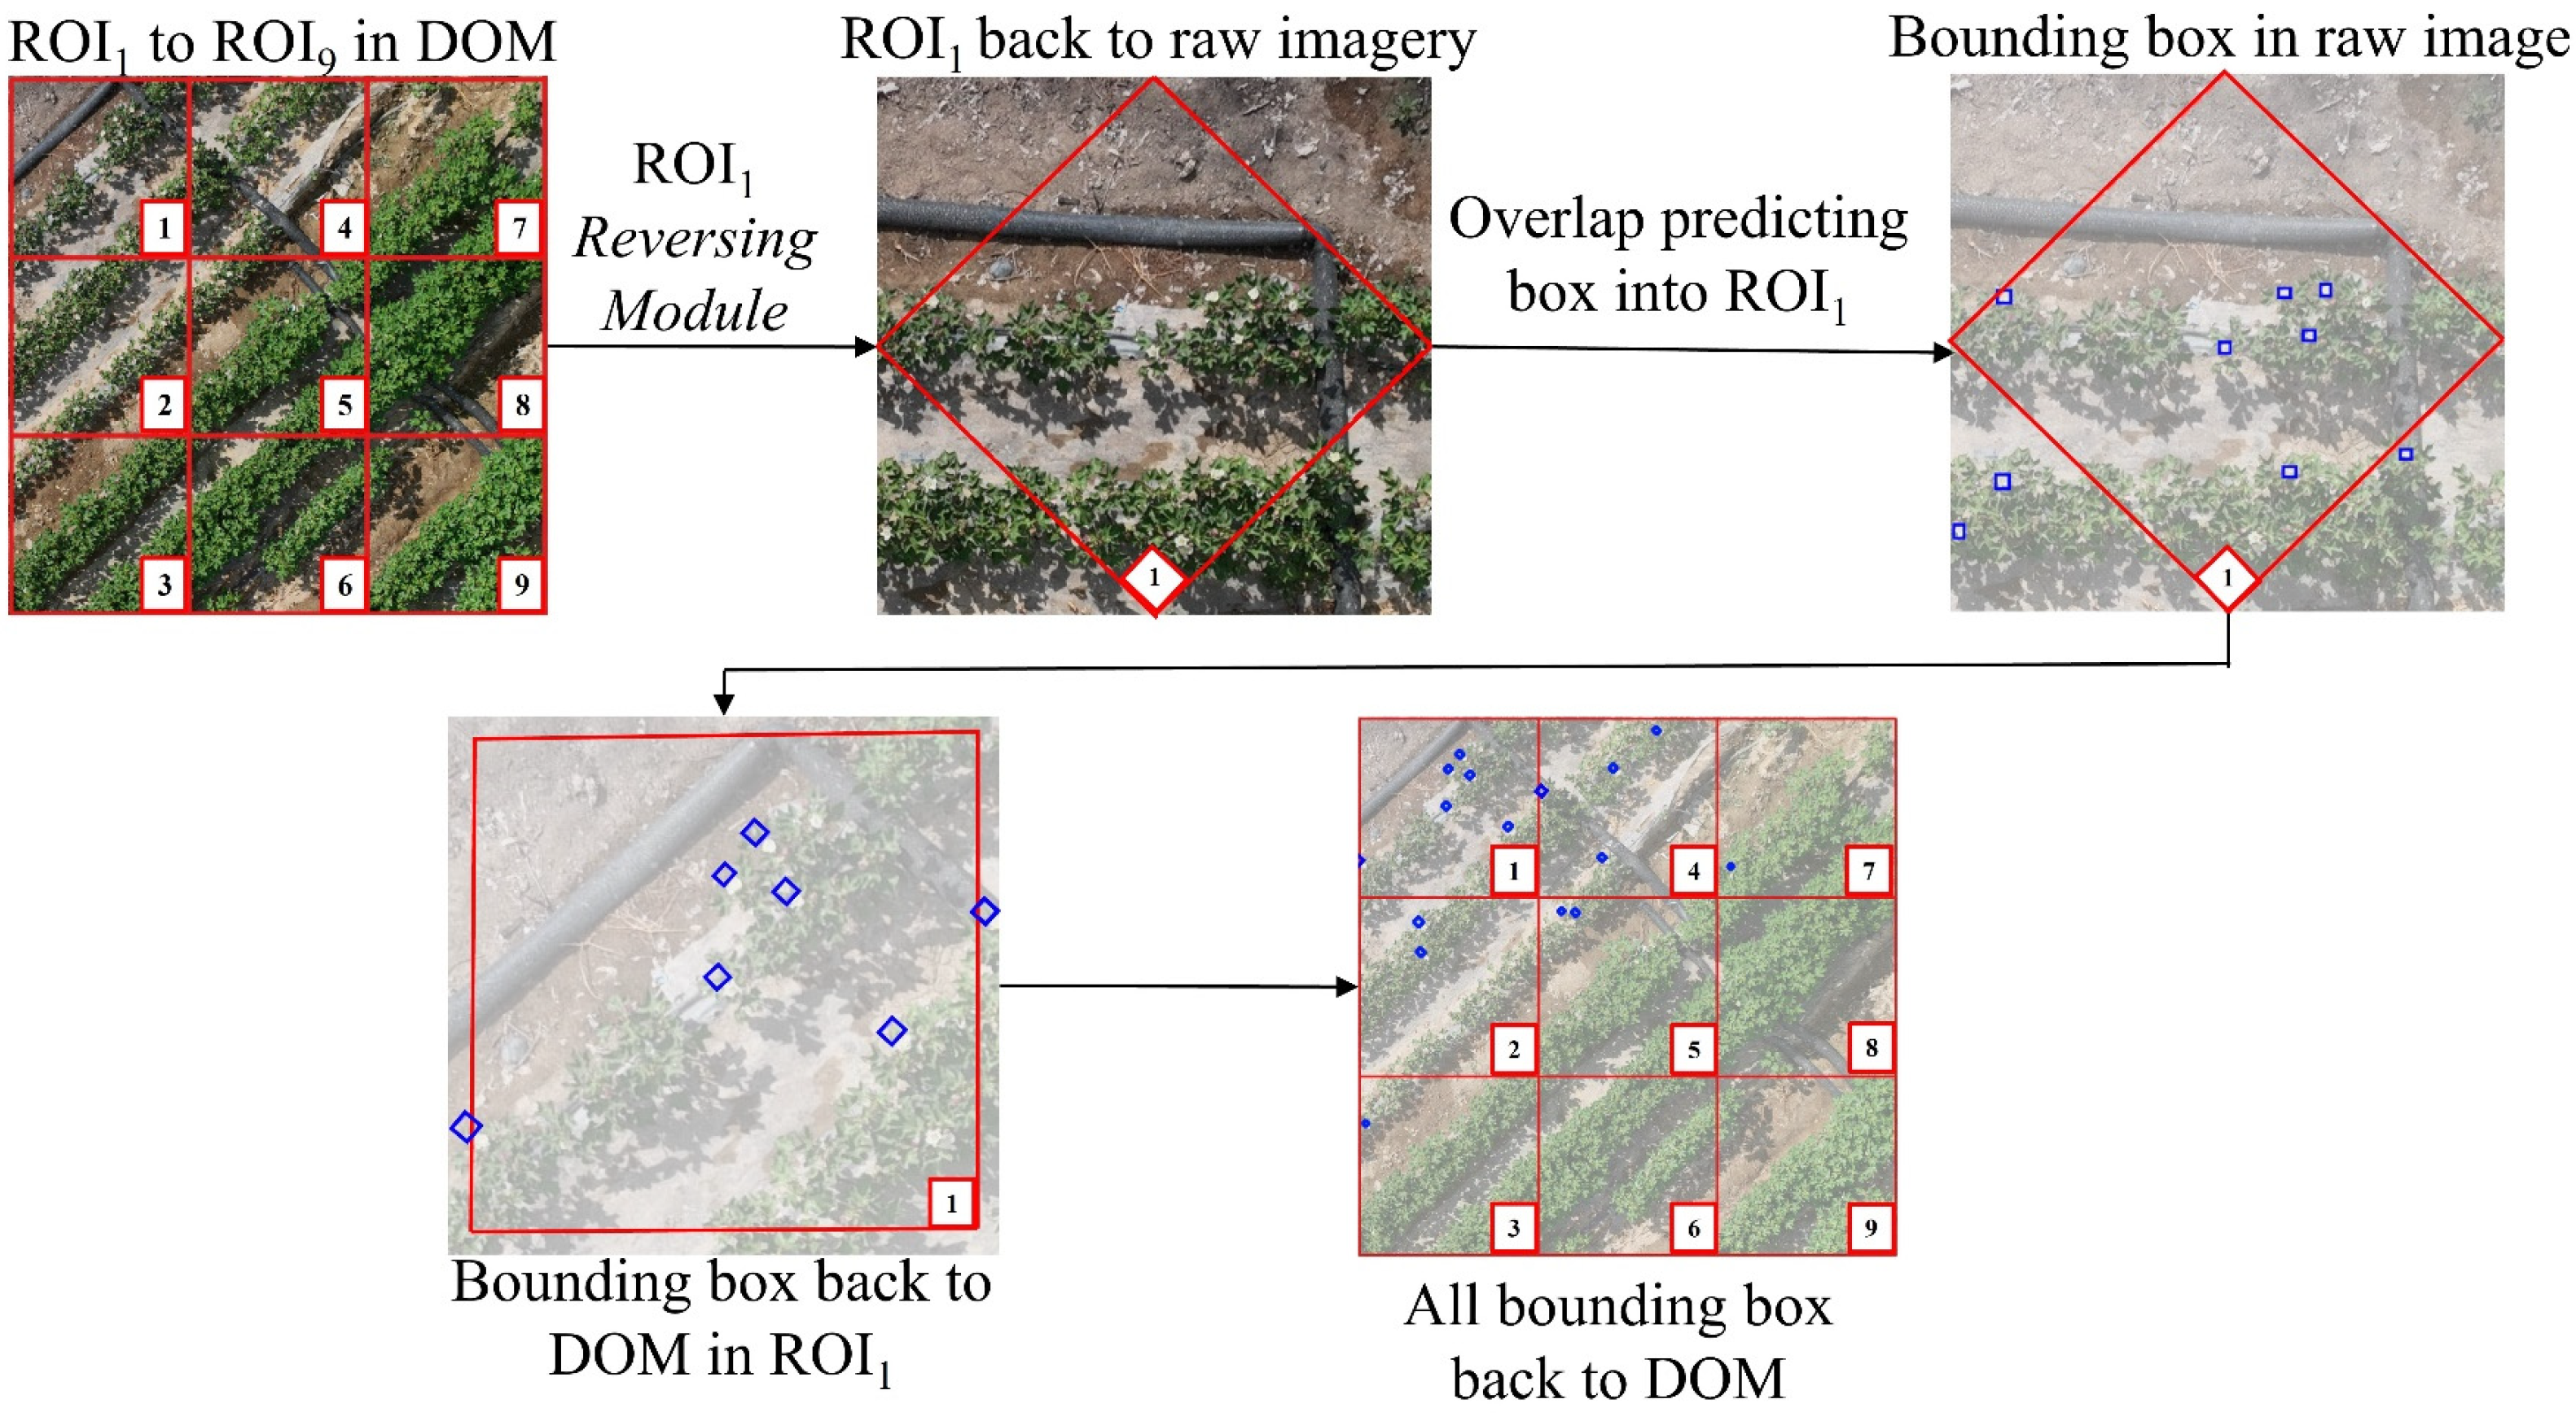
The ultimate objective of this study extends beyond merely detecting crop canopy objects within UAV raw image; it aims to accurately map these target locations back onto the Digital Orthophoto Map (DOM). To accomplish this, the EasyIDP framework was employed. As illustrated in
Figure 7, a portion of the DOM was selected and divided into nine regions of interest (ROIs), labeled ROI
1 through ROI
9, with ROI
1 used as a demonstration example. First, EasyIDP's Reversing Module mapped ROI
1 back to the raw image, where prediction boxes for crop canopy objects within ROI
1 (derived from SAHI results) were calculated and identified. Then, using EasyIDP's forward mapping function, the ROI, along with its prediction boxes, was mapped back onto the DOM. By repeating this process, the precise locations of all crop canopy objects within the DOM were obtained. Based on the distribution density and quantity of these objects, insights into crop growth status and developmental stages were further evaluated.
2.8. Implementation
For detailed information on the hardware platform and software environment used for training and testing, the experiments were conducted on a system equipped with a Tesla V100-SXM-2 GPU with 32 GB memory, an Intel Xeon(R) Gold 6226R v4 CPU operating at 2.90 GHz with 64 cores, and 256 GB of RAM. The operating system was Ubuntu 20.04 LTS, with PyTorch 1.12 serving as the tensor library and CUDA 11.5 enabling GPU acceleration. Python 3.8 was used as the programming language.
Appendix A compares the training parameters across the YOLOv8 to YOLOv10 series, ultimately leading to the selection of YOLOv10n as the base detection model in this study.
3. Results
3.1. Comparison of SAHI-YOLOv10n in Detecting Canopy Targets on Raw Image and DOM
Appendix Figure A1 illustrates the resolution limitations for detecting organ level objects in DOM. To further validate and compare the differences in detecting canopy objects on raw image and DOM, SAHI was applied to detect the four types of crop canopy objects collected in this study. In
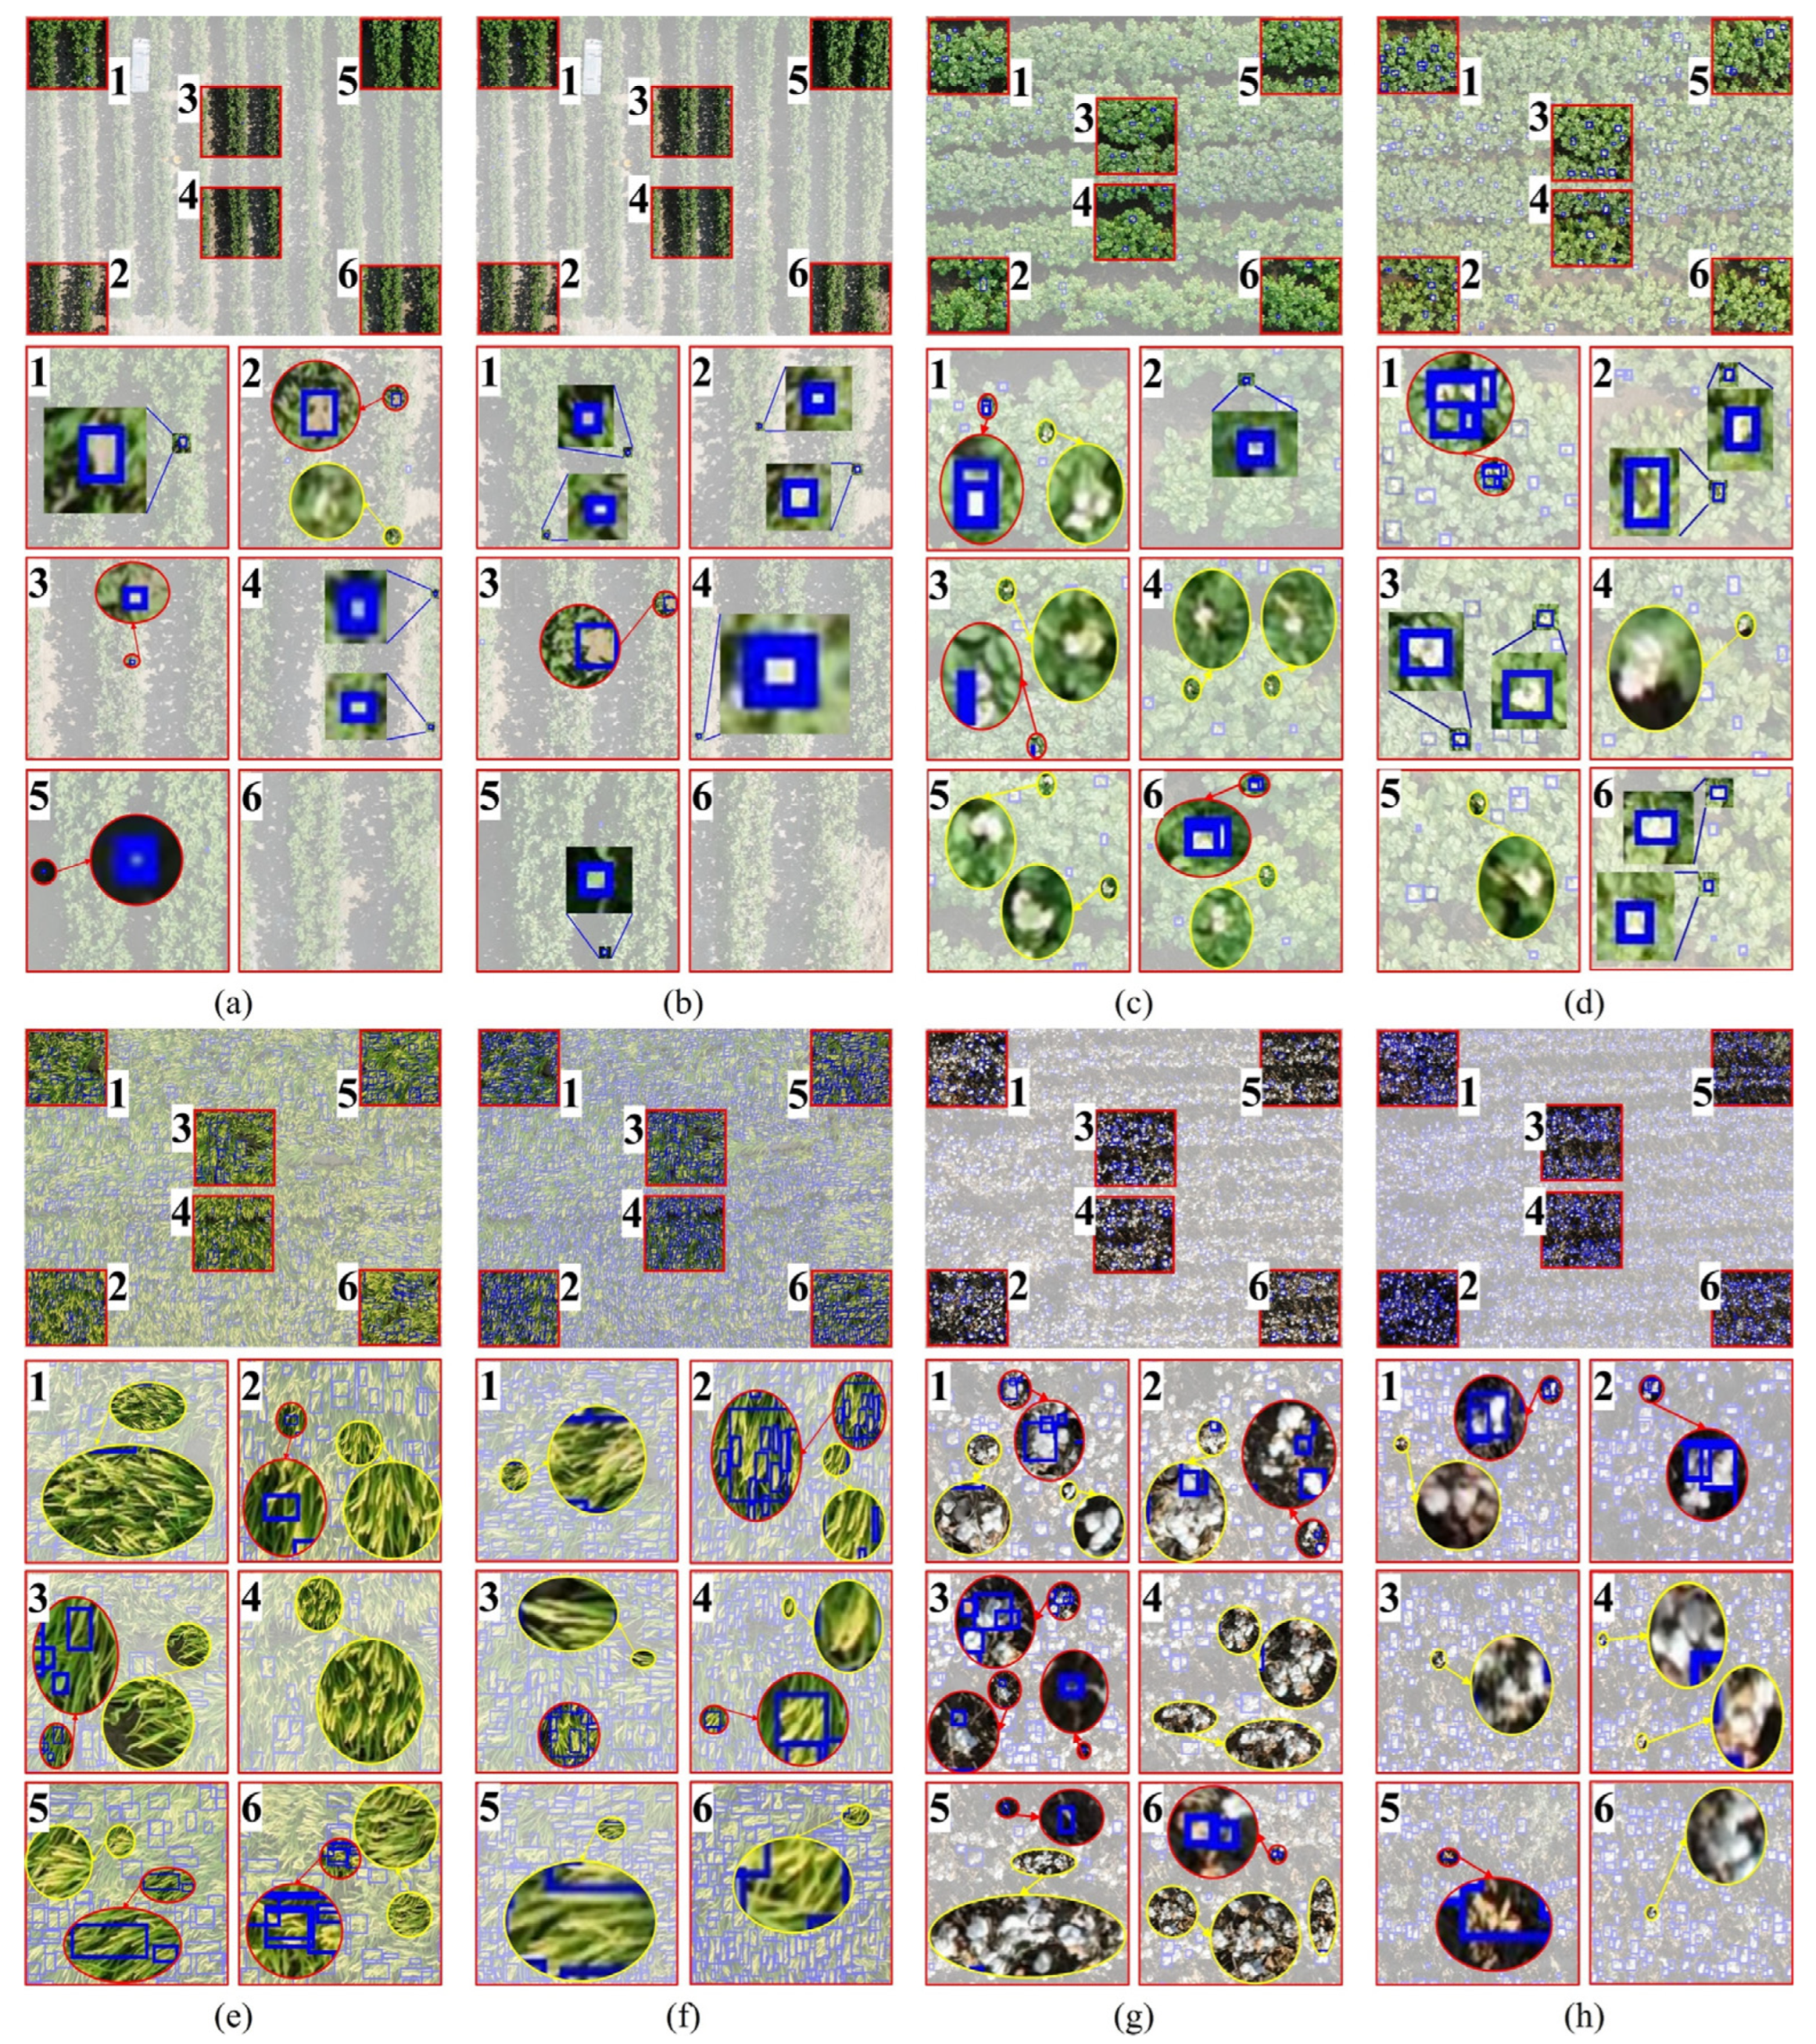
Figure 8, panels (a), (c), (e), (g) and (b), (d), (f), (h) represent the detection results for cotton flowers, potato flowers, rice panicles, and cotton bolls in DOM and raw image of the same regions, respectively. Sub-figures (a1) to (h6) in
Figure 8 display selected subregions from panels (a) to (h), respectively.
Figure 8(a) through
Figure 8(h) illustrate an increasing density and complexity in the distribution of cotton flowers, potato flowers, rice panicles, and cotton bolls. In general, cotton flowers in the canopy are the most sparsely distributed and have the smallest target size; however, after defoliation treatment during the cotton maturity phase, the absence of leaves causes cotton bolls to become more densely clustered. Compared to cotton flowers, potato flowers exhibit a higher density with relatively even distribution. Rice panicles display the most complex distribution pattern due to their slender morphology, presenting varying shapes in the orthogonal view. Overall, SAHI achieves higher detection precision for crop canopy objects in raw image than in DOM, mainly because the higher image quality of raw image provides clearer target features within the crop canopy.
Figure 8 (a1-h6) illustrate the comparison of crop canopy target detection by SAHI in DOM and raw image. Red circles indicate false detections, while yellow circles denote missed detections. Through comparative analysis, the primary causes of false detections are identified as follows:
Low quality and image distortion introduced during the DOM reconstruction process. Sub-figures (a2) to (a5) show instances where light spots and fallen leaves are misidentified as cotton flowers. In sub-figures (c1) to (c5), a single potato flower is mistakenly detected as two, while in sub-figures (e1) to (e6), rice leaves are misidentified as rice panicles. In sub-figures (g1) to (g6), cotton bolls are incompletely detected, and a single cotton boll is sometimes detected as two;
These issues are effectively mitigated in raw image; however, occasional duplicate detections occur when crop canopy objects are densely clustered. In such cases, multiple detected objects may have a larger detection frame encompassing them, mainly because the algorithm misinterprets the combined edges of densely packed objects as a single feature.
The primary causes of missed detections are as follows:
- 3.
Low quality and image distortion in DOM reconstruction lead to blurred features of crop canopy objects. As target complexity increases, missed detections become more pronounced, particularly for rice panicles and cotton bolls, as shown in sub-figures (e1) to (e6) and (g1) to (g6);
- 4.
In raw image, missed detections are mainly attributed to the complexity of the crop canopy objects. Although missed detections are generally less frequent in raw image compared to DOM, partial omissions of rice panicles and cotton bolls can still be observed in sub-figures (f2) to (f5) and h(4).
In the previous section, we qualitatively analyzed the detection performance of organ level objects in DOM and raw image. To further quantify these results,
Table 2 summarizes the number of organ level objects identified in sub-figures (a1) through (h6) in
Figure 8.
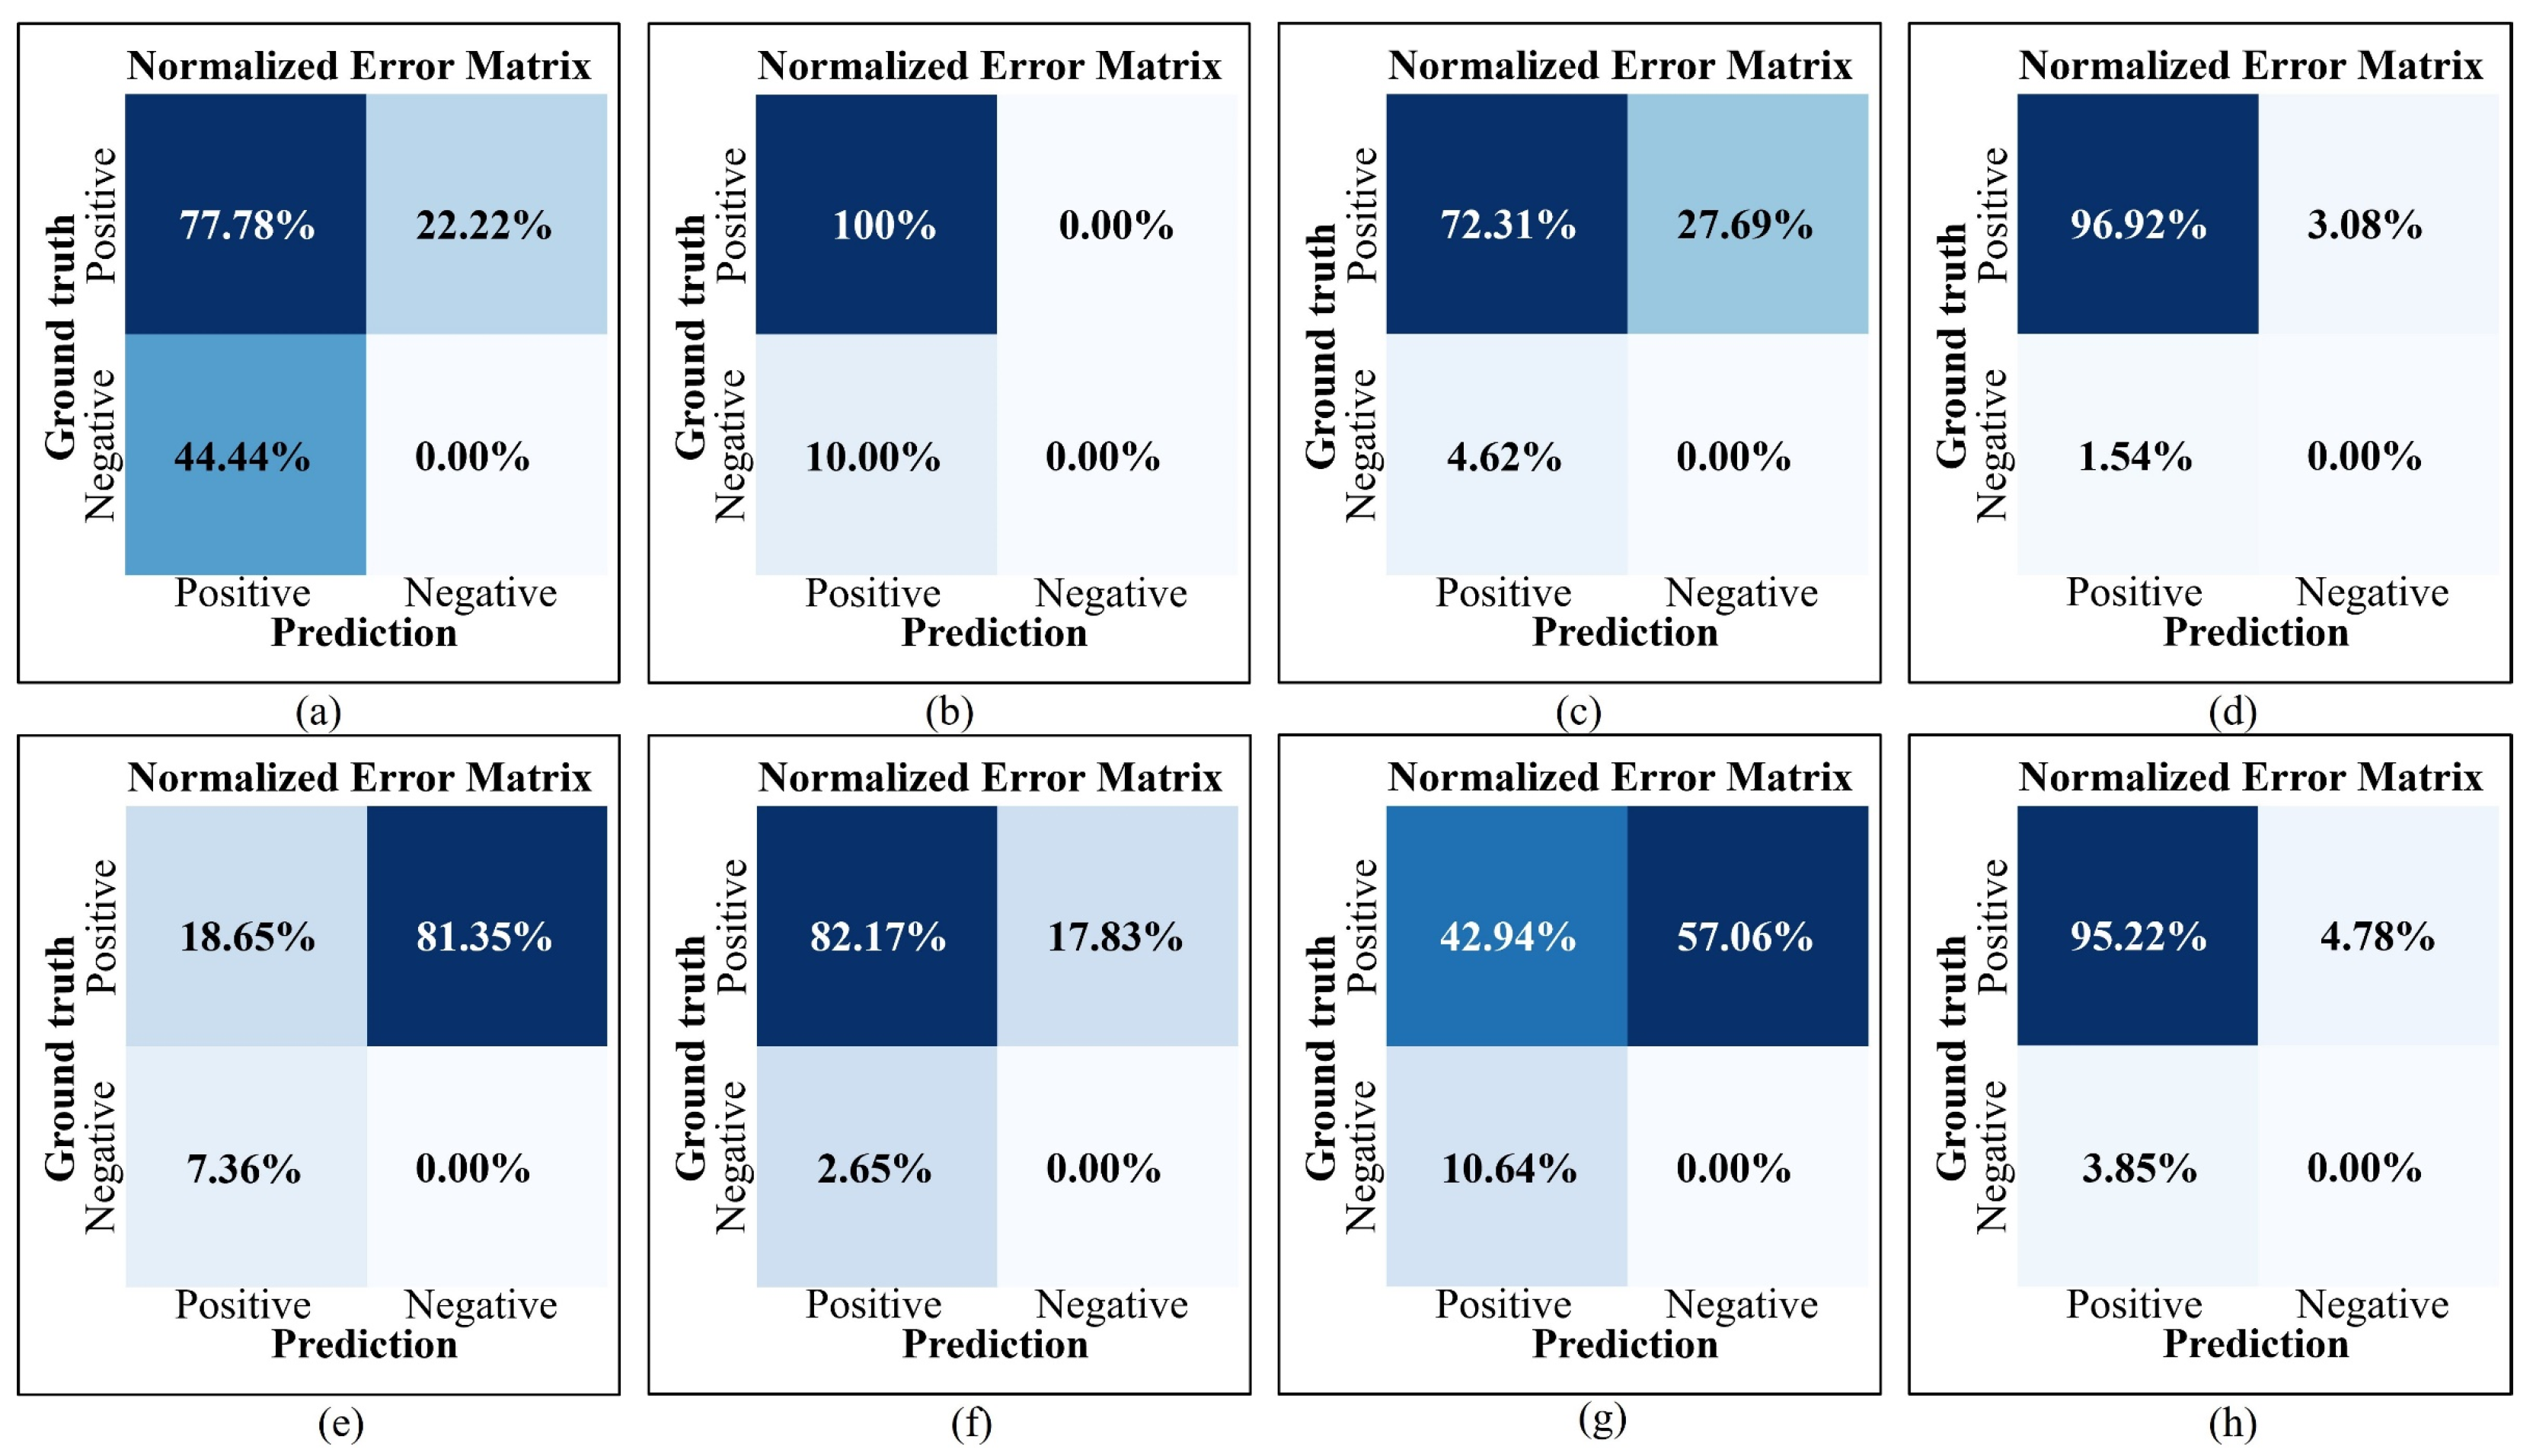
Figure 9 presents the error matrices for the four types of organ level objects derived from these data. The analysis of
Table 2 and
Figure 9 yields the following results:
- 5.
The limited number of cotton and potato flowers in individual sub-figures led to extreme cases where omission (Omission) and error (Error) rates reached 100%, as observed in sub-figures (a3) and (b3). However, such extreme cases do not adequately represent the overall detection accuracy of DOM and raw image. From an overall perspective, the omission count for cotton flowers in sub-figures (a1) to (a6) was 2, accounting for 22.22% of the total Ground truth, while the error count was 4, accounting for 44.44%. In contrast, the corresponding omission and error rates for cotton flowers in sub-figures (b1) to (b6) were 0% and 10%, respectively. Similar trends were observed for potato flowers: sub-figures (c1) to (c6) exhibited omission and error rates of 27.69% and 4.62%, respectively, while sub-figures (d1) to (d6) showed rates of 3.08% and 1.54%, respectively. With increasing complexity and density of the detection objects, omission and error rates increased significantly, especially in DOM. For example, the omission rate of rice panicles in DOM sub-figure (e1) reached 88.67%, whereas the highest omission rate in raw image sub-figure (f5) was 21.88%, a reduction of 66.79% compared to DOM. This analysis highlights that detection based on raw image achieves significantly higher precision;
- 6.
Figure 9 illustrates the normalized error matrices derived from the data in
Table 2. The comparison shows that, compared to DOM, the TP rates for cotton flowers, potato flowers, rice panicles, and cotton bolls in raw image increased by 22.22%, 24.31%, 63.52%, and 52.28%, respectively. Simultaneously, the FP rates decreased by 34.44%, 3.08%, 4.71%, and 6.79%, respectively, and the FN rates decreased by 22.22%, 24.61%, 63.52%, and 52.28%, respectively. These results confirm that raw image delivers superior detection accuracy, particularly for organ level objects with higher complexity and density.
3.2. Evaluating EasyIDP for Mapping Raw Image-based Detection Results to DOM
In
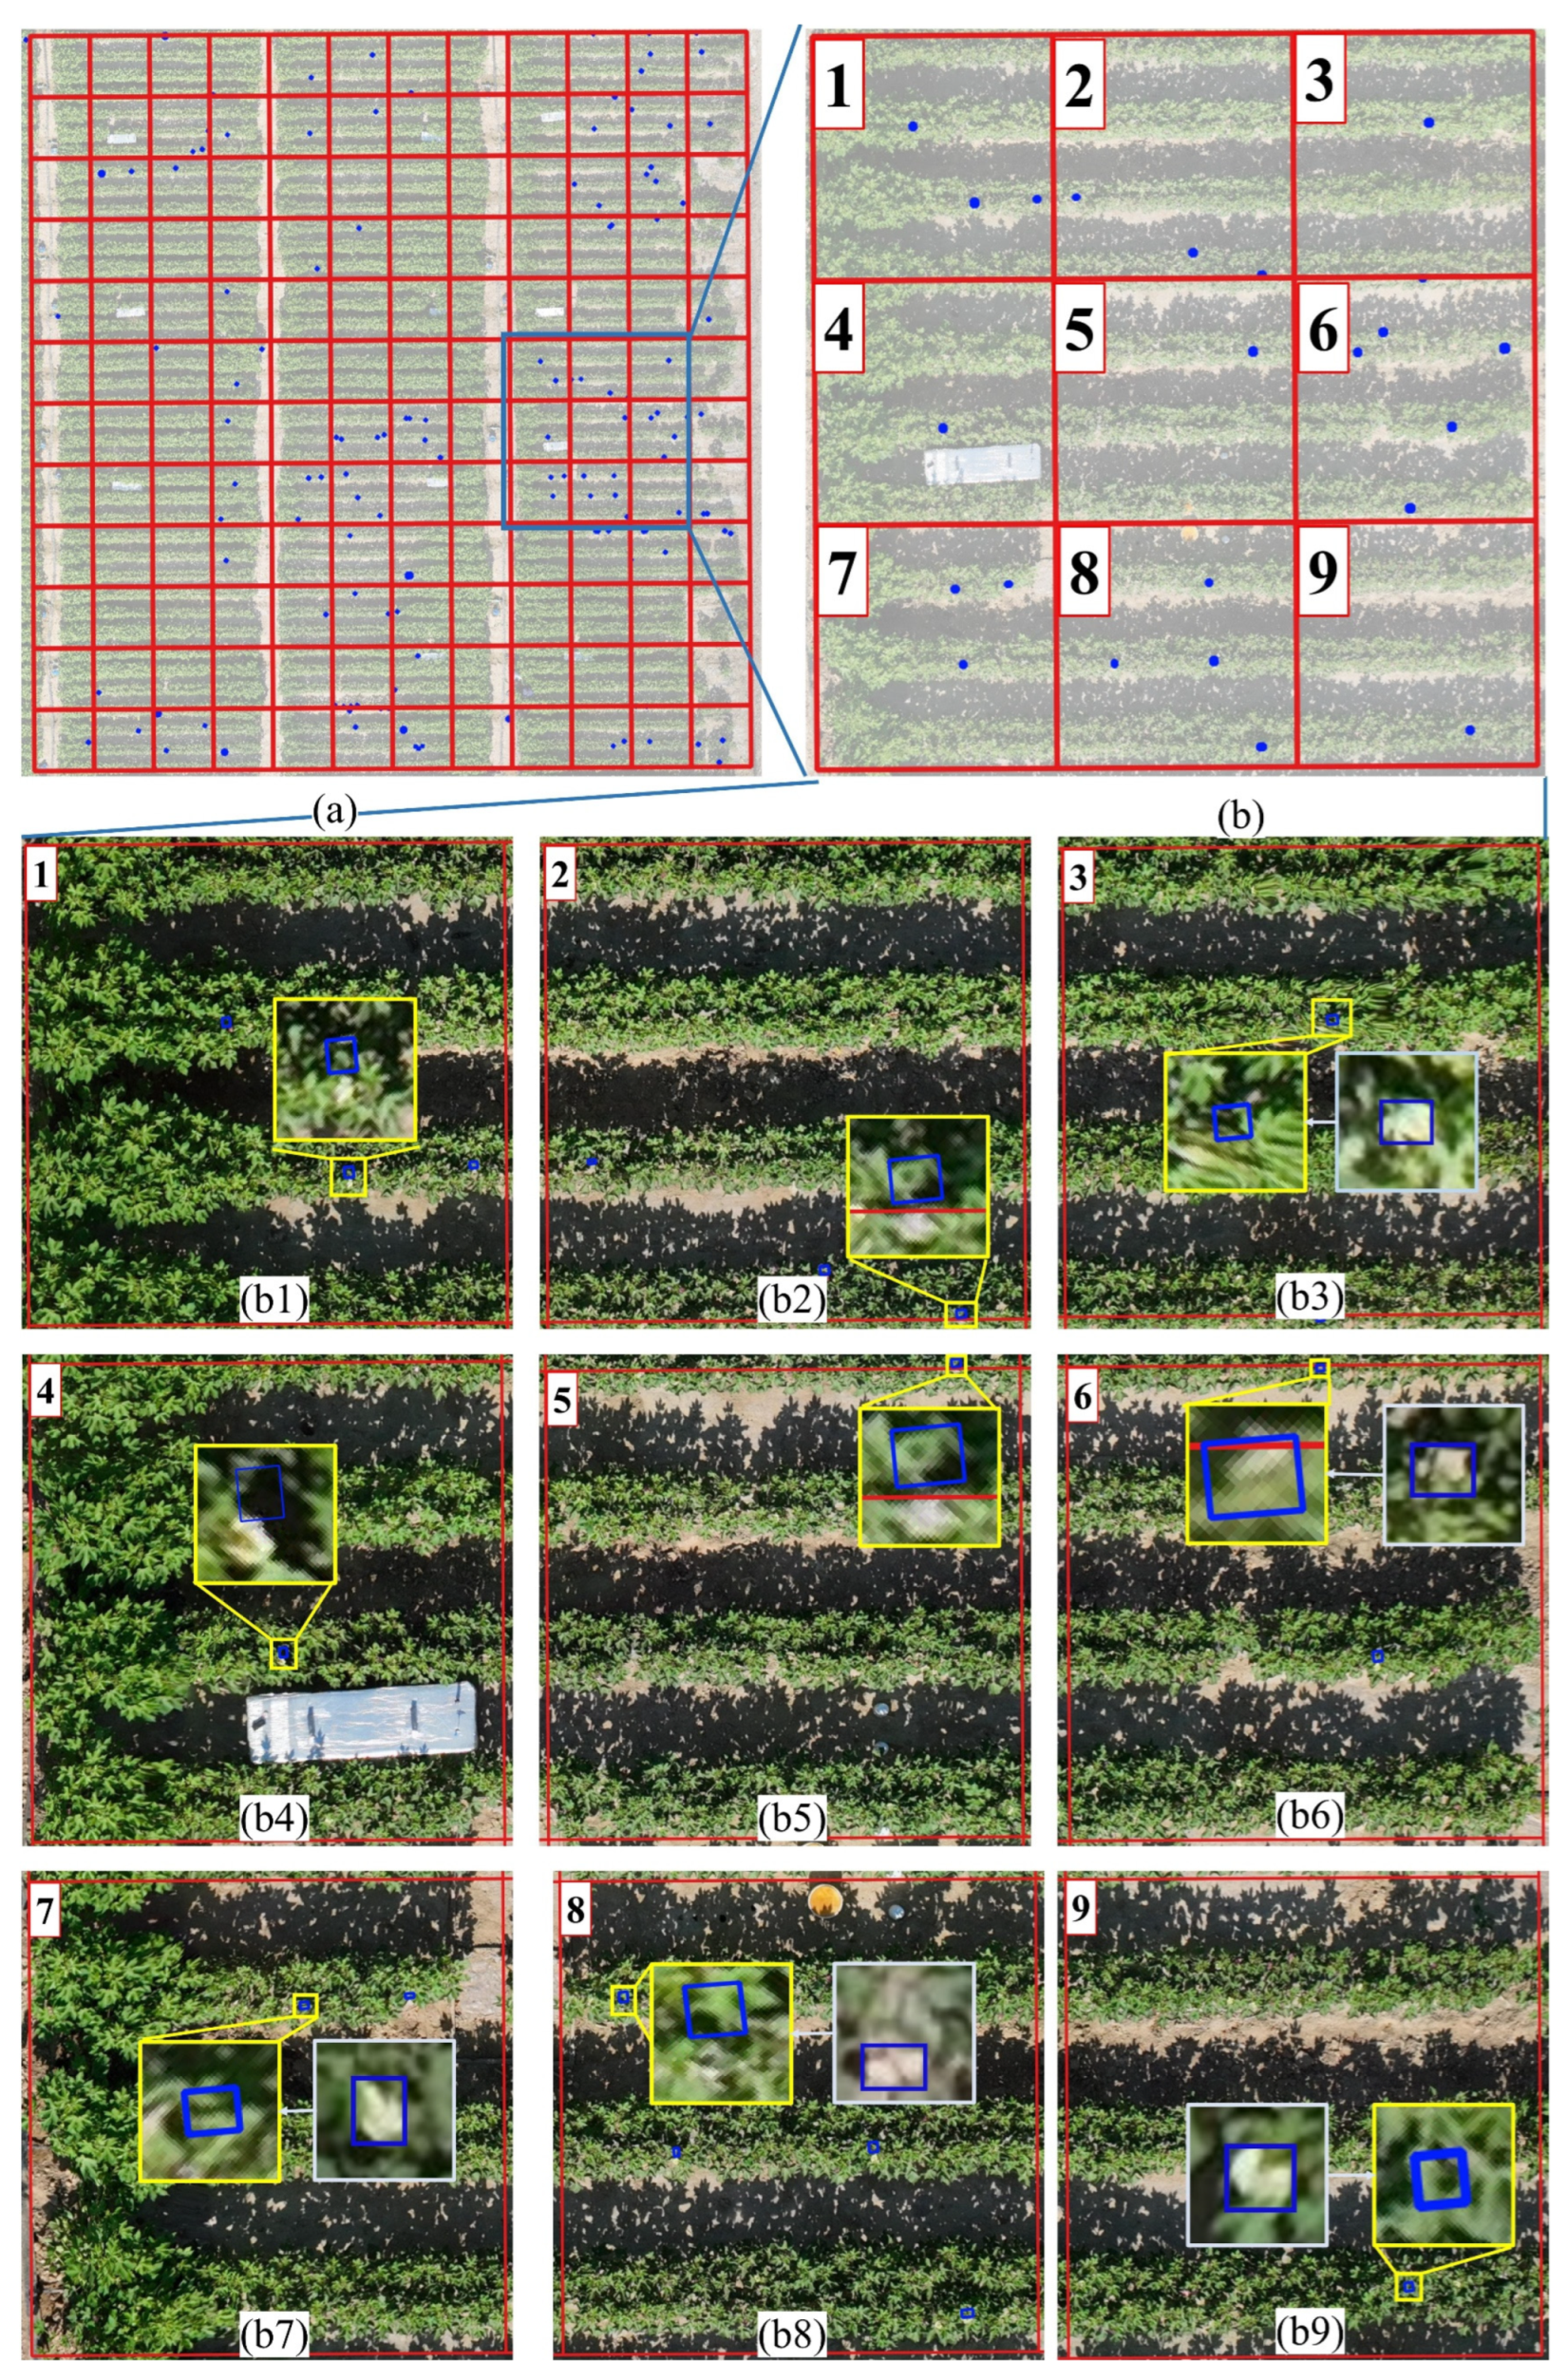
Section 3.1, the detection performance of crop canopy objects in both DOM and raw image was analyzed, with the finding that detection precision was higher for crop canopy objects in raw image. This section will analyze the effectiveness of EasyIDP in mapping crop canopy target prediction boxes from raw image to DOM. To facilitate a clear and concise analysis of EasyIDP's performance, cotton flowers, which exhibit the lowest density distribution, were selected as the analysis case in
Figure 10.
Figure 10(b) is derived from the 9 ROIs in
Figure 10(a).
Figure 10(b1) to
Figure 10(b9) correspond to ROI
1 to ROI
9, with yellow boxes representing the local magnified DOM images, and light blue boxes indicating the corresponding regions in raw image. Based on the analysis, the following results were drawn:
- 7.
Mapping Displacement: As shown in
Figure 10(b1) and (b4), EasyIDP effectively maps the crop canopy target prediction boxes to the DOM; however, slight positional deviations are observed. The causes of these minor deviations were analyzed, revealing that the fisheye lens on the DJI M3M UAV introduces lens distortion, which impacts mapping accuracy. This distortion causes unavoidable georeferencing discrepancies when converting ROIs and raw image into geographic coordinates, leading to mapping errors;
- 8.
Compensation for DOM's Resolution Deficiencies by EasyIDP: As shown in the yellow boxes in
Figure 10(b3), (b6), (b7) to (b9), DOM exhibits resolution defects, as shown in Fig. 3, which cause the cotton flower features within the yellow boxes to be severely blurred or even disappear during the reconstruction process. In this case, these features could not be detected in DOM. However, EasyIDP successfully maps the corresponding cotton flower prediction boxes from raw image to the same locations in DOM, effectively compensating for the resolution deficiencies of DOM;
- 9.
Mapping of Objects at ROI Edges: As shown in the yellow boxes in
Figure 10(b2), (b5), and (b6), cotton flowers are located on the outer edge of ROI
2, the inner side of ROI
5, and the edge of ROI
6. The corresponding prediction boxes are placed around the cotton flowers, indicating that EasyIDP can correctly process cotton flowers located at the edges of ROIs in DOM and accurately map the corresponding prediction boxes from raw image back to DOM.
3.3. Analysis of Crop Phenotypic Information Based on Mapped Detection Boxes in DOM
In
Section 3.1 and
Section 3.2, the performance of SAHI and EasyIDP in detecting crop canopy objects was discussed. To further illustrate the extraction of crop phenotypic information based on mapped prediction boxes in the DOM, we selected potato flowers, which exhibit moderate density and sample area, as an analysis case. As shown in
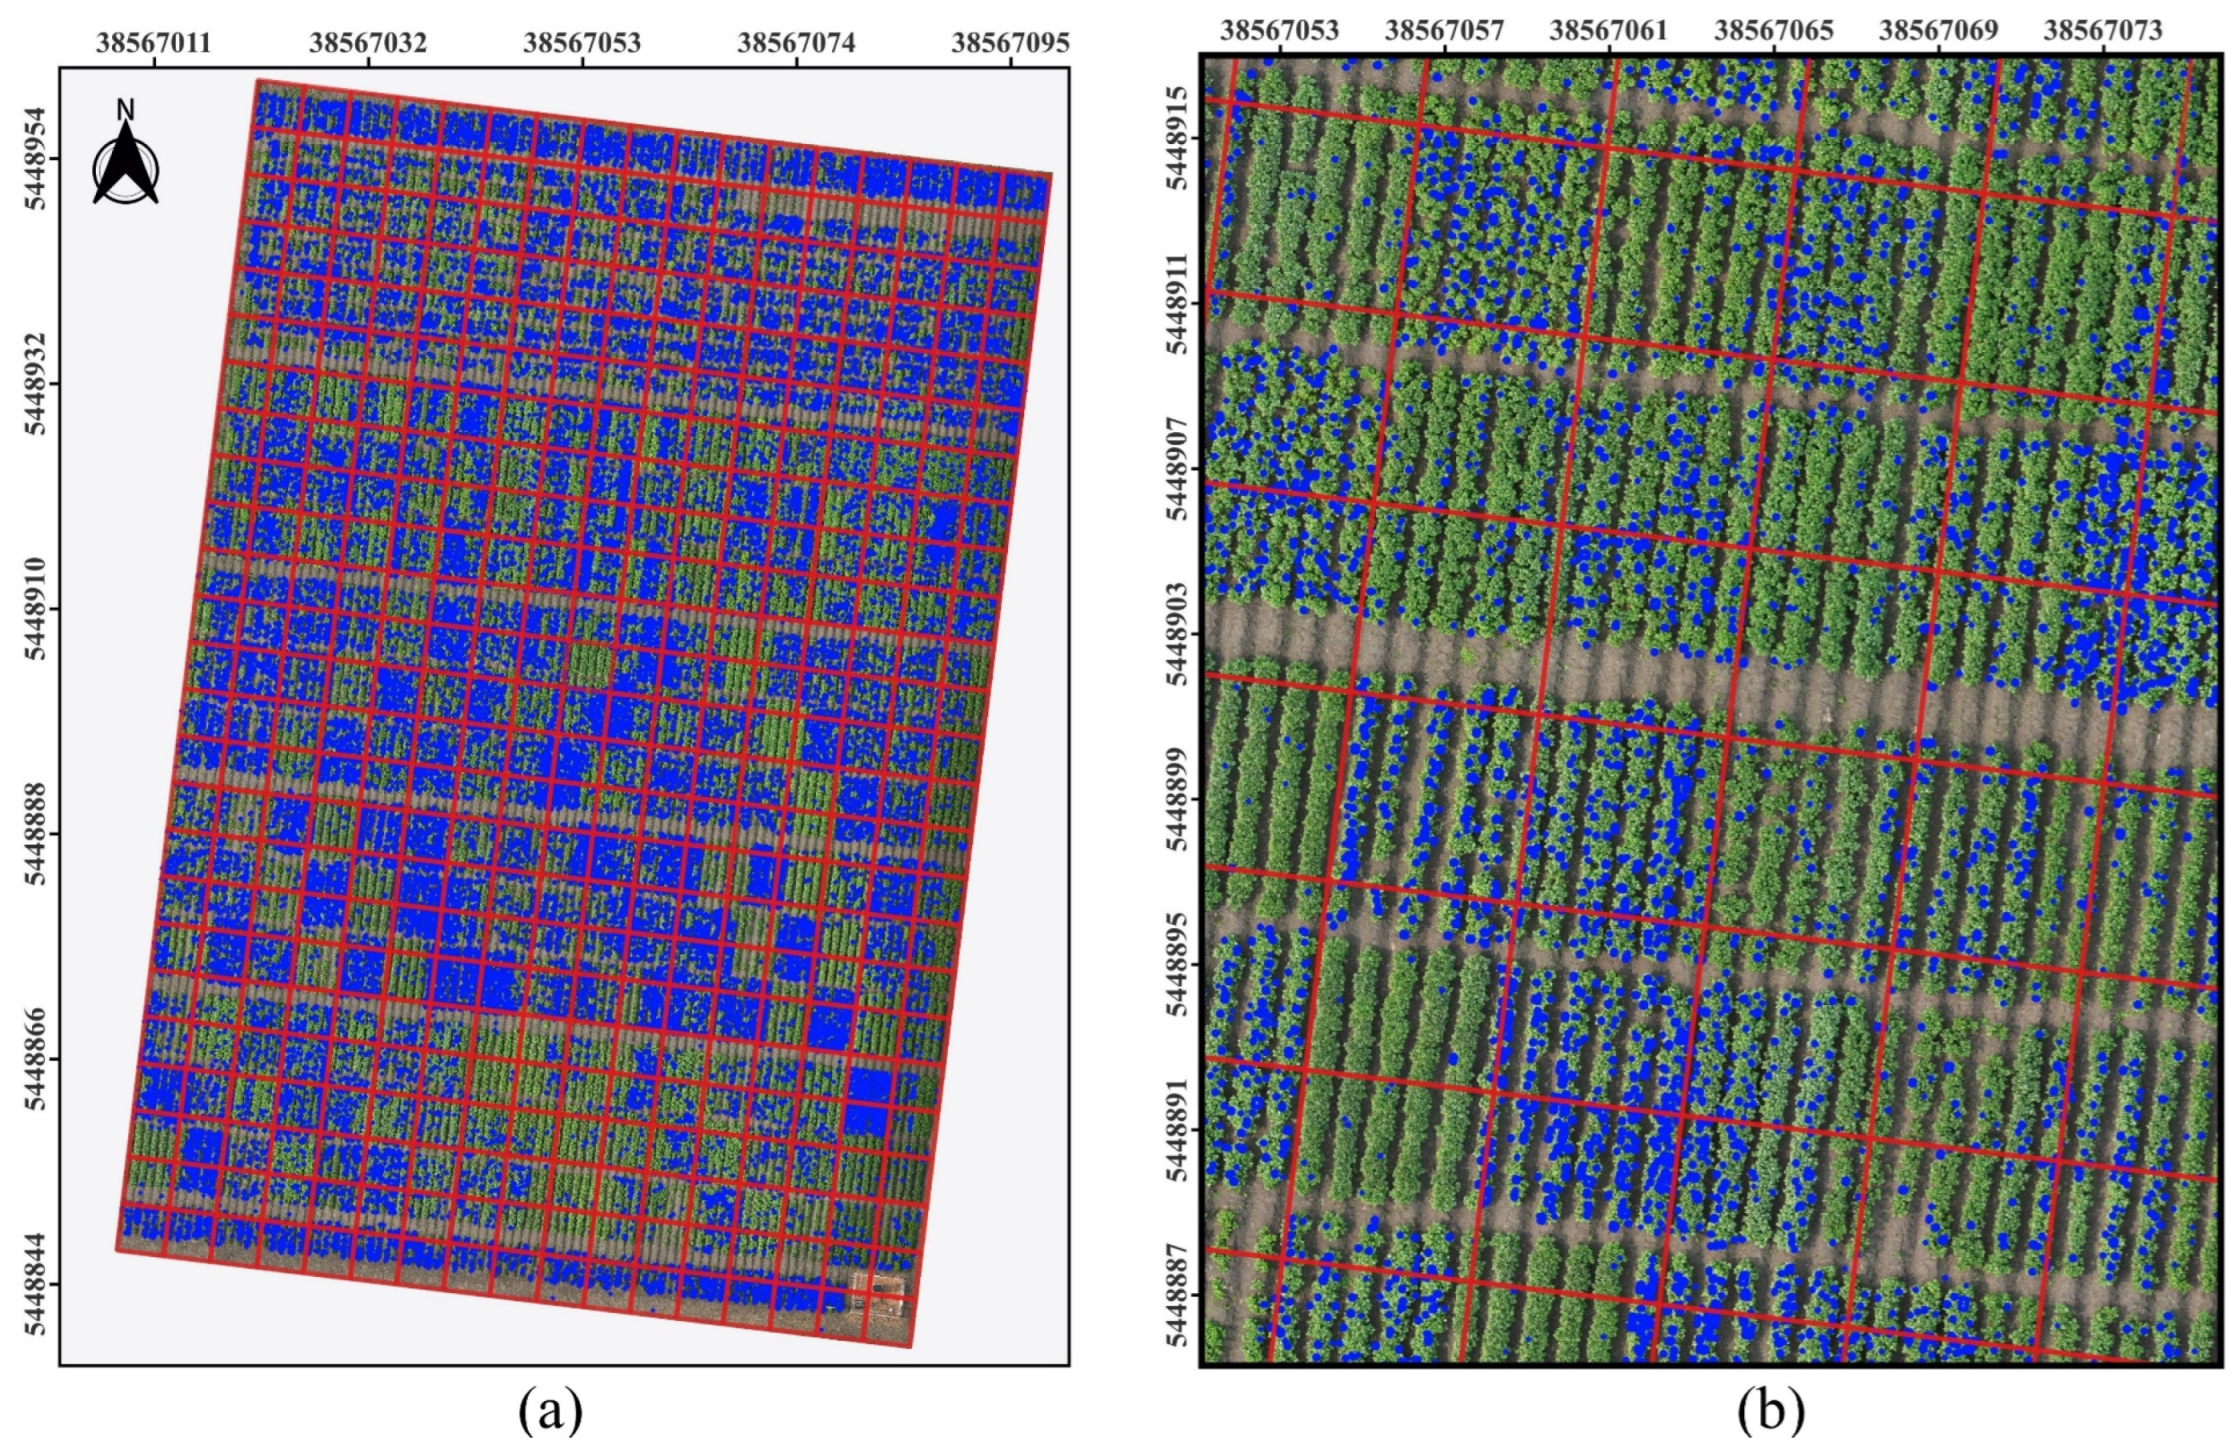
Figure 11(a), we examined a potato field with an area of 10,625 square meters. The x- and y-axes in
Figure 11 reference the EPSG:2413-Beijing 1954/3-degree Gauss-Kruger zone 37 coordinate system, with units in meters. From
Figure 11(a), it can be determined that this canopy region contains 31,385 potato flowers.
Figure 11(b) further indicates significant variability in flower density across different ROIs, which provides insights into the potato growth vigor and stages of the growth cycle. This information can, in turn, inform targeted agronomic practices such as optimizing irrigation schedules, adjusting fertilization rates, and predicting harvest times to improve crop yields.
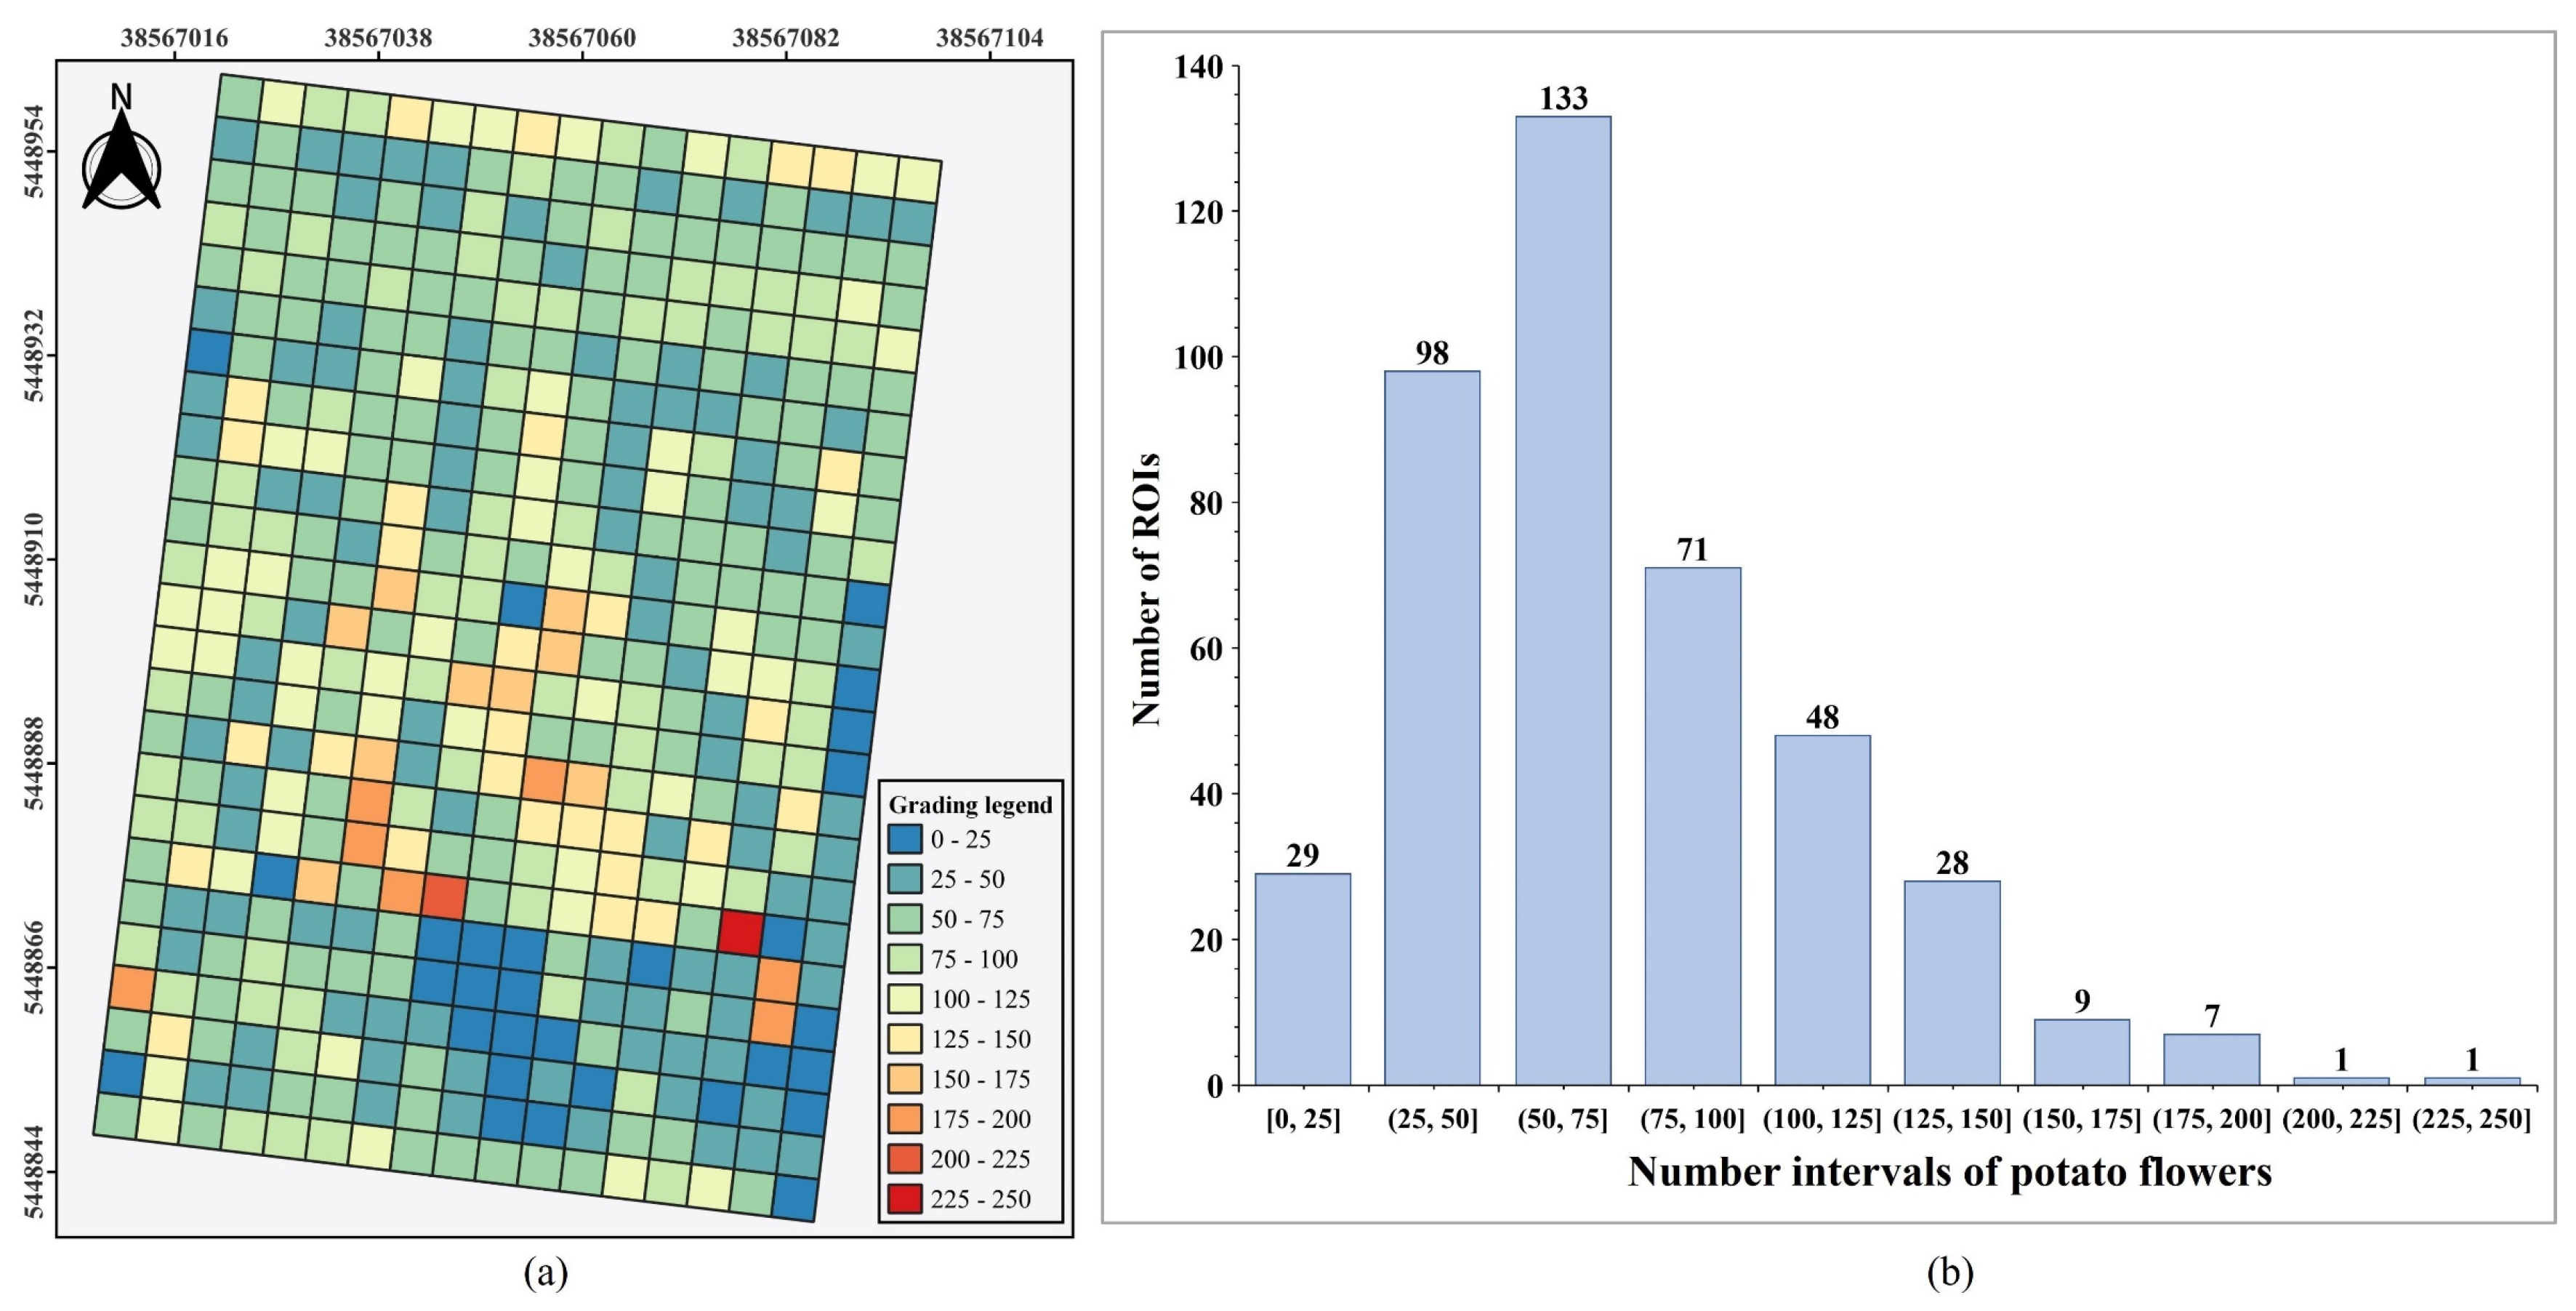
By analyzing the distribution of prediction box counts within each ROI, crop phenotypic information based on mapped prediction boxes in the DOM can be further clarified. As shown in
Figure 12(a), the number of prediction boxes within each ROI was calculated, grouped at intervals of 25, and visualized as a graded distribution map of potato flower counts. This graded map provides a clear view of the distribution of potato flowers across the sample field. Additionally,
Figure 12(b) presents a histogram of the count distribution across these intervals. For example, using the ROI size in this study (
), the area with potato flower counts in the range of (50, 75] covered the largest blooming area at 3,325 m², while areas within the (150, 250] range occupied only 450 m².
Together, the results from
Figure 11 and
Figure 12 offer a more holistic understanding of the crop growth status and development stages at both macro and micro levels, providing valuable data support for precise agricultural management decisions.
4. Discussion
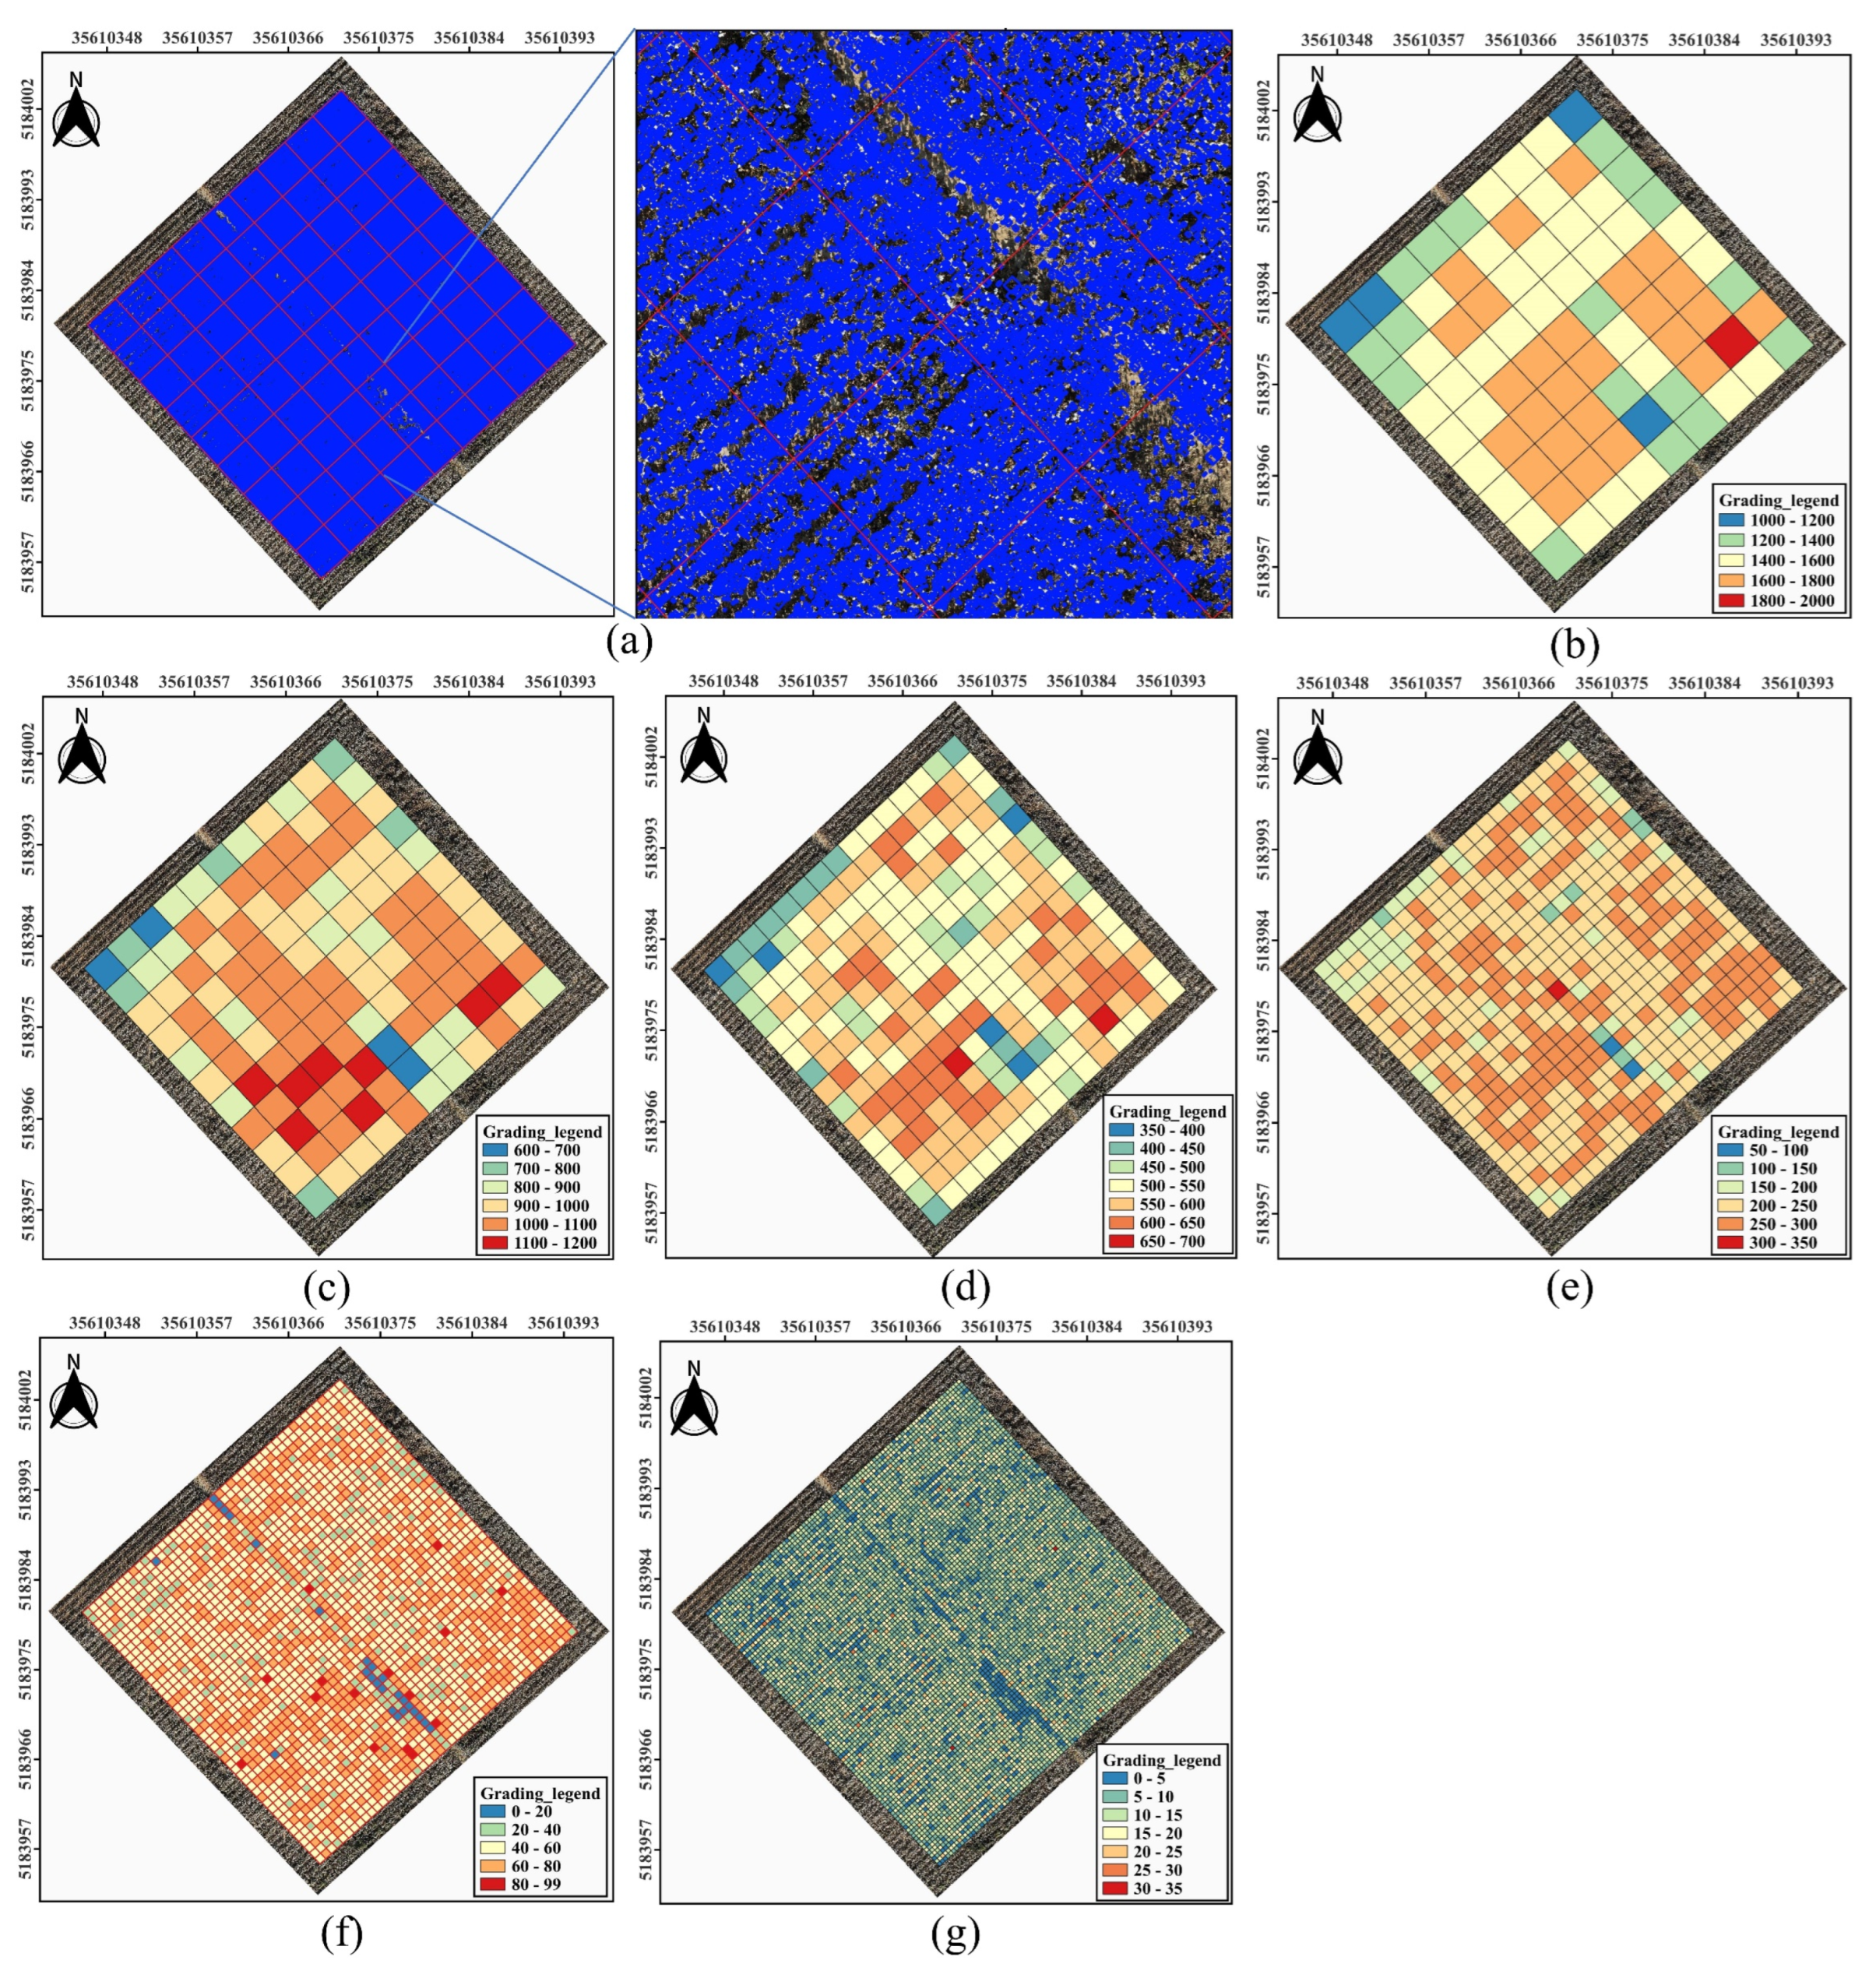
In this section, the limitations of the proposed method under complex scenarios, as well as directions for future improvements and applications, are discussed. As shown in
Figure 13, a high-density cotton boll canopy sample plot in the DOM was selected, and different ROI sizes of 5m, 4m, 3m, 2m, 1m, and 0.5m square were defined to compare the performance of EasyIDP in mapping prediction boxes from raw image to the DOM. It was observed that as the ROI size decreased, the computation time for mapping prediction boxes significantly increased, with times recorded as 0.81, 2.17, 3.41, 13.6, 40.14, and 153.91 minutes for ROI sizes of 5m, 4m, 3m, 2m, 1m, and 0.5m, respectively.
Figure 13(a) illustrates the mapping results for ROI sizes of 5m, enabling the extraction of cotton boll counts within each individual ROI.
To further extract phenotypic information from the ROIs,
Figure 13(b) to (h)present the canopy cotton flowers density grading maps for the different ROI sizes. The grading_legend in these figures represents the count of cotton flowers within each ROI. By comparing the density grading maps of varying ROI sizes in
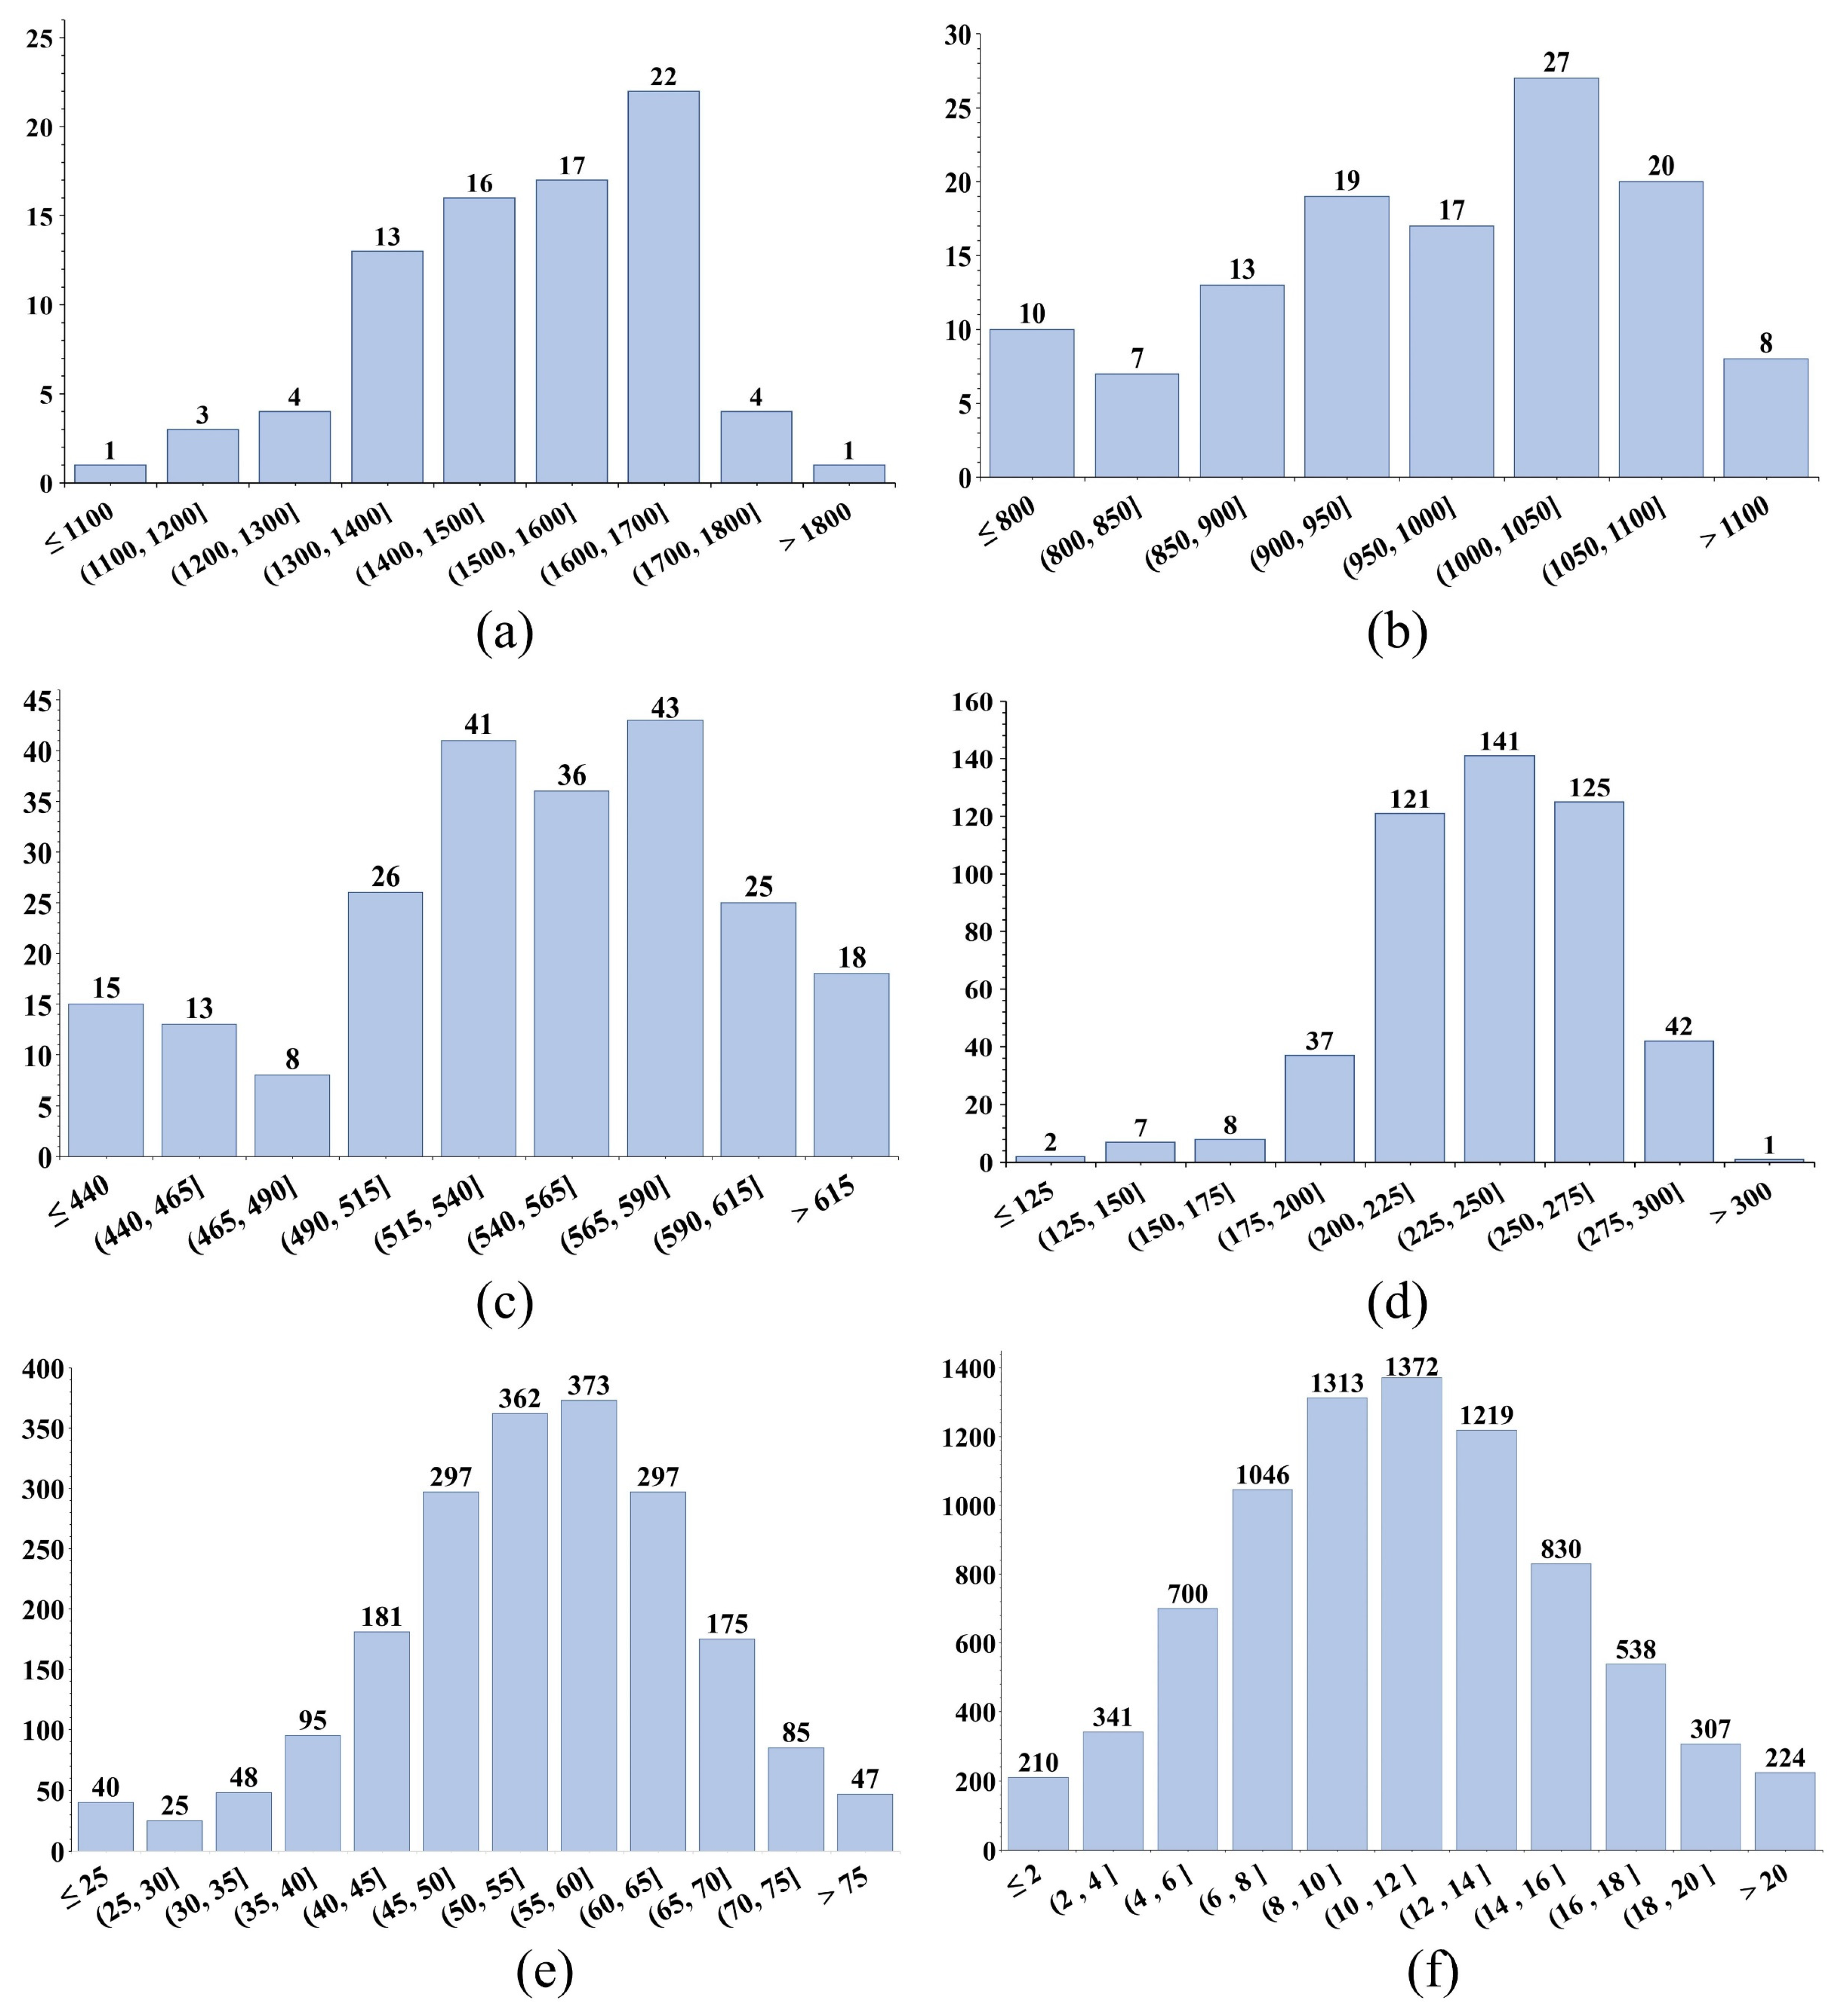
Figure 13(b) to (h) with the density histograms in
Figure 14, it was found that smaller ROIs yield more precise density statistics. Specifically, with an ROI size of 0.5m in
Figure 13(h), the density grading map effectively highlights gaps within the cotton fields, while the corresponding density histogram in
Figure 14(f) shows a clearer normal distribution. This observation suggests that smaller ROI sizes produce density grading maps that more accurately reflect the growth patterns of the cotton canopy. As the ROI size decreases, the grading_legend becomes more detailed, further underscoring the advantage of smaller ROIs in capturing refined density distribution. Consequently, different agricultural monitoring applications may select appropriate ROI sizes according to specific phenotypic information requirements.
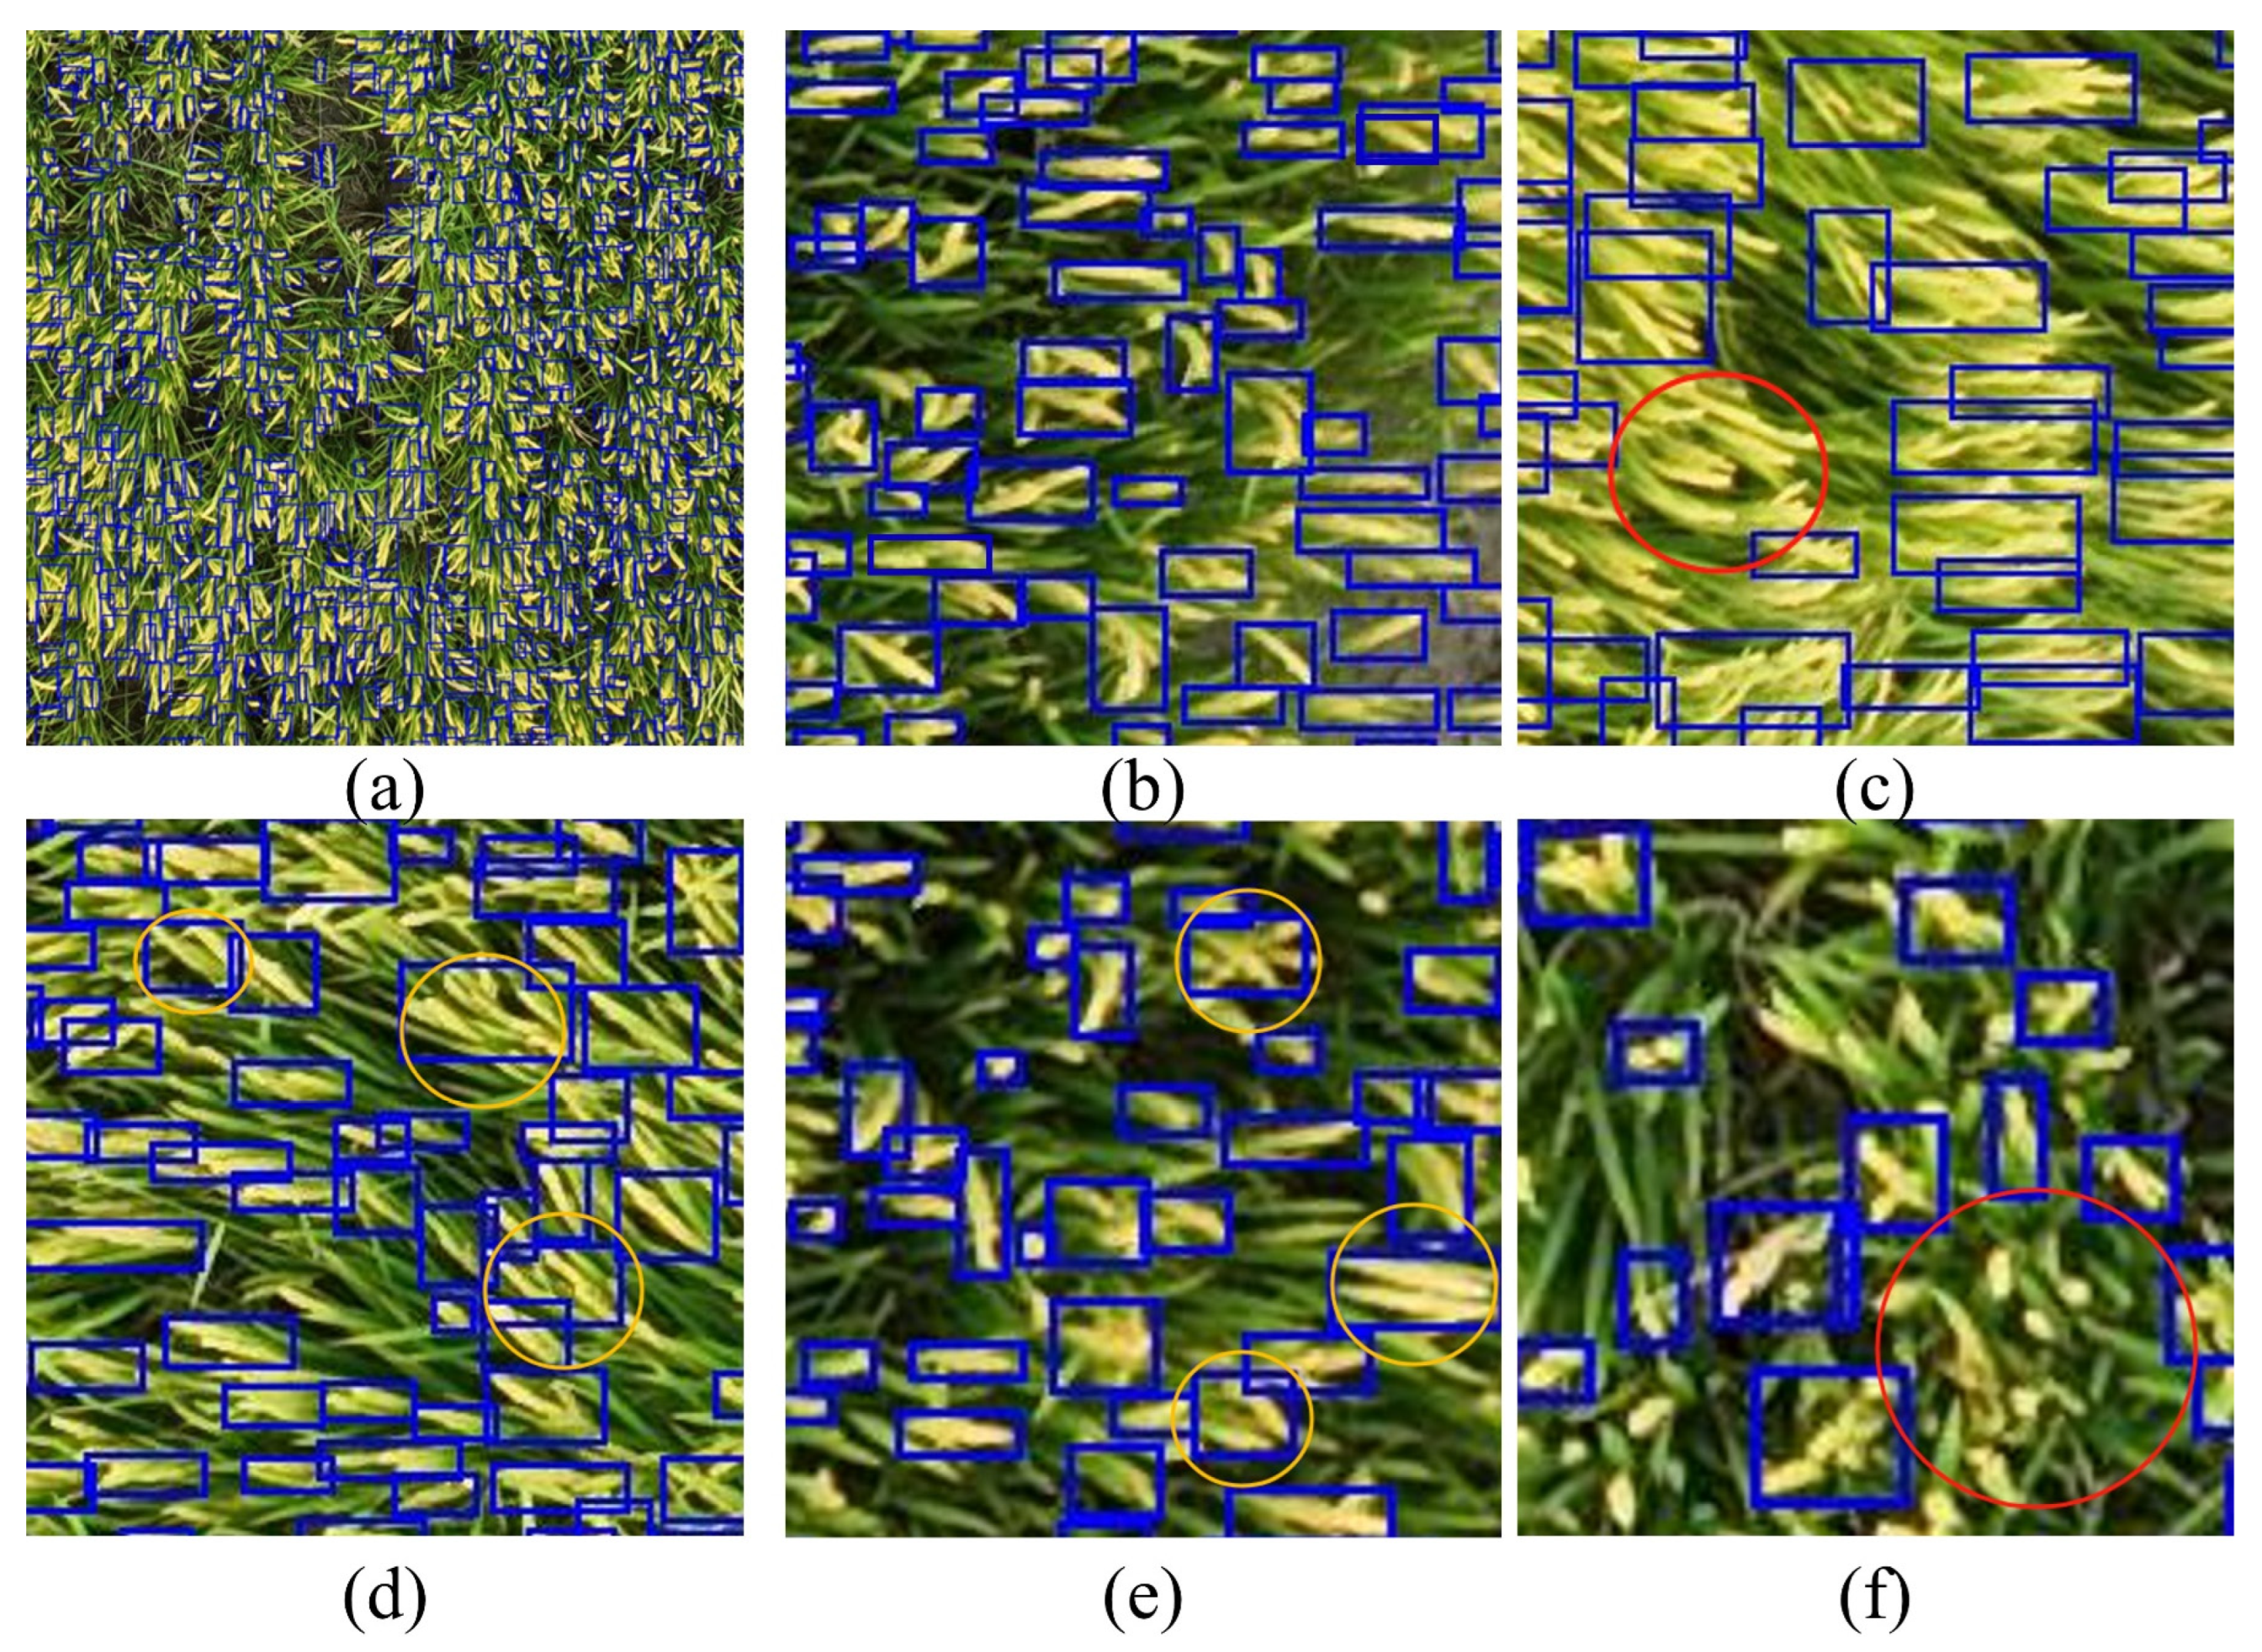
High-density distribution is one of the complex scenarios in crop canopy target detection. Additionally, the morphology of crop canopy objects significantly affects detection precision. To examine this, we selected the morphologically complex rice panicles for analysis.
Figure 15(a) illustrates the detection of rice panicles in the raw image, where the panicles exhibit slender forms with varying orientation, size, and shape.
Figure 15(b) shows areas with relatively high detection precision, while
Figure 15(c) to (f) illustrate how rice panicle morphology affects YOLOv10n's detection performance. In
Figure 15(b), distinct features, high resolution, and relatively isolated panicle distribution contribute to the high detection precision. In contrast, the red-circled rice panicles in
Figure 15(c) have low quality and close proximity, which impairs detection, while those in
Figure 15(d) are less distinguishable due to an unfavorable angle despite high resolution, highlighting that both resolution and target distinctiveness are critical to YOLOv10n’s detection precision. Furthermore,
Figure 15(e) and (f) reveal another challenge: even with high resolution and clear features, overlapping panicles and close spacing can cause multiple rice panicles to be detected as a single object, leading to inaccuracies in the panicle count. These issues warrant further research for improved detection precision.
In summary, based on this study's detection of crop canopy organs in raw image and mapping of prediction boxes to the DOM, as well as the analysis of YOLOv10n's performance in detecting canopy organs, we propose two directions for future research. First, this study does not improve the detection algorithm specifically for morphologically complex rice panicles; future research could focus on developing general algorithms targeting complex canopy organs. Second, the data annotation process still requires manual handling, especially in high-density and complex scenarios, which demands significant time and effort. Thus, developing automated tools for data annotation would be beneficial to enhance research efficiency.
5. Conclusions
This study addresses two key challenges in UAV-based organ level object detection. The first is seamline distortion and ghost effects in DOM, which reduce its suitability for detection tasks. The second is the difficulty in obtaining georeferenced information for detected objects in raw images. To solve these problems, we proposed a fusion method. It combines ortho maps and UAV raw images using the EasyIDP tool. This approach establishes a georeferencing mapping relationship between raw images and DOM. Small object detection was performed using the SAHI framework and YOLOv10n. This significantly improved detection speed and precision for large-scale farmlands. Experimental results show that the proposed method outperforms direct detection on DOM. YOLOv10n with SAHI achieved a precision of 0.825, a mAP of 0.864, and a processing latency of 1.84 milliseconds on resolution frames. Additionally, we developed the CCOD-Dataset for crop canopy organ level object detection. It contains 3,986 images and 410,910 annotated boxes, generated through interactive annotation with SAHI-YOLOv10n. The dataset is publicly available to support further research and detection tasks. The proposed method provides a robust solution for detecting and geolocating small organ level objects in crop canopies. Future work will focus on expanding the dataset to include more crop types, improving detection accuracy for complex objects, and developing a user-friendly canopy target detection tool.
Author Contributions
Conceptualization, Huaiyang Liu and Haozhou Wang; Data curation, Huaiyang Liu; Formal analysis, Huaiyang Liu and Chuanghai Liu; Funding acquisition, Jianping Qian and Zhanbiao Wang; Investigation, Huaiyang Liu and Chuanghai Liu; Methodology, Huaiyang Liu, Huibin Li and Haozhou Wang; Project administration, Changxing Geng; Resources, Jianping Qian and Zhanbiao Wang; Software, Huaiyang Liu and Haozhou Wang; Supervision, Changxing Geng; Validation, Huibin Li and Haozhou Wang; Visualization, Huaiyang Liu, Haozhou Wang and Chuanghai Liu; Writing – original draft, Huaiyang Liu; Writing – review & editing, Huibin Li, Haozhou Wang and Changxing Geng.
Funding
This work received funding support from the following projects: Key Technology Development for Agricultural Condition Parameter Acquisition and Integrated Application of Sensing Equipment by 2022LQ02004, Research on Key Technologies for Sky-Ground Integrated Crop Production Diagnosis and Precision Farming by 2023B02014-2, Research on Field Agricultural Condition Information Acquisition and Agricultural Machinery Operation Decision Technology by CAAS-CAE-202301, and Research on Macro-Micro Precision Integrated Navigation and Target Recognition Methods by CAAS-CAE-202302, The Science and Technology Development Program of the Pilot Zone for Innovation-Driven Development along the Silk Road Economic Belt and the Wu-Chang-Shi National Innovation Demonstration Zone by 2023LQJ03.
Data Availability Statement
Acknowledgments
We would like to express our gratitude to the technical staff at Future Smart Pastoral in Luja, the Changji Laolonghe Experimental Base, and Keshan Farm for their invaluable support in land management, fertilization, and other essential tasks, which greatly facilitated the progress of this study.
Conflicts of Interest
The authors declare that they have no known competing financial interests or personal relationships that could have appeared to influence the work reported in this paper.
Appendix A
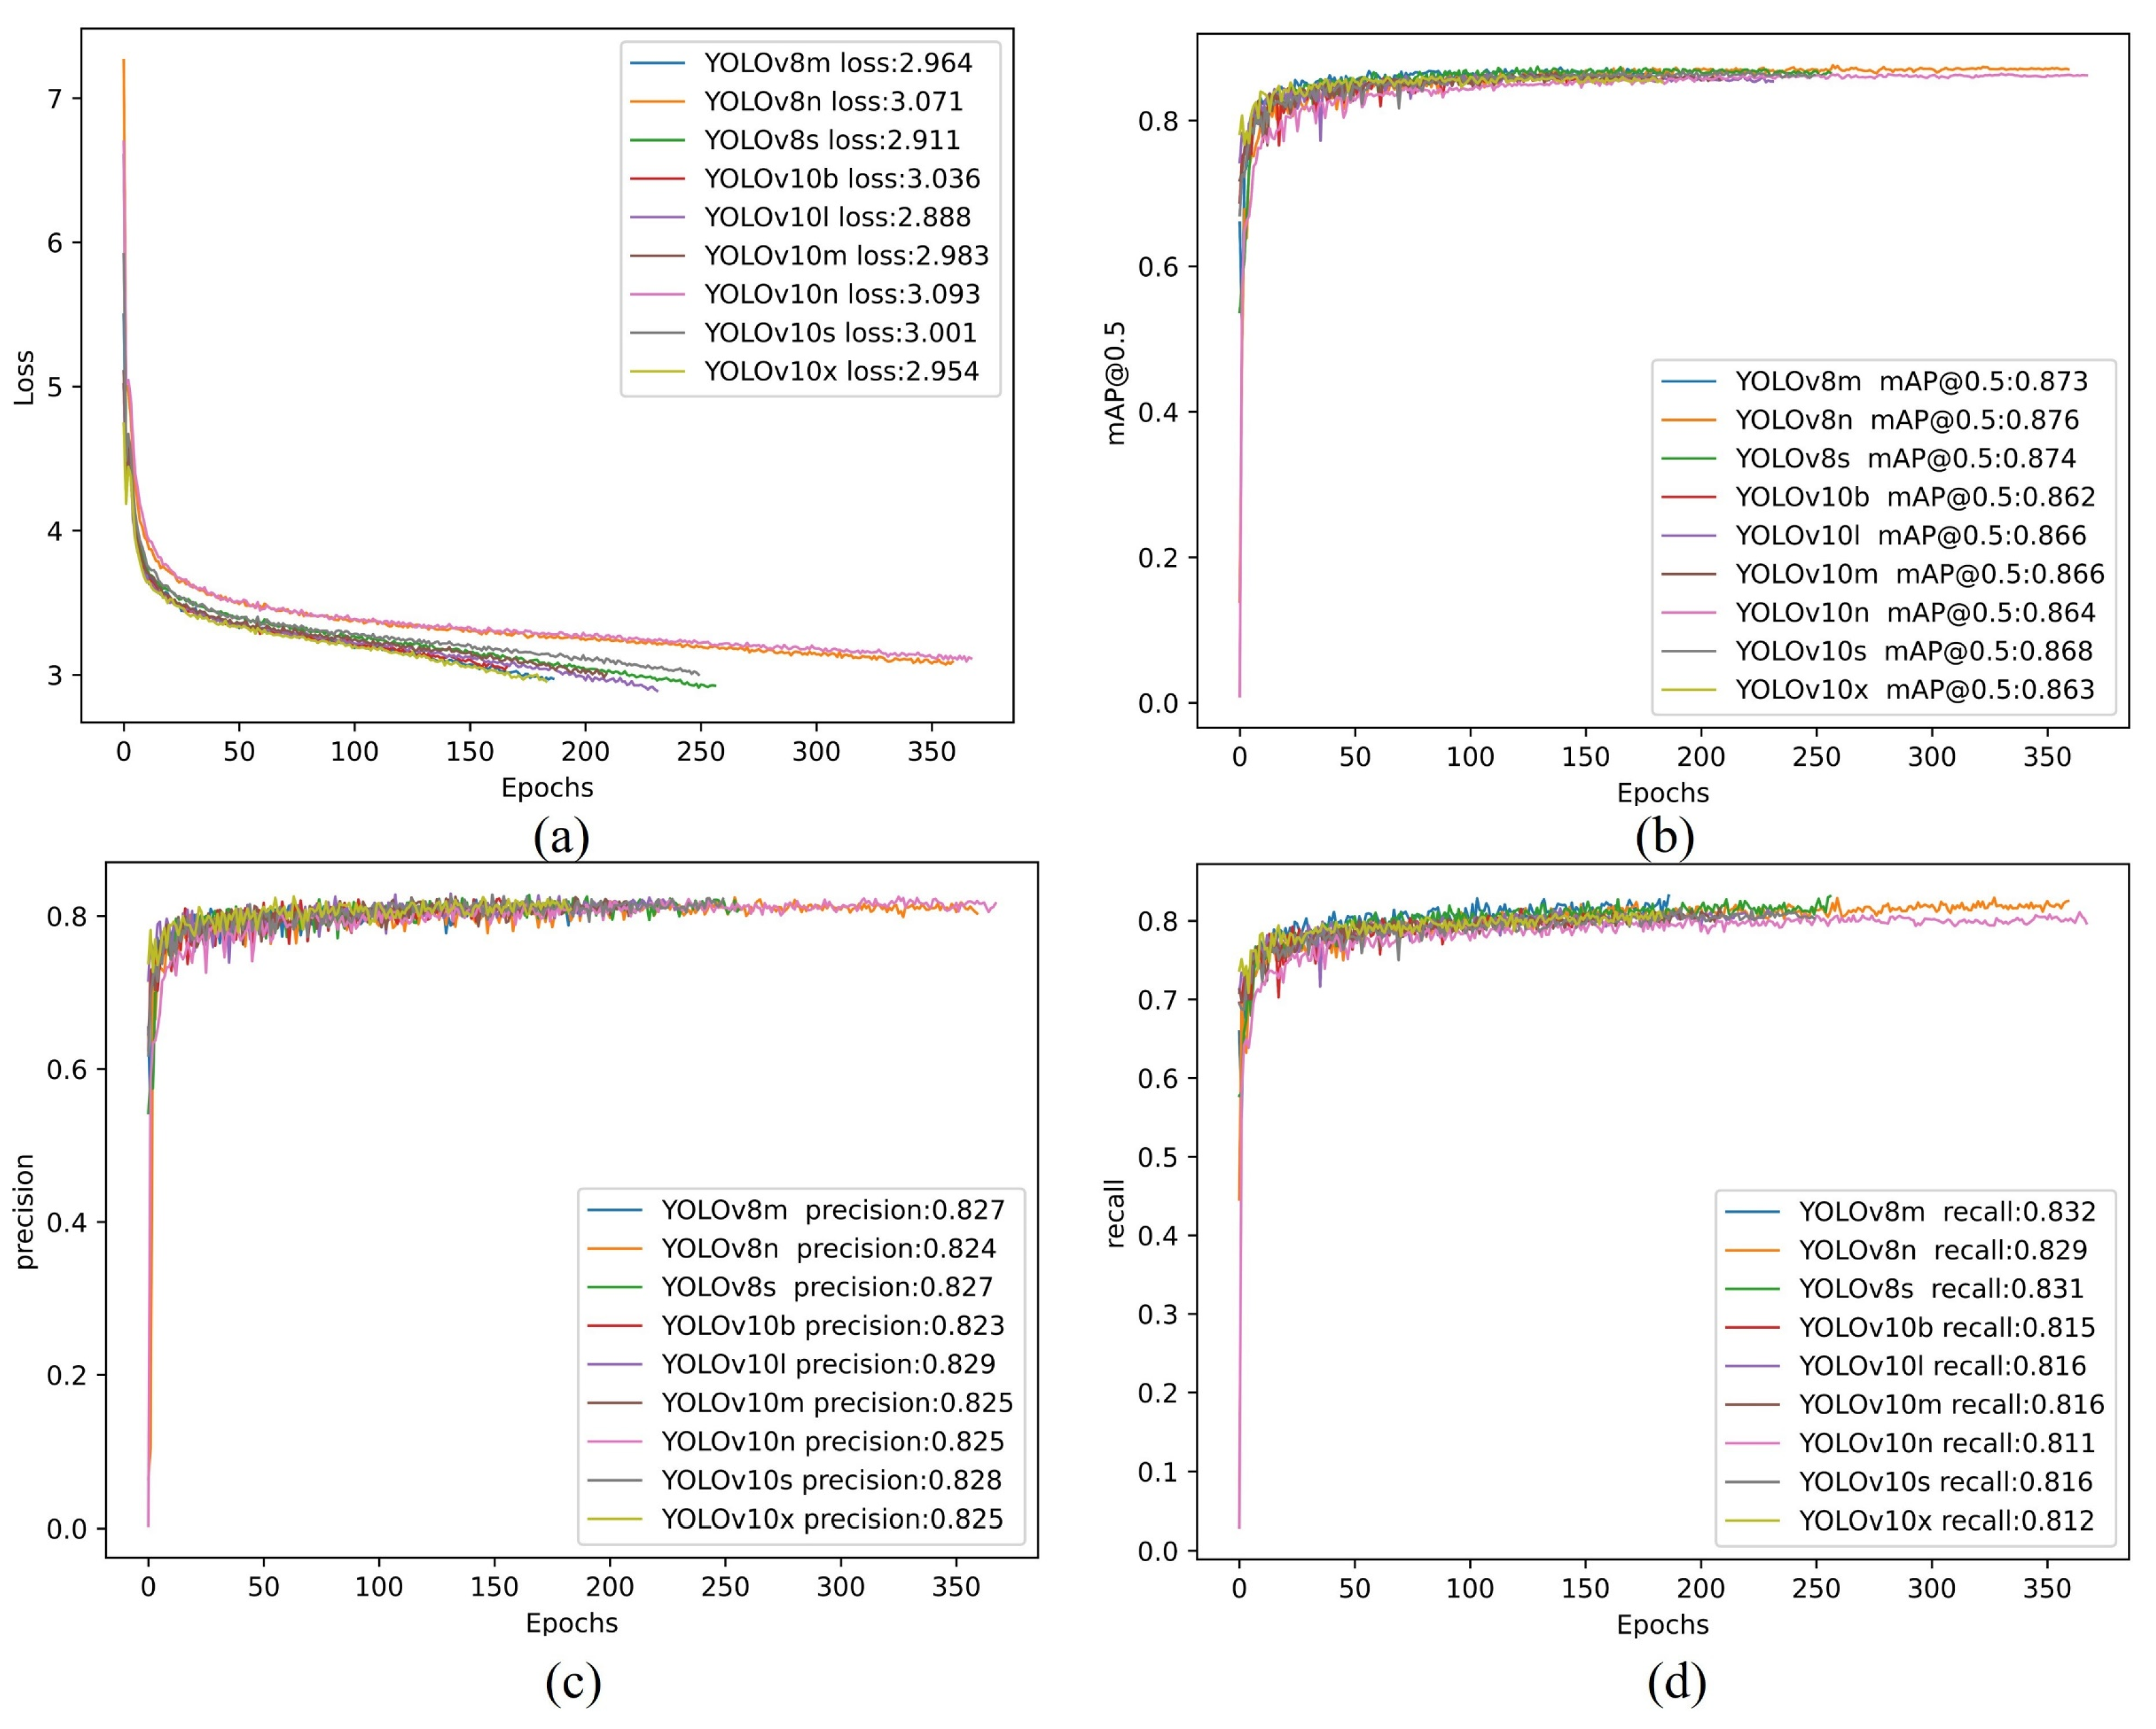
This section presents the training results and relevant metrics of the CCOD-Dataset for the YOLOv8 and YOLOv10 series. To conserve computational resources, an early stopping mechanism was employed, whereby training was halted if the best weight file (best.pth) had not been updated for 100 consecutive epochs. Appendix Figure A1 illustrates the trend of the algorithm's loss curve during the training process, with all algorithms ceasing training at approximately 350 epochs. The results revealed that the differences among the Loss value, mAP@50 value, Precision, and Recall metrics were minimal. For instance, the Precision metric indicated that YOLOv10l achieved a maximum value of 0.829, while YOLOv10b recorded a minimum value of 0.823, resulting in a negligible difference of 0.006. This observation suggested that the detection performance of the YOLOv8 and YOLOv10 series on the CCOD-Dataset was closely aligned, leading to two key insights: first, investing considerable effort solely for marginal improvements in detection precision yields low cost-effectiveness; second, in the agricultural sector, the emphasis is placed on the sparsity of crop target distribution. Therefore, within an acceptable range of precision, obtaining an overall distribution of objects in the DOM assumes greater significance.
In the agricultural domain, balancing the computational resources of the model with detection precision is crucial. Lower computational demands facilitate rapid deployment to smart agricultural platforms and devices, thus enhancing the practicality of the models and methods. In Appendix Table A1, a comprehensive comparison of the computational resource consumption parameters for the YOLOv8 and YOLOv10 series alongside the training results from the CCOD-Dataset is presented, with optimal metrics highlighted in bold font. It was observed that YOLOv10n exhibited the lowest Parameters (Param.) and FLOPs, with a Latency of only 1.840 ms, indicating minimal resource consumption during computation. In contrast, YOLOv10l, which demonstrated the lowest Loss value and the highest Precision value, achieved reductions of 90.5%, 94.4%, and 74.7% in Param, FLOPs, and Latency, respectively. However, the differences in Loss and Precision values were limited to 6.6% and 0.4%. Consequently, YOLOv10n was selected as the target detection model for this study to establish an optimal balance between computational resources and detection precision.
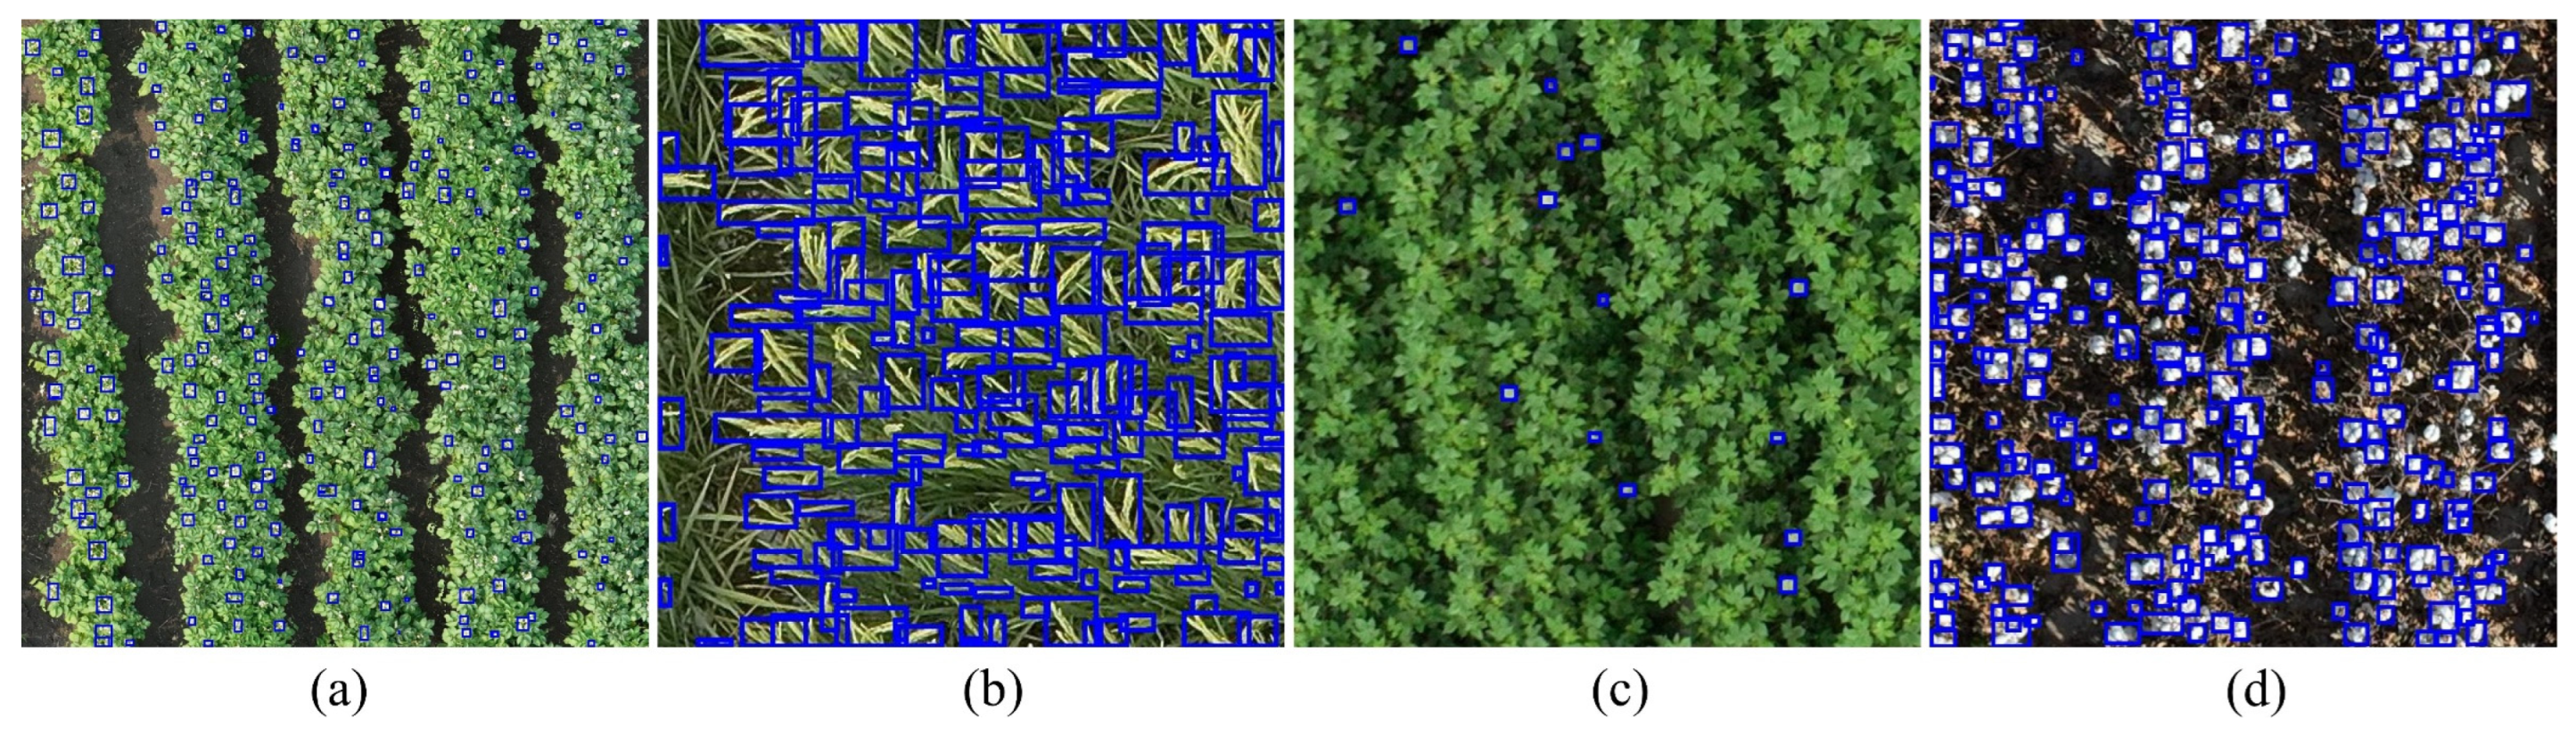
Appendix Figure A2 displays the detection results of YOLOv10n on crop canopy objects within the CCOD-Dataset test set. The results indicate that YOLOv10n performs effectively in detecting the four types of crop canopy objects.
Table A1.
Metrics comparison between YOLOv8 and YOLOv10 series.
Table A1.
Metrics comparison between YOLOv8 and YOLOv10 series.
| Model |
Param.(M) |
FLOPs(G) |
Latency(ms) |
Loss |
mAP@0.5 |
Precision |
Recall |
| YOLOv8n |
3.200 |
8.700 |
6.160 |
3.071 |
0.876 |
0.824 |
0.829 |
| YOLOv10n |
2.300 |
6.700 |
1.840 |
3.093 |
0.864 |
0.825 |
0.811 |
| YOLOv8s |
11.200 |
26.400 |
7.070 |
2.911 |
0.874 |
0.827 |
0.831 |
| YOLOv10s |
7.200 |
21.600 |
2.490 |
3.001 |
0.868 |
0.828 |
0.816 |
| YOLOv8m |
25.900 |
78.900 |
9.500 |
2.964 |
0.873 |
0.827 |
0.832 |
| YOLOv10m |
15.400 |
59.100 |
4.740 |
2.983 |
0.866 |
0.825 |
0.816 |
| YOLOv10b |
19.100 |
92.000 |
5.470 |
3.036 |
0.862 |
0.823 |
0.815 |
| YOLOv10l |
24.400 |
120.300 |
7.280 |
2.888 |
0.866 |
0.829 |
0.816 |
| YOLOv10x |
29.500 |
160.400 |
10.700 |
2.954 |
0.863 |
0.825 |
0.812 |
Figure A1.
Metrics curve with YOLOv8 & YOLOv10. (a) Loss value curve; (b) mAP@0.5 value curve; (c) Precision value curve; (d) Recall value curve.
Figure A1.
Metrics curve with YOLOv8 & YOLOv10. (a) Loss value curve; (b) mAP@0.5 value curve; (c) Precision value curve; (d) Recall value curve.
Figure A2.
Results of YOLOv10n on crop canopy objects. (a) potato flowers; (b) rice panicles; (c)cotton flowers; (d) cotton bolls.
Figure A2.
Results of YOLOv10n on crop canopy objects. (a) potato flowers; (b) rice panicles; (c)cotton flowers; (d) cotton bolls.
References
- Liu, J.; Xiang, J.; Jin, Y.; Liu, R.; Yan, J.; Wang, L. Boost Precision Agriculture with Unmanned Aerial Vehicle Remote Sensing and Edge Intelligence: A Survey. Remote Sensing 2021, 13, 4387. [Google Scholar] [CrossRef]
- Zahra, S.; Ruiz, H.; Jung, J.; Adams, T. UAV-Based Phenotyping: A Non-Destructive Approach to Studying Wheat Growth Patterns for Crop Improvement and Breeding Programs. Remote Sensing 2024, 16, 3710. [Google Scholar] [CrossRef]
- Wang, D.; Zhao, M.; Li, Z.; Xu, S.; Wu, X.; Ma, X.; Liu, X. A survey of unmanned aerial vehicles and deep learning in precision agriculture. European Journal of Agronomy 2025, 164, 127477. [Google Scholar] [CrossRef]
- Vong, A.; Matos-Carvalho, J.P.; Toffanin, P.; Pedro, D.; Azevedo, F.; Moutinho, F.; Garcia, N.C.; Mora, A. How to Build a 2D and 3D Aerial Multispectral Map?—All Steps Deeply Explained. Remote Sensing 2021, 13, 3227. [Google Scholar] [CrossRef]
- Aszkowski, P.; Kraft, M.; Drapikowski, P.; Pieczyński, D. Estimation of corn crop damage caused by wildlife in UAV images. Precision Agriculture 2024, 25, 2505–2530. [Google Scholar] [CrossRef]
- Jyothi, V.K.; Aradhya, V.N.M.; Sharath Kumar, Y.H.; Guru, D.S. Retrieval of flower videos based on a query with multiple species of flowers. Artificial Intelligence in Agriculture 2021, 5, 262–277. [Google Scholar] [CrossRef]
- Bay, H.; Ess, A.; Tuytelaars, T.; Van Gool, L. Speeded-Up Robust Features (SURF). Computer Vision and Image Understanding 2008, 110, 346–359. [Google Scholar] [CrossRef]
- Rublee, E.; Rabaud, V.; Konolige, K.; Bradski, G. ORB: An efficient alternative to SIFT or SURF. 2011 International Conference on Computer Vision 2011, 2564–2571. [Google Scholar] [CrossRef]
- Liu, W.; Sun, H.; Xia, Y.; Kang, J. Real-Time Cucumber Target Recognition in Greenhouse Environments Using Color Segmentation and Shape Matching. Applied Sciences 2024, 14, 1884. [Google Scholar] [CrossRef]
- Liang, W.-z.; Kirk, K.R.; Greene, J.K. Estimation of soybean leaf area, edge, and defoliation using color image analysis. Computers and Electronics in Agriculture 2018, 150, 41–51. [Google Scholar] [CrossRef]
- Linaza, M.T.; Posada, J.; Bund, J.; Eisert, P.; Quartulli, M.; Döllner, J.; Pagani, A.; G. Olaizola, I.; Barriguinha, A.; Moysiadis, T.; et al. Data-Driven Artificial Intelligence Applications for Sustainable Precision Agriculture. Agronomy 2021, 11, 1227. [Google Scholar] [CrossRef]
- Istiak, M.A.; Syeed, M.M.M.; Hossain, M.S.; Uddin, M.F.; Hasan, M.; Khan, R.H.; Azad, N.S. Adoption of Unmanned Aerial Vehicle (UAV) imagery in agricultural management: A systematic literature review. Ecological Informatics 2023, 78, 102305. [Google Scholar] [CrossRef]
- Wachs, J.P.; Stern, H.I.; Burks, T.; Alchanatis, V. Low and high-level visual feature-based apple detection from multi-modal images. Precision Agriculture 2010, 11, 717–735. [Google Scholar] [CrossRef]
- Li, L.; Liu, L.; Peng, Y.; Su, Y.; Hu, Y.; Zou, R. Integration of multimodal data for large-scale rapid agricultural land evaluation using machine learning and deep learning approaches. Geoderma 2023, 439, 116696. [Google Scholar] [CrossRef]
- Zhu, H.; Lin, C.; Liu, G.; Wang, D.; Qin, S.; Li, A.; Xu, J.-L.; He, Y. Intelligent agriculture: deep learning in UAV-based remote sensing imagery for crop diseases and pests detection. Frontiers in Plant Science 2024, 15. [Google Scholar] [CrossRef] [PubMed]
- Rasmussen, C.B.; Kirk, K.; Moeslund, T.B. The Challenge of Data Annotation in Deep Learning—A Case Study on Whole Plant Corn Silage. Sensors 2022, 22, 1596. [Google Scholar] [CrossRef] [PubMed]
- Nethala, P.; Um, D.; Vemula, N.; Montero, O.F.; Lee, K.; Bhandari, M. Techniques for Canopy to Organ Level Plant Feature Extraction via Remote and Proximal Sensing: A Survey and Experiments. Remote Sensing 2024, 16, 4370. [Google Scholar] [CrossRef]
- Bao, W.; Liu, W.; Yang, X.; Hu, G.; Zhang, D.; Zhou, X. Adaptively spatial feature fusion network: an improved UAV detection method for wheat scab. Precision Agriculture 2023, 24, 1154–1180. [Google Scholar] [CrossRef]
- Lin, Y.-C.; Zhou, T.; Wang, T.; Crawford, M.; Habib, A. New Orthophoto Generation Strategies from UAV and Ground Remote Sensing Platforms for High-Throughput Phenotyping. Remote Sensing 2021, 13, 860. [Google Scholar] [CrossRef]
- Petti, D.; Li, C. Weakly-supervised learning to automatically count cotton flowers from aerial imagery. Computers and Electronics in Agriculture 2022, 194, 106734. [Google Scholar] [CrossRef]
- Wan, L.; Zhang, G. Super-resolution reconstruction of unmanned aerial vehicle image based on deep learning. Journal of Physics: Conference Series 2021, 1948, 012028. [Google Scholar] [CrossRef]
- Shoab, M.; Singh, V.K.; Ravibabu, M.V. High-Precise True Digital Orthoimage Generation and Accuracy Assessment based on UAV Images. Journal of the Indian Society of Remote Sensing 2022, 50, 613–622. [Google Scholar] [CrossRef]
- Zhang, J.; Xu, S.; Zhao, Y.; Sun, J.; Xu, S.; Zhang, X. Aerial orthoimage generation for UAV remote sensing: Review. Information Fusion 2023, 89, 91–120. [Google Scholar] [CrossRef]
- Wang, H.; Li, Y.; Minh Dang, L.; Moon, H. An efficient attention module for instance segmentation network in pest monitoring. Computers and Electronics in Agriculture 2022, 195, 106853. [Google Scholar] [CrossRef]
- Hu, G.; Ye, R.; Wan, M.; Bao, W.; Zhang, Y.; Zeng, W. Detection of Tea Leaf Blight in Low-Resolution UAV Remote Sensing Images. IEEE Transactions on Geoscience and Remote Sensing 2024, 62, 1–18. [Google Scholar] [CrossRef]
- Zhou, J.; Xi, W.; Li, D.; Huang, H. Image enhancement and image matching of UAV based on histogram equalization. 2021 28th International Conference on Geoinformatics 2021, 1–5. [Google Scholar] [CrossRef]
- Panduangnat, L.; Posom, J.; Saikaew, K.; Phuphaphud, A.; Wongpichet, S.; Chinapas, A.; Sukpancharoen, S.; Saengprachatanarug, K. Time-efficient low-resolution RGB aerial imaging for precision mapping of weed types in site-specific herbicide application. Crop Protection 2024, 184, 106805. [Google Scholar] [CrossRef]
- Magoulianitis, V.; Ataloglou, D.; Dimou, A.; Zarpalas, D.; Daras, P. Does Deep Super-Resolution Enhance UAV Detection? 2019 16th IEEE International Conference on Advanced Video and Signal Based Surveillance (AVSS) 2019, 1–6. [Google Scholar] [CrossRef]
- Tang, G.; Ni, J.; Zhao, Y.; Gu, Y.; Cao, W. A Survey of Object Detection for UAVs Based on Deep Learning. Remote Sensing 2024, 16, 149. [Google Scholar] [CrossRef]
- Su, J.; Qin, Y.; Jia, Z.; Liang, B. MPE-YOLO: enhanced small target detection in aerial imaging. Scientific Reports 2024, 14, 17799. [Google Scholar] [CrossRef]
- Wu, H.; Wang, Y.; Zhao, P.; Qian, M. Small-target weed-detection model based on YOLO-V4 with improved backbone and neck structures. Precision Agriculture 2023, 24, 2149–2170. [Google Scholar] [CrossRef]
- Li, J.; Wang, E.; Qiao, J.; Li, Y.; Li, L.; Yao, J.; Liao, G. Automatic rape flower cluster counting method based on low-cost labelling and UAV-RGB images. Plant Methods 2023, 19, 40. [Google Scholar] [CrossRef]
- Tan, C.; Li, C.; He, D.; Song, H. Anchor-free deep convolutional neural network for tracking and counting cotton seedlings and flowers. Computers and Electronics in Agriculture 2023, 215, 108359. [Google Scholar] [CrossRef]
- Abekasis, D.; Sadka, A.; Rokach, L.; Shiff, S.; Morozov, M.; Kamara, I.; Paz-Kagan, T. Explainable machine learning for revealing causes of citrus fruit cracking on a regional scale. Precision Agriculture 2024, 25, 589–613. [Google Scholar] [CrossRef]
- Yu, X.; Yin, D.; Xu, H.; Pinto Espinosa, F.; Schmidhalter, U.; Nie, C.; Bai, Y.; Sankaran, S.; Ming, B.; Cui, N.; et al. Maize tassel number and tasseling stage monitoring based on near-ground and UAV RGB images by improved YoloV8. Precision Agriculture 2024, 25, 1800–1838. [Google Scholar] [CrossRef]
- Vélez, S.; Ariza-Sentís, M.; Panić, M.; Ivošević, B.; Stefanović, D.; Kaivosoja, J.; Valente, J. Speeding up UAV-based crop variability assessment through a data fusion approach using spatial interpolation for site-specific management. Smart Agricultural Technology 2024, 8, 100488. [Google Scholar] [CrossRef]
- Yang, C.; Baireddy, S.; Cai, E.; Crawford, M.; Delp, E.J. Field-Based Plot Extraction Using UAV RGB Images. 2021 IEEE/CVF International Conference on Computer Vision Workshops (ICCVW) 2021, 1390–1398. [Google Scholar] [CrossRef]
- Chen, Y.; Jiang, J. An Oblique-Robust Absolute Visual Localization Method for GPS-Denied UAV With Satellite Imagery. IEEE Transactions on Geoscience and Remote Sensing 2024, 62, 1–13. [Google Scholar] [CrossRef]
- Luo, X.; Tian, Y.; Wan, X.; Xu, J.; Ke, T. Deep learning based cross-view image matching for UAV geo-localization. 2022 International Conference on Service Robotics (ICoSR) 2022, 102–106. [Google Scholar] [CrossRef]
- Gómez-Candón, D.; De Castro, A.I.; López-Granados, F. Assessing the accuracy of mosaics from unmanned aerial vehicle (UAV) imagery for precision agriculture purposes in wheat. Precision Agriculture 2014, 15, 44–56. [Google Scholar] [CrossRef]
- Feng, A.; Vong, C.N.; Zhou, J.; Conway, L.S.; Zhou, J.; Vories, E.D.; Sudduth, K.A.; Kitchen, N.R. Developing an image processing pipeline to improve the position accuracy of single UAV images. Computers and Electronics in Agriculture 2023, 206, 107650. [Google Scholar] [CrossRef]
- Cagatay Akyon, F.; Onur Altinuc, S.; Temizel, A. Slicing Aided Hyper Inference and Fine-tuning for Small Object Detection. arXiv 2022, arXiv:2202.06934. [Google Scholar] [CrossRef]
- Wang, H.; Duan, Y.; Shi, Y.; Kato, Y.; Ninomiya, S.; Guo, W. EasyIDP: A Python Package for Intermediate Data Processing in UAV-Based Plant Phenotyping. Remote Sensing 2021, 13, 2622. [Google Scholar] [CrossRef]
- Wang, H.; Guo, W. EasyIDP V2.0: An Intermediate Data Processing Package for Photogrammetry-Based Plant Phenotyping. Harnessing Data Science for Sustainable Agriculture and Natural Resource Management 2024, 149–172. [Google Scholar] [CrossRef]
- Teng, Z.; Chen, J.; Wang, J.; Wu, S.; Chen, R.; Lin, Y.; Shen, L.; Jackson, R.; Zhou, J.; Yang, C. Panicle-Cloud: An Open and AI-Powered Cloud Computing Platform for Quantifying Rice Panicles from Drone-Collected Imagery to Enable the Classification of Yield Production in Rice. Plant Phenomics 2023, 5, 0105. [Google Scholar] [CrossRef] [PubMed]
- Peng, J.; Sun, M.; Lim, E.G.; Wang, Q.; Xiao, J. Prototype Guided Pseudo Labeling and Perturbation-based Active Learning for domain adaptive semantic segmentation. Pattern Recognition 2024, 148, 110203. [Google Scholar] [CrossRef]
- Lawal, O.M. Real-time cucurbit fruit detection in greenhouse using improved YOLO series algorithm. Precision Agriculture 2024, 25, 347–359. [Google Scholar] [CrossRef]
- Russell, B.C.; Torralba, A.; Murphy, K.P.; Freeman, W.T. LabelMe: A Database and Web-Based Tool for Image Annotation. International Journal of Computer Vision 2008, 77, 157–173. [Google Scholar] [CrossRef]
- Varghese, R.; S, M. YOLOv8: A Novel Object Detection Algorithm with Enhanced Performance and Robustness. 2024 International Conference on Advances in Data Engineering and Intelligent Computing Systems (ADICS) 2024, 1–6. [Google Scholar] [CrossRef]
- Wang, A.; Chen, H.; Liu, L.; Chen, K.; Lin, Z.; Han, J.; Ding, G. YOLOv10: Real-Time End-to-End Object Detection. arXiv 2024, arXiv:2405.14458. [Google Scholar] [CrossRef]
Figure 1.
Low quality issues of DOM in (a) blurred edges, (b) distortions and (c) low resolution; (d) raw image.
Figure 1.
Low quality issues of DOM in (a) blurred edges, (b) distortions and (c) low resolution; (d) raw image.
Figure 2.
Workflow in detecting and locating organ level objects.
Figure 2.
Workflow in detecting and locating organ level objects.
Figure 3.
Aerial image captured at three locations.
Figure 3.
Aerial image captured at three locations.
Figure 4.
Workflow for constructing the CCOD-Dataset. (a) Initial annotation and iterative model training using Labelme; (b) Efficient cotton boll annotation process using a pre-trained model, showing annotated and corrected samples.
Figure 4.
Workflow for constructing the CCOD-Dataset. (a) Initial annotation and iterative model training using Labelme; (b) Efficient cotton boll annotation process using a pre-trained model, showing annotated and corrected samples.
Figure 5.
Annotation samples of crop canopy organs in the CCOD-Dataset. (a) Potato canopy flowers; (b) Rice canopy panicles; (c) Cotton canopy flowers; (d) Cotton canopy bolls.
Figure 5.
Annotation samples of crop canopy organs in the CCOD-Dataset. (a) Potato canopy flowers; (b) Rice canopy panicles; (c) Cotton canopy flowers; (d) Cotton canopy bolls.
Figure 6.
SAHI in organ level objects detection.
Figure 6.
SAHI in organ level objects detection.
Figure 7.
Mapping of crop canopy objects from raw image to DOM using EasyIDP framework.
Figure 7.
Mapping of crop canopy objects from raw image to DOM using EasyIDP framework.
Figure 8.
Figure 8. Comparison of Detecting Canopy Objects on Raw Image and DOM with SAHI. (a) DOM & (b) Raw image in cotton canopy flowers; (c) DOM & (d) Raw image in potato canopy flowers; (e) DOM & (f) Raw image in rice panicles; (g) DOM & (h) Raw image in cotton canopy bolls.
Figure 8.
Figure 8. Comparison of Detecting Canopy Objects on Raw Image and DOM with SAHI. (a) DOM & (b) Raw image in cotton canopy flowers; (c) DOM & (d) Raw image in potato canopy flowers; (e) DOM & (f) Raw image in rice panicles; (g) DOM & (h) Raw image in cotton canopy bolls.
Figure 9.
Normalized Error Matrix of
Table 2. (a) DOM & (b) Raw image in cotton canopy flowers; (c) DOM & (d) Raw image in potato canopy flowers; (e) DOM & (f) Raw image in rice panicles; (g) DOM & (h) Raw image in cotton canopy bolls.
Figure 9.
Normalized Error Matrix of
Table 2. (a) DOM & (b) Raw image in cotton canopy flowers; (c) DOM & (d) Raw image in potato canopy flowers; (e) DOM & (f) Raw image in rice panicles; (g) DOM & (h) Raw image in cotton canopy bolls.
Figure 10.
Application of EasyIDP in cotton flower detection. (a) Overall results; (b) Sample ROIs, with ROI1 to ROI9 shown in (b1) to (b9); The light gray box represents the object in the raw image, which corresponds to the object position in the yellow box in the DOM.
Figure 10.
Application of EasyIDP in cotton flower detection. (a) Overall results; (b) Sample ROIs, with ROI1 to ROI9 shown in (b1) to (b9); The light gray box represents the object in the raw image, which corresponds to the object position in the yellow box in the DOM.
Figure 11.
Mapped Prediction boxes in the DOM for Potato Flowers. (a) Overview of results; (b) Detail view of selected DOM regions.
Figure 11.
Mapped Prediction boxes in the DOM for Potato Flowers. (a) Overview of results; (b) Detail view of selected DOM regions.
Figure 12.
Analysis of potato flowers by ROIs. (a) Potato flowers grading; (b) Histogram of distributions.
Figure 12.
Analysis of potato flowers by ROIs. (a) Potato flowers grading; (b) Histogram of distributions.
Figure 13.
Analysis of cottons bolls by ROIs. (a) Mapping Prediction boxes in DOM; Cottons bolls grading in (b) to (g).
Figure 13.
Analysis of cottons bolls by ROIs. (a) Mapping Prediction boxes in DOM; Cottons bolls grading in (b) to (g).
Figure 14.
Density histograms for cotton boll detection at different ROI sizes. (a) 5m, (b) 4m, (c) 3m, (d) 2m, (e) 1m, and (f) 0.5m. The horizontal and vertical axes of the coordinate system represent number intervals of cotton bolls and number of ROIs, respectively.
Figure 14.
Density histograms for cotton boll detection at different ROI sizes. (a) 5m, (b) 4m, (c) 3m, (d) 2m, (e) 1m, and (f) 0.5m. The horizontal and vertical axes of the coordinate system represent number intervals of cotton bolls and number of ROIs, respectively.
Figure 15.
Detection of Rice Panicles with Complex Morphologies. (a) Overall detection in raw image; (b) Example of clear detection; (c-f) Cases illustrating detection challenges due to resolution, proximity, orientation, and overlapping panicles.
Figure 15.
Detection of Rice Panicles with Complex Morphologies. (a) Overall detection in raw image; (b) Example of clear detection; (c-f) Cases illustrating detection challenges due to resolution, proximity, orientation, and overlapping panicles.
Table 1.
Distribution of crop canopy organs in the CCOD-Dataset.
Table 1.
Distribution of crop canopy organs in the CCOD-Dataset.
| Crop canopy organs |
Number of images |
Number of bounding boxes |
| Potato canopy flowers |
992 |
77034 |
| Rice canopy panicles |
994 |
82108 |
| Cotton canopy flowers |
1000 |
15490 |
| Cotton canopy bolls |
1000 |
236278 |
Table 2.
The number of organ level objects identified of sub-figures in
Figure 8.
Table 2.
The number of organ level objects identified of sub-figures in
Figure 8.
| Type |
DOM |
Raw image |
| Cotton flowers |
(a1) |
(a2) |
(a3) |
(a4) |
(a5) |
(a6) |
(b1) |
(b2) |
(b3) |
(b4) |
(b5) |
(b6) |
| Ground truth |
1 |
5 |
1 |
2 |
0 |
0 |
2 |
3 |
1 |
2 |
2 |
0 |
| Prediction |
1 |
5 |
1 |
2 |
2 |
0 |
2 |
3 |
2 |
2 |
2 |
0 |
| Omission |
0 |
1 |
1 |
0 |
0 |
0 |
0 |
0 |
0 |
0 |
0 |
0 |
| Error |
0 |
1 |
1 |
0 |
2 |
0 |
0 |
0 |
1 |
0 |
0 |
0 |
| Potato flowers |
(c1) |
(c2) |
(c3) |
(c4) |
(c5) |
(c6) |
(d1) |
(d2) |
(d3) |
(d4) |
(d5) |
(d6) |
| Ground truth |
19 |
4 |
13 |
14 |
9 |
6 |
15 |
9 |
11 |
11 |
10 |
9 |
| Prediction |
12 |
4 |
10 |
12 |
7 |
5 |
16 |
9 |
11 |
10 |
9 |
9 |
| Omission |
8 |
0 |
4 |
2 |
2 |
2 |
0 |
0 |
0 |
1 |
1 |
0 |
| Error |
1 |
0 |
1 |
0 |
0 |
1 |
1 |
0 |
0 |
0 |
0 |
0 |
| Rice panicles |
(e1) |
(e2) |
(e3) |
(e4) |
(e5) |
(e6) |
(f1) |
(f2) |
(f3) |
(f4) |
(f5) |
(f6) |
| Ground truth |
256 |
223 |
169 |
202 |
172 |
147 |
214 |
218 |
182 |
212 |
224 |
195 |
| Prediction |
44 |
61 |
49 |
33 |
66 |
51 |
182 |
178 |
156 |
195 |
179 |
166 |
| Omission |
227 |
174 |
130 |
173 |
130 |
117 |
39 |
44 |
33 |
23 |
49 |
34 |
| Error |
15 |
12 |
10 |
4 |
24 |
21 |
7 |
4 |
7 |
6 |
4 |
5 |
| Cotton bolls |
(g1) |
(g2) |
(g3) |
(g4) |
(g5) |
(g6) |
(h1) |
(h2) |
(h3) |
(h4) |
(h5) |
(h6) |
| Ground truth |
89 |
80 |
87 |
85 |
85 |
91 |
143 |
137 |
147 |
152 |
122 |
157 |
| Prediction |
52 |
51 |
67 |
43 |
27 |
37 |
142 |
140 |
143 |
152 |
120 |
153 |
| Omission |
52 |
40 |
33 |
48 |
63 |
59 |
5 |
5 |
7 |
9 |
5 |
10 |
| Error |
15 |
11 |
13 |
6 |
5 |
5 |
4 |
8 |
3 |
9 |
3 |
6 |
|
Disclaimer/Publisher’s Note: The statements, opinions and data contained in all publications are solely those of the individual author(s) and contributor(s) and not of MDPI and/or the editor(s). MDPI and/or the editor(s) disclaim responsibility for any injury to people or property resulting from any ideas, methods, instructions or products referred to in the content. |
© 2024 by the authors. Licensee MDPI, Basel, Switzerland. This article is an open access article distributed under the terms and conditions of the Creative Commons Attribution (CC BY) license (http://creativecommons.org/licenses/by/4.0/).