
Submitted:
24 December 2024
Posted:
25 December 2024
You are already at the latest version
Abstract
Focal adhesions (FAs) are multi-protein structures mediating interaction between cells and extracellular matrix. The formation and maturation of FAs depend on intracellular tension generated through the of actin filaments interacting with phosphorylated myosin II. Using live cell and confocal microscopy we evaluated the regulation of FA dynamics by actin polymerization and myosin II-mediated tension in motile cells. Our findings confirm that while partial inhibition of myosin II, through ROCK kinase or myosin II light chain kinase (MLCK) inhibitors, leads to the gradual shrinkage but increased stability of FAs, complete inhibition of myosin II phosphorylation results in disassembly of existing FAs followed by the formation of new small FAs at the cell edges. These FAs are rather stable, supported by cortical actin structures. Partial inhibition of actin polymerization with nanomolar doses of latrunculin B or cytochalasin D results in the similar effect, while complete inhibition leads to the rapid and irreversible disassembly of FAs and shrinkage of cell lamella. Overall, our results show that small FAs, which are normally short-living structures at the advancing cell edge, could be stabilized and persist, driven only by partial actin polymerization. These insights highlight the role of the interplay between actin and myosin in maintaining FA formation and dynamics.
Keywords:
Focal adhesions (FAs)
; actin polymerization
; actin inhibitors
; myosin II-mediated tension
; myosin II inhibitors
; FA dynamics
; cellular lamellae
1. Introduction
Focal adhesions (FAs) are intricate multi-protein complexes that form at the junction between cells and the extracellular matrix (ECM). These structures are pivotal in transmitting both mechanical signals and biochemical cues between the cell’s interior and its external environment. The assembly of FAs is a multistep process highly regulated by cell-substrate interaction and through recruitment of specific proteins [1,2]. Formation of FAs is initiated in the advancing cell lamella by interaction of integrin clusters with the adhesive substrate. These initial complexes often named nascent adhesions [3,4] are thought to be unstable – they either maturate by attaching to the stress fibers [5,6] increasing in size and elongating towards the cell center or disassemble completely [3].
The formation and maturation of FAs is controlled by intracellular tension generated through the interaction of FA proteins with actin filaments. This tension mainly generated by actin-myosin II interaction facilitates the recruitment of structural proteins such as talin, vinculin, and paxillin, promoting FA growth and stabilization [7]. Increased tensile force results in larger and more stable FAs, enhancing cell anchorage to the ECM [8]. When cell tension is reduced, FAs tend to disassemble, and formation of new FAs is hindered due to the dissociation of mechanosensitive proteins [9,10]. However, emerging evidence suggests that strong myosin II-mediated tension is not critical for FA formation. Even with an 80% reduction in myosin-mediated tension, the compositional maturation of FAs can occur through protein recruitment and matrix remodeling [11]. During the initial stages of FA assembly, not only talin but also vinculin is recruited to nascent adhesions independently of mechanical force, which is applied later during FAs’ maturation [12]. Thus the question on the behavior of FAs in the cells when intracellular tension is reduced, but cells’ lamellae are still able to spread on the substrate requires further elucidation.
In this study, we confirm that partial inhibition of myosin II, achieved through inhibition of ROCK kinase or myosin II light chain kinase (MLCK), results in a moderate response from FAs. Specifically, FAs gradually shrink but become more stable. However, using direct time-lapse observations we show for the first time that complete inhibition of myosin II phosphorylation does not simply lead to partial FA disassembly shown previously [13], instead, it results in a complex behavior, including disassembly of the existing FAs followed by the formation of new small FAs mainly at the cell edges. Meanwhile, alteration of actin polymerization cytochalasin D and latrunculin B treatments leads to relatively rapid and irreversible disassembly of FAs along with shrinkage of the cell lamella.
We propose that short bundles of actin continue to grow in the lamella under blebbistatin action are sufficient for small FA formation at the cell edge, whereas new FAs cannot form in the presence of actin polymerization inhibitors when cell lamellae retract.
2. Materials and Methods
2.1. Cell Culture
Model cell lines of mouse fibroblasts 3T3 and osteosarcoma U2OS ATCC, VA, USA transduced with vinculin-RFP gene were cultured in a 1:1 mixture of DMEM and F12 media (Sigma Aldrich, USA) supplemented with 5% fetal calf serum (PanEco, Russia), 2 mM glutamine (PanEco, Russia), and 90 μg/ml gentamicin (PanEco, Russia) at 37°C in a humidified atmosphere with 5% CO2. Some experiemnts were done on A549 cells temporarily transfected with vinculin-RFP construct. A549 cells were obtained from ATCC, VA, USA. Cells were grown in Dulbecco’s modified Eagle medium (DMEM) (Thermo Fisher Scientific) supplemented with 10% fetal bovine serum (FBS) (Thermo Fisher Scientific), 4–8 mM of L-glutamine (Sigma) and penicillin–streptomycin mixture (Sigma-Aldrich), at 37°C in a humidified atmosphere with 5% CO2. Transient transfection of A-549 cells with Ptag-RFP-vinculin vector (Eurogen, Russia) was carried out using X-treme GENE HP DNA transfection reagent (Roche, Switzerland) according to manufacturer’s instructions.
2.2. Generation of 3T3 and U2OS Model Cell Lines with Stable Vinculin Expression
To generate 3T3 and U2OS cell lines with stable vinculin-RFP expression, vinculin cDNA was cloned into the pSLIK lentiviral vector containing the RFP gene as a reporter and a puromycin resistance gene for selection (Evrogen, Russia). HEK293T cells (ATCC, USA) were transfected with the lentiviral vector using X-TremeGENE HP DNA transfection reagent (Sigma Aldrich, USA) following the manufacturer's protocol. Viral particles were harvested from the medium at 24 and 48 hours after transfection. To evaluate transduction efficiency, HEK293T cells were infected with serial dilutions of the viral particles. To enhance infection efficiency, the cationic polymer polybrene (Sigma-Aldrich, USA) was added to the culture medium at a final concentration of 8 μg/ml. After 48 hours of transduction, the number of transducing units (TU) per ml was calculated by flow cytometry based on the percentage of RFP-expressing cells.
For infection of model cell lines, 5x10^6 3T3 and U2OS cells were seeded in 2 ml of culture medium and infected with viral particles. The minimum TU concentration was at least 10^7 TU/ml. After 24 hours, the medium was changed. Infected cells were cultured in the full culture medium containing 0.1% puromycin (Gibco, USA). After 5 days, cells were sorted by RFP fluorescence intensity (excitation 561 nm, emission 585/15 nm BP) using a FACSAria SORP cell sorter (BD Biosciences, USA) with an 85 μm nozzle and corresponding pressure parameters. After obtaining cell lines with stable vinculin-RFP expression, 3T3-RFP or U2OS-RFP cells with medium fluorescence levels of the RFP (27% of events with MFI 168) were sorted, excluding cells with high RFP fluorescence.
2.3. Live Cell Fluorescence Microscopy
Model cell lines were detached using trypsin-EDTA solution (PanEco, Russia) and seeded in 4-well glass-bottom Petri dishes (35 mm) (Cellvis, USA). After 24 hours, an experimental wound was created in the monolayer using a 10 μl pipette tip. Cell debris was removed by washing twice with serum-free DMEM. To maintain cell viability, the medium was replaced with a 1:1 mixture of DMEM/F12 and CO2-independent culture medium (Gibco, USA) overlaid with mineral oil (Sigma, USA). Time-lapse imaging was conducted using an inverted Nikon Eclipse TiE microscope (Nikon, Japan) with a phase-contrast Plan Apo 60x/1.4 objective (Nikon, Japan). Images were recorded using an ORCA-Flash 4.2 CMOS camera (Hamamatsu, Japan) controlled by MicroManager software. The exposure time was 500 ms for fluorescence and 100 ms for phase-contrast images. The equivalent pixel size was 0.108 µm. Imaging was performed at 5-minute intervals for 6.5 hours at 37oC. For analysis of FAs in the same cells before and after cytoskeleton inhibitor treatment, inhibitors were added 30 minutes after the start of time-lapse imaging and recording was performed at 2-minute time intervals for 3 hours.
2.4. Immunocytochemical Staining
Cells were fixed with 4% paraformaldehyde in PBS (pH=7.2-7.4) for 20 minutes at room temperature and washed three times with buffer and then permeabilized with 0.1% Triton-X-100 (Amresco, USA) and 0.01% Tween-20 (Amresco, USA) for 20 minutes. After three washes with PBS, cells were incubated with primary rabbit antibodies against bisphosphorylated myosin II (Thr18/Ser19) (Invitrogen, USA) at 1:200 dilution overnight at +4°C and with secondary anti-rabbit antibodies conjugated with Alexa-488 (Abcam, UK) at +37°C for 60 minutes. After washing, actin microfilaments were stained for 30 minutes with Phalloidin-Alexa-647 (Phalloidin-iFluor 647 reagent Ab176759, Lot GR3256003-2, Abcam). Images were acquired using an inverted Zeiss Axio Observer microscope with a Colibri 7 LED light source and multiple filter set for GFP, m-Kate and AlexaFluor647 (Carl Zeiss, Cat. No 489090-9110) with 63x/1.46 Plan Apo oil immersion objective. Images were recorded using an ORCA-Flash 4 V2 sCMOS camera (Hamamatsu, Japan) controlled by Zeiss Zen Blue 3.1 software. For each condition, at least 10 fields of view were imaged.
2.5. Inhibitory Analysis
Myosin II light chains were inhibited using 45 μM blebbistatin (Adooq Bioscience, USA). ROCK and MLCK kinases were inhibited using 10 μM Y-27632 (Sigma, USA) and 10 μM ML-7 (Sigma, USA), respectively. Actin microfilaments were inhibited using 1 μM cytochalasin D (Sigma, USA) and 1 μM latrunculin B (Calbiochem, USA).
2.6. Confocal Microscopy with Airyscan Super-Resolution Module
To assess residual tension in U2OS cells under normal conditions and after 3 hours of myosin II inhibition (45 μM blebbistatin), immunocytochemical staining was performed as described above. Cells were stained with antibodies against paxillin (Ab 32084, Rb mAB to paxillin (Y113), Lot GR215998-38, Abcam, UK) and secondary anti-rabbit antibodies conjugated to AlexaFluor 488 (Ab 150077, Lot GR3214958-1, Abcam, IUK). Phosphorylated myosin was stained with rabbit antibodies against myosin II (Thr18/Ser19) (Invitrogen, USA) and secondary anti-rabbit antibodies conjugated to AlexaFluor 568 (Ab175692), Lot GR322655-4, Abcam, UK). All antibodies were used at a final dilution of 1:200. Actin microfilaments were stained with Phalloidin-Alexa-647 (Ab176759, Lot GR3256003-2, Abcam, UK) at a final dilution of 1:50. Chromatin was stained with DAPI at a concentration of 2 μg/ml. Images were acquired using a Zeiss LSM780 confocal microscope or Zeiss LSM900 confocal microscope with an Airyscan super-resolution module. Scanning was performed with a 0.2 μm step along the Z-axis in "Frame" mode, with a pixel size of 0.035 x 0.035 μm in the X-Y plane. Detector gain was set automatically. For fluorescence imaging, lasers with wavelengths of 488 nm, 561 nm, 647 nm, and 405 nm were used. Final images were obtained as projections by summing optical sections by maximal intensity projection (MIP) in ImageJ software.
2.7. Western Blot
Cell pellets of 3T3 and U2OS model lines were lysed in RIPA buffer containing 1x protease inhibitor cocktail (Sigma Aldrich, USA) and phosphatase inhibitors (Roche, Switzerland). Lysates were incubated for 30 minutes at +4°C and clarified by centrifugation at 12000 rpm for 20 minutes. Supernatants were transferred to clean tubes, and total protein concentration was measured using a spectrophotometer (Nanodrop, Thermo Fischer Scientific, USA). The required volume of protein extract was calculated to load 40 μg into each well of an SDS-PAGE gel. Samples were mixed with 5x Laemmli buffer and heated at 100°C for 5 minutes. Samples were loaded into wells of a 12.5% polyacrylamide gel and electrophoresed. Proteins were transferred from the gel to Immobilon-P PVDF membranes (Merck Millipore, Germany). The membrane was washed three times with 1X TBS-T buffer and blocked with 5% non-fat dry milk (Cell Signaling Technology, USA) for 30 minutes at room temperature. The membrane was incubated overnight at +4°C with primary antibodies diluted in TBS-T buffer containing 1% BSA. Dilutions used: 1:500 for rabbit anti-phospho-myosin light chain antibodies (ab157747 Abcam, UK), 1:200 for mouse anti-α-tubulin antibodies (ab7291, Abcam, UK). After primary antibody incubation, the membrane was washed three times with TBS-T buffer at room temperature and then incubated with secondary anti-mouse HRP-conjugated antibodies (#7076, Cell Signaling Technology, USA) and anti-rabbit HRP-conjugated antibodies (#7074, Cell Signaling Technology, USA) diluted 1:1000 in TBS-T buffer containing 5% non-fat dry milk, for 60 minutes at room temperature. The membrane was washed three times with TBS-T buffer at room temperature. For detection of HRP-conjugated antibodies, the Clarity Western ECL system (BioRad, USA) was used according to the manufacturer's protocol. Chemiluminescent signals were visualized using the iBright imaging system (Invitrogen, USA).
2.8. Image Processing and Data Analysis
16-bit images were processed using ImageJ software (NIH Image, USA). Noise reduction and contrast enhancement were performed using brightness-contrast adjustment, background subtraction tools, and difference of Gaussians using the kernel one to kernel two ratio 1:5 (where indicated). FAs were manually outlined using the freehand selection tool, and the resulting contours were saved in the ROI manager. Contours were transferred to unprocessed (RAW) images, and the integral brightness and area were calculated for each FA in each frame. FA area and integral density were determined at the first frame where both parameters were visually different from the surrounding cytoplasm and followed until the last frame where both parameters were visually different from the surrounding cytoplasm. Growth and disassembly periods were determined manually from the life histories of FAs as periods when FA area increased or decreased consequently as described elsewhere using linear regression with R2≥0.8 as a threshold (see [14] for details). Data were averaged for at least 20 FAs in control cells and cells treated with each inhibitor.
2.9. Statistical Analysis and Data Visualization
Statistical analysis was performed using Prism 9.0 software (GraphPad Software Inc., USA). For comparison of multiple non-parametric groups, the Kruskal-Wallis one-way analysis of variance with Dunn's test was used. Statistical significance was set at p<0.05. Data are presented as medians with ranges if otherwise is not stated.
3. Results
3.1. Morphology and Dynamics of Focal Adhesions in Control Cells
For comprehensive analysis of focal adhesion dynamics, we evaluated in detail normal 3T3 mouse fibroblasts and osteosarcoma U2OS cells to evaluate FA dynamics. These cell lines have been widely used in studies of cell adhesion, migration, and cytoskeletal dynamics [15,16]. Besides, some experiments with live cell imaging were done on human adenocarcinoma A549. All three cell lines form prominent FAs that are easily visualized and could be quantitatively evaluated.
In both cell types FAs typically exhibit an ellipsoidal or sometimes elongated shape (Figure 1 A, B, C). In control cells dynamic FAs were located mainly at the cell edge, and some relatively stable FАs are located in the internal areas. This is in accord with previously described fibrillar adhesions located in the internal cell areas that were less dynamic and contained fewer FA proteins [17,18]. Size and shape of individual FAs were characterized by area and integral brightness (both parameters were taken at the frame with maximal area for a given FA).
FAs in U2OS cells had median area 0.76 µm2 (0.09 – 8.48, n=1396) and median brightness 2510 a.u. (111-123682, n=1396). In 3T3 cells dynamic FAs were distributed more regularly within the cytoplasm and had median area 0.86 µm2 (0.08 – 5.45 µm2, n=345) and median brightness 2823 a.u. (276 –61131 a.u. n=345) (Figure 1D,E).
In migrating cells most of FAs were assembled de novo near the cell edge, a part of them disassembled rapidly, while most increased in area and survived for a relatively long time. In control U2OS cells median lifetime of FAs was 32.5 minutes (range 10-190 minutes), which was similar to 3T3 cells with FA median lifetime 33.5 minutes (range 6-164 minutes) (Figure 1F).
3.2. Focal Adhesions Decrease in Area and Brightness, but Do Not Completely Disappear After Inhibition of Myosin II Phosphorylation
To determine the role of tensile forces in FA formation and behavior we used direct and indirect inhibitors of myosin II light chain phosphorylation, namely blebbistatin, Y-27632 and ML-7. 3Т3 and U2OS cells were treated with myosin II inhibitors for 30, 180, and 360 minutes. In both types of cells under these treatments there was time-dependent decrease of phosphorylated myosin II. Within 30 minutes phosphorylated myosin disappeared from the cell edges while remained in the central part of cells, sometimes being associated with remaining actin fibers. After 3 h treatment only residual phoshomyosin II staining was obseved in some cells. Along with decrease of phosphomyosin II, actin fibers completely disappear between 180 min and 360 min. of treatment with blebbistatin, while under the action of ML-7 and Y-27632 residual actin fibers remain in some cells for at least 360 min., while (Figure 2A, B).
Western blot analysis (Figure 2C, D) shows that in 3T3 cells the overall level of phosphorylated myosin II dramatically decreases under complete inhibition of myosin II or ROCK kinase, and decreases slightly with inhibition of MLCK kinase. Besides it also decreases in the presence of latrunculin B but under the treatment with cytochalasin D the level of phosphorylated myosin remains nearly the same as in control. In U2OS cells (Figure 2D) phosphorylated myosin is almost completely absent with complete inhibition of myosin II with blebbistatin or ROCK kinase with Y-27632. When MLCK kinase is inhibited by ML-7, and in the presence of latrunculin B or cytochalasin D, the level of phosphorylated myosin decreases markedly.
In control 3T3 cells FAs are located at the cell edge and in the cell interior while in control U2OS cells most FAs are located at the cell edge. In both cultures treatment with 45 μM blebbistatin or 10 µM Y-27632 results in reduction of FA size and brightness. Treatment with 10 µM ML-7 did not show significant changes (Figure 3).
Quantitative analysis of FAs on the fixed specimens (Figure 4) showed that in 30 minutes treatment of 3T3 cells with Y-27632 median FA area decreased from 0.44 µm2 (0.09 – 2.13, n=100) to 0.17 µm2 (range 0.04 – 0.51 µm2, n=100), in 3 hours - to 0.12 µm2 (range 0.04-0.29 µm2, n=100), and in 6 hours - to 0.10 µm2 (range 0.04-0.45 µm2, n=100) (Figure 4A). In these cells, FAs became 3.5 times paler, with the decrease in integral brightness from 4849 a.u. (203 – 24136, n=100) to 1418 a.u. (306 – 9419, n = 100) within 30 minutes and slow gradual decrease to 909.5 a.u. (130 – 5150, n = 100) and 1047 a.u. (184 – 6050, n = 100) within 3 and 6 hours, respectively (Figure 4B). In Y-27362-treated U2OS cells we also observed the decrease of FA area and brightness, though in a more gradual mode (Figure 4G, 4H). The difference in FA area and brightness for control and Y-27362-treated cells was statistically significant for all time points (the Kruskal-Wallis test with Dunn’s post test, p<0.001).
Similarly, in ML-7 treated 3T3 cells we observed the decrease of FA area and brightness, though in a more gradual mode. The median FA area diminished from 0.44 µm2 (0.09 – 2.13, n=100) to 0.29 µm2 (0.08 – 1.34 µm2, n = 100) in 30 minutes to 0.18 µm2 (0.04 – 0.71 µm2, n = 100) and 0.19 µm2 (0.05 – 0.85 µm2, n = 100) in 3 and 6 hours, respectively (Figure 4C). FA integral brightness values in 3T3 cells reduced from 4849 a.u. (203 – 24136, n=100) to 2652 a.u. (303 – 24189, n = 100) within 30 minutes, with gradual decrease to 1540 a.u. (256 – 11930, n = 100) within 3 hours and remained almost at the same level within 6 hours (Figure 4D). In U2OS cells we observed the same continuous fading and area reduction (Figure 4I, 4J). For ML-7 treatment, the difference in FA area and brightness was statistically significant only for control cells and cells after 3 or 6 hours treatment (the Kruskal-Wallis test with Dunn’s posttest, p<0.01).
Blebbistatin treatment led to the rapid decrease of FA area and brightness in both cell lines. In the first 30 minutes after adding of blebbistatin, FA area in 3T3 cells decreased rapidly from 0.44 µm2 (0.09 - 2.13, n = 100) to 0.16 µm2 (0.04 - 0.6, n = 100). Then after 3 h area deceleration slowed down and has reached a plateau at median area of 0.13 µm2 (0.04 - 0.45, n = 100) (Figure 4E). Similarly, FA brightness in 3T3 cells decreased in 30 minutes from 4849 a.u. (203 – 24136, n = 100) to 2279 a.u. (253 – 11619, n = 100), reached plateau in 3 hours with the median 1392 a.u. (200 – 10404, n = 100) and was almost the same after 6 hours (Figure 4F). In U2OS cells we observed the same tendency of rapid deceleration of FA area within first 30 minutes and area reaching a plateau within 3 and 6 hours (Figure 4K, 4L). For each time point the difference in FA area and brightness for control and blebbistatin-treated cells was statistically significant (the Kruskal-Wallis test with Dunn’s post test, p<0.001). The stronger and more complex effect of blebbistatin treatment will be discussed below (see sectioin 3.3.).
For all treatments with myosin inhibitors new lamellipodia formed 10 minutes after adding the inhibitor in both cell types (data not shown).
Thus, we determined the two phases in the behavior of FAs under treatment with myosin II inhibitors. The first one lasts from 30 minutes to one hour after the addition of the inhibitor when the cells are in a transition state, and we observe a disassembly of FAs and rapid decrease in area and brightness for the remaining FA population. The second phase begins between one and three hours after adding the inhibitor, when cells come to a new steady state, and the population of dim and small FAs could still be detected at the cell edge both for 3T3 and U2OS cells. Since FAs were still visible after 3-hrs treatment, we suggested that either residual FAs were stabilized or new FAs continue to form under the action of myosin II inhibitor. To test this, we performed the detailed analysis of FA dynamics at different time points after myosin II inhibition.
To confirm that FA measurements in cultured cells are not affected by fixation procedure, we imaged RFP-vinculin in blebbistatin-treated live cells and analyzed dynamic of FAs in the cell lamellum. All measurements before and after addition of inhibitor were performed in uniform conditions and for the same cells. For all inhibitors decrease in FA area and brightness values were similar when measured on the fixed specimens and on time-lapse frames (Supplementary Tables S1-S3, Figures S1, S2, Videos 1 and 2).
The most prominent changes in FAs were observed under the treatment of blebbistatin. New lamellipodia were formed in 3T3 cells within 30 minutes after adding the inhibitor. However, existing lamellae did not shrink significantly even after 3 h treatment. The total number of FAs per cell decreased 4 to 5 times. Later on (after one hour) small and pale FAs were present at the cell edge and few FAs could be observed in the cell interior. In U2OS cells the total number of FAs per cell also decreased 4 to 5 times, but unlike 3T3, FAs in the cell body completely disassembled.
To visualize the dynamics of FAs at the cell edge in the complete absence of phosphorylated myosin II, we performed time-lapse recording and calculated the lifetime of FAs that were formed after 195 minutes from zero frame (at the timepoint where the absence of phosphorylated myosin II was verified by western blot and IHC – see Figure 2C,D). For all three myosin II inhibitors we observed the statistically significant increase of lifespan for FAs that were formed de novo compared to control cells (Figure 5A, B). In control 3T3 cells median FA lifetime was 33.5 minutes (range 6-164 minutes). Under blebbistatin treatment median FA lifetime increased twice to 62.5 minutes (range 20-280 minutes, Kruskal-Wallis test, p<0.05), under ML-7 treatment it increased to 59.5 minutes (range 18-177 minutes), while under Y-27632 it increased only to 49.5 minutes (range 13 – 121 minutes), though the difference between control and treatment was statistically significant for all three inhibitors (Kruskal—Wallis test, p<0.05). In U2OS cells we observed a slightly different response of FA dynamics to myosin II inhibitors: the most prominent increase in FA lifetime was for ML-7 treatment (70 minutes, range 20-245 minutes), less in Y-27362 (57.5 minutes, range 15-190 minutes) and only 40 min for blebbistatin (15-245 min), compared to 32.5 minutes (range 10-190 minutes) in control, though the difference between control and treatment was statistically significant for all three inhibitors (Kruskal—Wallis test, p<0.01) (Figure 5B).
3.3. Blebbistatin Treatment Promotes Disassembly of Pre-Formed FAs and Inhibits Growth of New FAs
To further analyze how blebbistatin affects the dynamics of these new FAs, we compared dynamics of the area and integrated brightness of FAs before and after addition of inhibitor in the same cells at higher temporal resolution (1 frame per minute) and detected the significant decrease in the assembly time of those adhesions. In control cells the phase of FA assembly continued for 6 minutes (median, N=25). Under the blebbistatin treatment, the FA assembly phase shortened to 2 minutes (median, N=20). While in control FA area increased during growth period 3.5-fold and in the presence of blebbistatin the area increase was only 2-fold (Figure 5C) with the same difference in brightness dynamics (Figure 5D). Under blebbistatin treatment median fluorescence intensity of mature FAs was four-fold lower than in control cells – 2566 A.U. instead of 10044 A.U to (p<0.00003) (Figure 5E). Thus, inhibition of myosin light chain leads to a shortening of the FA growth period, a decrease in the total amount of fluorescent vinculin within an individual FA, and results in significant decrease of vinculin density in the FA.
Under the action of blebbistatin disassembly of the preexisting FAs happens simultaneously with or slightly before the formation of new FAs. Formation of the new FAs under blebbistatin treatment was further confirmed by time-lapse microscopy started immediately upon addition of blebbistatin on A549 cells (Figure S3). Within 20-30 minutes all preexisting FAs disassembled, and in next 30 minutes, intermediate set of short-living small FAs appeared at the cell edge. Small FAs continued to assemble at the cell edge for at least 2 hours. The whole population of FAs is thus at the transition phase during the first hour of treatment. To perform a more detailed analysis of FA dynamics on a transition phase, we measured the area and integrated intensity of FAs in the same U2OS cells (n=5) that formed before and after blebbistatin treatment. Measurements were performed in 3 frames before exposure to blebbistatin, and every 5 minutes during the first 30 minutes after addition of the drug, as well as in frames corresponding to the following time points: 45 minutes, 2.5 hours, 3 hours, 3.5 hours. In U2OS cells, before exposure to the inhibitor, area and integrated intensity did not change over time (Kruskal-Wallis test with Dunn's test, p=0.36). Both area and integrated intensity decreased significantly in the first 5 minutes after the addition of blebbistatin, until 45 minutes, when the process came to a plateau (Kruskal-Wallis test with Dunn's test, p<0.0001) (Figure 5F,G). Thus, the loss of tension during the transition phase facilitates the disassembly of preformed FAs but does not preclude formation of small new FAs.
3.4. Actin Cytoskeleton Changes Under the Action of Myosin II Inhibitors
In both cell lines, after 3-hour treatment with blebbistatin, actin is mainly accumulated at the very edge of the cell (Figure 2, Figure S4). More detailed analysis shows that stress fibrils or other well-organized F-actin structures (dorsal arcs and arcs running along the stable edge) were diminished. In the area of actin accumulation near the membrane, small adhesions not associated with prominent actin bundles were formed. In some cells of the U2OS line, stress fibrils disassembled almost completely (Figure 6A), while in the body of 3T3 cells shortened stress fibrils and scattered small FAs remained (Figure 6B).
Since actin cytoskeleton changes dramatically after inhibition of myosin II phosphorylation, while small FAs continued to form, we next addressed the question on the behavior of FAs in the presence of inhibitors of actin polymerization.
3.5. Actin Filaments Are Necessary for the Formation of New Dynamic FAs Under the Total Loss Of Contractile Forces
Formation of new dynamic FAs under myosin II inhibition is generally thought to be dependent on the presence of residual cell tension after partial inhibition of myosin II [11,19]. However, a certain population of FAs assembled and disassembled even in the complete absence of phosphorylated myosin II. We suggested in this case residual actin bundles are responsible for the formation of new FAs at the cell edge. To test whether FAs formation on the cell edge depends on the presence of actin bundles, we treated cells with 1µM of cytochalasin D or 1 µM of latrunculin B for different time periodss (30 min, 3 and 6 hours) and visualized actin and phosphomyosin II distribution using confocal microscopy. 40 cells were examined in each time point.
30-minutes incubation of 3T3 fibroblasts with 1 µM cytochalasin D caused disassembly of FAs, all actin and phospho-myosin II structures in 80% of cells, in the remaining 20% thin actin fibers remained on stable edges associated with a small amount of phosphorylated myosin and tiny vinculin adhesions. After 3 hours under cytochalasin D treatment acto-myosin structures and FAs were disassembled in all 3T3 cells observed. Similarly latrunculin B caused disassembly of all F-actin cytoskeleton, phospho-myosin, and FAs in all 3T3 cells within 30 minutes. After 3 and 6 hours of incubation with the inhibitor we observed the fragmentation of cells (Figure 7A, Figure S5A).
After 30 minutes of incubation of U2OS cells with 1 µM cytochalasin D, ventral stress fibers and actin arcs disassembled. Thin actin bundles, and pale small vinculin adhesions were still present in 83% of U2OS cells (n = 34), while 17% of cells (n = 6) had no FAs and phospho-myosin staining at all. After 3 hours of incubation of U2OS cells with 1 µM cytochalasin D FAs disappeared everywhere, while we could still detect irregular non-organized thick and short actin bundles at the leading edge of the cell and sometimes – residual stress fibers along the stable edges.
Under the action of 1 μM of latrunculin B, all F-actin structures and FAs disassembled in 71% of U2OS cells, and phosphorylated myosin II was also absent. In the rest of cells thin actin fibers were located at stable cell edges, associated with tiny vinculin-positive spots. After 3 hours, all cells lacked the F-actin cytoskeleton and FAs. After 6 hours of treatment, no recovery of F-actin structures and FAs occurred (Figure 7B, Figure S5B).
To test whether FAs formation at the cell edge depends on the presence of actin bundles in more details, we treated A549 cells for 2 h with a rrange of concentrations of cytochalasin D (100 nM – 10 μM) or latrunculin B (300 nM-3 µM) and visualized FAs (paxillin staining) nd actin distribution using confocal microscopy (Figure 8).
Treatment with 100 nM of cytochalasin D results in partial shrinkage of cells and disassembly of long stress fibres in the majority of cells. However short actin fibers remained at the cell edges and numerous FAs were present at the cell margins associated with actin patches and residual actin bundles (Figure 8B). At the increasing concentrations of cytochalasin D the number of FAs decreased, yet some could be observed at the cell margin after treatment with 300 nM or even 1 μM of the drug (Figure 8 C). Higher concentration of cytochalasin D (3-10 μM) resulted in the complete shrinkage of cell lamella and only residual cytoplasmic staining was observed in some cells in paxillin channel (Figure 8D).
After 2 h incubation of A549 cells with 300 nM latrunculin B lamellas in all cells partially shrink and in many cells stress fibers disassembled completely, while in some cells (6 out of 41 cells examined) residual stress fibers remained (Figure 8E). Small FAs were observed at the cell edges in 21 out of 41 of the cell examined.
After 2 h incubation of A549 cells with 1 μM latrunculin B lamellas in all cells completely shrinked and cell bodies rounded up. Residual FAs could be determined in 13 out of 46 cells, while only diffuse staining in the cytoplasdm was observed in other cells (Figure 8F). After 2 h incubation of A549 cells with 3 μM latrunculin B the morphological effect was the same, however there was no FAs at all (Figure 8G).
4. Discussion
FAs are complex multi-protein structures that play a critical role in transmitting mechanical signals and biochemical cues between the cell's interior and its external environment. The idea of FAs as mechanosensitive organelles suggests that their size and dynamics can change in response to mechanical forces.
Tension of actin fibers generated by myosin II promotes the recruitment of structural FA proteins, leading to the growth and maturation of these structures. As the force increases, FAs enlarge and strengthen, enabling the cell to anchor more firmly to the ECM [5,20]. Under higher tension, FAs not only grow larger but also exhibit a distinct composition, characterized by an increased presence of mechanosensitive proteins such as talin, vinculin, and paxillin [21,22,23]. Vice versa, reduced cell tension leads to the breakdown of FAs and prevents the formation of new ones due to increased dissociation of mechanosensitive proteins [10,24]. It is generally accepted that intracellular tension is generated by interaction of actin fibers with phosphorylated myosin II and is applied to the FAs through actin fibers originating there [25]. The question is what is the correlation between tensile force and size of FAs?
There are some cues that strong myosin II-mediated tension is not critical for FA formation at least at some stages of maturation and growth. It was shown that the compositional maturation of FAs through recruitment of adhesion proteins and matrix remodeling occurs even when the myosin-mediated tension cues are reduced by 80 %, though a minimal level of myosin II activity is required to facilitate the formation and maturation of FAs at the leading edge [11,19], while cortical actin supports the early stages of FA assembly [3,11,26,27]. Together, these actin structures regulate formation, stability, and function of FAs and thus facilitating essential cellular processes such as adhesion, spreading, polarization, migration, and mechanosensing [27,28,29]. We suggest that the only structures responsible for the formation of dynamic nascent adhesions in the cells under complete loss of myosin II-dependent tension are polymers of cortical actin that continue assembling under the plasma membrane [30,31]. To test this directly, we treated cells with the inhibitors of actin polymerization and observed rapid disassembly of actin bundles under both cytochalasin D and latrunculin B treatment along with the retraction of lamella. Using high resolution confocal microscopy, we confirmed presence of continuous layer of F-actin fibers near the cell edge after blebbistatin treatment, while this layer was almost completely lost after treatments with latrunculin B or cytochalasin D. This is in accord with recent observations on CAD cells that blebbistatin does not affect the peripheral F-actin while stimulates microtubule growth towards the cell margin, but latrunculin B significantly reduces the amount of F-actin near the cell edge within several hours [32] (Cisterna et al., 2024). In accord with the previous data [13,31] we suggest that short actin bundles are still growing under the action of blebbistatin thus allowing formation of the small FAs, while new FAs cannot form in the presence of actin inhibitors. Mechanisms that facilitate the interaction between cortical actin and FAs include the Arp2/3 complex interacting with vinculin and FAK [33,34]; VASP binding to actin and associating with vinculin and zyxin [35]; direct binding of vinculin and talin to actin [36,37]; and α-actinin, an actin cross-linker in lamellipodia [38]. It was also shown that mDia2, a formin involved in actin polymerization, localizes to the cortical actin network in migrating cells. This localization of actin-binding proteins is essential for maintaining polymerization-competent actin filaments at FAs, thus playing a significant role in adhesion dynamics and turnover [31,39,40].
Overall, we demonstrate that partial inhibition of myosin II results in the decrease of FA’s size but stabilizes them. Complete inhibition of myosin II results in the rearrangement of FA array – existing FAs disassemble and are substituted with small FAs which do not grow, however, are relatively stable, keeping lamella attached to the substrate. Inhibition of actin polymerization results in complete and irreversible disassembly of FAs. It happens in parallel with shrinkage of cell lamellum (Figures 8D, G, and 9). We suggest that when actin polymerization is impaired FA’s proteins (talin and vinculin) cannot interact with F-actin at the cell edge, thus no FAs can form. These insights advance our understanding of the mechanisms underlying cell spreading, polarization and migration, particularly the role of the cortical actin network in these processes.
5. Conclusion
Relatively rapid disassembly of large FAs happens after inhibition of myosin II or after partial inhibition of actin polymerization. In both cases lamella does not shrink significantly and small FAs are formed de novo at the cell edges. When actin polymerization is significantly perturbed FAs rapidly disassemble, lamella shrinks and no new FAs form. We propose a model, where after myosin II relaxation or partial actin desorganization lamella is supported by small FAs that are able to form but do not enlarge because of the lack of tension exerted by altered cytoskeleton. These small FAs turnover slower than normal ones and form only in the presence of polymerized actin filaments.
Supplementary Materials
The following supporting information can be downloaded at the website of this paper posted on Preprints.org.
Author Contributions
A.K. designed the study, performed the main experiments, and analyzed the data. E.S. and A.S. contributed to generation of stable cell lines. M.T. contributed to live cell imaging and data analysis. A.K., A.S. and I.A.V. wrote the manuscript with contributions from all authors. A.S. and I.A.V. initiated and supervised the project. I.A.V. was reponsible for funding acquisition. All authors have read and agreed to the published version of the manuscript.
Funding
This research has been funded by the grant number AP23488797 from the Science Committee of the Ministry of Science and Higher Education of the Republic of Kazakhstan to I.A.V.
Institutional Review Board Statement
Not applicable.
Informed Consent Statement
Not applicable.
Data Availability Statement
All raw data supporting the results obtained are available from the authors upon request.
Acknowledgments
We would like to acknowledge the contribution of Dr. Darya Potashnikova for cell sorting in the preparation of stably transfected cell lines.We would like to acknowledge Core Facility at Nazarbayev University for the excellent technical support and assisting with confocal microscopy and oligonucleotide synthesis.
Conflicts of Interest
The authors declare no conflicts of interest.
References
- Cimmino, C., Rossano, L., Netti, P. A., & Ventre, M. Spatio-Temporal Control of Cell Adhesion: Toward Programmable Platforms to Manipulate Cell Functions and Fate. Front Bioeng Biotechnol, 2018, 6, 190. [CrossRef]
- Vicente-Manzanares, M., & Horwitz, A. R. Adhesion dynamics at a glance. J Cell Sci, 2011, 124(Pt 23), 3923-3927. [CrossRef]
- Alexandrova, A. Y., Arnold, K., Schaub, S., Vasiliev, J. M., Meister, J. J., Bershadsky, A. D., & Verkhovsky, A. B. Comparative dynamics of retrograde actin flow and focal adhesions: formation of nascent adhesions triggers transition from fast to slow flow. PLoS One, 2008, 3(9), e3234. [CrossRef]
- Zaidel-Bar, R., Cohen, M., Addadi, L., & Geiger, B. Hierarchical assembly of cell-matrix adhesion complexes. Biochem Soc Trans, 2004, 32(Pt3), 416-420. [CrossRef]
- Geiger, B., Spatz, J. P., & Bershadsky, A. D. Environmental sensing through focal adhesions. Nat Rev Mol Cell Biol, 2009, 10(1), 21-33. [CrossRef]
- Giannone, G., Mège, R. M., & Thoumine, O. Multi-level molecular clutches in motile cell processes. Trends Cell Biol, 2009, 19(9), 475-486. [CrossRef]
- Wehrle-Haller, B. Assembly and disassembly of cell matrix adhesions. Curr Opin Cell Biol, 2012, 24(5), 569-581. [CrossRef]
- Chrzanowska-Wodnicka, M., & Burridge, K. Rho-stimulated contractility drives the formation of stress fibers and focal adhesions. J Cell Biol, 1996, 133(6), 1403-1415. [CrossRef]
- Vicente-Manzanares, M., Newell-Litwa, K., Bachir, A. I., Whitmore, L. A., & Horwitz, A. R. Myosin IIA/IIB restrict adhesive and protrusive signaling to generate front-back polarity in migrating cells. J Cell Biol, 2011, 193(2), 381-396. [CrossRef]
- Wolfenson, H., Bershadsky, A., Henis, Y. I., & Geiger, B. Actomyosin-generated tension controls the molecular kinetics of focal adhesions. J Cell Sci, 2011, 124(Pt 9), 1425-1432. [CrossRef]
- Stricker, J., Beckham, Y., Davidson, M. W., & Gardel, M. L. Myosin II-mediated focal adhesion maturation is tension insensitive. PLoS One, 2013, 8(7), e70652. [CrossRef]
- Han, S. J., Azarova, E. V., Whitewood, A. J., Bachir, A., Guttierrez, E., Groisman, A., . . . Danuser, G. Pre-complexation of talin and vinculin without tension is required for efficient nascent adhesion maturation. eLife, 2021, 10. [CrossRef]
- Hirata, H., Tatsumi, H., & Sokabe, M. Mechanical forces facilitate actin polymerization at focal adhesions in a zyxin-dependent manner. J Cell Sci, 2008, 121 (Pt 17), 2795-2804. [CrossRef]
- Berginski, M. E., Vitriol, E. A., Hahn, K. M., & Gomez, S. M. High-resolution quantification of focal adhesion spatiotemporal dynamics in living cells. PLoS One, 2011, 6(7), e22025. [CrossRef]
- Bershadsky, A., Kozlov, M., & Geiger, B. Adhesion-mediated mechanosensitivity: a time to experiment, and a time to theorize. Curr Opin Cell Biol, 2006, 18(5), 472-481. [CrossRef]
- Rossier, O., Octeau, V., Sibarita, J. B., Leduc, C., Tessier, B., Nair, D., . . . Giannone, G. Integrins β1 and β3 exhibit distinct dynamic nanoscale organizations inside focal adhesions. Nat Cell Biol, 2012, 14(10), 1057-1067. [CrossRef]
- Dumbauld, D. W., Michael, K. E., Hanks, S. K., & García, A. J. Focal adhesion kinase-dependent regulation of adhesive forces involves vinculin recruitment to focal adhesions. Biol Cell, 2010, 102(4), 203-213. [CrossRef]
- Guo, W. H., Frey, M. T., Burnham, N. A., & Wang, Y. L. Substrate rigidity regulates the formation and maintenance of tissues. Biophys J, 2006, 90(6), 2213-2220. [CrossRef]
- Oakes, P. W., Beckham, Y., Stricker, J., & Gardel, M. L. Tension is required but not sufficient for focal adhesion maturation without a stress fiber template. J Cell Biol, 2012, 196(3), 363-374. [CrossRef]
- Burridge, K., & Guilluy, C. Focal adhesions, stress fibers and mechanical tension. Exp Cell Res, 2016, 343(1), 14-20. [CrossRef]
- Holle, A. W., McIntyre, A. J., Kehe, J., Wijesekara, P., Young, J. L., Vincent, L. G., & Engler, A. J. High content image analysis of focal adhesion-dependent mechanosensitive stem cell differentiation. Integr Biol (Camb), 2016, 8(10), 1049-1058. [CrossRef]
- Ripamonti, M., Wehrle-Haller, B., & de Curtis, I. Paxillin: A Hub for Mechano-Transduction from the β3 Integrin-Talin-Kindlin Axis. Front Cell Dev Biol, 2022, 10, 852016. [CrossRef]
- Shoyer, T. C., Gates, E. M., Cabe, J. I., Conway, D. E., & Hoffman, B. D. Coupling During Collective Cell Migration is Controlled by a Vinculin Mechanochemical Switch. bioRxiv. 2023,. [CrossRef]
- Grandy, C., Port, F., Pfeil, J., Oliva, M. A. G., Vassalli, M., & Gottschalk, K. E. Cell shape and tension alter focal adhesion structure. Biomater Adv, 2003, 145, 213277. [CrossRef]
- Watanabe, T., Hosoya, H., & Yonemura, S. Regulation of myosin II dynamics by phosphorylation and dephosphorylation of its light chain in epithelial cells. Mol Biol Cell, 2007, 18(2), 605-616. [CrossRef]
- Choi, C. K., Vicente-Manzanares, M., Zareno, J., Whitmore, L. A., Mogilner, A., & Horwitz, A. R. Actin and alpha-actinin orchestrate the assembly and maturation of nascent adhesions in a myosin II motor-independent manner. Nat Cell Biol, 2008, 10(9), 1039-1050. [CrossRef]
- Gardel, M. L., Schneider, I. C., Aratyn-Schaus, Y., & Waterman, C. M. Mechanical integration of actin and adhesion dynamics in cell migration. Annu Rev Cell Dev Biol, 2010, 26, 315-333. [CrossRef]
- Hotulainen, P., & Lappalainen, P. Stress fibers are generated by two distinct actin assembly mechanisms in motile cells. J Cell Biol, 2006, 173(3), 383-394. [CrossRef]
- Cronin, N. M., & DeMali, K. A. Dynamics of the Actin Cytoskeleton at Adhesion Complexes. Biology (Basel), 2021, 11(1). [CrossRef]
- Carvalho, K., Lemière, J., Faqir, F., Manzi, J., Blanchoin, L., Plastino, J., . . . Sykes, C. Actin polymerization or myosin contraction: two ways to build up cortical tension for symmetry breaking. Philos Trans R Soc Lond B Biol Sci, 2013, 368(1629), 20130005. [CrossRef]
- Mittal, N., Michels, E. B., Massey, A. E., Qiu, Y., Royer-Weeden, S. P., Smith, B. R., . . . Han, S. J. Myosin-independent stiffness sensing by fibroblasts is regulated by the viscoelasticity of flowing actin. Commun Mater, 2024, 5. [CrossRef]
- Cisterna, B. A., Skruber, K., Jane, M. L., Camesi, C. I., Nguyen, I. D., Liu, T. M., . . . Vitriol, E. A. Prolonged depletion of profilin 1 or F-actin causes an adaptive response in microtubules. J Cell Biol, 2024, 223(7). [CrossRef]
- DeMali, K. A., Barlow, C. A., & Burridge, K. Recruitment of the Arp2/3 complex to vinculin: coupling membrane protrusion to matrix adhesion. J Cell Biol, 2002, 159(5), 881-891. [CrossRef]
- Serrels, B., Serrels, A., Brunton, V. G., Holt, M., McLean, G. W., Gray, C. H., . . . Frame, M. C. Focal adhesion kinase controls actin assembly via a FERM-mediated interaction with the Arp2/3 complex. Nat Cell Biol, 2007, 9(9), 1046-1056. [CrossRef]
- Bear, J. E., & Gertler, F. B. Ena/VASP: towards resolving a pointed controversy at the barbed end. J Cell Sci, 2009, 122(Pt 12), 1947-1953. [CrossRef]
- Critchley, D. R. Biochemical and structural properties of the integrin-associated cytoskeletal protein talin. Annu Rev Biophys, 2009, 38, 235-254. [CrossRef]
- Ziegler, W. H., Liddington, R. C., & Critchley, D. R. The structure and regulation of vinculin. Trends Cell Biol, 2006, 16(9), 453-460. [CrossRef]
- Sjöblom, B., Salmazo, A., & Djinović-Carugo, K. Alpha-actinin structure and regulation. Cell Mol Life Sci, 2008, 65(17), 2688-2701. [CrossRef]
- Saphirstein, R. J., Gao, Y. Z., Lin, Q. Q., & Morgan, K. G. Cortical actin regulation modulates vascular contractility and compliance in veins. J Physiol, 2015, 593(17), 3929-3941. [CrossRef]
- Han, J., Lin, K. H., & Chew, L. Y. Study on the regulation of focal adesions and cortical actin by matrix nanotopography in 3D environment. J Phys Condens Matter, 2017, 29(45), 455101. [CrossRef]
Figure 1.
Focal adhesions (vinculin-RFP expression) and F-actin (phalloidin-Alexa 647 staining) in control cells. Airyscan images of vinculin (green) and actin (red) in 3T3 (А) and U2OS cells (B) cells. (A) In 3T3 cells actin cytoskeleton consists mainly of stress fibers running along cell axis or perpendicular to the cell edge. FAs are mainly localized at the cell edges and often are associated with the ends of stress-fibers. (В) and (C) In U2OS and A549 cells actin cytoskeleton also contains dorsal fibers (asterisks) and actin arcs (arrowheads). Area (D), integrated brightness (E), lifetime (F). Data on the graphs are shown as median with range. Scale bar – 5 µm.
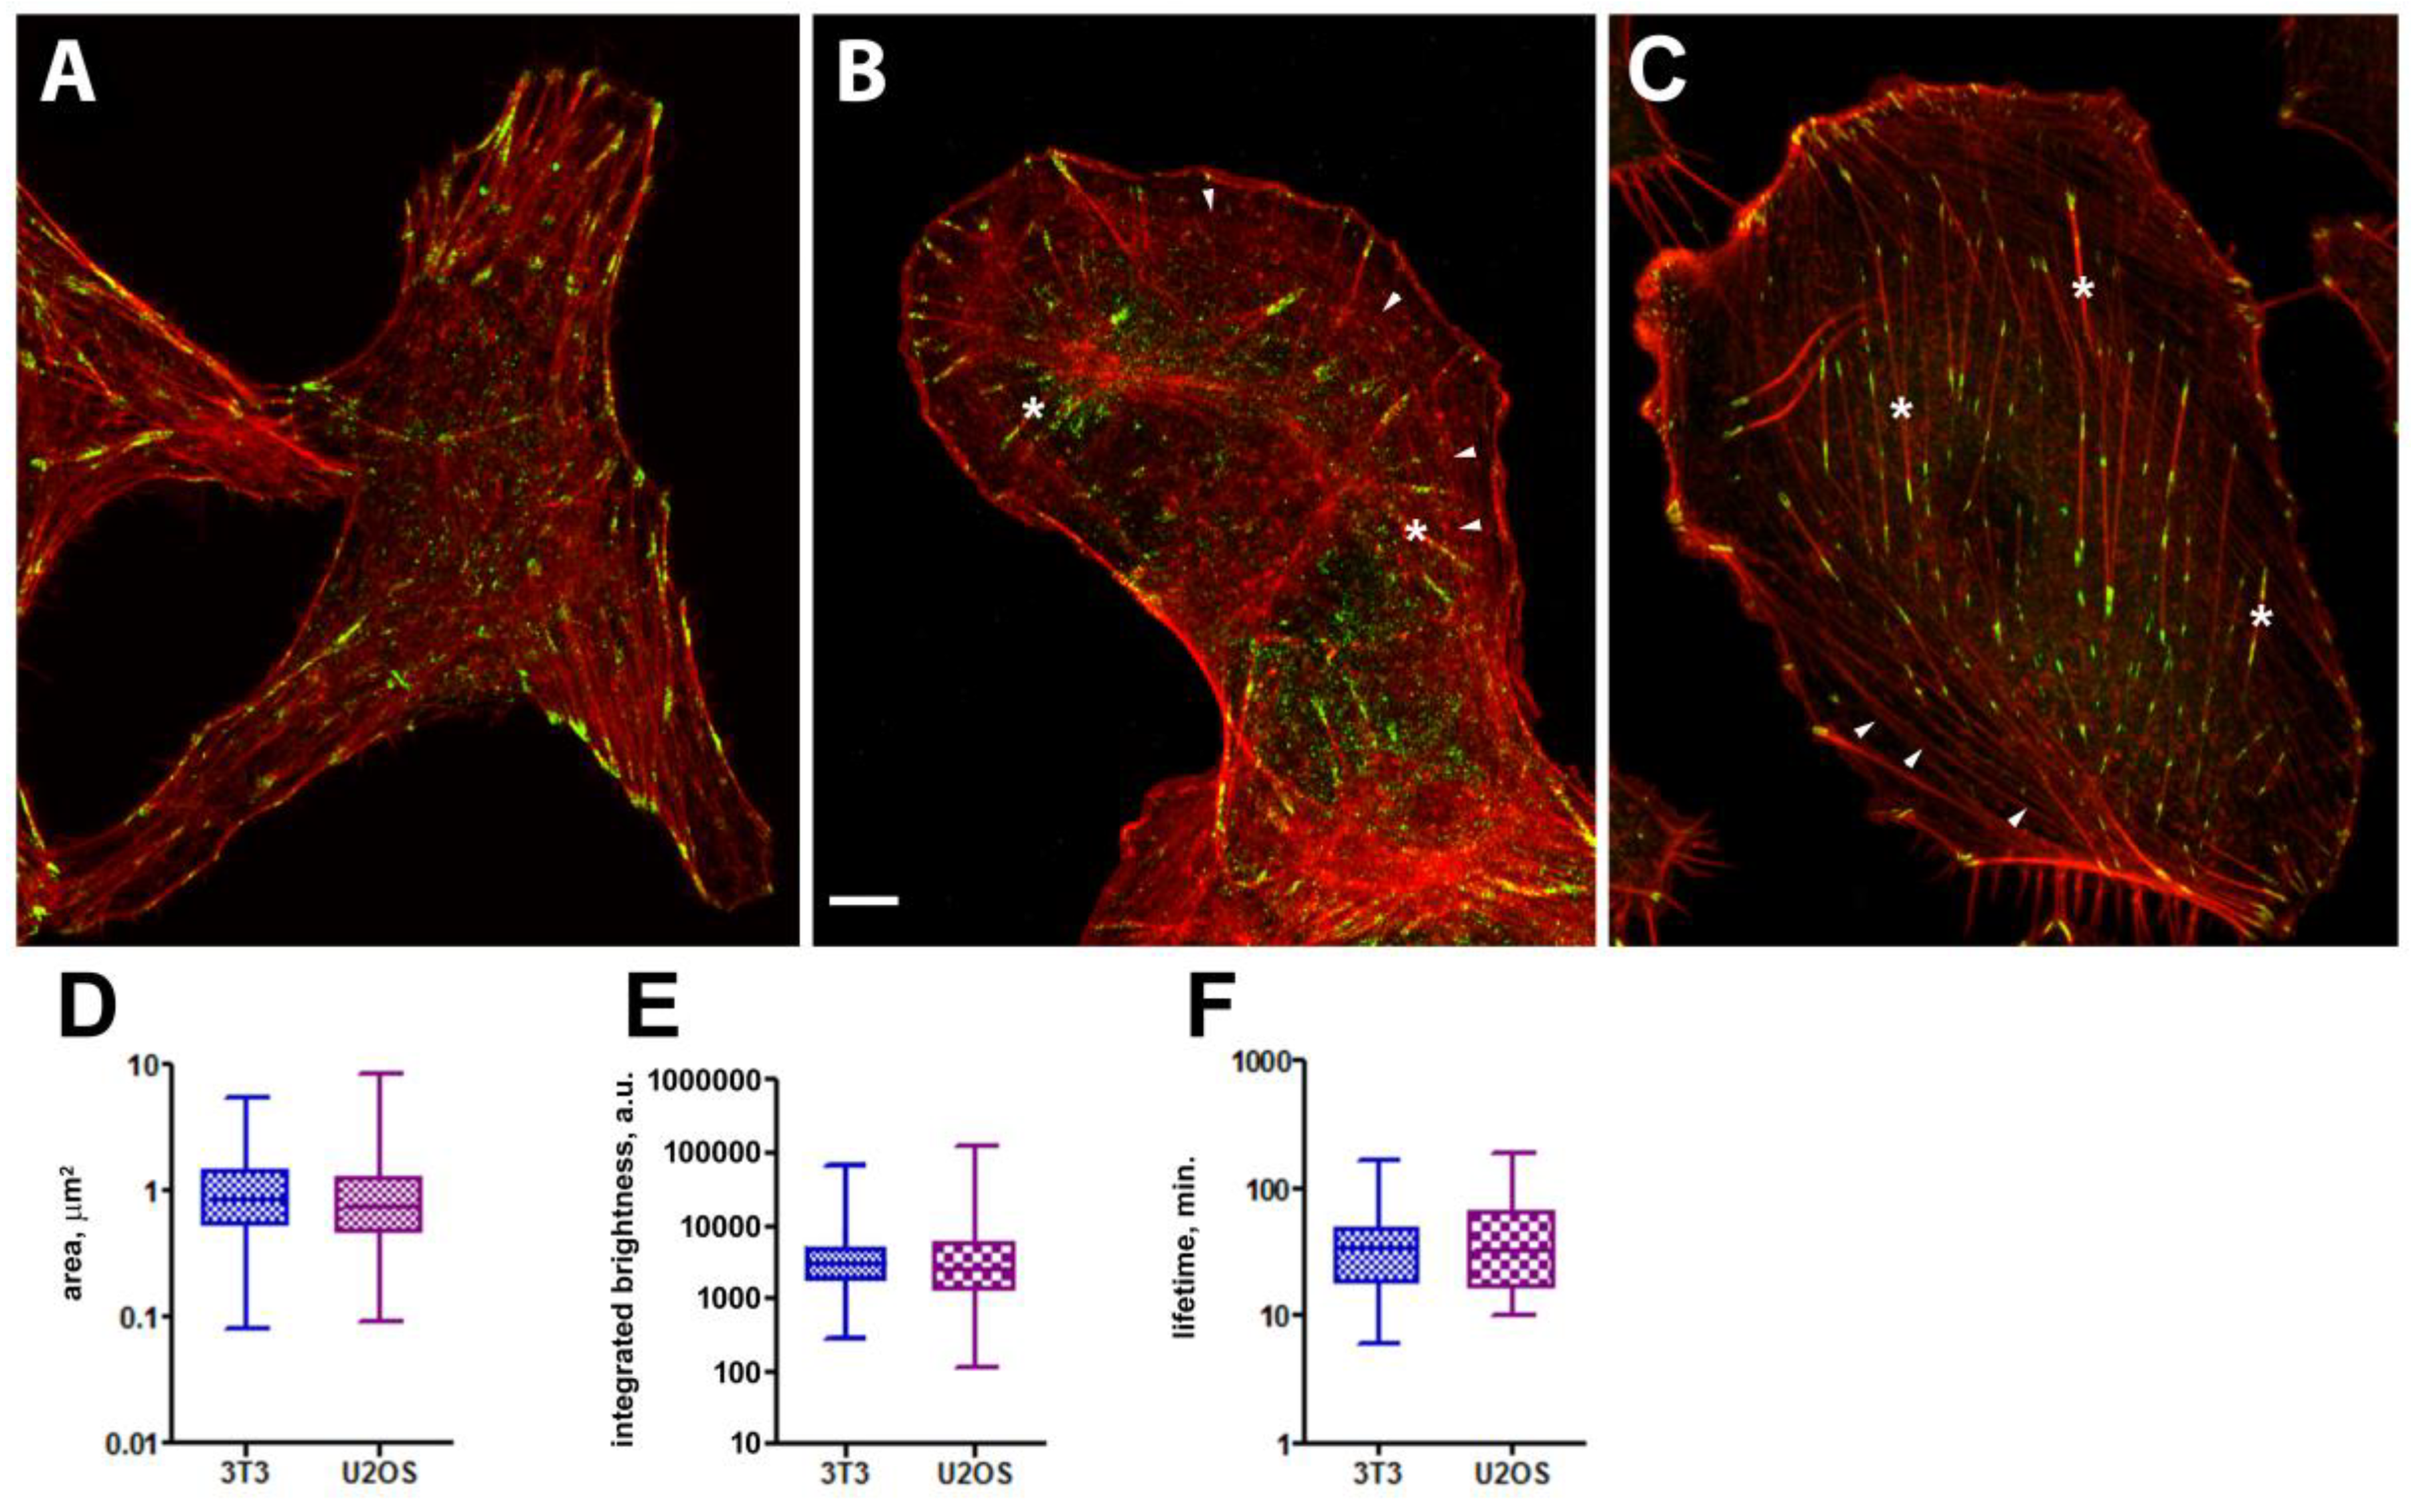
Figure 2.
Actin (red, phalloidin staining) and phosphomyosin II light chains (green, anti-myosin II antibody staining) in 3Т3 (A) and U2OS cells (B) under the action of inhibitors of myosin II phosphorylation. After 30 min treatment in some cells treated with ML-7 staining with phosphomyosin along actin fibers could be observed (arrowheads). This staining disappears after 180 min. of treatment. Only residual staining for the phosphomyosin II remains after 30 min. treatment with Y-27632 and blebbistatin. Under the action of ML-7 and Y-27632 residual actin fibers remain for at least 360 min., while under the action of blebbistatin prominent actin fibers completely disappear between 180 min and 360 min. Bar – 10 µm. Immunoblotting of phosphomyosin II light chains in 3T3 (C) and U2OS (D) cells in 3 hours after treatment with myosin II phosphorylation pathway inhibitors, α-tubulin is taken as a loading control.
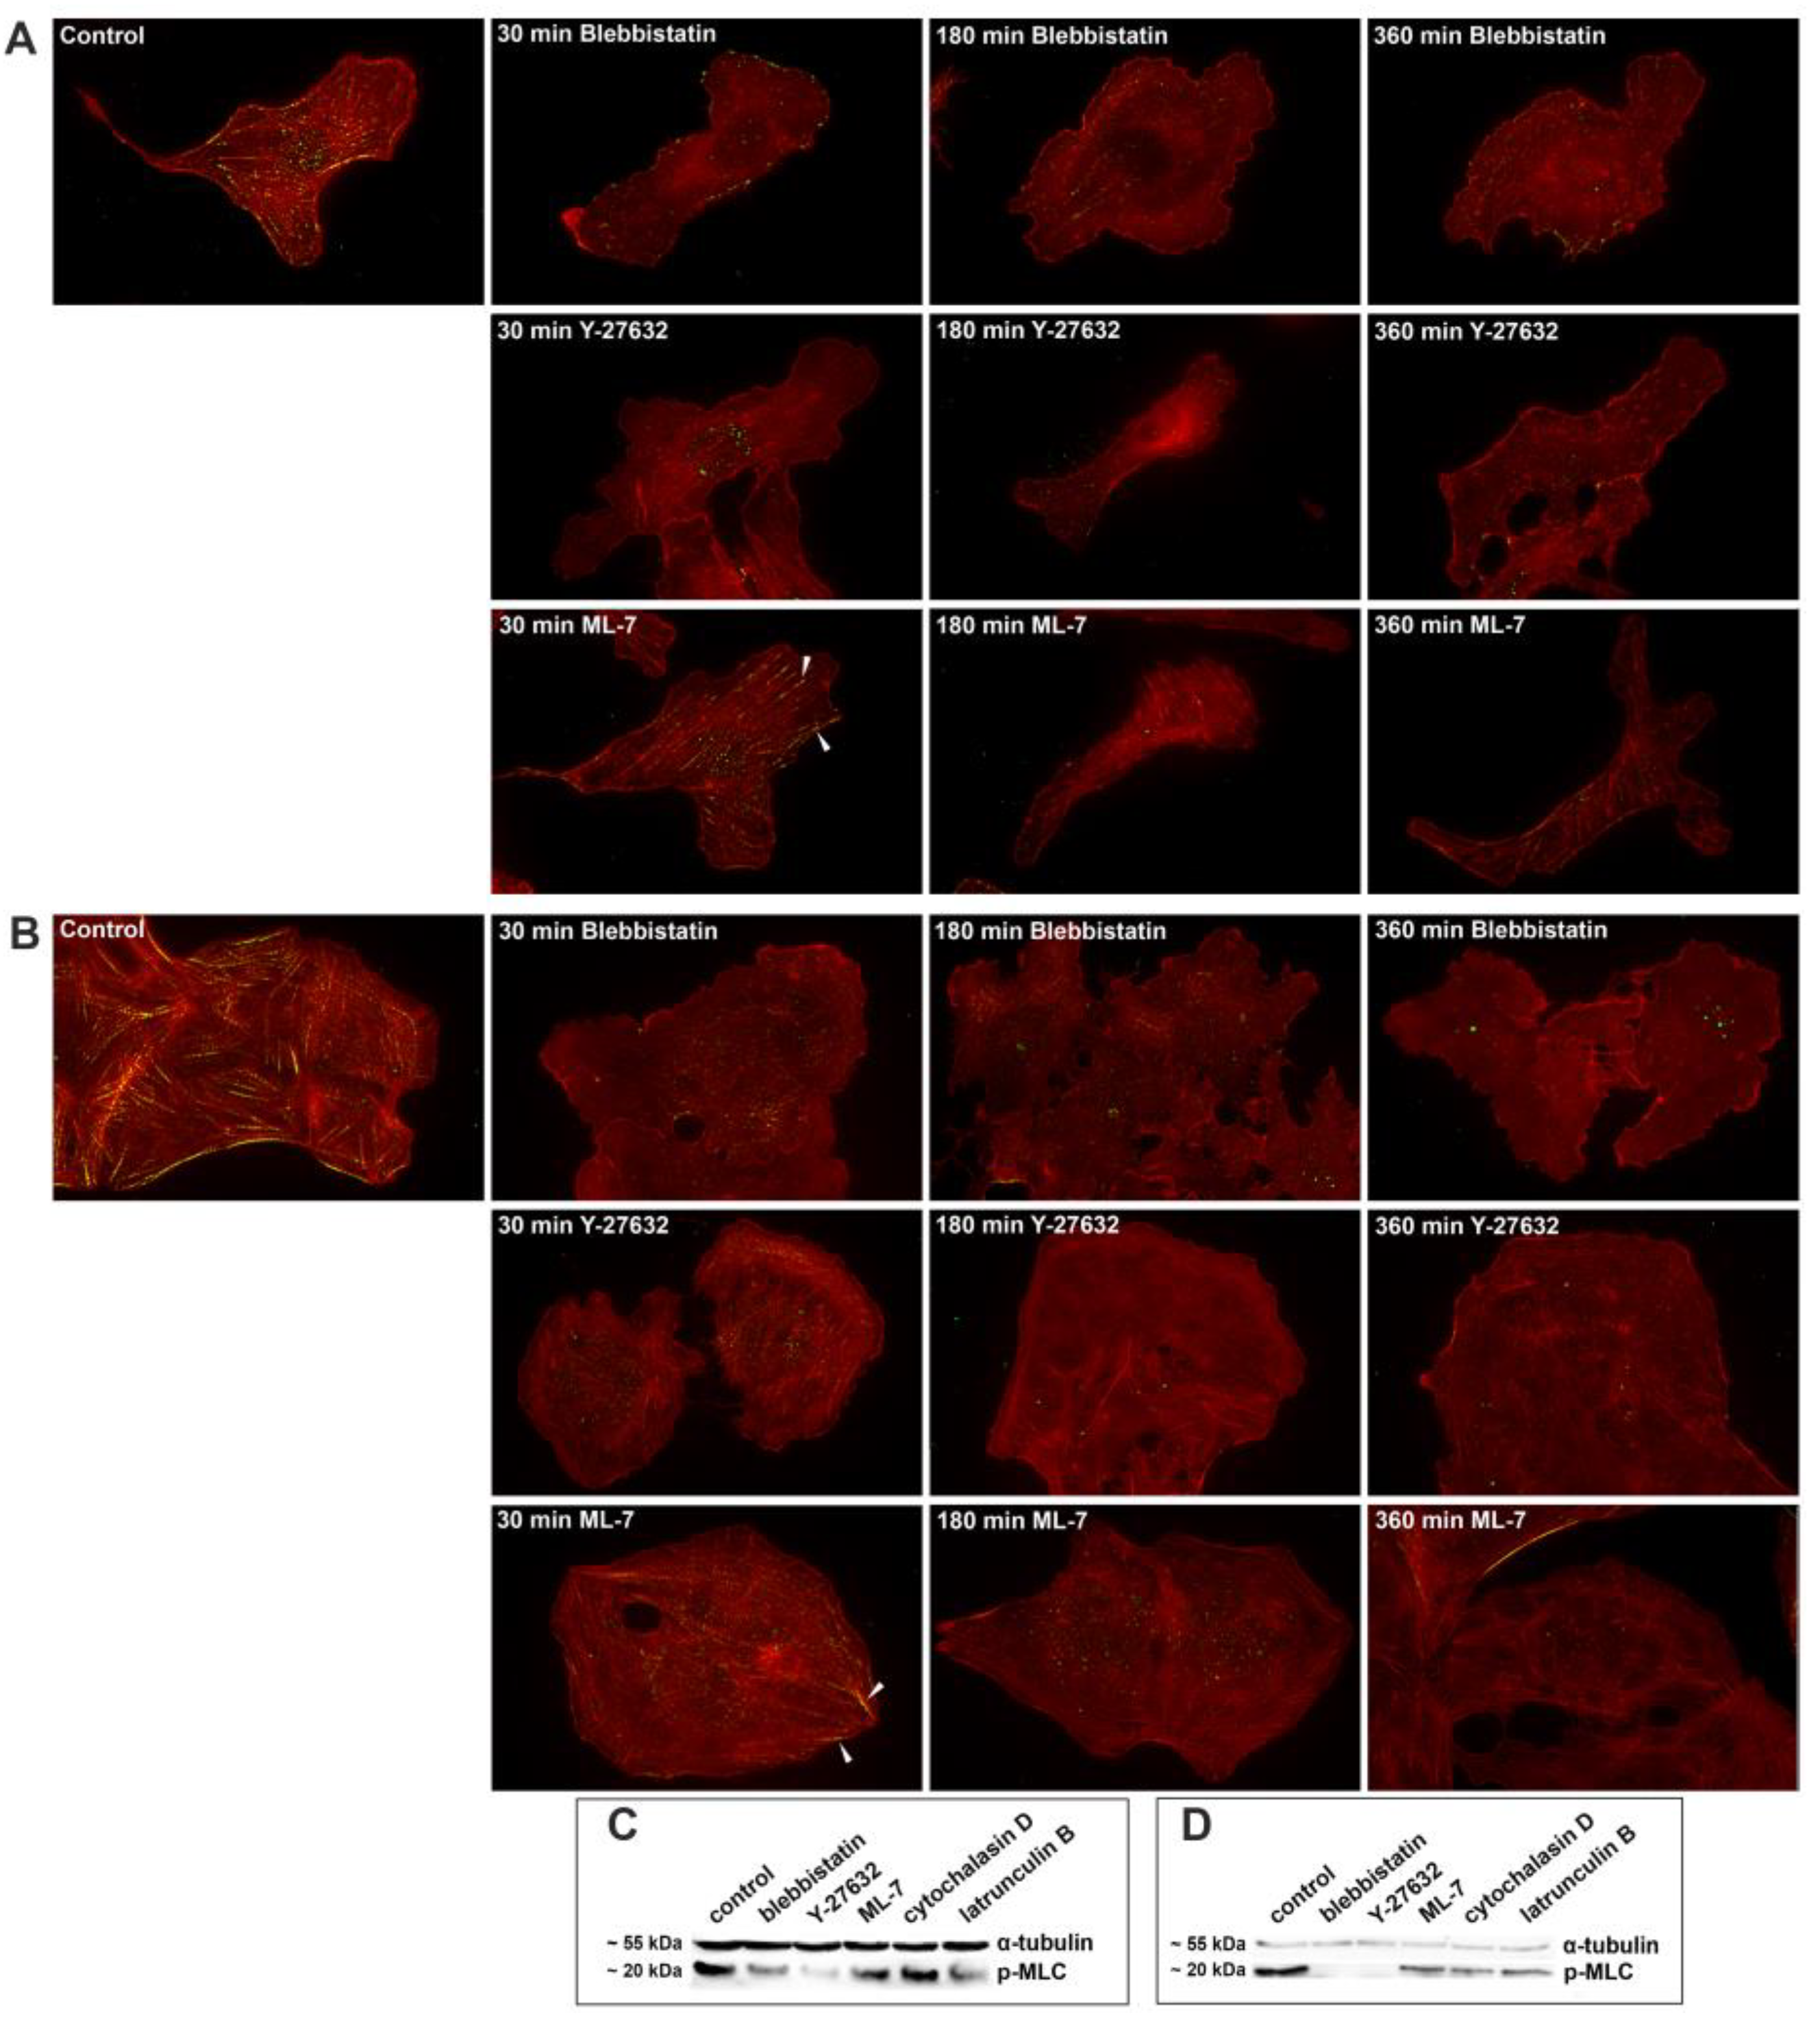
Figure 3.
FAs on fixed specimens in 3T3-vinculin-RFP and U2OS-vinculin-RFP cells after 30 min. treatment with myosin II inhibitors. (A) 3T3 cells, control, 30 minutes treatment with 45 μM blebbistatin, 10 µM Y-27632, and 10 µM ML-7. First two treatments results in reduction of FA size and brightness. (B) In control U2OS cells most FAs are located at the cell edge. Treatment with 45 μM blebbistatin or 10 µM Y-27632 reduces FAs to small, pale adhesions after 30 minutes, while treatment with 10 µM ML-7 shows no change in first 30 min. Scale bar – 10 µm.
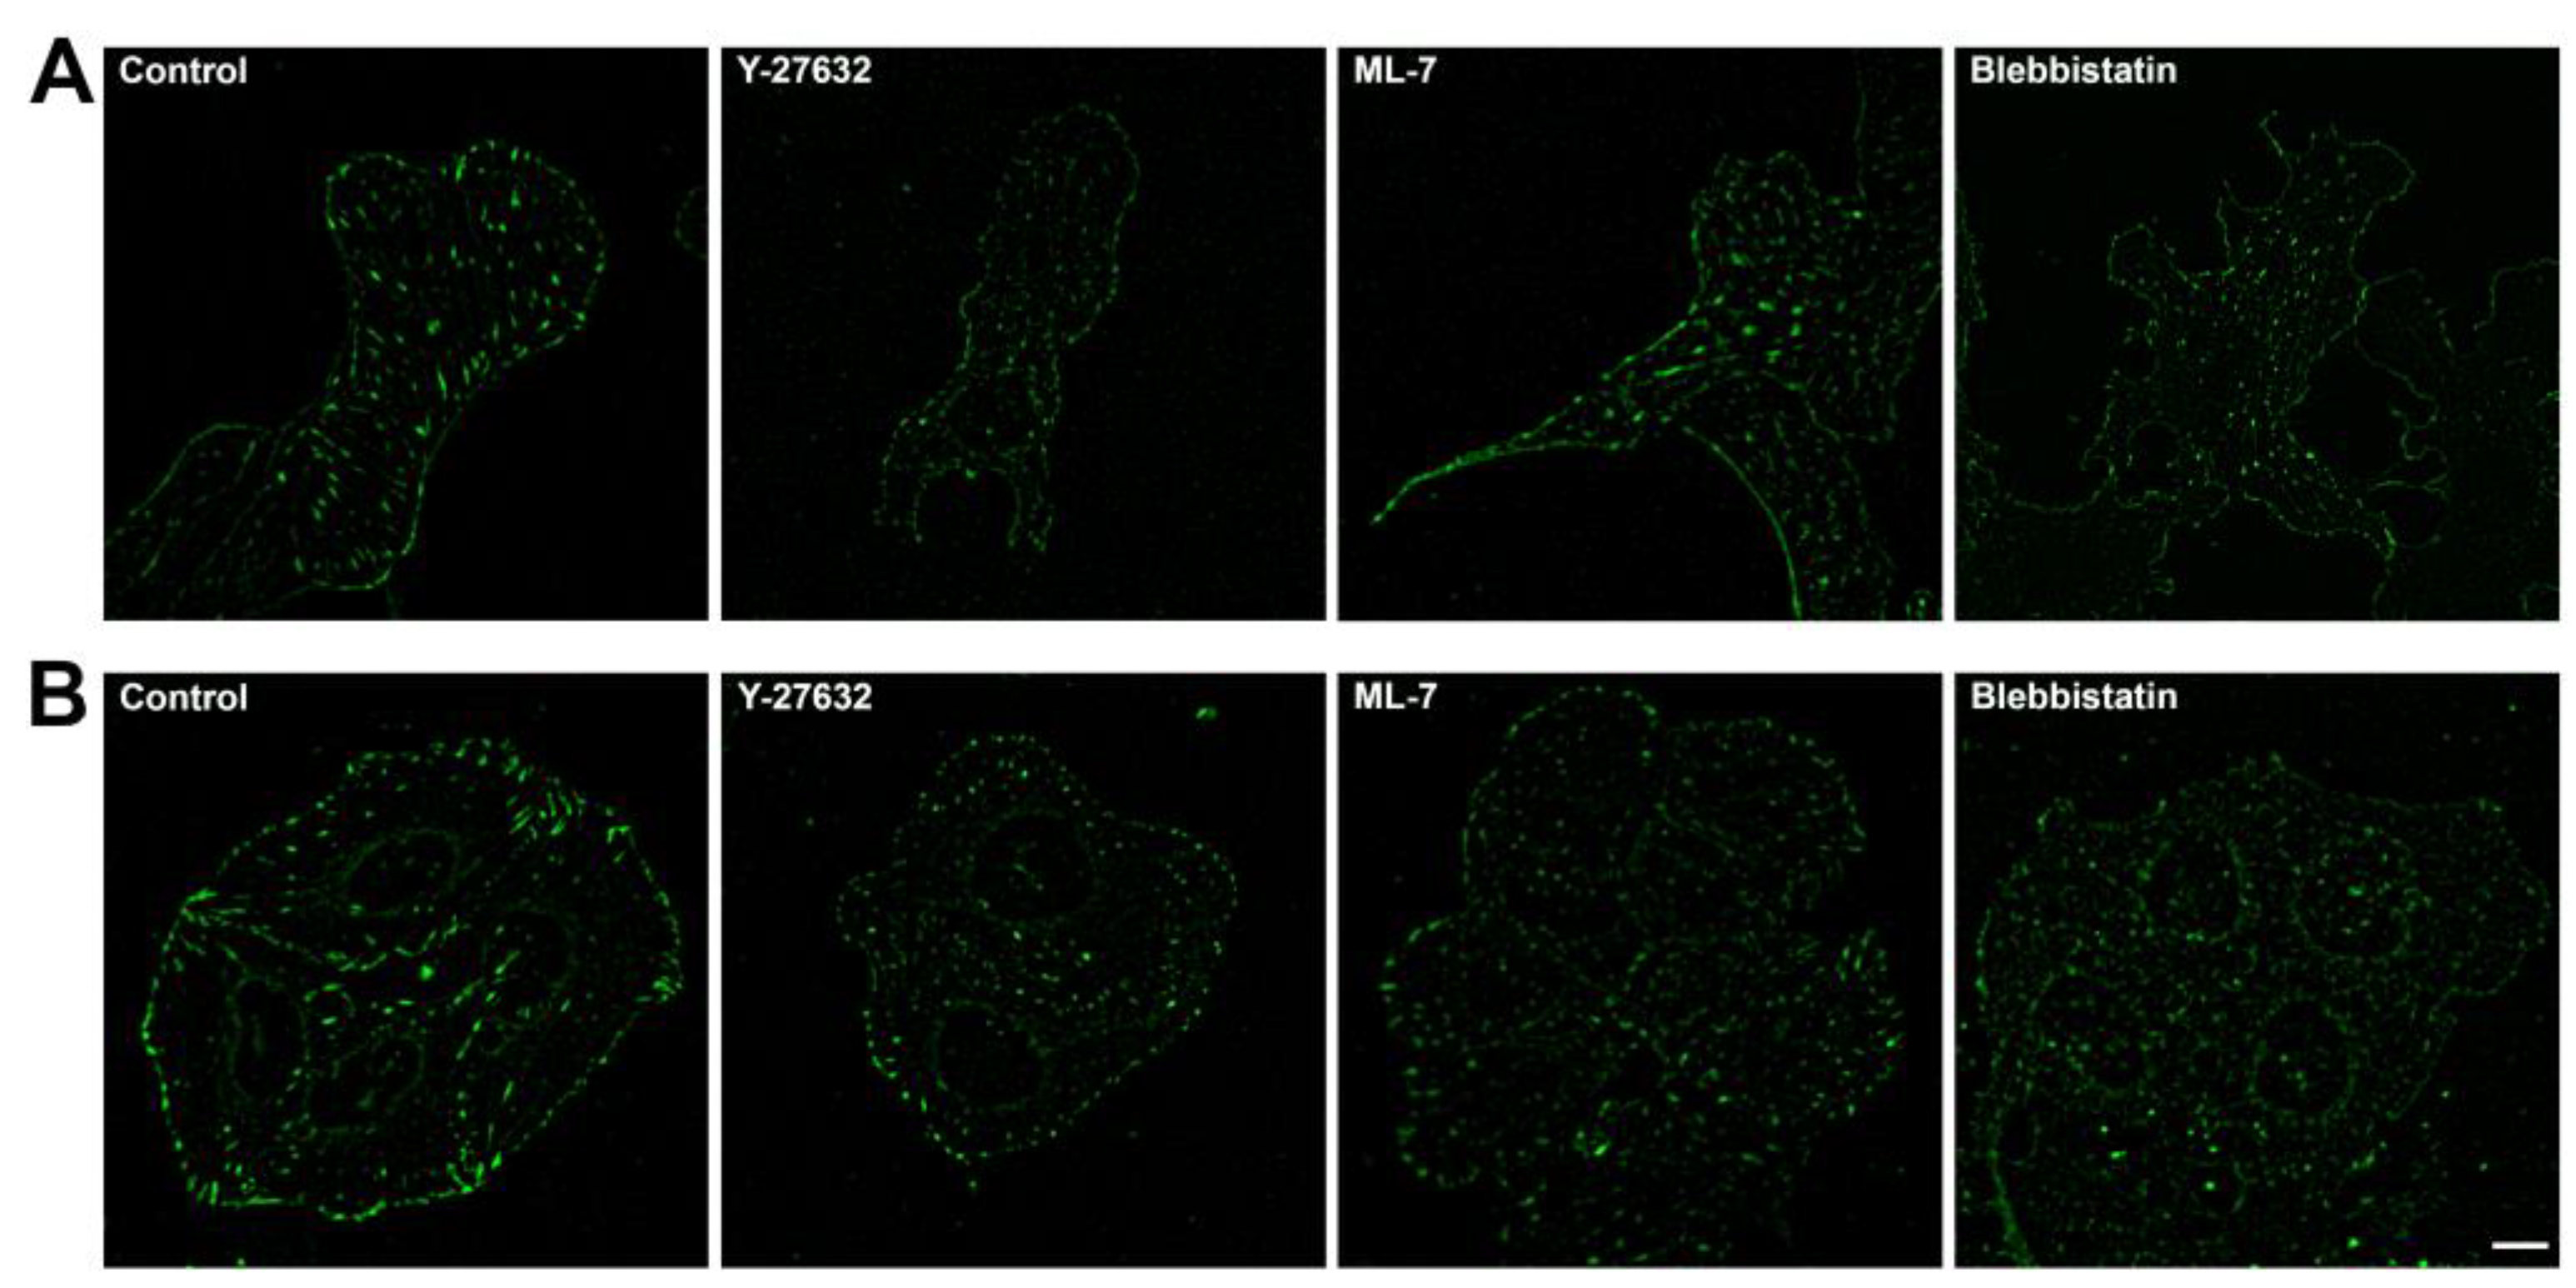
Figure 4.
Quantitative analysis of the changes of FA area and brightness under myosin II phosphorylation pathway inhibitors. FA area change after treatment with 10 μM Y-27632 (A, G), 10 μM ML-7 (C, I) and 45 μM blebbistatin (E, K) in 3T3 and U2OS cells respectively. FA integrated brightness after treatment with 10 μM Y-27632 (B, H), 10 μM ML-7 (D, J) and 45 μM blebbisttain (F, L) in 3T3 and U2OS cells respectively. Data are shown as median with range. (*) p<0.05; (***) – p<0.001; (****) p<0.0001.
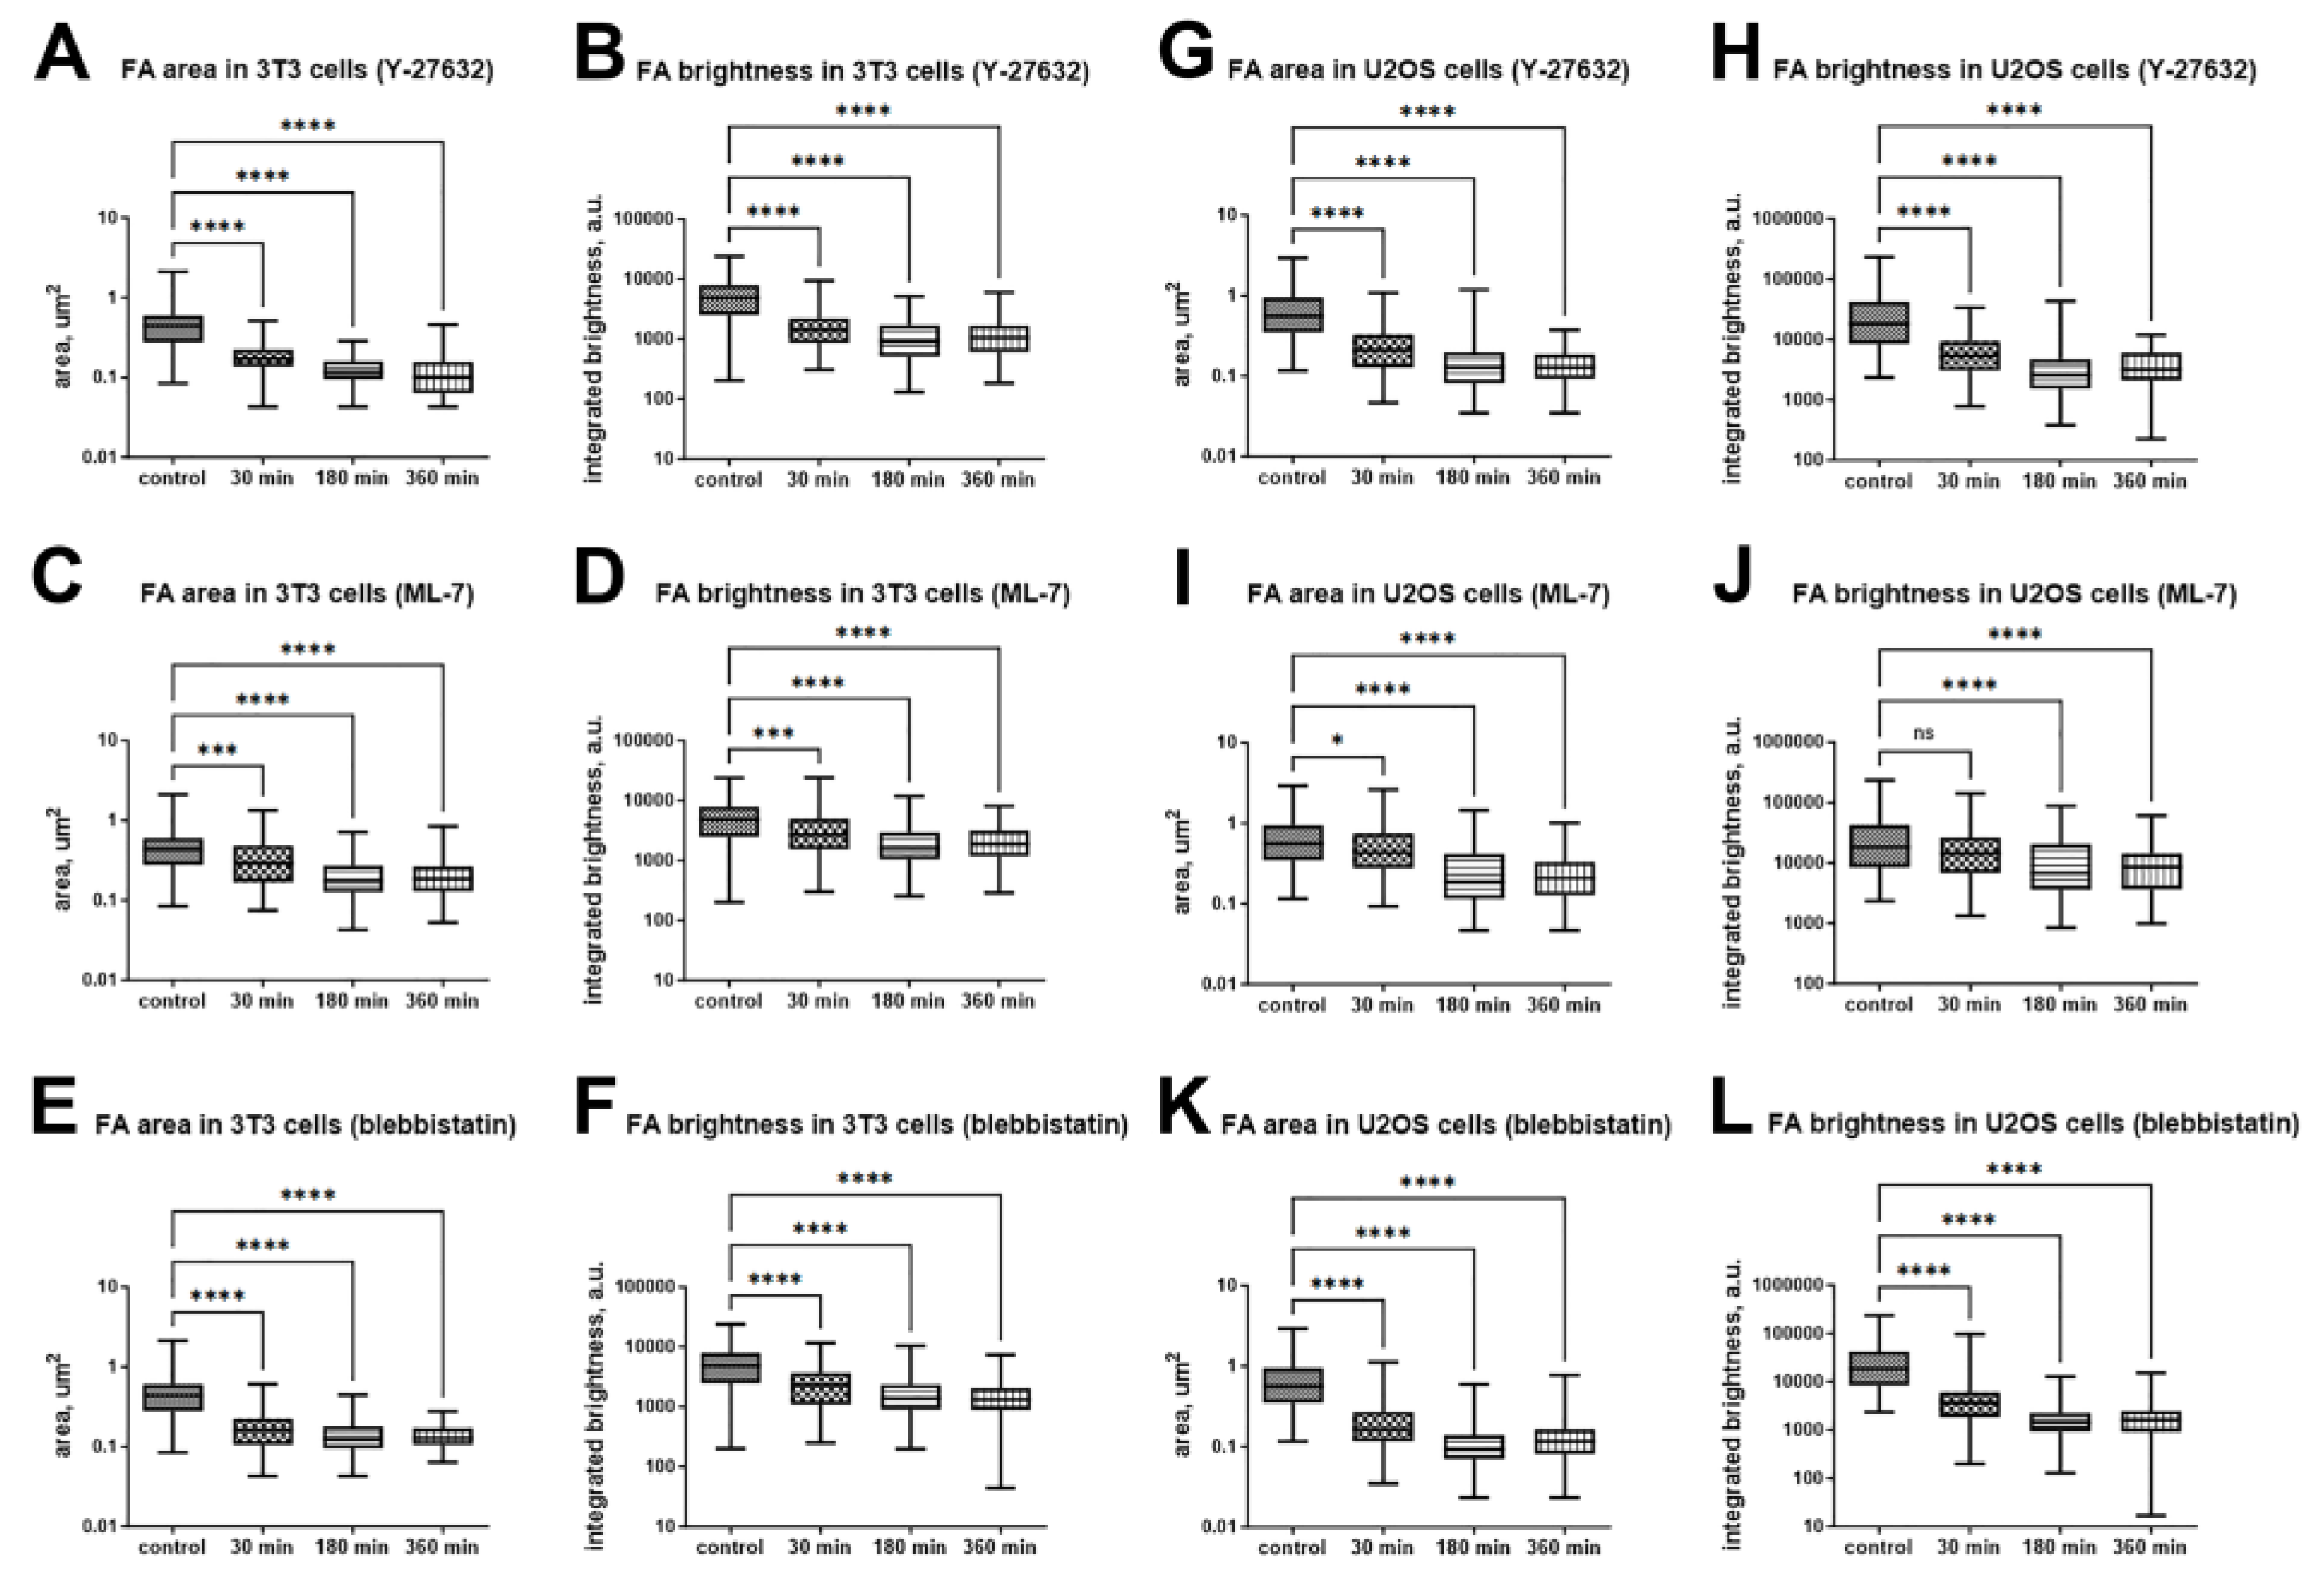
Figure 5.
Dynamic parameters of FAs in control and under treatment with myosin II inhibitors. Median lifespan of FAs in 3T3 (A) and U2OS (B) cells. Downregulation of FA growth: relative changes of area in 3T3 cells (C) and relative changes of integral intensity in 3T3 cells (D) and U2OS cells (E). Changes in maximal area (F) and integral intensity (G) of FAs in 3T3 cells during blebbistatin treatment. Data on (C)-(G) are presented as mean±SEM (n=20).
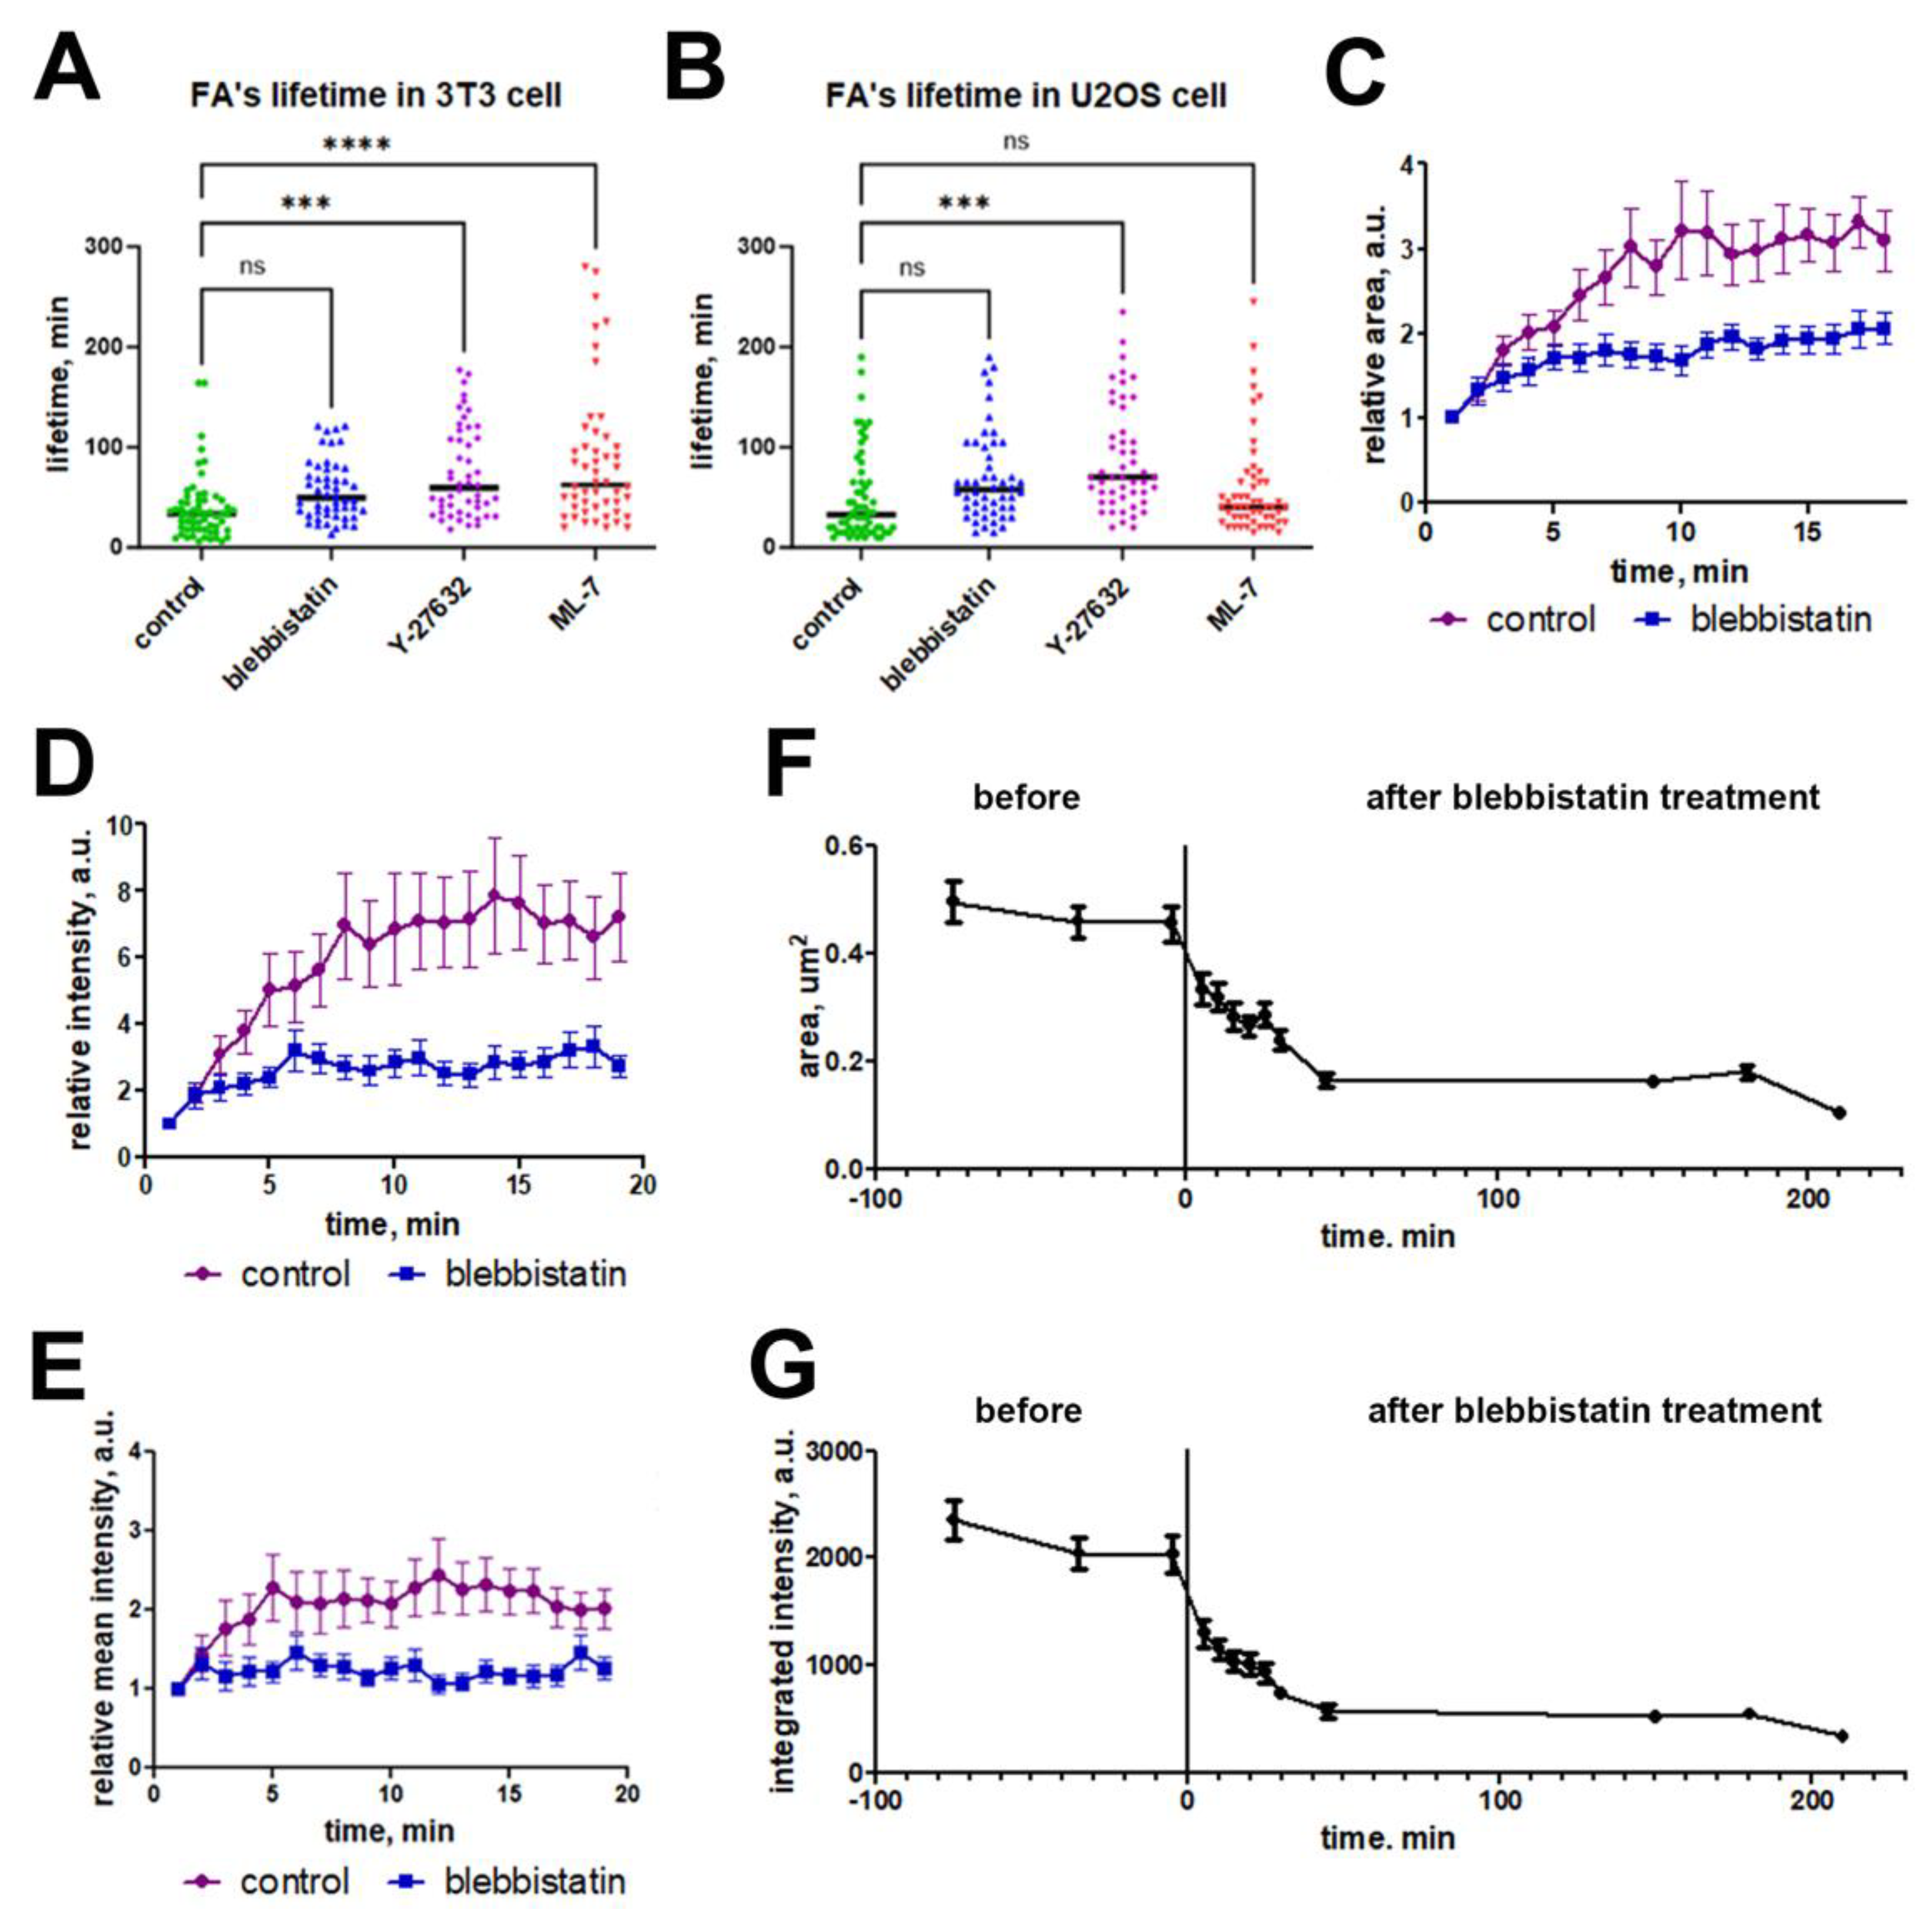
Figure 6.
Actin and paxillin distribution in fixed U2OS (A) and 3T3 (B) cells. Paxillin (green) and actin (red) in 3T3 cells under normal conditions and when myosin II was suppressed by 45 μM blebbistatin. In the insets (4x magnification of the highlighted area), paxillin FAs are normally formed next to actin bundles (arrows); while in the presence of blebbistatin, actin bundles are not well organized near the FAs (arrowheads). Scale bar: 10 µm.
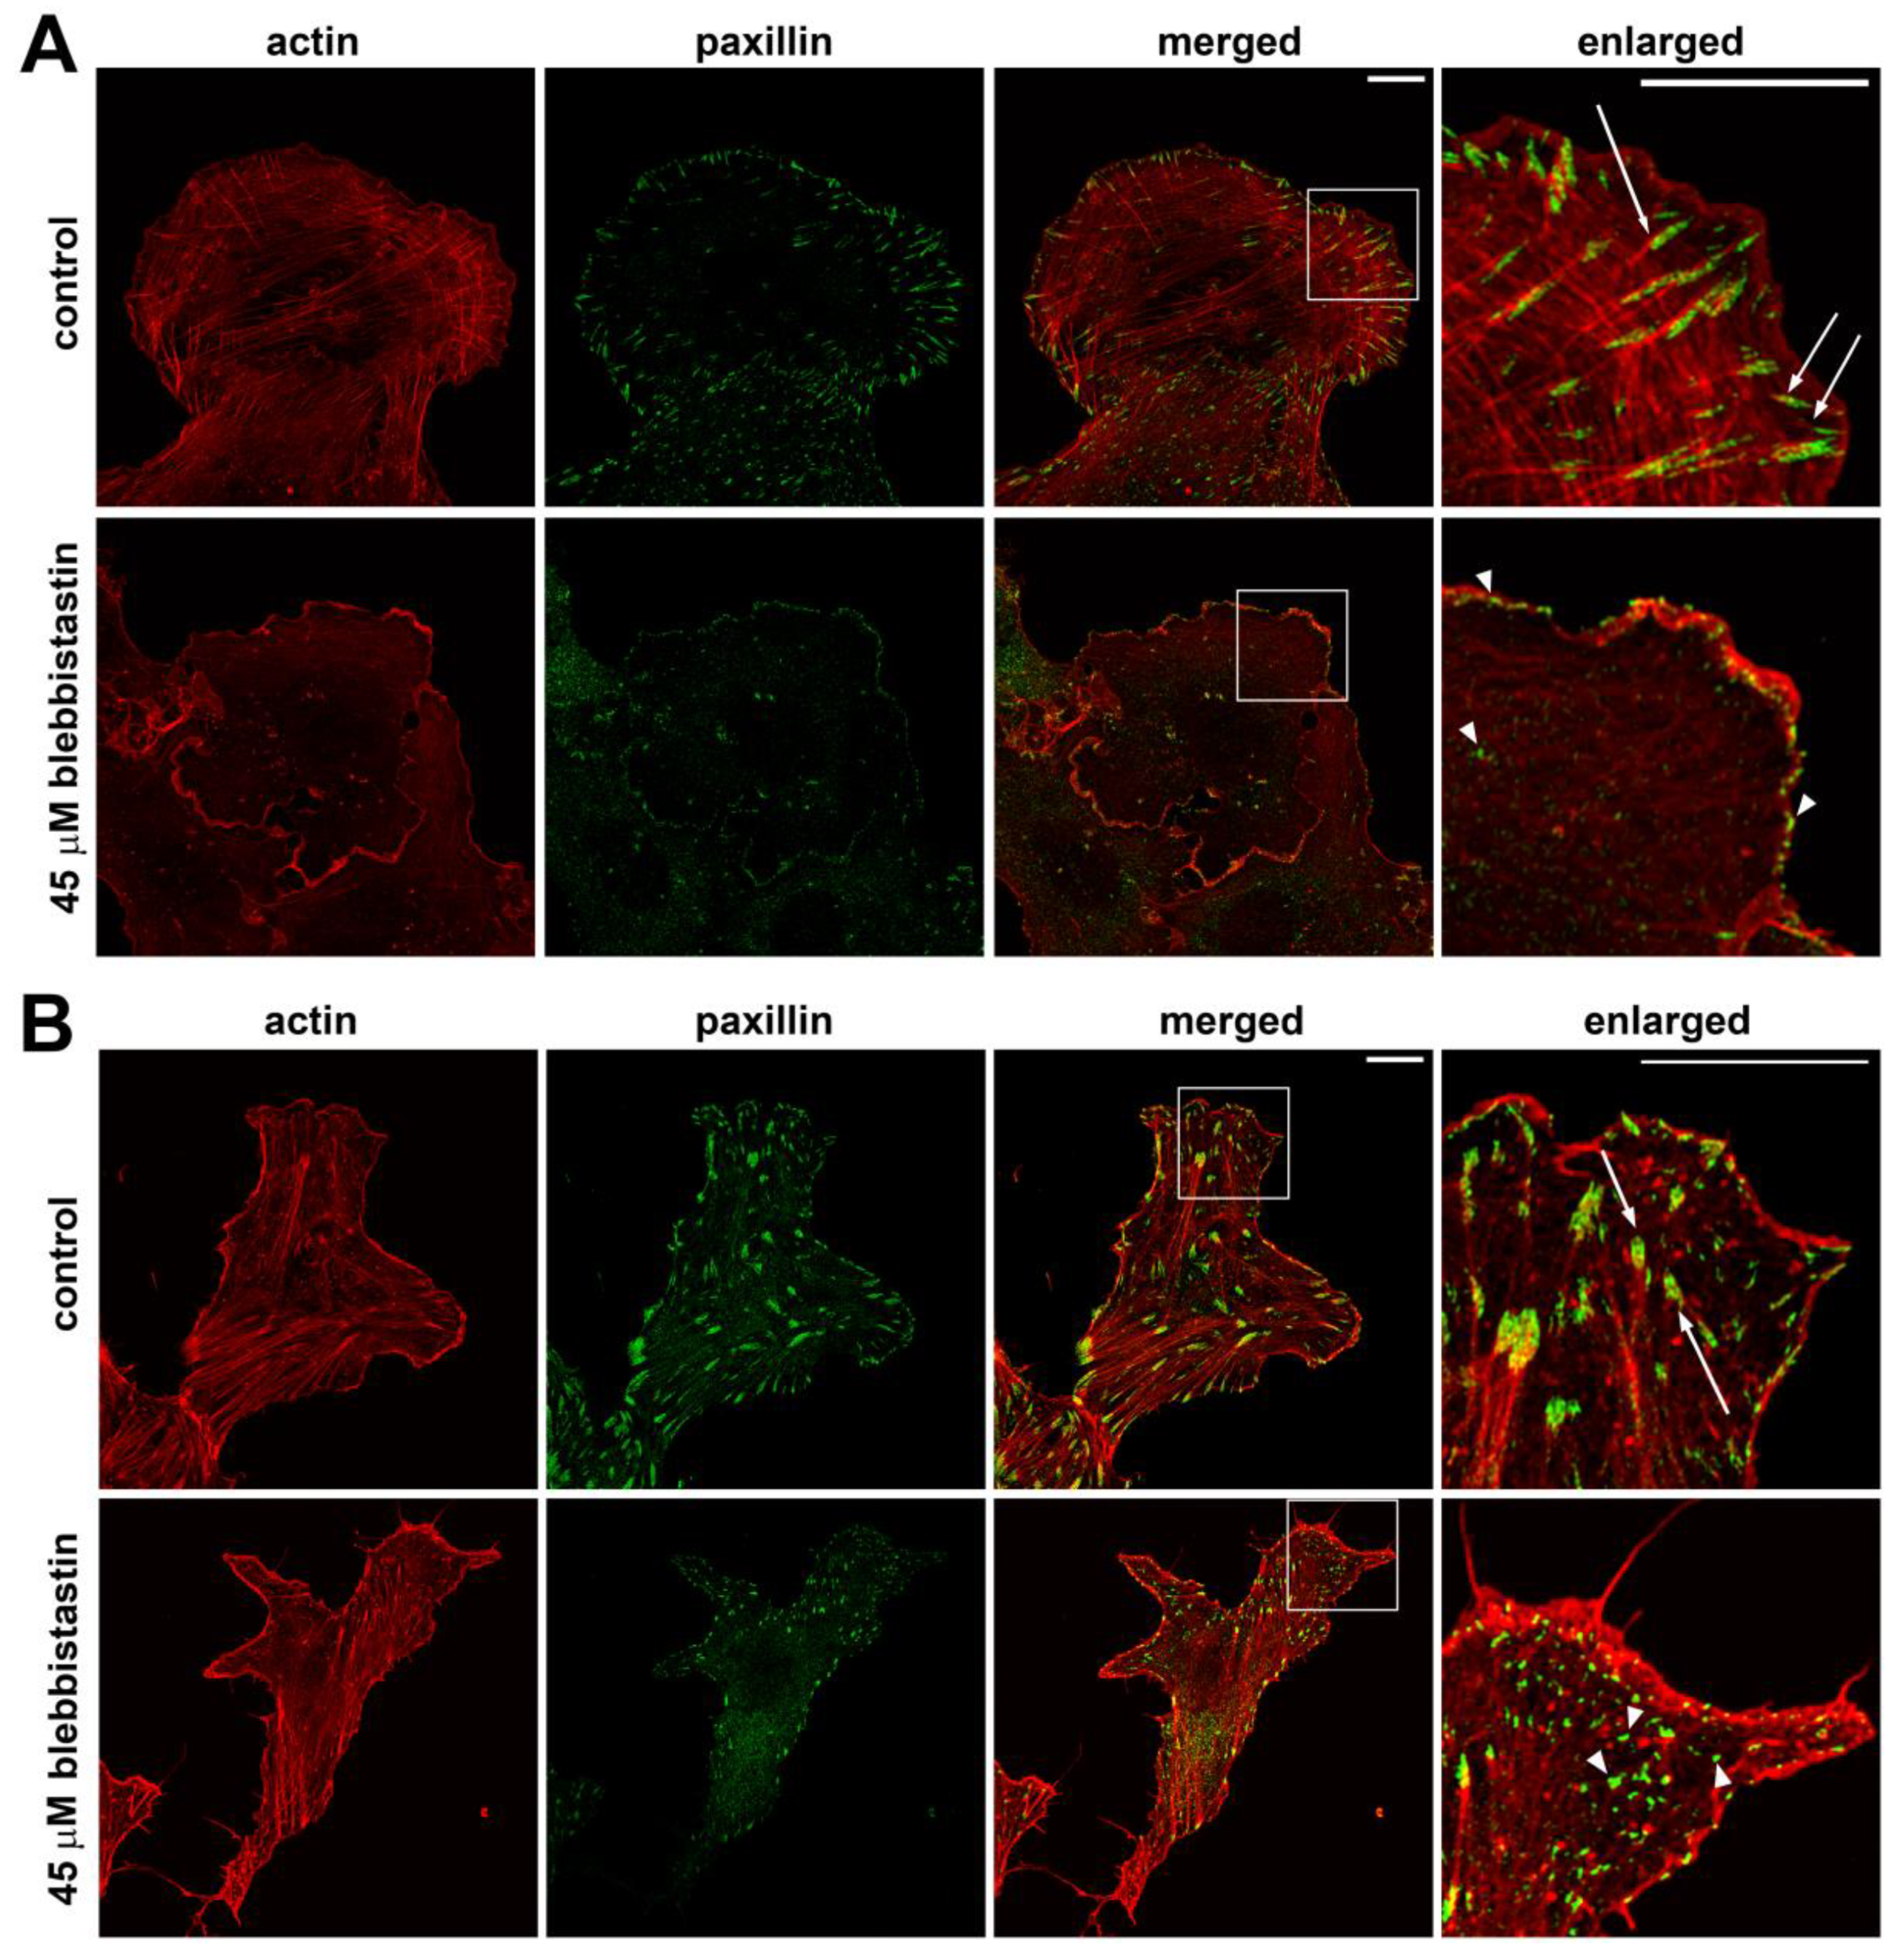
Figure 7.
Actin and myosin II distribution under the action of actin inhibitors in 3T3 and U2OS cells. Alexa-Fluor647-phalloidin is in the red channel, pMLC – green channel. Bar - 10 μm. (A) In control 3T3 cells, the actin cytoskeleton is represented by numerous stress fibrils, which are located perpendicular to the active edge and parallel to the long axis of the cell. Phosphorylated myosin II is associated with stress fibrils. In the presence of 1 μM cytochalasin D, the actin fibers disassemble within 30 minutes. Phosphorylated myosin forms rather bright clusters at the cell edges. In the presence of 1 µM latrunculin B, the F-actin structures are disassembled just in 30 minutes, phosphorylated myosin is reassembled into large clusters, which disappear completely after prolonged exposure to the drug. (B) In U2OS cells, actin microfilaments form large ventral fibrils in the cell body, thin dorsal fibrils directed perpendicular to the active edge of the cell and transverse arcs located parallel to the active edge of the cell. Phosphorylated myosin II in the form of small clusters is associated with all types of actin fibers. In the presence of 1 μM cytochalasin D, the actin cytoskeleton disassembles within 30 minutes, no changes are observed later on for several hours. Phosphorylated myosin II forms clusters at the cell periphery after 30 minutes of incubation with 1 μM cytochalasin D; over time, the number of phosphorylated myosin clusters decreases. In the presence of 1 μM latrunculin B, the disassembly of actomyosin complexes occurs in a similar manner.
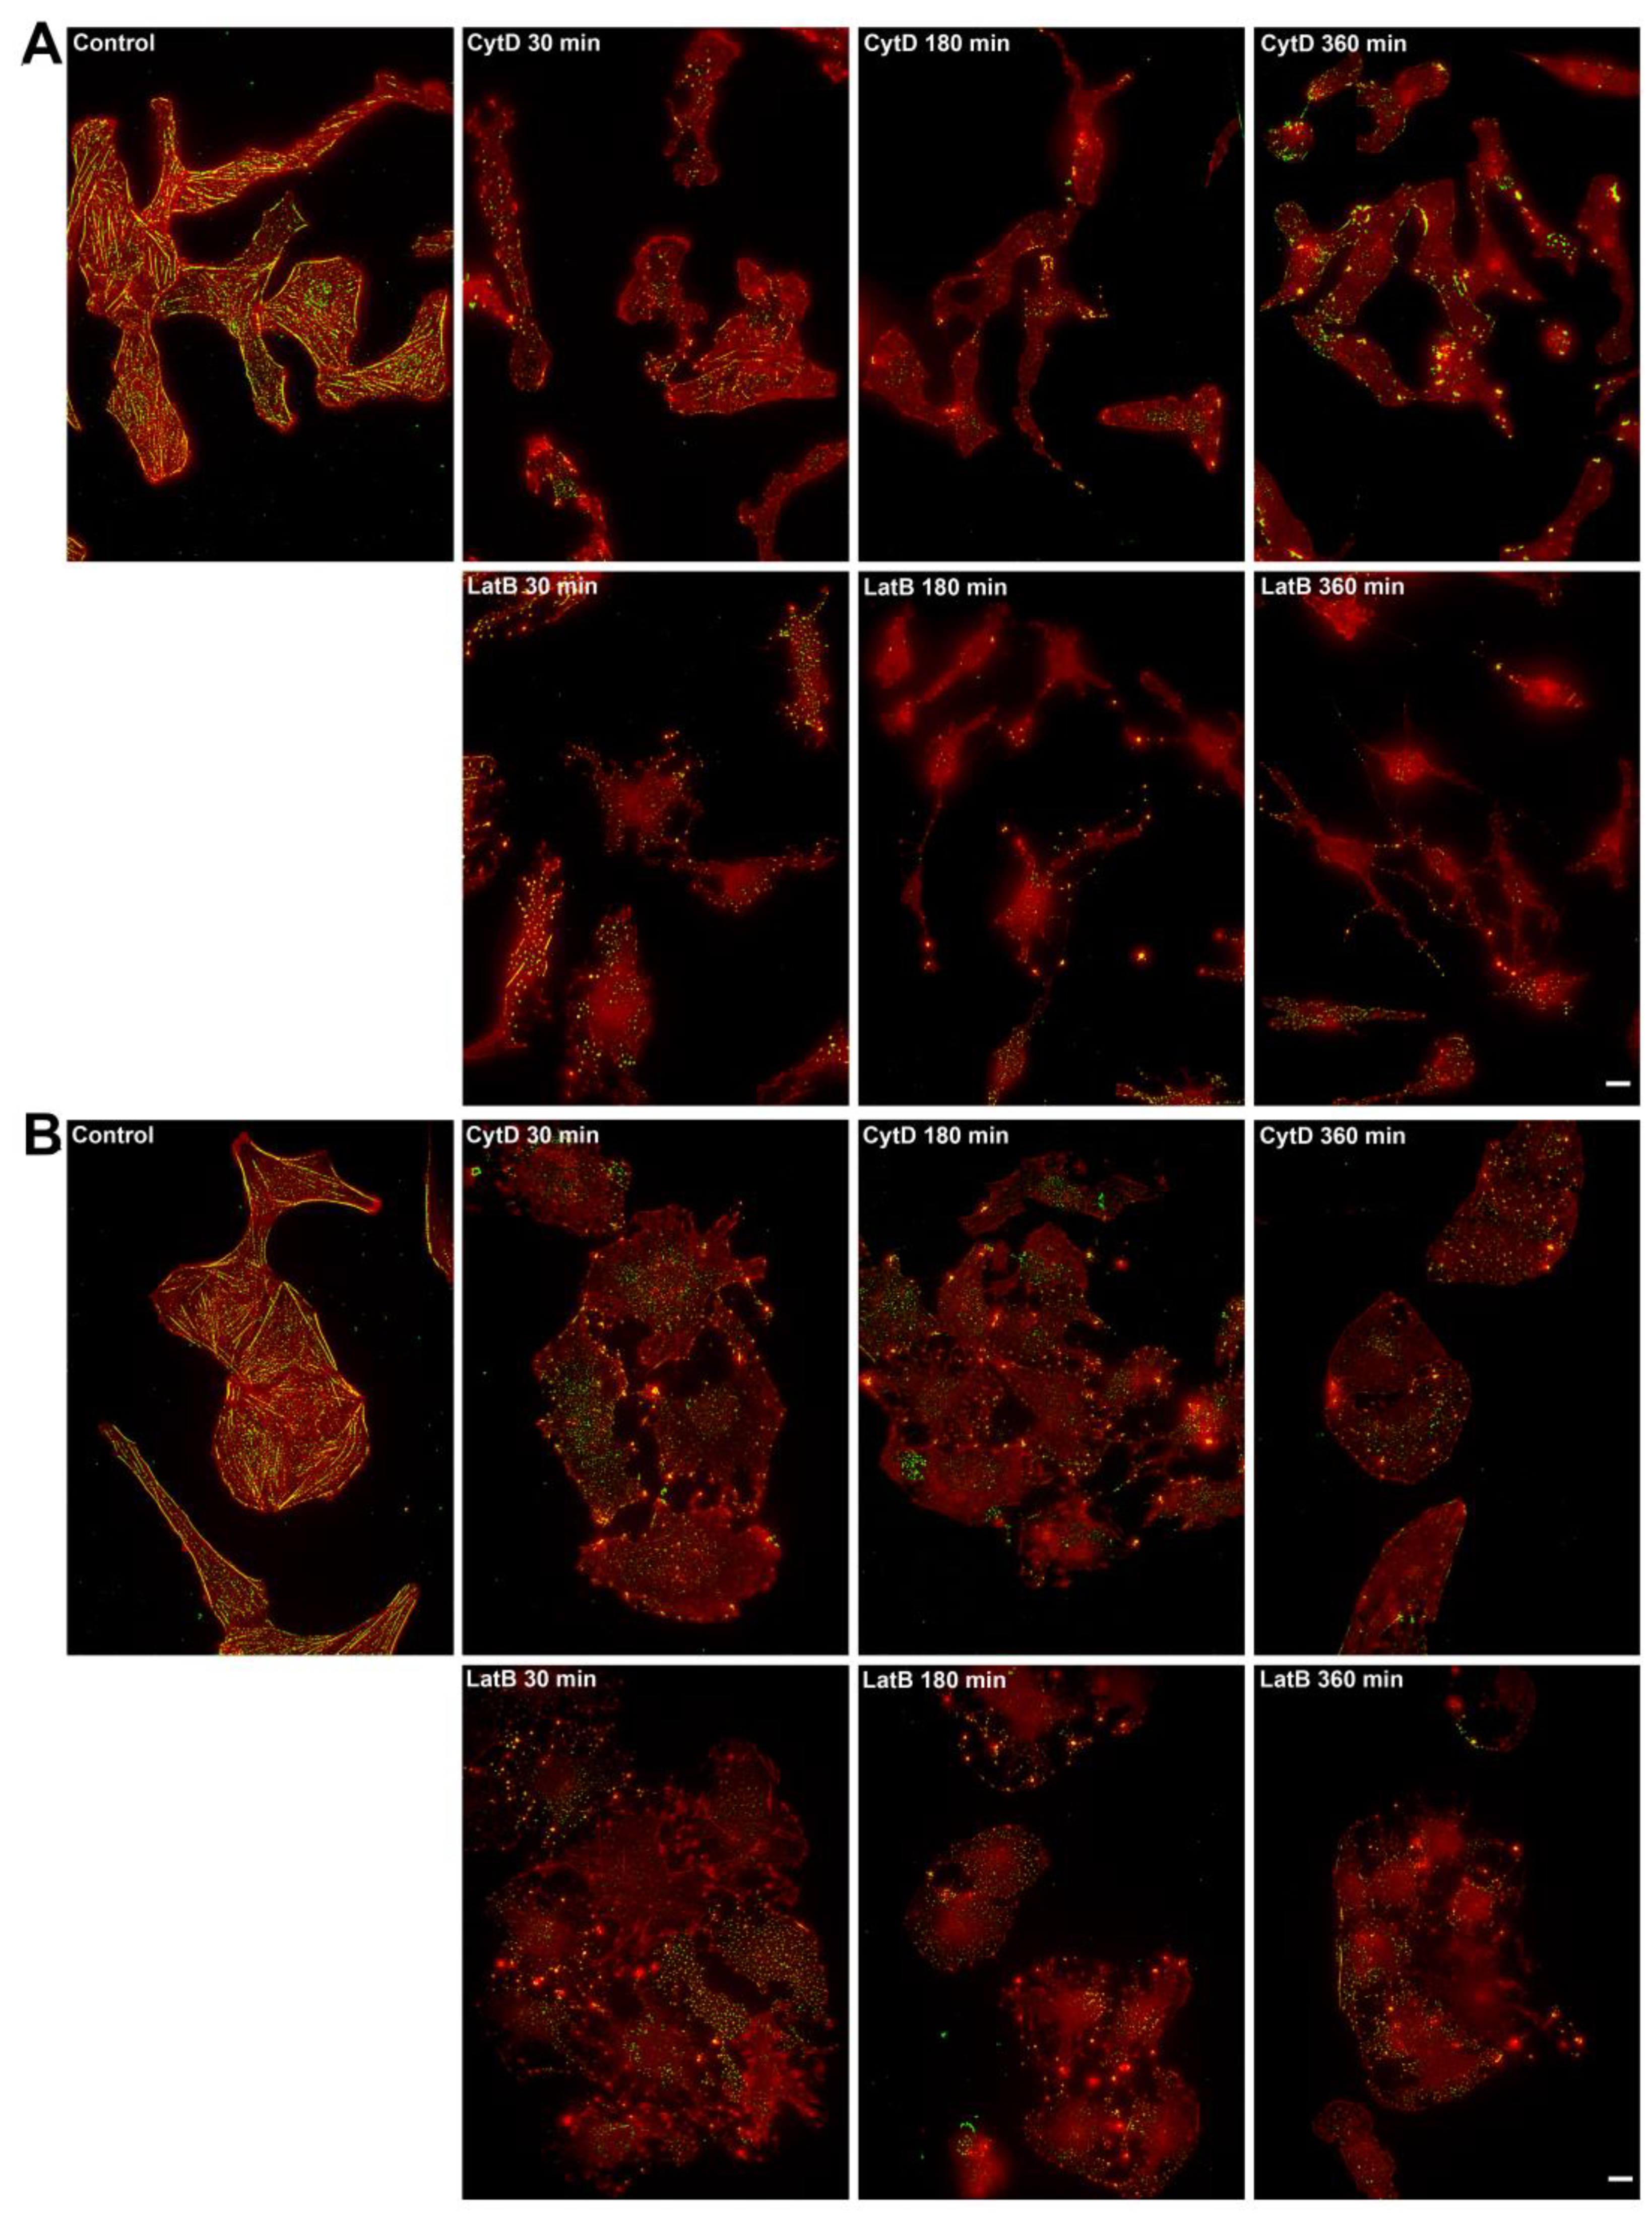
Figure 8.
Actin and paxillin distribution in A549 under the action of actin inhibitors. Paxillin (antibody staining, green) and actin (phalloidin staining, red) in control A549 cells and when actin polymerization is inhibited for 2 h by different concentrations of cytochalasin D (B – 100 nM, C – 1 μM, D – 3 μM) or latrunculin B (E – 300 nM; F – 1 μM, and G – 3 μM). Arrowheads indicate cells with residual paxillin staining in the cytoplasm. Scale bar – 10 µm. .
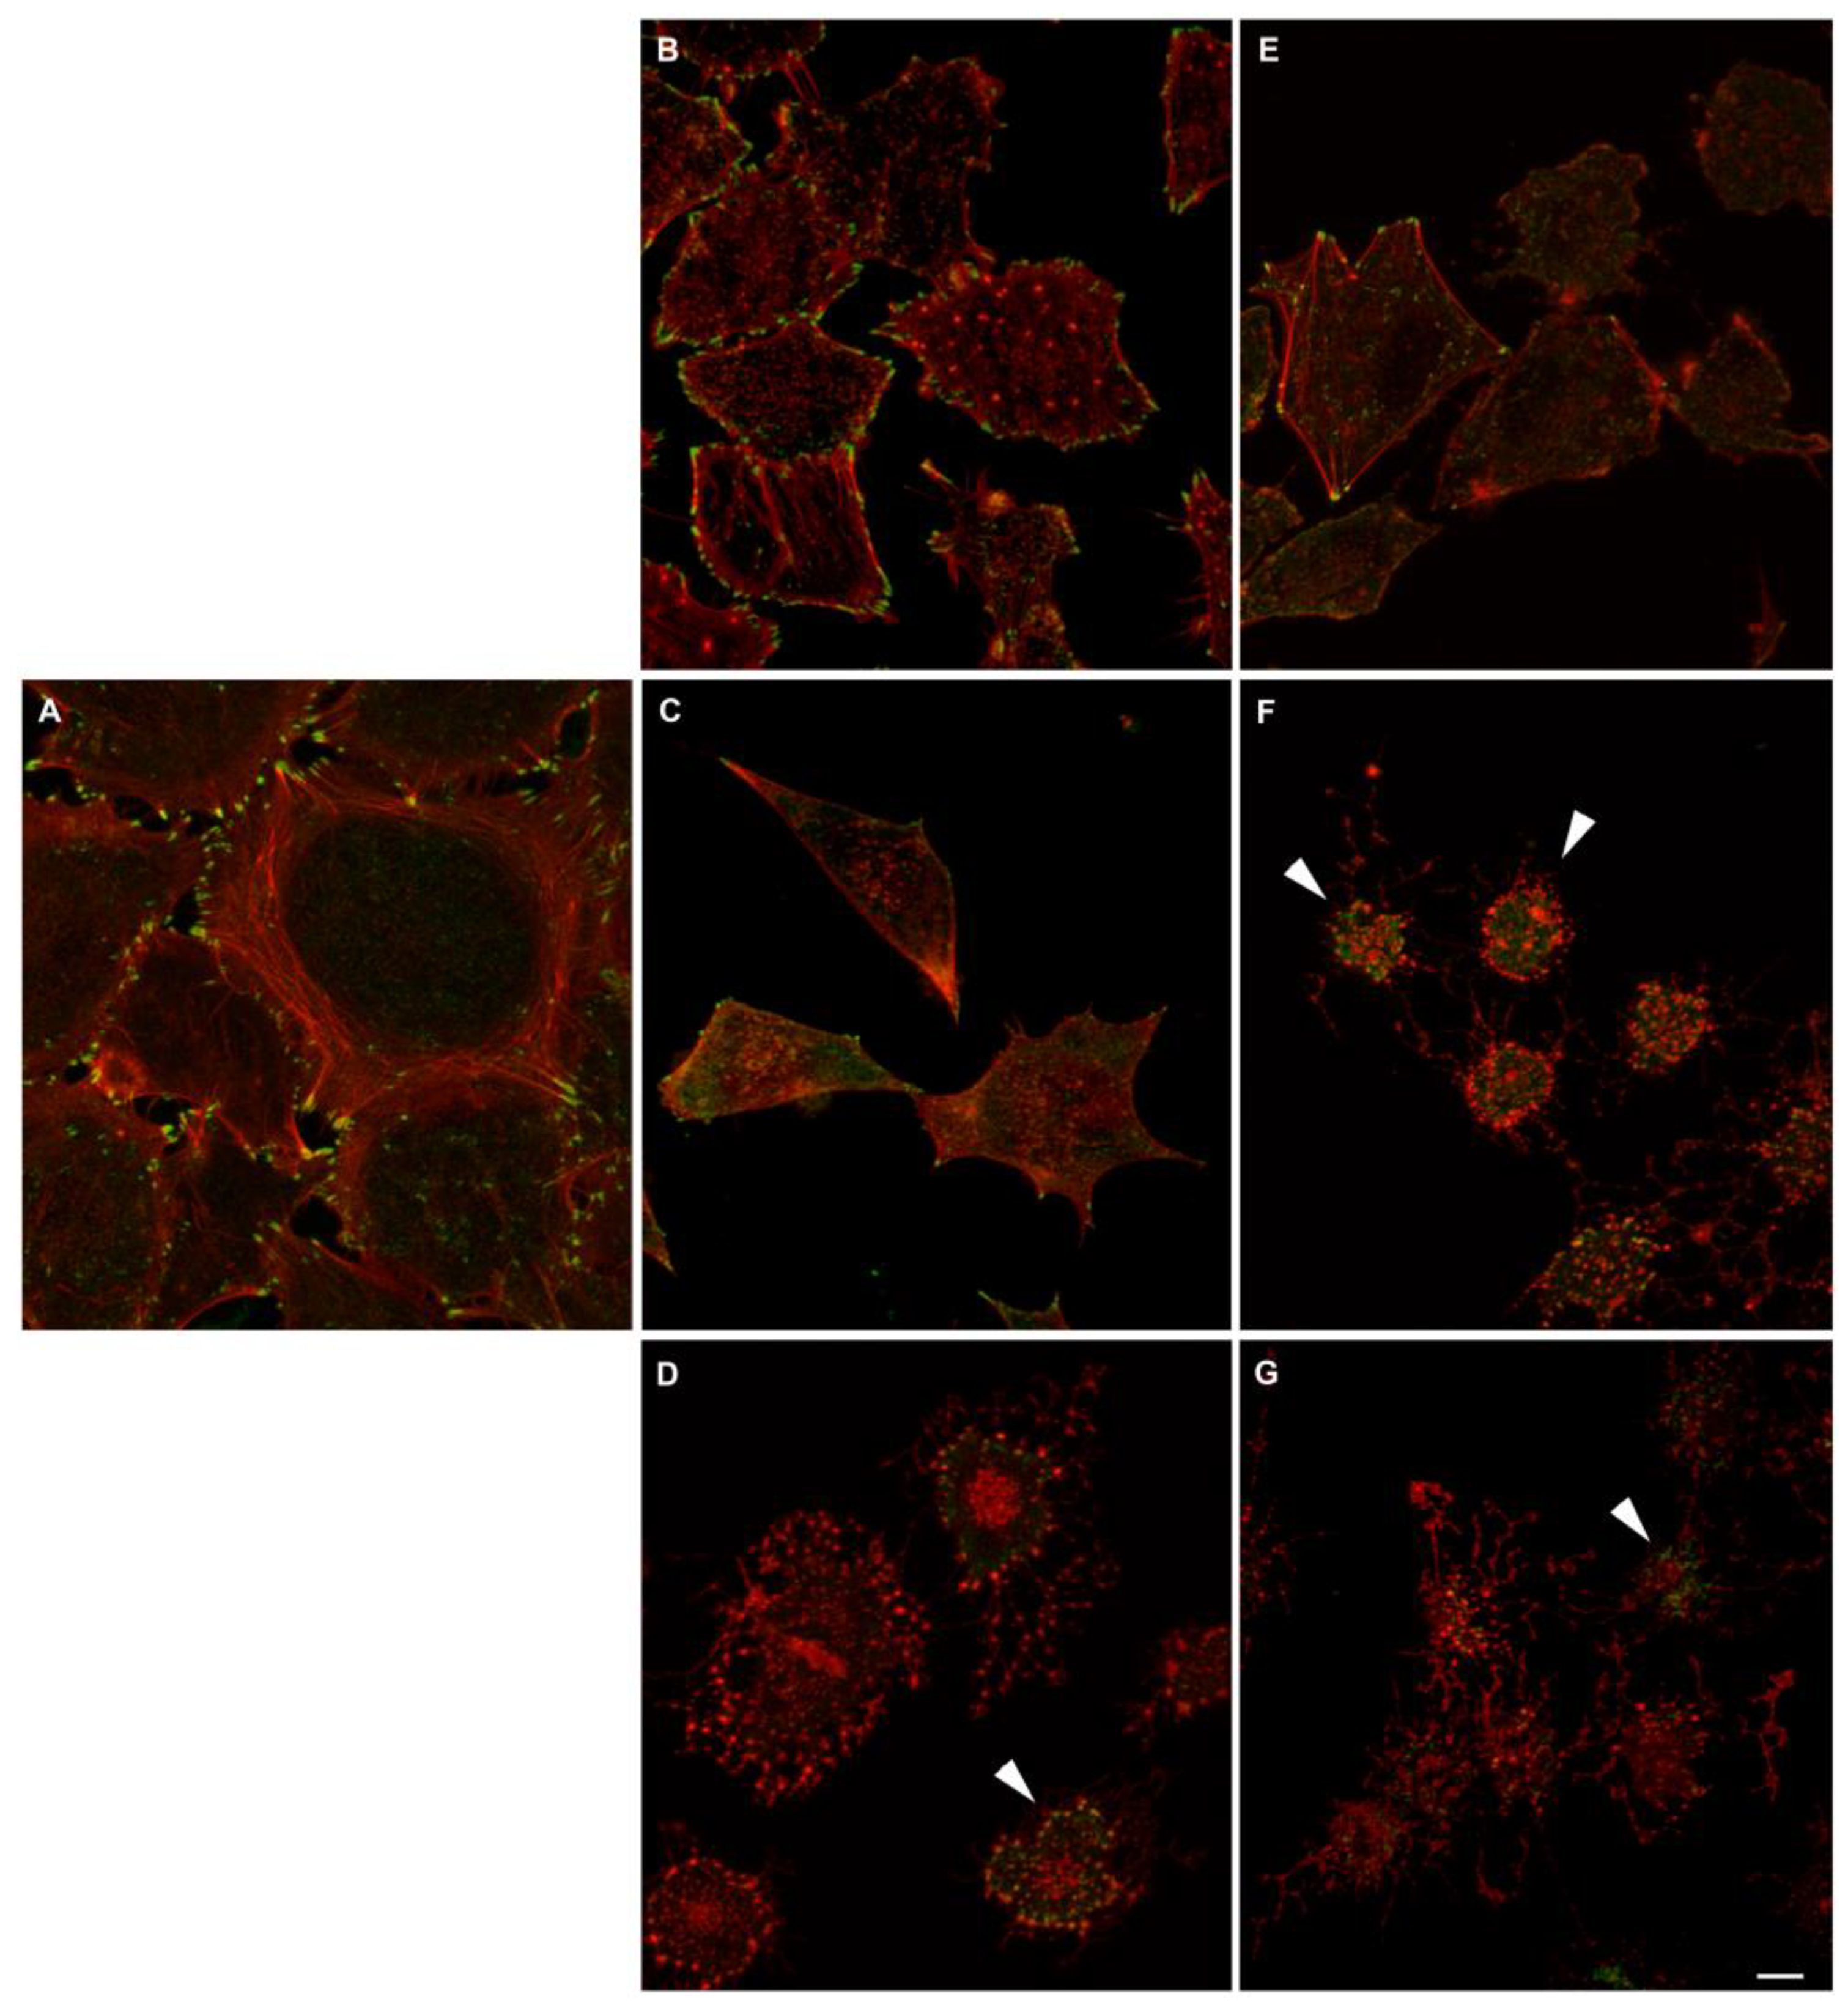
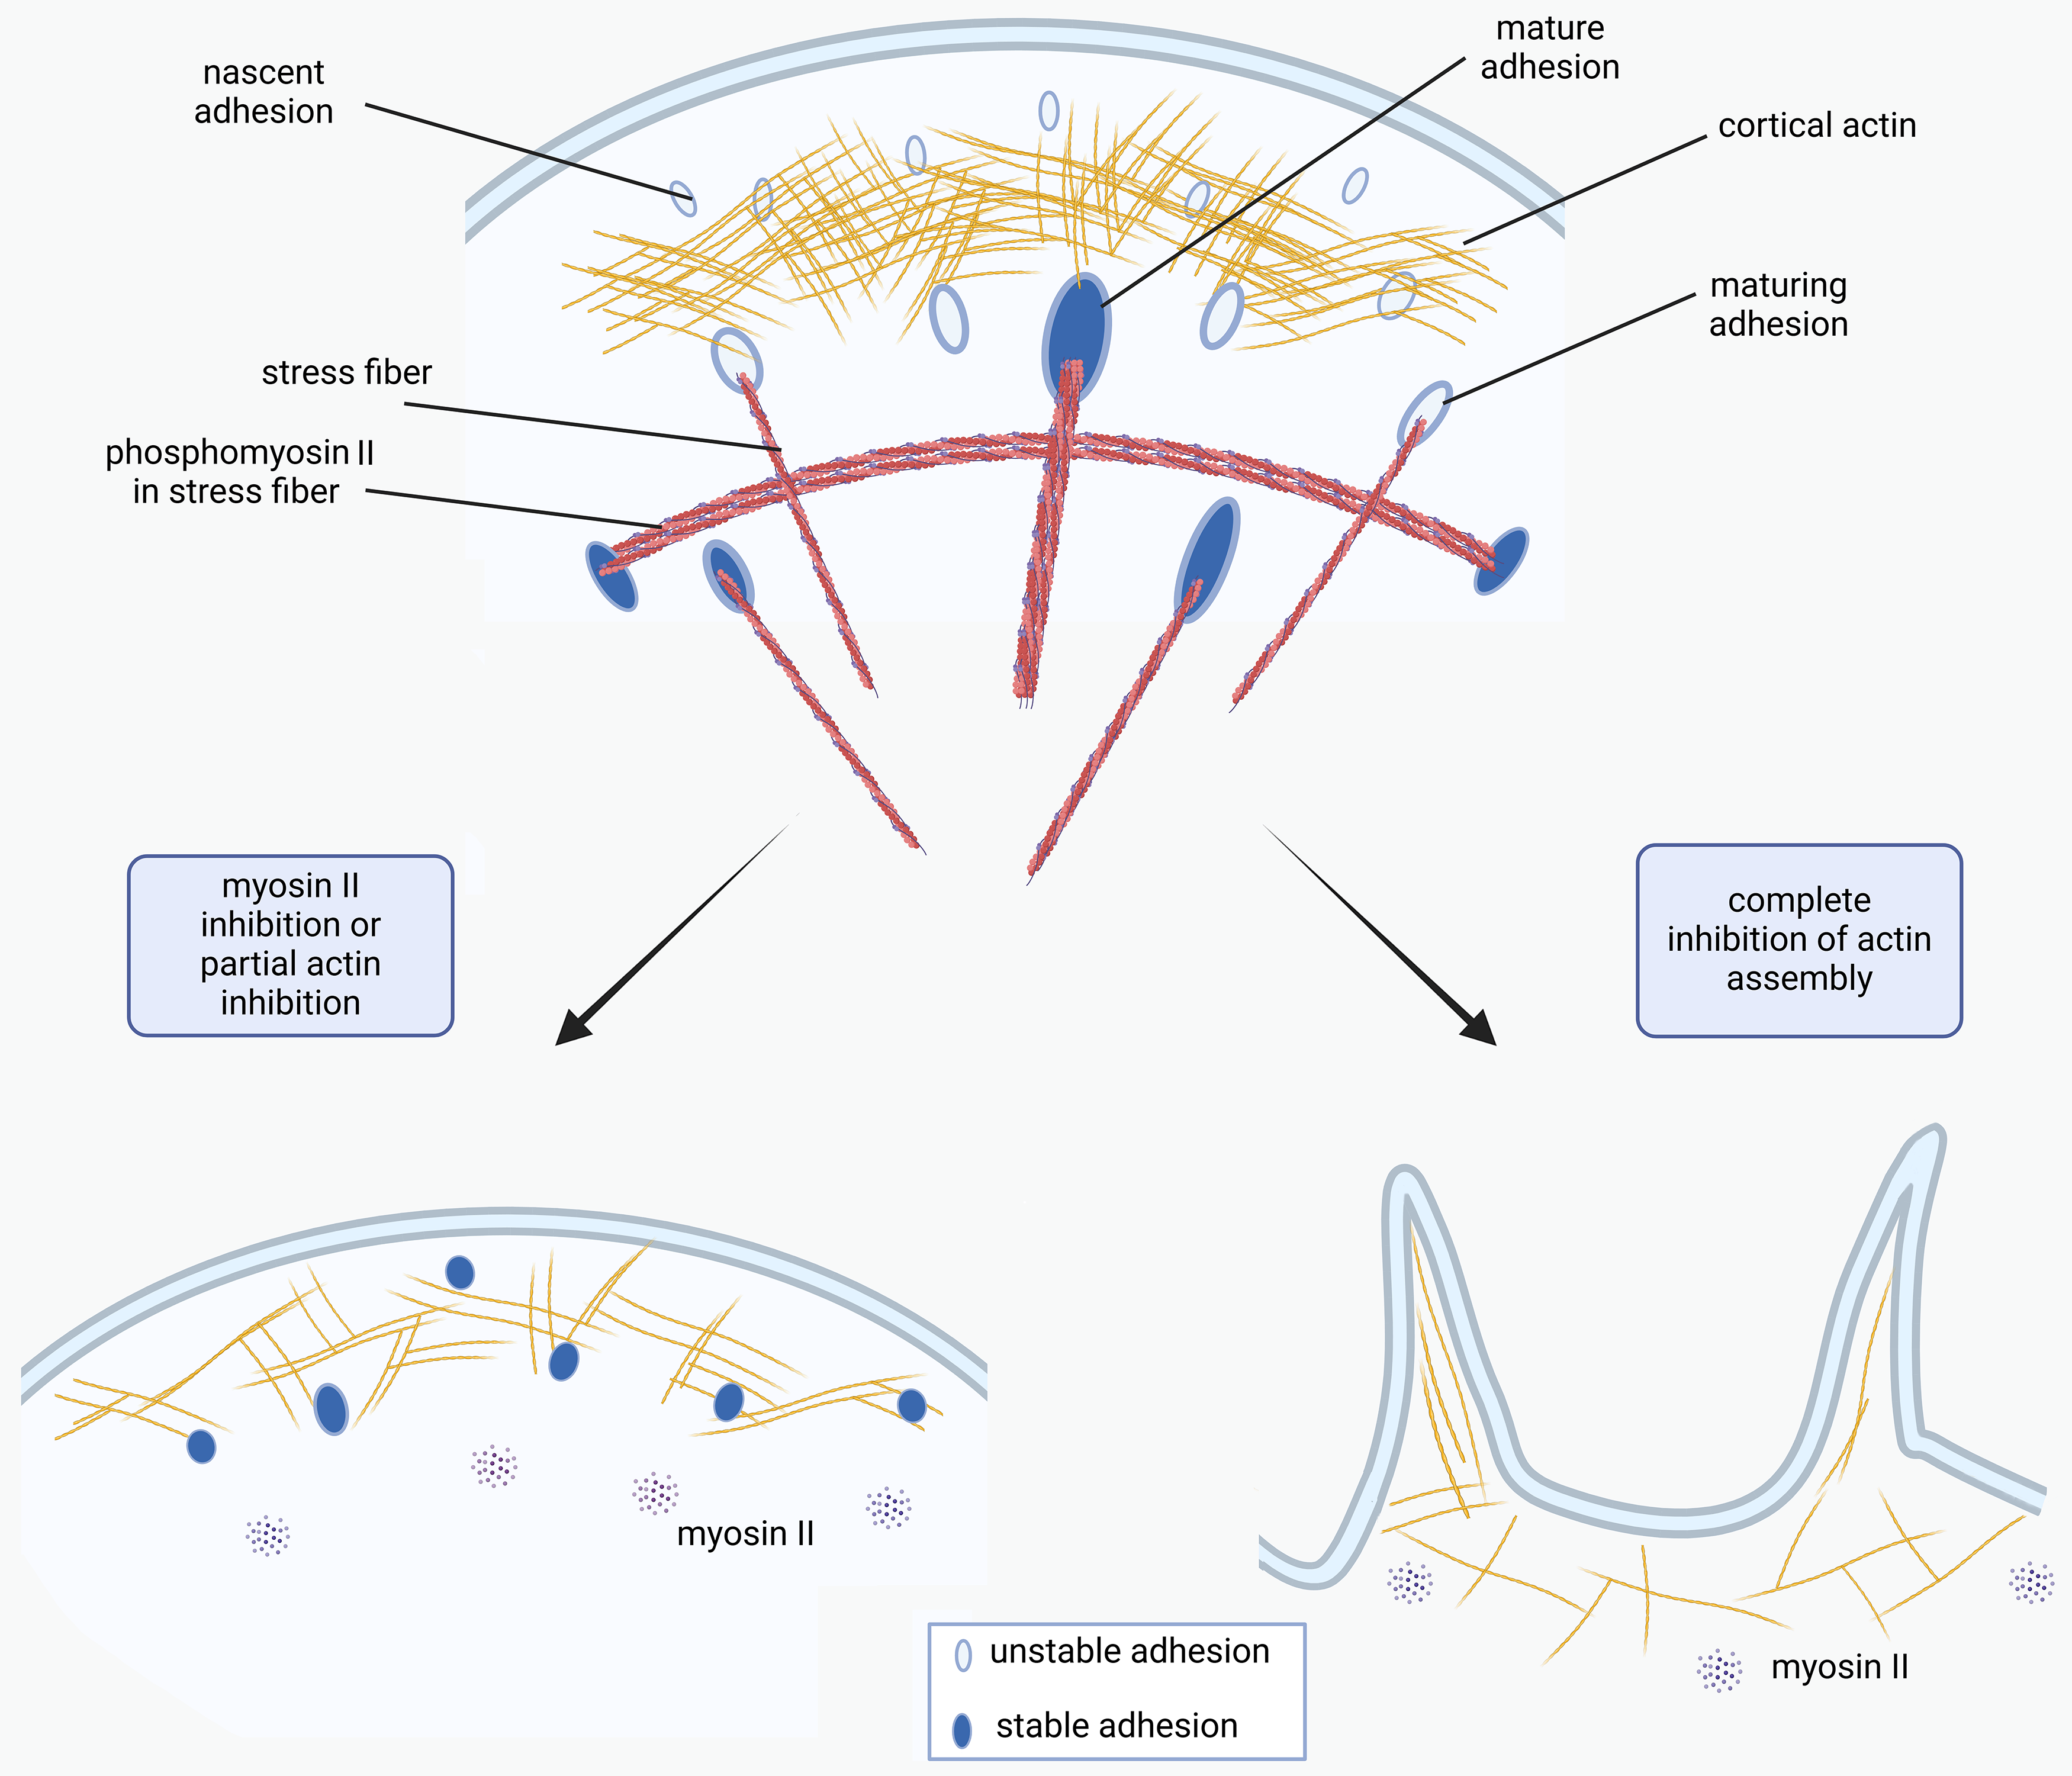
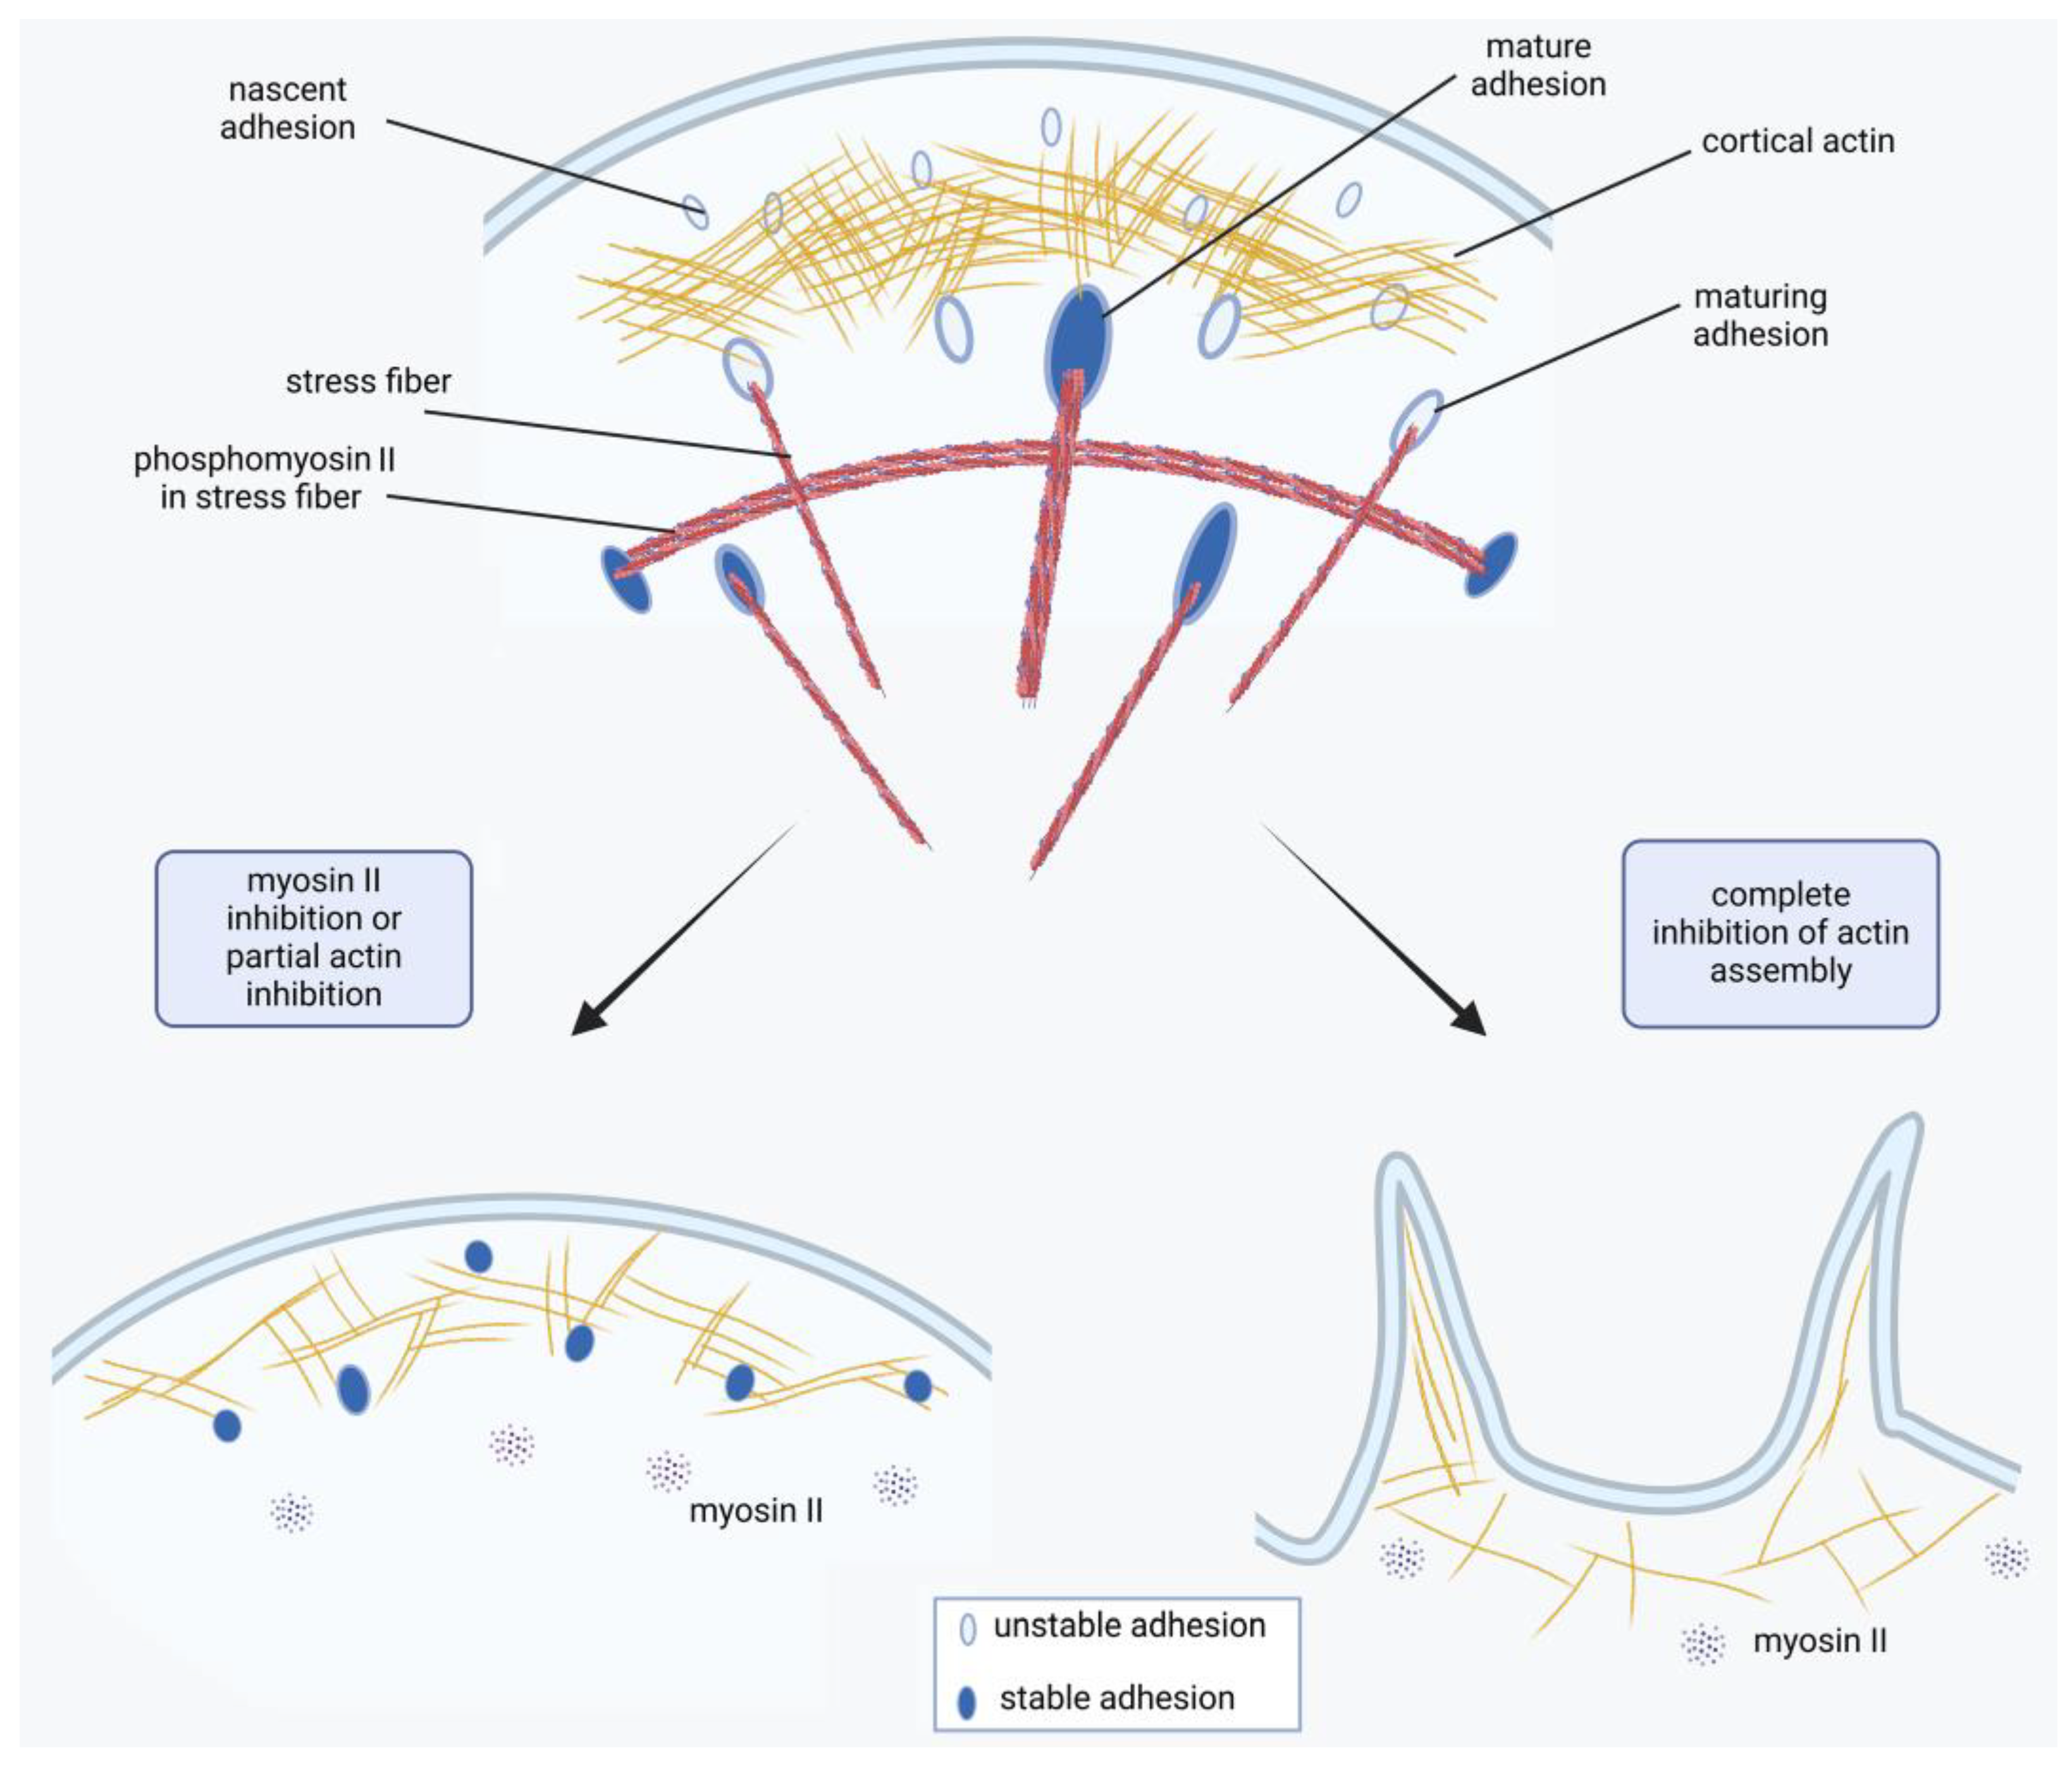
Figure 9.
A model of FA regulation by the interplay between actin dynamic actin polymerization and myosin II-dependent tension. Under normal conditions of actin assembly the density of major tension-dependent FA proteins (talin and vinculin) in nascent adhesions increase and can enlarge becoming FAs. Under inhibition of myosin II phosphorylation only cortical actin interacts with FA proteins – formation of small nascent adhesions is still possible. These adhesions cannot grow, but are rather stable in time. When actin assembly is impaired, FA’s proteins cannot interact with actin at the cell edge, thus no FAs form and destabilized lamellae shrinks.
Disclaimer/Publisher’s Note: The statements, opinions and data contained in all publications are solely those of the individual author(s) and contributor(s) and not of MDPI and/or the editor(s). MDPI and/or the editor(s) disclaim responsibility for any injury to people or property resulting from any ideas, methods, instructions or products referred to in the content. |
© 2025 by the authors. Licensee MDPI, Basel, Switzerland. This article is an open access article distributed under the terms and conditions of the Creative Commons Attribution (CC BY) license (https://creativecommons.org/licenses/by/4.0/).
Copyright: This open access article is published under a Creative Commons CC BY 4.0 license, which permit the free download, distribution, and reuse, provided that the author and preprint are cited in any reuse.


