
Submitted:
24 December 2024
Posted:
24 December 2024
You are already at the latest version
Abstract
Activated immune cells are highly susceptible to human immunodeficiency virus (HIV) infection. Vitamin D (VitD) induces antimicrobial responses and reduces cellular activation. We investigated VitD effects on HIV-1 replication, glucose uptake, and gene regulation using computational and in vitro approaches. CD4+ T-cells from healthy male donors were treated with VitD and infected with HIV-1. After 72 hours, p24 protein was measured to assess viral replication. VitD effects on anti- and pro-HIV genes were analyzed by a Boolean network model based on curated databases and literature. CCR5 and CXCR4 coreceptor expression, AKT phosphorylation and glucose uptake were evaluated by flow cytometry, and expression of some model-identified genes was quantified by qPCR. VitD reduced p24 by 53.2% (p=0.0078). Boolean network modeling predicted that VitD upregulates antiviral, migration and cell-differentiation related genes, while downregulating genes related to cellular activation, proliferation, glucose metabolism, and HIV replication; notably AKT1, CCNT1, SLC2A1, HIF1A and PFKL. In vitro, VitD reduced AKT phosphorylation by 26.6% (p=0.0156), transcription of CCNT1 by 22.7% (p=0.0391), and glucose uptake by 22.8% (p=0.0039) without affecting classic antiviral genes or coreceptor expression. These findings suggest an anti-HIV effect of VitD, mediated through AKT and glucose metabolism downmodulation, both involved in cell activation and HIV-1 replication.
Keywords:
HIV
; Vitamin D
; Glucose uptake
; Boolean modeling
; Protein Kinase B
; Akt signaling
; Anti-HIV mechanisms
; HIV-1 replication
1. Introduction
HIV/AIDS remains one of the most pressing public health challenges globally. Approximately 39.9 million people worldwide are currently living with HIV, and the development of a cure or effective vaccine remains elusive [1].
HIV primarily targets activated CD4+ T cells that express high levels of coreceptors CCR5 and CXCR4, which are essential for viral entry. Activated CD4+ T cells undergo rapid proliferation, with an elevated demand for energy and metabolic output, generating favorable conditions for HIV replication. Several steps throughout the viral cycle, including entry, latency, and replication, depend on the activation of diverse cellular signaling pathways in CD4+ T cells. Among these, the PI3K/Akt/mTOR pathway plays a critical role in cell survival, growth, proliferation, and glucose metabolism. Notably, HIV preferentially infects cells with enhanced glycolytic activity and increased expression of the glucose transporter 1 (Glut1) [2,3,4]. This preference could explain the resistance to viral replication exhibited by cells with an immunoquiescent phenotype [5,6,7], a trait widely observed in cells from HIV-exposed seronegative individuals (HESNs) who naturally resist HIV infection [8].
Vitamin D (VitD) has emerged as a promising immunomodulator due to its capacity to reduce activation of T cells [9], decrease inflammation [10,11], induce production of antimicrobial peptides [12,13] and suppress HIV replication in peripheral blood mononuclear cells (PBMCs) exposed to viral particles in vitro [14,15,16,17].
Our previous findings further suggest that VitD may contribute to the resistance mechanisms of HESNs by upregulating the expression of anti-inflammatory cytokine IL-10 and antimicrobial defensins [17,18]. Additionally, VitD has been shown to downregulate the expression of PI3K, AKT and mTOR in a cancer model [19] and modulate glucose metabolism via Akt-mediated signaling pathways in mice [20]. However, whether VitD can modulate HIV infection by targeting this signaling pathway remains unclear. This pathway has been proposed as an innovative therapeutic target against HIV [21].
In this study, we investigated the effects of VitD on HIV-1 replication in vitro in CD4+ T cells and in silico through a Boolean network model to predict whether VitD modulates host genes associated with HIV replication. Selected candidate pro- and anti-HIV genes and their associated cellular processes were validated in vitro using flow cytometry and qPCR. Our findings reveal that VitD reduces HIV replication, potentially by downregulating AKT activity and glucose metabolism, both of which are critical for T cell activation and HIV-1 replication.
2. Materials and Methods
2.1. Study Population and Sample Preparation for In Vitro Assays
In vitro assays were performed using blood samples collected from eight healthy, HIV-negative male donors. Exclusion criteria included the use of immunosuppressive, anti-inflammatory, or anticoagulant medications, dietary VitD supplementation, recent acute febrile episodes, and chronic illnesses. All participants provided written informed consent prior to enrollment. The study complied with the principles of the Declaration of Helsinki and was approved by the Ethics Committee of Universidad de Antioquia (ACT-008-2016).
2.2. CD4+ T Cell Isolation
The PBMCs were isolated using Ficoll-Histopaque®-1077 (Sigma-Aldrich, Darmstadt, Germany) and resuspended in X-VIVO 15 media (Lonza, Basel, Switzerland), a fetal bovine serum (FBS)-free and VitD-free medium ideal for VitD-focused studies. Viability and cell counts were determined with 1% Trypan blue (Sigma-Aldrich).
CD4+ T cells were purified by negative selection with immunomagnetic beads (Miltenyi Biotec, Bergisch Gladbach, Germany). Purity (>85%) and viability (>95%) were confirmed by flow cytometry using anti-CD3-Alexa Fluor™ 700, anti-CD4-Pacific Blue™ antibodies, and Fixable Viability Dye-eFluor™ (Invitrogen™, Massachusetts, USA) (Figure S1).
2.3. CD4+ T Cell Infection
CD4+ T cells were seeded at a density of 3.0x10⁵ cells per well in 96-well plates containing 200 μL of X-VIVO 15 medium. Cells were stimulated with 8 μg/mL PHA (Sigma-Aldrich) and 50 IU/mL IL-2 (RyD systems, Minnesota, USA) and treated with either the active form of VitD (calcitriol; Sigma-Aldrich) at 5 nM (a concentration found in serum after calcitriol supplementation [22,23] and in dendritic cells supernatants ex vivo [24,25]) or with 0.01% ethanol (EtOH) as vehicle control. Unstimulated cells were included as controls for cytometric analysis. Cultures were incubated at 37°C with 5% CO2 with media changed every 48 hours while maintaining VitD and EtOH concentrations.
Forty-eight hours post-activation, 7.5x10⁵ to 1.6x10⁶ CD4+ T cells were transferred to 1.5 mL vials and infected with 90 µL of X4-tropic HIV-1 (equivalent to 6.5 ng p24) obtained from H9-HTLV-IIIB cell line supernatants (ATCC-CRL-8543). Cells were incubated with the virus for 30 minutes at 37°C with 5% CO2, followed by spinoculation at 1200 x g for 2 hours at room temperature [26]. After washing with PBS (Sigma-Aldrich), cells were cultured in X-VIVO 15 media (Lonza) with their respective VitD or EtOH treatments for 72 hours. Viral replication was assessed by measuring p24 protein using an HIV-1 p24 ELISA kit (Xpress Bio, Frederick, MD, USA).
2.4. Data Collection and Boolean Model Design for Bioinformatic Simulations
A gene regulatory network was constructed to model molecular dynamics triggered by VitD and HIV infection. Data were sourced from curated databases (STRING version 12.0; TRRUST version 2 [27], the HIV-1, Human Protein Interaction Database [28]) and primary literature (File S1). The network's nodes represent genes, while edges denote regulatory interactions, classified as activation or inhibition. Activated or repressed genes during VitD or HIV infection were treated as individual nodes. Non-conclusive interactions, such as contradictory outcomes across databases (e.g., simultaneous activation and inhibition), were resolved using additional references or excluded if no consensus was reached. The complete network, comprising 1302 nodes and 4932 interactions (Table S1), was reduced using Net-Synthesis [29] to generate a sparse yet functional model (Figure S2), that could enhance interpretability and computational efficiency. Simplified interactions were used to define the logical dependencies between genes (AND, OR, NOT), and were modeled using Boolean formalism with the Python library BooleanNet [30]. The state of each node at time t+1 was determined by Boolean expressions combining the states of its regulators at time t. For instance, the regulatory logic of the transcription factor E2F1, activated by NR4A1 and repressed by CCNA1, E2F6 and E2F7, could be expressed as:
E2F1*= not CCNA1 or not E2F6 or not E2F7 or NR4A1
In the asynchronous setting, each node is updated exactly once per time unit in a specified order, reflecting the progression of regulatory events. At the start of the simulation, nodes were initialized as ON or OFF based on predefined rules. For example, HIV presence (ON or OFF) was simulated by setting the initial states of a specific set of genes according to established rules (File S2). After 40 simulation steps, the activation or deactivation states of all genes in the network were visualized in a heat map (Figure S3). This comprehensive view of the network enabled the selection of pro- and anti-HIV genes modulated by VitD for further analysis based on their relevance in the model and in the literature.
2.5. Assessment of AKT Phosphorylation and Coreceptors Expression
Purified CD4+ T cells were seeded at a density of 4.0x10⁵ cells per well in 96-well plates with X-VIVO 15 medium. Cells were treated for 16 hours with VitD, EtOH, or 15 µM Miltefosine (Abcam, Cambridgeshire, UK), a known Akt inhibitor [31,32], as a negative control. The cells were then stimulated with 100 nM Calyculin A (Invitrogen™), a strong inducer of Akt phosphorylation, in the presence of their respective treatments for 30 minutes. Cells were harvested for phospho-Akt staining. An unstimulated control was included to establish the basal threshold of Akt phosphorylation.
Cells were stained with Live/Dead Fixable Yellow Dead Cell Stain (Invitrogen™), anti-CD3-Alexa Fluor 700 (eBioscience™, California, USA), anti-CD4-V450 (BD™, New Jersey, USA), anti-CCR5-APC-Cy7 (eBioscience), and anti-CXCR4-PE-Cy5 (BD) at 4°C for 30 minutes. Stained cells were further fixated and permeabilized using FoxP3/transcription factor staining buffer (eBioscience™) according to the manufacturer instructions and intracellularly labeled with anti-phospho-AKT(Ser473)-PE (R&D Systems) at 4°C for 30 minutes. At least 100,000 events were acquired on an LSR Fortessa X-20 cytometer (BD) and analyzed using FlowJo V10.9.0 (BD). Compensation for fluorochrome spillover was performed using unstained and single-stained cells.
AKT phosphorylation was quantified by median fluorescence intensity (MFI) (Gating strategy shown in Figure S4).
2.6. qPCR Gene Expression Assay
To assess the effect of VitD on the expression of host proviral and antiviral genes, RNA was extracted from 8.0x10⁵ CD4+ T cells treated with either VitD or EtOH following 30 minutes of stimulation with Calyculin A and using the Direct-zol RNA Miniprep Kit (Zymo Research, California, USA). Complementary DNA (cDNA) was synthesized using the iScript™ cDNA Synthesis Kit (Bio-Rad, California, USA). Quantitative PCR (qPCR) was conducted for analyzing the expression of the following pro- and anti-HIV genes:
SAMHD1 (Fwd: 5´-CTCGCAACTCTTTACACCGTAGA-3´, Rev: 5´-TTTCCTCCAGCACCTGTAATCTC-3´), associated with antiviral activity.
PLD1 (Fwd: 5´-TTCCAAAGTCTCAAACAACAGCC-3´, Rev: 5´-AGCAGAGCGGAGCAACTGT-3´), involved in cellular activation signaling.
ADAM10 (Fwd: 5´-CGGGGATGGGAGGTCAGTAT-3´, Rev: 5´-ACGCTGGTGTTTTTGGTGTA-3´), and CCNT1 (Fwd: 5´-TTCATGGCAACCAACAGCC-3´, Rev: 5´-CCCGTCAGTTGAGACTGGGA-3´), required for viral replication, trafficking, and latency reversal.
VDR (Fwd: 5´-TGCTATGACCTGTGAAGGCTG-3´, Rev: 5´-AGTGGCGTCGGTTGTCCTT-3´) and VitD-target gene CYP24A1 (Fwd: 5´-CGCAAATACGACATCCAGGC-3´, Rev: 5'-AATACCACCATCTGAGGCGT-3´), used as controls for VitD transcriptional regulation.
PGK1 (Fwd: 5´-GTTGACCGAATCACCGACC-3´, Rev: 5´-TCGACTCTCATAACGACCCGC-3´), served as the reference gene for normalization.
The qPCRs were performed using SYBR™ Green Universal Master Mix (Thermo Fisher Scientific, Massachusetts, USA) in a CFX-96 real-time thermal cycler (Bio-Rad).
The thermal cycling conditions were as follows: initial enzyme activation at 95°C for 10 minutes, followed by 40 cycles of denaturation at 94°C for 8 seconds and annealing at 60°C for 40 seconds (except for SAMHD1 that annealed at 62°C). Relative expression units of mRNA (RU) were calculated by the ΔCt method [33] using the expression of PGK1 to normalize the amount of RNA in the samples.
2.7. Glucose Uptake Assay
The CD4+ T cells infected with HIV, as previously described, were treated with 5 nM active VitD or 0.01% EtOH for 72h. The medium was replaced after 48 hours while maintaining VitD and EtOH concentrations. At the end of the 72-hour culture period, the cells were harvested for glucose uptake assays. Cells were centrifuged at 700 g for 5 minutes and subsequently incubated for 3 hours at 37°C, 5% CO2 in 200 µL glucose-free and FBS-free RPMI. After incubation, 2 µL of glucose analog 2-(N-(7-Nitrobenz-2-oxa-1,3-diazol-4-yl)Amino)-2-Deoxyglucose (2-NBDG) (Invitrogen™) in a 1:40 dilution was added to the cells, and flow cytometry was carried out after a 10-minute incubation following the manufacturer's instructions. The MFI of 2-NBDG was measured using the FITC channel.
2.8. Statistical Analysis
Statistical analyses were conducted using GraphPad Prism 8.0 (GraphPad Software Inc., Massachusetts, USA). Data differences between VitD and EtOH treatments were analyzed using either the t-test or the Wilcoxon test, depending on whether data were normally or non-normally distributed as assessed by the Shapiro-Wilk test. Spearman's correlation analysis was conducted to determine the correlation between VitD, glucose uptake and viral particle concentration. A p-value <0.05 was considered statistically significant.
3. Results
3.1. Effect of VitD on HIV-1 Infection
To evaluate the impact of VitD treatment on the susceptibility of CD4+ T cells to HIV-1 infection, levels of p24 were quantified in the supernatants from VitD- or EtOH-treated cells after 72h post-infection using an ELISA assay. VitD-treated cells exhibited a significant reduction of 53.2% on the levels of p24 in 7 out of 8 individuals, compared to EtOH-treated cells (Median: 438.135 pg/mL vs. 936.235 pg/mL, respectively, p = 0.0078) (Figure 1A).
3.2. Boolean Modeling of VitD Effects in Regulating Host Pro- and Antiviral Genes
Given the observed reduction in HIV infection of purified CD4+ T cells following VitD treatment in vitro, we employed a Boolean network model to investigate the regulatory effects of VitD on the expression of host proviral and antiviral genes. Gene Ontology (GO) enrichment analysis revealed that VitD upregulates genes involved in antiviral responses, leukocyte migration, T cell differentiation, and negative responses to stimuli, while primarily downregulating genes associated with cellular activation and proliferation (Figure 1B,C). This analysis further revealed dynamic shifts occurring in the regulation of antiviral and proviral genes under four conditions: the presence (ON) or absence (OFF) of both HIV and VitD. A global visualization of all network genes is presented in Figure S3. A subset of 33 antiviral and 33 proviral genes modulated by VitD are shown in Figure 1D,E, respectively. Specifically, antiviral genes (Figure 1D) were selected based on their confirmed anti-HIV roles or enrichment in GO terms related to antiviral responses, cellular migration, and negative regulation of activation, whereas proviral genes (Figure 1E) were chosen for their established roles in facilitating HIV infection or enrichment in GO terms associated with proliferation, activation, and metabolic processes.
Notably, several antiviral genes, including SAMHD1, APOBEC family genes, defensins, IRF7, the interferon-inducible factor tetherin (BST2), and CXCL12, showed increased expression when VitD was ON, but were downregulated in the presence of HIV, with the exception of SAMHD1 and APOBEC genes, which remained largely unaffected by HIV (Figure 1D). In contrast, proviral genes such as AKT1, PLD1, ADAM10, TNF, LCK, SLC2A1, and CCNT1, which are implicated in cellular activation, latency maintenance, and viral replication, were upregulated in response to HIV but consistently downregulated by VitD, regardless of HIV presence (Figure 1E). The model also predicts that VitD induces expression of the HIV coreceptor CXCR4 and, to a lesser extent, CCR5, both essential for viral entry.
Interestingly, VitD downregulates several genes related to glucose metabolism and the AKT signaling pathway, including AKT1, GSK3B, MYC, SLC2A1, HIF1A, FOXO, PCK1, PFKM, and PFKL, while upregulating THEM4, INSR, and PFKFB4 (Fig 1D-E). Indeed, an interaction network of the above-mentioned VitD-modulated genes created using STRING database V12.0 [34] (available at https://string-db.org) shows the interplay and connections among AKT, antiviral and glucose metabolism genes.
Other genes involved in glucose metabolism, such as G6PD and GAPDH, remained unchanged in our simulations (Figure S3).
3.3. VitD Reduces AKT Phosphorylation, CCNT1 Expression and Glucose Uptake In Vitro
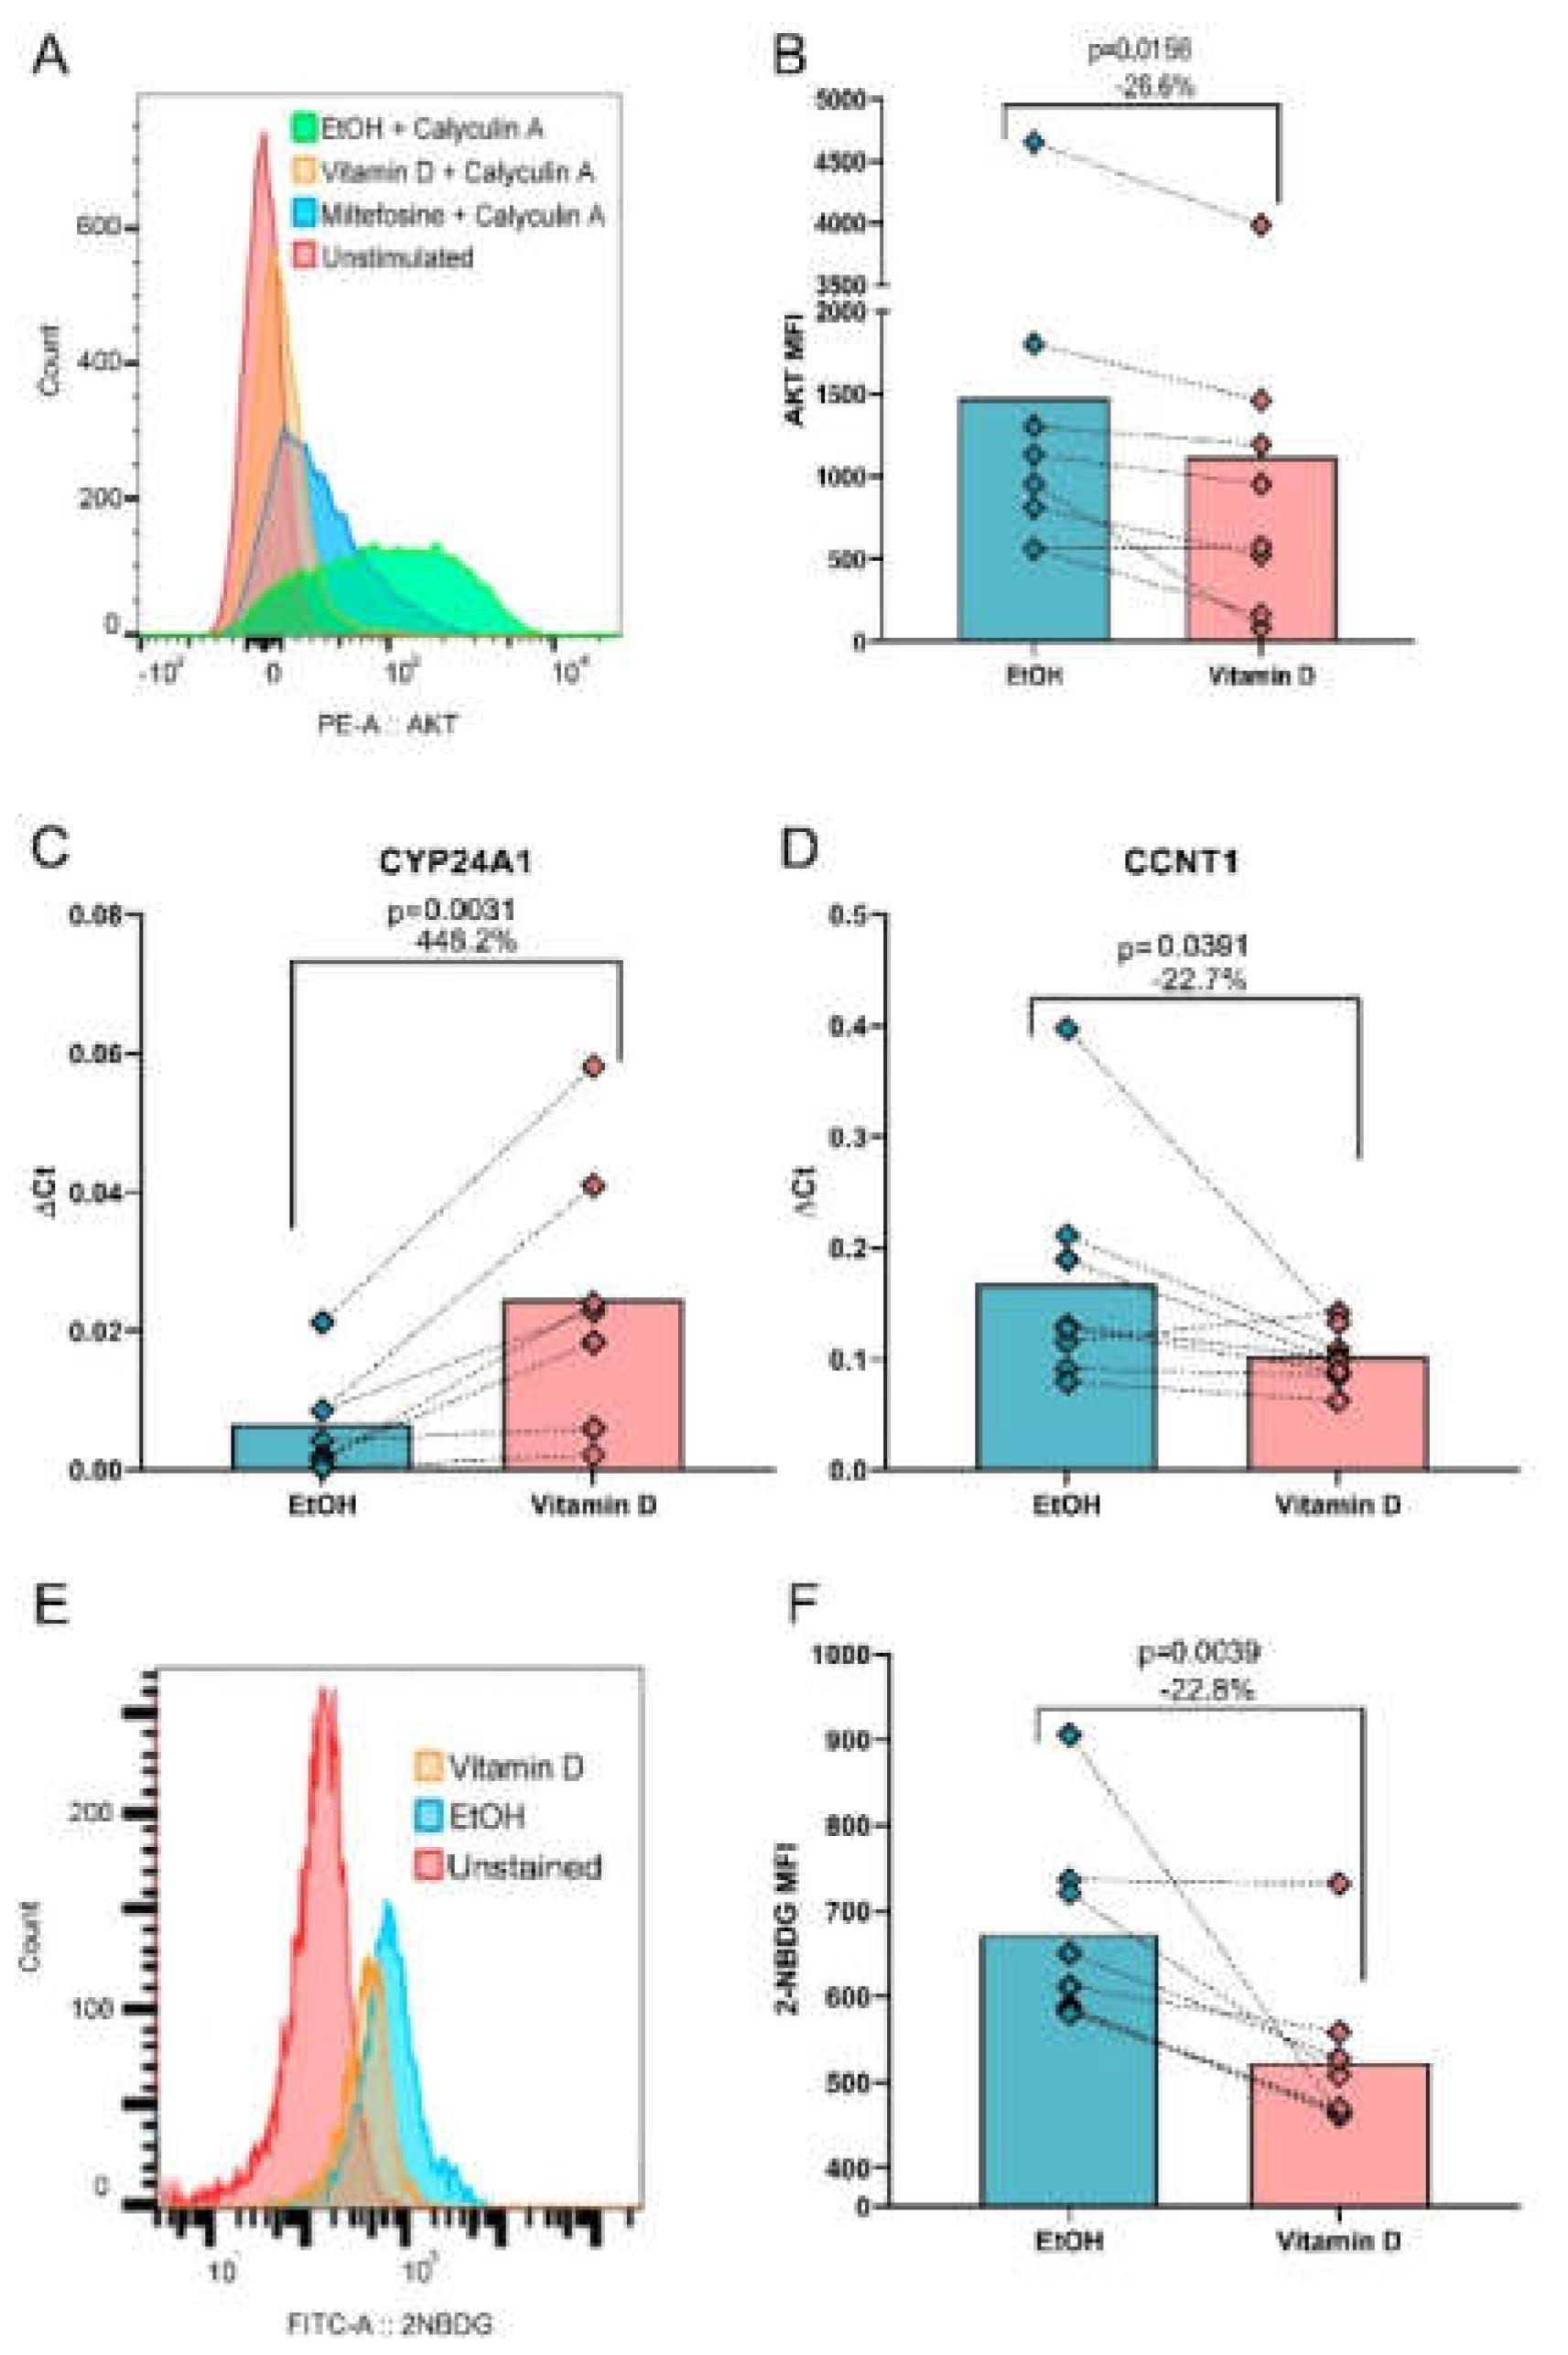
Based on the bioinformatic predictions, we investigated the effects of VitD on key pathways identified in silico, including AKT phosphorylation, glucose uptake, and the expression of antiviral and proviral genes. Flow cytometry analysis confirmed that VitD significantly reduced the MFI of phosphorylated AKT (pAkt) by 26.6% compared to the EtOH control (MFI: 766 vs. MFI: 1044, p= 0.0156, Figure 2A,B), after validating the assay using calyculin A (an AKT phosphorylation inducer) and miltefosine (an AKT inhibitor). To validate the predicted gene regulation by VitD, we analyzed the mRNA expression of SAMHD1, PLD1, ADAM10, and CCNT1, which are critical genes for HIV-1 replication [35], along with VDR and CYP24A1 as VitD-regulated genes.
As expected, the expression of CYP24A1, a well-established VitD-induced gene [36], increased by 448.2% (p = 0.0156, Figure 2C). Notably, VitD reduced the expression of CCNT1 expression by 22.7% (p = 0.0391, Figure 2D). However, the expression of the remaining four genes analyzed by qPCR, and HIV coreceptors CXCR4 and CCR5 measured by flow cytometry, showed no significant changes (Figures S5 and S6).
Given the downregulation of PFKL and AKT observed in silico, we further investigated glucose uptake using the fluorescent glucose analog 2-NBDG. VitD-treated cells exhibited a 22.8% reduction in glucose uptake compared to EtOH-treated controls (MFI: 487.5 vs. MFI: 634.5, p = 0.0039, Figure 2E,F). However, no significant linear correlation was found between glucose uptake and p24 levels (r = 0.04657, p = 0.8785), suggesting that VitD-mediated effects on glucose metabolism and HIV replication occur through distinct pathways.
4. Discussion
Our study confirmed that VitD decreases HIV-1 infection in CD4+ T cells. This finding aligns with prior reports from our group and others using various in vitro models [14,15,17,37] and in vivo approaches [16]. These anti-HIV effects are thought to be mediated by the induction of anti-inflammatory profiles and reduced T cell activation [9-11,17,18].
We demonstrated that AKT, also known as protein kinase B (PKB), a serine/threonine kinase essential for regulating metabolism, proliferation, and cell survival [38], is downregulated by VitD, as shown through both in silico and in vitro assays. The functionality of VitD in our experimental conditions was validated by measuring the transcriptional expression of CYP24A1, a well-established VitD-responsive gene, which was significantly upregulated, consistent with previous findings [36]. Our Boolean model identified AKT as a central regulator of VitD-regulated genes involved in metabolism, growth, cellular proliferation, and HIV replication. In CD4+ T cells, AKT is phosphorylated upon antigenic and co-stimulatory signals, activating downstream targets such as GSK3-β, mTORC1, CREB, Foxo, and NF-κB, which regulate activation, survival, and differentiation in these cells [38]. Notably, VitD-induced upregulation of THEM4, a known inhibitor of AKT [39], could explain the AKT inhibition observed in our model. This has been previously demonstrated in macrophages where VitD inhibited expression of THEM4 independently of LPS stimulus due to the presence of a negative VitD responsive element within the THEM4 gene [40].
The energy metabolism of T cells is intrinsically linked to their activation state. Resting T cells primarily depend on oxidative phosphorylation and fatty acid oxidation, whereas activation triggers metabolic reprogramming toward glycolysis to meet the energy demands of effector functions [41]. Because HIV replication requires activated T cells, increased glucose uptake and glycolysis efficiently promote viral replication [42,43].
AKT modulates glucose metabolism by targeting receptors and enzymes that promote aerobic glycolysis, ensuring sufficient energy supply for cell activation [44]. Consistently, our Boolean model predicted that VitD reduced SLC2A1, which encodes GLUT1, a key glucose transporter regulated by AKT. GLUT1 plays a crucial role in maintaining CD4+ T cell activation and is a marker of poor prognosis in HIV infection [45] and cancer [46]. In HIV-infected individuals, GLUT1 expression is upregulated in CD4+ T cells, correlating with increased glucose metabolism, cellular activation, and effector functions. This upregulation persists despite antiretroviral therapy and is associated with loss of CD4+ T cells and disease progression [45]. Given the association of GLUT1 expression with immune activation and disease severity, this glucose transporter could serve as a potential prognostic marker for both HIV and cancer [45,46].
Remarkably, our in vitro assays demonstrated that VitD reduces glucose uptake, mirroring findings in breast cancer cells [47]. VitD also decreased the expression of glycolytic enzymes phosphofructokinase (PFK), the main regulatory enzyme of glycolysis, and phosphoenolpyruvate carboxykinase (PCK1), a rate-limiting enzyme in gluconeogenesis. Both enzymes are predicted to interact with AKT in our interaction network. Furthermore, overexpression of PFK and PCK1 in T cells has been linked to increased glycolytic flux and enhanced effector functions [48,49]. Thus, VitD may reduce T-cell activation by downregulating glycolytic pathways. Interestingly, VitD upregulated PFKB4, an isoform of phosphofructokinase 2 (PFK2) with dual kinase and phosphatase functions. While the kinase activity of this enzyme could promote glycolysis, its phosphatase activity may promote the pentose phosphate pathway and NADPH generation, potentially reducing oxidative stress and enhancing survival in the absence of glycolysis, as observed in cancer [50].
In addition to regulating T cell activation, VitD supplementation has been shown to increase circulating regulatory (Treg) cells and positively modulate their suppressive phenotype in both healthy individuals and patients with inflammatory disease [51]. The PI3K/AKT/mTOR pathway, reduced by VitD in our bioinformatic model, integrates glucose metabolism and T cell signaling, influencing T cell fate. In peripheral CD4+ T cells, this pathway is essential for differentiation into Th1, Th2 and Th17 effector subsets [52], and it might also play a significant role in Treg development, since the phosphorylation status of AKT may lead to alternative T cell profiles. It has been observed that a low TCR signal strength leads to low AKT/mTOR signaling, resulting in induction of Treg cells in a murine model [53]. In addition, reduced glucose uptake, Glut1 expression and glycolytic activity are pivotal in promoting Treg induction. Glut1-mediated glucose uptake and expression of glycolytic cellular machinery are required for effector CD4+ T cell activation, subsequent metabolic reprogramming and clonal expansion. In contrast, Tregs rely on alternative metabolic pathways, such as fatty acid oxidation, and exhibit decreased levels of GLUT1 expression. This reduction is regulated by the transcription factor FOXP3, aligning with Tregs’ diminished reliance on glycolysis [54,55,56].
Our model also predicts that VitD downregulates GSK3B, a regulatory glycogen synthase kinase typically inhibited by the PI3K/AKT pathway [57,58]. Reduction of GSK3B has been shown to induce Treg [59], and the isoforms of this kinase have distinct effects, either enhancing or attenuating T cell activation [57]. Additionally, VitD downregulated c-Myc, a transcription factor downstream of AKT phosphorylation that is crucial for CD4+ T-cell development, differentiation, and activation [60]. c-Myc induces the expression of GLUT1, PFK, and other glycolytic proteins, and its inhibition abrogates T-cell growth and proliferation [60]. c-Myc also regulates the cell cycle by upregulating cyclins such as CCNA2, which promote G1/S and G2/M transitions. Our model predicts that VitD reduces CCNA2 expression, likely through c-Myc downregulation [61].
Furthermore, our model predicts that VitD reduces HIF1α, a transcription factor that regulates oxygen levels and hypoxic adaptive metabolic responses. Decreased HIF1α expression in CD4+ T cells inhibits glycolytic gene expression, including GLUT1 and rate-limiting enzymes such as hexokinase 2 (HK2) and pyruvate kinase myoisozyme 2 (PKM2) [44].
Although the model predicts that VitD promotes some pro-glycolytic nodes, such as the insulin receptor (INSR), which activates Glut1 in a PI3K-AKT-dependent manner [62], the net reduction in Glut1 predicted by the model could be attributed to the downregulation of major nodes such as AKT and HIF1A. These nodes control glycolysis and glucose transporter trafficking and expression, ultimately limiting glucose uptake, as confirmed in vitro, which is essential for HIV-infected cells [45,63].
These findings suggest that VitD may reprogram cellular metabolism to a state less favorable for viral replication through downregulation of AKT, thereby reducing the glycolytic pathways essential for cellular activation and therefore, limiting HIV infection. However, the complex interplay between INSR, GSK3B, and AKT observed in our model underscores the need for further studies to fully elucidate these regulatory pathways and their therapeutic potential.
In addition to its metabolic effects, VitD seems to restrict viral replication independently of cellular metabolism. We observed that VitD downregulates Cyclin-T1 both in silico and transcriptionally in vitro. Cyclin-T1, encoded by CCNT1, is the regulatory subunit of positive transcription elongation factor b (P-TEFb) [64], which is recruited by the HIV-1 Tat protein during viral genome replication. P-TEFb phosphorylates RNA polymerase II, enhancing transcriptional elongation and viral replication [65,66]. Since Cyclin-T1 expression is increased in activated lymphocytes via AKT activation [66,67], VitD may induce an antiviral state by reducing kinase cascades critical for both HIV replication and cellular activation.
VitD also modulates known HIV restriction factors in silico, such as RNA editing APOBEC proteins, antiprotease Elafin (PI3) and SAMHD1, a deoxynucleotide triphosphate hydrolase that reduces intracellular dNTP pools [35,68]. Whereas our previous results support a potential positive effect of VitD on the expression of APOBEC proteins and Elafin in mononuclear cells [17], there is little evidence available describing the effects of VitD on the expression of SAMHD1, a protein that enhances antiviral response by reducing cellular activation [69]. Although our model predicted that VitD increases SAMHD1, no significant increase of SAMHD1 mRNA was observed in response to VitD in our in vitro assays, requiring caution when interpreting the model findings.
In contrast with the antiviral state promoted by VitD, our model predicts the upregulation of HIV coreceptors CXCR4 and CCR5, essential for viral entry. Interestingly, CCR5 restricts aerobic glycolysis in memory CD4+ T cells and organizes TCR nanoclusters, reducing the T cell activation threshold [70]. VitD’s potential upregulation of CXCR4 could result from increased expression of its ligand, stromal cell-derived factor 1 (SDF1 or CXCL12), also predicted by the model, which has been observed to impede HIV entry, protecting against infection [71]. However, we observed no changes in protein levels of these coreceptors in our in vitro assays, emphasizing the need for further research to understand the implications of these findings.
Our study has several limitations. First, discrepancies between experimental and computational results may stem from the heterogeneity of data used in the bioinformatic model, which relied on public databases, whereas our in vitro experiments focused on primary CD4+ T cells. Future studies incorporating T cell-specific datasets, along with additional in vitro and ex vivo experiments, are needed to refine predictions and validate their biological relevance [72]. Second, the binary nature of gene expression modeling simplifies gene activity, potentially overlooking critical regulatory nuances. Gene interactions often rely on precise timing and sequential expressions that Boolean functions cannot fully capture. Third, we faced challenges in constructing a comprehensive Boolean model that fully represents the HIV-host gene regulatory network. The available HIV-host protein interaction databases and literature primarily focus on individual or small groups of genes, limiting our ability to identify specific genes that are necessary or sufficient for HIV replication. While Boolean modeling offered a framework to explore interactions among 227 pro- and anti-HIV host genes under VitD stimulation, further investigation with more dynamic and integrative modeling approaches is warranted.
Despite these limitations, our in vitro assays, albeit limited by a smaller sample size, demonstrated the beneficial effects of VitD in reducing p24 concentration, AKT phosphorylation, and glucose uptake, suggesting that VitD's capacity to decrease cellular activation may result in reduced HIV infection. It is worth noting that viral replication was measured only at 72 hours, an appropriate timeframe to assess viral replication. In future studies, it could be beneficial to examine other time points to determine if the effect of VitD on viral replication is sustained over time. Moreover, VitD appears to restrict viral replication by modulating the transcription of antiviral and metabolic genes. Collectively, these findings highlight the potential of VitD as an adjunctive therapeutic strategy in HIV management. Future studies should include larger sample sizes and further explore the effects of VitD on glucose transporter expression and glycolytic pathways to further elucidate its mechanism of action
Supplementary Materials
The following supporting information can be downloaded at the website of this paper posted on Preprints.org. Table S1: Complete network and interactions. File S1: HIV interaction database. File S2: Custom BooleanNet script and rules for simulating the effect of VitD and HIV. File S2: Custom dataset retrieved from the NCBI HIV-1-Human Protein Interaction Database. Figure S1: Purity and Viability Assessment of CD4+ T Cells. Figure S2: Simplified gene regulatory network of interactions relevant to HIV infection. Figure S3: Heatmap of nodes states across 40 simulation steps in the gene regulatory network. Figure S4: Gating strategy to determine the effect of VitD on AKT phosphorylation. Figure S5: qPCR results of genes not modulated by VitD. Figure S6: Effect of VitD on the expression of CXCR4 and CCR5 coreceptors.
Author Contributions
Conceptualization, Maria T. Rugeles, John Loaiza and Wbeimar Aguilar-Jimenez; methodology, Daniel Muñoz-Escudero, Sandra M. Gonzalez, Maria T. Rugeles, Fernando Gómez; software, Daniel Muñoz-Escudero, Sandra M. Gonzalez, and Fernando Gómez; validation, John Loaiza and Wbeimar Aguilar-Jimenez; formal analysis, John Loaiza, Wbeimar Aguilar-Jimenez and Ana Lucía Rodriguez-Perea; investigation, John Loaiza, Fernando Gómez and Timothy Kyle Eubank; resources, Wbeimar Aguilar-Jimenez; data curation, Ana Lucía Rodriguez-Perea; writing—original draft preparation, Fernando Gómez; writing—review and editing, John Loaiza, Wbeimar Aguilar-Jimenez, Ana Lucía Rodriguez-Perea, Timothy Kyle Eubank, Fernando Gómez; visualization, Daniel Muñoz-Escudero, Sandra M. Gonzalez; supervision, Wbeimar Aguilar-Jimenez, Maria T. Rugeles; project administration, Wbeimar Aguilar-Jimenez. All authors have read and agreed to the published version of the manuscript.
Funding
This research received no external funding.
Institutional Review Board Statement
The study was conducted in accordance with the Declaration of Helsinki and approved by the Ethics Committee of Universidad de Antioquia (ACT-008-2016).
Informed Consent Statement
Informed consent was obtained from all subjects involved in the study.
Data Availability Statement
The original contributions presented in this study are included in the article and supplementary material. Further inquiries can be directed to the corresponding author(s). Input data for our computational models was derived from the following resources available in the public domain: NCBI HIV-1-Human Protein Interaction Database, available at http://www.ncbi.nlm.nih.gov/genome/viruses/retroviruses/hiv-1/interactions, STRING Version 12.0, available at https://string-db.org, and TRRUST Version 2.0, available at https://www.grnpedia.org/trrust. Our custom BooleanNet script is available under File S1 for public use. For proper script execution, the file extension format must be changed from .txt to .py.
Acknowledgments
The authors would like to thank all the participants, Juan Gómez from University of Antioquia and Simon Villegas from The University of Queensland for their help in literature exploration and review for the bioinformatic model construction and Universidad de Antioquia for their support (Sostenibilidad program).
Conflicts of Interest
The authors declare no conflicts of interest. The funders had no role in the design of the study; in the collection, analyses, or interpretation of data; in the writing of the manuscript; or in the decision to publish the results.
Abbreviations
The following abbreviations are used in this manuscript:
| 2-NBDG | 2-(N-(7-nitrobenz-2-oxa-1,3-diazol-4-yl)amino)-2-deoxyglucose |
| AIDS | Acquired Immunodeficiency Syndrome |
| AKT, PKB | Protein Kinase B |
| APOBEC | Apolipoprotein B mRNA Editing Enzyme, Catalytic Polypeptide |
| BST2 | Tetherin |
| CCR5 | C-C chemokine receptor type 5 |
| CD | Cluster of Differentiation |
| cDNA | Complementary DNA |
| CO2 | Carbon dioxide |
| CXCR4 | C-X-C chemokine receptor type 4 |
| DNA | Deoxyribonucleic Acid |
| dNTP | Deoxynucleotide Triphosphate |
| ELISA | Enzyme-Linked Immunosorbent Assay |
| EtOH | Ethanol |
| FBS | Fetal Bovine Serum FBS |
| FOXP3 | Forkhead Box P3 |
| Glut1 | Glucose transporter 1 |
| GO | Gene Ontology |
| HESNs | HIV-Exposed Seronegative individuals |
| HIV | Human Immunodeficiency Virus. |
| HK2 | Hexokinase 2 |
| INSR | Insulin Receptor |
| MFI | Median Fluorescence Intensity |
| mRNA | messenger Ribonucleic Acid |
| mTOR | mechanistic Target of Rapamycin |
| NADPH | Nicotinamide Adenine Dinucleotide Phosphate |
| pAKT | phosphorylated AKT |
| PBMCs | Peripheral Blood Mononuclear Cells |
| PCK1 | Phosphoenolpyruvate Carboxykinase |
| PFK | Phosphofructokinase |
| PFK2 | phosphofructokinase 2 |
| PHA | Phytohemagglutinin |
| PI3 | Elafin |
| PI3K | Phosphoinositide 3-kinase |
| P-TEFb | Positive Transcription Elongation Factor b |
| qPCR | quantitative Polymerase Chain Reaction |
| RNA | Ribonucleic Acid |
| RU | Relative expression units of mRNA |
| SDF1, CXCL12 | Stromal Cell-Derived Factor 1 |
| TCR | T Cell Receptor |
| Th | Helper T cell |
| Treg | Regulatory T cell |
| VitD | Vitamin D |
References
- UNAIDS. Global HIV & AIDS statistics — Fact sheet. Available online: https://www.unaids.org/en/resources/fact-sheet (accessed on 31 October 2024).
- Palmer, C.S.; Duette, G.A.; Wagner, M.C.E.; Henstridge, D.C.; Saleh, S.; Pereira, C.; Zhou, J.; Simar, D.; Lewin, S.R.; Ostrowski, M.; et al. Metabolically active CD4+ T cells expressing Glut1 and OX40 preferentially harbor HIV during in vitro infection. FEBS Lett 2017, 591, 3319–3332. [Google Scholar] [CrossRef] [PubMed]
- Dickerson, J.E.; Pinney, J.W.; Robertson, D.L. The biological context of HIV-1 host interactions reveals subtle insights into a system hijack. BMC Syst Biol 2010, 4, 80. [Google Scholar] [CrossRef] [PubMed]
- Valle-Casuso, J.C.; Angin, M.; Volant, S.; Passaes, C.; Monceaux, V.; Mikhailova, A.; Bourdic, K.; Avettand-Fenoel, V.; Boufassa, F.; Sitbon, M.; et al. Cellular Metabolism Is a Major Determinant of HIV-1 Reservoir Seeding in CD4(+) T Cells and Offers an Opportunity to Tackle Infection. Cell Metab 2019, 29, 611–626. [Google Scholar] [CrossRef] [PubMed]
- Gonzalez, S.M.; Taborda, N.A.; Feria, M.G.; Arcia, D.; Aguilar-Jimenez, W.; Zapata, W.; Rugeles, M.T. High Expression of Antiviral Proteins in Mucosa from Individuals Exhibiting Resistance to Human Immunodeficiency Virus. PLoS ONE 2015, 10, e0131139. [Google Scholar] [CrossRef] [PubMed]
- Lajoie, J.; Juno, J.; Burgener, A.; Rahman, S.; Mogk, K.; Wachihi, C.; Mwanjewe, J.; Plummer, F.A.; Kimani, J.; Ball, T.B.; Fowke, K.R. A distinct cytokine and chemokine profile at the genital mucosa is associated with HIV-1 protection among HIV-exposed seronegative commercial sex workers. Mucosal Immunol 2012, 5, 277–287. [Google Scholar] [CrossRef]
- Yao, X.D.; Omange, R.W.; Henrick, B.M.; Lester, R.T.; Kimani, J.; Ball, T.B.; Plummer, F.A.; Rosenthal, K.L. Acting locally: innate mucosal immunity in resistance to HIV-1 infection in Kenyan commercial sex workers. Mucosal Immunol 2014, 7, 268–279. [Google Scholar] [CrossRef]
- Miyazawa, M.; Lopalco, L.; Mazzotta, F.; Lo Caputo, S.; Veas, F.; Clerici, M.; Group, E.S.N.S. The 'immunologic advantage' of HIV-exposed seronegative individuals. AIDS 2009, 23, 161–175. [Google Scholar] [CrossRef]
- von Essen, M.R.; Kongsbak, M.; Schjerling, P.; Olgaard, K.; Odum, N.; Geisler, C. Vitamin D controls T cell antigen receptor signaling and activation of human T cells. Nat Immunol 2010, 11, 344–349. [Google Scholar] [CrossRef]
- Hansdottir, S.; Monick, M.M.; Lovan, N.; Powers, L.; Gerke, A.; Hunninghake, G.W. Vitamin D decreases respiratory syncytial virus induction of NF-kappaB-linked chemokines and cytokines in airway epithelium while maintaining the antiviral state. J Immunol 2010, 184, 965–974. [Google Scholar] [CrossRef]
- Korf, H.; Wenes, M.; Stijlemans, B.; Takiishi, T.; Robert, S.; Miani, M.; Eizirik, D.L.; Gysemans, C.; Mathieu, C. 1,25-Dihydroxyvitamin D3 curtails the inflammatory and T cell stimulatory capacity of macrophages through an IL-10-dependent mechanism. Immunobiology 2012, 217, 1292–1300. [Google Scholar] [CrossRef]
- McMahon, L.; Schwartz, K.; Yilmaz, O.; Brown, E.; Ryan, L.K.; Diamond, G. Vitamin D-mediated induction of innate immunity in gingival epithelial cells. Infect Immun 2011, 79, 2250–2256. [Google Scholar] [CrossRef] [PubMed]
- Wang, T.T.; Nestel, F.P.; Bourdeau, V.; Nagai, Y.; Wang, Q.; Liao, J.; Tavera-Mendoza, L.; Lin, R.; Hanrahan, J.W.; Mader, S.; White, J.H. Cutting edge: 1,25-dihydroxyvitamin D3 is a direct inducer of antimicrobial peptide gene expression. J Immunol 2004, 173, 2909–2912. [Google Scholar] [CrossRef] [PubMed]
- Campbell, G.R.; Spector, S.A. Hormonally active vitamin D3 (1alpha,25-dihydroxycholecalciferol) triggers autophagy in human macrophages that inhibits HIV-1 infection. J Biol Chem 2011, 286, 18890–18902. [Google Scholar] [CrossRef] [PubMed]
- Coussens, A.K.; Naude, C.E.; Goliath, R.; Chaplin, G.; Wilkinson, R.J.; Jablonski, N.G. High-dose vitamin D3 reduces deficiency caused by low UVB exposure and limits HIV-1 replication in urban Southern Africans. Proc Natl Acad Sci U S A 2015, 112, 8052–8057. [Google Scholar] [CrossRef]
- Stallings, V.A.; Schall, J.I.; Hediger, M.L.; Zemel, B.S.; Tuluc, F.; Dougherty, K.A.; Samuel, J.L.; Rutstein, R.M. High-dose vitamin D3 supplementation in children and young adults with HIV: a randomized, placebo-controlled trial. Pediatr Infect Dis J 2015, 34, e32–40. [Google Scholar] [CrossRef]
- Aguilar-Jimenez, W.; Villegas-Ospina, S.; Gonzalez, S.; Zapata, W.; Saulle, I.; Garziano, M.; Biasin, M.; Clerici, M.; Rugeles, M.T. Precursor Forms of Vitamin D Reduce HIV-1 Infection In Vitro. J Acquir Immune Defic Syndr 2016, 73, 497–506. [Google Scholar] [CrossRef]
- Aguilar-Jimenez, W.; Zapata, W.; Caruz, A.; Rugeles, M.T. High transcript levels of vitamin D receptor are correlated with higher mRNA expression of human beta defensins and IL-10 in mucosa of HIV-1-exposed seronegative individuals. PLoS ONE 2013, 8, e82717. [Google Scholar] [CrossRef]
- Yiyan, S.; Yang, S.; Li, D.; Li, W. Vitamin D Affects the Warburg Effect and Stemness Maintenance of Non- Small-Cell Lung Cancer Cells by Regulating the PI3K/AKT/mTOR Signaling Pathway. Curr Cancer Drug Targets 2022, 22, 86–95. [Google Scholar] [CrossRef]
- Mutt, S.J.; Raza, G.S.; Makinen, M.J.; Keinanen-Kiukaanniemi, S.; Jarvelin, M.R.; Herzig, K.H. Vitamin D Deficiency Induces Insulin Resistance and Re-Supplementation Attenuates Hepatic Glucose Output via the PI3K-AKT-FOXO1 Mediated Pathway. Mol Nutr Food Res 2020, 64, e1900728. [Google Scholar] [CrossRef]
- Pasquereau, S.; Herbein, G. CounterAKTing HIV: Toward a "Block and Clear" Strategy? Front Cell Infect Microbiol 2022, 12, 827717. [Google Scholar] [CrossRef]
- Beer, T.M.; Munar, M.; Henner, W.D. A Phase I trial of pulse calcitriol in patients with refractory malignancies: pulse dosing permits substantial dose escalation. Cancer 2001, 91, 2431–2439. [Google Scholar] [CrossRef] [PubMed]
- Fakih, M.G.; Trump, D.L.; Muindi, J.R.; Black, J.D.; Bernardi, R.J.; Creaven, P.J.; Schwartz, J.; Brattain, M.G.; Hutson, A.; French, R.; Johnson, C.S. A phase I pharmacokinetic and pharmacodynamic study of intravenous calcitriol in combination with oral gefitinib in patients with advanced solid tumors. Clin Cancer Res 2007, 13, 1216–1223. [Google Scholar] [CrossRef] [PubMed]
- Sigmundsdottir, H.; Pan, J.; Debes, G.F.; Alt, C.; Habtezion, A.; Soler, D.; Butcher, E.C. DCs metabolize sunlight-induced vitamin D3 to 'program' T cell attraction to the epidermal chemokine CCL27. Nat Immunol 2007, 8, 285–293. [Google Scholar] [CrossRef] [PubMed]
- Fritsche, J.; Mondal, K.; Ehrnsperger, A.; Andreesen, R.; Kreutz, M. Regulation of 25-hydroxyvitamin D3-1 alpha-hydroxylase and production of 1 alpha,25-dihydroxyvitamin D3 by human dendritic cells. Blood 2003, 102, 3314–3316. [Google Scholar] [CrossRef] [PubMed]
- O'Doherty, U.; Swiggard, W.J.; Malim, M.H. Human immunodeficiency virus type 1 spinoculation enhances infection through virus binding. J Virol 2000, 74, 10074–10080. [Google Scholar] [CrossRef]
- Han, H.; Cho, J.W.; Lee, S.; Yun, A.; Kim, H.; Bae, D.; Yang, S.; Kim, C.Y.; Lee, M.; Kim, E.; et al. TRRUST v2: an expanded reference database of human and mouse transcriptional regulatory interactions. Nucleic Acids Res 2018, 46, D380–D386. [Google Scholar] [CrossRef]
- Ako-Adjei, D.; Fu, W.; Wallin, C.; Katz, K.S.; Song, G.; Darji, D.; Brister, J.R.; Ptak, R.G.; Pruitt, K.D. HIV-1, human interaction database: current status and new features. Nucleic Acids Res 2015, 43, D566–570. [Google Scholar] [CrossRef]
- Kachalo, S.; Zhang, R.; Sontag, E.; Albert, R.; DasGupta, B. NET-SYNTHESIS: a software for synthesis, inference and simplification of signal transduction networks. Bioinformatics 2008, 24, 293–295. [Google Scholar] [CrossRef]
- Albert, I. Ialbert/Booleannet: Boolean Network Modeling. Available online: https://github.com/ialbert/booleannet (accessed on 19 November 2024).
- Pozuelo-Rubio, M.; Leslie, N.R.; Murphy, J.; Mackintosh, C. Mechanism of activation of PKB/Akt by the protein phosphatase inhibitor Calyculin A. Cell Biochem Biophys 2010, 58, 147–156. [Google Scholar] [CrossRef]
- Cheshenko, N.; Trepanier, J.B.; Stefanidou, M.; Buckley, N.; Gonzalez, P.; Jacobs, W.; Herold, B.C. HSV activates Akt to trigger calcium release and promote viral entry: novel candidate target for treatment and suppression. FASEB J 2013, 27, 2584–2599. [Google Scholar] [CrossRef]
- Walker, N.J. Tech.Sight. A technique whose time has come. Science 2002, 296, 557–559. [Google Scholar] [CrossRef] [PubMed]
- Szklarczyk, D.; Kirsch, R.; Koutrouli, M.; Nastou, K.; Mehryary, F.; Hachilif, R.; Gable, A.L.; Fang, T.; Doncheva, N.T.; Pyysalo, S.; et al. The STRING database in 2023: protein-protein association networks and functional enrichment analyses for any sequenced genome of interest. Nucleic Acids Res 2023, 51, D638–D646. [Google Scholar] [CrossRef] [PubMed]
- Friedrich, B.M.; Dziuba, N.; Li, G.; Endsley, M.A.; Murray, J.L.; Ferguson, M.R. Host factors mediating HIV-1 replication. Virus Res 2011, 161, 101–114. [Google Scholar] [CrossRef] [PubMed]
- Baeke, F.; Korf, H.; Overbergh, L.; van Etten, E.; Verstuyf, A.; Gysemans, C.; Mathieu, C. Human T lymphocytes are direct targets of 1,25-dihydroxyvitamin D3 in the immune system. J Steroid Biochem Mol Biol 2010, 121, 221–227. [Google Scholar] [CrossRef]
- Gonzalez, S.M.; Aguilar-Jimenez, W.; Trujillo-Gil, E.; Zapata, W.; Su, R.C.; Ball, T.B.; Rugeles, M.T. Vitamin D treatment of peripheral blood mononuclear cells modulated immune activation and reduced susceptibility to HIV-1 infection of CD4+ T lymphocytes. PLoS ONE 2019, 14, e0222878. [Google Scholar] [CrossRef]
- Abdullah, L.; Hills, L.B.; Winter, E.B.; Huang, Y.H. Diverse Roles of Akt in T cells. Immunometabolism 2021, 3. [Google Scholar] [CrossRef]
- Maira, S.M.; Galetic, I.; Brazil, D.P.; Kaech, S.; Ingley, E.; Thelen, M.; Hemmings, B.A. Carboxyl-terminal modulator protein (CTMP), a negative regulator of PKB/Akt and v-Akt at the plasma membrane. Science 2001, 294, 374–380. [Google Scholar] [CrossRef]
- Wang, Q.; He, Y.; Shen, Y.; Zhang, Q.; Chen, D.; Zuo, C.; Qin, J.; Wang, H.; Wang, J.; Yu, Y. Vitamin D inhibits COX-2 expression and inflammatory response by targeting thioesterase superfamily member 4. J Biol Chem 2014, 289, 11681–11694. [Google Scholar] [CrossRef]
- Pearce, E.L.; Poffenberger, M.C.; Chang, C.H.; Jones, R.G. Fueling immunity: insights into metabolism and lymphocyte function. Science 2013, 342, 1242454. [Google Scholar] [CrossRef]
- Pan, X.; Baldauf, H.M.; Keppler, O.T.; Fackler, O.T. Restrictions to HIV-1 replication in resting CD4+ T lymphocytes. Cell Res 2013, 23, 876–885. [Google Scholar] [CrossRef]
- Lever, A.M.; Jeang, K.T. Insights into cellular factors that regulate HIV-1 replication in human cells. Biochemistry 2011, 50, 920–931. [Google Scholar] [CrossRef] [PubMed]
- Liu, S.; Liao, S.; Liang, L.; Deng, J.; Zhou, Y. The relationship between CD4(+) T cell glycolysis and their functions. Trends Endocrinol Metab 2023, 34, 345–360. [Google Scholar] [CrossRef] [PubMed]
- Palmer, C.S.; Ostrowski, M.; Gouillou, M.; Tsai, L.; Yu, D.; Zhou, J.; Henstridge, D.C.; Maisa, A.; Hearps, A.C.; Lewin, S.R.; et al. Increased glucose metabolic activity is associated with CD4+ T-cell activation and depletion during chronic HIV infection. AIDS 2014, 28, 297–309. [Google Scholar] [CrossRef] [PubMed]
- Kato, H.; Takita, J.; Miyazaki, T.; Nakajima, M.; Fukai, Y.; Masuda, N.; Fukuchi, M.; Manda, R.; Ojima, H.; Tsukada, K.; Kuwano, H. Glut-1 glucose transporter expression in esophageal squamous cell carcinoma is associated with tumor aggressiveness. Anticancer Res 2002, 22, 2635–2639. [Google Scholar]
- Xiang, J.; Wang, K.; Tang, N. PCK1 dysregulation in cancer: Metabolic reprogramming, oncogenic activation, and therapeutic opportunities. Genes Dis 2023, 10, 101–112. [Google Scholar] [CrossRef]
- Ho, P.C.; Bihuniak, J.D.; Macintyre, A.N.; Staron, M.; Liu, X.; Amezquita, R.; Tsui, Y.C.; Cui, G.; Micevic, G.; Perales, J.C.; et al. Phosphoenolpyruvate Is a Metabolic Checkpoint of Anti-tumor T Cell Responses. Cell 2015, 162, 1217–1228. [Google Scholar] [CrossRef]
- Toledano Zur, R.; Atar, O.; Barliya, T.; Hoogi, S.; Abramovich, I.; Gottlieb, E.; Ron-Harel, N.; Cohen, C.J. Genetically engineering glycolysis in T cells increases their antitumor function. J Immunother Cancer 2024, 12. [Google Scholar] [CrossRef]
- Guo, M.; Abd-Rabbo, D.; Bertol, B.C.; Carew, M.; Lukhele, S.; Snell, L.M.; Xu, W.; Boukhaled, G.M.; Elsaesser, H.; Halaby, M.J.; et al. Molecular, metabolic, and functional CD4 T cell paralysis in the lymph node impedes tumor control. Cell Rep 2023, 42, 113047. [Google Scholar] [CrossRef]
- Fisher, S.A.; Rahimzadeh, M.; Brierley, C.; Gration, B.; Doree, C.; Kimber, C.E.; Plaza Cajide, A.; Lamikanra, A.A.; Roberts, D.J. The role of vitamin D in increasing circulating T regulatory cell numbers and modulating T regulatory cell phenotypes in patients with inflammatory disease or in healthy volunteers: A systematic review. PLoS ONE 2019, 14, e0222313. [Google Scholar] [CrossRef]
- Pompura, S.L.; Dominguez-Villar, M. The PI3K/AKT signaling pathway in regulatory T-cell development, stability, and function. J Leukoc Biol 2018. [Google Scholar] [CrossRef]
- Hawse, W.F.; Boggess, W.C.; Morel, P.A. TCR Signal Strength Regulates Akt Substrate Specificity To Induce Alternate Murine Th and T Regulatory Cell Differentiation Programs. J Immunol 2017, 199, 589–597. [Google Scholar] [CrossRef] [PubMed]
- Gerriets, V.A.; Kishton, R.J.; Johnson, M.O.; Cohen, S.; Siska, P.J.; Nichols, A.G.; Warmoes, M.O.; de Cubas, A.A.; MacIver, N.J.; Locasale, J.W.; et al. Foxp3 and Toll-like receptor signaling balance T(reg) cell anabolic metabolism for suppression. Nat Immunol 2016, 17, 1459–1466. [Google Scholar] [CrossRef] [PubMed]
- Macintyre, A.N.; Gerriets, V.A.; Nichols, A.G.; Michalek, R.D.; Rudolph, M.C.; Deoliveira, D.; Anderson, S.M.; Abel, E.D.; Chen, B.J.; Hale, L.P.; Rathmell, J.C. The glucose transporter Glut1 is selectively essential for CD4 T cell activation and effector function. Cell Metab 2014, 20, 61–72. [Google Scholar] [CrossRef]
- Kempkes, R.W.M.; Joosten, I.; Koenen, H.; He, X. Metabolic Pathways Involved in Regulatory T Cell Functionality. Front Immunol 2019, 10, 2839. [Google Scholar] [CrossRef]
- Steele, L.; Mannion, A.J.; Shaw, G.; Maclennan, K.A.; Cook, G.P.; Rudd, C.E.; Taylor, A. Non-redundant activity of GSK-3alpha and GSK-3beta in T cell-mediated tumor rejection. iScience 2021, 24, 102555. [Google Scholar] [CrossRef]
- Jendrossek, V.; Henkel, M.; Hennenlotter, J.; Vogel, U.; Ganswindt, U.; Muller, I.; Handrick, R.; Anastasiadis, A.G.; Kuczyk, M.; Stenzl, A.; Belka, C. Analysis of complex protein kinase B signalling pathways in human prostate cancer samples. BJU Int 2008, 102, 371–382. [Google Scholar] [CrossRef]
- Xia, Y.; Zhuo, H.; Lu, Y.; Deng, L.; Jiang, R.; Zhang, L.; Zhu, Q.; Pu, L.; Wang, X.; Lu, L. Glycogen synthase kinase 3beta inhibition promotes human iTreg differentiation and suppressive function. Immunol Res 2015, 62, 60–70. [Google Scholar] [CrossRef]
- Wang, R.; Dillon, C.P.; Shi, L.Z.; Milasta, S.; Carter, R.; Finkelstein, D.; McCormick, L.L.; Fitzgerald, P.; Chi, H.; Munger, J.; Green, D.R. The transcription factor Myc controls metabolic reprogramming upon T lymphocyte activation. Immunity 2011, 35, 871–882. [Google Scholar] [CrossRef]
- Garcia-Gutierrez, L.; Bretones, G.; Molina, E.; Arechaga, I.; Symonds, C.; Acosta, J.C.; Blanco, R.; Fernandez, A.; Alonso, L.; Sicinski, P.; et al. Myc stimulates cell cycle progression through the activation of Cdk1 and phosphorylation of p27. Sci Rep 2019, 9, 18693. [Google Scholar] [CrossRef]
- Taniguchi, C.M.; Emanuelli, B.; Kahn, C.R. Critical nodes in signalling pathways: insights into insulin action. Nat Rev Mol Cell Biol 2006, 7, 85–96. [Google Scholar] [CrossRef]
- Lan, X.; Cheng, K.; Chandel, N.; Lederman, R.; Jhaveri, A.; Husain, M.; Malhotra, A.; Singhal, P.C. High glucose enhances HIV entry into T cells through upregulation of CXCR4. J Leukoc Biol 2013, 94, 769–777. [Google Scholar] [CrossRef] [PubMed]
- Fujinaga, K.; Huang, F.; Peterlin, B.M. P-TEFb: The master regulator of transcription elongation. Mol Cell 2023, 83, 393–403. [Google Scholar] [CrossRef] [PubMed]
- Hafer, T.L.; Felton, A.; Delgado, Y.; Srinivasan, H.; Emerman, M. A CRISPR Screen of HIV Dependency Factors Reveals That CCNT1 Is Non-Essential in T Cells but Required for HIV-1 Reactivation from Latency. Viruses 2023, 15, 1863. [Google Scholar] [CrossRef] [PubMed]
- Mbonye, U.; Karn, J. The cell biology of HIV-1 latency and rebound. Retrovirology 2024, 21, 6. [Google Scholar] [CrossRef]
- Rice, A.P.; Herrmann, C.H. Regulation of TAK/P-TEFb in CD4+ T lymphocytes and macrophages. Curr HIV Res 2003, 1, 395–404. [Google Scholar] [CrossRef]
- Ellegard, R.; Shankar, E.M.; Larsson, M. Targeting HIV-1 innate immune responses therapeutically. Curr Opin HIV AIDS 2011, 6, 435–443. [Google Scholar] [CrossRef]
- Ruffin, N.; Brezar, V.; Ayinde, D.; Lefebvre, C.; Schulze Zur Wiesch, J.; van Lunzen, J.; Bockhorn, M.; Schwartz, O.; Hocini, H.; Lelievre, J.D.; et al. Low SAMHD1 expression following T-cell activation and proliferation renders CD4+ T cells susceptible to HIV-1. AIDS 2015, 29, 519–530. [Google Scholar] [CrossRef]
- Blanco, R.; Gomez de Cedron, M.; Gamez-Reche, L.; Martin-Leal, A.; Gonzalez-Martin, A.; Lacalle, R.A.; Ramirez de Molina, A.; Manes, S. The Chemokine Receptor CCR5 Links Memory CD4(+) T Cell Metabolism to T Cell Antigen Receptor Nanoclustering. Front Immunol 2021, 12, 722320. [Google Scholar] [CrossRef]
- Jacobs, E.S.; Keating, S.M.; Abdel-Mohsen, M.; Gibb, S.L.; Heitman, J.W.; Inglis, H.C.; Martin, J.N.; Zhang, J.; Kaidarova, Z.; Deng, X.; et al. Cytokines Elevated in HIV Elite Controllers Reduce HIV Replication In Vitro and Modulate HIV Restriction Factor Expression. J Virol 2017, 91. [Google Scholar] [CrossRef]
- Schwab, J.D.; Kuhlwein, S.D.; Ikonomi, N.; Kuhl, M.; Kestler, H.A. Concepts in Boolean network modeling: What do they all mean? Comput Struct Biotechnol J 2020, 18, 571–582. [Google Scholar] [CrossRef]
Figure 1.
VitD reduces HIV replication in vitro and modulates host gene expression in silico. (A) p24 concentrations in CD4+ T cell supernatants 72 hours post-infection in the presence of VitD or EtOH (vehicle control). Points represent individual values. Statistical comparisons were performed using Wilcoxon matched pairs signed rank test. (B) GO enrichment analysis of genes positively and (C) negatively modulated by VitD. Dot plots highlight the top enriched GO terms associated with genes upregulated and downregulated in the presence of VitD. Dot plots highlight the top enriched GO terms, with dot size representing the number of genes in each term, color representing p-values and the x-axis showing the gene ratio. (D) Heatmaps displaying the simulated regulatory behavior of selected antiviral and (E) proviral genes in response to VitD under different conditions (VitD ON/OFF and HIV ON/OFF). Rows correspond to individual genes and columns represent the last 20 averaged simulation steps for each condition. (F) Undirected interaction network of AKT and other VitD-modulated genes in the Boolean model, with roles in cellular activation, metabolism, and anti-HIV responses. GO terms associated with each protein are color-coded, with each color representing a specific biological process or metabolic pathway. Lines indicate confidence levels, ranging from 0.15 to 0.90, with thicker lines representing higher confidence. The network was generated using STRING, incorporating evidence from both functional and physical interactions.
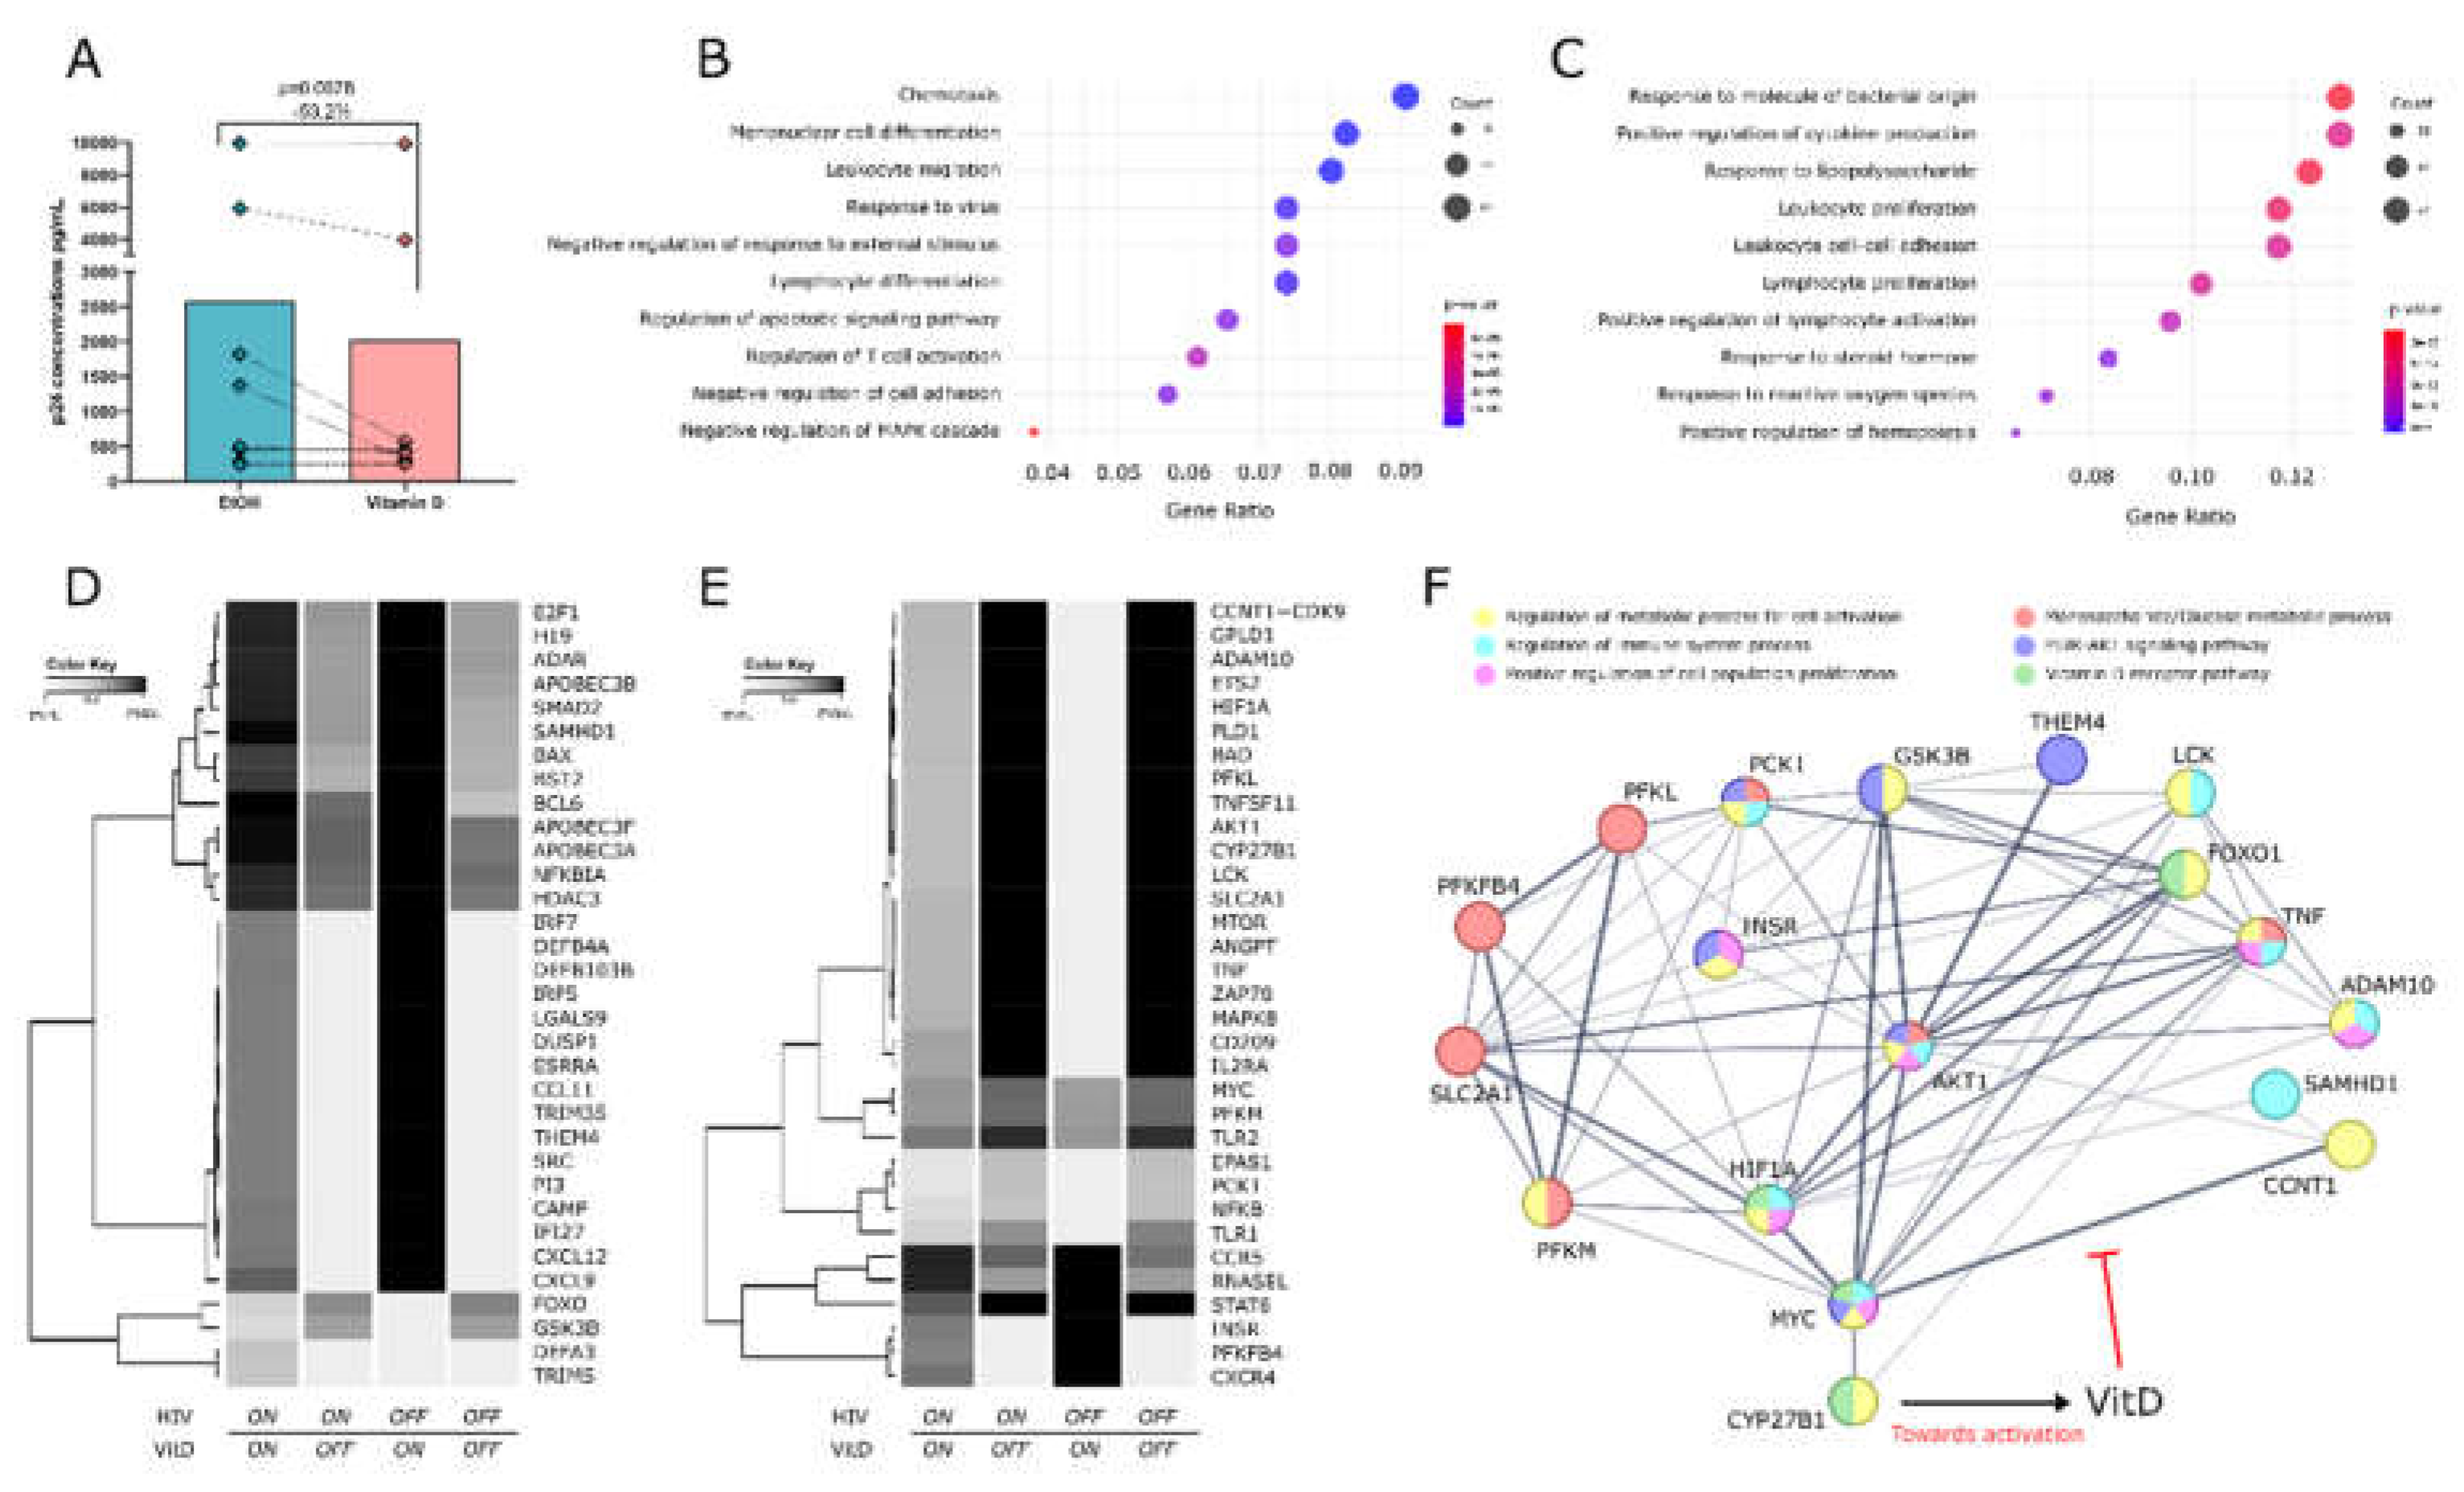
Figure 2.
VitD reduces AKT phosphorylation, modulates gene expression and decreases glucose uptake in CD4+ T-cells in vitro. (A) Representative flow cytometry histogram showing the MFI of pAKT upon 30 min of calyculin stimulation, either under VitD treatment with EtOH as a vehicle control, or miltefosine as a negative control (B) MFI of pAKT upon VitD stimulation versus vehicle control (EtOH). (C) Effect of VitD on gene regulation by qPCR. CYP24A1, a gene known to be regulated by the active form of VitD was used as a control. (D) Expression of proviral gene CCNT1 decreased after VitD stimulation. (E) Flow cytometry histogram showing the MFI of 2-NBDG under different experimental conditions (F) MFI of 2-NDBG uptake upon VitD stimulation versus vehicle control. Wilcoxon matched pairs signed rank test was used for all statistical comparisons.
Disclaimer/Publisher’s Note: The statements, opinions and data contained in all publications are solely those of the individual author(s) and contributor(s) and not of MDPI and/or the editor(s). MDPI and/or the editor(s) disclaim responsibility for any injury to people or property resulting from any ideas, methods, instructions or products referred to in the content. |
© 2024 by the authors. Licensee MDPI, Basel, Switzerland. This article is an open access article distributed under the terms and conditions of the Creative Commons Attribution (CC BY) license (http://creativecommons.org/licenses/by/4.0/).
Copyright: This open access article is published under a Creative Commons CC BY 4.0 license, which permit the free download, distribution, and reuse, provided that the author and preprint are cited in any reuse.


