
Submitted:
23 December 2024
Posted:
24 December 2024
You are already at the latest version
Abstract
This article focuses on the propensity to patent across Italian regions, considering data from ISTAT-BES between 2004 and 2019 to contribute to analyzing regional gaps and determinants of innovative performances. Results show how the North-South gap in innovative performance has persisted over time, confirming the relevance of research intensity, digital infrastructure, and cultural employment on patenting activity. These relations have been analyzed using the panel data econometric model. It allows singling out crucial positive drivers like R&D investment or strongly negative factors, such as limited mobility of graduates. More precisely, given the novelty of approaches applied in the used model, the following contributions are represented: first, the fine grain of regional differentiation, from which the sub-national innovation system will be observed. It also puts forward a set of actionable policy recommendations that would contribute to more substantial inclusive innovation, particularly emphasizing less-performing regions. By focusing on such dynamics, this study will indirectly address how regional characteristics and policies shape innovation and technological competitiveness in Italy. Therefore, it contributes to the debate on regional systems of innovation and their possible role in economic development in Europe since the economic, institutional, and technological conditions are differentiated between various areas in Italy.
Keywords:
Innovation
; Innovation and Invention
; Management of Technological Innovation and R&D
; Technological Change
; Intellectual Property and Intellectual Capital
1. Introduction
The innovation landscape in Italy is a mosaic of regional differences, subtleties and unique industrial dynamics that characterize the propensity to patent in different areas of the country. This article embarks on an analytical journey to decipher the factors that influence patenting behavior in Italian regions, delving into the diverse structure of the Italian innovation ecosystem. Italy is known for its rich history of creativity and technological advancement, from the inventors of the Renaissance to the industrial designers of today. This study aims to shed light on the current challenges and opportunities of regional innovation systems. We hypothesize that regional characteristics such as the presence of industry clusters, the level of R&D investment, the quality of academic institutions, and the availability of supportive policies and infrastructures significantly influence the propensity to patent. Furthermore, this article seeks to understand how these factors interact with the broader national and European intellectual property framework to influence regional innovation outcomes. By using a mixed methods approach that combines quantitative analysis of patent data from the European Patent Office (EPO) with qualitative insights from interviews with regional stakeholders, this study aims to provide a comprehensive picture of the patent landscape in Italy.
This dual approach allows us not only to map the distribution of patent activities, but also to uncover the underlying motivations, obstacles and strategies that determine the innovation paths of Italian regions. This research is embedded in the broader discourse on regional innovation systems (RIS) and the role of intellectual property rights (IPR) in promoting economic growth and competitiveness in the knowledge economy. In this way, we aim to contribute to the ongoing dialog on how regions in a country as historically and culturally rich as Italy can navigate the complexities of innovation, competitiveness and economic development in the 21st century. Our findings are intended to inform policy makers, business leaders and academics about the nuances of promoting innovation in different regional contexts. By identifying the levers and barriers to patenting in Italian regions, this article aims to provide insights that could lead to the formulation of more nuanced, effective policies and strategies to improve Italy's innovation capacity and regional competitiveness on the global stage.
The article proceeds as follows: the second section presents an analysis of the literature, the third section analyzes the data on patent propensity in Italian regions, the fourth section presents the econometric analysis, the fifth section highlights the policy implications related to patent propensity, the sixth section presents the conclusions.
2. Critical Analysis of Scientific Literature by Macro Themes
Innovation systems are integral frameworks that determine the development, diffusion and application of knowledge in regions, nations and industries. This literature review critically examines five interrelated macro-themes that explore the dynamics of innovation systems and their impact on technological and economic development. First, the concept of regional innovation systems (RIS) and their efficiency is discussed, focusing on the interplay between local knowledge flows, resource allocation and innovation performance. Second, it examines the role of national innovation systems (NIS) and governance, focusing on how policy and institutional frameworks drive innovation at the national level. Third, the analysis looks at the importance of universities and knowledge networks as central nodes in innovation systems and examines their contribution to knowledge transfer and technological progress. Fourth, it assesses the critical relationship between innovation and patents, looking at patents both as facilitators of technological diffusion and as instruments for the protection of intellectual property. Finally, the report looks at emerging trends and technologies that are reshaping innovation systems, such as digital transformation, sustainability-driven innovation and open collaboration models. Together, these topics provide a comprehensive understanding of how innovation systems function and evolve in response to global challenges and opportunities.
2.1. Regional Innovation Systems (RIS) and Efficiency
Regional Innovation Systems (RIS) are frameworks that describe the interaction between institutions, firms, and knowledge systems within a specific geographic area, aimed at fostering innovation and regional development. Patenting, as both an indicator and driver of innovation, plays a critical role in these systems by promoting knowledge spillovers, protecting intellectual property, and facilitating commercialization. This discussion critically examines selected articles on RIS, analyzing their contributions to understanding the relationship between patenting, innovation systems, and regional development. Cooke, Heidenreich, and Braczyk (2024) provide a foundational perspective on RIS, adopting an evolutionary approach that emphasizes the role of institutional structures and local knowledge dynamics. They argue that RIS effectiveness depends on adaptive governance mechanisms that support knowledge creation and diffusion. Fernandes et al. (2021) complement this view by synthesizing 25 years of RIS research, highlighting how institutional quality and policy design have emerged as critical determinants of innovation performance. Theoretical advancements in RIS underscore the importance of patents as metrics for regional innovation. Patents capture the output of localized knowledge production and signal the region's technological competitiveness. Thus, understanding RIS requires integrating patenting activities into broader innovation policies that enhance regional development.
Several studies explore the role of patents within RIS. Ali (2024) investigates the Egyptian context using a regional knowledge production function approach, demonstrating that patents are closely linked to knowledge generation and economic outcomes in governorates. The study highlights disparities in patenting activities, emphasizing the need for targeted interventions to foster innovation in lagging regions. Block et al. (2022) focus on Japanese prefectures, using trademarks and patents as indicators of regional innovation. Their findings suggest that intellectual property rights serve as proxies for measuring innovation intensity and reveal regional disparities in innovation capacity. Similarly, Bianchi et al. (2021) examine Latin American cities, illustrating the trade-offs involved in brokerage roles within innovation networks. They emphasize the significance of patents in sustaining knowledge exchange and fostering regional competitiveness. These studies collectively underline patents as central to RIS, not only as indicators of innovation output but also as enablers of knowledge transfer and collaboration. Policymakers must, therefore, design strategies to enhance patenting activity while addressing regional disparities in knowledge production.
Barra and Ruggiero (2022) provide an in-depth analysis of how institutional quality influences RIS efficiency in Italy. They identify key dimensions such as governance, rule of law, and institutional transparency that enhance the effectiveness of innovation systems. Their findings align with those of Ciołek and Golejewska (2022), who examine Polish subregions and highlight the role of institutional stability in fostering innovation. Institutional quality serves as a foundational element in RIS by creating an enabling environment for patenting and innovation. Without robust governance structures, even regions with high innovation potential may struggle to capitalize on their knowledge assets. This insight underscores the necessity of integrating institutional reforms into regional innovation strategies.
Berman et al. (2020) adopt a core–periphery perspective to analyze the global connectivity of Italian RIS. They argue that regions with strong global linkages outperform isolated regions in innovation output, as global networks facilitate knowledge spillovers and access to advanced technologies. Kim and Lee (2022) extend this analysis to Asian regions, emphasizing the local-global interface as a critical factor in RIS catching-up processes. Regions such as Shenzhen demonstrate how global connectivity can accelerate innovation and development. Ganau and Grandinetti (2021) disentangle regional innovation capability, highlighting the importance of both local knowledge flows and global networks. They argue that balancing these dimensions is essential for RIS to thrive. These studies collectively emphasize that connectivity enhances the absorptive capacity of RIS, enabling regions to leverage external knowledge while strengthening internal capabilities.
Despite the potential of RIS, significant challenges persist. Cappellano et al. (2022) explore cross-border RIS and highlight the complexities of coordinating innovation activities across national boundaries. They argue that cross-border regions face unique challenges related to policy fragmentation and institutional mismatches. Heidenreich (2024) identifies broader dilemmas in RIS, including the tension between innovation-driven growth and social equity. He argues that policymakers must balance the pursuit of competitiveness with inclusive development. Pan et al. (2023) offer a complementary perspective, using lifecycle analysis to identify stages of RIS development in China. Their findings highlight the need for adaptive policies that address the evolving needs of regions at different stages of innovation maturity. Future research should focus on integrating digital transformation into RIS frameworks. Digital technologies offer new opportunities for regional development but also present challenges related to skill gaps and infrastructure disparities. Policymakers must navigate these challenges to ensure that RIS remain inclusive and sustainable.
The critical discussion of selected articles shows the complicated relationship between patenting, innovation systems and regional development. Patents serve both as indicators and drivers of innovation, shaping the dynamics of RIS and promoting regional competitiveness. The quality of institutions and global-local networking prove to be decisive factors for the effectiveness of RIS, while challenges such as policy fragmentation and regional inequalities require targeted interventions. To maximize the potential of RIS, policy makers need to prioritize institutional reforms, strengthen global-local linkages and incentivize patenting activities. Future research should explore the integration of digital technologies into RIS and develop strategies to address the challenges posed by technological disruption. With a holistic approach, regions can harness the power of innovation to drive sustainable and inclusive development (Table 1).
2.2. National Innovation Systems (NIS) and Governance
Patents are both indicators of technological progress and essential tools for driving innovation. They protect intellectual property, encourage investment in research and development (R&D), and facilitate knowledge transfer. Innovation systems, particularly at the national and regional levels, play a central role in fostering environments conducive to patenting activity. Regional development is significantly influenced by these systems, as they shape knowledge creation, economic growth, and technological advancement. This discussion critically examines selected articles, interpreting their insights on the interconnections between patenting, innovation systems, and regional development. By addressing the roles of governance, collaboration networks, historical legacies, and sectoral specialization, the analysis highlights the complex dynamics shaping innovation outcomes. Political stability significantly affects innovation systems, as explored by Aguiar-Hernandez and Breetz (2024). Their study on Mexico's wind and solar sectors demonstrates how inconsistent policies and political instability disrupt resource allocation, impede investment in R&D, and weaken long-term innovation efforts. The lack of a stable policy environment discourages private sector participation and limits patent filings in renewable energy technologies. This, in turn, stifles regional development by curbing the potential for knowledge diffusion and economic growth. Stable governance frameworks are essential for fostering innovation systems that encourage patenting and drive sustainable regional development. Anouze, Al Khalifa, and Al-Jayyousi (2024) introduce a dynamic-network data envelopment analysis (DEA) index to evaluate national innovation systems. Their approach incorporates patenting as a key metric of innovation efficiency, reflecting the ability of a system to transform inputs such as R&D investments into tangible outputs like patents. Patents serve as critical indicators of the efficiency of innovation systems at both national and regional levels. By identifying disparities in innovation performance, tools like the DEA index guide policymakers in implementing targeted interventions. Efficient innovation systems, characterized by robust patenting activity, drive regional development by fostering commercialization, attracting investment, and creating jobs. Regions with weaker systems must focus on institutional reforms to improve patent generation and innovation capacity. Governance is also central to the effectiveness of innovation systems. Binz and Truffer (2020) examine the influence of governance structures on global innovation systems, emphasizing the need for context-sensitive policies that balance local needs with global opportunities. Governance frameworks determine how effectively innovation systems can produce patents by fostering collaboration and addressing structural challenges. Similarly, Galaso and Kovářík (2021) analyze the impact of collaboration networks on innovation outcomes. Their study highlights how strong local networks enhance trust and promote knowledge spillovers, while national-level networks facilitate access to diverse resources.
Together, these studies underscore that robust governance and collaborative networks are critical for fostering patenting and driving regional innovation systems. Regions with strong global and local linkages experience greater innovation outcomes, as knowledge flows across networks facilitate technological advancements and economic growth. To enhance these dynamics, governments must promote international collaboration and foster cross-regional partnerships that integrate regions into global value chains. Historical legacies profoundly influence innovation systems and patenting performance, as shown in the work of Fritsch, Greve, and Wyrwich (2023). Their analysis of East and West Germany between 1877 and 2014 reveals how socialist policies in East Germany suppressed entrepreneurial activities, resulting in lower patenting rates even after reunification. Historical trajectories shape regional innovation capabilities, creating disparities in technological advancement and economic development. Regions with a weaker historical foundation in innovation often exhibit lower levels of patenting and slower economic progress. Bridging these gaps requires targeted capacity-building initiatives that address historical inequities and foster innovation ecosystems capable of sustaining patenting activity over time. Universities are pivotal actors in national and regional innovation systems, particularly through their contributions to patenting. Shahwan and Zaman (2023) emphasize the critical role universities play as knowledge creators, especially within the open innovation paradigm. Universities act as hubs for translating research into marketable technologies, contributing significantly to patent filings and fostering knowledge transfer. Regions with strong university-industry linkages benefit from enhanced patenting activity, technological advancements, and economic growth. Policies that incentivize collaboration between academia and industry can further strengthen regional innovation ecosystems. Establishing technology transfer offices and funding joint research initiatives are effective strategies for enhancing patenting and commercialization efforts.
Sectoral innovation systems play a crucial role in aligning patenting with regional development goals. Gutiérrez, Roa, and Smith (2021) focus on the Chilean sectoral innovation systems, demonstrating how sector-specific dynamics influence patenting activity. Disparities in institutional support and market demand lead to variations in innovation performance across different sectors. Similarly, Montenegro, Ribeiro, and Britto (2021) analyze the role of environmental technologies within national innovation systems, emphasizing their potential to drive sustainable development. Patenting activity in sectors like renewable energy and green technologies not only advances regional innovation systems but also aligns them with global sustainability objectives. Regions specializing in high-potential sectors achieve better developmental outcomes by leveraging their unique strengths. Policymakers should prioritize R&D funding in these sectors, aligning patenting efforts with sustainability and regional growth. Smart specialization strategies are another effective mechanism for enhancing innovation systems and patenting performance. Ruhrmann, Fritsch, and Leydesdorff (2022) examine how smart specialization strategies in Germany foster synergy across national, regional, and local innovation systems. These strategies align patenting efforts with regional strengths, optimizing resource allocation and fostering competitive advantages. Patents often reflect the effectiveness of specialization strategies, signaling a region’s capacity to innovate in niche areas. Smart specialization reduces duplication of effort and enables regions to focus resources on high-potential industries. Collaborative policy-making at multiple levels of governance is essential to ensure the success of these initiatives. Developing countries face unique challenges in fostering patenting activity and building innovation systems. Ndicu, Ngui, and Barasa (2024) highlight the difficulties African nations encounter in generating patents due to limited resources, weak institutions, and a lack of supportive policies. Their findings align with those of Radosevic (2022), who emphasizes the need for tailored policy interventions to enable technological catch-up in Eastern Europe and the former Soviet Union. Developing regions often lag in global innovation systems, which limits their economic growth potential. Enhancing patenting capabilities in these regions requires a focus on knowledge absorption, local capacity-building, and international collaboration. By addressing these challenges, developing countries can bridge global innovation gaps and foster inclusive regional development. Sectoral innovation and sustainability are increasingly critical in shaping regional development. Gutiérrez et al. (2021) emphasize how sectoral disparities in patenting arise from differences in institutional support, market dynamics, and resource availability. Environmental technologies are particularly noteworthy, as Montenegro et al. (2021) demonstrate their potential to align regional innovation systems with global sustainability goals. By prioritizing patents in high-impact sectors like green technologies, regions can simultaneously enhance their innovation capacity and contribute to addressing global challenges. These findings underscore the need for governments to invest in sustainable sectors, ensuring that innovation systems drive both economic and environmental progress (Table 2).
2.3. University and Knowledge Networks in Innovation Systems
The collection of studies presented offers a rich perspective on the intersection of patenting activities and regional innovation systems, exploring their transformative effects across different contexts, regions, and technological domains. These works delve into a variety of themes, from the role of universities as hubs of innovation to the dynamics of knowledge integration through co-patenting, the influence of clusters and industrial structures, and the emerging challenges and opportunities presented by open innovation and technological convergence. One prominent theme in this body of research is the role of university patenting in fostering regional technological specialization and innovation. Caviggioli et al. (2023) emphasize the importance of university-driven patents in enhancing the technological specialization of European regions. Their findings suggest that academic institutions serve as critical nodes of localized knowledge generation, enabling specific regions to carve out competitive advantages in niche technological areas. Ar et al. (2021) extend this discussion by focusing on the enabling conditions that allow entrepreneurial universities in emerging economies to contribute to patenting activities. These conditions often include institutional support, infrastructure, and policy mechanisms that foster an entrepreneurial culture within academia. Similarly, Meetei et al. (2024) examine the role of universities in innovation systems in developing countries, shedding light on the unique challenges these institutions face, such as limited resources, inadequate research funding, and insufficient policy alignment. Together, these studies underscore the vital role of universities in regional innovation systems while also highlighting the structural barriers that hinder their full potential, especially in less developed contexts. Another significant area of exploration is the concept of co-patenting as a mechanism for knowledge integration and technological differentiation. Ervits (2024) provides a focused analysis of Siemens’ co-patenting strategies, illustrating how large corporations leverage collaborative intellectual property practices to diversify their technological portfolios. This approach allows firms to tap into external knowledge pools while simultaneously strengthening their internal innovation capabilities. Tahmooresnejad and Turkina (2023) introduce a novel angle by examining the gender dynamics within co-inventor networks, revealing that diversity in collaborative networks positively impacts regional innovation outputs. This study contributes to an emerging discourse on the intersectionality of innovation systems, emphasizing the value of inclusivity in fostering technological progress. However, while these studies illuminate the benefits of co-patenting, they leave certain gaps, particularly in exploring the organizational and cultural challenges that can hinder effective collaboration across institutional and national boundaries.
The dynamics of regional innovation systems are also explored through the lens of clusters and localized networks. Christopoulos and Wintjes (2024) conceptualize clusters as local innovation systems, emphasizing their role as focal points for shared resources, collaborative partnerships, and knowledge spillovers. Their analysis situates clusters as essential mechanisms for fostering innovation within specific geographic areas. Innocenti et al. (2020) offer a detailed examination of knowledge networks and industrial structures in Italy, illustrating how patent collaborations shape regional economic landscapes and influence industrial specialization. Meanwhile, Wong and Lee (2022) analyze the evolution of peripheral innovation systems in East Asia, focusing on the transformative role played by core firms like Samsung and TSMC in upgrading these systems. These studies collectively highlight the critical role of localized innovation ecosystems in driving regional competitiveness. However, they also raise important questions about potential drawbacks, such as the risk of cluster lock-in, where over-reliance on established networks stifles broader innovation, and the concentration of power among dominant firms that can marginalize smaller actors.
The measurement and redefinition of innovation system efficiency emerge as another important area of focus. Jovanović et al. (2022) introduce a Triple Helix-based efficiency index that evaluates the interplay between universities, industries, and governments within innovation systems. Their framework provides a valuable tool for assessing how well these key stakeholders collaborate to generate innovative outcomes. Forner and Ozcan (2023) take a more technological approach, utilizing deep neural networks and natural language processing to analyze the overlapping boundaries of innovation systems. Their work offers fresh insights into the interconnectedness of innovation systems and the ways in which advanced computational methods can enhance our understanding of these dynamics. Stojčić (2021) complements these perspectives by examining collaborative innovation in Central and Eastern Europe, highlighting how regional specificities shape the effectiveness of innovation systems. While these studies contribute valuable methodological advancements, they often sideline qualitative factors such as the historical and cultural dimensions that also play a significant role in shaping innovation systems.
Emerging technologies and open innovation models represent a growing area of interest within the discourse on regional innovation. Manuylenko et al. (2022) explore the generation and assessment of intellectual and informational capital as foundational elements for digital innovation within open systems. Their findings highlight the increasing interdependence between corporations and external innovation actors, particularly in the context of digital transformation. Wong, Sheu, and Lee (2023) examine the dynamics of satellite platform regions such as Singapore, emphasizing how strategic positioning and policy frameworks enable these regions to maintain competitive advantages in global innovation networks. These studies underscore the transformative potential of open innovation and emerging technologies in reshaping traditional innovation paradigms. However, they also suggest that grassroots and community-driven innovation models may be overlooked in favor of top-down corporate and institutional approaches. Across these diverse studies, several key observations emerge regarding the interplay between patenting activities and regional innovation systems. First, the concept of localized knowledge spillovers is a recurring theme, with patents often serving as anchors for innovation within specific regions. This reinforces the idea that innovation systems are inherently territorial, shaped by local networks, resources, and institutional frameworks. Second, the diversity of innovation models, ranging from university-driven patenting to cluster-based ecosystems and Triple Helix collaborations, underscores the contextual nature of innovation. What works in one region or sector may not necessarily translate to another, highlighting the importance of tailoring innovation policies to regional specificities. Third, the studies collectively point to a range of barriers to innovation, including socioeconomic disparities, gender imbalances, and institutional inefficiencies. These barriers often limit the potential of innovation systems, particularly in developing and transition economies. Finally, the convergence of emerging technologies and open innovation models is dissolving traditional boundaries between regions and sectors, creating new opportunities for collaboration and knowledge exchange. Despite these advancements, several gaps and areas for future research remain.
One area that warrants further exploration is the role of intersectionality within innovation systems, particularly how factors such as gender, ethnicity, and socioeconomic status influence the dynamics of collaboration and knowledge generation. The intersectional lens introduced by Tahmooresnejad and Turkina (2023) offers a promising starting point, but more empirical studies are needed to deepen our understanding of these dynamics. Additionally, the role of artificial intelligence in reshaping patenting and innovation landscapes represents an emerging frontier. Forner and Ozcan’s (2023) application of deep learning techniques demonstrates the potential of AI to enhance our analytical capabilities, but its broader implications for IP management and policy remain underexplored. Another critical area is the perspective of the Global South, where innovation systems often operate under vastly different conditions compared to developed regions. Meetei et al. (2024) highlight some of these challenges, but more empirical data and case studies from underrepresented regions are necessary to provide a more holistic understanding of global innovation systems (Table 3).
2.4. Innovation and Patents
The role of patents in cumulative knowledge production is examined by Cefis, Grassano, and Tubiana (2024), who focus on the largest R&D investors globally. Their study underscores the dual role of patents in innovation ecosystems: while they formalize and protect intellectual property, they also risk creating knowledge silos where firms strategically use patents to block competitors rather than encourage innovation. This behavior can limit the cumulative benefits of collective knowledge and reduce the openness of innovation systems. Nevertheless, the study demonstrates how effective use of patents can enhance knowledge sharing within firms and drive global innovation dynamics, provided the balance between competition and collaboration is carefully managed. Spatial and sectoral dimensions of patenting receive significant attention in the works of Kitaisky et al. (2021) and Kryukov and Tokarev (2022). Kitaisky and colleagues investigate the preferences of Russian innovation enterprises for foreign patenting, revealing that many firms prioritize securing intellectual property protection in international markets to strengthen their global competitiveness. While this strategy underscores the importance of patents in global value chains, it also reflects the limitations of domestic innovation systems, which struggle to retain and capitalize on technological advances. Kryukov and Tokarev analyze patenting trends in the Russian oil and gas sector, focusing on innovation in geographically challenging regions such as Siberia and the Arctic. Their findings highlight how patenting in resource-intensive industries often addresses region-specific challenges, such as extreme environmental conditions, demonstrating the interplay between industrial context and geographic location in shaping patenting activities. Together, these studies reveal how spatial and sectoral dynamics influence both the distribution and efficacy of patenting efforts, offering valuable insights for regional innovation policies. The importance of institutional and professional support in the patenting process is discussed in detail by Klincewicz and Szumiał (2022), who highlight the critical role of patent attorneys. Their findings emphasize that successful patenting involves more than just technological innovation; it also depends on the expertise of professionals who navigate the complex legal and administrative processes of intellectual property protection. Patent attorneys serve as essential intermediaries, ensuring that inventions are adequately protected and legally enforceable. This perspective sheds light on the often-overlooked human infrastructure that supports innovation systems. Zhao and Tan (2021) expand on this theme by exploring how informal institutions, such as cultural norms and social trust, influence the effectiveness of patenting in emerging economies. In regions with weak formal institutions, informal mechanisms often play a crucial role in filling governance gaps, shaping how patents are utilized and enforced. Together, these studies highlight the need to align patenting policies with local institutional contexts and to invest in capacity-building for legal and administrative support structures. Green technologies and circular innovations represent another significant area of focus, with several studies examining how patenting contributes to environmental sustainability. Maasoumi, Heshmati, and Lee (2021) explore the role of patents in fostering renewable energy technologies, demonstrating how intellectual property rights incentivize investment in sustainable innovations. By protecting technological advancements in green energy, patents facilitate the diffusion of renewable technologies, aligning innovation systems with global efforts to combat climate change. Sanni and Kim (2024) extend this discussion to Africa, where they investigate open green technologies and patenting activities. Their findings reveal how African inventors increasingly use patenting to address local environmental challenges, often adopting open innovation models to promote knowledge sharing and inclusivity. Portillo-Tarragona, Scarpellini, and Marín-Vinuesa (2024) introduce the concept of "circular patents," arguing that patents in the circular economy not only protect innovations but also drive dynamic capabilities that enable firms to adapt to sustainable practices. These studies collectively highlight how patenting activities can be aligned with environmental and economic goals, emphasizing the transformative potential of intellectual property in fostering a sustainable future.
The diffusion of emerging technologies and their impact on regional development are explored in studies such as Yuan and Li (2021) and Stek (2021). Yuan and Li examine the diffusion of battery electric vehicle technologies through patent analysis, mapping the global pathways of innovation in this critical sector. Their findings demonstrate how patents serve as mechanisms for technology transfer, facilitating the spread of innovations across national and regional boundaries. This perspective underscores the interconnected nature of global innovation systems and the role of intellectual property in driving technological convergence. Stek focuses on spatial technology clusters, using patent concentration data to identify localized hubs of innovation. These clusters, which often emerge around key technological fields, serve as engines of regional competitiveness by fostering collaboration and knowledge spillovers. However, they also raise concerns about uneven development and the concentration of resources in specific regions, suggesting a need for more inclusive innovation policies.
The socioeconomic impact of patenting is addressed by Önder, Schweitzer, and Tcaci (2024), who investigate the relationship between patenting and labor market outcomes. Their study reveals that regions with high levels of patenting activity often experience positive employment effects, particularly in high-skill sectors. This finding aligns with the broader narrative that innovation drives economic growth and regional development. However, the distribution of these benefits is not always equitable, as the advantages of patenting tend to be concentrated in regions with robust institutional frameworks and advanced technological ecosystems. This raises questions about how innovation policies can be designed to ensure that the benefits of patenting are shared more widely across regions and populations. Several overarching themes emerge from these studies. First, while patents are widely regarded as critical indicators of innovation, their effectiveness in driving commercialization and broader economic benefits varies significantly across contexts. Alnafrah’s exploration of innovation roadblocks highlights the persistent challenges in translating patents into marketable products, emphasizing the need for stronger linkages between patenting activities and commercialization ecosystems. Second, the spatial and sectoral dimensions of patenting reveal the importance of geographic and industrial contexts in shaping the dynamics of innovation systems. Studies such as those by Kryukov and Tokarev and Stek demonstrate how localized patenting activities create hubs of innovation, while Kitaisky et al. highlight the strategic use of patents in global markets. These insights suggest that innovation policies must be tailored to the unique characteristics of regions and sectors. Third, the alignment of patenting with sustainability goals represents a growing trend in innovation systems. Green and circular innovations, as explored by Maasoumi et al., Sanni and Kim, and Portillo-Tarragona et al., illustrate how patents can be leveraged to address pressing environmental challenges while also driving economic transformation. This underscores the potential for intellectual property systems to contribute to global sustainability efforts. Finally, the role of institutional and professional support structures is critical to the success of patenting activities. Studies by Klincewicz and Szumiał and Zhao and Tan highlight the importance of aligning patenting processes with local institutional realities and investing in the human infrastructure that supports innovation systems (Table 4).
2.5. Emerging Trends and Technologies in Innovation
Ashari, Blind, and Koch (2023) explore the role of patents alongside publications and standards in the hydrogen technological innovation system (TIS), demonstrating their critical role in protecting and disseminating hydrogen-related innovations. The study emphasizes how patents complement other knowledge transfer mechanisms but may inadvertently slow open collaboration, a significant challenge for nascent fields like hydrogen technologies. Ashari, Oh, and Koch (2024) extend this exploration by comparing the hydrogen economies of Germany and South Korea, highlighting how patents reflect the divergent pathways these countries are taking toward hydrogen-based economies. Germany emphasizes renewable energy integration, while South Korea focuses on industrial applications, illustrating how regional priorities shape patenting activities and innovation trajectories.
This multidimensional analysis underlines the need to coordinate patenting strategies with national innovation policies in order to support the systemic transition to sustainability. Scherngell, Schwegmann and Zahradnik (2023) analyze the global dynamics of R&D collaboration in robotics through co-patenting activities. Their study identifies urban areas as hubs for robotics innovation where co-patenting facilitates knowledge exchange between regions. Spatial clustering of innovation improves regional competitiveness, but also risks exacerbating global inequalities as less developed regions struggle to integrate into these networks. Co-patenting promotes the global exchange of knowledge, but problems such as the fragmentation of intellectual property rights (IPR) and unequal participation pose a challenge. Policies that address these dynamics are critical to ensure that co-patenting benefits innovation systems without exacerbating inequalities. Sanni and Kim (2024) focus on green technologies in Africa and analyze the openness of African inventors in patenting activities. Open innovation models prove to be valuable tools for promoting inclusion and overcoming structural barriers such as high patenting costs, weak institutional support and limited infrastructure. By promoting collaboration and access, African inventors can use patents to engage more effectively in global innovation networks while addressing local environmental challenges. The study highlights the need to tailor patenting mechanisms and innovation policies to local circumstances to maximize impact. Wirkierman, Ciarli and Savona (2023) propose a taxonomy of European innovation clubs that reveals significant differences in patenting capabilities between regions. Leading regions concentrate resources and capabilities and benefit from patents as indicators of innovation performance, while lagging regions risk being marginalized. This polarization requires policies that promote cooperation between leading and lagging regions to reduce inequalities. Patents are crucial for competitive advantage in advanced regions, but regional innovation systems require a more equitable distribution of resources and opportunities for knowledge exchange. Zhou et al. (2024) analyze how the digital economy affects innovation performance and show that advances such as artificial intelligence and big data significantly increase patent activity. The spillover effects of digital innovation promote broader sectoral growth, but regional inequalities in access to digital technologies risk uneven development. Inclusive digital transformation strategies are essential to enable the participation of less technologically advanced regions. Yuan and Li (2021) focus on the diffusion of battery electric vehicle (BEV) technologies using patent data and mapping global innovation pathways. Their findings show how patents serve as important tools for technology transfer and enable the diffusion of BEV innovations across national and regional boundaries. The study illustrates the leading role of countries such as China and the United States in BEV patenting, where dominance over key patents shapes the global innovation landscape. This leadership accelerates adoption, but also risks creating a technological lock-in that limits opportunities for smaller players and less developed regions. Several recurring themes emerge in the studies regarding the relationship between patenting and regional innovation systems. First, patents are consistently emphasized as indicators and drivers of innovation, whether in emerging sectors such as hydrogen technology, mature sectors such as robotics, or transformative sectors such as the digital economy. However, patents are not without limitations. They can create barriers to collaboration, concentrate innovation resources in certain regions and exacerbate inequalities in innovation systems. Policies need to strike a balance between protection and openness to promote inclusive and equitable innovation. Second, spatial and sectoral dynamics reveal the importance of geographic and industrial context in shaping innovation outcomes. Studies such as those by Scherngell et al. and Wirkierman et al. highlight the clustering of patents in regions with strong institutional and technological capabilities, which increases regional competitiveness. However, these clusters often leave regions with weaker innovation systems behind. Thirdly, sustainability is an important issue. Studies on green technologies and circular innovation systems show how patents are aligned with broader environmental goals. In contexts such as Africa, open innovation models show the potential of patents for inclusive sustainability. Ensuring the accessibility of sustainability-oriented patents remains a major challenge, especially in underrepresented regions. Finally, the transformative role of digital innovation is evident in all studies, where advances in the digital economy are driving patent activity and innovation output. The integration of digital technologies with open collaboration networks offers opportunities for global knowledge sharing while eliminating regional inequalities (Table 5).
3. Data and Methodologies
In order to analyze the determinants of patenting we have chosen a series of variables from the ISTAT-BES section dedicated to the topic and called "Innovation, research and creativity". The ISTAT-BES database is in fact divided into sub-categories. In the case in question, attention was oriented to capture the dynamics of innovation and research present within the same database through the use of the variables indicated in the following Table 6.
Since the Italian regions are characterized by the presence of significant heterogeneity and above all by the existence of a significant economic-social and technological gap between the regions of the South and the regions of the North, it was then necessary to refer to clustering techniques to verify the distribution of the 20 Italian regions around average values. To optimize the task of choosing the optimal number of clusters, we compared 6 different machine learning algorithms for clustering evaluated on the basis of 10 statistical indicators. The algorithms used are indicated in the following Table 7.
The algorithms were analyzed through the application of an ordering rule aimed at maximizing the statistical content of the indicators analyzed as output of the machine learning analysis. The application of this sorting rule allowed us to choose the most performing machine learning algorithm to be used for the in-depth analysis of clustering.
Subsequently, to analyze the relationships between the variables we used two panel data models i.e. panel data with fixed effects and panel data with random effects. The main characteristics of the models are identified in the following Table 8.
4. Clustering Results and Introduction of the Sorting Rule
In the following analysis we compared 6 machine learning algorithms applied to clustering namely: Density Based, Fuzzy C-Means, Hierarchical, Model Based, K-Means, Random Forest. (see Drago et al. 2024, Petrosillo et al. 2024, Drago et al. 2025 for a different approach see Errichiello & Drago 2024)
To analyze the data we realized the average of the value of the variables PTP, RI, IPS, CCE, MIG, RIU, MEOSF. The data related to the results obtained are presented in the following Table 9.
However, in order to make a comparison between the statistical indicators identified through the analysis, we applied data normalization before submitting them to a rule for defining the most efficient machine learning algorithm through the integrated analysis of the results.
Having normalized the data, we identify the rule for creating an ordering among the various machine learning algorithms used for the selection of the most efficient algorithm based on the statistical indicators. The selection and ranking rule also identifies the algorithms to maximize, those to minimize and those to consider through a statistical relationship. The ordering rule is first exposed from the ideal-conceptual point of view as follows, where S(A) is the role for sorting algorithms and (A) is the algorithm:
The same rule is then analysed from a more analytical point of view by reporting the formulas relating to the statistical indicators used as follows:
Where: is a single data point in the dataset, is the centroid of the cluster k, is the centroid of cluster j, is the overall mean of the entire dataset, is the set of data points belonging to cluster k, K is the total number of clusters, N is the total number of data points in the dataset, L is the likelihood that is used in AIC and BIC, k is the number of parameters in the model that are used in AIC and BIC; is the probability of a data point belonging to cluster used in entropy.
The determination of the weights within the equations is shown in the following Table 11:
Based on the application developed, it turns out that the most efficient algorithm for clustering is K-Means Clustering as showed in the following Figure 1.
Therefore, applying the k-Means algorithm, the following clusters have been identified:
- Cluster 1: Piedmont, Liguria, Lombardy, Trentino-Alto Adige, Veneto, Friuli-Venezia Giulia, Emilia Romagna, Tuscany, Umbria, Marche, Lazio. The regions in cluster C1, such as Piemonte, Lombardia, Emilia Romagna, and Veneto, show high values for PTP combined with homogenous performance with regard to variables such as RI, IPS, and regular internet users. These are regions characterized by highly industrialized economies and a framework for research and development which is quite robust. An example could be Emilia Romagna, where it is observed that the PTP is the highest. In fact, this region shows first place in Innovation of the Production System and Cultural and Creative Employment. In particular, infrastructure, highly educated labor force of the region, enterprise-oriented attitude to innovation, and important role of RIU as the indicator of populations' digitalization in clustering these types of regions denote that highly connected and digitally skilled people facilitate the propensity of patent filing.
- Cluster 2: Valle d'Aosta, Abruzzo, Molise, Campania, Puglia, Basilicata, Calabria, Sicily, Sardinia. This cluster has a much lower value of PTP in respect to C1. This probably links to low Research Intensity and Innovation of the Production System. The latter are determined by infrastructural deficiencies and lower graduate mobility, which is important for knowledge and skills mobility. The southern regions and islands are characterized by a marked digital gap, as testified by low RIU values and limited diffusion of MEOSF. All this reduces access to technological resources and administrative efficiency and, in turn, decreases propensity to patent.
A representation of the clusters is shown in Figure 2.
Specifically, the average value of the PTP value of the regions of cluster 1 is equal to 87.02 while the average value of the PTP of cluster 2 is 15.66. It therefore follows that C1>C2. An analysis of the values that key variables assume shows clearly that regions belonging to cluster C1 enjoy several structural and cultural factors favourable to high PTP, while for cluster C2, large systemic deficiencies have crystalized in low values for both RI and IPS, added to a symptomatic out-migration of young graduates to more dynamic regions. The digital element appears relevant for distinguishing between the two clusters described here by the variables RIU and MEOSF. This underlines that technological innovation and digitalization are supportive of PTP but work as accelerators of regional competitiveness at the same time. The clustering of regions strongly depends on the interaction between the analyzed variables. A targeted improvement in the regions in cluster C2 regarding PTP would have to be focused intervention in RI, IPS, and digitalization in such a way that an innovative ecosystem is created which then can ignite patenting activity. On the contrary, regions in cluster C1 should continue investing in infrastructure and research in order to maintain their leadership. For this reason, PTP is not only an indicator of innovation but also a reflection of regional structural disparities within Italy.
5. The Econometric Model for the Estimation of Propensity to Patenting
Below we present a model for estimating the propensity to patent in Italian regions. The data is analysed with the following models: Panel Data with Fixed Effects, Panel Data with Random Effects. Specifically, we estimated the following equation:
With i=20 and t=2004-2022 (Table 12).
There is a positive relationship between the PTP value and the following variables:
RI: The relation found between PTP and the RI is positive, which is justified and driven by the investments in research and development. Those firms which have invested intensively in R&D generate abundant new technical knowledge that enables them to create patentable inventions. Patents protect the inventions and give exclusive ownership rights, increasing the techno-economic value of the inventions to the owners. This is a self-reinforcing relationship: R&D gives rise to innovations, which are patented; patents generate financial and strategic advantages that can be reinvested in R&D. Patents signal to the markets and investors the technological leadership and competitive potential of firms. Firms with a strong portfolio of patents are usually considered to be the most innovative; hence, they attract much better opportunities for investment; thus, creating entry barriers. Industries that are typically intensive in their research and development tend to make heavier use of patents, including high-technology products such as pharmaceuticals, bio-technology, information technology, etc. Other industries are simply less R&D-intensive; for some other forms of protection may generally be preferred, such as trade secrets. While these strong linkages between PTP and RI are pretty straightforward, not all pending or granted patents bear equivalent economic or technological value; instead the level of importance differs. The true quality of R&D depends on the quality, not the number of patent applications. Finally, all that would suggest a positive association of patenting propensity and research intensity only justifies relevance in investing on R &D to drive appropriate innovation, securing intellectual property, and hence facilitating firms' competitive long-term growth (Hazarika, 2021; Dong et al., 2020; Ghazal et al., 2024).
MEOSFF: the positive relationship between PTP and MEOSFF shows the meeting of technological innovation and public service. Municipalities in providing fully digitalized family services show advanced development in the digitalization of the public sector and are able to show and build a general attitude toward innovation. Such digital transformation would, by default, come with robust technological infrastructure supportive of new technologies' creation and adoption, including patentable inventions. Digitalized public services signal a local culture open to innovation. This would attract investment in research and development by enterprises and individuals. The propensity to patent would increase. Efficiency and accessibility offered through online services save valuable time and resources that may be reinvested in the creation of new technology. Moreover, the municipalities creating these services themselves also often collaborate with private sector entities, including startups and technology companies, in the design and implementation of solutions. This provides further opportunities for transfer of technologies and the commercialization of inventions, hence boosting patenting activity. These regions that commit to digital transformation and innovative public services become appealing to business and talent oriented towards research and innovation. In their turn, these create a virtuous circle, stimulating the development of technology and greater efforts in patenting. In such a dynamic, there is underlined the issue that the public sector can also support an environment conducive to innovation and creation of intellectual property (Nguyen and Nguyen, 2024; Burhan et al., 2017; Crespi and Guarascio, 2019).
There is a negative relationship between the PTP value and the following variables:
IPS: This negative relationship of PTP in this case, as a proxy for innovation with innovation within the production system, calls into serious question any assumption of reflection within significant innovations due to a high number of patents. It is the contexts where patenting can increase, therefore serving as a sign of less radical innovations. More precisely, these are innovations of an incremental character that have been made against the background of existing products or processes-a type of variation that could introduce truly disruptive variations into the production systems, hence are hardly patentable, or the recognition comes far later. Strong proclivity to patent creates obstacles in entry for the potential entrants, most of whom would be startups or at best SMEs bound to catalyse disruption. The large patent portfolios held by dominant companies would, in turn, drive down the competition since driving down the innovation drives it. In addition, innovations of real importance give way to maintaining the status quo. The general quality and importance of innovations further weaken as low-value patents shift attention from quality to quantity. In many cases, the paradigm of full openness-free-the knowledge exchange, such as open-source software or academic-industry collaborative research-a faster route to innovation in certain ecosystems is provided compared with the strict protection of intellectual property. In such situations, over-emphasis on patenting may actually hinder the speed of innovation because it restricts access to technologies and limits opportunities for collaboration. Besides, since many fundamental innovations concern methods of production or business models that do not fit within the domain of patentability, decoupling of patenting activity from true drivers of progress in the production system seems to be even greater. This dynamic underlines the necessity to reconsider the intellectual property politics according to a balanced approach going for placing meaningful innovations before patent volumes, thus supporting different pathways to innovation and stimulating competition, but above all, collaboration to raise economic dynamism (Zhao et al., 2023; Im et al., 2015; Al-Khatib and Al-ghanem, 2022).
CCE: the opposite sign for PTP relative to CCE indeed implies some more fundamental differences related to innovation and intellectual property approach. Patents most usually apply to technologically intensive sectors like pharmaceuticals or electronics, whereby innovation can be well-defined and protectable. In contrast, creative and cultural industries are those where the outcome of art, fashion, design, and music results in subjective and expressive forms of innovation that might be protected more effectively under copyright or other forms of protection of intellectual property rather than via patenting. The generation of innovation in creative cultural industries depends on collaboration and, therefore requires openness in the sharing of ideas. Often the trends in fashion or lifestyle evolve at an enormous speed, and accordingly, the costly and lengthy patent process tends to become irrelevant. Many of the cultural and creative products are short-life-cycle in nature and linked with fickle tastes, and in this context, their invention could be appropriately safeguarded only during that very period, which does not require any sort of protection beyond. Other areas in which the sources of finance differ between the creative and technological industries include the following: while in technological fields, R&D incentives, policies that strongly favor patenting have taken the front seat; however creative industries receive major funding from the public funding sources, patronage, and their own resources. Most jobs within the cultural and creative sectors are related to social, cultural, and educational value rather than pure financial return; thus, the incentive to patent would be weakened. Such dynamics underpin the different business models, mechanisms of innovation, and socio-economic objectives of both sectors and thus explain the lower propensity to patent cultural and creative industries, though these are highly innovative and creative (Nuccio and Bertacchini, 2023; Cheng et al., 2022; Han, 2017).
MIG: PTP-MIG inverse relationship: In that respect, it is important to look from another angle of view, taking the interaction of the two factors: PTP and MIG, in economic and social settings. With some instances in the regimes having very high propensities to patent, for instance, the limitation of the mobility of the skilled workers including the graduates to be able to avoid lost secret and technical expertise of the trade. It may discourage motive or ability to relocate graduate movements. Where there is strong patenting policy and incentives highly effective to secure talent and elicit innovation, these provide, in turn, a less dynamic context concerning worker mobility; perhaps feeling that there is little in the way of either personal or professional development outwith the given context. This might be taken to argue for a more closed model of innovation-one where knowledge is more properly protected and disseminated less. This could be restrictive to the scope of learning and development which graduates might seek in a more liberal and vibrant atmosphere. In essence, lower graduate mobility leads to lesser diversity of ideas flow within higher learning institutions and corporations, hence stifling innovation and creativity. In fact, the interrelationship between the two factors would be very contextual to the nature and setting of the industrial sector, the government and its policies, labor market conditions, and corporate culture (Braunerhjelm et al., 2020; Ganguly, 2024; Rahko, 2017).
RIU: the negative relationship that will, therefore, arise out of propensity to patent with regularly using the internet will give a signal that the rampant use of the internet may trigger off a decline in the tendency and motivation to patent anything that is an idea for an invention or a procedure. While access to unprecedented amounts of information and inputs are advantages which an enthusiast browsing the internet on a regular basis stand to acquire, the very same factor reduces novelty attributes and lowers perceived needs about patenting. The internet creates an environment of collaboration and sharing of ideas often on open-source models or the free dissemination of knowledge over restrictive intellectual property protection, hence lowering the propensity to patent even further. The fast pace of the digital environment challenges the relevance of patents as well. Long and costly processes of patenting may not be worth it or practical when technologies are fast becoming obsolete. Generally, internet users and digital creators prefer more agile and less resource-intensive methods of sharing or protecting their innovations. While this may bring openness and a quicker pace for innovation-especially for startups and high-tech firms-this can also hamper the protection of innovations toward the achievement of sustainable competitive advantage. This dynamic reflects a shift in values concerning knowledge and protection of innovation in the digital era, favoring collaboration over exclusivity and speed (Fang and Li, 2024; Mazlumi and Kermani, 2022; Paunov and Rollo, 2016).
6. Policy Implications
This could also point to the political influence in the possibility of patenting that develops for the Italian regions through the complex balance of territorial, economic and political dynamics that influence innovation and protection through the filing of patents. In fact, the propensity to patent has a complex relationship with technological innovation, investment in research and development, pro-innovation policies of local and national institutions and collaboration between universities, research centers and industry. It should be emphasized that policies to promote innovation and patenting can vary greatly in different Italian regions, reflecting priorities and different economic strategies. Richer regions may have more resources to invest in research and development and may even support patent applications. This would mean that the subtle policy strategy, taking into account the results, should strike a balance between safeguarding national growth and at the same time encouraging investment in R&D in all regions, including the less developed regions. If there is a greater propensity for patents in a region, economic development in that region can generally be observed, as there is usually a strong, mostly one-way relationship between innovation and economic growth. However, this is the policy challenge for decision-making today: each region needs to develop policy opportunities for innovation everywhere and use innovation wherever it is available. Innovation - and therefore patenting - depends heavily on human resources. There are large local-regional differences in access and quality of education - along with vocational training - in terms of the contribution and gain of a localized population from the innovation expressed in an area (Innocenti et al., 2020; Matricano, 2020; Di Comite et al., 2018).
Consequently, such investments at the policy level must focus on education, skills upgrading and training programs tailored to the satisfaction of the target industries or sectors. However, this depends on the ability of companies, especially small and medium-sized ones, to collaborate with research institutions. With this in mind, policy efforts to encourage such collaboration in the form of funding, tax incentives and networking opportunities could well kick-start innovation in different regions, helping to bridge the gap between them in terms of innovative capacity. Effective protection of intellectual property rights thus becomes a prerequisite for the promotion of patent applications. At a policy level, this means that existing laws need to be implemented, but perhaps also that new laws need to be enacted to keep pace with increasing technological developments so that inventors can continue to protect their investments in research and development. In addition, a region's propensity to patent has an impact on its international competitiveness. From a policy perspective, this would mean that strategies not only support national innovation, but also enable the creation of better Italian innovation abroad and put Italy in a leading position in these so-called specific technological sectors. All too often, today's inclination towards patent issues clashes with the requirements of sustainability and social justice. From these points of view, for example, an environmentally friendly patent policy would promote sustainable innovation that is compatible with environmental objectives; and it is to be hoped that social challenges in patent policy would serve society in these interests. The patent propensity of Italian regions has developed a complex trajectory that is deeply embedded in a wide range of political, economic and social considerations. It considers some of the implications for an integrated approach that combines supportive policies in the areas of innovation, education and intellectual property protection with international competitiveness, taking full account of sustainability and social justice. In this way, Italy can take advantage of diversified regions through comprehensive strategies for balanced, inclusive and innovation-driven economic growth (D’Adamo et al., 2024; Ottone and Barbieri, 2022; Lepore et al., 2021).
7. Conclusions
The willingness to patent increased in the Italian regions between 2004 and 2019. Political measures to increase the propensity to patent can have a significant impact on the economic development and innovation of a region or country. An increase in public funding for R&D can stimulate basic and applied research, leading to more patentable inventions. R&D tax credits can encourage companies to invest in new research projects. Measures to support small and medium-sized enterprises and innovative start-ups can encourage the creation of new patents. Collaboration between universities, research centers and industry can accelerate technology transfer and commercialization of inventions. Promote science, technology, engineering and math (STEM) education to develop the skills needed for innovation. A well-defined and functioning intellectual property system is important to protect patents and incentivize innovation. Simplifying the patenting process and reducing the associated costs can encourage more individuals and companies to patent their inventions. Creating industry clusters where companies, research institutions and universities work together can encourage innovation. Support networks between companies to share knowledge and resources and create synergies that can lead to innovation. Provide access to venture capital to fund innovation and commercialization of inventions. Regulations that keep markets open and competitive can encourage companies to innovate in order to maintain or increase their market share. Policies that are specifically tailored to regional needs, as the drivers of innovation can vary greatly from one region to another. Continue to monitor and evaluate the effectiveness of policies in order to make timely adjustments and improvements. Actively listen to feedback from innovators to understand the practical barriers to innovation and patenting. Work with other nations to promote the exchange of knowledge and technologies. Policies to promote patenting propensity in Italian regions should be integrated into a broader economic development strategy that takes into account local specificities and is sustainable in the long term.
References
- Abdulhameed, T.Z.; Yousif, S.A.; Samawi, V.W.; Al-Shaikhli, H.I. SS-DBSCAN: Semi-Supervised Density-Based Spatial Clustering of Applications with Noise for Meaningful Clustering in Diverse Density Data. IEEE Access 2024. [Google Scholar] [CrossRef]
- Aguiar-Hernandez, C.; Breetz, H.L. The adverse effects of political instability on innovation systems: The case of Mexico's wind and solar sector. Technovation 2024, 136, 103083. [Google Scholar] [CrossRef]
- Ali, M.A. Modeling regional innovation in Egyptian governorates: Regional knowledge production function approach. Regional Science Policy & Practice 2024, 16, 12450. [Google Scholar]
- Al-Khatib, A.W.; Al-ghanem, E.M. Radical innovation, incremental innovation, and competitive advantage, the moderating role of technological intensity: evidence from the manufacturing sector in Jordan. European Business Review 2022, 34, 344–369. [Google Scholar] [CrossRef]
- Alnafrah, I. Identifying innovation roadblocks: unveiling knowledge and innovation patterns that hinder commercialisation. Technology Analysis & Strategic Management 2024, 1–21. [Google Scholar]
- Anouze, A.L.; Al Khalifa, M.M.; Al-Jayyousi, O.R. Reevaluating national innovation systems: An index based on dynamic-network data envelopment analysis. Socio-Economic Planning Sciences 2024, 95, 102003. [Google Scholar] [CrossRef]
- Ar, I.M.; Temel, S.; Dabic, M.; Howells, J.; Mert, A.; Yesilay, R.B. The role of supporting factors on patenting activities in emerging entrepreneurial universities. IEEE transactions on engineering management 2021, 70, 2293–2304. [Google Scholar] [CrossRef]
- Ashari, P.A.; Blind, K.; Koch, C. Knowledge and technology transfer via publications, patents, standards: Exploring the hydrogen technological innovation system. Technological Forecasting and Social Change 2023, 187, 122201. [Google Scholar] [CrossRef]
- Ashari, P.A.; Oh, H.; Koch, C. Pathways to the hydrogen economy: A multidimensional analysis of the technological innovation systems of Germany and South Korea. international journal of hydrogen energy 2024, 49, 405–421. [Google Scholar] [CrossRef]
- Barra, C.; Ruggiero, N. How do dimensions of institutional quality improve Italian regional innovation system efficiency? The Knowledge production function using SFA. Journal of Evolutionary Economics 2022, 32, 591–642. [Google Scholar]
- Bechini, A.; Marcelloni, F.; Renda, A. TSF-DBSCAN: A novel fuzzy density-based approach for clustering unbounded data streams. IEEE Transactions on Fuzzy Systems 2020, 30, 623–637. [Google Scholar] [CrossRef]
- Berman, A.; Marino, A.; Mudambi, R. The global connectivity of regional innovation systems in Italy: A core–periphery perspective. Regional Studies 2020, 54, 677–691. [Google Scholar] [CrossRef]
- Bharill, N.; Patel, O.P.; Tiwari, A.; Mu, L.; Li, D.L.; Mohanty, M.; Prasad, M. A generalized enhanced quantum fuzzy approach for efficient data clustering. IEEE Access 2019, 7, 50347–50361. [Google Scholar] [CrossRef]
- Bianchi, C.; Galaso, P.; Palomeque, S. The tradeoffs of brokerage in innovation networks: a study of Latin American cities. Serie Documentos de Trabajo; 21/21. 2021.
- Binz, C.; Truffer, B. The governance of global innovation systems: Putting knowledge in context. Knowledge for governance 2020, 397–414. [Google Scholar]
- Block, J.; Fisch, C.; Ikeuchi, K.; Kato, M. Trademarks as an indicator of regional innovation: evidence from Japanese prefectures. Regional Studies 2022, 56, 190–209. [Google Scholar] [CrossRef]
- Braunerhjelm, P.; Ding, D.; Thulin, P. Labour market mobility, knowledge diffusion and innovation. European Economic Review 2020, 123, 103386. [Google Scholar] [CrossRef]
- Burhan, M.; Singh, A.K.; Jain, S.K. Patents as proxy for measuring innovations: A case of changing patent filing behavior in Indian public funded research organizations. Technological Forecasting and Social Change 2017, 123, 181–190. [Google Scholar] [CrossRef]
- Cappellano, F.; Sohn, C.; Makkonen, T.; Kaisto, V. Bringing borders back into cross-border regional innovation systems: Functions and dynamics. Environment and Planning A: Economy and Space 2022, 54, 1005–1021. [Google Scholar] [CrossRef]
- Caviggioli, F.; Colombelli, A.; De Marco, A.; Scellato, G.; Ughetto, E. The impact of university patenting on the technological specialization of European regions: a technology-level analysis. Technological Forecasting and Social Change 2023, 188, 122216. [Google Scholar] [CrossRef]
- Cefis, E.; Grassano, N.; Tubiana, M. Firms’ patenting and collective cumulative knowledge: evidence from the largest R&D investors in the world. Industry and Innovation 2024, 1–36. [Google Scholar]
- Cheng, H.; Yu, Y.; Zhang, L.; Zhang, Z. The effect of subsidies on cultural and creative Enterprise performance: mediating role of patents. Engineering Economics 2022, 33, 188–199. [Google Scholar] [CrossRef]
- Christensen, J.L.; Gregersen, B.; Holm, J.R.; Lorenz, E. (Eds.) Globalisation, new and emerging technologies, and sustainable development: The Danish innovation System in Transition. 2021. [Google Scholar]
- Christopoulos, G.; Wintjes, R. Identifying Clusters as Local Innovation Systems. Journal of the Knowledge Economy 2024, 15, 9784–9823. [Google Scholar] [CrossRef]
- Ciołek, D.; Golejewska, A. Efficiency determinants of regional innovation systems in Polish subregions. Gospodarka Narodowa. The Polish Journal of Economics 2022, 311, 24–45. [Google Scholar] [CrossRef]
- Cooke, P.; Heidenreich, M.; Braczyk, H.J. Introduction: Regional innovation systems–an evolutionary approach. In Regional innovation systems; Routledge, 2024; pp. 1–18. [Google Scholar]
- Crespi, F.; Guarascio, D. The demand-pull effect of public procurement on innovation and industrial renewal. Industrial and Corporate Change 2019, 28, 793–815. [Google Scholar] [CrossRef]
- D’Adamo, I.; Di Carlo, C.; Gastaldi, M.; Rossi, E.N.; Uricchio, A.F. Economic Performance, Environmental Protection and Social Progress: A Cluster Analysis Comparison towards Sustainable Development. Sustainability 2024, 16, 5049. [Google Scholar] [CrossRef]
- Dhulipala, L.; Dong, X.; Gowda, K.N.; Gu, Y. Optimal Parallel Algorithms for Dendrogram Computation and Single-Linkage Clustering. arXiv arXiv:2404.19019, 2024.
- Di Comite, F.; Diukanova, O.; Mandras, G.; Gómez Prieto, J. The RHOMOLO economic impact assessment of the R&I and Low-Carbon ERDF Investment programme in Apulia, Italy (No. 04/2018). JRC Working Papers on Territorial Modelling and Analysis. 2018.
- Dong, Y.; Wei, Z.; Liu, T.; Xing, X. The impact of R&D intensity on the innovation performance of artificial intelligence enterprises-based on the moderating effect of patent portfolio. Sustainability 2020, 13, 328. [Google Scholar] [CrossRef]
- Drago, C.; Di Nallo, L.; Russotto, M.L. Measuring and classifying the social sustainability of European banks: An analysis using interval-based composite indicators. Environmental Impact Assessment Review 2024, 105, 107434. [Google Scholar] [CrossRef]
- Drago, C.; Minnetti, F.; Di Nallo, L.; Manzari, A. Uncovering patterns of fintech behavior in Italian banks: A multidimensional statistical analysis. Research in International Business and Finance 2025, 73, 102598. [Google Scholar] [CrossRef]
- Errichiello, L.; Drago, C. Destinations’ environmental orientation: a symbolic cluster analysis based on hotel employees’ environmental knowledge, awareness, and concern. Journal of Sustainable Tourism 2024, 32, 1471–1491. [Google Scholar] [CrossRef]
- Ervits, I. The effect of co-patenting as a form of knowledge meta-integration on technological differentiation at Siemens. European Journal of Innovation Management 2024, 27, 2575–2596. [Google Scholar] [CrossRef]
- Fang, L.; Li, Z. Corporate digitalization and green innovation: Evidence from textual analysis of firm annual reports and corporate green patent data in China. Business Strategy and the Environment 2024. [Google Scholar] [CrossRef]
- Fernandes, C.; Farinha, L.; Ferreira, J.J.; Asheim, B.; Rutten, R. Regional innovation systems: what can we learn from 25 years of scientific achievements? . Regional studies 2021, 55, 377–389. [Google Scholar] [CrossRef]
- Filippopoulos, N.; Fotopoulos, G. Innovation in economically developed and lagging European regions: A configurational analysis. Research Policy 2022, 51, 104424. [Google Scholar] [CrossRef]
- Forner, D.; Ozcan, S. Examination of overlapping boundaries of innovation systems using deep neural network and natural language processing. IEEE Transactions on Engineering Management 2023. [Google Scholar] [CrossRef]
- Franco, S.; Gianelle, C.; Kleibrink, A.; Murciego, A. Learning from similar regions: how to benchmark innovation systems beyond rankings. In Quantitative Methods for Place-Based Innovation Policy; Edward Elgar Publishing, 2020; pp. 162–194. [Google Scholar]
- Fritsch, M.; Greve, M.; Wyrwich, M. Shades of a Socialist Legacy? Innovation Activity in East and West Germany 1877-2014. 2023. [Google Scholar]
- Fu, Y.; Liu, X.; Sarkar, S.; Wu, T. Gaussian mixture model with feature selection: An embedded approach. Computers & Industrial Engineering 2021, 152, 107000. [Google Scholar]
- Galaso, P.; Kovářík, J. Collaboration networks, geography and innovation: Local and national embeddedness. Papers in Regional Science 2021, 100, 349–378. [Google Scholar] [CrossRef]
- Ganau, R.; Grandinetti, R. Disentangling regional innovation capability: what really matters? . Industry and Innovation 2021, 28, 749–772. [Google Scholar] [CrossRef]
- Ganguly, M. Stronger patent regime, innovation and scientist mobility. Research in Economics 2024, 78, 101004. [Google Scholar] [CrossRef]
- Ghazal, S.; Aziz, T.; Tabash, M.I.; Drachal, K. The Linkage between Corporate Research and Development Intensity and Stock Returns: Empirical Evidence. Journal of Risk and Financial Management 2024, 17, 180. [Google Scholar] [CrossRef]
- Gutiérrez, C.; Roa P, V.; Smith, J. The Chilean sectoral innovation systems: An approach from the National Innovation Survey. Journal of technology management & innovation 2021, 16, 3–13. [Google Scholar]
- Han, J. Technology commercialization through sustainable knowledge sharing from university-industry collaborations, with a focus on patent propensity. Sustainability 2017, 9, 1808. [Google Scholar] [CrossRef]
- Hazarika, N. R&D intensity and its curvilinear relationship with firm profitability: Perspective from the alternative energy sector. Sustainability 2021, 13, 5060. [Google Scholar] [CrossRef]
- Heidenreich, M. Conclusion: the dilemmas of regional innovation systems. In Regional innovation systems; Routledge, 2024; pp. 363–389. [Google Scholar]
- Houdouin, P.; Ollila, E.; Pascal, F. Regularized EM algorithm. ICASSP 2023-2023 IEEE International Conference on Acoustics, Speech and Signal Processing (ICASSP) 1–5.
- Howoldt, D. Characterising innovation policy mixes in innovation systems. Research Policy 2024, 53, 104902. [Google Scholar] [CrossRef]
- Ikotun, A.M.; Ezugwu, A.E. Improved SOSK-means automatic clustering algorithm with a three-part mutualism phase and random weighted reflection coefficient for high-dimensional datasets. Applied Sciences 2022, 12, 13019. [Google Scholar] [CrossRef]
- Im, H.J.; Park, Y.J.; Shon, J. Product market competition and the value of innovation: Evidence from US patent data. Economics Letters 2015, 137, 78–82. [Google Scholar] [CrossRef]
- Innocenti, N.; Capone, F.; Lazzeretti, L. Knowledge networks and industrial structure for regional innovation: An analysis of patents collaborations in Italy. Papers in Regional Science 2020, 99, 55–73. [Google Scholar] [CrossRef]
- Javadian, M.; Vaziri, R.; Haghzad Klidbary, S.; Malekzadeh, A. Refining membership degrees obtained from fuzzy C-means by re-fuzzification. Iranian Journal of Fuzzy Systems 2020, 17, 85–104. [Google Scholar]
- Jovanović, M.; Savić, G.; Cai, Y.; Levi-Jakšić, M. Towards a Triple Helix based efficiency index of innovation systems. Scientometrics 2022, 127, 2577–2609. [Google Scholar]
- Karna, A.; Gibert, K. Automatic identification of the number of clusters in hierarchical clustering. Neural Computing and Applications 2022, 34, 119–134. [Google Scholar] [CrossRef]
- Kim, H.; Kim, H.K.; Cho, S. Improving spherical k-means for document clustering: Fast initialization, sparse centroid projection, and efficient cluster labeling. Expert Systems with Applications 2020, 150, 113288. [Google Scholar] [CrossRef]
- Kim, J.; Lee, K. Local–global interface as a key factor in the catching up of regional innovation systems: Fast versus slow catching up among Taipei, Shenzhen, and Penang in Asia. Technological Forecasting and Social Change 2022, 174, 121271. [Google Scholar] [CrossRef]
- Kim, J.; Lee, K. Varieties of Regional Innovation Systems around the World and Catch-up by Latecomers. Utrecht University, Human Geography and Planning. Utrecht University, Human Geography and Planning, 2022. [Google Scholar]
- Kitaisky, V.; Revinsky, G.; Revinsky, O.; Shvedova, V. Industry preferences for foreign patenting of Russian innovation enterprises. Economic Annals-XXI/Ekonomìčnij Časopis-XXI, 189. 2021.
- Klincewicz, K.; Szumiał, S. Successful patenting—not only how, but with whom: the importance of patent attorneys. Scientometrics 2022, 127, 5111–5137. [Google Scholar] [CrossRef]
- Kryukov, V.; Tokarev, A. Spatial trends of innovation in the Russian oil and gas sector: What does patent activity in Siberia and the Arctic reflect? . Regional Science Policy & Practice 2022, 14, 127–146. [Google Scholar]
- Lee, S.; Lee, H.; Lee, C. Open innovation at the national level: Towards a global innovation system. Technological Forecasting and Social Change 2020, 151, 119842. [Google Scholar] [CrossRef]
- Lepore, D.; Micozzi, A.; Spigarelli, F. Industry 4.0 accelerating sustainable manufacturing in the COVID-19 era: assessing the readiness and responsiveness of Italian regions. Sustainability 2021, 13, 2670. [Google Scholar] [CrossRef]
- Li, Y.; Wei, Y.; Li, Y.; Lei, Z.; Ceriani, A. Connecting emerging industry and regional innovation system: Linkages, effect and paradigm in China. Technovation 2022, 111, 102388. [Google Scholar] [CrossRef]
- Longi, H.; Niemelä, S.; Leppänen, T. Bridging the innovation system and industry development: experiments from Northern Finland. International Journal of Innovation and Regional Development 2020, 9, 85–101. [Google Scholar] [CrossRef]
- Lu, H.; Du, D.; Qin, X. Assessing the dual innovation capability of national innovation system: Empirical evidence from 65 countries. Systems 2022, 10, 23. [Google Scholar] [CrossRef]
- Maasoumi, E.; Heshmati, A.; Lee, I. Green innovations and patenting renewable energy technologies. Empirical economics 2021, 60, 513–538. [Google Scholar] [CrossRef]
- Manuylenko, V.V.; Ermakova, G.A.; Gryzunova, N.V.; Koniagina, M.N.; Milenkov, A.V.; Setchenkova, L.A.; Ochkolda, I.I. Generation and assessment of intellectual and informational capital as a foundation for corporations’ digital innovations in the “open innovation” system. International Journal of Advanced Computer Science and Applications 2022, 13. [Google Scholar] [CrossRef]
- Matricano, D. The effect of R&D investments, highly skilled employees, and patents on the performance of Italian innovative startups. Technology Analysis & Strategic Management 2020, 32, 1195–1208. [Google Scholar]
- Mazlumi, S.H.H.; Kermani, M.A.M. Investigating the structure of the internet of things patent network using social network analysis. IEEE Internet of Things Journal 2022, 9, 13458–13469. [Google Scholar] [CrossRef]
- McCaw, Z.R.; Aschard, H.; Julienne, H. Fitting Gaussian mixture models on incomplete data. BMC bioinformatics 2022, 23, 208. [Google Scholar]
- Meetei, L.A.; Bhattacharjya, B.; Bhowmick, B. The role of universities in the innovation systems in the developing countries. Foresight and STI Governance 2024, 18, 58–67. [Google Scholar] [CrossRef]
- Mi, T.; Zhong, L.; Huang, Y.; Liu, Y.; Yu, G. A Grid-Based Fuzzy C-Means Clustering Algorithm with Unknown Number of Clusters. In Proceedings of the 2023 5th International Conference on Artificial Intelligence and Computer Applications (ICAICA), November 2023; pp. 182–185. [Google Scholar]
- Montenegro RL, G.; Ribeiro, L.C.; Britto, G. The effects of environmental technologies: evidences of different national innovation systems. Journal of Cleaner Production 2021, 284, 124742. [Google Scholar] [CrossRef]
- Muna, U.M.; Biswas, S.; Zarif SA, A.M.; Farid, D.M. Ameliorating Performance of Random Forest using Data Clustering. 2023 26th International Conference on Computer and Information Technology (ICCIT), December 2023; IEEE; pp. 1–6. [Google Scholar]
- Ndicu, S.; Ngui, D.; Barasa, L. Technological catch-up, innovation, and productivity analysis of national innovation systems in developing countries in Africa 2010–2018. Journal of the knowledge economy 2024, 15, 7941–7967. [Google Scholar] [CrossRef]
- Nguyen PN, D.; Nguyen, H.H. Examining the Role of Family in Shaping Digital Entrepreneurial Intentions in Emerging Markets. SAGE Open 2024, 14, 21582440241239493. [Google Scholar] [CrossRef]
- Nuccio, M.; Bertacchini, E. Data-driven arts and cultural organizations: opportunity or chimera? In Rethinking Culture and Creativity in the Digital Transformation; Routledge, 2023; pp. 31–48. [Google Scholar]
- Önder, A.S.; Schweitzer, S.; Tcaci, O. Innovation and Regional Development: The Impact of Patenting on Labor Market Outcomes. Available at SSRN 5010957. 2024.
- Ortega, A.M.; Serna, M. Determinants of innovation performance of organizations in a regional innovation system from a developing country. International Journal of Innovation Science 2020, 12, 345–362. [Google Scholar] [CrossRef]
- Ottone, V.; Barbieri, M. Research & innovation policy in the Italian NRRP: an evalutation of emerging challenges for multi-level governance. Contemporary Italian Politics 2022, 14, 409–423. [Google Scholar]
- ÖZen, B.S.; Baycan, T. Comparison of Innovation Strategies of Regional Development Agencies in Turkey. Ekonomicheskie i Sotsialnye Peremeny 2022, 15, 236–258. [Google Scholar] [CrossRef]
- Pan, X.; Li, J.; Shen, Z.; Song, M. Life cycle identification of China's regional innovation systems based on entropy weight disturbing attribute model. Habitat International 2023, 131, 102725. [Google Scholar] [CrossRef]
- Paunov, C.; Rollo, V. Has the internet fostered inclusive innovation in the developing world? . World Development 2016, 78, 587–609. [Google Scholar] [CrossRef]
- Petrosillo, I.; Lovello, E.M.; Drago, C.; Magazzino, C.; Valente, D. Global environmental sustainability trends: A temporal comparison using a new interval-based composite indicator. Environmental and Sustainability Indicators 2024, 24, 100482. [Google Scholar] [CrossRef]
- Portillo-Tarragona, P.; Scarpellini, S.; Marín-Vinuesa, L. M. ‘Circular patents’ and dynamic capabilities: new insights for patenting in a circular economy. Technology Analysis & Strategic Management 2024, 36, 1571–1586. [Google Scholar]
- Puri, D.; Gupta, D. Enhancing K-Means Clustering with Data-Driven Initialization and Adaptive Distance Measures. In Proceedings of the 2024 International Conference on Emerging Innovations and Advanced Computing (INNOCOMP), May 2024; pp. 570–574. [Google Scholar]
- Radosevic, S. Techno-economic transformation in Eastern Europe and the former Soviet Union–A neo-Schumpeterian perspective. Research Policy 2022, 51, 104397. [Google Scholar] [CrossRef]
- Rahko, J. Knowledge spillovers through inventor mobility: the effect on firm-level patenting. The Journal of Technology Transfer 2017, 42, 585–614. [Google Scholar] [CrossRef]
- Rhodes, J.S.; Cutler, A.; Moon, K.R. Geometry-and accuracy-preserving random forest proximities. IEEE Transactions on Pattern Analysis and Machine Intelligence 2023, 45, 10947–10959. [Google Scholar] [CrossRef]
- Ruhrmann, H.; Fritsch, M.; Leydesdorff, L. Synergy and policy-making in German innovation systems: Smart Specialisation Strategies at national, regional, local levels? . Regional Studies 2022, 56, 1468–1479. [Google Scholar] [CrossRef]
- Samara, E.; Kilintzis, P.; Katsoras, E.; Martnidis, G.; Kosti, P. A system dynamics approach for the development of a Regional Innovation System. Journal of Innovation and Entrepreneurship 2024, 13, 26. [Google Scholar] [CrossRef]
- Scherngell, T.; Schwegmann, K.; Zahradnik, G. The geographical dynamics of global R&D collaboration networks in robotics: Evidence from co-patenting activities across urban areas worldwide. Plos one 2023, 18, e0281353. [Google Scholar]
- Shahwan, R.; Zaman, T. Role of universities as knowledge Creators in a national innovation system: an open innovation paradigm. In Industry clusters and innovation in the Arab world: Challenges and opportunities; Emerald Publishing Limited, 2023; pp. 259–280. [Google Scholar]
- Song, M.; Jung, H.; Lee, S.; Kim, D.; Ahn, M. Diagnostic classification and biomarker identification of Alzheimer’s disease with random forest algorithm. Brain sciences 2021, 11, 453. [Google Scholar] [CrossRef]
- Stek, P.E. Identifying spatial technology clusters from patenting concentrations using heat map kernel density estimation. Scientometrics 2021, 126, 911–930. [Google Scholar] [CrossRef]
- Stojčić, N. Collaborative innovation in emerging innovation systems: Evidence from Central and Eastern Europe. The Journal of Technology Transfer 2021, 46, 531–562. [Google Scholar] [CrossRef]
- Su, Y.; Jiang, X.; Lin, Z. Simulation and relationship strength: characteristics of knowledge flows among subjects in a regional innovation system. Science, Technology and Society 2021, 26, 459–481. [Google Scholar] [CrossRef]
- Suominen, A.; Deschryvere, M.; Narayan, R. Uncovering value through exploration of barriers-A perspective on intellectual property rights in a national innovation system. Technovation 2023, 123, 102719. [Google Scholar] [CrossRef]
- Tahmooresnejad, L.; Turkina, E. Economic geography of innovation: The effect of gender-related aspects of co-inventor networks on country and regional innovation. Plos one 2023, 18, e0288843. [Google Scholar] [CrossRef] [PubMed]
- Volchik, V.V.; Maslyukova, E.V.; Panteeva, S.A. Investigating the approaches to national innovation systems modeling. Ekonomicheskie i Sotsialnye Peremeny 2021, 14, 135–150. [Google Scholar] [CrossRef]
- Wagner, C.; Poland, K.B.; Yan, X. Flows and Networks in Global Innovation System among Top R&D Nations. Global Innovation and National Interests Project: Working Paper 2021, 7, 2016–2021. [Google Scholar]
- Wang, J.; Chandra, K.; Du, C.; Ding, W.; Wu, X. Assessing the Potential of Cross-border regional innovation Systems: A case study of the Hong Kong-Shenzhen region. Technology in Society 2021, 65, 101557. [Google Scholar] [CrossRef]
- Wibisono ETHEROLEOFLOCALGOVERNMENTINIMPROVINGREGIONALINNOVATIONCAPABILITY:, A.C.R.I.T.I.C.A.L.L.I.T.E.R.A.T.U.R.E.R.E.V.I.E.W.I.N.T.H.E.C.O.N.T.E.X.T.O.F.T.H.E.A.S.I.A.N.R.E.G.I.O.N. Jurnal Khazanah Intelektual 2024, 8, 1–28.
- Wirkierman, A.L.; Ciarli, T.; Savona, M. A taxonomy of European innovation clubs. Economia Politica 2023, 40, 1–34. [Google Scholar] [CrossRef]
- Wong, C.Y.; Lee, K. Evolution of innovation systems of two industrial districts in East Asia: transformation and upgrade from a peripheral system and the role of the core firms, Samsung and TSMC. Journal of Evolutionary Economics 2022, 32, 955–990. [Google Scholar] [CrossRef]
- Wong, C.Y.; Sheu, J.; Lee, K. Dynamics or dilemma: Assessing the innovation systems of three satellite platform regions (Singapore, Dublin and Penang). Eurasian Geography and Economics 2023, 64, 589–628. [Google Scholar] [CrossRef]
- Yan, S.; Zou, L.; Growe, A.; Wang, Q. Propositions for place-based policies in making regional innovation systems. Evidence from six high-tech industrial development zones in China. Cities 2024, 154, 105322. [Google Scholar]
- Yao, L.; Li, J.; Li, J. Urban innovation and intercity patent collaboration: A network analysis of China’s national innovation system. Technological Forecasting and Social Change 2020, 160, 120185. [Google Scholar] [CrossRef]
- Yu, S.; Wang, Y.; Gu, Y.; Dhulipala, L.; Shun, J. Parchain: A framework for parallel hierarchical agglomerative clustering using nearest-neighbor chain. arXiv arXiv:2106.04727, 2021. [CrossRef]
- Yuan, X.; Li, X. Mapping the technology diffusion of battery electric vehicle based on patent analysis: A perspective of global innovation systems. Energy 2021, 222, 119897. [Google Scholar] [CrossRef]
- Zhao, R.; Zhang, H.; Zhang, M.Y.; Qu, F.; Xu, Y. Competitor-weighted centrality and small-world clusters in competition networks on firms’ innovation ambidexterity: Evidence from the wind energy industry. International Journal of Environmental Research and Public Health 2023, 20, 3339. [Google Scholar] [CrossRef] [PubMed]
- Zhao, X.; Tan, J. The performance implications of patenting–the moderating effect of informal institutions in emerging economies. R&D Management 2021, 51, 468–483. [Google Scholar]
- Zhou, Q.; Cheng, C.; Fang, Z.; Zhang, H.; Xu, Y. How does the development of the digital economy affect innovation output? Exploring mechanisms from the perspective of regional innovation systems. Structural Change and Economic Dynamics 2024, 70, 1–17. [Google Scholar] [CrossRef]
Figure 1.
Ranking of machine learning algorithms for clustering following the application of the sorting rule.
Figure 1.
Ranking of machine learning algorithms for clustering following the application of the sorting rule.
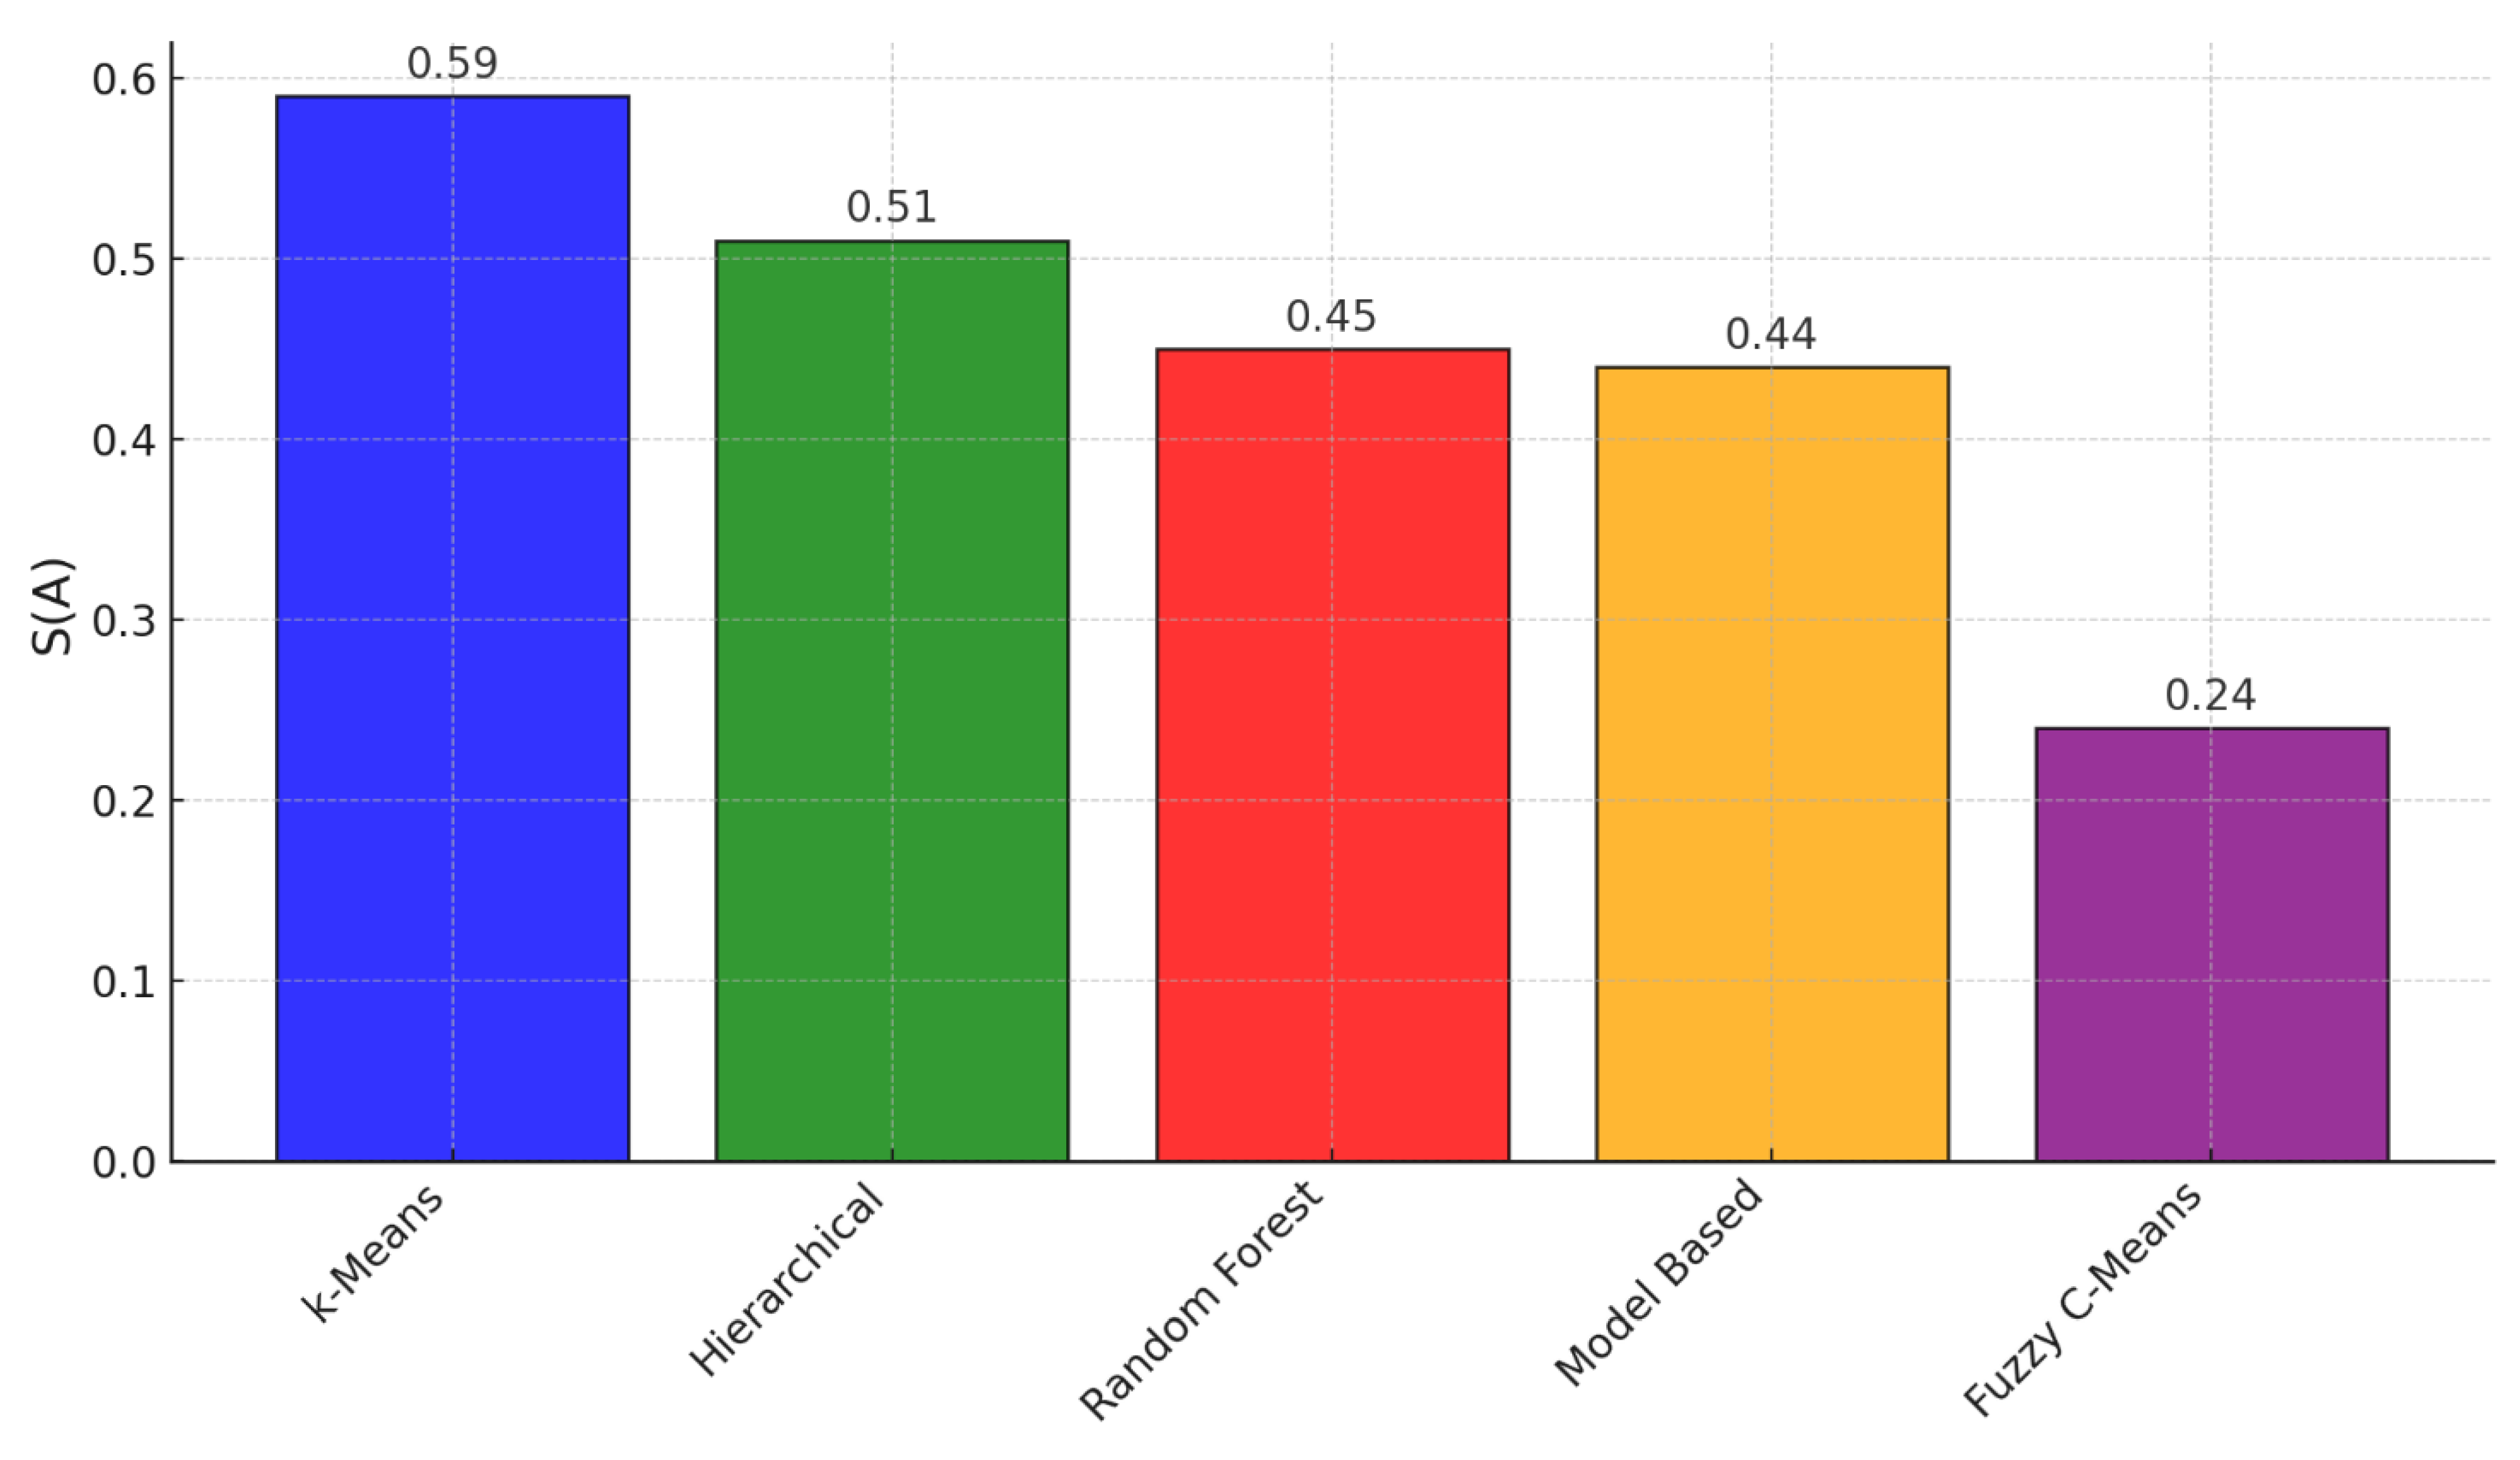
Figure 2.
Composition of clusters by regions following the application of the k-Means algorithm.
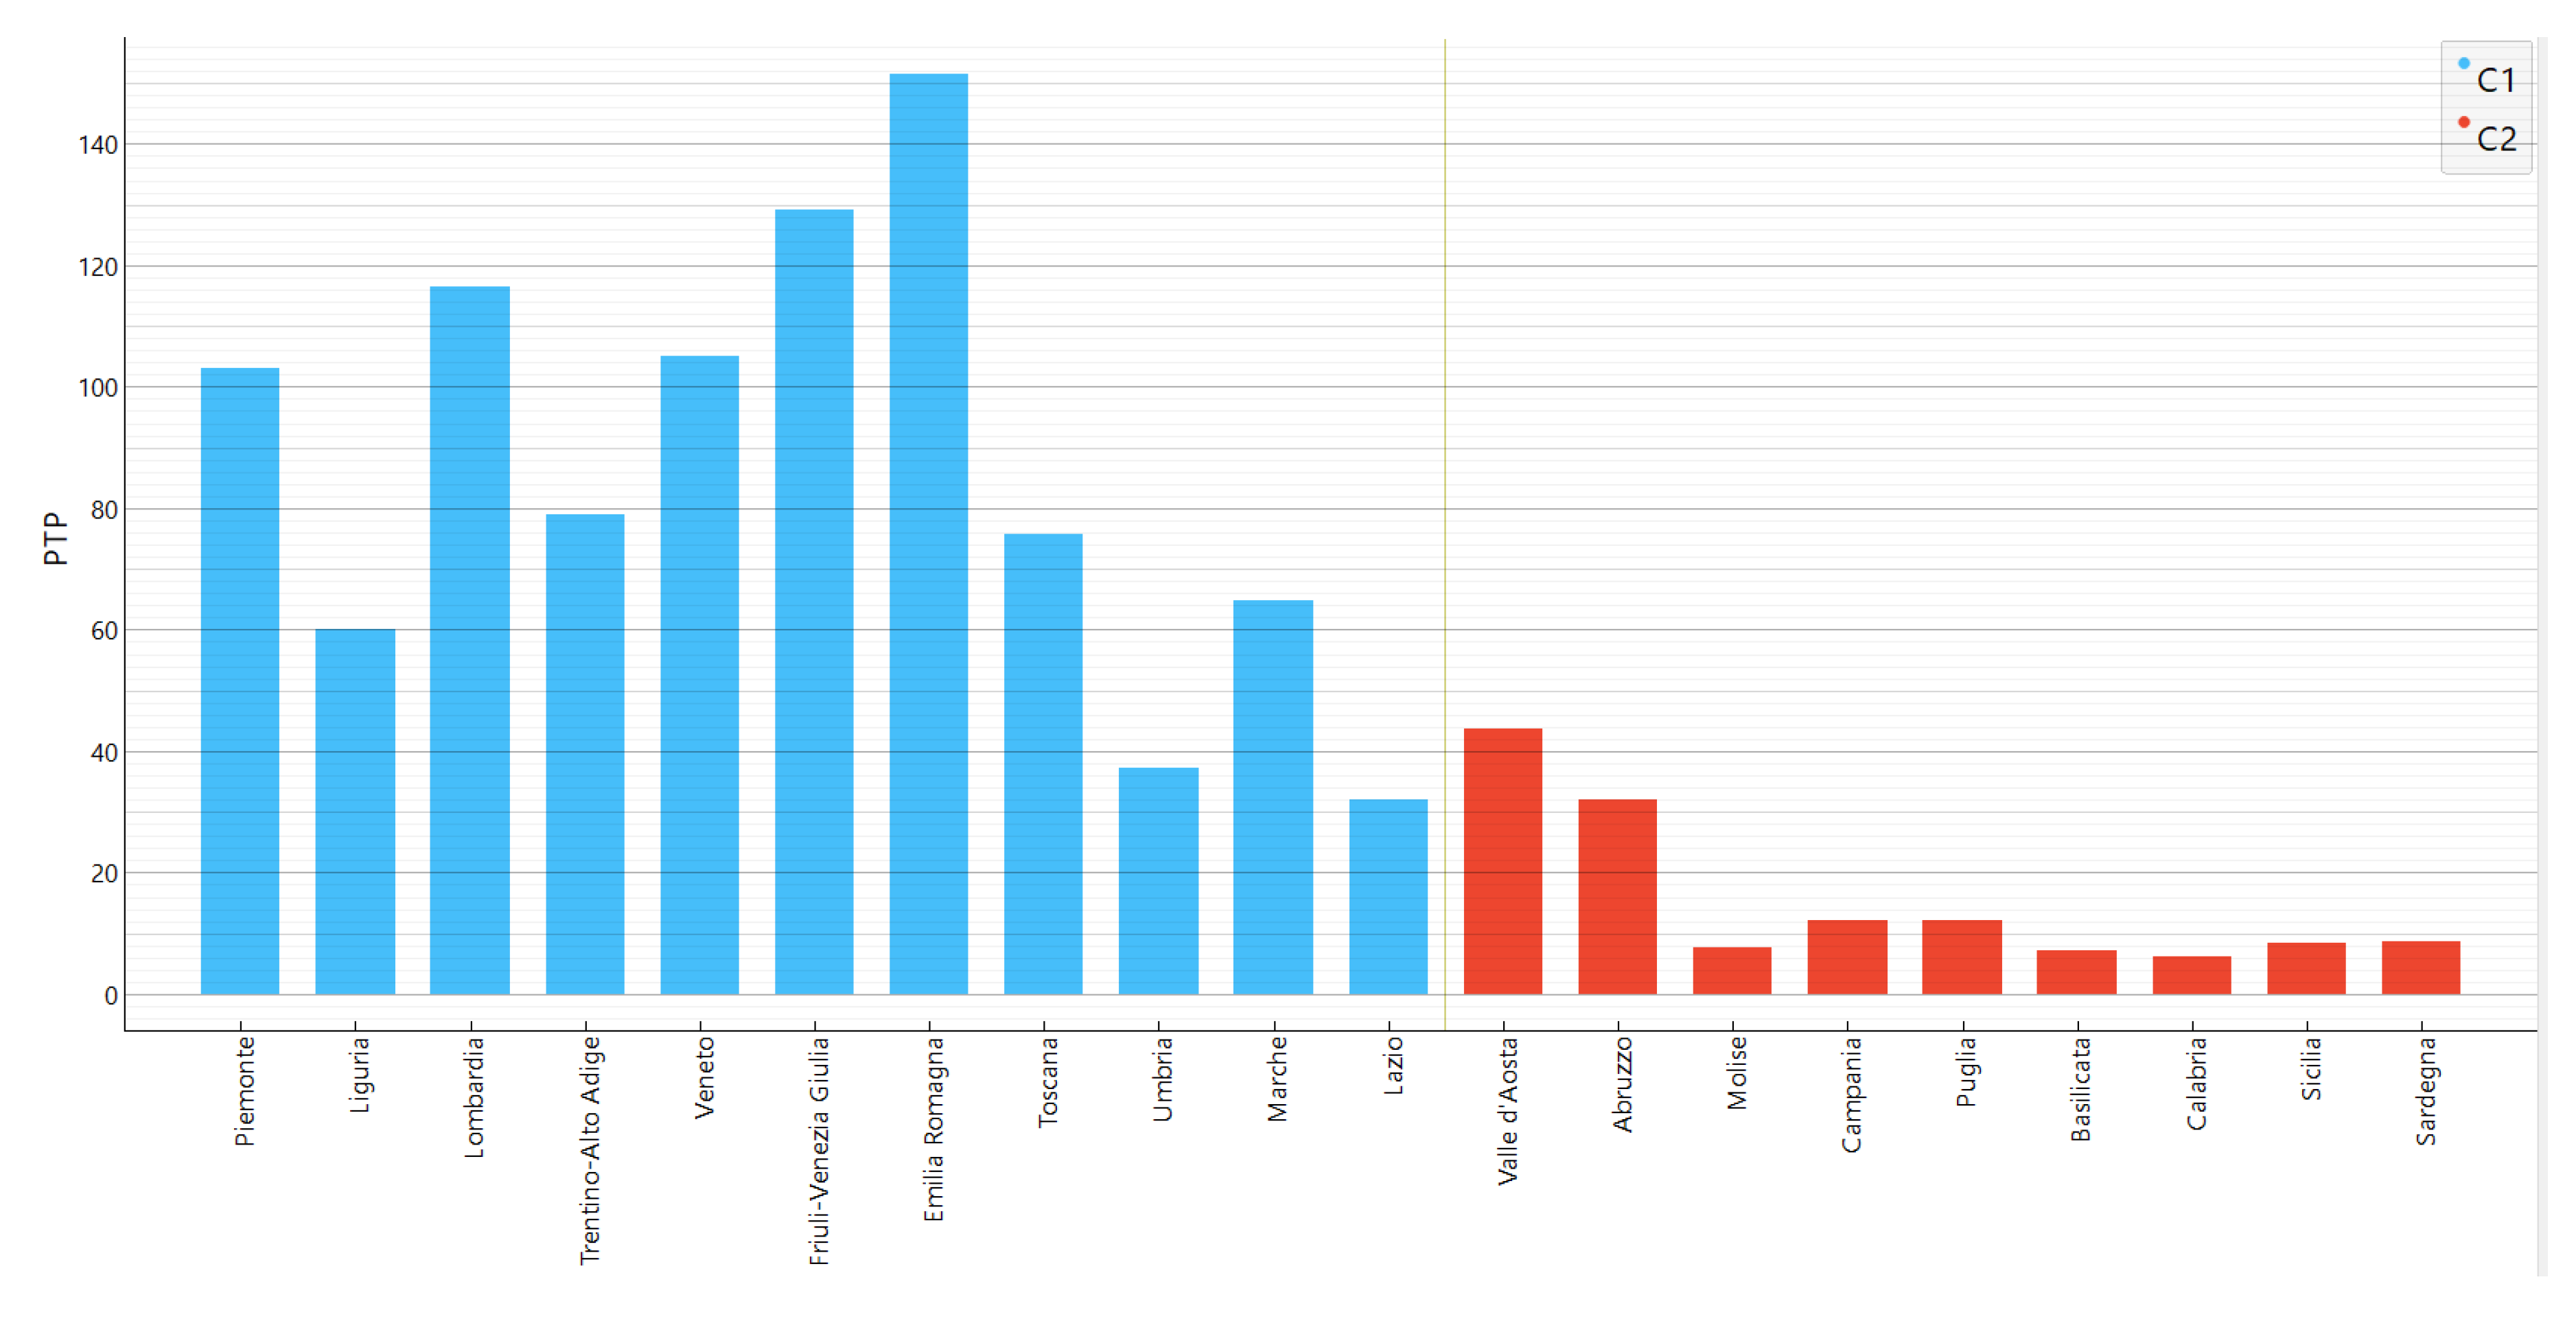

Table 1.
Regional Innovation Systems (RIS) and Efficiency.
| Main Topic | References | Impact on Patenting | Impact on Regional Innovation Systems | Methodologies |
| Knowledge Production and Regional Innovation | Ali (2024); Pan, Li, Shen, & Song (2023); Filippopoulos & Fotopoulos (2022); Zhou, Cheng, Fang, Zhang, & Xu (2024) | Patenting reflects regional knowledge production disparities; innovation varies across lifecycle stages, with lagging regions struggling due to weaker resources. | Tailored interventions based on lifecycle stages or regional disparities can strengthen RIS by fostering knowledge generation and diffusion. | Knowledge production function, lifecycle analysis, configurational analysis, regional data modeling. |
| Institutional Quality and Governance in RIS | Barra & Ruggiero (2022); Ciołek & Golejewska (2022); Cooke, Heidenreich, & Braczyk (2024); Cappellano, Sohn, Makkonen, & Kaisto (2022) | Strong institutions promote patenting through intellectual property rights protection and policy support, reducing inefficiencies. | Institutional frameworks enhance RIS efficiency by fostering collaboration, reducing barriers, and addressing the specific needs of cross-border or less developed regions. | Statistical efficiency models, institutional quality frameworks, cross-border policy analysis. |
| Connectivity in Innovation Systems | Berman, Marino, & Mudambi (2020); Kim & Lee (2022); Ganau & Grandinetti (2021); Longi, Niemelä, & Leppänen (2020) | Global-local linkages boost patenting by facilitating cross-border knowledge flows and exposing regions to advanced technological networks. | Connectivity enables regions to leverage global knowledge while reinforcing local capabilities, supporting RIS competitiveness and adaptation to global demands. | Social network analysis, global-local connectivity models, case studies of regions. |
| Intellectual Property as Innovation Indicators | Block, Fisch, Ikeuchi, & Kato (2022); Bianchi, Galaso, & Palomeque (2021); Ortega & Serna (2020) | Trademarks and patents act as complementary indicators of regional innovation, revealing disparities in regional innovation capabilities. | Intellectual property strengthens RIS by formalizing innovation outputs and incentivizing collaborative networks, though risks of power imbalances in knowledge sharing persist. | Patent and trademark analysis, network and brokerage role analysis, econometric models. |
| Emerging Trends in RIS and Digital Economy | Zhou, Cheng, Fang, Zhang, & Xu (2024); Pan, Li, Shen, & Song (2023); Fernandes, Farinha, Ferreira, Asheim, & Rutten (2021) | Emerging trends like the digital economy enhance patenting by enabling faster knowledge generation, reducing transactional inefficiencies. | Digital transformation introduces new paradigms in RIS, fostering data-driven ecosystems while requiring regions to address gaps in digital infrastructure and skills. | Digital economy analysis, entropy-weighted models, longitudinal studies of RIS transformation. |
Table 2.
National Innovation Systems (NIS) and Governance.
| Main Topic | References | Impact on Patenting | Impact on Regional Innovation Systems | Methodologies |
| Governance, Political Stability, and Institutional Quality | Aguiar-Hernandez & Breetz (2024); Anouze et al. (2024); Binz & Truffer (2020); Fritsch, Greve, & Wyrwich (2023) | Political instability and weak governance reduce patent filings, while efficient governance frameworks enhance resource allocation and intellectual property protection. | Stable governance fosters innovation system efficiency, reduces regional disparities, and encourages knowledge diffusion to drive regional competitiveness. | Case studies (e.g., Mexico), data envelopment analysis (DEA), and longitudinal historical analysis (e.g., Germany). |
| Collaboration, Networks, and Knowledge Institutions | Galaso & Kovářík (2021); Yao et al. (2020); Shahwan & Zaman (2023); Ruhrmann, Fritsch, & Leydesdorff (2022) | Strong local and global collaboration networks boost patenting through knowledge spillovers and efficient resource sharing. | Collaboration strengthens regional innovation systems by enhancing connectivity, trust, and intercity spillovers while universities drive commercialization. | Network analysis, intercity patent collaboration studies, and analysis of university-industry linkages in innovation systems. |
| Sectoral Specialization, Sustainability, and Development Challenges | Gutiérrez et al. (2021); Montenegro et al. (2021); Ndicu et al. (2024); Radosevic (2022) | Sector-specific patenting trends in areas like green technologies drive sustainability, while developing regions struggle with institutional barriers to patenting. | Specialized sectors align innovation systems with sustainability goals, while tailored interventions help lagging regions catch up and foster development. | Sectoral innovation system analysis, patent trend evaluation in green technologies, and studies on technological catch-up in developing economies. |
Table 3.
University and Knowledge Networks in Innovation Systems.
| Main Topic | References | Impact on Patenting | Impact on Regional Innovation Systems | Methodologies |
| University Patenting and Knowledge Collaboration | Caviggioli et al. (2023); Ar et al. (2021); Meetei et al. (2024); Ervits (2024); Tahmooresnejad & Turkina (2023) | Universities contribute significantly to regional patents, driving technological specialization. Co-patenting enhances collaboration and inclusivity in innovation. | Strengthens localized innovation ecosystems, enabling regions to build technological niches. Knowledge collaboration bridges institutional and cultural divides. | Case studies, policy analysis, network analysis |
| Regional Clusters and Innovation Ecosystems | Christopoulos & Wintjes (2024); Innocenti et al. (2020); Wong & Lee (2022); Jovanović et al. (2022); Stojčić (2021) | Clusters anchor shared patenting activities and foster knowledge spillovers. Core firms drive systemic upgrades in innovation ecosystems. | Enhances regional competitiveness but risks over-reliance on dominant firms. Efficiency models and cluster-based frameworks reveal localized and cross-regional dynamics. | Cluster mapping, spatial analysis, efficiency indices |
| Emerging Technologies, Open Innovation, and Inclusion | Forner & Ozcan (2023); Manuylenko et al. (2022); Wong, Sheu & Lee (2023); Tahmooresnejad & Turkina (2023); Meetei et al. (2024) | AI, digital innovation, and open systems increase patenting efficiency and knowledge integration. Diversity positively impacts co-inventor networks and outcomes. | Open innovation integrates regions into global networks. Inclusion efforts and emerging technologies reshape traditional boundaries and foster more equitable innovation. | AI-driven analysis (e.g., deep learning, NLP), social and inclusion metrics |
Table 4.
Innovation and Patents.
| Macrotheme | References | Impact on Patenting | Impact on Regional Innovation Systems | Methodologies |
| Barriers, Knowledge Accumulation, and Institutional Support | Alnafrah (2024); Cefis, Grassano, & Tubiana (2024); Klincewicz & Szumiał (2022); Zhao & Tan (2021) | Alnafrah: Identifies barriers in translating patents into marketable products. Cefis: Examines patents as drivers of cumulative knowledge but warns of silos. Klincewicz: Highlights importance of patent attorneys. Zhao: Shows how informal institutions shape patent effectiveness in emerging economies. | Alnafrah: Highlights gaps in innovation systems that hinder commercialization. Cefis: Shows the dual role of patents in fostering knowledge and blocking innovation. Klincewicz & Zhao: Institutional and professional frameworks significantly influence patent success and innovation outcomes. | Case studies, institutional analysis, survey data, and knowledge ecosystem modeling. |
| Spatial, Sectoral, and Socioeconomic Dynamics | Kitaisky et al. (2021); Kryukov & Tokarev (2022); Önder, Schweitzer, & Tcaci (2024); Stek (2021) | Kitaisky: Shows Russian firms patenting abroad for competitiveness. Kryukov: Focuses on spatial trends in patenting in resource-intensive industries. Önder: Highlights patents as drivers of employment in high-skill sectors. Stek: Maps clusters using patent concentrations. | Kitaisky & Kryukov: Spatial and sectoral contexts affect how patenting activities address regional challenges. Önder & Stek: Patents boost regional competitiveness and labor market outcomes but unevenly across regions. | Geographic and sectoral case studies, labor market analysis, spatial heat mapping. |
| Sustainability, Technology Diffusion, and Circular Innovation | Maasoumi et al. (2021); Sanni & Kim (2024); Portillo-Tarragona et al. (2024); Yuan & Li (2021) | Maasoumi: Patents drive renewable energy innovation. Sanni: Open innovation supports inclusivity in green technologies. Portillo: Circular patents promote sustainability. Yuan: Patents facilitate global diffusion of electric vehicle technologies. | Green and circular patents align innovation systems with sustainability goals. Technology diffusion through patents fosters global collaboration and regional competitiveness. | Patent analysis, sustainability-focused case studies, technology diffusion modeling. |
Table 5.
Emerging Trends and Technologies in Innovation.
| Macrotheme | References | Impact on Patenting | Impact on Regional Innovation Systems | Methodologies |
| Hydrogen Economy, Knowledge Transfer, and Sustainability | Ashari, Blind, & Koch (2023); Ashari, Oh, & Koch (2024); Sanni & Kim (2024); Maasoumi et al. (2021); Portillo-Tarragona et al. (2024) | Patents protect hydrogen innovations, promote knowledge transfer (via publications and standards), and drive sustainability through green and circular technologies. Open innovation models foster inclusivity but face barriers in developing regions. | Supports systemic innovation pathways (e.g., hydrogen in Germany and South Korea) and aligns regional systems with environmental goals. Challenges include infrastructure gaps in developing regions. | Comparative TIS analysis, case studies of green patents, frameworks for sustainability and circular economies. |
| Global Collaboration, Spatial Dynamics, and Technology Diffusion | Scherngell, Schwegmann, & Zahradnik (2023); Wirkierman, Ciarli, & Savona (2023); Yuan & Li (2021) | Patents facilitate international R&D collaboration and global technology diffusion, particularly in robotics and electric vehicles. Co-patenting enhances knowledge sharing but risks creating inequalities in participation. | Regional clustering of patenting boosts competitiveness but reinforces inequalities between innovation leaders and lagging regions. Technology diffusion fosters cross-regional integration. | Co-patenting network analysis, global patent mapping, clustering analysis of R&D hotspots. |
| Digital and Regional Innovation Systems | Zhou et al. (2024); Yuan & Li (2021); Wirkierman, Ciarli, & Savona (2023) | Digital advancements (AI, big data) enhance patenting activity and foster innovation in digital and adjacent sectors. BEV patents promote global sustainability goals. | Digital economies create innovation spillovers, driving regional growth but exacerbating inequalities in access to technology and innovation resources. | Statistical modeling, patent activity mapping, regional clustering, analysis of digital economy metrics. |
Table 6.
Variables and sources.
| Variable | Acronym | Definition | Source |
| Propensity towards patenting | PTP | Total number of patent applications filed with the European Patent Office (EPO) per million inhabitants. | ISTAT-BES |
| Research intensity | RI | Percentage of expenditure on intra muros research and development activities carried out by companies, public institutions, universities (public and private) and the non-profit sector on GDP. Expenditure and GDP are considered in millions of current euros. | ISTAT-BES |
| Innovation of the production system | IPS | Percentage of companies that introduced product and process innovations in the three-year reference period out of the total number of companies with at least 10 employees. | ISTAT-BES |
| Cultural and creative employment | CCE | Percentage of employed people in professions or sectors of cultural and creative activities (Isco-08, Nace rev.2) on the total employed people (15 years and over). | ISTAT-BES |
| Mobility of Italian graduates (25-39 years) | MIG | Migration rate of Italians (25-39 years) with a tertiary education qualification, calculated as the ratio between the migration balance (difference between those registered and those cancelled due to transfer of residence) and residents with a tertiary education qualification (degree, AFAM, doctorate). The values for Italy include only movements from/to abroad, for the distribution values, inter-departmental movements are also considered. | ISTAT-BES |
| Regular internet users | RIU | Percentage of people aged 11 and over who used the Internet at least once a week in the 3 months preceding the interview. | ISTAT-BES |
| Municipalities with entirely online services for families | MEOSF | Percentage of Municipalities that provide at least one service aimed at families or individuals online at a level that allows the entire process to be started and concluded electronically (including any online payment) | ISTAT-BES |
Source of data: ISTAT-BES. Link: https://www.istat.it/statistiche-per-temi/focus/benessere-e-sostenibilita/la-misurazione-del-benessere-bes/gli-indicatori-del-bes/ Accessed 15/08/2024.
Table 7.
Machine learning algorithms used for clustering.
| Machine Learning Algorithm | Main Characteristics | Advantages | Disadvantages | References |
| Density-Based (DBSCAN) | Clusters based on density. Handles noise and clusters of arbitrary shapes. Requires ϵ\epsilonϵ (radius) and MinPts (minimum neighbors). | Detects clusters of arbitrary shape. Handles noise well. Does not require predefining the number of clusters. | Struggles with varying density or high-dimensional data. | Abdulhameed, et al., 2024; Bechini, et al., 2020. |
| Fuzzy C-Means (FCM) | Assigns fuzzy membership to data points. Suitable for overlapping clusters. Uses a fuzziness parameter m>1m > 1m>1. | Handles overlapping clusters. Provides probabilistic membership of data points. | Requires the number of clusters ccc to be predefined. Sensitive to initialization and outliers. | Mi et al., 2023; Javadian et al., 2020; Bharill et al., 2019 |
| Hierarchical Clustering | Builds a tree-like cluster hierarchy. No need to predefine the number of clusters. Can use different linkage criteria (single, complete, average). | No need to predefine the number of clusters. Provides a dendrogram for visualization. Suitable for small datasets. | Computationally expensive for large datasets. Sensitive to noise and outliers. Difficult to modify once a step is completed. | Yu et al., 2021; Dhulipala et al., 2024; Karna and Gibert, 2022 |
| Model-Based (GMM) | Assumes data is generated from Gaussian distributions. Uses Expectation-Maximization (EM) for optimization. Outputs probabilities for cluster membership. | Flexible in modeling clusters with varying shapes. Provides probabilistic membership. Can fit clusters with different covariance structures. | Assumes data follows a Gaussian distribution. Requires predefining the number of components. Computationally expensive for large datasets. | Houdouin et al., 2023; Fu et al., 2021; McCaw et al., 2022 |
| K-Means | Minimizes the sum of squared distances to cluster centroids. Requires predefining the number of clusters K. Iterative optimization. | Simple and fast for large datasets. Works well with spherical clusters. Easy to implement and interpret. | Sensitive to initialization and outliers. Requires K to be predefined. Struggles with non-spherical clusters or varying cluster sizes. | Kim et al., 2020; Puri and Gupta, 2024; Ikotun and Ezugwu, 2022 |
| Random Forest | Combines multiple decision trees using bagging. Performs majority voting for classification or averaging for regression. | Robust to overfitting. Handles high-dimensional data well. Can measure feature importance. Performs well on both classification and regression tasks. | Computationally intensive for large datasets. Less interpretable than single decision trees. May struggle with sparse data if not tunnel properly. | Song et al., 2021; Muna et al., 2023; Rhodes et al., 2023 |
Table 8.
Characteristics of panel data with fixed effects and random effects.
| Aspect | Fixed Effects Model | Random Effects Model |
| Model Specification | ||
| Key Idea | . | . |
| Unobserved Effects | Treated as fixed parameters, eliminated via demeaning or dummy variables. | Treated as random variables with a specific distribution (usually normal). |
| Estimation Method | Least Squares Dummy Variables (LSDV) or within-transformation (demeaning). | Generalized Least Squares (GLS). |
| Time-Invariant Variables | Cannot estimate effects of variables that do not vary over time for each entity. | Can estimate effects of time-invariant variables, as they are not absorbed into the random component. |
| Focus | Within-entity variations (how changes within the same entity affect the outcome). | Both within- and between-entity variations. |
| Key Assumption | . | . |
| Advantages | - Controls for unobserved heterogeneity; - Reduces omitted variable bias; - Suitable for causal inference. |
- More efficient when random-effects assumption holds; - Includes time-invariant variables; - Handles large datasets well. |
| Disadvantages | - Cannot estimate time-invariant variable effects. - Less efficient due to within-transformation. - May overfit. |
- Susceptible to bias if random -effects assumption is violated. |
| Test for Model Selection | Hausman Test: Compares the efficiency of fixed effects and random effects models. | Hausman Test: If the null hypothesis of no correlation is rejected, the fixed effects model is preferred. |
| Use Cases | Suitable when entity-specific effects correlate with predictors (e.g., policy analysis, longitudinal studies). | Suitable when entity-specific effects are assumed uncorrelated with predictors (e.g., large cross-sectional datasets). |
Table 9.
Clustering results with machine learning algorithms and statistical indicator metrics.
| Statistics | Density-Based | Fuzzy C-Means | Hierarchical | Model Based | K-Means | Random Forest |
| Clusters | 1 | 3 | 2 | 3 | 2 | 2 |
| R² | 0.000 | 0.635 | 0.510 | 0.682 | 0.570 | 0.516 |
| AIC | 147.000 | 92.620 | 93.220 | 84.210 | 85.130 | 92.330 |
| BIC | 153.970 | 113.530 | 107.160 | 105.120 | 99.070 | 106.270 |
| Silhouette | 0.000 | 0.200 | 0.390 | 0.310 | 0.430 | 0.390 |
| Maximum diameter | NA | 4.541 | 5.181 | 4.541 | 4.541 | 5.327 |
| Minimum separation | NA | 1.091 | 2.127 | 1.579 | 1.599 | 1.591 |
| Pearson's γ | NA | 0.501 | 0.657 | 0.570 | 0.658 | 0.565 |
| Dunn index | NA | 0.240 | 0.410 | 0.348 | 0.352 | 0.299 |
| Entropy | NA | 1.030 | 0.647 | 1.089 | 0.688 | 0.647 |
| Calinski-Harabasz index | NA | 13.832 | 18.706 | 18.281 | 23.903 | 19.212 |
Table 10.
Normalized results of clustering performed with machine learning algorithms.
| Statistical Index | Density-Based Clustering | Fuzzy C-Means Clustering | Hierarchical Clustering | Model Based Clustering | K-Means Clustering | Random Forest Clustering |
| R^2 | 0.0 | 0.93 | 0.74 | 0.99 | 0.83 | 0.75 |
| AIC | 1.0 | 0.13 | 0.14 | 0.0 | 0.01 | 0.12 |
| BIC | 1.0 | 0.26 | 0.14 | 0.11 | 0.0 | 0.13 |
| Silhouette | 0.0 | 0.46 | 0.90 | 0.72 | 1.0 | 0.90 |
| Maximum Diameter | 0.0 | 0.85 | 0.97 | 0.85 | 0.85 | 1.0 |
| Minimum Separation | 0.0 | 0.51 | 1.0 | 0.74 | 0.75 | 0.74 |
| Pearson's γ | 0.0 | 0.76 | 0.99 | 0.86 | 1.0 | 0.85 |
| Dunn Index | 0.0 | 0.58 | 0.99 | 0.84 | 0.85 | 0.72 |
| Entropy | 0.0 | 0.94 | 0.59 | 1.0 | 0.63 | 0.59 |
| Calinski-Harabasz Index | 0.0 | 0.57 | 0.78 | 0.76 | 1.0 | 0.80 |
Table 11.
Value of the weights attributed to the statistical indicators.
| Criterion | Explanation | Weight Value |
| R^2 | Moderate importance for variance explained. | 0.10 |
| AIC | Penalizes models with higher complexity (lower AIC is better). | -0.15 |
| BIC | Penalizes models with higher complexity (lower BIC is better). | -0.15 |
| Silhouette Coefficient | High importance for cluster cohesion and separation. | 0.20 |
| Maximum Diameter | Penalizes large diameters to promote compact clusters. | -0.1 |
| Minimum Separation | Rewards higher separation between clusters. | 0.10 |
| Pearson's γ | Rewards better separation of inter/intra cluster distances. | 0.10 |
| Dunn Index | Promotes compact and well-separated clusters. | 0.1 |
| Entropy | Penalizes models with higher uncertainty (lower entropy is better). | -0.1 |
| Calinski-Harabasz Index | High importance for inter-cluster and intra-cluster variance ratio. | 0.2 |
Table 12.
Results of econometric estimates, statistics and tests.
| Fixed Effects. 375 observations. 20 cross-sectional units. Time-series length: minimum 17, maximum 19 | Random Effects. 375 observations. 20 cross-sectional units. Time-series length: minimum 17, maximum 19 | |||||
| Coefficient | Std. Error | t-ratio | Coefficient | Std. Error | z | |
| Costant | 46.5080*** | 5.28921 | 8.793 | 44.7160*** | 11.1681 | 4.004 |
| PTP | 31.5393*** | 3.86326 | 8.164 | 32.6285*** | 3.81796 | 8.546 |
| RI | -0.174213*** | 0.0601014 | −2.899 | -0.176330*** | 0.0599298 | −2.942 |
| IPS | -9.67995*** | 1.26902 | −7.628 | -9.57356*** | 1.26409 | −7.573 |
| CCE | -0.740930*** | 0.182690 | −4.056 | -0.702699*** | 0.181885 | −3.863 |
| MIG | -0.277999*** | 0.0913644 | −3.043 | -0.269195*** | 0.0911003 | −2.955 |
| RIU | 1.12366*** | 0.211900 | 5.303 | 1.11507*** | 0.211249 | 5.278 |
| MEOSF | 46.5080*** | 5.28921 | 8.793 | 44.7160*** | 11.1681 | 4.004 |
|
Statistics |
Mean dependent var | 55.30827 | Mean dependent var | 55.30827 | ||
| Sum squared resid | 212013.6 | Sum squared resid | 853960.8 | |||
| Log-likelihood | -1720.379 | Log-likelihood | -1981.611 | |||
| Schwarz criterion | 3594.859 | Schwarz criterion | 4004.710 | |||
| rho | 0.304440 | rho | 0.304440 | |||
| S.D. dependent var | 56.45687 | S.D. dependent var | 56.45687 | |||
| S.E. of regression | 24.64729 | S.E. of regression | 24.64729 | |||
| Akaike criterion | 3492.759 | Akaike criterion | 0.496327 | |||
| Hannan-Quinn | 3533.293 | Hannan-Quinn | 9.6e-115 | |||
| Durbin-Watson | 1.297997 | Durbin-Watson | 3492.759 | |||
| Tests | Joint test on named regressors - Test statistic: F(6, 349) = 57.3183 with p-value = P(F(6, 349) > 57.3183) = 4.0877e-49 |
'Between' variance = 1819.36 'Within' variance = 565.37 mean theta = 0.872262 Joint test on named regressors - Asymptotic test statistic: Chi-square(6) = 348.915 with p-value = 2.63859e-72 |
||||
| Test for differing group intercepts - Null hypothesis: The groups have a common intercept Test statistic: F(19, 349) = 43.4951 with p-value = P(F(19, 349) > 43.4951) = 5.76937e-80 |
Breusch-Pagan test - Null hypothesis: Variance of the unit-specific error = 0 Asymptotic test statistic: Chi-square(1) = 1100.96 with p-value = 2.03784e-241 |
|||||
| Hausman test - Null hypothesis: GLS estimates are consistent Asymptotic test statistic: Chi-square(6) = 15.9175 with p-value = 0.0142035 |
||||||
Disclaimer/Publisher’s Note: The statements, opinions and data contained in all publications are solely those of the individual author(s) and contributor(s) and not of MDPI and/or the editor(s). MDPI and/or the editor(s) disclaim responsibility for any injury to people or property resulting from any ideas, methods, instructions or products referred to in the content. |
© 2024 by the authors. Licensee MDPI, Basel, Switzerland. This article is an open access article distributed under the terms and conditions of the Creative Commons Attribution (CC BY) license (http://creativecommons.org/licenses/by/4.0/).
Copyright: This open access article is published under a Creative Commons CC BY 4.0 license, which permit the free download, distribution, and reuse, provided that the author and preprint are cited in any reuse.


