Preprint
Article

This version is not peer-reviewed.

The Influence of the Nutritional and Mineral Composition of Vegetable Protein Concentrates on Their Functional Properties

A peer-reviewed article of this preprint also exists.

Submitted:

23 December 2024

Posted:

24 December 2024

You are already at the latest version

Abstract

Vegetable proteins derived from legumes, cereals or pseudocereals have increased in popularity in recent years, becoming very interesting for the food industry. In addition to their nutritional interest, these products have techno-functional properties that allow them to be used in the production of a wide variety of foods. This research has studied the nutritional and mineral composition of 12 samples of rice, pea and soy concentrates. The objective was to investigate the influence of this nutritional composition, mainly mineral components, on the techno-functional properties (water and oil binding capacity, swelling, emulsifying, gelling and foaming capacities) of these concentrates. For this purpose, a Pearson correlation matrix and a GH biplot method have been applied. The results showed that there is a correlation between mineral content and functional properties. Mg, K and Ca were positively correlated with protein solubility index, oil absorption capacity and swelling capacity. Na and P contents are positively related to water absorption capacity and emulsifying capacity. Gelling capacity was positively correlated with Mg contents and negatively correlated with Cu and Fe contents. The preliminary results reported in this study highlight the necessity to further assess the influence of non-protein components on the techno-functionality of protein concentrates.

Keywords: 
;  ;  ;  ;  ;  ;  

1. Introduction

The increasing demand for sustainable and plant-based protein options has propelled vegetable proteins into the spotlight thanks to their exceptional nutritional composition, functional properties, and potential health advantages [1]. Vegetable Protein Concentrates (VPC) are products derived from plant sources that have been processed to increase their protein content. The protein content of VPCs can range from 40% to 90% by dry weight, these percentages vary depending on the processing methods employed as well as the plant source [2]. These products generally have a favorable proximate composition, characterized not only by its high protein content, but also by its low levels of fat and the presence of bioactive compounds, which occur naturally in plant sources and are associated with potential health benefits [3]. In addition, they exhibit functional properties such as water- and oil-holding capacity, swelling capacity, foam formation and/or gelling, these functional properties allow the application of vegetable proteins for the development of new products, replacing totally or partially animal proteins [4].
Among the plants most commonly used to obtain VCP are legumes, cereals, and pseudocereals [5]. One of the best known and most widely applied sources of vegetable protein in the food industry is soyabean. Its composition shows elevated levels of cysteine, methionine, and tryptophan and high content of minerals such as zinc, iron and copper [6]. From a nutritional point of view, the partial substitution of wheat by soy increased the protein content and improved the nutritional value of foods [7]. This replacement enriches the amino acid profile of the final products, particularly by covering lysine and tryptophan deficiencies in cereals [8]. Soybean protein applications include bakery products, snacks, bars, and beverages [9] and their incorporation into corn tortillas [8]. Other applications of soy proteins are the production of miso, cheese, tofu and meat-like vegetarian products [10].
In addition, VCP from legumes are gaining popularity in the food industry due to their richness in essential amino acids and their competitive price [11]. In recent years there have seen increasing interest in pea proteins due to their sustainability, low allergenicity, and balanced amino acid profile [12]. These proteins are being widely used in the food industry to manufacture protein bars, gluten-free confectionery and bakery products, pasta and even as a substitute for egg proteins in mayonnaise [3].
Some cereals such as rice are other important vegetal sources of protein. Rice protein shows high nutritional value and hypoallergenic properties and has been described as higher quality than wheat and maize [13]. Industrial applications of rice protein concentrates include their use in bakery and biscuit products, the production of alternative beverages for children with cow's milk allergies, in the development of supplements for athletes [14] and in the production of products for infants and the elderly [15].
The composition and functional properties of VPC are influenced by the raw material used [16], but also by the production process employed [17]. This results in the fact that different commercial brands, even obtained from the same raw material, can differ significantly [18]. For this reason, the industries must face the challenge of optimizing their production processes whenever they change suppliers. In this context, the present work tries to evaluate the relationships between the physico-chemical composition of protein concentrates and their techno-functional behavior. For this purpose, linear correlations, through a correlation matrix, as well as the effectiveness of multivariate GH biplot techniques were tested as a tool to evaluate the links between composition and functionality.

2. Materials and Methods

2.1. Materials

A total of 12 samples corresponding to six commercial brands of protein concentrate, two soybean (Glycina maxima), two pea (Pisum sativum) and two rice (Oryza sativa) were analyzed. Samples were purchased through online shops. Each commercial brand was purchased twice, 6 months in between, in order to account for production variability. To avoid conflicts of interest the brands have not been identified, instead they have been named Brand 1 and Brand 2.

2.2. Proximate Composition

To determine the nutritional composition of the samples, the methods described in Absi et al. [18] were applied. The parameters analysed were moisture, fat, protein, fiber, starch, ash and carbohydrates. The Soxhlet method was used for fat determination using petroleum ether. Protein content (N × 6.25) was determined by the Kjeldahl method and ash was determined by incinerating at 550±10°C. Dietary fiber was analysed using ANKOM equipment (ANKOM Technology, New York, USA). Starch content was analysed by enzymatic method and moisture content by gravimetric method. Total carbohydrates were calculated by difference, and the amount of energy provided was calculated considering that protein and carbohydrates contribute 4 kcal/g, and fat 9 kcal/g. All determinations were carried out in triplicate. Results were expressed in g/100 g dry weight (dw).

2.3. Mineral Analysis

Mineral composition was analyzed by inductively coupled plasma mass spectrometry (ICP-MS). A microwave pre-digestion with HNO3 was performed using 0.2 g of sample. The analysis was carried out with an Agilent 7800 ICP mass spectrometer (Santa Clara, CA, USA) according to the method previously described by Absi et al. [18]. Certified standard solutions (1g/L) were used for quantification and results were expressed in ppm or ppb depending on the mineral.

2.4. Physicochemical Parameters

The water activity (aw) of the samples was determined in triplicate using the Novasina AW Sprint TH500 equipment (Switzerland). Color determination was carried out using a MiniScan XE Plus (Hunterlab, Reston, VA, USA), with a D65 illuminant and a 10° standard observer. The color parameters L*, a* and b* were recorded. The analysis was performed in nine replicates for each sample.

2.5. Techno-Functional Properties

2.5.1. Water Holding Capacity, Oil Holding Capacity, and Water Solubility Index

The methods described by Rodríguez-Miranda et al. [19] was used. For WHC determination, the sample (0.5 g) was mixed with 10 ml of distilled water and vortexed for 30 seconds. After 24 hours of standing at room temperature the sample was centrifuged for 20 minutes at 3000 rpm in a Sigma 4K 15C centrifuge (Darmstadt, Germany). The supernatant was discarded, and the weight of the moist sample was determined. The analysis was performed in triplicate and the results were expressed as g/g. A similar procedure was used for the determination of the oil retention capacity, where 0.4 g of sample was mixed with 5 ml of olive oil and vortexed. After storage and centrifugation, as described for WHC, the sample weight was determined after removal of the supernatant. The results were expressed in g/g and the analysis was performed in triplicate. The water solubility index (WSI) was determined with a portable refractometer ZUZI 300 (Barcelona, Spain) in the supernatant obtained in the WHC determination. The analysis was performed in triplicate and the results were expressed in ºBrix.

2.5.2. Swelling Capacity

The swelling capacity (SC) was determined following the method described by Akpata and Miachi [20] with some modifications. The sample (0.5 g) was mixed with distilled water (5 ml) and vortexed for 1 minute. After storage for 24 hours at room temperature the final volume of the sample was determined. The analysis was carried out in triplicate. The results were expressed as volume increase per gram of sample.

2.5.3. Foaming Capacity

The method proposed by Chau et al. [21] was used to determine the foaming capacity (FC) with some modifications. For this purpose, an ULTRA-TURRAX T 25 basic homogenizer (IKA-WERKE, Germany) was used, and the sample (5g) was stirred (19000rpm, 2 min) together with 100 ml of distilled water. The stability of the foam formed (FS) was determined from the foam remaining after 5 min at room temperature. In both FC and FS, the height of the foam was determined, and the result was expressed as a percentage. All analyses were carried out in triplicate.

2.5.4. Gel Formation

Gel formation was evaluated from the hardness of the gel produced by the sample following the method described by Tomé et al. [22]. The gel was formed by mixing the sample (6g) with sodium chloride (3g) and distilled water (30ml). The samples were subjected to heating 90°C for 30 minutes and subsequently refrigerated for 24 hours prior to texture determination. A penetration test with a 10 mm probe was performed in a Texture Analyzer TX-T2iplus (Stable Micro Systems, Surrey, UK) with a 5 kg load cell at 20ºC. A distance penetration of 8 mm and a crosshead speed of 1 mm/s were used. The mean maximum force from three replicates was recorded.

2.5.5. Emulsifying Activity and Its Stability

The emulsifying activity (EC) and stability (ES) were determined using the methodology described by Bora [23]. For the determination of the EC, the sample (2.25 g) was dissolved in 150 ml of distilled water. The mixture was then homogenized with 10 ml of sunflower oil at 13,000 rpm for 1 minute using an Ultraturrax (ULTRA-TURRAX T 25 basic, IKA-WERKE, Germany). The resulting emulsions were centrifuged (Sigma-Aldrich 4K15C, Darmstadt, Germany) at 1,500 rpm for 5 minutes at a temperature of 15°C. The ES was determined after heating the sample at 80°C for 30 minutes and then subjecting them to centrifugation under the same conditions. The EE and ES were expressed as a percentage and were determined in triplicate.

2.6. Statistical Analysis

Variations between samples were evaluated using one-way analysis of variance, followed by Tukey's significant difference post hoc. The data were analysed using IBM SPSS Statistics (version 27). The correlations between the different physicochemical parameters and the techno-functional properties of the different VCPs analyzed were studied using a Pearson two-tailed significance correlation. Finally, the multi-parametric GH-biplot method has been used to describe the relationships between protein concentrates of different raw materials and the physicochemical and techno-functional variables analyzed. GH-biplot is a method of graphical representation of multivariate data in which the axes composing the reference system are the Principal Components of the indicator space [24]. A free application R package MULTBIPLOT program package (MULTivariate analysis using BIPLOT) developed by Vicente-Villardón [25] was used for statistical analysis.

3. Results

3.1. Proximate Composition

The proximate composition and content of rice, pea and soy protein concentrates are shown in Table 1. The moisture content of all the samples was low, ranging from 4.3% to 7.2%, with pea concentrates showing the highest moisture content, regardless of the commercial brand. In all the samples, protein accounted for between 84 and 89%/dw of their composition, with soybean concentrates having the highest contents and pea concentrates the lowest. The fat content varied between 9.3% (pea) and 2.6% (soybean), these values are lower in all cases than the fat content of the raw materials from which they are derived. Carbohydrates are present in low concentrations, however, one of the commercial brands of rice has a content of 7.36%, being this sample that presented the lowest ash content. The starch concentrations found ranged from 0.9% to 2.0%, while the fiber and sugar contents of all samples were below the detection limit. Soybean concentrates had the lowest energy content due to their low fat content.
Regarding moisture content, values obtained are within the ranges described for VCPs in bibliography varying between 2.25% [14,17] and 17.03% [26]. According to Mondor et al. [27], protein concentrates have a protein content comprised between 65-90% w/w on a dry basis, while for contents higher than 90% w/w the denomination used is protein isolates. Based on these classifications, the products analyzed in this research can be considered protein concentrates, with a high protein content, above 84% w/w in all of them. However, a large variability is found in protein concentration in VCPs in literature. Thus, for rice protein, concentrations between 67% [26,28] and 83.57% [17] have been described. While for pea protein the described range is much wider being between 48.5 % and 82.0% [22,29]. In the case of soybean, higher amounts of protein have been described, thus Zhao et al. [30] reported a protein content of 86.36%, while Foh et al. [31] found amounts of 88.66%.
Fat contents also show a great variability, values between 0.36% and 2.0% have been described for in VCP [17,22,29,31]. The fat content of this type of compound is related to the defatting process to which they are subjected, the results obtained in the samples analyzed seem to indicate a partial defatting of the same as they still retain high fat contents, particularly in the case of rice concentrate.
Ash content was found similar to the values described by Zhao and Boatright [17] (0.96% to 2.31%), Amagliani et al. [14] (2.35 to 9.55%), Reda et al. [28] (2.5%) and Guroy et al. [26] 4.78 %. Similarly, a wide range of fiber (0.72 and 2.02%), starch (0.39 to 6.50 %) and carbohydrate (9.03 to 16.2%) contents have been described for this type of product [14,26]. For all the protein concentrates analyzed, there are significant differences (p<0.05) between the brands of each sample. The biggest differences were found between the soybean and rice protein brands in relation to moisture and carbohydrate content. The variability found in the parameters studied is related to different raw material factors such as genetic background, annual climatic conditions, and crop location, as well as the interaction between these [32]. Besides this, factors related to the process of obtaining the concentrates also have a great influence on its final composition [33] (Mondor et al., 2009).

3.2. Mineral Content

Fourteen minerals, including macroelements (Sodium, Magnesium, Phosphorus, Potassium, and Calcium), microelements (Manganese, Iron, Copper, Zinc, Chromium, Selenium, Nickel), and trace toxic elements (Cadmium, and Lead) have been analyzed in rice, pea and soybean proteins samples (Table 2). The highest concentration of minerals in all the analyzed VPCs was found for the macroelements Na, P, and Ca. Pea and soybean concentrates show Na as the most abundant mineral, followed by P and Ca. In the case of rice concentrates, P is the most abundant mineral. All these minerals showed significant differences between the two commercial brands.
In relation to micronutrients, Fe is the one found in the highest concentration in the samples analysed, followed by Zn. The Fe concentrations were higher than 80 ppm in all concentrates, highlighting the high concentrations found in pea concentrates. For all concentrates, significant differences were observed between both commercial brands, being particularly striking in the case of rice concentrates where the Fe content was double in one of the commercial brands. Regarding other micronutrient contents, the concentrations of Se and Ni stand out, with a high concentration of Ni present in the soybean concentrates. For these minerals, the differences found between commercial brands are greater than those found for macronutrients, as well as the differences between batches of the same commercial brand. Cd was not found in any of the samples analysed and Pb was only found in one of the samples corresponding to a commercial brand of rice concentrates.
The legume concentrates (soybean and pea) showed the highest concentration of macroelements, which contributed to their higher ash values (Table 1). In relation to microelements, pea concentrates presented the highest concentration, only the Ni content was higher in soybean concentrates. The greatest differences between commercial brands are found in the micronutrient composition of rice concentrates, mainly due to variations in Ni and Cr content.
Similar mineral contents have been described for soy protein concentrates with K and P being the most abundant minerals [34]. Karr-lilienthal et al. [35] found P to be the major mineral in soybean concentrates with high concentrations of K and Ca. Also, in rice concentrates P has been described as the major mineral with important concentrations of K and Ca [36]. For pea concentrates P, K and Mn have been described as the major minerals, with important Ca contents as well [37]. Large differences have been described between concentrates in the Na and K content, which could be related to the incorporation of NaOH or KOH to adjust the pH during the enzymatic hydrolysis reaction in the production of protein concentrates [36]. Regarding micronutrients, previous studies agree with our results, finding that iron is the major micronutrient in rice [17] and soybean [34] concentrates.
Several factors could explain the differences found in the mineral composition of VPCs between commercial brands and/or production batches. Firstly, the cultivar used to obtain the concentrate will influence its mineral content [38]. On the other hand, many minerals are incorporated into grains depending on the available mineral concentration found in the soil, so the mineral content of the soil and/or its availability in plant tissues also influence the mineral content of concentrates [39]. Karr-Lilienthal et al. [35] observed, in soybean concentrates, a great difference in the contents of micronutrients and trace elements depending on the country of origin of the concentrate, attributing these differences to the mineral composition of the soils. In addition, the production process of the protein concentrate could influence the final concentration of minerals [40]. Thus, an effect of Fe and Mn concentration attributed to the process of obtaining rice concentrates has been described [17] and differences in the contents of Cu, Co, Mn and Ni due to the process of obtaining pea concentrates has been also reported [41]. In addition, processes such as air sorting have been shown to have an important influence on the mineral concentrations of protein concentrates [42,43].

3.3. Techno Functional Properties

The behaviour of protein concentrates during preparation, processing, storage and consumption of the foods in which they are incorporated is determined by their functionality. This functionality is influenced by the raw material the concentrate comes from, the protein concentration and the technological extraction process itself [44]. In this study, surface properties such as protein solubility, foaming capacity, emulsifying capacity and liquid binding capacity were analysed. In relation to the hydrodynamic properties, the gelling capacity was determined. The results obtained are shown in Table 3.
The rice concentrates show the lowest values for water holding capacity (WHC), oil holding capacity (OHC) and water solubility index (WSI). Soybean and pea concentrates show similar values for WHC and OHC, however, WSI is significantly higher for soybean concentrates. Differences between commercial brands can also be observed for these properties in the case of soybean concentrates. WHC and OHC properties measure the amount of water or oil that can be retained per unit mass, while WSI determines the soluble solids, measured as °Brix, that remain in the aqueous phase. The soluble solids measured in the aqueous phase are mainly protein, but other hydrophilic compounds present would also be measured so this parameter is closely related to the chemical composition of the concentrate [42].
Swelling capacity (SC) refers to the amount of space taken up by a specific quantity of hydrated protein [45]. The results obtained (Table 3) show that soybean concentrates have the highest SC followed by pea, with the values for rice concentrates being significantly lower. However, for the foaming capacity (FC), soybean concentrates have the lowest capacity. The rice concentrate, in addition to having a higher FC, also has a higher foam stability (FS). The FC describes the amount of interfacial area that proteins are able to stabilise per unit weight [14]. The lower foaming capacity and stability of soybean may be related to its nutritional composition (Table 2) because the presence of high lipid content seems to inhibit the ability of protein to form and stabilise foam and on the contrary, starch has a positive impact on foaming properties due to its ability to stabilise foam [46]. The emulsifying capacity (EC) shows no differences between concentrates and for emulsion stability (ES) rice concentrates seem to have a higher stability. The EC is defined as the volume of the emulsified layer after a centrifugation of the emulsion, while emulsion stability (ES) is a measure of the emulsion stability over a certain time [44]. The presence of non-protein components, such as fibre, have been described as factors with a positive effect on ES [47]. All these properties are strongly influenced by pH, in our case the determination of these properties has been carried out at the native pH of the concentrates which had a pH value of pH ≈7.
Regarding gelation, statistically significant differences in the hardness of the gels formed at pH 5 can be observed with soybean concentrates forming the hardest gels followed by pea. The gels of the rice concentrates were much less hard, showing differences between the two commercial brands. Gelation involves the transition from a liquid to a solid state, characterised by a three-dimensional matrix in which the liquid phase is retained. Gel formation requires proteins to denature and unfold to form a network capable of retaining water molecules [44]. The gelation capacity is closely related to the protein content, but other components present can influence this property, so the starch and lipid content negatively affect gelation [46]. Regarding starch, no significant differences were observed between the concentrates (Table 1), however, soybean concentrates showed the lowest fat content, which could explain the higher hardness of the gel formed. The EC, FC and gelling properties are influenced by the water solubility of the proteins [48]. This solubility is in turn influenced by the botanical origin, by the presence of other compounds such as polyphenols and by the extraction method employed [49].
In addition to the functional properties, the parameters water activity (aw) and colour (L, a* and b*) were also determined (Table 3). The aw was found to be between 0.3-0.4 for all concentrates, with the exception of soy brand 2, which showed values of 0.134. Significant differences were observed for this parameter depending on the raw material, but also between the commercial brands. Regarding colour, all the concentrates showed high L values (>70) and positive a* and b* values, indicating that their colour is light and tends to red and yellow. The highest values for these two parameters are observed for the pea concentrates. Significant differences for the colour parameters both between raw materials and between commercial brands are observed.
As pointed out by de Angelis et al.,[44] the comparison of properties in different studies is very complicated as it depends on the methodologies used for their determination. However, some comparisons can be carried out, such as for the rice concentrates similar results have been described by Amagliani et al. [14], for OHC and EC properties, stating that the low surface hydrophobicity of rice concentrates would be the reason for these results as it would cause weak interactions between proteins and oil [50]. Regarding the foam formation values, the results obtained in our work are lower than the FC (116%) and FS (98%) values described by Zhao et al. [30]. For pulses, the functional properties of concentrates vary depending on the legume from which they are derived [51], thus peas have been shown to have a higher FC than other legumes [49]. Soybean has been described as having a good EC and a good FC [9]. However, our results show that there were no significant differences in EC with respect to other concentrates, presenting a low FC value. In relation to pea, good EC, FC WHC and OHC have been described [52], with a weaker gel texture compared to soy proteins [40], which would be consistent with the results found in our samples.
As already noted, the physicochemical composition of protein concentrates significantly influences their techno-functional properties, factors such as protein purity or the presence of compounds other than the protein itself influence these properties. The source of the protein (animal or plant) and its intrinsic characteristics also play a crucial role. Legume proteins have a low proportion of hydrophilic amino acids with a compact structure that limits their solubility and emulsifying capacity [53]. In contrast, animal proteins, such as whey, due to their globular structure and higher sulphur content exhibit good gelation [54]. The higher soluble protein content improves the ability to form and stabilise emulsions and foams, while the presence of residual polysaccharides can affect the viscosity and gelling properties of the concentrates [55]. The stabilisation of emulsions is enhanced by the presence of non-protein components such as dietary fibres [47]. Foaming capacity is positively influenced by the presence of high contents of albumin-like protein [56] and starch [47], while the presence of lipids can negatively influence this property [46]. The mineral content, in combination with low molecular weight peptides and amino acids has been shown to have an impact on the thermomechanical behaviour in the extrusion process [57]. Additionally, the chemical or physical modifications during the production processes also affect the techno functional behaviour. As such, protein solubility is negatively affected by processing conditions such as heating or an acidic or alkaline environment while the ability to bind water is enhanced when using wet-extraction technologies [58]. Hydrodynamic properties are also affected by the production process, with the strongest gels being obtained when using wet-extracted processes [59]. In addition, it has been found that enzymatic hydrolysis or conjugation with polysaccharides can improve some techno-functional properties of protein concentrates [60,61].

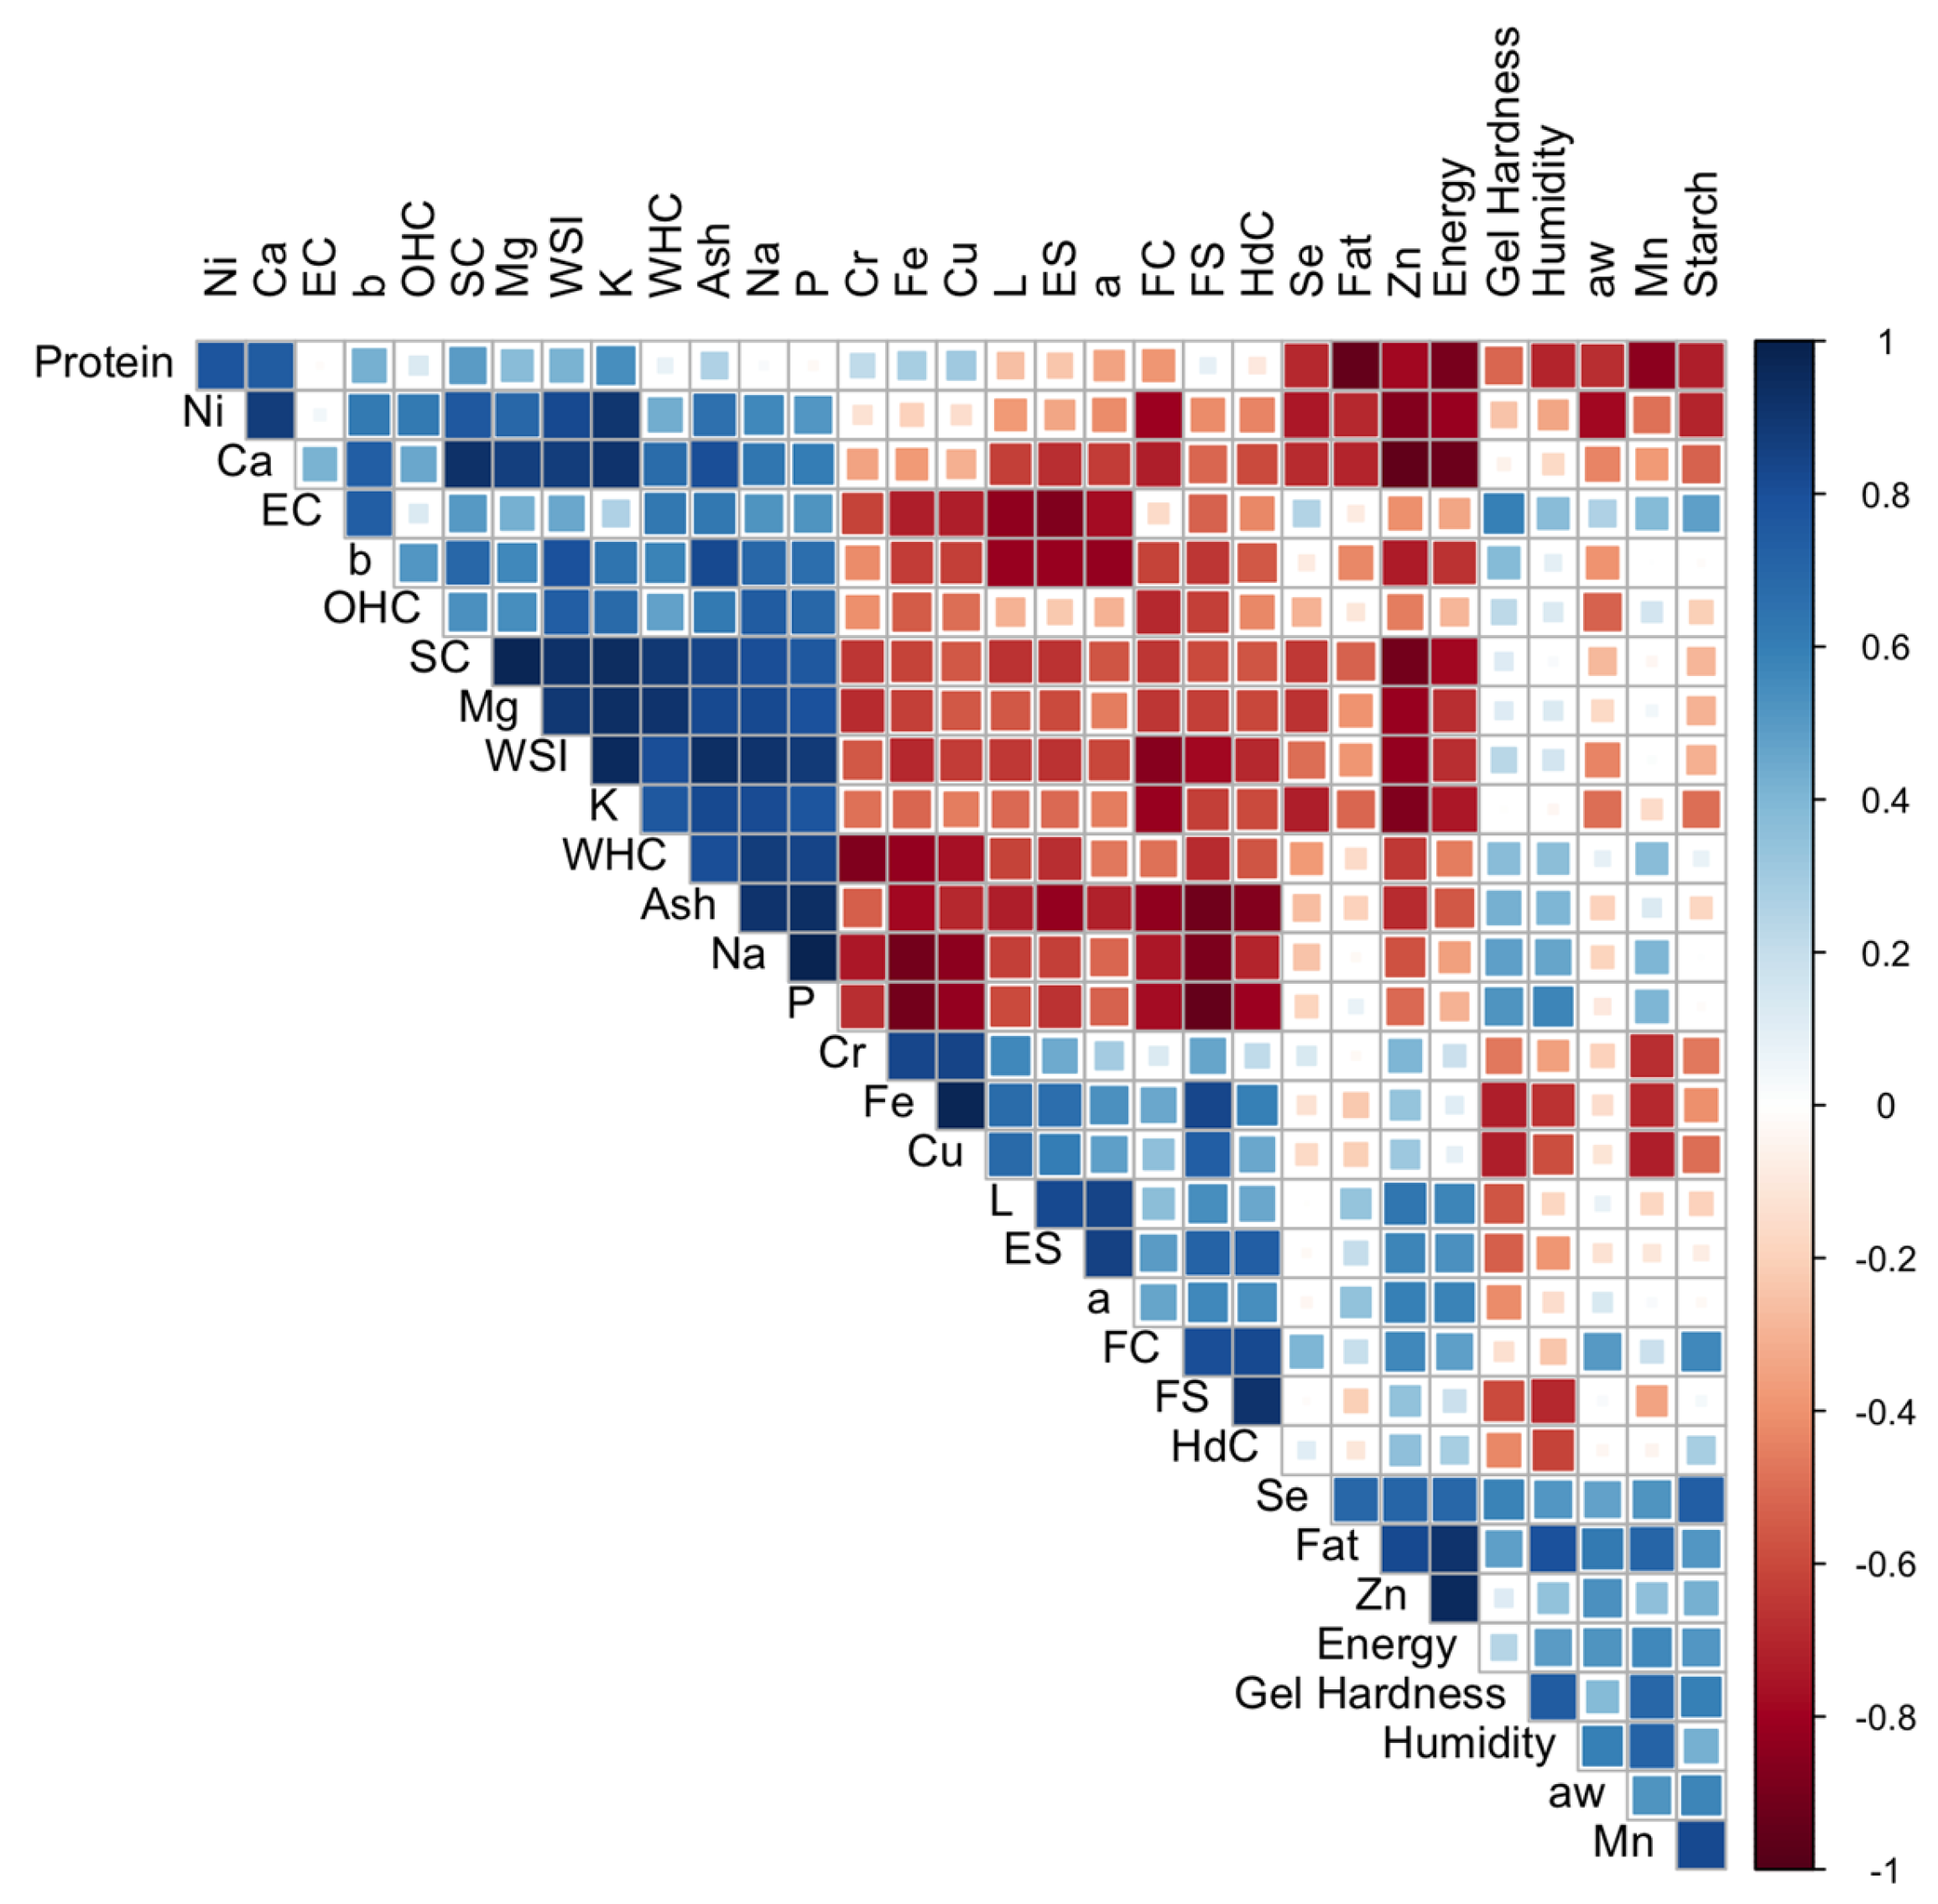
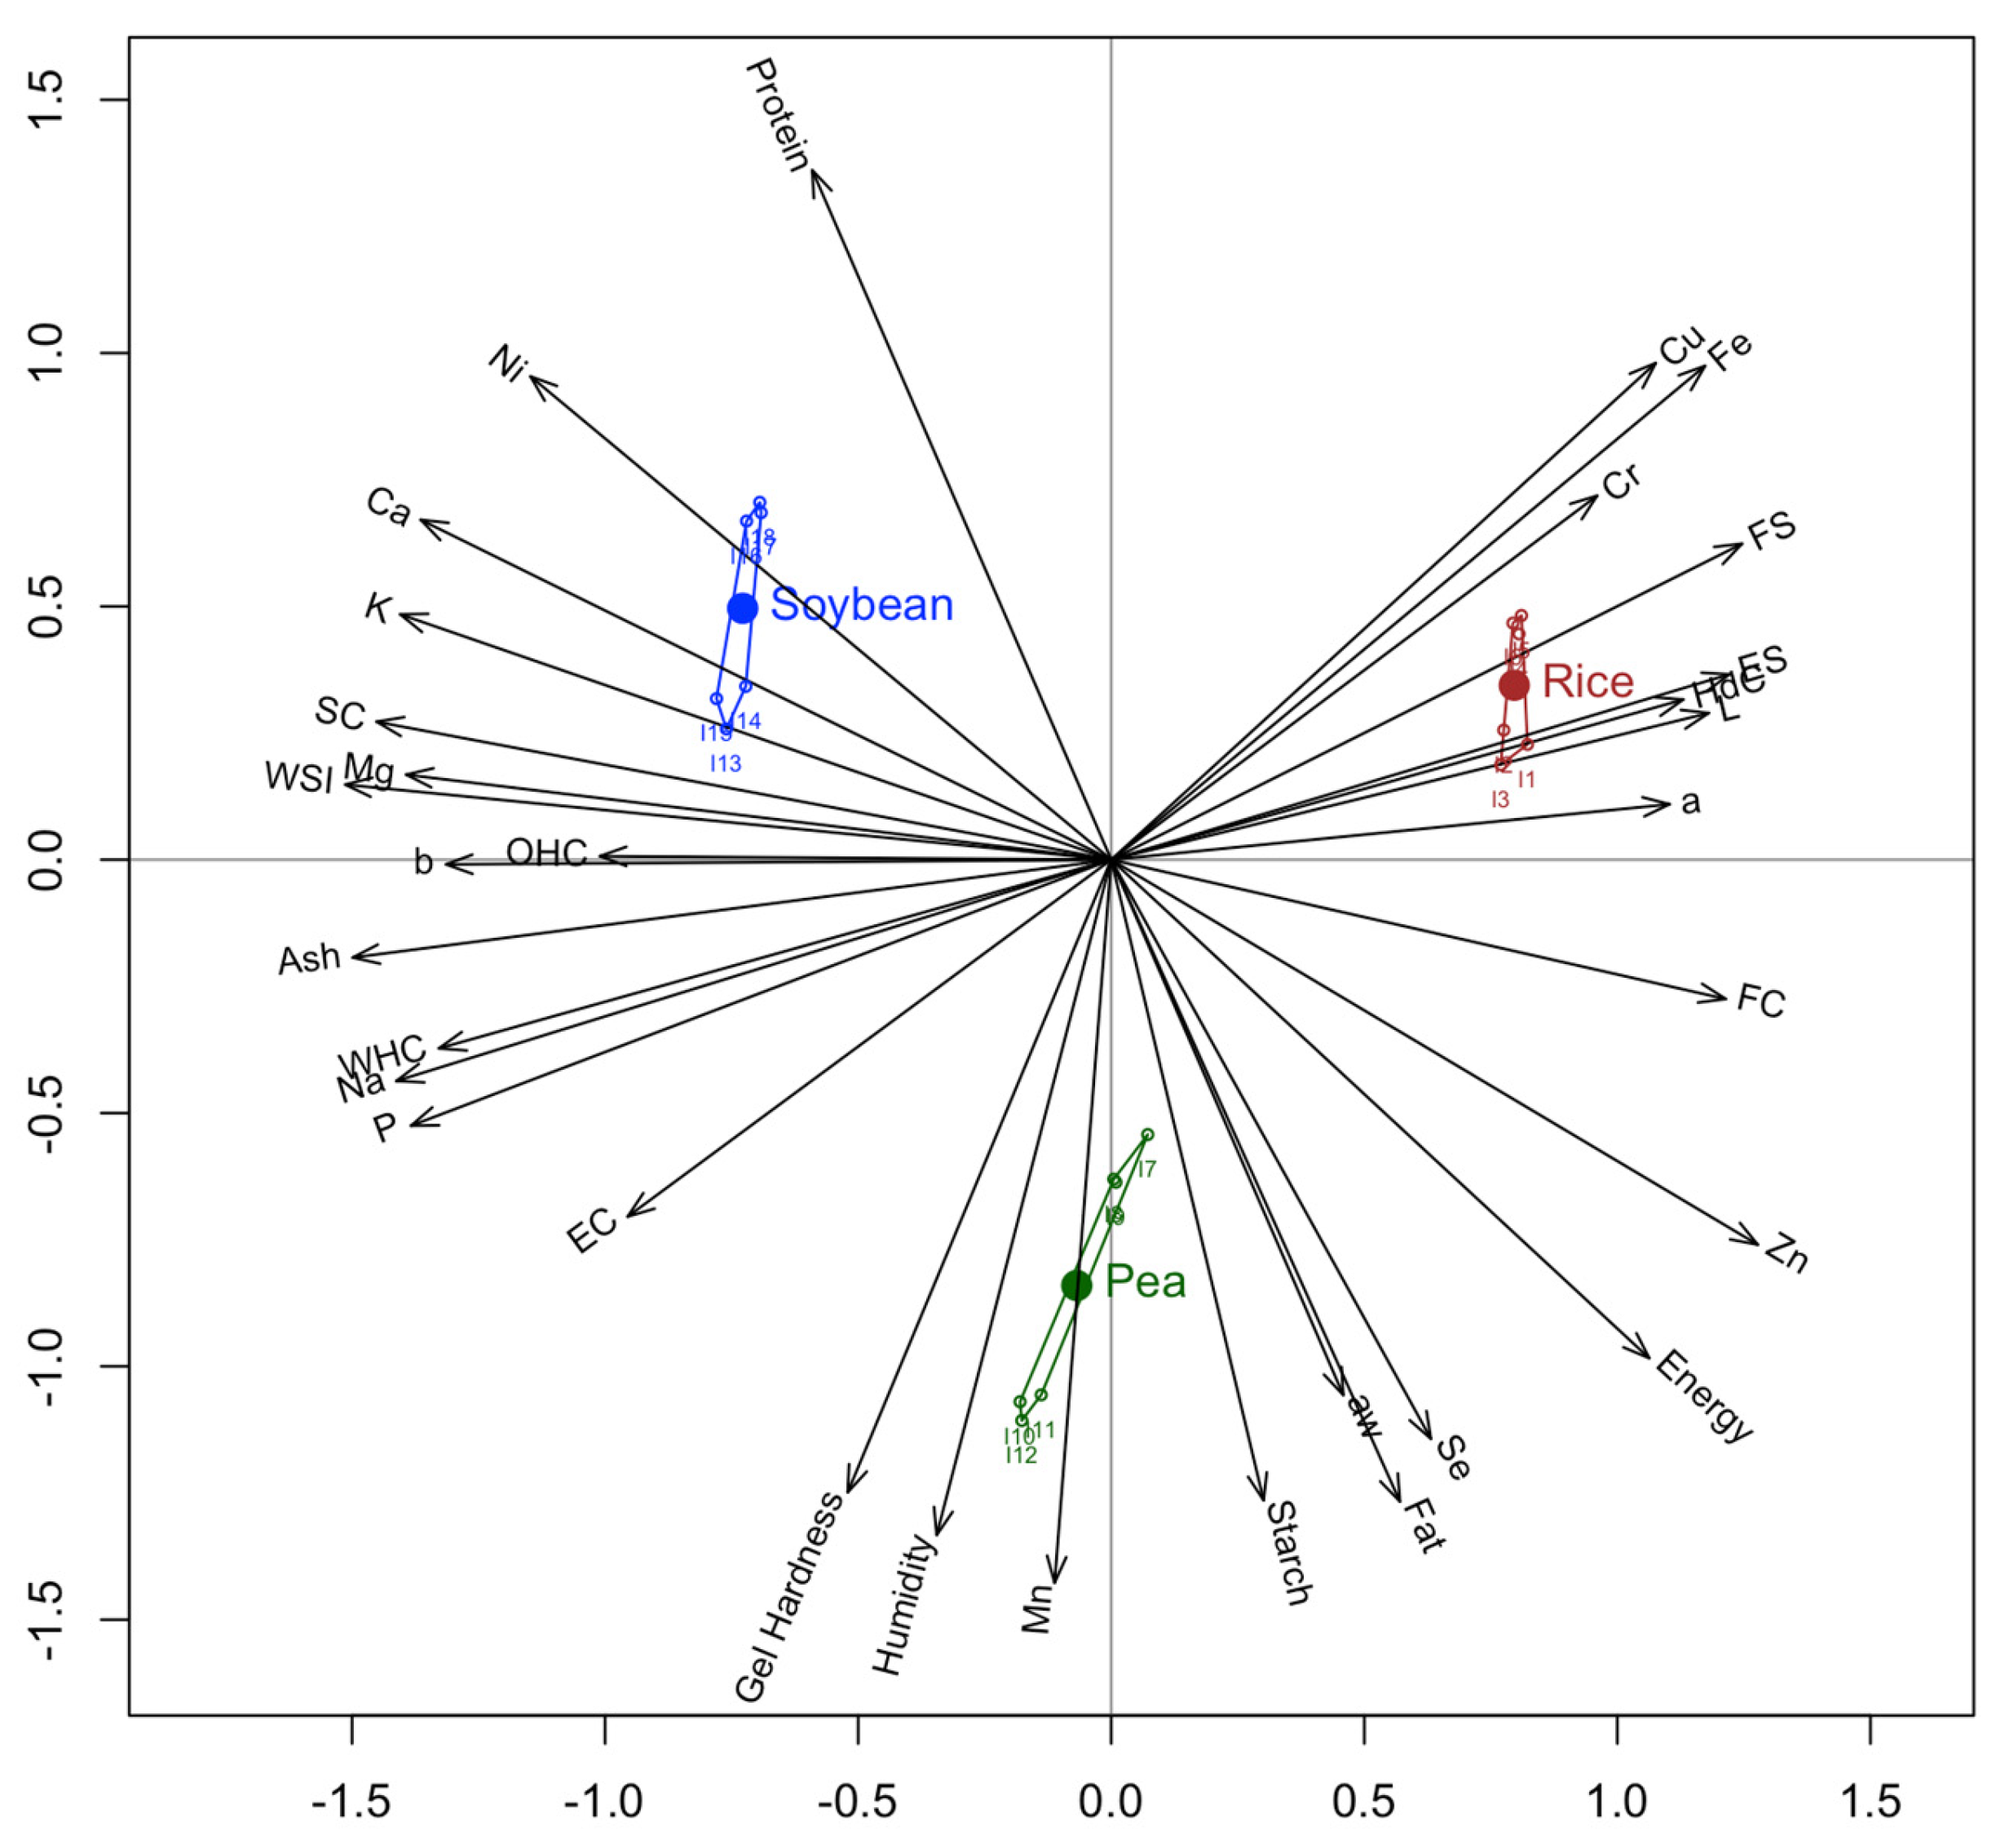
3.4. Correlations Between Physicochemical and Functional Parameters

A pair-wise correlation analysis was conducted to investigate the interaction between physicochemical parameters and techno-functional properties of soybean, rice and pea protein concentrates (Figure 1). Regarding the correlations between the mineral compounds, high significant correlations were observed between several minerals, being positive for K with Mg (0.93) and Ca (0.91), and among Fe with Cu (0.97), and negative in the case of Fe with Na (-0.90) and P (-0.90) and Zn with Ca (-0.95). Significant correlations between 0.8 and 0.9 were also found, both positive and negative, mainly for Ca and Mg with several macro and microelements (Figure 1). Correlations between different minerals have already been highlighted in some concentrates, thus in rice protein concentrates a positive correlation between iron and magnesium content has been described [17].
Regarding the correlations between the mineral composition and the techno-functional properties, it can be observed that the Na and Mg contents are significantly correlated, in a positive way, with almost all the functional properties of the concentrates, except with the emulsifying capacity and gelling. In the case of Mg, there is also no significant correlation with OHC. The highest correlations are observed for WHC with Mg (0.91), SC with Mg (0.97), K (0.94) and Ca (0.92) and WSI with Na (0.91) and K (0.95). Emulsifying capacity and gelling capacity only correlate with Fe and Cu contents (-0.72 for both minerals). Significant negative correlations were also observed between Zn content and SC (-0.90) and P content and FS (-0.94). As noted previously, the techno-functional properties are influenced by the composition of protein concentrates, the minerals belong to the group of so-called antitechnological factors (ATFs), due to its interaction with proteins [62]. According to our results, emulsifying capacity, gelation, FC and SC have shown a negative correlation with some of the minerals analysed. However, the correlation between the macroelements in the concentrates and the techno-functional properties was positive for most of these properties, with the SC and WSI properties standing out.
In relation to the correlations between the different techno functional properties, there are significant positive correlations between the properties WSI and WHC, SC and OHC and a negative correlation with FC. The WHC and SC are properties that are closely related to protein solubility, so it is reasonable that they are correlated with WSI. The colour parameters correlate significantly with the EC and Es properties and the b parameter also with WSI (0.79). In addition, the FS property is positively related to FC and ES. The good correlation between these properties may be due to the fact that the formation and stability of foams and emulsions is closely related to hydrophobic interactions which are favoured by the amount of hydrophobic amino acids in the concentrate, this would also explain the negative correlation with WSI since these amino acids reduce the interactions with water interfering in its solubility [63]. A relationship between WSI with other properties such as EC, FC and gelation has been previously reported [64].
In order to evaluate linear relationships or links between variables different from those provided by the usual studies of correlation coefficients, it was decided to apply the multivariate technique GH biplot. Biplots are graphical techniques that allow the visual identification of real associations between variables which have proven to be suitable for the study of compositional variables in food [65]. This method allows us to project the original data onto a lower dimensional subspace, so that most of the variability can be captured. The main difference of biplot methods compared to a traditional PCA is that it allows us to represent both variables and samples. Among the biplot methods, the GH biplot is characterized by the fact that it achieves a high-quality representation of the variables [66].
Figure 2 shows the representation of the 1-2 factorial plane resulting from the GH-Biplot diagram, which explains 78.1% of the variance. The physicochemical and technofunctional variables are represented as vectors and the protein concentrates as points. The length of the vector will be related to the standard deviation and the cosine of the angle between two vectors indicates the correlation between the variables.
A clear segregation between the protein concentrates analyzed as a function of the raw material can be shown in Figure 2. The principal component PC1, which explains 51.4% of the variance, allows us to differentiate between rice concentrates with positive values on this axis and soybean concentrates with negative values. The greatest contribution to this axis corresponds to techno-functional properties and minerals. The functional properties are mainly those related to protein solubility such as SC, WSI and WHC, and all minerals have a great weight in this axis except Mn and Se. The PC2, which explains 26.7% of the variance, allows us to differentiate the pea concentrates with negative values from the soybean and rice concentrates with positive values on this axis. The greatest contribution to this axis corresponds to nutritional composition parameters such as protein, starch and fat; for minerals, the Mn has a great contribution, and regarding functional properties, gelling stands out. Considering the vectors that are closer to the concentrates, it should be noted that in terms of minerals, rice concentrates are located near the Cu and Fe vectors, soybean concentrates are located near the Ca, K, Ni and Mg vectors, and pea concentrates are located near the Mn vectors. Regarding the techno-functional properties, rice concentrates are close to the FS and EC vectors, soybean concentrates are close to the SC and WSI vectors, and pea concentrates are close to the gelling vector. Finally, in terms of nutritional composition, soybean concentrates are close to the protein vector and pea concentrates to the fat, moisture and starch vectors. These results are in agreement with the results discussed from the data collected in Table 1, Table 2 and Table 3.
Another interesting information that can be obtained from Figure 2 is the correlation that exists between the variables. The angles between the vectors approximate the correlations between variables in such a way that small acute angles are associated with variables that are strongly positively correlated, obtuse angles close to 180° with variables that are strongly negatively correlated, and right angles with uncorrelated variables [65]. Following this approach, the correlations that can be seen in Figure 2 support the results already discussed from Pearson's correlation. In this way it is observed that Mg, K and Ca contents are positively related to WSI, OHC and SC properties and negatively related to FC. Meanwhile, Na and P contents are positively related to WHC and EC and negatively related to ES and FS. In addition, the Cu and Fe contents are positively related to FS and ES properties and negatively related to EC and gelling, while Mn is related to gelling. Considering the acute angles found, the strongest positive correlations occur in the case of Mg/WSI and Na/WHC.
Most of the studies carried out have focused on studying the influence of extraction methods on technofunctional properties. The influence on technofunctional properties of the presence of compounds such as polysaccharides, alkaloids, phenolic compounds or phytates has also been addressed [64]. Kohnhorst et al. [67] suggested that gelation capacity depends not only on the protein concentration, but also on the non-protein components present in the concentrates. In spite of this, there is hardly any information on the relationship between minerals and these properties in protein concentrates. Based on the results obtained, further studies should be carried out to study these relationships.

4. Conclusions

The nutritional composition of the protein concentrates showed differences not only according to the botanical origin of the concentrate but also between different commercial brands, mainly affecting the fat, protein and ash contents. In terms of mineral composition, all the concentrates analysed showed high contents of Na, P, Ca and Mg, with rice concentrates having the lowest mineral concentrations. Differences between commercial brands were observed for all the concentrates analysed. In relation to the techno-functional properties, soybean highlighted for its higher gelling and swelling capacity and its higher solubility, while rice had a greater capacity for the formation and stability of foams. Differences were observed according to botanical origin except for emulsifying capacity, and differences between commercial brands were observed for all the properties analysed except for water absorption capacity and solubility index. The physico-chemical and mineral composition has been shown to correlate with the techno-functional properties of protein concentrates. Macroelements such as Na and Mg are significantly related to most of the techno-functional properties, while K and Ca are significantly related to SC. As for microelements, Fe and Cu are related to EC and gelling capacity and Zn to SC. Based on the results achieved, the characterisation of the nutritional and mineral composition of protein concentrates may be of great interest in order to anticipate the functional behaviour of these products. Further studies with more varieties of concentrates and commercial brands would be necessary to validate these observed correlations.

Author Contributions

Conceptualization, A.V-Q.; validation, I.R. and A.V-Q.; data curation, I.M.; formal analysis, Y.A.; writing—original draft preparation, Y.A., M. R-F. and R.L-C.; writing—review and editing, I.R. and A.V-Q. All authors have read and agreed to the published version of the manuscript.

Funding

This research has been conducted within the framework of the TRANSCOLAB PLUS research project (0112_TRANSCOLAB_PLUS_2_P), entitled “Cross-border Collaborative Laboratory for the green transition of the Agri-Food and Agro-industrial sector”, co-financed by the European Regional Development Fund - ERDF - through the INTERREG VI - A Spain-Portugal Cooperation Program (POCTEP) 2021-2027.

Data Availability Statement

The data that support the findings of this study are available from the corresponding author upon reasonable request.

Conflicts of Interest

The authors declare no conflicts of interest.

References

  1. Hertzler, S.R.; Lieblein-Boff, J.C.; Weiler, M.; Allgeier, C. Plant Proteins: Assessing Their Nutritional Quality and Effects on Health and Physical Function. Nutrients 2020, 12, 3704. [Google Scholar] [CrossRef] [PubMed]
  2. Han, Y.; Yu, M.; Wang, L. Preparation and characterization of antioxidant soy protein isolate films incorporating licorice residue extract. Food Hydrocolloids 2018, 75, 13–21. [Google Scholar] [CrossRef]
  3. Shanthakumar, P.; Klepacka, J.; Bains, A.; Chawla, P.; Dhull, S.B.; Najda, A. The Current Situation of Pea Protein and Its Application in the Food Industry. Molecules 2022, 27. [Google Scholar] [CrossRef]
  4. Kumar, M.; Tomar, M.; Potkule, J.; Punia, S.; Dhakane-Lad, J.; Singh, S.; Kennedy, J.F. Functional characterization of plant-based protein to determine its quality for food applications. Food Hydrocolloids 2022, 123, 106986. [Google Scholar] [CrossRef]
  5. Kurek, M.A.; Onopiuk, A.; Pogorzelska-Nowicka, E.; Szpicer, A.; Zalewska, M.; Półtorak, A. Novel Protein Sources for Applications in Meat-Alternative Products—Insight and Challenges. Foods 2022, 11, 957. [Google Scholar] [CrossRef]
  6. . New protein foods: seed storage proteins. Altschul, A.M.; Wilcke, H.L. (Eds.) Academic press: Orlando, USA, 2013; Vol. 5. [Google Scholar]
  7. Padalkar, G.; Mandlik, R.; Sudhakaran, S.; Vats, S.; Kumawat, S.; Kumar, V.; Sonah, H. Necessity and challenges for exploration of nutritional potential of staple-food grade soybean. Journal of Food Composition and Analysis 2023, 105093. [Google Scholar] [CrossRef]
  8. Amaya-Guerra, C.A.; Alanis-Guzman, M.G.; Serna Saldívar, S.O. Effects of soybean fortification on protein quality of tortilla-based diets produced from regular and quality protein maize. Plant foods for human nutrition 2004, 59, 45–50. [Google Scholar] [CrossRef]
  9. Tian, T.; Tong, X.; Ren, K.; Cao, J.; Yuan, Y.; Yang, J.; Jiang, L. Influence of protein ratios on the structure and gel properties of soybean-wheat co-precipitated proteins. LWT 2022, 170, 114045. [Google Scholar] [CrossRef]
  10. Friedman, M.; Brandon, D.L. Nutritional and health benefits of soy proteins. Journal of agricultural and food chemistry 2001, 49, 1069–1086. [Google Scholar] [CrossRef]
  11. Boye, J.; Zare, F.; Pletch, A. Pulse proteins: Processing, characterization, functional properties and applications in food and feed. Food Research International, 2010, 43, 414–431. [Google Scholar] [CrossRef]
  12. Yang, M.; Li, N.; Tong, L.; Fan, B.; Wang, L.; Wang, F.; Liu, L. Comparison of physicochemical properties and volatile flavor compounds of pea protein and mung bean protein-based yogurt. LWT 2021, 152, 112390. [Google Scholar] [CrossRef]
  13. Poutanen, K.S.; Kårlund, A.O.; Gómez-Gallego, C.; Johansson, D.P.; Scheers, N.M.; Marklinder, I.M.; Landberg, R. Grains–a major source of sustainable protein for health. Nutrition reviews 2022, 80, 1648–1663. [Google Scholar] [CrossRef] [PubMed]
  14. Amagliani, L.; O'Regan, J.; Kelly, A.L.; O'Mahony, J.A. The composition, extraction, functionality and applications of rice proteins: A review. Trends in food science & technology 2017, 64, 1–12. [Google Scholar] [CrossRef]
  15. Jayaprakash, G.; Bains, A.; Chawla, P.; Fogarasi, M.; Fogarasi, S. A narrative review on rice proteins: current scenario and food industrial application. Polymers 2022, 14, 3003. [Google Scholar] [CrossRef]
  16. Cruz Solorio, A.; Garín Aguilar, M.; Valencia del Toro, G. Nutritional and functional properties of protein concentrate and protein isolates of foods. Science within food: Up-to-date advances on research and educational ideas. Formatex Research Center 2020.
  17. Zhao, J.; Boatright, W.L. Static headspace analysis of odorants in commercial rice proteins. Food chemistry 2017, 221, 345–350. [Google Scholar] [CrossRef]
  18. Absi, Y.; Revilla, I.; Vivar-Quintana, A.M. Commercial Hemp (Cannabis sativa Subsp. sativa) Proteins and Flours: Nutritional and Techno-Functional Properties. Applied Sciences 2023, 13, 10130. [Google Scholar] [CrossRef]
  19. Rodríguez-Miranda, J.; Hernández-Santos, B.; Herman-Lara, E.; Gómez-Aldapa, C.A.; Garcia, H.S.; Martínez-Sánchez, C.E. Effect of some variables on oil extraction yield from Mexican pumpkin seeds. CyTA-Journal of Food 2014, 12, 9–15. [Google Scholar] [CrossRef]
  20. Akpata, M.I.; Miachi, O.E. Proximate composition and selected functional properties of Detarium microcarpum. Plant Foods for Human Nutrition 2001, 56, 297–302. [Google Scholar] [CrossRef]
  21. Chau, C.F.; Cheung, P.C.K. Functional properties of flours prepared from three Chinese indigenous legume seeds. Food Chemistry 1998, 61, 429–433. [Google Scholar] [CrossRef]
  22. Tomé, A.S.; Pires, C.; Batista, I.; Sousa, I.; Raymundo, A. Protein gels and emulsions from mixtures of Cape hake and pea proteins. Journal of the Science of Food and Agriculture 2015, 95, 289–298. [Google Scholar] [CrossRef]
  23. Bora, P.S. Functional properties of native and succinylated lentil (Lens culinaris) globulins. Food Chemistry 2002, 77, 171–176. [Google Scholar] [CrossRef]
  24. Galindo, M.P. Una alternativa de representacion simultanea: HJ-Biplot. Questiio 1986, 10, 13–23. [Google Scholar]
  25. Vicente-Villardon, J.L. MultBiplotR: Multivariate Analysis using Biplots. R Package Version 19.11.19 (2019). Available via http://biplot.usal.es/multbiplot/multbiplot-in-r/.
  26. Güroy, D.; Şahin, İ.; Güroy, B.; Merrifield, D.L.; Bulut, M.; Tekinay, A.A. Replacement of fishmeal with rice protein concentrate in practical diets for European sea bass Dicentrarchus labrax reared at winter temperatures. Aquaculture Research 2013, 44, 462–471. [Google Scholar] [CrossRef]
  27. Mondor, M.; Hernández-Álvarez, A.J. Processing technologies to produce plant protein concentrates and isolates. In Plant protein foods (pp. 61–108). Cham: Springer International Publishing (Guelph, Canada) 2022. [CrossRef]
  28. Reda, R.M.; Maricchiolo, G.; Quero, G.M.; Basili, M.; Aarestrup, F.M.; Pansera, L.; Rahman, A.N.A. Rice protein concentrate as a fish meal substitute in Oreochromis niloticus: Effects on immune response, intestinal cytokines, Aeromonas veronii resistance, and gut microbiota composition. Fish & Shellfish Immunology 2022, 126, 237–250. [Google Scholar] [CrossRef]
  29. Tömösközi, S.; Lásztity, R.; Haraszi, R.; Baticz, O. Isolation and study of the functional properties of pea proteins. Food/Nahrung 2001, 45, 399–401. [Google Scholar] [CrossRef]
  30. Zhao, S.; Xu, X.; Wei, D.; Lin, X.; Qiu, S.; Ciampitti, I.; He, P. Soybean yield, nutrient uptake and stoichiometry under different climate regions of northeast China. Scientific reports 2020, 10, 8431. [Google Scholar] [CrossRef]
  31. Foh, M.B.K.; Wenshui, X.; Amadou, I.; Jiang, Q. Influence of pH shift on functional properties of protein isolated of tilapia (Oreochromis niloticus) muscles and of soy protein isolate. Food and Bioprocess Technology 2012, 5, 2192–2200. [Google Scholar] [CrossRef]
  32. Nosworthy, M.G.; Huang, S.; Franczyk, A.; Arganosa, G.C.; Warkentin, T.D.; House, J.D. Effect of genotype, year, and location on the proximate composition and in vitro protein quality of select pea cultivars. ACS Food Science & Technology 2021, 1, 1670–1676. [Google Scholar] [CrossRef]
  33. Mondor, M.; Aksay, S.; Drolet, H.; Roufik, S.; Farnworth, E.; Boye, J.I. Influence of processing on composition and antinutritional factors of chickpea protein concentrates produced by isoelectric precipitation and ultrafiltration. Innovative Food Science & Emerging Technologies 2009, 10, 342–347. [Google Scholar] [CrossRef]
  34. Awadalkareem, A.M.; Mustafa, A.I.; El Tinay, A.H. Protein, mineral content and amino acid profile of sorghum flour as influenced by soybean protein concentrate supplementation. Pakistan Journal of Nutrition 2008, 7, 475–479. [Google Scholar] [CrossRef]
  35. Karr-Lilienthal, L.K.; Grieshop, C.M.; Merchen, N.R.; Mahan, D.C.; Fahey, G.C. Chemical composition and protein quality comparisons of soybeans and soybean meals from five leading soybean-producing countries. Journal of Agricultural and Food Chemistry 2004, 52. [Google Scholar] [CrossRef] [PubMed]
  36. Amagliani, L.; O’Regan, J.; Kelly, A.L.; O’Mahony, J.A. Composition and protein profile analysis of rice protein ingredients. Journal of Food Composition and Analysis 2017, 59, 18–26. [Google Scholar] [CrossRef]
  37. de Paiva Gouvêa, L.; Caldeira, R.; de Lima Azevedo, T.; Antoniassi, R.; Galdeano, M.C.; Felberg, I.; Mellinger, C.G. Nutritional properties of common bean protein concentrate compared to commercial legume ingredients for the plant-based market. Current Research in Food Science 2024, 100937. [Google Scholar] [CrossRef] [PubMed]
  38. Anjum, F.M.; Pasha, I.; Bugti, M.A.; Butt, M.S. Mineral composition of different rice varieties and their milling fractions. Pak. J. Agri. Sci 2007, 44, 332–336. [Google Scholar]
  39. Nasiroleslami, E.; Mozafari, H.; Sadeghi-Shoae, M.; Habibi, D.; Sani, B. Changes in yield, protein, minerals, and fatty acid profile of wheat (Triticum aestivum L.) under fertilizer management involving application of nitrogen, humic acid, and seaweed extract. Journal of Soil Science and Plant Nutrition 2021, 21, 2642–2651. [Google Scholar] [CrossRef]
  40. Kornet, R.; Shek, C.; Venema, P.; van der Goot, A.J.; Meinders, M.; van der Linden, E. Substitution of whey protein by pea protein is facilitated by specific fractionation routes. Food Hydrocolloids 2021, 117, 106691. [Google Scholar] [CrossRef]
  41. Kolpakova, V.V.; Ulanova, R.V.; Kulikov, D.S.; Gulakova, V.A.; Semenov, G.V.; Shevjakova, L.V. Pea and chickpea protein concentrates: quality indicators. Food Processing: Techniques and Technology 2022, 52, 4–649. [Google Scholar] [CrossRef]
  42. De Angelis, D.; Pasqualone, A.; Allegretta, I.; Porfido, C.; Terzano, R.; Squeo, G.; Summo, C. Antinutritional factors, mineral composition and functional properties of dry fractionated flours as influenced by the type of pulse. Heliyon 2021, 7. [Google Scholar] [CrossRef]
  43. do Carmo, C.S.; Silventoinen-Veijalainen, P.; Zobel, H.; Holopainen-Mantila, U.; Sahlstrøm, S.; Knutsen, S.H. The effect of dehulling of yellow peas and faba beans on the distribution of carbohydrates upon dry fractionation. LWT 2022, 163, 113509. [Google Scholar] [CrossRef]
  44. De Angelis, D.; Pasqualone, A.; Squeo, G.; Caponio, F.; Summo, C. Amino acid and fatty acid compositions of texturized vegetable proteins: Composizione di proteine vegetali testurizzate. Italian Journal of Food Science 2023, 35, 19–25. [Google Scholar] [CrossRef]
  45. Awuchi, C.G.; Igwe, V.S.; Echeta, C.K. The functional properties of foods and flours. International Journal of Advanced Academic Research 2019, 5, 139–160. [Google Scholar]
  46. Solaesa, Á.G.; Villanueva, M.; Vela, A.J.; Ronda, F. Protein and lipid enrichment of quinoa (cv. Titicaca) by dry fractionation. Techno-functional, thermal and rheological properties of milling fractions. Food Hydrocolloids 2020, 105, 105770. [Google Scholar] [CrossRef]
  47. Silventoinen, P.; Kortekangas, A.; Ercili-Cura, D.; Nordlund, E. Impact of ultra-fine milling and air classification on biochemical and techno-functional characteristics of wheat and rye bran. Food Research International 2021, 139, 109971. [Google Scholar] [CrossRef] [PubMed]
  48. Bogahawaththa, D.; Chau, N.H.B.; Trivedi, J.; Dissanayake, M.; Vasiljevic, T. Impact of selected process parameters on solubility and heat stability of pea protein isolate. Lwt 2019, 102, 246–253. [Google Scholar] [CrossRef]
  49. do Carmo, C.S.; Silventoinen, P.; Nordgård, C.T.; Poudroux, C.; Dessev, T.; Zobel, H.; Sahlstrøm, S. Is dehulling of peas and faba beans necessary prior to dry fractionation for the production of protein-and starch-rich fractions? Impact on physical properties, chemical composition and techno-functional properties. Journal of food engineering 2020, 278, 109937. [Google Scholar] [CrossRef]
  50. Wang, M.; Hettiarachchy, N.S.; Qi, M.; Burks, W.; Siebenmorgen, T. Preparation and functional properties of rice bran protein isolate. Journal of agricultural and food chemistry 1999, 47, 411–416. [Google Scholar] [CrossRef]
  51. Boye, J.I.; Aksay, S.; Roufik, S.; Ribéreau, S.; Mondor, M.; Farnworth, E.; Rajamohamed, S.H. Comparison of the functional properties of pea, chickpea and lentil protein concentrates processed using ultrafiltration and isoelectric precipitation techniques. Food Research International 2010, 43, 537–546. [Google Scholar] [CrossRef]
  52. Toews, R.; Wang, N. Physicochemical and functional properties of protein concentrates from pulses. Food Research International 2013, 52, 445–451. [Google Scholar] [CrossRef]
  53. Zhang, B.; Kang, X.; Cheng, Y.; Cui, B.; Abd El-Aty, A.M. Impact of high moisture contents on the structure and functional properties of pea protein isolate during extrusion. Food Hydrocolloids 2022, 127, 107508. [Google Scholar] [CrossRef]
  54. Tang, Q.; Roos, Y.H.; Miao, S. Structure, gelation mechanism of plant proteins versus dairy proteins and evolving modification strategies. Trends in Food Science & Technology 2024, 104464. [Google Scholar] [CrossRef]
  55. Tang, C.; Chen, Y.; Luo, J.; Low, M.Y.; Shi, Z.; Tang, J.; Tam, K.C. Pickering emulsions stabilized by hydrophobically modified nanocellulose containing various structural characteristics. Cellulose 2019, 26, 7753–7767. [Google Scholar] [CrossRef]
  56. Tabtabaei, S.; Konakbayeva, D.; Rajabzadeh, A.R.; Legge, R.L. Functional properties of navy bean (Phaseolus vulgaris) protein concentrates obtained by pneumatic tribo-electrostatic separation. Food Chemistry 2019, 283, 101–110. [Google Scholar] [CrossRef] [PubMed]
  57. Samuelsen, T.A.; Mjøs, S.A.; Oterhals, Å. Impact of variability in fishmeal physicochemical properties on the extrusion process, starch gelatinization and pellet durability and hardness. Animal Feed Science and Technology 2013, 179, 77–84. [Google Scholar] [CrossRef]
  58. Vogelsang-O’Dwyer, M.; Petersen, I.L.; Joehnke, M.S.; Sørensen, J.C.; Bez, J.; Detzel, A.; Zannini, E. Comparison of faba bean protein ingredients produced using dry fractionation and isoelectric precipitation: Techno-functional, nutritional and environmental performance. Foods 2020, 9, 322. [Google Scholar] [CrossRef]
  59. Nasrollahzadeh, F.; Roman, L.; Swaraj, V.S.; Ragavan, K.V.; Vidal, N.P.; Dutcher, J.R.; Martinez, M.M. Hemp (Cannabis sativa L.) protein concentrates from wet and dry industrial fractionation: Molecular properties, nutritional composition, and anisotropic structuring. Food Hydrocolloids 2022, 131, 107755. [Google Scholar] [CrossRef]
  60. Wang, J.; Wang, T.; Yu, G.; Li, X.; Liu, H.; Liu, T.; Zhu, J. Effect of enzymatic hydrolysis on the physicochemical and emulsification properties of rice bran albumin and globulin fractions. LWT 2022, 156, 113005. [Google Scholar] [CrossRef]
  61. Siddiquy, M.; JiaoJiao, Y.; Rahman, M.H.; Iqbal, M.W.; Al-Maqtari, Q.A.; Easdani, M.; Zhang, L. Advances of protein functionalities through conjugation of protein and polysaccharide. Food and Bioprocess Technology 2024, 17, 2077–2097. [Google Scholar] [CrossRef]
  62. Bou, R.; Navarro-Vozmediano, P.; Domínguez, R.; López-Gómez, M.; Pinent, M.; Ribas-Agustí; A; Jorba-Martín, R. Application of emerging technologies to obtain legume protein isolates with improved techno-functional properties and health effects. Comprehensive Reviews in Food Science and Food Safety 2022, 21, 2200–2232. [Google Scholar] [CrossRef]
  63. Vojdani, F. Solubility, in Methods of Testing Protein Functionality, 1st edn, ed. By GM Hall. Blackie Academic & Professional, London, pp. 11–60 (London, UK) 1996.
  64. Constantino, A.B.T.; Garcia-Rojas, E.E. Proteins from pseudocereal seeds: solubility, extraction, and modifications of the physicochemical and techno-functional properties. Journal of the Science of Food and Agriculture 2022, 102, 2630–2639. [Google Scholar] [CrossRef]
  65. Hernández Suárez, M.; Molina Pérez, D.; Rodríguez-Rodríguez, E.M.; Díaz Romero, C.; Espinosa Borreguero, F.; Galindo-Villardón, P. The compositional HJ-biplot—A new approach to identifying the links among bioactive compounds of tomatoes. International Journal of Molecular Sciences 2016, 17, 1828. [Google Scholar] [CrossRef]
  66. Cubilla-Montilla, M.; Nieto-Librero, A.B.; Galindo-Villardón, M.P.; Torres-Cubilla, C.A. Sparse HJ biplot: A new methodology via elastic net. Mathematics 2021, 9, 1298. [Google Scholar] [CrossRef]
  67. Kohnhorst, A.L.; Uebersax, M.A.; Zabik, M.E. Production and functional characteristics of protein concentrates. J Am Oil Chem Soc 1990, 67, 285–292. [Google Scholar] [CrossRef]
Figure 1. Heat map of Pearson correlation coefficients of protein concentrates between the physical-chemical and mineral parameters and the techno-functional properties analysed.
Preprints 143924 g001
Figure 2. GH-biplot based on the two principal component (PC1 51.4%-PC2 26.7%) analysis for nutritional composition parameters and physicochemical and techno-functional properties of the protein concentrates analyzed.
Preprints 143924 g002
Table 1. Proximate composition of different protein concentrates (rice, pea, soybean). Data presented as means ± standard deviation from the triplicate analysis.
Rice proteins Pea proteins Soybean proteins
Brand 1 Brand 2 Brand 1 Brand 2 Brand 1 Brand 2
Moisture (%) 4.35±0.08a 5.43±0.24c 7.15±0.05d 7.19±0.04d 5.71±0.26c 4.86±0.03b
Proteins (g/100g dw) 87.00±0.05b 87.77±0.23c 84.35±0.07a 84.85±0.14a 89.60±0.39d 89.80±0.24d
Fat (g/100g dw) 4.40±0.01b 6.35±0.02c 9.37±0.18e 8.31±0.13d 2.65 ±0.01a 2.63±0.02a
Carbohydrates (g/100g dw) 7.36±0.05e 3.41±0.02d 2.38±0.02b 2.41±0.12b 1.29 ±0.01a 2.76±0.03c
Starch (g/100g dw) 1.72±0.01d 1.01±0.05a 1.46±0.10c 2.06±0.02e 1.18±0.02b 0.99±0.01a
Total sugar (g/100g dw) <1 <1 <1 <1 <1 <1
Fiber (g/100g dw) <1 <1 <1 <1 <1 <1
Ash (g/100g dw) 1.27±0.02a 2.17±0.05b 3.70±0.22c 4.29±0.08d 5.12±0.02e 4.86±0.02e
Energy (Kcal/100g) 417.04±0.09c 421.86±0.99d 431.25±1.85e 423.89±1.40d 387.46± 1.58a 393.85±1.11b
a–e: Values followed by different superscripts in the same row are significantly different (p<0.05).
Table 2. Mineral composition of different commercial proteins (rice, pea, soybean). Data presented as means ± standard deviation from the duplicate analysis.
Rice proteins Pea proteins Soybean proteins
Brand 1 Brand 2 Brand 1 Brand 2 Brand 1 Brand 2
ppm
Na 1861.82±31.01b 816.24±16.36a 11530.00±153.61d 10719.10±7.88c 10944.44±67.13c 13307.24±10.41e
Mg 330.50±1.47b 179.52±2.71a 707.86±7.79d 429.35±16.69c 971.99±11.79f 799.06±0.76e
P 2650.93±2.94a 3270.61±26.44b 8083.31±106.50d 7611.91±17.50c 7730.74±30.45c 8176.00±26.03d
K 78.65±1.36b 42.20±0.01a 1224.59±0.65d 447.74±4.93c 2027.68±1.38e 2410.37±4.19f
Ca 688.41±4.37a 1043.30±20.86b 1421.15±11.52c 1423.29±14.57c 5225.22±11.55e 4418.93±22.91d
Mn 25.51±0.11d 31.48±0.27e 10.98±0.15b 5.84±0.04a 13.15±0.47c 13.81±0.16c
Fe 180.00±0.35c 87.08±1.30a 256.15±3.46d 267.77±3.74e 132.34±2.81b 133.14±0.94b
Cu 14.64±2.23bc 17.69±0.24c 11.18±0.20ab 8.95±0.00a 12.00±0.00ab 11.59±0.16ab
Zn 59.49±0.21b 73.95±0.70e 67.77±0.95d 63.07±0.11c 20.42±0.04a 21.75±0.25a
ppb
Se 496.21±22.08bc 613.30±45.04c 436.15±2.53b 1039.83±35.33d 200.95±60.32a 185.51±23.46a
Ni 240.22±19.88a 604.54±65.39b 585.49±47.94b 268.27±35.21a 1447.33±35.89c 2282.92±30.11d
Cr 208.98±4.31a 627.11±2.34b 78.97±11.24a 114.11±31.83a 103.74±12.28a 189.71±88.97a
Cd* nd nd nd nd nd nd
Pb** nd 175.40±3.15 nd nd nd nd
a–e: Values followed by different superscripts in the same row are significantly different (p<0.05). *Detection limit <0.015 **Detection limit <0.026.
Table 3. Techno-functional properties of commercial proteins. Data presented as means ± standard deviation.
Rice proteins Pea proteins Soybean proteins
Brand 1 Brand 2 Brand 1 Brand 2 Brand 1 Brand 2
WHC(g/g) 3.46±0.06b 2.13±0.03a 5.18±0.13d 4.56±0.32c 5.94±0.27e 4.84±0.26cd
OHC(g/g) 0.99±0.09a 1.00±0.11a 1.16±0.03b 1.12±0.09ab 1.08±0.05ab 1.29±0.03c
WSI(°Brix) 1.0±0.00a 1.7±0.06a 11.7±0.06b 11.0±0.10b 18.3±0.06c 22.0±0.10d
SC(%) 0.74±0.01b 0.25±0.07a 1.35±0.04d 1.05±0.03c 2.43±0.08f 2.08±0.06e
FC(%) 474.60±2.75e 294.66±8.39d 257.57±10.50c 296.82±5.50d 228.61±3.37b 136.36±31.8a
FS(%) 465.08±2.75d 284.33±17.21c 87.88±5.25b 49.20±5.50a 101.39±2.41b 92.42±2.62b
EC (%) 43.54±2.12b 35.62±0.74a 41.61±2.06ab 63.25±3.84c 59.88±1.45c 45.59±1.90b
ES (%) 82.54±1.15e 77.13±0.65d 75.05±2.57d 55.19±2.77b 48.75±0.86a 67.83±0.37c
GF (N) 85.39±24.66b 59.79±1.14a 639.90±1015.93c 619.08±158.51c 2067.33±1870.70d 2482.80±218.24d
aw 0.344±0.001c 0.318±0.004b 0.404±0.001f 0.389±0.001e 0.371±0.002d 0.134±0.002a
L* 82.03±27.38d 78.08±1.17c 76.36±2.42bc 73.52±1.83a 74.69±2.14ab 83.53±2.14d
a* 2.71±0.07d 2.46±0.07c 5.06±0.01e 5.39±0.01f 0.37±0.07a 0.51±0.02b
b* 15.91±0.16a 19.16±0.35b 25.00±0.61e 23.23±0.47d 19.96±0.48c 18.77±0.37b
WHC: water-holding capacity, OHC: oil-holding capacity SC: swelling capacity, WSI: water solubility index, FC: foaming capacity, FS: foaming stability, GF: gel formation (hardness of the gel formed at pH = 5). EC: emulsion activity, ES: emulsion stability. L*: lightness, a*: redness, and b*: yellowness.a–e Values in the same row followed by different letters are significantly different (p < 0.05).
Disclaimer/Publisher’s Note: The statements, opinions and data contained in all publications are solely those of the individual author(s) and contributor(s) and not of MDPI and/or the editor(s). MDPI and/or the editor(s) disclaim responsibility for any injury to people or property resulting from any ideas, methods, instructions or products referred to in the content.
Copyright: This open access article is published under a Creative Commons CC BY 4.0 license, which permit the free download, distribution, and reuse, provided that the author and preprint are cited in any reuse.
Prerpints.org logo

Preprints.org is a free preprint server supported by MDPI in Basel, Switzerland.

Subscribe

Disclaimer

Terms of Use

Privacy Policy

Privacy Settings

© 2026 MDPI (Basel, Switzerland) unless otherwise stated