Preprint
Article

This version is not peer-reviewed.

Multiple Highly Methylated CpG Sites as Potential Epigenetic Markers for the Diagnosis of Prostate Cancer

Submitted:

21 December 2024

Posted:

23 December 2024

You are already at the latest version

Abstract

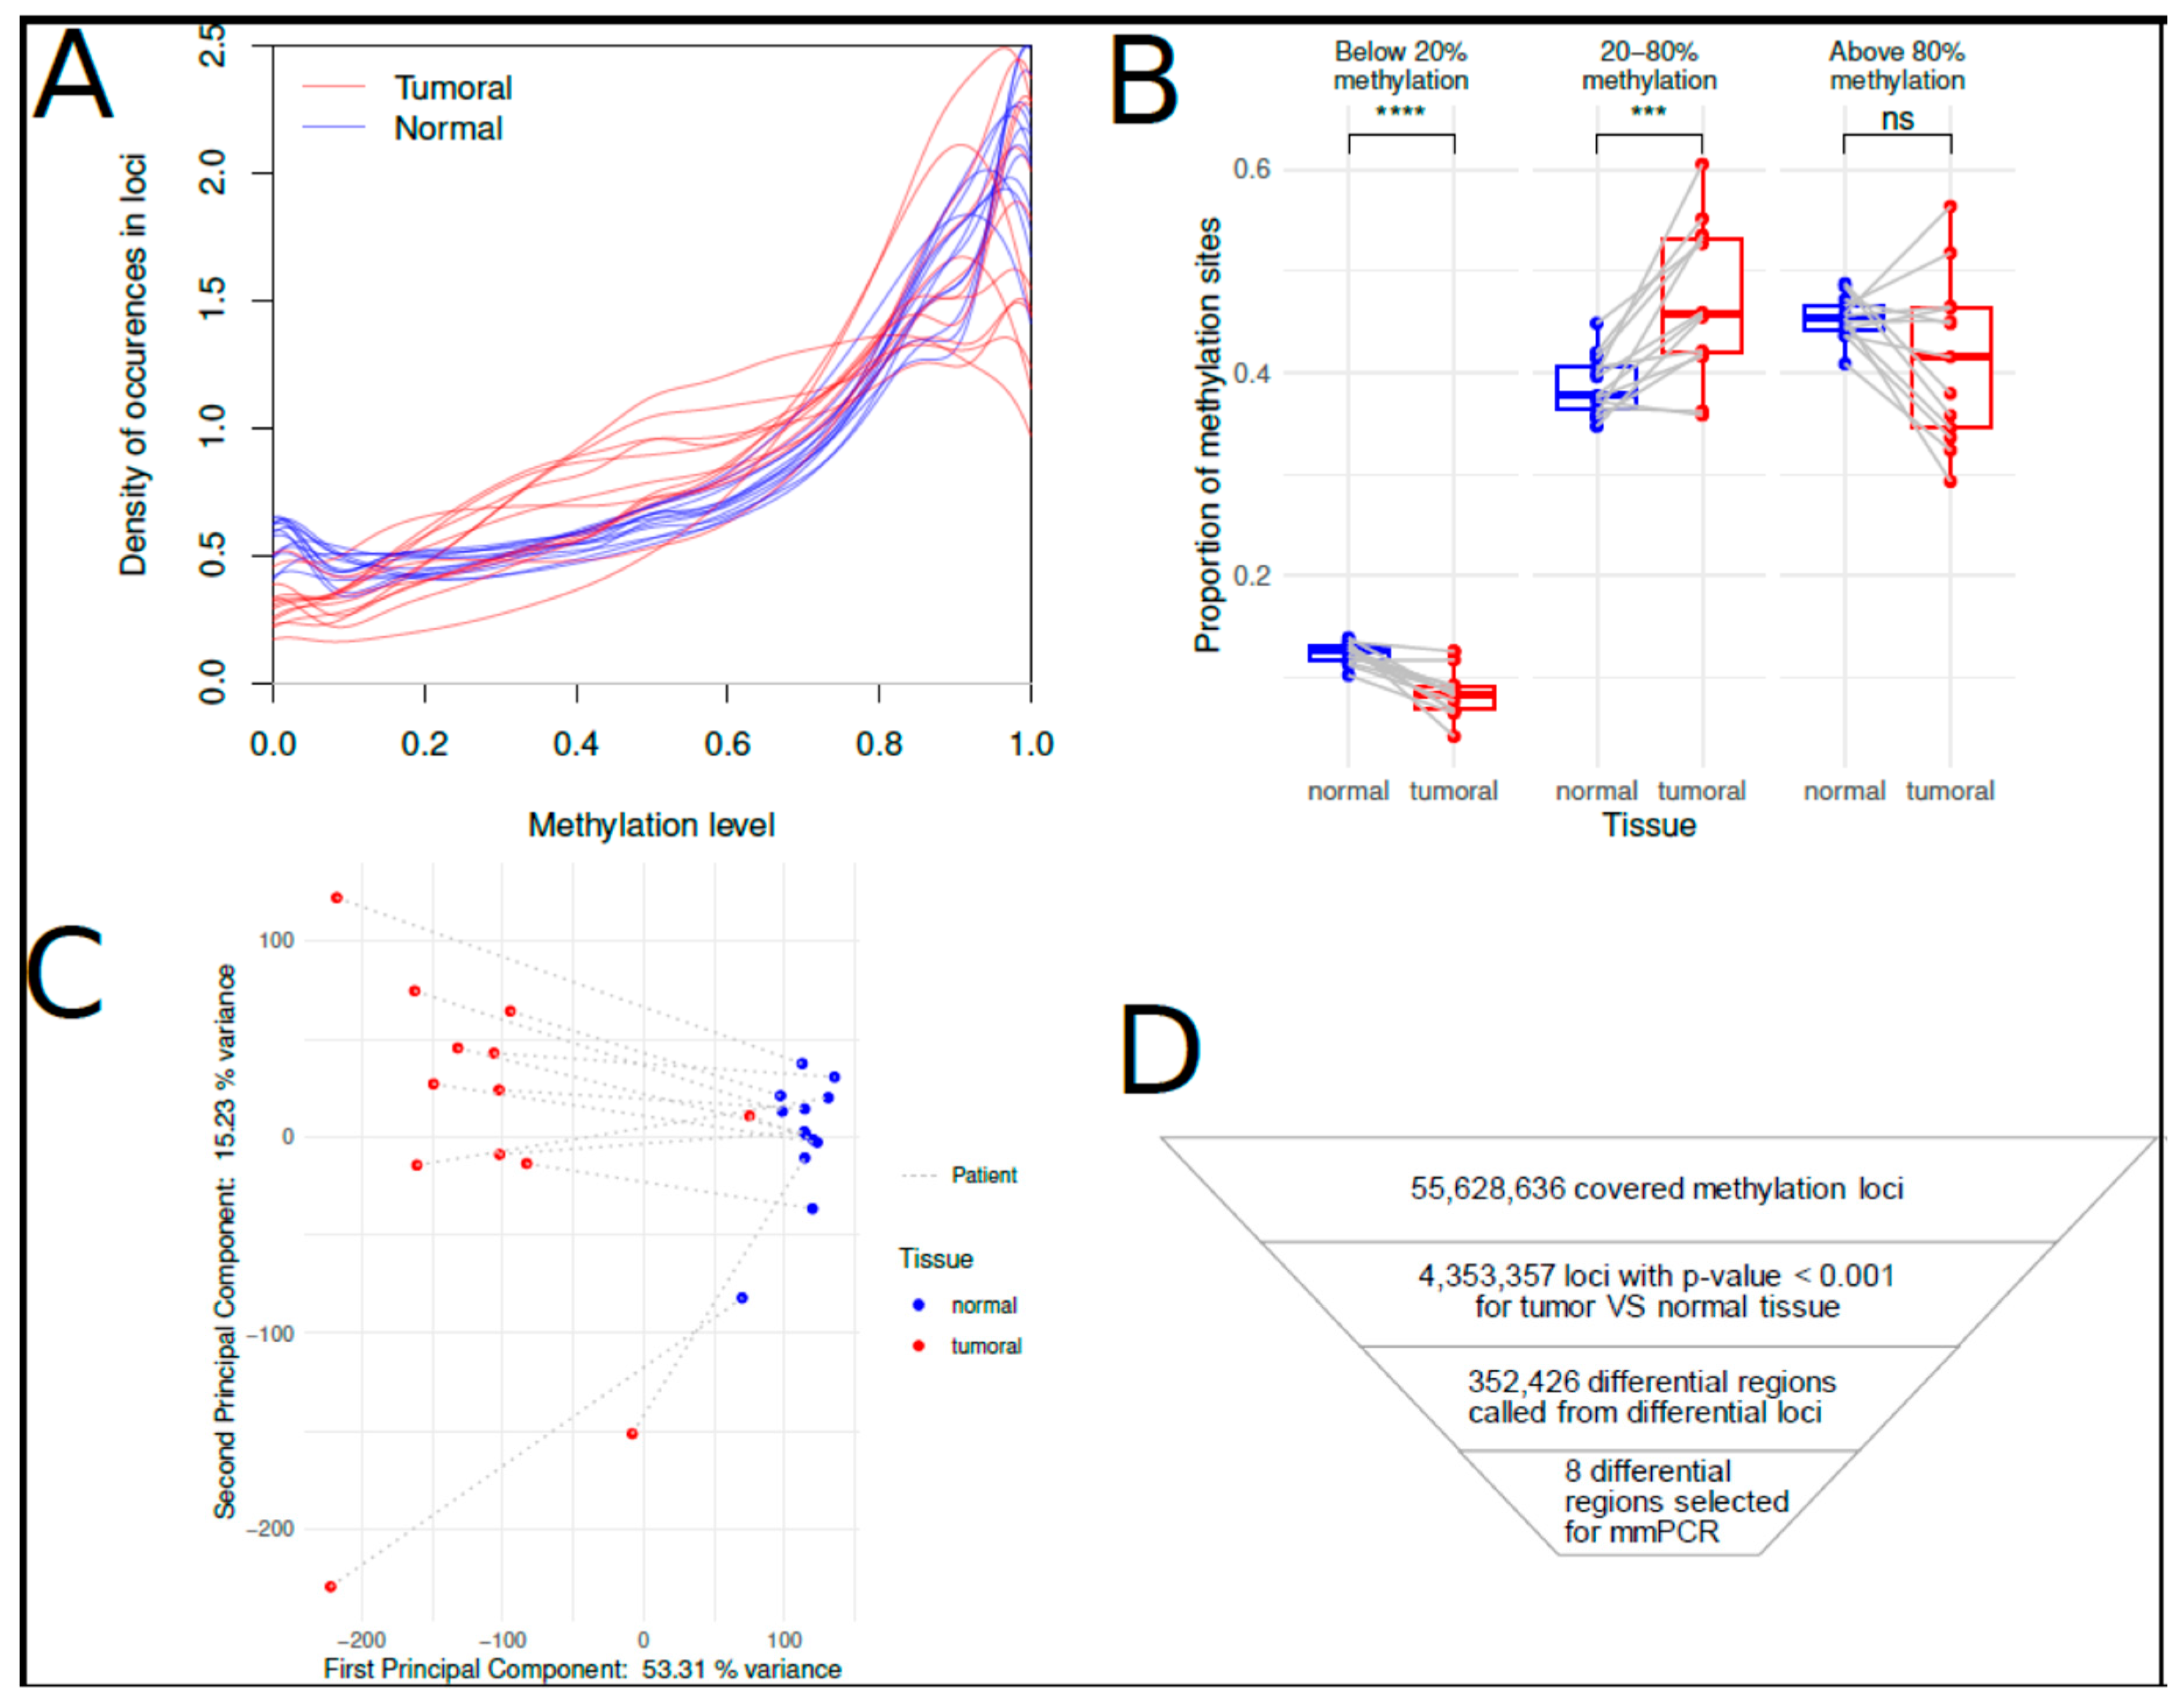
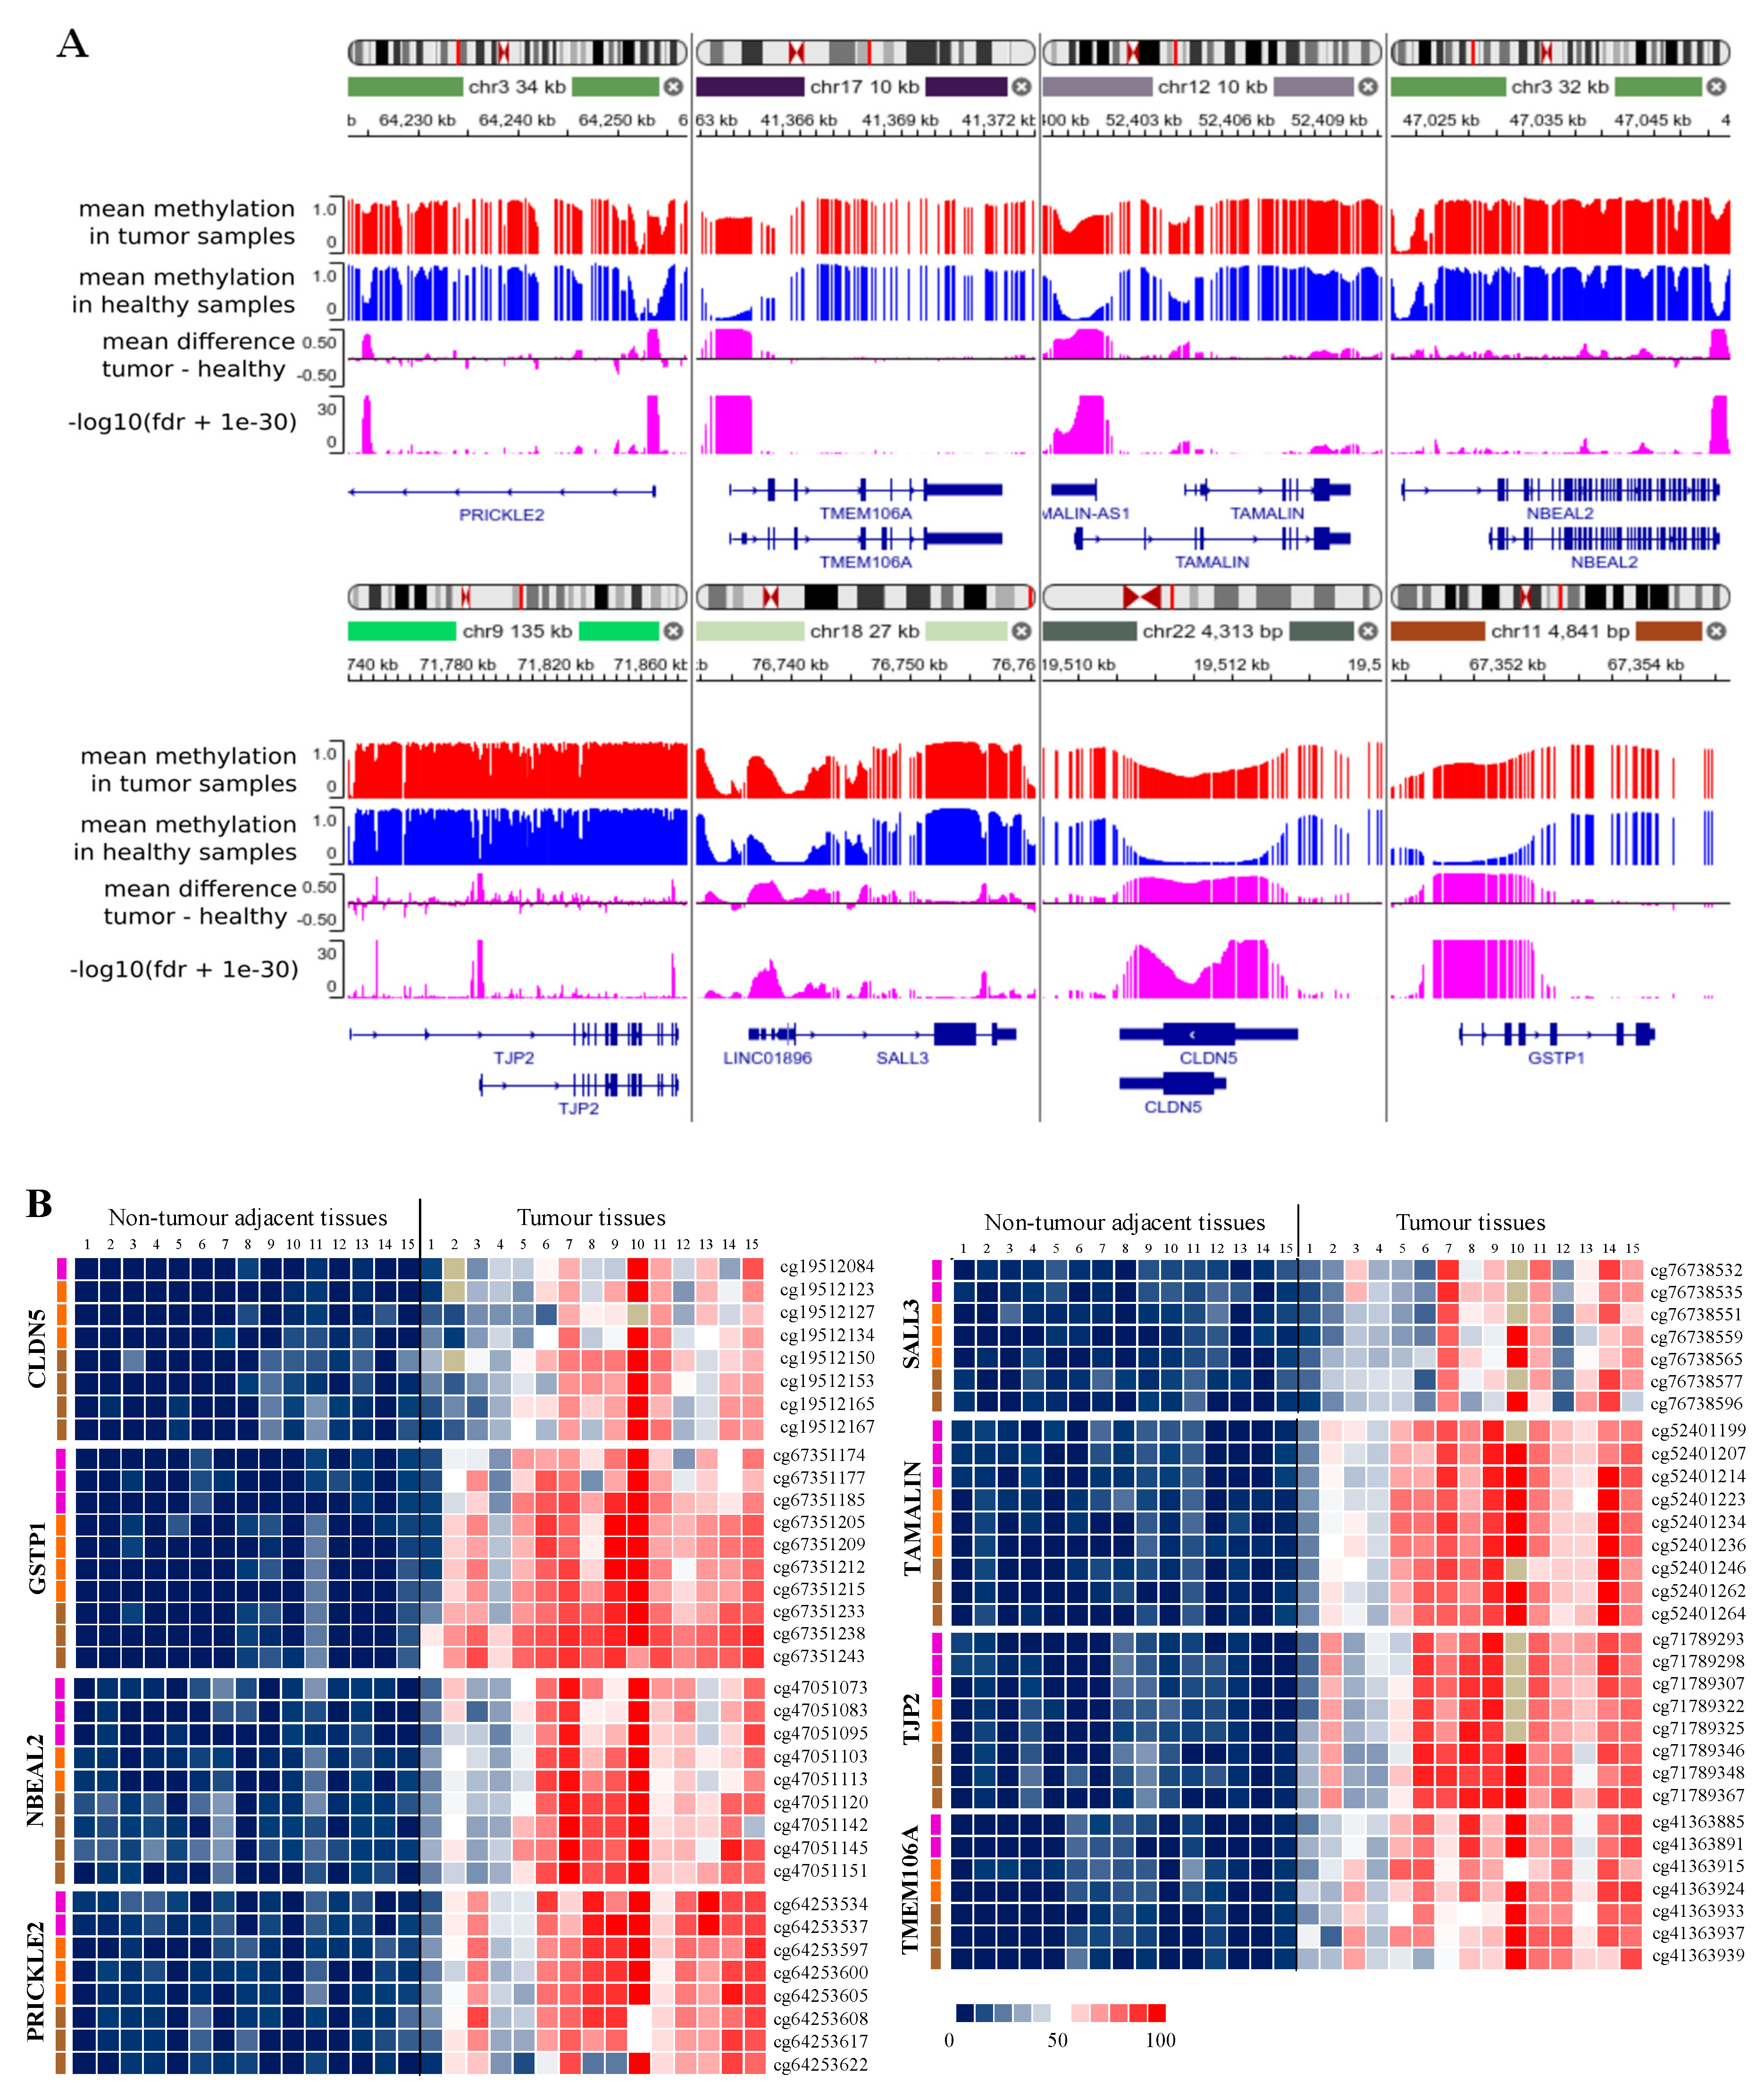
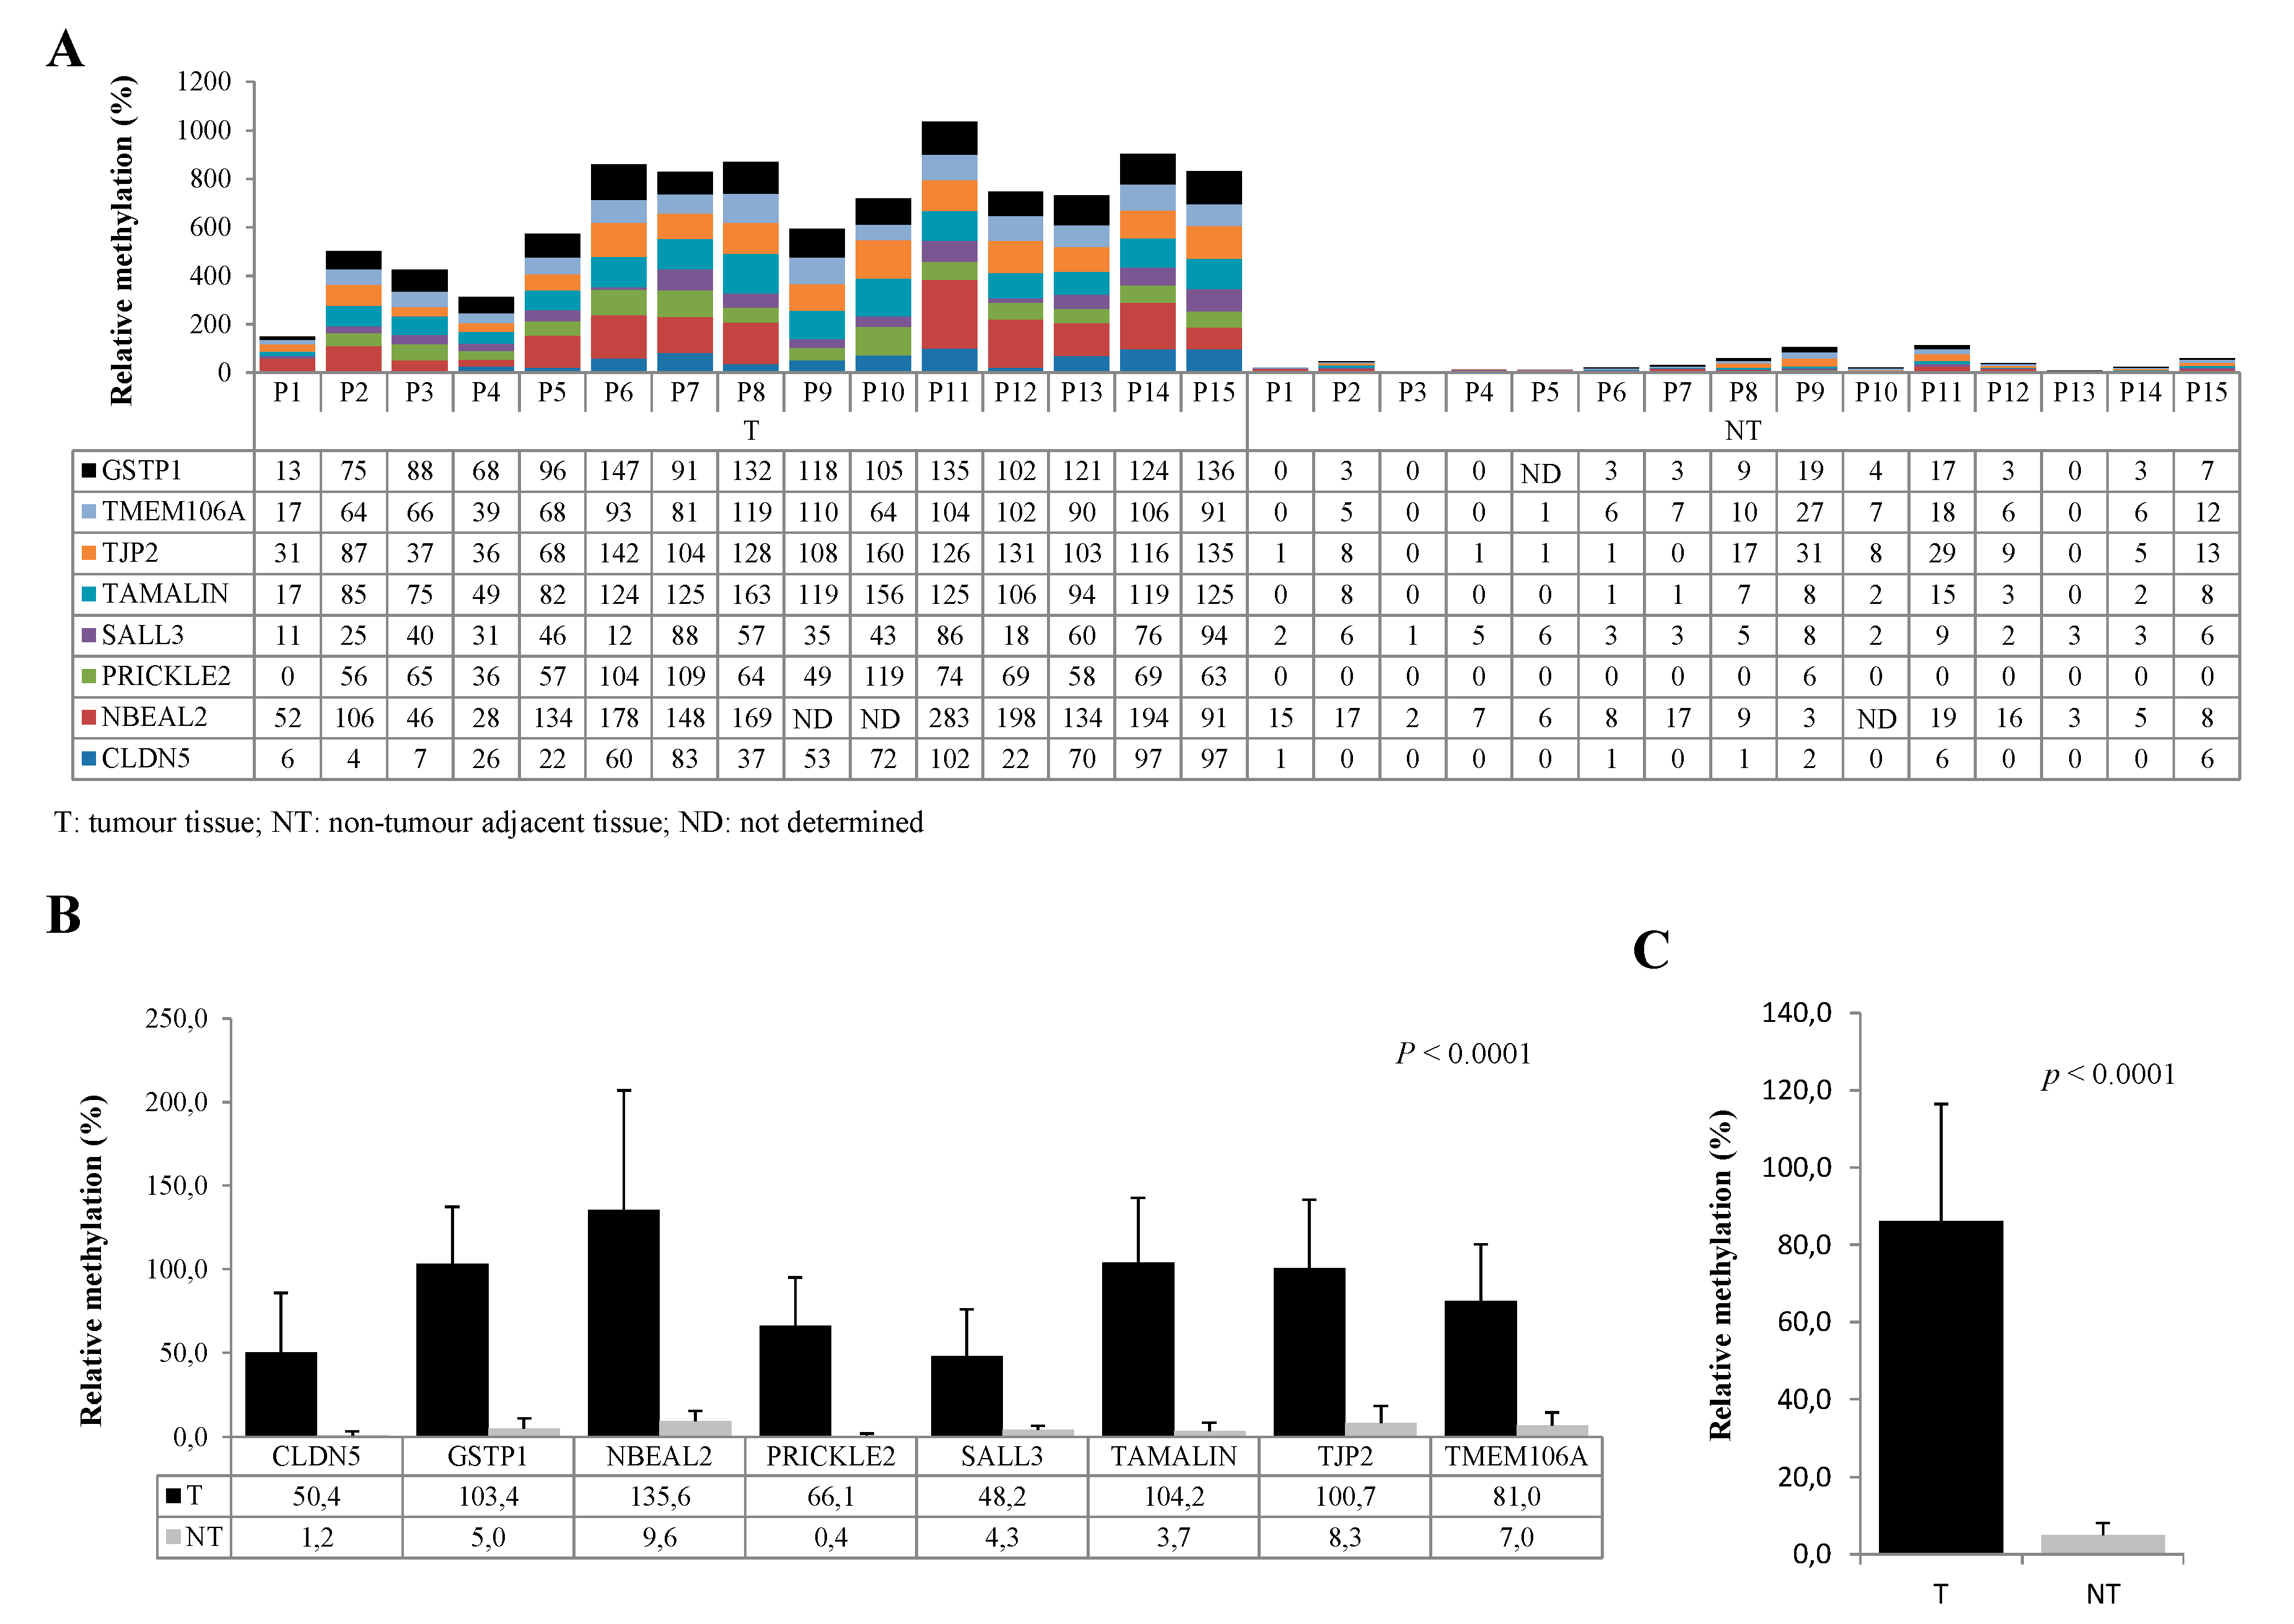
Prostate cancer represents the second most frequently diagnosed malignant tumour in males. Serum PSA is used as a screening tool for prostate cancer. However, there are limitations to this approach due to the number of false positives it generates, which can result in overdiagnosis and over-treatment. The objective of this study was to identify accurate DNA methylation markers for the diagnosis of prostate cancer. In order to achieve this objective, whole-methylome sequencing was performed on tumour tissue samples, and the identified epi-genetic markers were validated using multiplex methylation-specific PCR. Abstract: Background/Objectives: Prostate cancer (PCa) remains the leading cause of cancer deaths in men. Serum Prostate-Specific Antigen (PSA) test is widely used for PCa screening. This method is controversial, as it can lead to over-diagnosis and over-treatment. Using DNA methyl-ation sequencing, our aim was to identify new sensitive and specific epigenetic markers in PCa tissue. Methods: DNA methylome analysis was performed from 15 paired tumors (T) and non-tumour adjacent (NT) prostate tissues by Enzymatic Methyl-seq Kit (EM-seq). Results: 66 CpGs sites representing eight genes were identified as hypermethylated in T versus NT, and were confirmed by multiplex methylation-specific PCR (MM-SPCR). A very good correlation between EM-Seq and MM-SPCR results was observed (Pearson's correlation of 0.93). As an indicator of the overall methylation status, the percentage of methylated reference (PMR) was measured for each marker. Overall, a significant difference was found in the mean PMR values of T vs. NT (86.2  30.3% vs. 5.0  3.2%, p < 0.0001). Area under the ROC curve (AUC) was calculated from PMRs for each marker, with AUC values ranging from 0.987 to 1.0. This is an indication of the very high diagnostic accuracy of these markers in the tissue of prostate cancer patients. Conclusions: A total of 66 hypermethylated CpG sites were identified in paired prostate tumour tissue in comparison to non-tumour adjacent tissue by EM-seq. They represent a set of eight genes, including CLDN5, GSTP1, NBEAL2, PRICKLE2, SALL3, TAMALIN, TJP2 and TMEM106A, which could be used as diagnostic markers for prostate cancer.

Keywords: 
;  ;  ;  

1. Introduction

Prostate cancer (PCa) ranks among the five most common malignancies worldwide [1]. The incidence of PCa is increasing sharply, due to the aging of the population and the improvement of diagnostic methods such as Magnetic Resonance Imagery (MRI). The measurement in serum of the Prostate-Specific Antigen (PSA), a protein produced almost exclusively by prostate epithelial cells, is widely used for PCa screening [2,3]. Because of its lack of specificity, its measurement alone is disputed, as it can lead to over-diagnosis and unnecessary treatment. Indeed, serum PSA levels can be increased in cases of inflammation of the prostate (prostatitis), benign prostatic hypertrophy or urinary tract infection, when there is no cancer [4]. False positive results can expose patients to invasive and costly examinations (MRI and prostate biopsies), increasing their anxiety levels and exposing them to complications of treatments (surgery, radiotherapy), including urinary incontinence and impaired erectile function [5]. To date, no health agency in the world has given a favourable opinion on the introduction of a systematic, organised prostate cancer screening programme based on serum PSA dosage. In this context, replacing this dosage with a new highly sensitive and specific blood test remains a real medical need. Aberrant DNA methylation is frequently observed in cancers [6,7], including prostate cancer [8,9,10].
By employing the EM-seq method, we were able to identify the eight most relevant differentially methylated regions (DMRs) in prostate cancer tissues. In total, 66 methylated CpG sites were selected in the following genes: Claudin-5 (CLDN5), Glutathione S-transferase Pi 1 (GSTP1), Neurobeachin like 2 (NBEAL2), Prickle planar cell polarity protein 2 (PRICKLE2), Spalt-like transcription factor 3 (SALL3), Traffick-ing regulator and scaffold protein tamalin (TAMALIN), Tight junction protein 2/zonula occluden-2 (TJP2) and Transmembrane protein 106A (TMEM106A). The CpG sites identified make it possible to distinguish prostate cancer tissue from non-tumour adjacent tissue with great precision.

2. Materials and Methods

2.1. Tissue Sample Collection and Patient Information

The 15 patients selected for this study were recruited and nested in the PROGENE study (FWA00006032). They all provided written informed consent to participate in this study that complied with the Declaration of Helsinki and was approved by the CCP Ile de France IV (IRB: 00003835). Archival tissues were provided from fresh frozen tissues of radical prostatectomies. All specimens (n= 30) were reviewed by an expert urological pathologist, who selected, for molecular analyses, a first area in the tumour (n=15) and a second area in the non-tumour adjacent tissue (n= 15). Both areas were macro-dissected, and histologically verified to confirm the presence of more than 70% of tumour cells in the tumour area and, the absence of tumour cells in the non-tumour adjacent tissue. Table 1 shows the clinical and pathological information of patients.

2.2. DNA Isolation

DNA was extracted using the QIAamp DNA mini kit (Qiagen) in accordance to the manufacturer’s protocol. DNA was quantified by fluorimetry using the QubitTM dsDNA HS assay (Invitrogen).

2.3. DNA Methylation Sequencing Analysis

200 ng of genomic DNA were used for preparing librairies following manufacturer’s recommendations with the Enzymatic Methyl-seq Kit (New England Biolabs). Librairies were sequenced on Novaseq 6000 ILLUMINA with S4-200 cycles cartridge (2x10000 Millions of 100 base reads), corresponding to 2x333 Millions of reads per sample after demultiplexing. Fastq files were processed on hg19 assembly using nf-core/methyleq v2.3.0 with methyldackel to generate methylation calls as bedgraph. Differentially methylated loci and regions were extracted using DSS v2.46.0 and annotated with ChIPpeakAnno v3.32.0. Identification of DMR and selection of highly methylated CpG sites were performed from the exported statistic tables. Code to generate custom tables and figures is available at https://github.com/guillaumecharbonnier/mw-oncodiag

2.4. Quantification of Methylation Levels by MM-SPCR

Twenty-five nanograms of DNA were bisulfite converted using EZ DNA Methylation Kit (Zymo Research). Universal methylated human DNA standard (Zymo Research) was used as positive control. Bisulfite-converted DNA was eluted in 20 µl of elution buffer. One M-SPCR to amplify GSTP1 (singleplex) and four MM-SPCR to co-amplify Vic-ALB and 6Fam-TMEM106A (duplex1), 6Fam-CLDN5 and Vic-TAMALIN (duplex2), 6Fam-SALL3 and Ned-TJP2 (duplex3) and 6Fam-NBEAL2 and Ned-PRICKLE2 (duplex4), respectively, were developed. To normalize the amount of DNA loaded per well, Vic-ALBUMIN (ALB) containing no CpG sites was used. Four µl of bisulfite-converted DNA (≈ 5 ng) were used as template for each duplex for a total volume of 20 µl per reaction. Each reaction contained 1x QuantiNova Multiplex Kit (Qiagen), ROX reference dye diluted 1:20 (Qiagen), 400 nM primers (Eurogentec) and 250 nM TaqMan-MGB probes (Life Technologies). The sequences of the primers and TaqMan MGB probes are shown in Table 2. MM-SPCR was performed using the QuantStudio 5 Real-Time PCR system (Life Technologies). PCR cycling parameters were as follows: initial denaturation of 3 min at 95°C, followed by 40 cycles consisting of 5 sec at 95°C (denaturation) and 30 sec at 60°C (annealing/extension and data collection). The percentage of methylated reference (PMR) was determined by the “2-∆∆Ct” method were ΔΔCt = (Ct marker - Ct ALB)Control - (Ct marker - Ct ALB)Sample. The diagnostic accuracy of each marker was assessed by Receiver Operating Characteristic (ROC) curves using CombiROC software (htpp://CombiRoc.eu).

2.5. Array RNA Expression Validation

Normalized expressions of genes identified by the methylation study were analyzed with 15 genes referenced in the literature as hypermethylated in PCa. Analyse was performed on 170 samples according to their prostate tissue origin (68 non-tumoral samples, 47 tumor ISUP-1, 35 tumors ISUP-2 or 3 and 20 tumours ISUP 4 or 5) obtained from radical prostatectomy specimens. The transcriptomic dataset using Affymetrix HG U133 arrays was obtain thanks the PROGENE cohort previously characterize (E-MTAB-6128) [16]. Comparisons were performed using the XLSTAT statistical and data analysis solution 2024 (Lumivero, https://www.xlstat.com/fr) with either the Mann-Whitney test or Kruskal-Wallis test depending on the number of groups compared. Significance was based on Bonferroni corrected p-value <0.05.

2.6. Gene Expression Validation Using Spatial Transcriptomics

Spatial transcriptomics data were obtained from our previously published dataset obtained from radical prostatectomy tissue of a patient with multifocal prostate cancer [11]. The analysis included eight distinct tissue sections, encompassing a total of 32,156 spatial transcriptomics spots. To ensure data quality, spots with fewer than 500 Unique Molecular Identifier (UMI) counts were excluded. Raw FASTQ files were processed using 10X Genomics® Visium Spaceranger software. Libraries were normalised using spaceranger aggr (v2.0) function to correct for batch effects, ensuring comparable gene expression data across samples and reducing variance. Gene expression data were extracted from the barcode ID using R (v4.4.0), and visualization was performed with LoupeBrowser (v8.0.0). Pathological annotation followed a consensus approach, with two independent pathologists reviewing each spatial transcriptomics spot. Violin plots and statistical analyses were generated using GraphPad Prism (v10.4.0).

3. Results

3.1. Analysis of Cytosine Methylation Using EM-seq

Methylation analysis was performed from 15 paired tumors (T) and non-tumour adjacent (NT) prostate tissues by Enzymatic Methyl-seq Kit (EM-seq). Different patterns of global methylation were observed between normal and tumor samples, where normal samples exhibited more completely hypomethylated loci (paired t-test p-value = 5.6e-5), while tumor samples had more loci with average methylation (paired t-test p-value = 7.3e-4, Figure 1A-1B). We noticed a mean methylation slightly up in normal samples relative to tumoral ones in CpG context, and the opposite trend in CHG and CHH contexts (Figure S1). The main component of the variance in the methylation landscape was strongly associated with the normal/tumoral variable (Figure 1C). This analysis led to the identification of more than 4-million loci that were statistically differentially methylated (p-value < 0.001) between T and NT samples (Figure 1D).
The methylome analysis identified more than 350,000 DMRs. Among the most differentially hypermethylated regions in tumor (mean methylation difference tumor vs. normal > 0.25 for regions with more than 20 sites), we selected eight that are associated with the following genes: CLDN5, GSTP1, NBEAL2, PRICKLE2, SALL3, TAMALIN, TJP2 and TMEM106A (Figure 2A). MM-SPCR has been developed for the accurate and cost-effective detection and quantification of the eight candidate genes. In order to ensure reliable and robust amplification, the following criteria have been established: a gene fragment of around 100 nucleotides in size, a minimum of seven hypermethylated CpGs (with a minimum of one in each primer and probe), and an annealing and elongation temperature of 60°C. Heat map analysis was performed for each of the eight genes in accordance with the aforementioned criteria, with a comparison between T and NT (Figure 2B). Mean methylation levels of selected CpG sites in T and NT are provided in Table S1.

3.3. Evaluation of Diagnostic Performance with MM-SPCR

PCR fragments were designed allowing methylation quantification of the identified hypermethylated CpG sites by MM-SPCR and determining the Percentage of Methylated Reference (PMR) of each gene in the different tissues (Figure 3A). The mean cumulative PMR for each gene was significantly different between the T and NT groups. PMR values were as follows with 50.4 ± 34.1% vs. 1.2 ± 2.0% for CLDN5 (p = 3.4e-05), 103.4 ± 34.1% vs. 5.0 ± 6.1 for GSTP1 (p = 2.3e-08), 135.6 ± 68.7% vs. 9.6 ± 5.7% for NBEAL2 (p = 1.4e-05), 66.1 ± 28.2% vs. 0.4 ± 1.5% for PRICKLE2 (p = 2.8e-07), 48.2 ± 26. 8% vs. 4.3 ± 2.3% for SALL3 (p = 1.0e-05), 104.2 ± 37.2% vs. 3.7 ± 4.5% for TAMALIN (p = 2.3e-08), 100.7 ± 39.6 vs. 8.3 ± 9.9% for TJP2 (p = 9.3e-08) and 81.0 ± 27.1% vs. 7.0 ± 7.3% for TMEM106A genes (p = 5.4e-09) (Figure 3B). Considering the eight genes altogether, the mean cumulative PMR values were significantly different between T and NT tissues (86.2 ± 30.3% vs. 5.0 ± 3.2%, p < 0.0002) (Figure 3C). Using, CombiROC software, the diagnostic performance for each gene was evaluated using the area under the ROC curve (AUC). With AUCs ranging from 0.987 to 1.0, each gene has a very high diagnostic accuracy to discriminate non tumoural from tumour prostate tissues (data not shown).

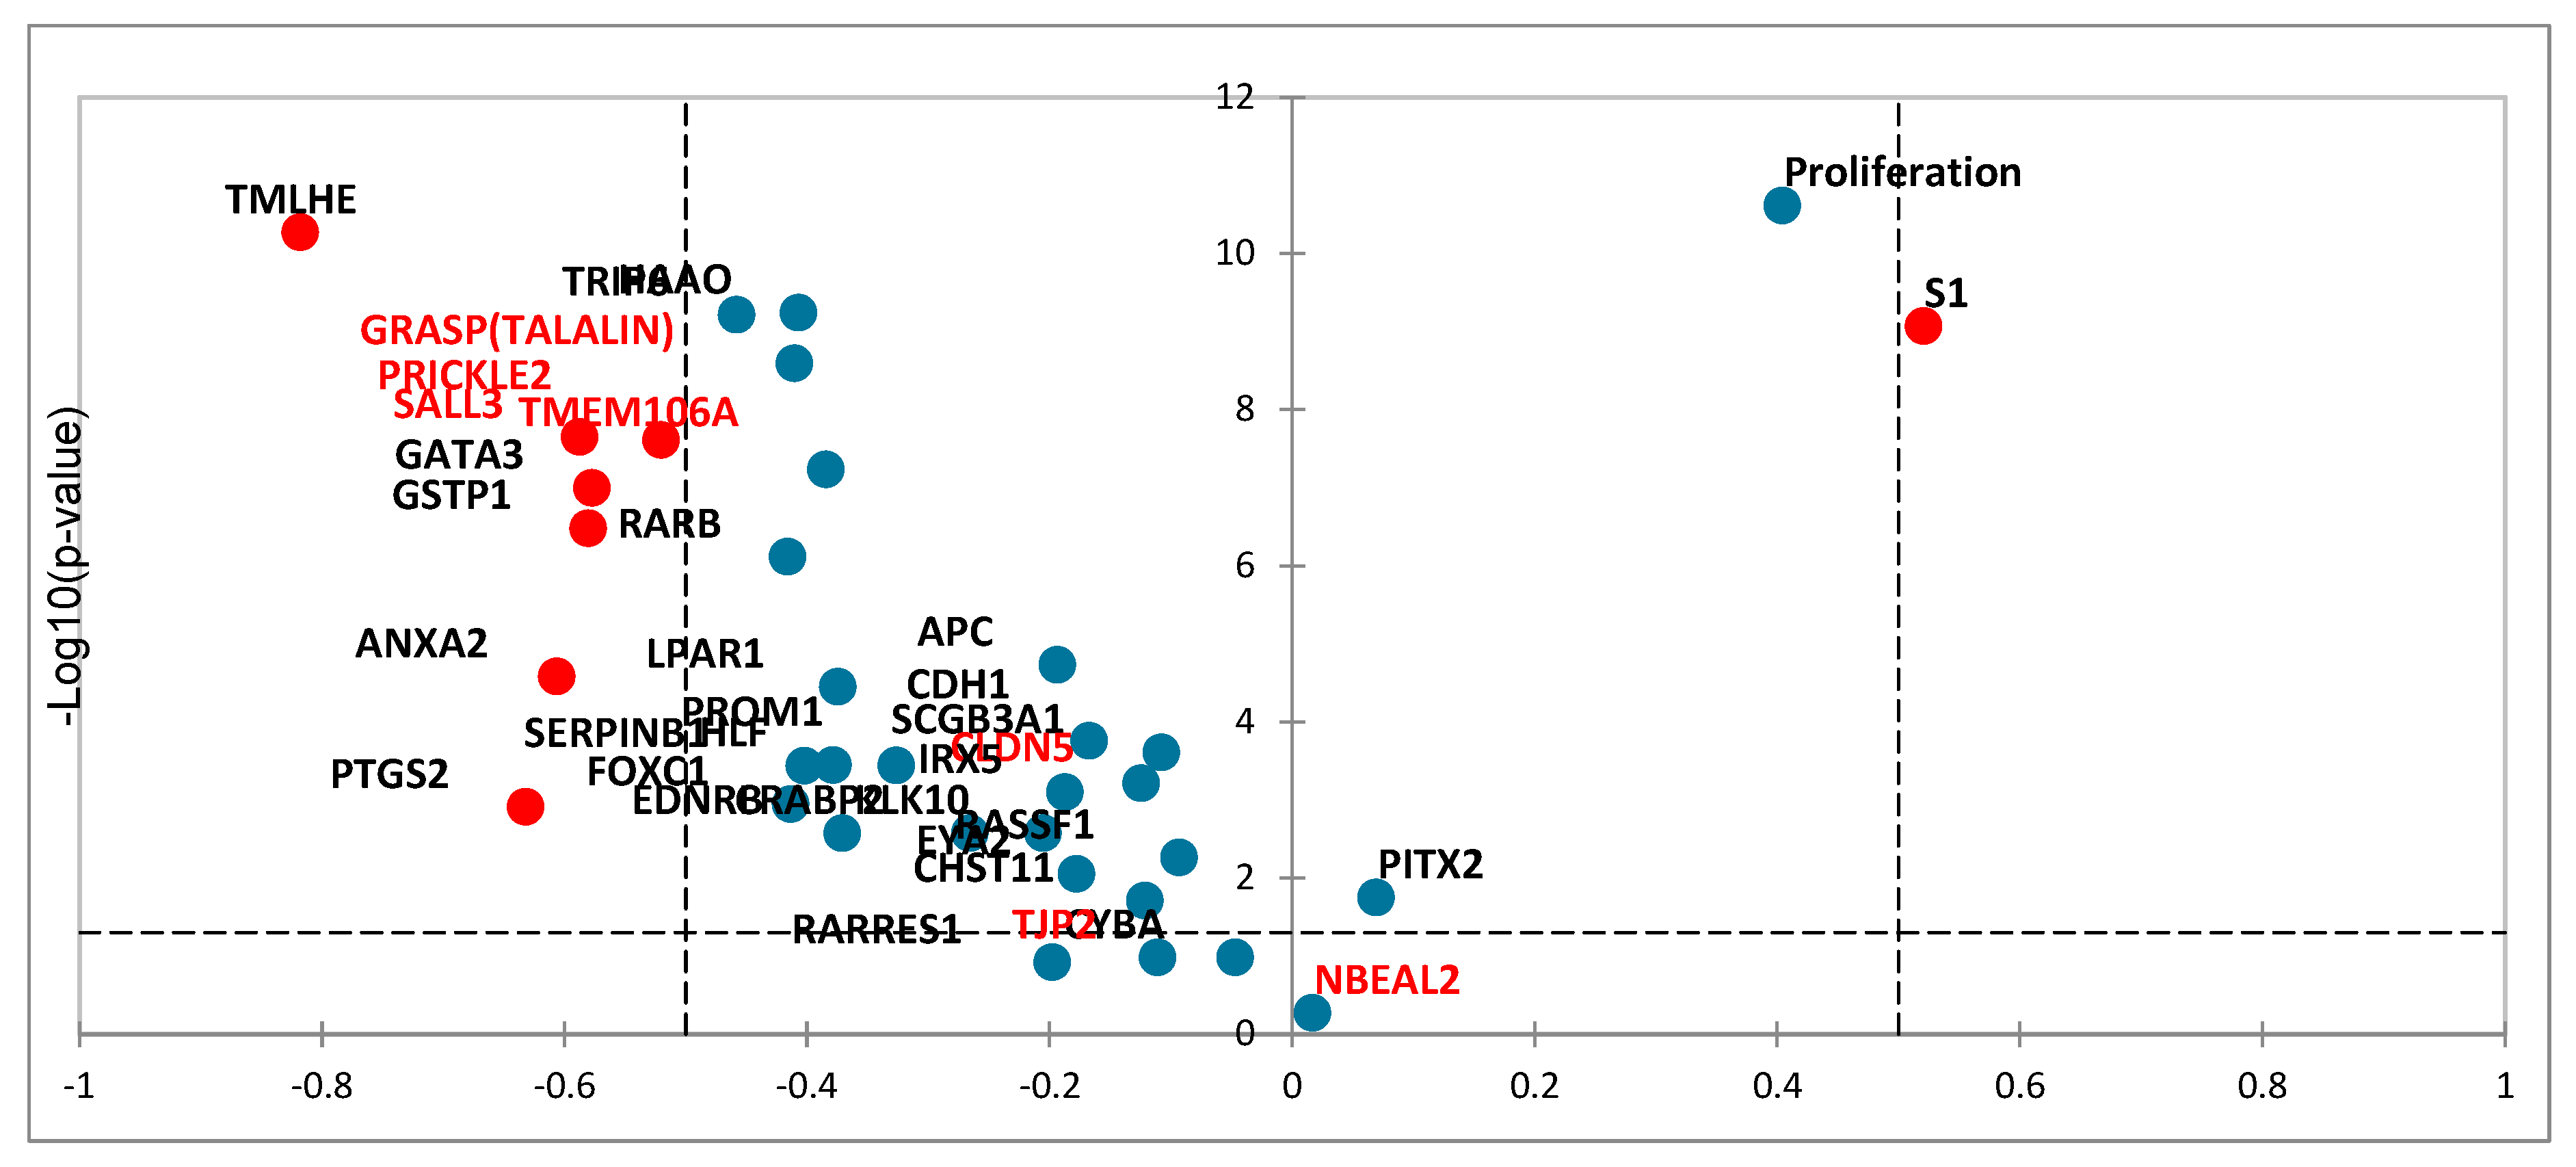
3.4. Tissue RNA Expression of Candidate Genes Using Affimetryx Arrays Data Set and In Situ Expression using Spatial Transcriptomics Visium 10X

3.4.1. Tissue RNA Expression of Candidate Genes Using Affimetryx Arrays Data Set

A Volcano plot (Figure 4) was used to visualize the differential expression between non tumoural and matched tumour tissues for the eight candidate genes and compared it to those of other genes previously reported to be methylated in prostate cancer [12,13,14], and to the mean differential expression levels of genes associated with two prostate cancer aggressiveness signatures (proliferation [15] and S1 signature [16]). Significance of differential expression is reported in Supplement Table S2. For the eight candidate genes, a threshold of significance was obtained for CLDN5 (p-value =0.001), GSTP1 (p-value <0.0001), PRICKLE2 (p-value <0.0001), SALL3 (p-value <0.0001, TAMALIN (p-value <0.0001), and TMEM106A (p-value <0.0001), but not for NBEAL2 and TJP2.
Expression of genes (CLDN5; NBEAL2; PRICKLE2; SALL3; TJP2; TMEM106A; GRASP/TAMALIN) was compared between non tumoral samples and tumours samples according to their aggressiveness defined by ISUP score (Figure S2a,b,c,d,e). Levels of expression were significantly different between non tumoural and cancer with ISUP-1 for CLDN5 (p-value <0.0001), PRICKLE2 (p-value <0.0001), SALL3 (p-value <0.0001), TMEM106A (p-value <0.0001) and GRASP/TAMALIN (p-value <0.0001). Regarding aggressiveness, only the expression of the gene SALL3 was significantly different between ISUP-1 vs ISUP 4 or 5 (p-value <0.006).

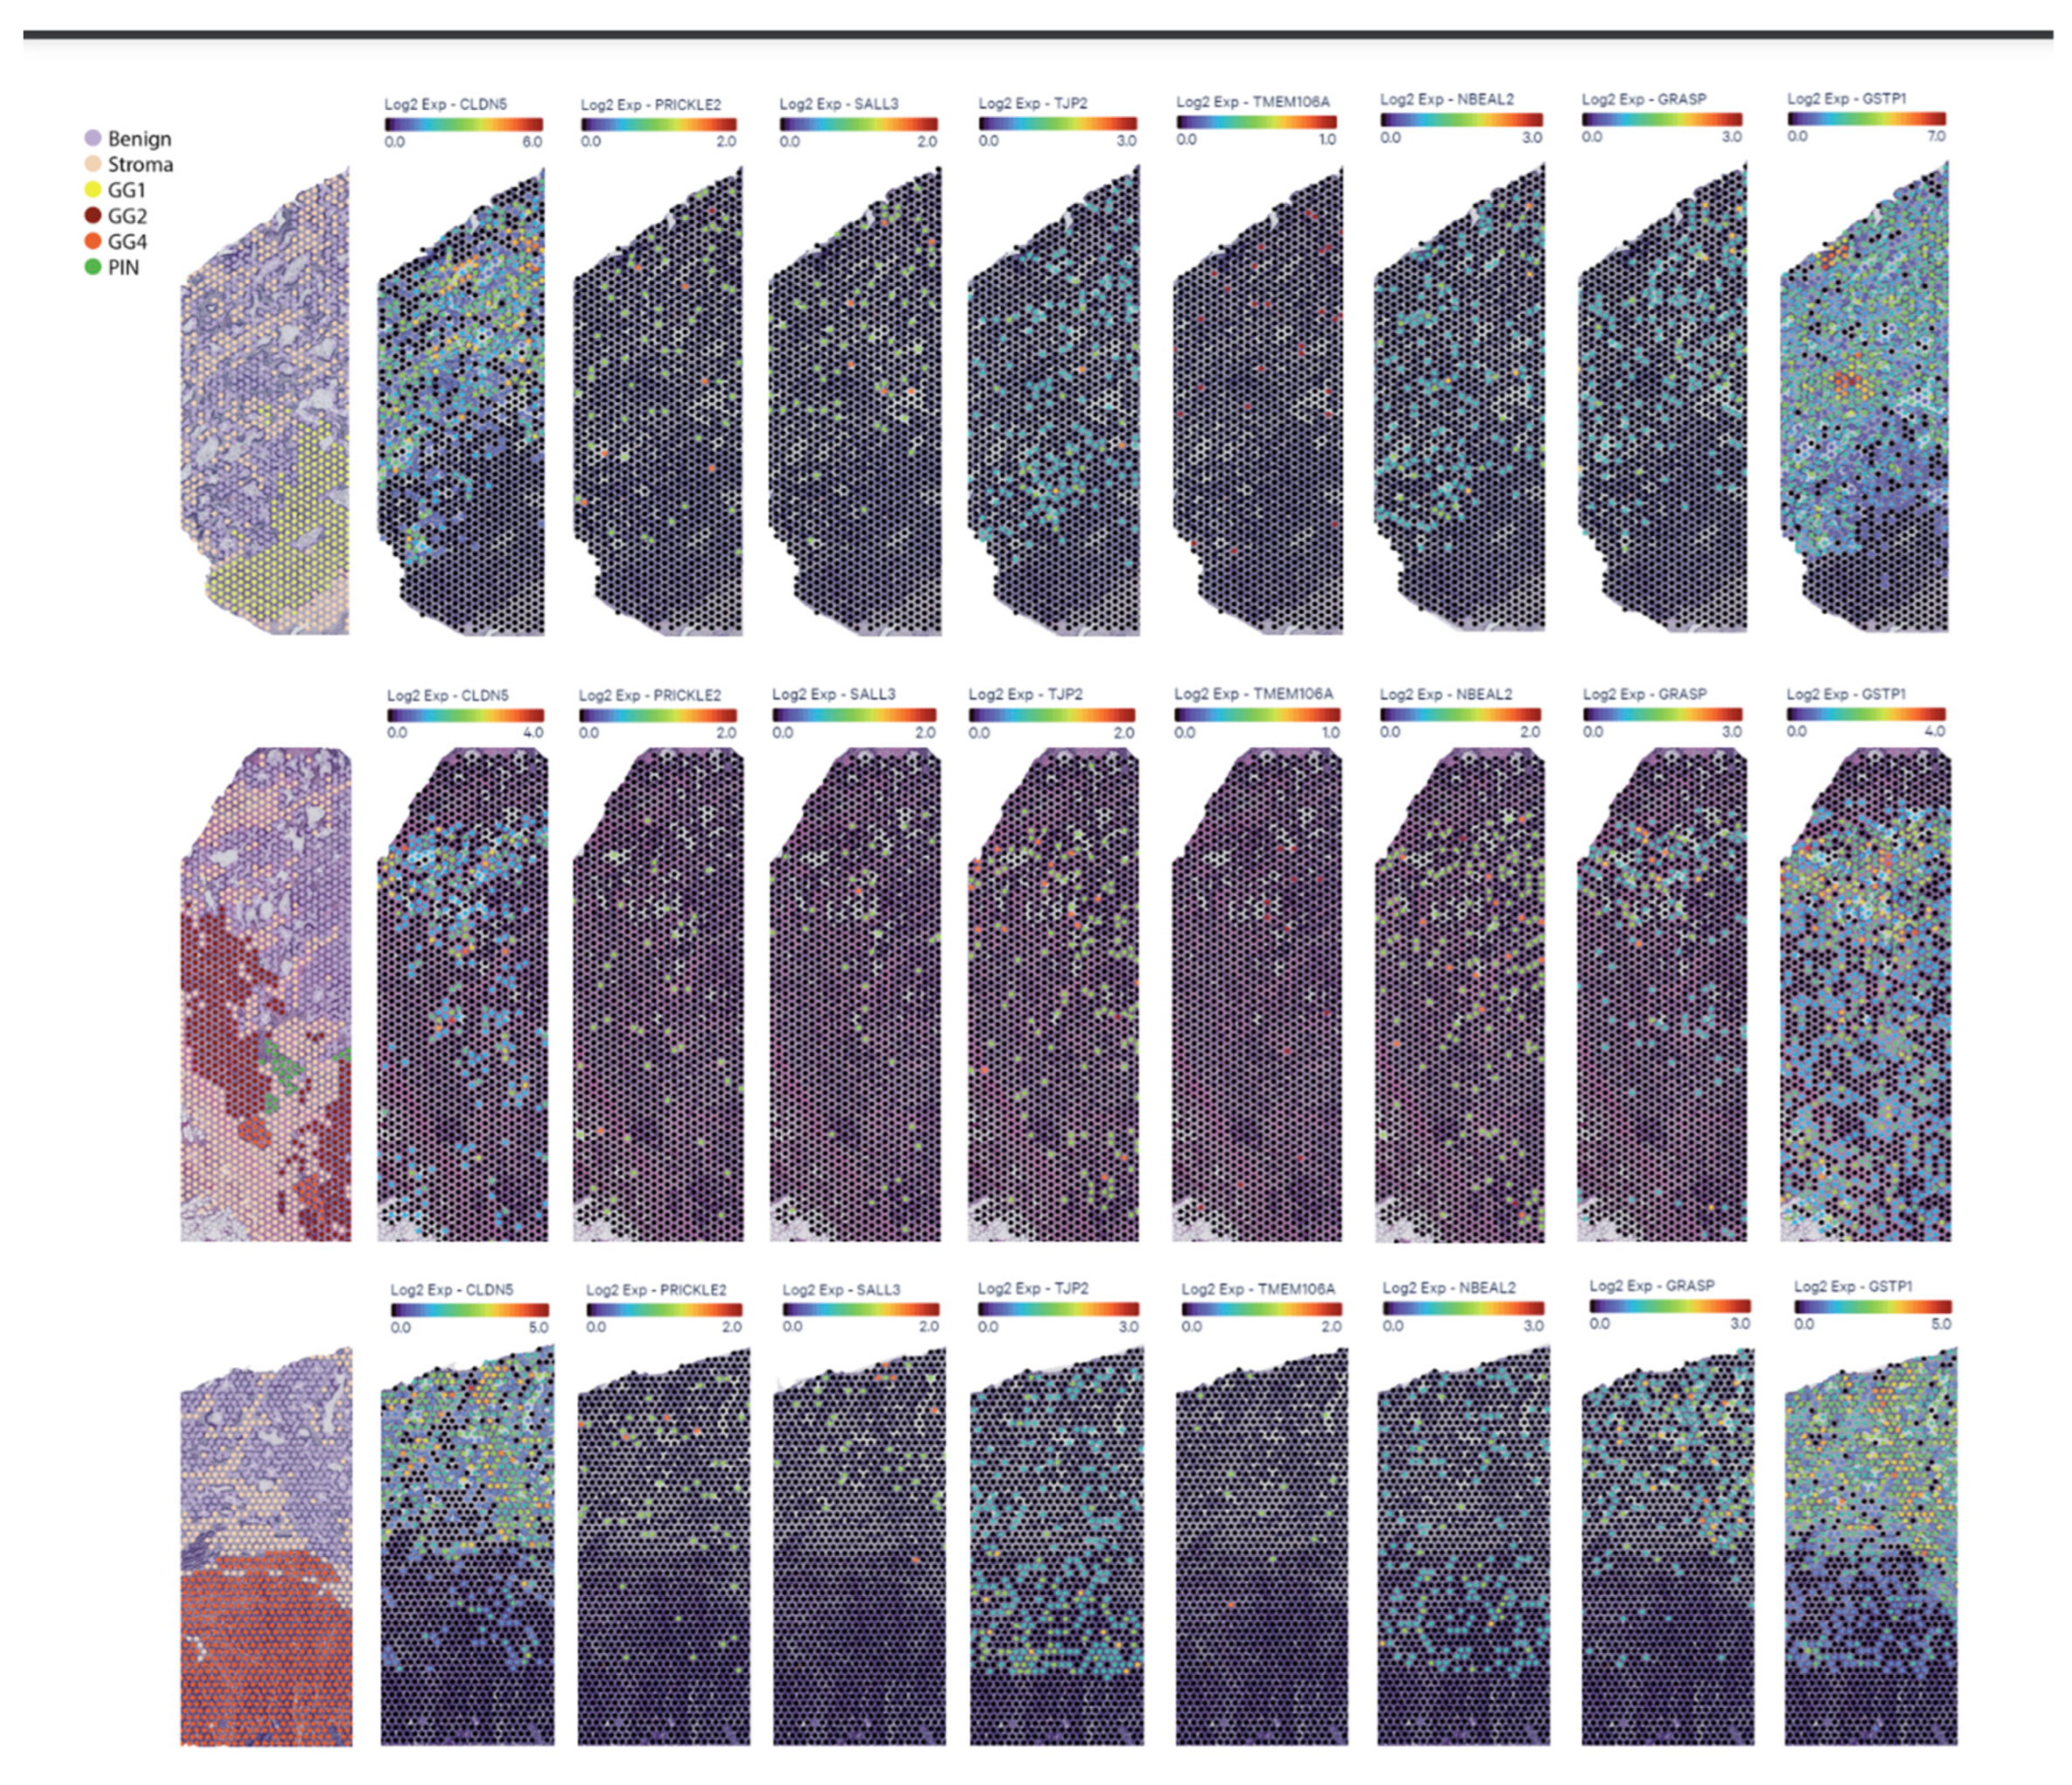
3.4.2. In Situ RNA Expression Using Spatial Transcriptomics Visium 10X

Spatial transcriptomics was used to analyse, alongside histology, the gene expression of the eight candidate genes in three tumour sections containing non-tumoural glands and different grades of aggressiveness (Figure 5). Statistical results are presented in supplement Table S3 and Figure S3.

4. Discussion

So far, serum PSA levels have constituted the most commonly employed measure for the purpose of prostate cancer screening. The main limitation of the serum PSA test is its lack of specificity in the detection of benign prostate disease and prostate cancer. In this context, the replacement of serum PSA with a new accurate blood test remains an unmet need. Alterations in DNA methylation have been associated to many types of cancer. In order to identify novel epigenetic markers with high accuracy and reliability, we conducted a comparative analysis between prostate cancer tissue and adjacent non-tumour tissue samples using the EM-seq. This method was selected as an alternative to bisulfite sequencing and the high-density DNA methylation array (Infinium Human Methylation EPIC/450K array, Illumina). Compared with the other two methods mentioned above, it enables complete and highly accurate detection of CpG sites with single-nucleotide resolution without damaging the DNA [17,18]. EM-seq has been shown to identify more CpG sites and DMRs than the EPIC/450K array [19].
We identified more than 4-million differentially methylated between tumour tissue and non-tumour tissue samples CpG sites in EM-Seq. We validated 66 CpG of them by MM-SPCR, which are associated with CLDN5, GSTP1, NBEAL2, PRICKLE2, SALL3, TAMALIN/GRASP, TJP2/ZO-2 or TMEM106A genes.
Of the genes identified, GSTP1 is the most frequently one referenced in prostate cancer research articles [20,21]. This gene has been identified on chromosome 11q13, a region known to be affected by alterations in numerous cancers [22], and is subject to hypermethylation in different types of cancer, including prostate, breast, lung and hepatocellular carcinoma [23]. Furthermore, Casadio et al. established a causal relationship between the methylation of the GSTP1 promoter and the downregulation of protein expression in prostate cancer [24]. A low level of expression of the GSPT1 protein may be a contributing factor in the progression of prostate cancer [25]. Our study confirms that methylation of the GSPT1 gene promoter is an accurate epigenetic marker for the detection of prostate cancer from tissue samples. In the same way, other studies, including ours, had identified hypermethylated sequences in various genes at different stages of prostate cancer and have been able to detect some of them in circulating cells [13] or from free DNA in plasma [12]. CLDN5 and TJP2/ZO-2 belong to the family of tight junction proteins (TJP). This family of proteins plays an important role in cell-cell adhesion [26], which is lost during malignant transformation [27,28,29,30]. Down-regulation of CLDN5 expression was previously reported in several malignancies, including breast, colorectal, esophageal, lung and brain cancers [31,32,33,34,35]. In prostate cancer, a lower expression of CLDN5 was associated with a higher Gleason score (>7) and high serum PSA, two bad prognosis factors [36,37]. The tissue profile of RNA expression as a function of disease aggressiveness is closely linked to the GSTP1 profile. TJP2/ZO-2 protein expression is downregulated in pancreatic, breast [38], and bladder cancers [39]. We observed that TJP2/ZO-2 RNA expression in tissue decrease only with aggressive disease (ISUP-4 and 5). NBEAL2 and PRICKLE2 genes are located on the short arm of chromosome 3 (3p), a region which is well known for the presence of tumour suppressor genes [40]. Senchenko and colleagues reported DNA hypermethylation of NBEAL2 and PRICKLE2 genes in cervical and ovarian cancers [41,42]. However, NBEAL2 tissue RNA expression did not show significant expression variation in our study. To our knowledge, our work is the first to report hypermethylation of PRICKLE2 in prostate cancer. The gene SALL3 is mapped to chromosome 18q, a region frequently deleted in prostate cancer [43]. Down-regulation of the SALL3 protein, due to hypermethylation of the gene, was observed in most human cancers, such as bladder, cervical, head and neck, liver, oral, pancreatic, and thymic carcinoma [44,45,46,47,48,49,50,51,52]. Interestingly, we observed that SALL3 expression decreases significantly with aggressiveness of tumoural tissue defined by ISUP score.
Bjerre et al. using a high-density DNA methylation array (Infinium Human Methylation EPIC/450K Array, Illumina) found a correlation between high methylation level of the promoter of the TAMALIN/GRASP gene and the CAPRA score, which predicts biochemical recurrence after radical prostatectomy [53]. Other studies reported that TAMALIN/GRASP is also hypermethylated in colon [54] and liver [55,56] cancer tissues. Similarly, using the Infinium HumanMethylation450 array, Govorun and colleagues published that the promoter of the TMEM106A gene showed hypermethylation in prostate cancer [57]. Other studies reported low levels of the TMEM106A protein in different cancers, including prostate, gastric, liver, lung and kidney cancer [58,59,60,61,62]. The observed down-regulation of the expression of this protein could be attributed to methylation of the promoter of the TMEM106A gene, notably in prostate cancer.
In this study, we found a DNA hypermethylation of CLDN5, PRICKLE2, GSTP1, SALL3, TAMALIN, TJP2 and TMEM106A genes in prostate cancer tissue compared to non-tumour adjacent tissue. These markers have the potential to be employed in the development of new non-invasive diagnostic test.

5. Conclusions

Our whole methylome sequencing analysis has revealed epigenetic markers that can accurately discriminate between normal and prostate cancer tissues. To improve the diagnostic accuracy of prostate cancer, it is crucial to evaluate the clinical value of these epigenetic markers, both individually and in conjunction with PSA test, in liquid biopsy samples.

Supplementary Materials

The following supporting information can be downloaded at: www.mdpi.com/xxx/s1. Table S1: Mean methylation levels of selected CpG sites by EM-seq in tissue samples; Table S2: Differential expression (Volcano plot) between non tumoural and tumoural prostatic tissues; Figure S1: CpG, CHG and CHH methylation in tissue samples; Figure S2: Scattergrams comparing RNA expression in the PROGENE cohort of CLDN5; NBEAL2; PRICKLE2; SALL3; TJP2; TMEM106A and GRASP/TAMALIN genes between prostate tissues according to aggressiveness. Table S3 and Figure S3: Statistical results of spatial transcriptomics study of CLDN5, GSPT1, NBEAL2, PRICKLE2, SALL3, GRASP/TAMALIN, TJP2, TMEM106A.

Author Contributions

Study design and the development of methodology: CH, GCT, JPR and OC. Data acquisition and analysis: GC, JPR, OC. SF, AL, IM. Writing manuscript: All authors read and approved the final manuscript for publication.

Funding

This project was supported in part by Bpifrance and the Normandy Region

Institutional Review Board Statement

This study was approved by the CCP Ile de France IV (IRB: 00003835).

Informed Consent Statement

Patients’ informed consent was obtained for all human tissue samples used in this study.

Data Availability Statement

The data from this study are available from the corresponding author upon request.

Acknowledgments

The whole-genome methylation sequencing benefited from equipment and services from the iGenSeq core facility (Genotyping and sequencing), at Paris Brain Institute (ICM).

Conflicts of Interest

Claude Hennion is President and Jean-Pierre Roperch is Chief Scientific Officer of OncoDiag company. The remaining authors declare that there are no conflicts of interest.

References

  1. Sung, H.; J. Ferlay, R. L. Siegel, M. Laversanne, I. Soerjomataram, A. Jemal.; et al. Global Cancer Statistics 2020: GLOBOCAN Estimates of Incidence and Mortality Worldwide for 36 Cancers in 185 Countries. CA Cancer J Clin. 2021, 71(3):209–249. [CrossRef]
  2. Van Poppel, H.; Albreht, T.; Basu, P.; et al. Serum PSA-based early detection of prostate cancer in Europe and globally: past, present and future. Nature Reviews Urology. 2022, 19, 562–572.
  3. Merriel, SWD.; Pocock, L., Gilbert, E.; et al. Systematic review and meta-analysis of the diagnostic accuracy of prostate-specific antigen (PSA) for the detection of prostate cancer in symptomatic patients. BMC Medicine. 2022, 20:54. [CrossRef]
  4. Catalona, WJ.; Smith, DS.; Ratliff, TL.; et al. Measurement of Prostate-Specific Antigen in Serum as a Screening Test for Prostate Cancer. N Engl J Med. 1991, 324:1156-1161.
  5. Bernal-Soriano, MC.; Parker, LA.; Lopez-Garrigos, M.; et al. Factors associated with false negative and false positive results of prostate-specific antigen (PSA) and the impact on patient health: Cohort study protocol. Medicine. 2019, 98(40):e17451.
  6. Esteller, M. Epigenetics in cancer. N. Engl. J. Med. 2008, 358, 1148–1159.
  7. Baylin, P.; Jones, A. A decade of exploring the cancer epigenome-biological and translational implications. Nat. Rev. Cancer. 2011, 11, 726–734.
  8. Jeronimo, C.; Bastian, PJ.; Bjartell, A.; Carbone, GM.; Catto, JW.; Clark, SJ.; Henrique, R.; Nelson, WG.; Shariat.; SF. Epigenetics in prostate cancer: biologic and clinical relevance. European urology. 2011, 60(4):753–766. [CrossRef]
  9. Majumdar, S.; Buckles, E.; Estrada, J.; et al. Aberrant DNA Methylation and Prostate Cancer. Curr Genomics. 2011, 12(7):486-505.
  10. Massie, CE.; Mills IG.; Lynch, AG. The importance of DNA methylation in prostate cancer development. Journal of Steroid Biochemistry & Molecular Biology. 2017, 166:1–15.
  11. Erickson, A.; He, M.; Berglund, E.; Marklund, M.; Mirzazadeh, R.; Schultz, N.; Kvastad, L.; Andersson, A.; et al. Spatially resolved clonal copy number alterations in benign and malignant tissue. Nature. 2022, 608, 360–367. [CrossRef]
  12. Dillinger, T.; Sheibani-Tezerji R.; Pulverer, W.; Stelzer, I.; Hassler, MR.; Scheibelreiter, J.; Pérez Malla, CU.; et al. Identification of tumor tissue-derived DNA methylation biomarkers for the detection and therapy response evaluation of metastatic castration resistant prostate cancer in liquid biopsies. Mol Cancer. 2022, Jan 3;21(1):7.
  13. Rouprêt, M.; Hupertan, V.; Catto, JW.; Yates, DR.; Rehman, I.; Proctor, LM.; Phillips, J.; Meuth, M.; Cussenot, O.; Hamdy FC. Promoter hypermethylation in circulating blood cells identifies prostate cancer progression. Int J Cancer. 2008, Feb 15;122(4):952-6.
  14. Li, Y.; Meng, L.; Shi, T.; Ren, J.; Deng, Q. Diagnosis and prognosis potential of four gene promoter hypermethylation in prostate cancer. Cell Biol Int. 2021, Jan;45(1):117-126. [CrossRef]
  15. Kuhl, V.; Clegg, W.; Meek, S.; Lenz, L.; Flake, DD.; Ronan, T.; Kornilov, M.; Horsch, D.; Scheer, M.; Farber, D.; Zalaznick, H.; Cussenot, O.; Compérat, E.; Cancel-Tassin, G.; et al. Development and validation of a cell cycle progression signature for decentralized testing of men with prostate cancer. Biomark Med. 2022, Apr;16(6):449-459.
  16. Kamoun, A.; Cancel-Tassin, G.; Fromont, G.; Elarouci, N.; Armenoult, L.; Ayadi, M.; Irani, J.; Leroy, X.; Villers A.; et al. Comprehensive molecular classification of localized prostate adenocarcinoma reveals a tumour subtype predictive of non-aggressive disease. Ann Oncol. 2018, Aug 1;29(8):1814-1821. [CrossRef]
  17. Hoppers, A.; Williams, L.; Ponnaluri, VKC.; et al. Enzymatic Methyl-seq: Next Generation Methylomes. J Biomol Tech. 2020, 31:S15.
  18. Vaisvila, R.; Ponnaluri, VKC.; Sun, Z.; and al. Enzymatic methyl sequencing detects DNA methylation at single-base resolution from picograms of DNA. Genome Res. 2021, 17;31(7):1280-1289. [CrossRef]
  19. Füllgrabe, J.; Gosal, WS.; Creed, P.; et al. Simultaneous sequencing of genetic and epigenetic bases in DNA. Nature Biotechnology. 2023, 41, 1457-1464. [CrossRef]
  20. Costa, VL.; Henrique, R.; Jeronimo C. Epigenetic markers for molecular detection of prostate cancer. Disease Markers. 2007, 23:31-41.
  21. Goering, W.; Kloth, M.; Schulz, WA. DNA methylation changes in prostate cancer. Methods Mol Biol. 2012, 863:47-66.
  22. Lammie, GA. ; Peters, G. Chromosome 11q13 abnormalities in human cancer. Cancer Cells. 1991, 3(11):413-20.
  23. Gurioli, G.; Martignano, F.; Salvi, S.; Costantini, M.; Gunelli, R.; Casadio, V. GSTP1 Methylation in Cancer: A Liquid Biopsy Biomarker? Clin. Chem. Lab. Med. 2018, 56, 702–717.
  24. Martignano, F.; Gurioli, G.; Salvi, S.; Calistri, D.; Costantini, M.; Gunelli, R et al. GSTP1 Methylation and Protein Expression in Prostate Cancer: Diagnostic Implications. Disease Markers. 2016, 10:4358292.
  25. Jian, C.; Guoqing, L.; Jie, Y.; Linwei, L.; Yue, T.; Haoran, W.; Bang, L.; Lihong, D.; Jialu, T.; Yongli, C and Lan, Y. GSTP1 and cancer: Expression, methylation, polymorphisms and signaling. International Journal of oncology. 2020, 56: 867-878.
  26. Singh, AB.; Sharma, A.; Dhawan. Claudin Family of Proteins and Cancer: An Overview. Journal of Oncology. 2010, 541957.
  27. Coradini, D.; Casarsa, C.; Oriana, S. Epithelial cell polarity and tumorigenesis: new perspectives for cancer detection and treatment. Acta Pharmacologica Sinica. 2011, 32: 552–564.
  28. Sawada, N.; Murata, M.; Kikuchi, K.; et al. Tight junctions and human diseases. Medical Electron Microscopy. 2023, Volume 36, no. 3, 147–156.
  29. Martin, TA.; Jiang, WG. Loss of tight junction barrier function and its role in cancer metastasis. Biochimica et Biophysica Acta. 2009, Volume 1788, no. 4, 872–891.
  30. Martin, TA.; Mason, MD.; Jiang, WG. Tight junctions in cancer metastasis. Front Biosci (Landmark Ed). 2011, 16,898.
  31. Yuang, G.; Jiang, L.; Chen, Q. Comprehensive analysis of expression and prognostic value of the claudin family in human breast cancer. Aging. 2021, Volume 13, no. 6.
  32. Cherradi, S.; Martineau, P.; Gongora, C.; et al. Claudin gene expression profiles and clinical value in colorectal tumors classified according to their molecular subtype. Cancer Management and Research. 2019, 11, 1337–1348.
  33. Huang, S.; Zhang, J.; Li, Y.; et al. Downregulation of Claudin5 promotes malignant progression and radioresistance through Beclin1-mediated autophagy in esophageal squamous cell carcinoma. J. Transl Med. 2023, 11;21(1):379.
  34. Yang, R.; Zhou, Y.; Du, C.; Wu, Y. Bioinformatics analysis of differentially expressed genes in tumor and paracancerous tissues of patients with lung adenocarcinoma. J Thorac Dis. 2020, 12:7355–64.
  35. Karnati, HK.; Panigrahi, M.; Shaik, NA.; et al. Down regulated expression of Claudin-1 and Claudin-5 and up regulation of β-catenin: Association with Human Glioma Progression. CNS Neurol Disord Drug Targets. 2014, 13(8): 1413-1426. [CrossRef]
  36. Väre, P.; Loikkanen, I.; Hirvikoski, P.; Vaarala, MH.; Soini, Y. Low claudin expression is associated with high Gleason grade in prostate adenocarcinoma. Oncol Rep. 2008, 19,25.
  37. Seo, KW.; Kwon, YK.; Kim, BH.; et al. Correlation between Claudins Expression and Prognostic Factors in Prostate Cancer. Korean Journal of Urology. 2010, 51:239-244.
  38. Chlenski, A.; Ketels, KV.; Korovaitseva, GI.; et al. Organization and expression of the human zo-2 gene (tjp-2) in normal and neoplastic tissues. Biochim Biophys Acta. 2000, 2;1493(3):319-24.
  39. Chihara, Y.; Hanai, Y.; Fujimoto, H.; et al. Diagnostic markers of urothelial cancer based on DNA methylation analysis. BMC Cancer. 2013, 13:275.
  40. Zabarovsky, ER.; Lerman, MI.; Minna, JD. Tumor suppressor genes on chromosome 3p involved in the pathogenesis of lung and other cancers. Oncogene. 2002, 7;21(45):6915-35.
  41. Senchenko, VN.; Kisseljova, NP.; Ivanova, TA.; et al. Novel tumor suppressor candidates on chromosome 3 revealed by NotI-microarrays in cervical cancer. Epigenetics. 2013, 8:4, 409–420.
  42. Kashuba, V.; Dmitriev, AA.; Krasnov, GS. NotI Microarrays: Novel Epigenetic Markers for Early Detection and Prognosis of High Grade Serous Ovarian Cancer. Int. J. Mol. Sci. 2012, 13, 13352-13377.
  43. Kluth, M.; Graunke, M.; Möller-Koop, C.; et al. Deletion of 18q is a strong and independent prognostic feature in prostate cancer. Oncotarget. 2016, 27; 7(52): 86339-86349.
  44. Yu, J.; Zhu, T.; Wang, Z.; et al. A novel set of DNA methylation markers in urine sediments for sensitive/specific detection of bladder cancer. Clin. Cancer Res. 2007, 15,13(24):7296-304.
  45. Wei, X.; Zhang, S.; Cao, D.; et al. Aberrant Hypermethylation of SALL3 with HPV Involvement Contributes to the Carcinogenesis of Cervical Cancer. Plos One. 2015, 23;10(12):e0145700.
  46. Misawa, K.; Kanazawa, T.; Mochizuki, D.; et al. Genes located on 18q23 are epigenetic markers and have prognostic significance for patients with head and neck cancer. Cancers. 2009, 11,401.
  47. Misawa, K.; Mochizuki, D.; Imai, A.; et al. Epigenetic silencing of SALL3 is an independent predictor of poor survival in head and neck cancer. Clin Epigenetics. 2017, 12:9:64. [CrossRef]
  48. Shikauchi, Y.; Saiura, A.; Kubo, T.; et al. SALL3 interacts with DNMT3A and shows the ability to inhibit CpG island methylation in hepatocellular carcinoma. Mol Cell Biol. 2009, 29(7):1944-58.
  49. Yang, XX.; Sun, JZ.; Li, FX.; et al. Aberrant methylation and downregulation of sall3 in human hepatocellular carcinoma. World J Gastroenterol. 2012, 7;18(21):2719-26.
  50. Imai, A.; Mochizuki, D.; Misawa, Y.; et al. SALL2 Is a Novel Prognostic Methylation Marker in Patients with Oral Squamous Carcinomas: Association with SALL1 and SALL3 methylation status. DNA Cell. Biol. 2019, 38(7):678-687.
  51. Sato, N.; Fukushima, N.; Maitra, A.; Matsubayashi, H.; Yeo, CJ.; Cameron, JL.; Hruban, RH.; et Goggins M. Discovery of novel targets for aberrant methylation in pancreatic carcinoma using high-throughput microarrays. Cancer Res. 2003, 63, 3735 – 3742.
  52. Kishibuchi, R.; Kondo, K.; Soejima, S.; et al. DNA methylation of GHSR, GNG4, HOXD9 and SALL3 is a common epigenetic alteration in thymic carcinoma. Int J Oncol. 2020, 56(1):315-326.
  53. Bjerre, MT.; Strand, SH.; Norgaard, M., et al. Aberrant DOCK2, GRASP, HIF3A and PKFP hypermethylation has potential as a prognostic biomarker for prostate cancer. Int. J. Mol. Sci. 2009, 20, 1173.
  54. Mitchell, S.; Ross, JP.; Drew, HR.; et al. A panel of genes methylated with high frequency in colorectal cancer. BMC Cancer. 2014, 14:54.
  55. Shen, J.; Le Fave, C.; Sirosh, I.; et al. Integrative epigenomic and genomic filtering for methylation markers in hepatocellular carcinomas. BMC Med Genomics. 2015, 8:28. [CrossRef]
  56. Yamada, N.; Yasui, K.; Dohi, O.; et al. Genome-wide DNA methylation analysis in hepatocellular carcinoma. Oncol Rep. 2016, 35(4):2228-36.
  57. Babalyan, KA.; Sultanov, R.; Generozov, EV.; Zakharzhevskaya, NB.; Sharova, EI.; Peshkov, MN et al. Genome-wide analysis of DNA methylation in prostate cancer using the technology of Infinium HumanMethylation450 BeadChip (HM450. Voprosy Onkologii. 2016, 62(1) :122-132.
  58. Geybels, MS.; Zhao, S.; Wong, CJ.; et al. Epigenomic profiling of DNA methylation in paired prostate cancer versus adjacent benign tissue. Prostate. 2015, 75(16):1941–1950.
  59. Xu, D.; Qu, L.; Hu, J.; Li, G.; Lu, P.; Ma, D.; Guo, M.; Chen, Y. Transmembrane protein 106a is silenced by promoter region hypermethylation and suppresses gastric cancer growth by inducing apoptosis. J Cell Mol Med. 2014, 18:1655-1666.
  60. Shi, S.; Wang, B.; Wan, J.; et al. TMEM106A transcriptionally regulated by promoter methylation is involved in invasion and metastasis of hepatocellular carcinoma. Acta Biochim Biophys Sin. 2022, 54(7): 1008-1020.
  61. Liu, J.; Zhu, H. TMEM106A inhibits cell proliferation, migration, and induces apoptosis of lung cancer cells. J Cell Biochem. 2019, 120(5):7825-7833.
  62. Wu, C.; Xu, J.; Wang, H.; and al. TMEM106a is a Novel Tumor Suppressor in Human Renal Cancer. Kidney Blood Press Res. 2017, 42:853-864. [CrossRef]
Figure 1. Quantification of cytosine methylation based on methylome sequencing. (A) Density of distribution for CpG methylation in whole genome. Each row represents a sample. (B) Proportion of CpG methylation loci with values below 0.2 and above 0.8 methylation level by sample. (C) Principal component analysis on CpG methylation values. Samples from the same patient are connected with a dotted line. (D) synthetic flowchart for the bioinformatic analysis.
Preprints 143729 g001
Figure 2. Identification of 8 key DMR and selection of highly methylated CpG sites. (A): Genomic views of the 8 selected DMR associated with CLDN5, GSTP1, NBEAL2, PRICKLE2, SALL3, TAMALIN, TJP2 and TMEM106A genes. Indicated in green rectangles, DMR selection is based on the number of CpG sites with highly methylated cytosines. (B): Heatmap analysis of 66 highly differentially methylated CpG sites between non-tumour adjacent tissue and tumour tissue. Purple, brown and orange bars indicate primers (forward and reverse) and probes used for MM-SPCR. The light brown square indicates no CpG data.
Preprints 143729 g002
Figure 3. DNA methylation levels of epigenetic markers by MM-SPCR. (A) Mean PMR values per gene were plotted as bar charts in each sample. (B) Mean cumulative PMR values per gene for pooled samples: tumour (T) and non-tumour adjacent (NT) tissue (p <0.0001). (C) Mean cumulative of PMR values of all genes for T and NT tissues (86.2 ± 30.3% and 5.0 ± 3.2%, respectively, p <0.0001).
Preprints 143729 g003
Figure 4. Volcano plot showing differential expression between non tumoural and matched tumour tissues (Figure 4, Table S1) shown differential expression of the candidate genes (CLDN5, GSTP1, NBEAL2, PRICKLE2, SALL3, TAMALIN, TJP2 and TMEM106A) and compared it to others genes previously reported as methylated in prostate cancer and mean of expression genes associated to prostate cancer aggressiveness (proliferation: ASPM, CDK1,DTL, KIAA0101, PRC1, TK1, CDKN) and S1 signature: ERG, TMEM45B, TANC1, RGS17, LRRN1, WT1, SAMD1, PIGZ.
Preprints 143729 g004
Figure 5. Spatial visualisation of histology and gene expression (CLDN5, PRICKLE2, SALL3, TJP2, TMEM106A, NBEAL2, GRASP, and GSTP1) based on organ-wide spatial transcriptomics data from three tumour sections. PIN = prostatic intra-epithelial neoplasia. GG = Gleason grade group (GG1, Gleason score ≤ 6; GG2, Gleason score 3 + 4 = 7; GG4, Gleason score 4+4 = 8).
Preprints 143729 g005
Table 1. Clinical characteristics of patients with primary PCa.
N° ID Age PR ISUP pT Surgical margin PSA level (ng/ml)
1 65 2 T2c Negative ND
2 65 3 T2c Negative 5
3 70 2 T3a Negative ND
4 60 1 T2c Negative 4.4
5 67 5 T2c Negative 4.3
6 70 5 T3a Negative 8.3
7 70 5 T3a Positive 14
8 68 1 T2 Negative 6.59
9 64 1 T2 Negative 9.40
10 69 3 T2cR1 Positive 10
11 69 1 T2 Negative 3.79
12 62 1 T2 Negative 7.19
13 73 1 T3aR1 Positive 11.44
14 71 1 T2cR1 Positive 6.89
15 59 1 T2c Negative 5.3
Age PR: Age of patient at time of radical prostatectomy; ISUP (International Society of Urological Pathology): System for grading of PCa; pT: Pathological tumoral stage; PSA: Prostate-specific antigen measured in the blood.
Table 2. Design of primers and TaqMan MGB probes.
Gene Oligonucleotide sequence (5’→ 3’) CpG DNA size, bp
ALBUMIN Fw
Rv
Pr
GGGATGGAAAGAATTTTATGTT
AAACAAACTAACCCCAAATTCT
Vic-AGGGTTTTTATAATTTA
0
0
0
76
CLDN5 Fw
Rv
Pr
TTTGGTAGTTGAAGTTAGGGAAATAACG
CCGCGACTAAAACAACGACG
6Fam-AACGACTACCGAACGAAA
1
4
3
112
GSTP1 Fw
Rv
Pr
TGGGGTCGGCGGGAGTTC
ATAATCCCGCCCCGCTCC
6Fam-AATCACGACGCCGACCGCTCTT
3
3
4
84
NBEAL2 Fw
Rv
Pr
CGGGGTTTTTCGGTTTTTAAGTC
AAAAAAACCGAAACCGCCG
6Fam-CGTTAAAGTACGAGGGTCGT
3
3
3
88
PRICKLE2 Fw
Rv
Pr
TAGGAGTAAATATGTTTTTGCGTCG
AATTTCCCGAACCGACAAAAAC
Ned-CGCAACGTCGAAACA
2
3
3
117
SALL3 Fw
Rv
Pr
AGAATGGAAGGGAGTTCGTCG
CCGCCTAAAAAAAAAATCCCC
6Fam-TCGAACCCGACCTAAC
2
2
3
83
TAMALIN Fw
Rv
Pr
TTTTTCGTTGTTGCGAAGGTC
ATAAAACGCGAAATTAAAAACCACC
Vic-CGTTTGTATATCGCGTTTAG
3
3
3
78
TJP2 Fw
Rv
Pr
AAATGTCGGTGCGAGGAGATC
CGACACAAAAAAACACTTACGCG
Ned-ACCTAACAACTCCCGCCGA
3
3
2
82
TMEM106A Fw
Rv
Pr
TTTGAGGGGAGTGTTCGTTTTC
AAAAACCTTACCCGCGAACG
6Fam-ACAACGACAAAAACGAA
2
3
2
83
Fw: Forward primer; Rv: Reverse primer; Pr: TaqMan MGB probe; Methylated CpG sites are shown in bold red.
Disclaimer/Publisher’s Note: The statements, opinions and data contained in all publications are solely those of the individual author(s) and contributor(s) and not of MDPI and/or the editor(s). MDPI and/or the editor(s) disclaim responsibility for any injury to people or property resulting from any ideas, methods, instructions or products referred to in the content.
Copyright: This open access article is published under a Creative Commons CC BY 4.0 license, which permit the free download, distribution, and reuse, provided that the author and preprint are cited in any reuse.
Prerpints.org logo

Preprints.org is a free preprint server supported by MDPI in Basel, Switzerland.

Subscribe

Disclaimer

Terms of Use

Privacy Policy

Privacy Settings

© 2025 MDPI (Basel, Switzerland) unless otherwise stated