
Submitted:
20 December 2024
Posted:
23 December 2024
You are already at the latest version
Abstract
Climate change, exacerbated by global warming in recent decades, has had a devastating impact on agriculture, leading to a significant decline in productivity in some areas. In some regions, the extreme effects have resulted in the complete destruction of crops, threatening food security and the balance of ecosystems, while in others production has fallen to alarming levels. The automation of irrigation, together with the generation of climate reports based on artificial intelligence, contributes to the optimization of resources by reducing excessive water and energy consumption, supporting plant health through proper irrigation and increasing sustainable agricultural productivity by providing suggestions and statistics to streamline the agricultural process. In this paper, the authors present a system that allows real-time monitoring of parameters such as temperature and humidity, providing detailed information and advanced analytics for each device and area monitored using AI (Artificial Intelligence). This uses data from all the devices that are integrated into the application to assess the state of the climate at a national level. The integration of artificial intelligence in the context of monitoring and irrigation of agricultural areas is a step forward in the development of sustainable agriculture and for the adaptation of agriculture to increasingly aggressive climate phenomena.
Keywords:
sensors
; artificial intelligence
; irrigation system
; data analysis
1. Introduction
In recent years, the climate in Romania has undergone significant changes, such as extreme temperature increases over long periods, the depletion of hydrological resources in many areas of the country and, in extreme cases, even rapid desertification. This has an impact on the soil in the affected areas and results in a reduction in crop yields. The lack of modern irrigation systems exacerbates these problems, leaving farmers without effective solutions to combat drought and maintain the productivity of agricultural land.
In the context of ensuring rich harvests, the introduction of modern agricultural techniques becomes necessary. The use of new data-driven technologies is helping to provide appropriate solutions for increasing crop yields, a concept known as precision agriculture. This type of agriculture monitors the climatic factors, the soil, the type of plant and its needs in order to obtain a quality production [1].
In this sense, the implementation of automated systems using the IoT (Internet of Things) technology that allows real-time monitoring of environmental parameters such as soil, air and water, providing a deeper understanding of their impact on plants and contributing to the user’s adaptation to natural conditions [2]. This data plays an essential role in understanding plant development processes and optimizing irrigation processes, thereby supporting the sustainability and efficiency of agriculture.
In this article, the authors present an example of an IoT system that includes a hardware part consisting of an ESP32 microcontroller and a DHT11 sensor, combined with an efficient software infrastructure based on ReactJS and Python. The microcontroller’s role is to collect temperature and humidity data from the sensor, which is centralized in a database and displayed in real time via an easy-to-use graphical interface. The hardware system is designed to operate independently and can be integrated into a network with multiple IoT systems, allowing data to be collected and transmitted from multiple locations, from local to national levels. The collected data are sent to the server via a secure WebSocket connection, where they are stored in a database, organized by the device’s unique identity and geographical location. The system allows dynamic configuration of monitoring stations, which are identified only by a unique ID and access key stored internally, with the rest of the information such as location, name, coordinates stored on the server. The architecture of the proposed IoT system is illustrated in Figure 1.
The integration of irrigation systems with IoT technology allows for promising results to be achieved through the implementation of modern techniques. This approach offers features such as activating irrigation as needed and analyzing daily water use [3]. In this context, the combination of cost-effective hardware technologies and robust software solutions represents an essential starting point for the development of affordable environmental monitoring systems for farmers [4].
This paper is structured as follows: after a brief introduction in Section 1, an analysis of IoT-based automatic irrigation systems and their applications in agriculture is presented in Section 2, Related Work. The materials and methods used to develop the proposed system are described in Section 3. Section 4 presents the proposed automated irrigation system, including location monitoring and interactive mapping, irrigation control mechanisms, and the integration of artificial intelligence for data analysis and visualization. Section 5 explores the implications of AI in agriculture, highlighting the impact of AI on irrigation automation, decision making, and the role of the system in promoting agricultural sustainability. The discussions are outlined in section 6. The final conclusions are presented in section 7.
2. Related Work
The authors [5] propose an automated irrigation mechanism based on the Arduino platform that uses moisture sensors to monitor soil water levels and automatically deliver the required amount of water to the plants. The sensors send data to the Arduino microcontroller, which calculates water requirements based on pre-defined values in the code and activates the irrigation system only when needed. This process optimizes the use of water, saves time and resources, and provides an efficient solution for farmers, especially those in rural areas where access to technology is limited.
In [6] the autonomous monitoring of the irrigation system in large and small plantations is aimed at eliminating the manual system. The proposed system monitors temperature, humidity, soil moisture and other physical factors such as the presence of major air pollutants. The factors and crop yields will be compared with data from previous surveys. An attempt will be made to predict irrigation requirements.
The authors in [7] propose a temperature and humidity monitoring system using the DHT11 sensor. The ESP32 microcontroller is used as the central processing unit due to its efficient processing capability and low power consumption. The system collects the data from the sensors, processes it and transmits it via Wi-Fi to the cloud platform, where Blynk is used for the visualization and monitoring in real time. The collected data is displayed to users via a Blynk IoT application.
The paper [8] proposes an affordable precision farming system using the ESP32 as the main controller due to its efficiency in energy consumption and processing. Sensors collect essential data, which is processed and displayed on an OLED display. The visualized data is accessible via the ThingSpeak IoT platform. This gives users easy access to essential information for real-time decision making.
In [4], a system using a Raspberry Pi for automatic irrigation is aimed at, based on data collected from humidity, temperature and sunshine duration sensors. This system optimizes the use of water and resources by providing precise irrigation, thus maximizing agricultural production and managing resources more efficiently, including the use of cloud computing.
An intelligent irrigation system based on IoT technology and sensor networks for real-time monitoring of agricultural conditions is presented in [9]. Sensors collect soil and weather data such as temperature, humidity and other important characteristics, which are transmitted through a wireless network (WSN) to a central processing platform. The automated system optimizes water consumption, thereby contributing to resource conservation and reducing environmental impact.
Another smart irrigation system based on IoT technology and wireless sensor networks (WSN) for automated irrigation monitoring and control is also presented in [10]. The system utilizes sensors for air temperature (DHT11), humidity, soil moisture (LM393) and water level (M116) that collect data in real time and transmit it via Zigbee to a main node. The data is then processed on a cloud server where an irrigation algorithm compares the measurements with pre-set thresholds based on crop type. Automated irrigation control is provided by AtMega328 microcontrollers at each node, which activate or deactivate the drip system according to the decisions received from the cloud server. The system allows remote monitoring and control via an Android app, providing farmers with real-time information on field conditions.
Compared to previous work, the novelty of this work brings new insights and improvement. Although it is based on the use of IoT technologies and the automation of irrigation processes, we have extended the proposed system to include localization capabilities. In this way, a system has been developed that allows not only the monitoring and control of irrigation, but also the integration of data collected through interactive maps, the real-time visualization of the climatic status and the intelligent analysis of irrigation trends.
In addition, artificial intelligence has been introduced to analyze historical data and monitoring indicators and generate reports that provide personalized recommendations, helping to optimize resources and maximize water use efficiency. The AI also generates an interactive map that classifies the areas monitored by each device according to climatic status - risk zone, precautionary zone and optimal zone - to support irrigation decisions and provide a broad perspective on the climatic conditions of each area, helping to identify areas at risk and supplement irrigation accordingly to support crops.
3. Materials and Methods
This section describes the materials and methods used in the realization of the proposed climate monitoring system, with a particular emphasis on cost-effectiveness and water resource efficiency. Since the amount of water used in irrigation plays a critical role, the application must be designed in such a way that it minimizes water consumption while ensuring optimal growth and high crop production. [11] The system proposes the use of AI technologies to make optimal decisions regarding irrigation. These decisions are based on continuous monitoring of the parameters, analysis of their history, the amount of water used in previous irrigation sessions and the crop specifics, finally providing a personalized and efficient resource management [12].
For a better understanding of the hardware system, Figure 2 illustrates the circuit diagram used. It details how the main components are interconnected.
3.1. ESP32 Microcontroller
The ESP32 microcontroller is utilized as the main control unit in the proposed hardware system, having advanced processing capabilities and Wi-Fi and Bluetooth connectivity. According to scientific works, ESP32 is characterized by high processing performance and energy efficiency, and is suitable for IoT applications that require real-time environmental monitoring [13].
3.2. DHT11 Sensor
The DHT11 sensor is used for real-time measurement of temperature and humidity. It is easy to integrate and provides essential data for monitoring climatic conditions, contributing to data analysis and resource optimization. The sensor provides precise digital humidity and temperature measurements. It features an 8-bit microcontroller that ensures fast response, low power consumption and long-term reliability.
3.3. Arduino
The Arduino IDE is used for programming the ESP32 microcontroller, providing a friendly development and testing environment. The platform facilitates sensor integration and communication management between hardware and software components [14].
4. The Proposed Automated Irrigation System
4.1. Monitor Locations and Interactive Map
All locations where devices are installed are visible on an interactive map, which can be accessed by users. This map provides a visual representation of the devices and can display collected data. The devices function as part of a larger network, contributing to the collection of data that is later stored and analyzed for report generation. Figure 3 shows the map with all device locations.
Each device has a dedicated page, accessible via the URL dashboard/{device_id}, which displays the current data collected from the device, i.e. temperature and humidity. Also present are graphs illustrating the variation of these parameters over the interval during which the device link was accessed or over a specific time interval. The page also provides statistical information such as average, maximum and minimum values for temperature and humidity. Figure 4 shows the page for each device.
4.2. Irrigation Control
The app allows the user to manage irrigation manually or automatically. The automatic mode is based on AI algorithms and is able to determine the optimal time to start irrigation. At the same time, the amounts of water used, coming from irrigation or rain, are memorized in order to calculate the water use efficiency. For example, if temperatures have been high one day, the system can decide to start irrigation at the optimal times of the day, when temperature conditions allow plants to absorb water efficiently with minimal losses. The system uses artificial intelligence to analyze real-time environmental conditions and adjust irrigation to maximize efficiency and minimize resource waste [15].
The system periodically analyzes environmental conditions to determine the need for irrigation. It evaluates critical factors such as the presence or absence of severe drought, temperatures, and favorable time intervals for irrigation. In addition, the sys-tem takes into account the type of crop present on the plot, the exact amount of water needed for proper irrigation and efficient and sustainable resource management.
Figure 5 illustrates the component dedicated to controlling the irrigation process. It includes a visual animation indicating the progress of automatic irrigation, providing users with real-time information about water consumption and irrigation status. Thus, the application allows monitoring irrigation efficiency and resources used, facilitating optimal management.
4.3. Using Artificial Intelligents (AI) to Analyze and Visualize Data
Using the OpenAI API, the application generates well-structured PDF reports. These include comparisons with historical data, climate analysis and suggestions for users. The reports can be accessed at any time from a dedicated menu, viewed directly in the app or downloaded for further use.
In order to provide a concrete value of the efficiency of the cultivated plot, we have introduced the IWUE index into the report. This index, called Irrigation Water Use Efficiency (IWUE)[16], is the main indicator that allows us to observe the efficiency of our production in relation to the water used. In the specialized literature, this index has been extended to include several variables so that the calculation and estimation of this index can be as accurate as possible. In this paper, we will calculate the index based on land production per unit area and the amount of water that has entered the soil, either from irrigation or precipitation.
We have included in the history menu a field where the user can add its annualized yield per unit of land, measured in kilograms. Our application saves the amount of water used at each irrigation and measures the amount of precipitation that fell that year, thus providing an approximate calculation for this index, which is extremely useful for understanding crop optimization and its evolution over time.
The backend architecture of the application is built using REST API for communicating with the frontend and with sensors in the field. A web socket connection is used for fast and secure data transfer between the data collection module and the server. This connection allows real-time transmission of data from the sensors to the server and immediate update of the user interface. The security layer is realized by storing in the ESP’s memory the unique id of the device together with the access key, which is verified at each connection/reconnection of the device with the server. The collected data is stored in a relational database, each device is uniquely identified by an ID, and the as-sociated location is directly correlated with the stored data. The backend uses artificial intelligence to analyze historical data and identify patterns, create predictive models for irrigation management, and generate heatmaps and detailed reports.
5. Implication of AI in Agriculture
5.1. The Impact of AI in Irrigation Automation
Artificial intelligence in the application plays a central role in the decision-making process, with the main goal of maximizing water resource efficiency and adapting the system to different climate changes or extreme events [17]. The data collected by the IoT device is continuously analyzed and artificial intelligence provides personalized recommendations for irrigation and plants.
Analyzing temperature and humidity results in the identification of seasonal pat-terns, necessary to predict and adjust water needs. The AI relies on the data stored by us and the data in its collection to adjust irrigation strategies based on future conditions.
The app utilizes the OpenAI API to generate well-structured reports that combine climate data with history recorded by IoT devices. The report generation process is constantly updated by refining prompts to respond to specific user non-voices and provide relevant suggestions to optimize the irrigation process. This process ensures the delivery to users of reports that are as detailed and relevant in information and recommendations as possible.
Thanks to the scalability of the system, the artificial intelligence has access to a vast dataset in our application, which makes it a powerful tool for analyzing the climate state for each monitored area. This process allows the creation of a national overview, illustrated in Figure 6. With the map highlighting climate risk areas, we can propose a national climate rehabilitation plan, whereby risk areas can be more precisely managed by extending smart irrigation solutions in these regions.
5.2. Decisions, Reports, Data
The application collects data from each device in the field, each of which is identi-fied by a unique ID. In our case, the example used is our city, where location-specific data is collected. All the information is stored long-term within the application, giving users the possibility to visualize it in the history interface
Figure 7 shows two representative graphs for temperature and humidity, together with two maps: one on the left showing the monitored locations and one on the right highlighting the climate risks associated with each area. For a comprehensive illustra-tion of the data, the temperature and humidity graphs, together with the heat-map, were made using variable colors and intensities. These re-presentations emphasize the ability of artificial intelligence to model and visualize climate risks through color-coding and intensity, complemented by location-specific textual in-formation. In the lower section of the interface, users have the option to select the desired location for display, selection is also possible directly from the map of monitored locations.
An additional aspect of the data collected by the application is the integration of a vast collection of information provided by the AI, which is used to support decision-making processes and generate complex reports. This collection is constantly being updated, ensuring access to relevant and recent data, which helps to keep the application up to date with climate change and increase its relevance in the dynamic context of climate monitorization.
The decision-making processes implemented in this application are geared to-wards optimizing irrigation and notifying users of climate risks identified in the monitored areas. Using the data collected from the field, complemented by the information gathered through OpenAI model training, the artificial intelligence is able to make ac-curate decisions to ensure an efficient irrigation regime for the monitored plots [18].
In Figure 8, the decision-making process at different times of the day is illustrated. A test set including varying values of temperature (between -10°C and 40°C) and humidity (between 0% and 100%) was used to evaluate the decision-making ability.
The decision results are plotted as follows: the red area indicates the decision not to irrigate, the green area suggests irrigation, and the blue area highlights an AI uncertainty interval. This uncertainty zone, being small in size, is considered insignificant and does not influence the final irrigation decision. These representations emphasize the robustness and accuracy of the model in making water resource management decisions.
Based on the analysis performed and in comparison, with available studies, it can be concluded that the decision-making power of artificial intelligence is promising, even in its early stage. Given its capacity for self-improvement through continuous learning, a significant evolution in long-term performance is anticipated. Artificial intelligence is currently at a preliminary stage, but its development potential points to remarkable prospects for the future.
The dataset collected for the city of Suceava includes temperature and humidity history, irrigation data such as the amount of water available, irrigation history, and precipitation data. This information is integrated to form a complete database for this location. The decisions generated by the artificial intelligence, combined with its knowledge base and our city’s related data collection, are condensed into a detailed report. The aim of this report is to synthesize all relevant information, presenting users with a complete and detailed picture of the conditions and decisions associated with this location.
The introductory section of the report provides an overview of the location, including information from the extensive OpenAI data collection. The next section presents a plot of irrigation and rainfall over one year, accompanied by a tabular representation of these data. This information is used to calculate the IWUE index, which will be analyzed in more detail in the last part of the document.
The data collected by the system, summarized in Table 1, are presented below.
For a clearer representation of the data, a graph has been made as shown in Figure 9. The left vertical axis shows the temperature scale, expressed in degrees Celsius, and its evolution is highlighted by the blue line. On the vertical axis on the right is the humidity scale, whose values are represented by the green line.
In the evolution section, historical values in 2023 are compared with simulated values in 2024. The artificial intelligence identifies the same trend in temperature evolution over the year, similar to the one observed in the previous year, but records a positive increase of 0.5-0.7 degrees Celsius compared to 2023. Regarding precipitation and irrigation, the system performs an analysis of the evolution of precipitation, com-paring different months in 2024 and marking the moments when the irrigation system required significant amounts of water to counteract the difficulties related to the evaporation of water from the soil and to respond to the periods of maximum plant growth.
In the next section of the report, a detailed comparative analysis of the temperature and humidity trends for the current year, 2024, compared to the previous year, 2023, is carried out. Figure 10 and Figure 11 illustrate both temperature and humidity evolution for both periods, thus comparing the relevant trends between the two years.
In the previous section of these graphs, the artificial intelligence compares different times of the year, showing an increase of about 1 degree Celsius between January this year and the same period last year. Finally, it shows a more pro-normalized warming throughout the year compared to the previous year. As for humidity, no significant changes are observed in the current year’s data, but there are small variations that may influence the behavior of this parameter.
The next stage of the analysis involves the calculation of the IWUE index, which presents data on water consumption, the size of the cultivated area, total production and other indicators essential for its determination and evaluation. The IWUE analysis starts from the graph in Figure 12, which illustrates the dynamics of rainfall and the volume of water used during the growing season. The artificial intelligence integrated climate in-formation, together with data on plot size and crop type, to calculate and evaluate IWUE.
The IWUE index is a key indicator reflecting the relationship between agricultural production and the amount of water used, either from irrigation or precipitation. IWUE is defined in the literature by the formula [19]:
In this work, we calculated IWUE based on the data obtained from the analyzed plot with wheat (Triticum aestivum) as the main crop, taking into account both irrigation and rainfall input. The data collected include a cultivated area of 1152 m², a total water consumption of 1099.2 m³ (composed of irrigation and rainfall) and an average yield of 1.1 kg/m².
The IWUE of wheat (Triticum aestivum) varies depending on growing conditions, typically between 0.8 and 1.6 kg/m³. Factors such as climate, wheat type and irrigation system influence IWUE. Climate with moderate temperatures and well-distributed rainfall contribute to more efficient water use, while fall wheat tends to have a higher IWUE than spring wheat due to better soil water use. Controlled irrigation and moderate deficit can also increase IWUE.
The IWUE for the analyzed plot was calculated using the formula:
Interpretation of the results reveals that for each cubic meter of water used, 1.37 kg of wheat yield was obtained. Compared to the average values reported in the literature (0.8 - 1.5 kg/m³), this result reflects an efficient use of water resources in the cultivation process. The IWUE value of 1.37 kg/m³ is in the average range, indicating a satisfactory performance, but there is also potential for improvement. Compared to the optimal values of up to 2.0 kg/m³, this work suggests that with time the learning capability of artificial intelligence can increase the IWUE index of our par-cell to the optimal value.
5.3. Impact on Agricultural Sustainability
The proposed system contributes significantly to agricultural sustainability by implementing optimized irrigation that significantly reduces water wastage [20]. It supplements only 120mm of irrigation annually, totaling a combined total of 955 mm between irrigation and rainfall. Low costs ensure democratized access to technology for small farms, facilitating the adoption of innovative solutions. Continuous monitoring of temperature and humidity allows optimized water use efficiency, thus contributing to the conservation of natural resources [21]. Integrating AI and IoT, the system supports informed decision-making, increasing irrigation water use efficiency (IWUE) to 1.37 kg/m³. This not only protects local ecosystems, but also promotes sustainable and cli-mate-adaptable agriculture [22].
6. Discussion
The potential for using artificial intelligence (AI) to optimize irrigation processes is highlighted by the results of this study. The initial hypothesis is that AI can help reduce water consumption by adjusting the amount of irrigation to the actual needs of the crop and local climatic conditions. Although no large-scale experiments were conducted in this study, the results of the simulations indicate a very promising potential for integrating AI in agriculture to optimize water use efficiency and increase productivity.
In simple irrigation methods without AI support, farmers often rely on fixed routines or visual observations to decide when and how much water to use. Although this approach is less expensive, it has several limitations:
- Water waste: Frequent and chaotic irrigation leads to water run-off into already saturated soils, reducing irrigation water use efficiency (IWUE).
- Water stress: Without accurate measurements, crops can suffer from either overwatering or lack of water.
- Lack of adaptability: Traditional irrigation does not take into account how the weather forecasts or local soil varies.
In contrast, AI technologies prevent both waste and water stress by dynamically adjusting the amount and timing of irrigation. For example, an AI system can automatically reduce the amount of water applied before a rainstorm, which is not possible with manual systems that do not pay attention to the weather forecast.
Applying artificial intelligence to irrigation systems has major implications for agricultural sustainability. In the long term, this technology can help reduce the risks associated with climate change by using water resources more efficiently and increasing the resilience of agricultural systems. In addition, the use of AI could help small-scale farmers by reducing their operating costs and increasing their productivity.
A key aspect of this study is improving the Irrigation Water Use Efficiency (IWUE) index. AI algorithms enable precise irrigation. Over-irrigation and water loss are avoided. In our study, the models used suggested a potential increase in IWUE of up to 25%, but these estimates need to be validated by future experiments under real conditions.
There are several limitations that need to be addressed, although the results presented are promising. The main obstacles are a lack of field testing and a reliance on simulated data. The implementation of artificial intelligence in irrigation depends on several factors, including the existence of a traditional irrigation system. Without it, upfront costs can be significant, making technology adoption difficult. In addition, a poorly developed digital infrastructure in rural areas can make the process of implementing and developing smart solutions more difficult.
Future research includes testing the technology in different environments and adapting the algorithms to incorporate more complex data, such as short-term weather forecasts and detailed soil analysis.
One of the main objectives in the development of the application should also be to take advantage of the sustainability of water resources in specific regional contexts. This approach could take into account how different regions are affected by drought and other climatic conditions, helping to personalize irrigation strategies and optimize water resource management based on the specific characteristics of the location.
Optimizing the decision-making process is also an essential objective to ensure the continuity of the application and maintain the inertia of the decision-making process, otherwise the application will not be able to evolve with the rapid climate changes caused by global warming.
In addition, future research should focus on the development of scalable storage solutions for recorded data, capable of handling large amounts of information collected from multiple sensors. This could include the use of cloud platforms to ensure that data can be accessed quickly and analyzed in an efficient manner.
Developing a learning and self-adapting system based on the results of the application’s past actions is another important aspect. By constantly analyzing and integrating the relationship between actions and their effects, the system can optimize the decision-making process and dynamically adapt to changing environmental and resource conditions. This self-adjusting mechanism would allow the application to learn from experience, reduce errors and improve overall performance, ensuring that its full potential is realized. In this way, the application could evolve over time, becoming more and more efficient and offering more and more personalized solutions.
From a hardware point of view, there is a need for expansion of the sensor network. These sensors should include soil sensors to measure the pH value, air pressure and wind sensors, as well as precipitation sensors to measure the amount and rate of rainfall.
By monitoring climatic conditions more extensively and accurately, we can obtain more detailed data and make more informed decisions.
5. Conclusions
Irrigation automation, supported by artificial intelligence-generated climate reports, optimizes water and energy resources, contributing to increased agricultural sustainability. The system monitors critical parameters such as temperature and humidity in real time, integrating data from multiple devices to provide a national view of climate conditions. This provides an overview of climate conditions across the country. It helps to identify long-term trends and risks.
The system uses artificial intelligence to determine the optimum time to water, taking into account factors such as crop type, environmental conditions, water use and the optimum time of day. This will contribute to a more sustainable management of water resources, to a reduction of waste and to a more efficient agricultural production.
Customized reports and interactive maps provide a clear understanding of the risks posed by climate change and tailored recommendations for each monitored region. The application is therefore an essential tool for the improvement of agricultural strategies and for the support of the sustainable development of the agricultural sector.
The originality of this study lies in the advanced use of artificial intelligence, integrated with interactive data visualization and localization functionalities, which significantly differentiates it from other works focused on conventional irrigation automation with IoT technologies. The system uses interactive maps to categorize monitored areas according to climatic conditions - risk, precautionary or optimal zones - providing a detailed perspective tailored to each region. Artificial intelligence plays a key role, analyzing historical data and generating accurate forecasts to enable optimized resource management decisions. Through personalized recommendations and targeted interventions, AI supports not only efficient irrigation, but also the sustainable adaptation of agriculture to changing climatic conditions, providing an innovative and scalable solution to today’s challenges in the field.
Author Contributions
Conceptualization, X.X. and Y.Y.; methodology, X.X.; software, X.X.; validation, X.X., Y.Y. and Z.Z.; formal analysis, X.X.; investigation, X.X.; resources, X.X.; data curation, X.X.; writing—original draft preparation, X.X.; writing—review and editing, X.X.; visualization, X.X.; supervision, X.X.; project administration, X.X.; funding acquisition, Y.Y. All authors have read and agreed to the published version of the manuscript.” Please turn to the CRediT taxonomy for the term explanation. Authorship must be limited to those who have contributed substantially to the work reported.
Funding
This research received no external funding.
Institutional Review Board Statement
Not applicable.
Informed Consent Statement
Not applicable.
Data Availability Statement
Data Availability Statements are available in section “MDPI Research Data Policies” at https://www.mdpi.com/ethics.
Acknowledgments
In this section, you can acknowledge any support given which is not covered by the author contribution or funding sections. This may include administrative and technical support, or donations in kind (e.g., materials used for experiments).
Conflicts of Interest
Declare conflicts of interest or state “The authors declare no conflicts of interest.” Authors must identify and declare any personal circumstances or interest that may be perceived as inappropriately influencing the representation or interpretation of reported research results. Any role of the funders in the design of the study; in the collection, analyses or interpretation of data; in the writing of the manuscript; or in the decision to publish the results must be declared in this section. If there is no role, please state “The funders had no role in the design of the study; in the collection, analyses, or interpretation of data; in the writing of the manuscript; or in the decision to publish the results”.
References
- Zhang, Naiqian, Maohua Wang, and Ning Wang. "Precision agriculture—a worldwide overview." Computers and electronics in agriculture 36.2-3 (2002): 113-132.
- C. Marwa, S. B. Othman and H. Sakli, "IoT Based Low-cost Weather Station and Monitoring System for Smart Agriculture," 2020 20th International Conference on Sciences and Techniques of Automatic Control and Computer Engineering (STA), Monastir, Tunisia, 2020, pp. 349-354. [CrossRef]
- K. Pernapati, "IoT Based Low Cost Smart Irrigation System," 2018 Second International Conference on Inventive Commu-nication and Computational Technologies (ICICCT), Coimbatore, India, 2018, pp. 1312-1315. [CrossRef]
- Rao, R.N.; Sridhar, B. IoT Based Smart Crop-Field Monitoring and Automation Irrigation System. In Proceedings of the 2018 2nd International Conference on Inventive Systems and Control (ICISC), Coimbatore, India, 19–20 January 2018; pp. 478–483. [Google Scholar]
- G. E. Rani, S. Deetshana, K. Y. Naidu, M. Sakthimohan and T. Sarmili, "Automated Interactive Irrigation System - IoT Based Approach," 2019 IEEE International Conference on Intelligent Techniques in Control, Optimization and Signal Processing (INCOS), Tamilnadu, India, 2019, pp. 1-4. [CrossRef]
- Dasgupta, Ajanta, et al. "Smart irrigation: IOT-based irrigation monitoring system." Proceedings of International Ethical Hacking Conference 2018: eHaCON 2018, Kolkata, India. Springer Singapore, 2019.
- Adeagbo, Adesunmbo Adeboye. "IOT Based Environment Monitoring System Using. arXiv:2405.14047 (2024).
- Math, Rajinder Kumar M., and Nagaraj V. Dharwadkar. "IoT Based low-cost weather station and monitoring system for precision agriculture in India." 2018 2nd international conference on I-SMAC (IoT in social, mobile, analytics and cloud)(I-SMAC) I-SMAC (IoT in social, mobile, analytics and cloud)(I-SMAC), 2018 2nd international conference on. IEEE, 2018.
- Obaideen, K.; Yousef, B.A.; AlMallahi, M.N.; Tan, Y.C.; Mahmoud, M.; Jaber, H.; Ramadan, M. An overview of smart irrigation systems using IoT. Energy Nexus 2022, 7. [Google Scholar] [CrossRef]
- Saraf, S.B.; Gawali, D.H. IoT based smart irrigation monitoring and controlling system. In Proceedings of the 2017 2nd IEEE International Conference on Recent Trends in Electronics, Information & Communication Technology (RTEICT), Bangalore, India, 19–20 May 2017; pp. 815–819. [Google Scholar]
- Boursianis, A.D.; Papadopoulou, M.S.; Gotsis, A.; Wan, S.; Sarigiannidis, P.; Nikolaidis, S.; Goudos, S.K. Smart Irrigation System for Precision Agriculture—The AREThOU5A IoT Platform. IEEE Sensors J. 2020, 21, 17539–17547. [Google Scholar] [CrossRef]
- Mohammed, M.; Hamdoun, H.; Sagheer, A. Toward Sustainable Farming: Implementing Artificial Intelligence to Predict Optimum Water and Energy Requirements for Sensor-Based Micro Irrigation Systems Powered by Solar PV. Agronomy 2023, 13, 1081. [Google Scholar] [CrossRef]
- M. Babiuch, P. Foltýnek and P. Smutný, "Using the ESP32 Microcontroller for Data Processing," 2019 20th International Carpathian Control Conference (ICCC), Krakow-Wieliczka, Poland, 2019, pp. 1-6. [CrossRef]
- Fezari, Mohamed, and Ali Al Dahoud. "Integrated development environment “IDE” for Arduino." WSN applications 11 (2018): 1-12.
- Tace, Y.; Tabaa, M.; Elfilali, S.; Leghris, C.; Bensag, H.; Renault, E. Smart irrigation system based on IoT and machine learning. Energy Rep. 2022, 8, 1025–1036. [Google Scholar] [CrossRef]
- David L. Hoover, Lori J. Abendroth, Dawn M. Browning, Amartya Saha, Keirith Snyder, Pradeep Wagle, Lindsey Witthaus, Claire Baffaut, Joel A. Biederman, David D. Bosch, Rosvel Bracho, Dennis Busch, Patrick Clark, Patrick Ellsworth, Philip A. Fay, Gerald Flerchinger, Sean Kearney, Lucia Levers, Nicanor Saliendra, Marty Schmer, Harry Schomberg, Russell L. Scott,Indicators of water use efficiency across diverse agroecosystems and spatiotemporal scales,Science of The Total Environment,Volume 864,2023,160992,ISSN 0048-9697. [CrossRef]
- Kujawa, S.; Niedbała, G. Artificial Neural Networks in Agriculture. Agriculture 2021, 11, 497. [Google Scholar] [CrossRef]
- Ghosh, Ashish, Debasrita Chakraborty, and Anwesha Law. "Artificial intelligence in Internet of things." CAAI Transactions on Intelligence Technology 3.4 (2018): 208-218.
- Belay, S.A.; Schmitter, P.; Worqlul, A.W.; Steenhuis, T.S.; Reyes, M.R.; Tilahun, S.A. Conservation Agriculture Saves Irrigation Water in the Dry Monsoon Phase in the Ethiopian Highlands. Water 2019, 11, 2103. [Google Scholar] [CrossRef]
- Yunlong, C.; Smit, B. Sustainability in agriculture: a general review. Agric. Ecosyst. Environ. 1994, 49, 299–307. [Google Scholar] [CrossRef]
- G. Sushanth and S. Sujatha, "IOT Based Smart Agriculture System," 2018 International Conference on Wireless Communica-tions, Signal Processing and Networking (WiSPNET), Chennai, India, 2018, pp. 1-4. [CrossRef]
- Dhanaraju, M.; Chenniappan, P.; Ramalingam, K.; Pazhanivelan, S.; Kaliaperumal, R. Smart Farming: Internet of Things (IoT)-Based Sustainable Agriculture. Agriculture 2022, 12, 1745. [Google Scholar] [CrossRef]
Figure 1.
The proposed architecture of the system.
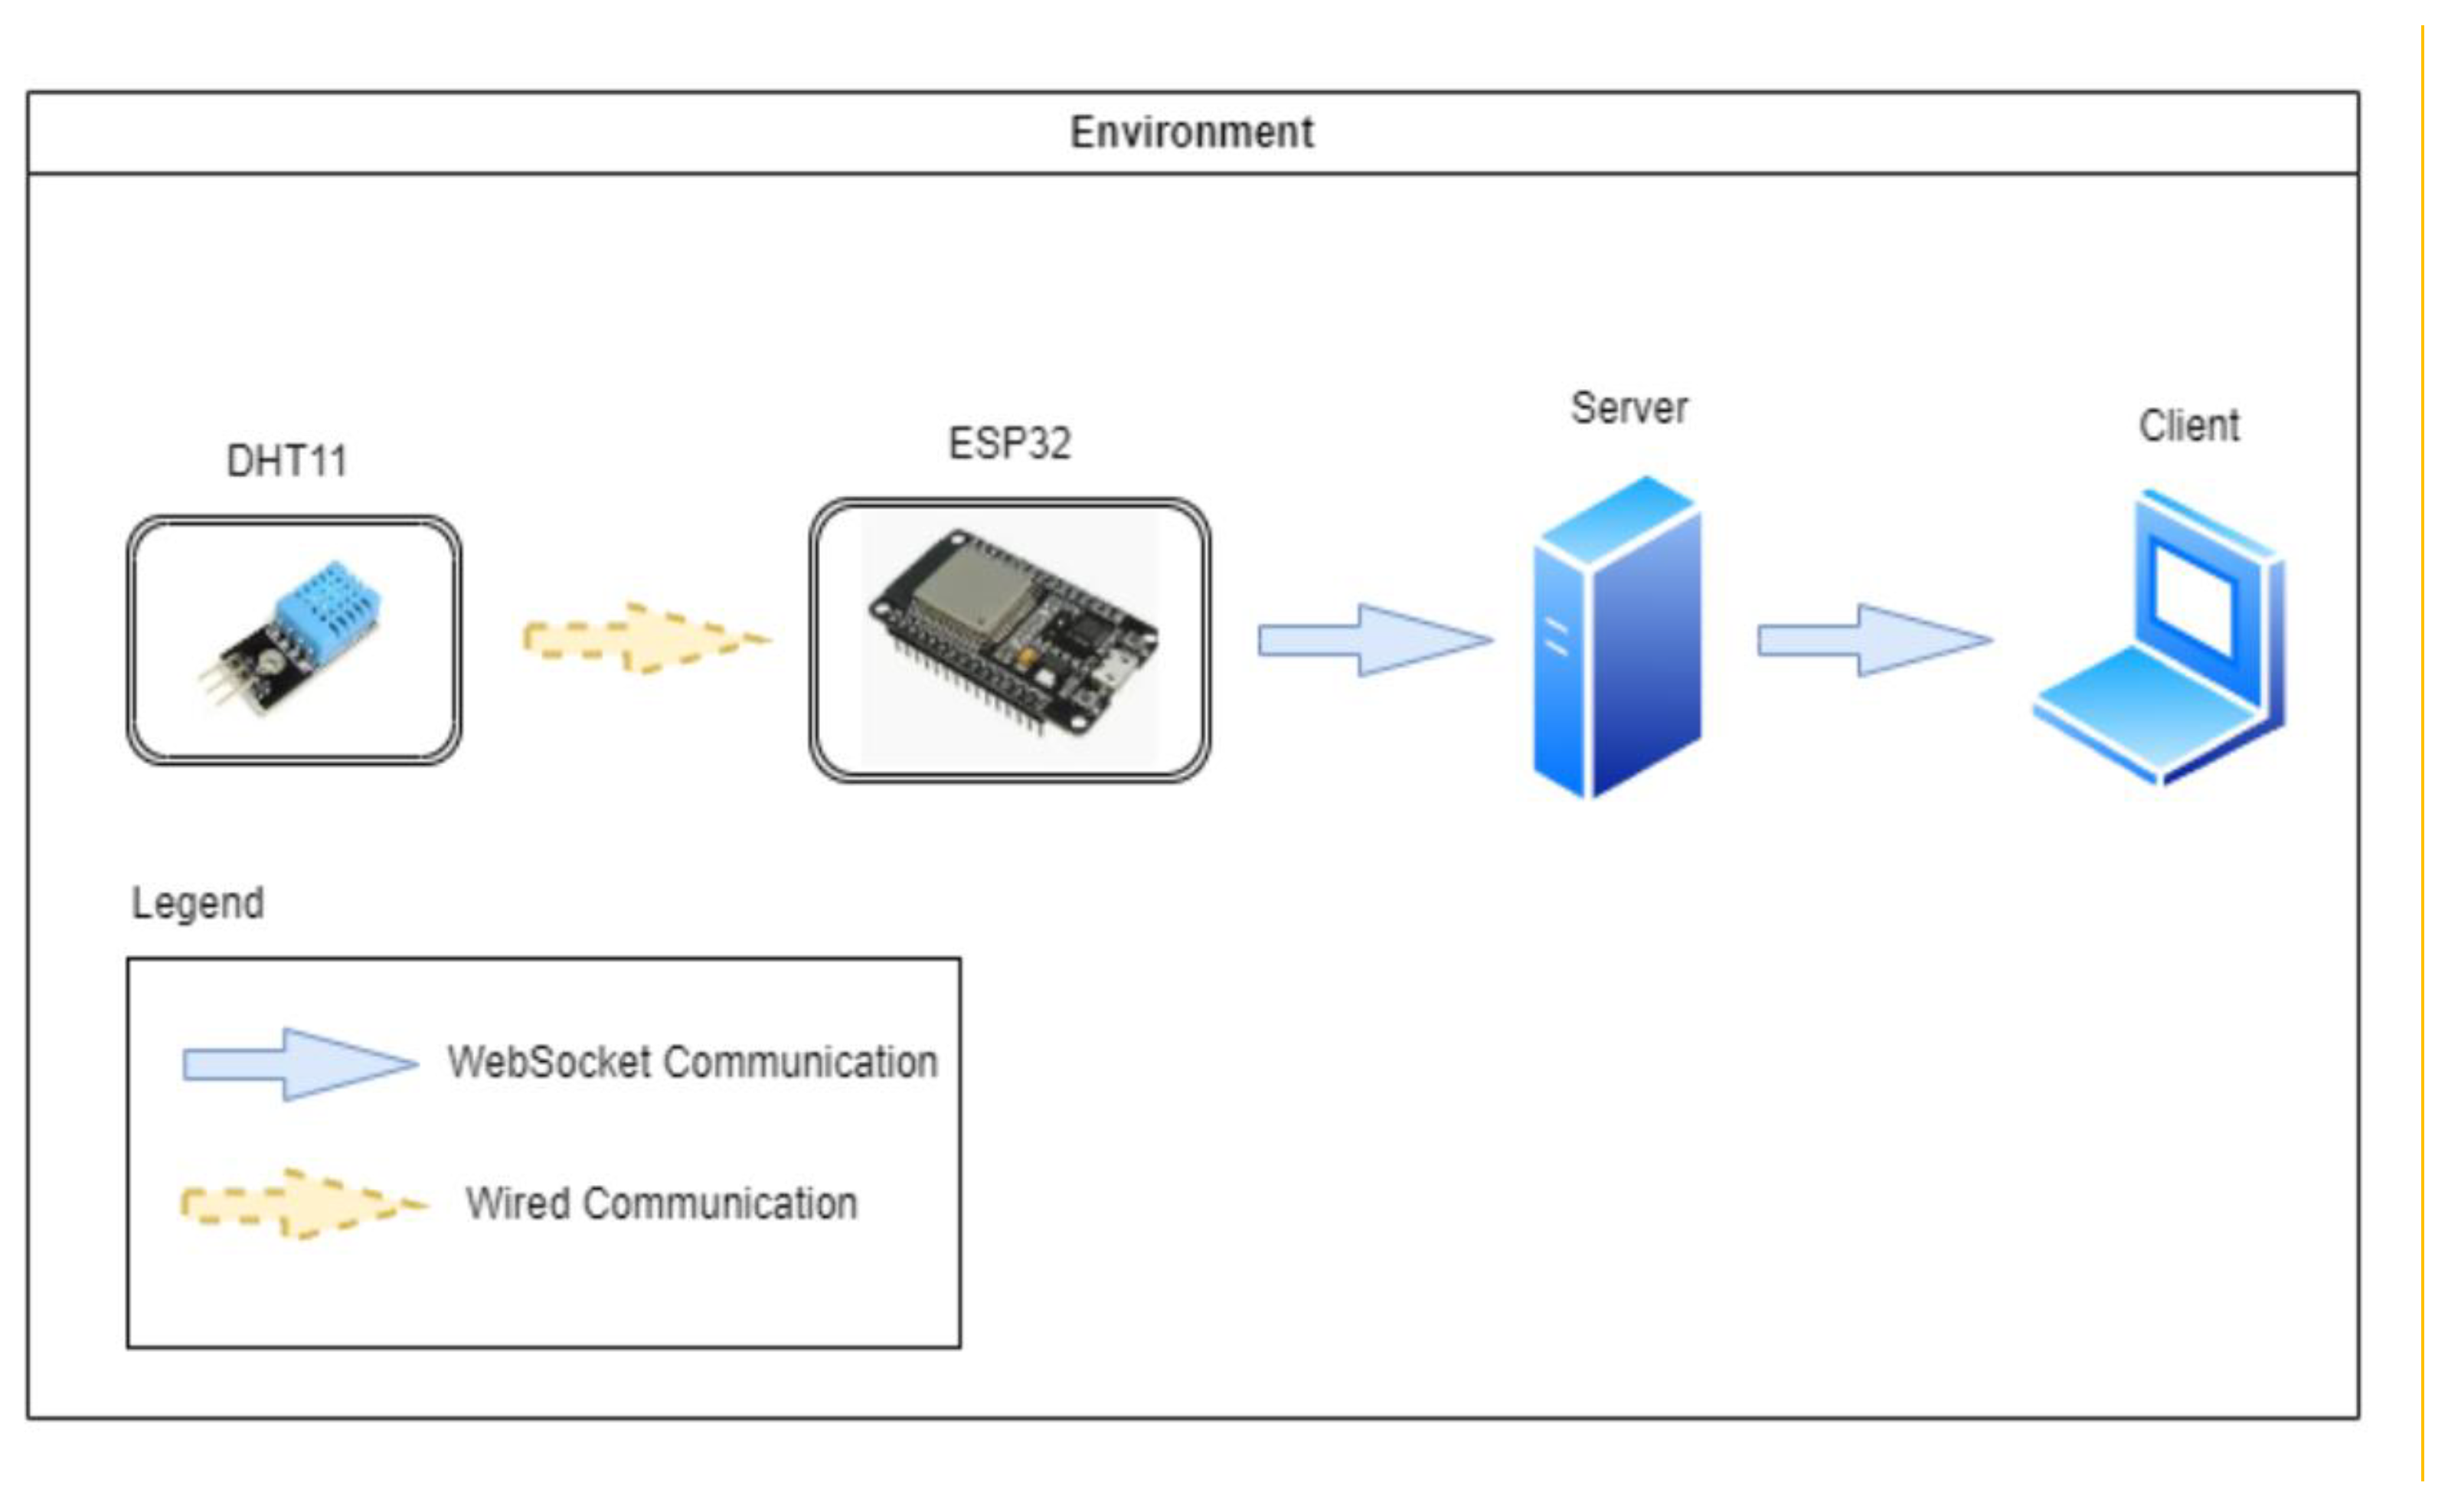
Figure 2.
System diagram.
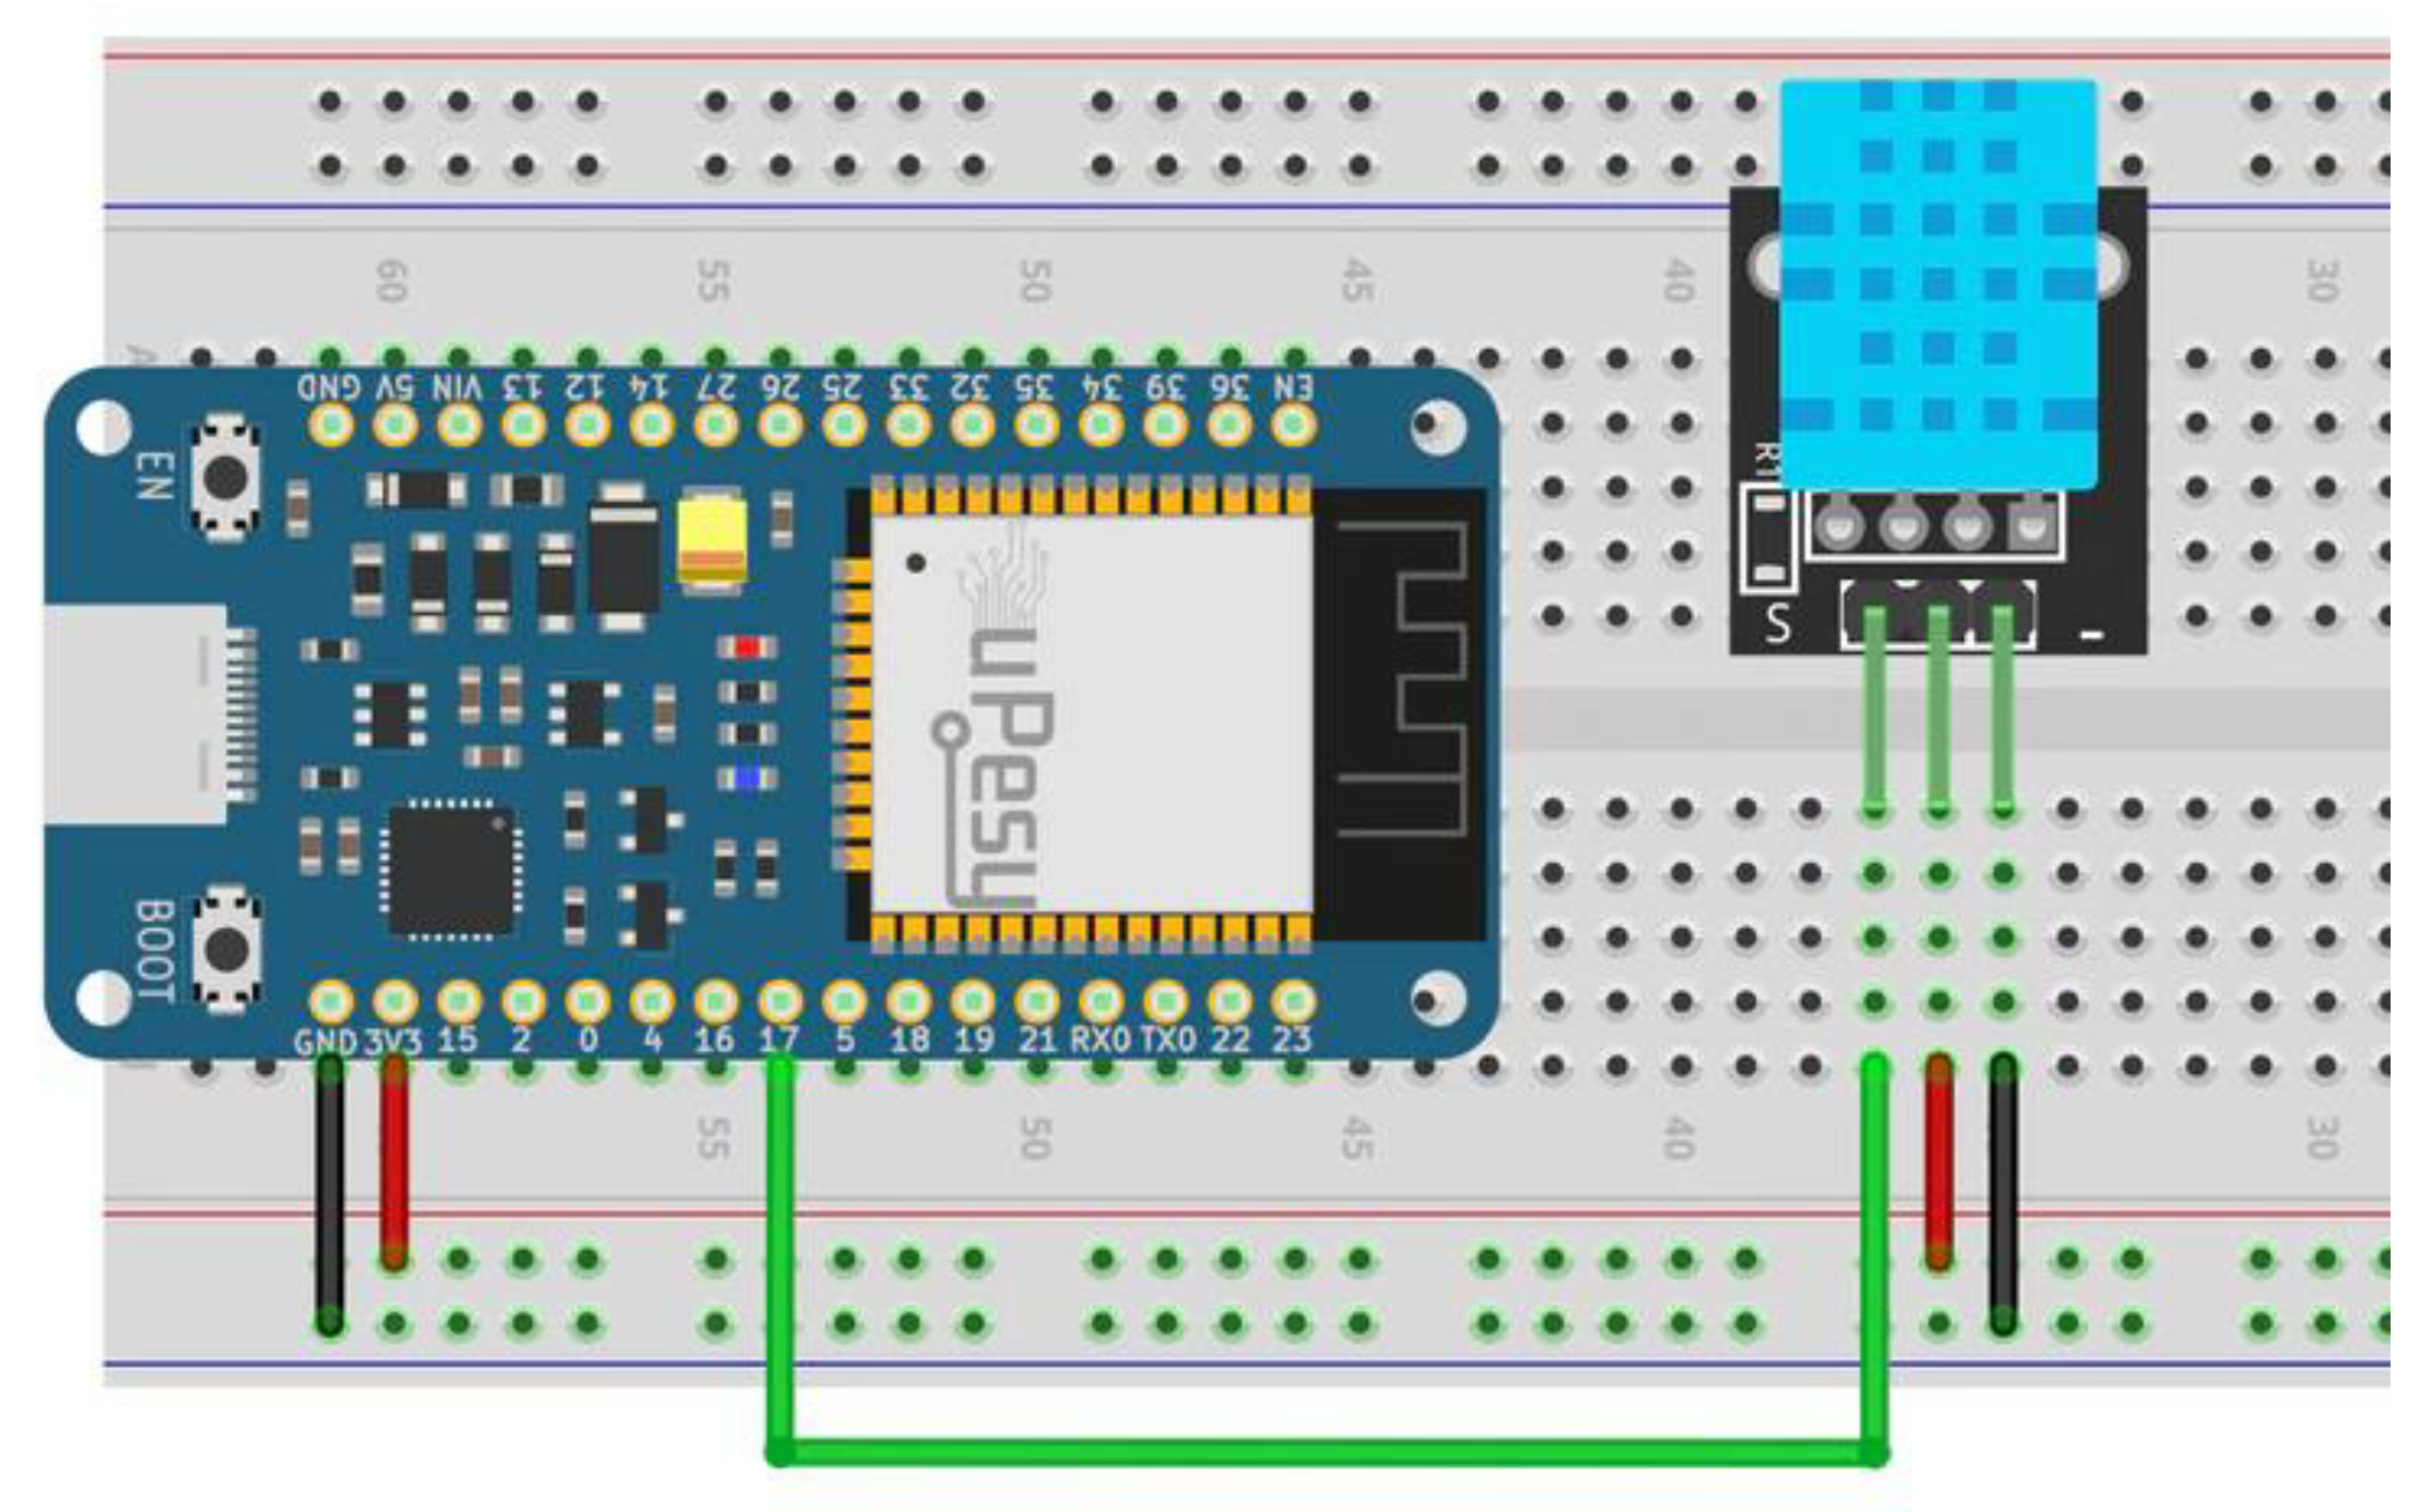
Figure 3.
Monitored locations.
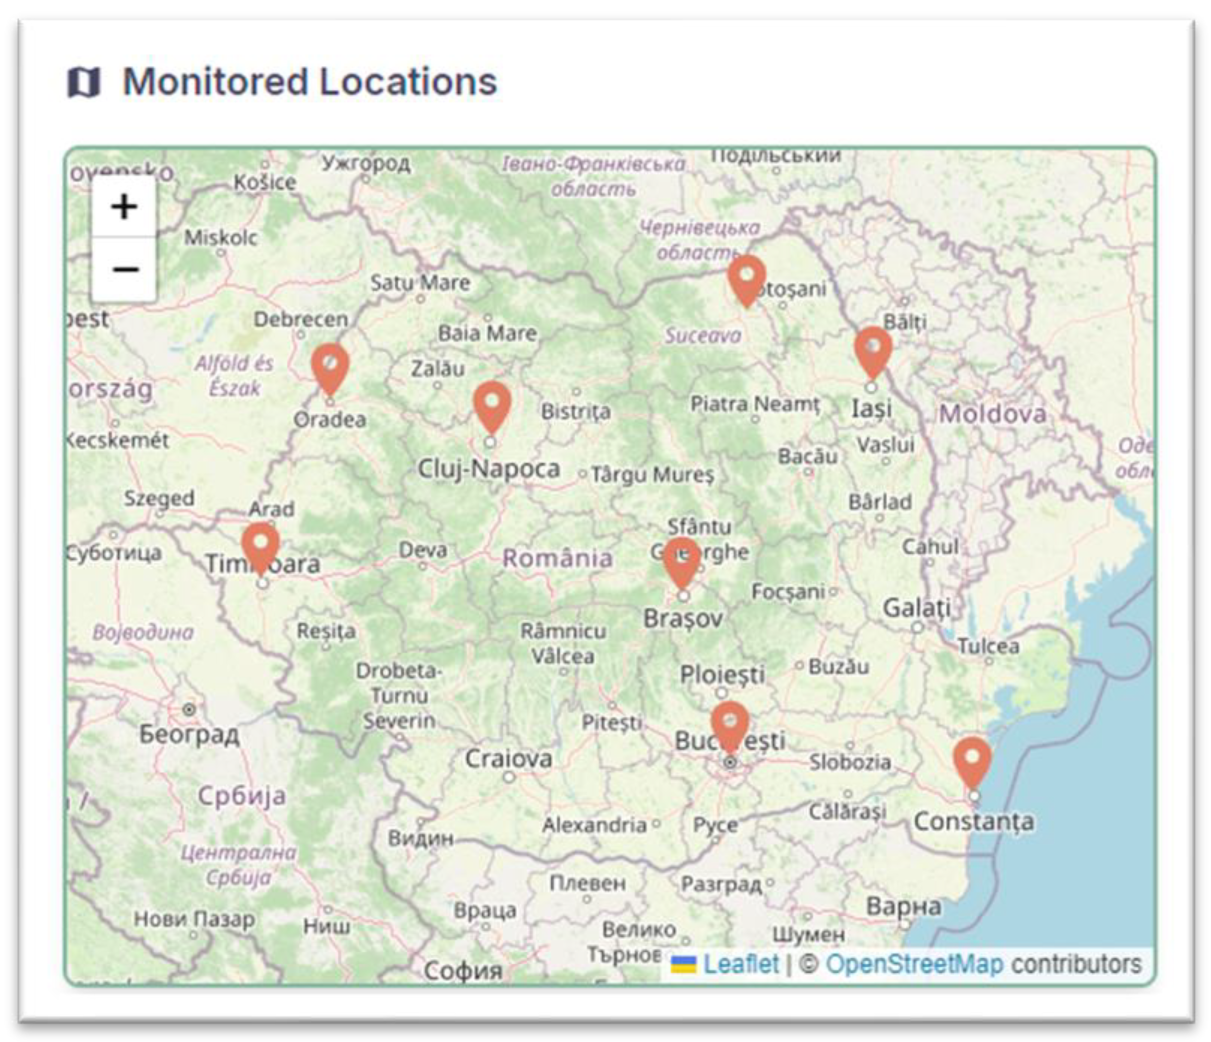
Figure 4.
Device-specific page.
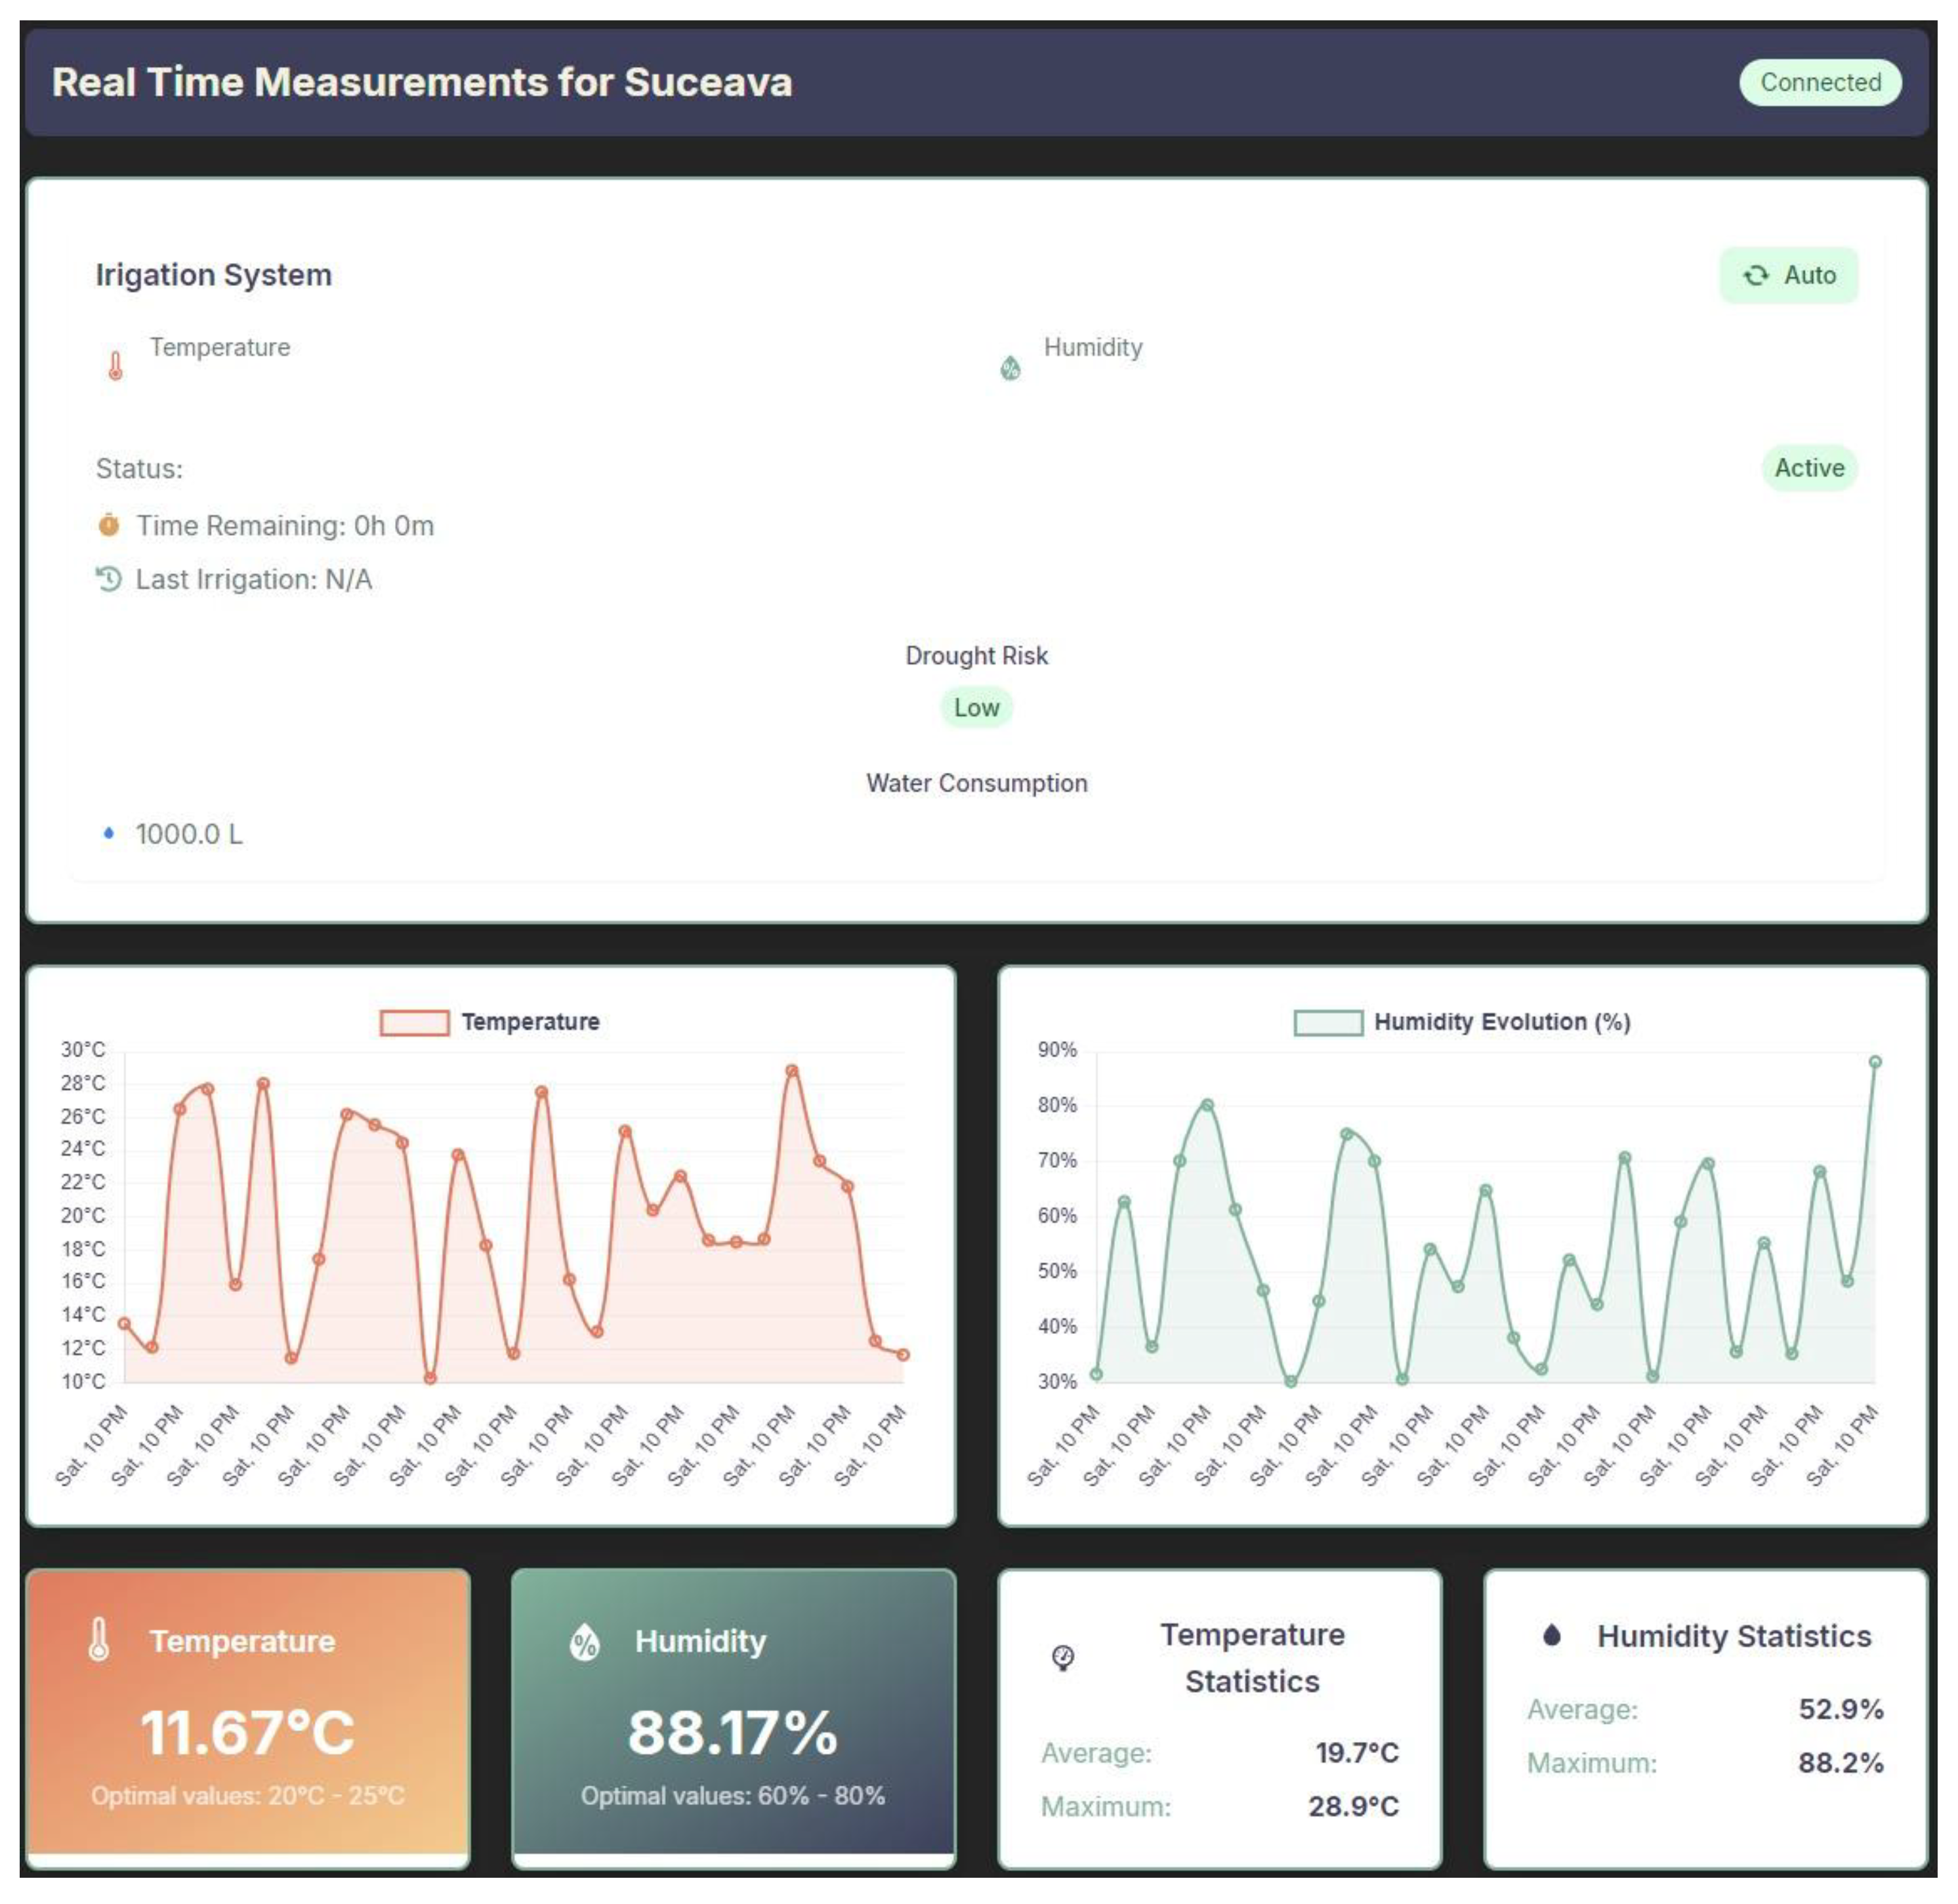
Figure 5.
Irrigation control component.
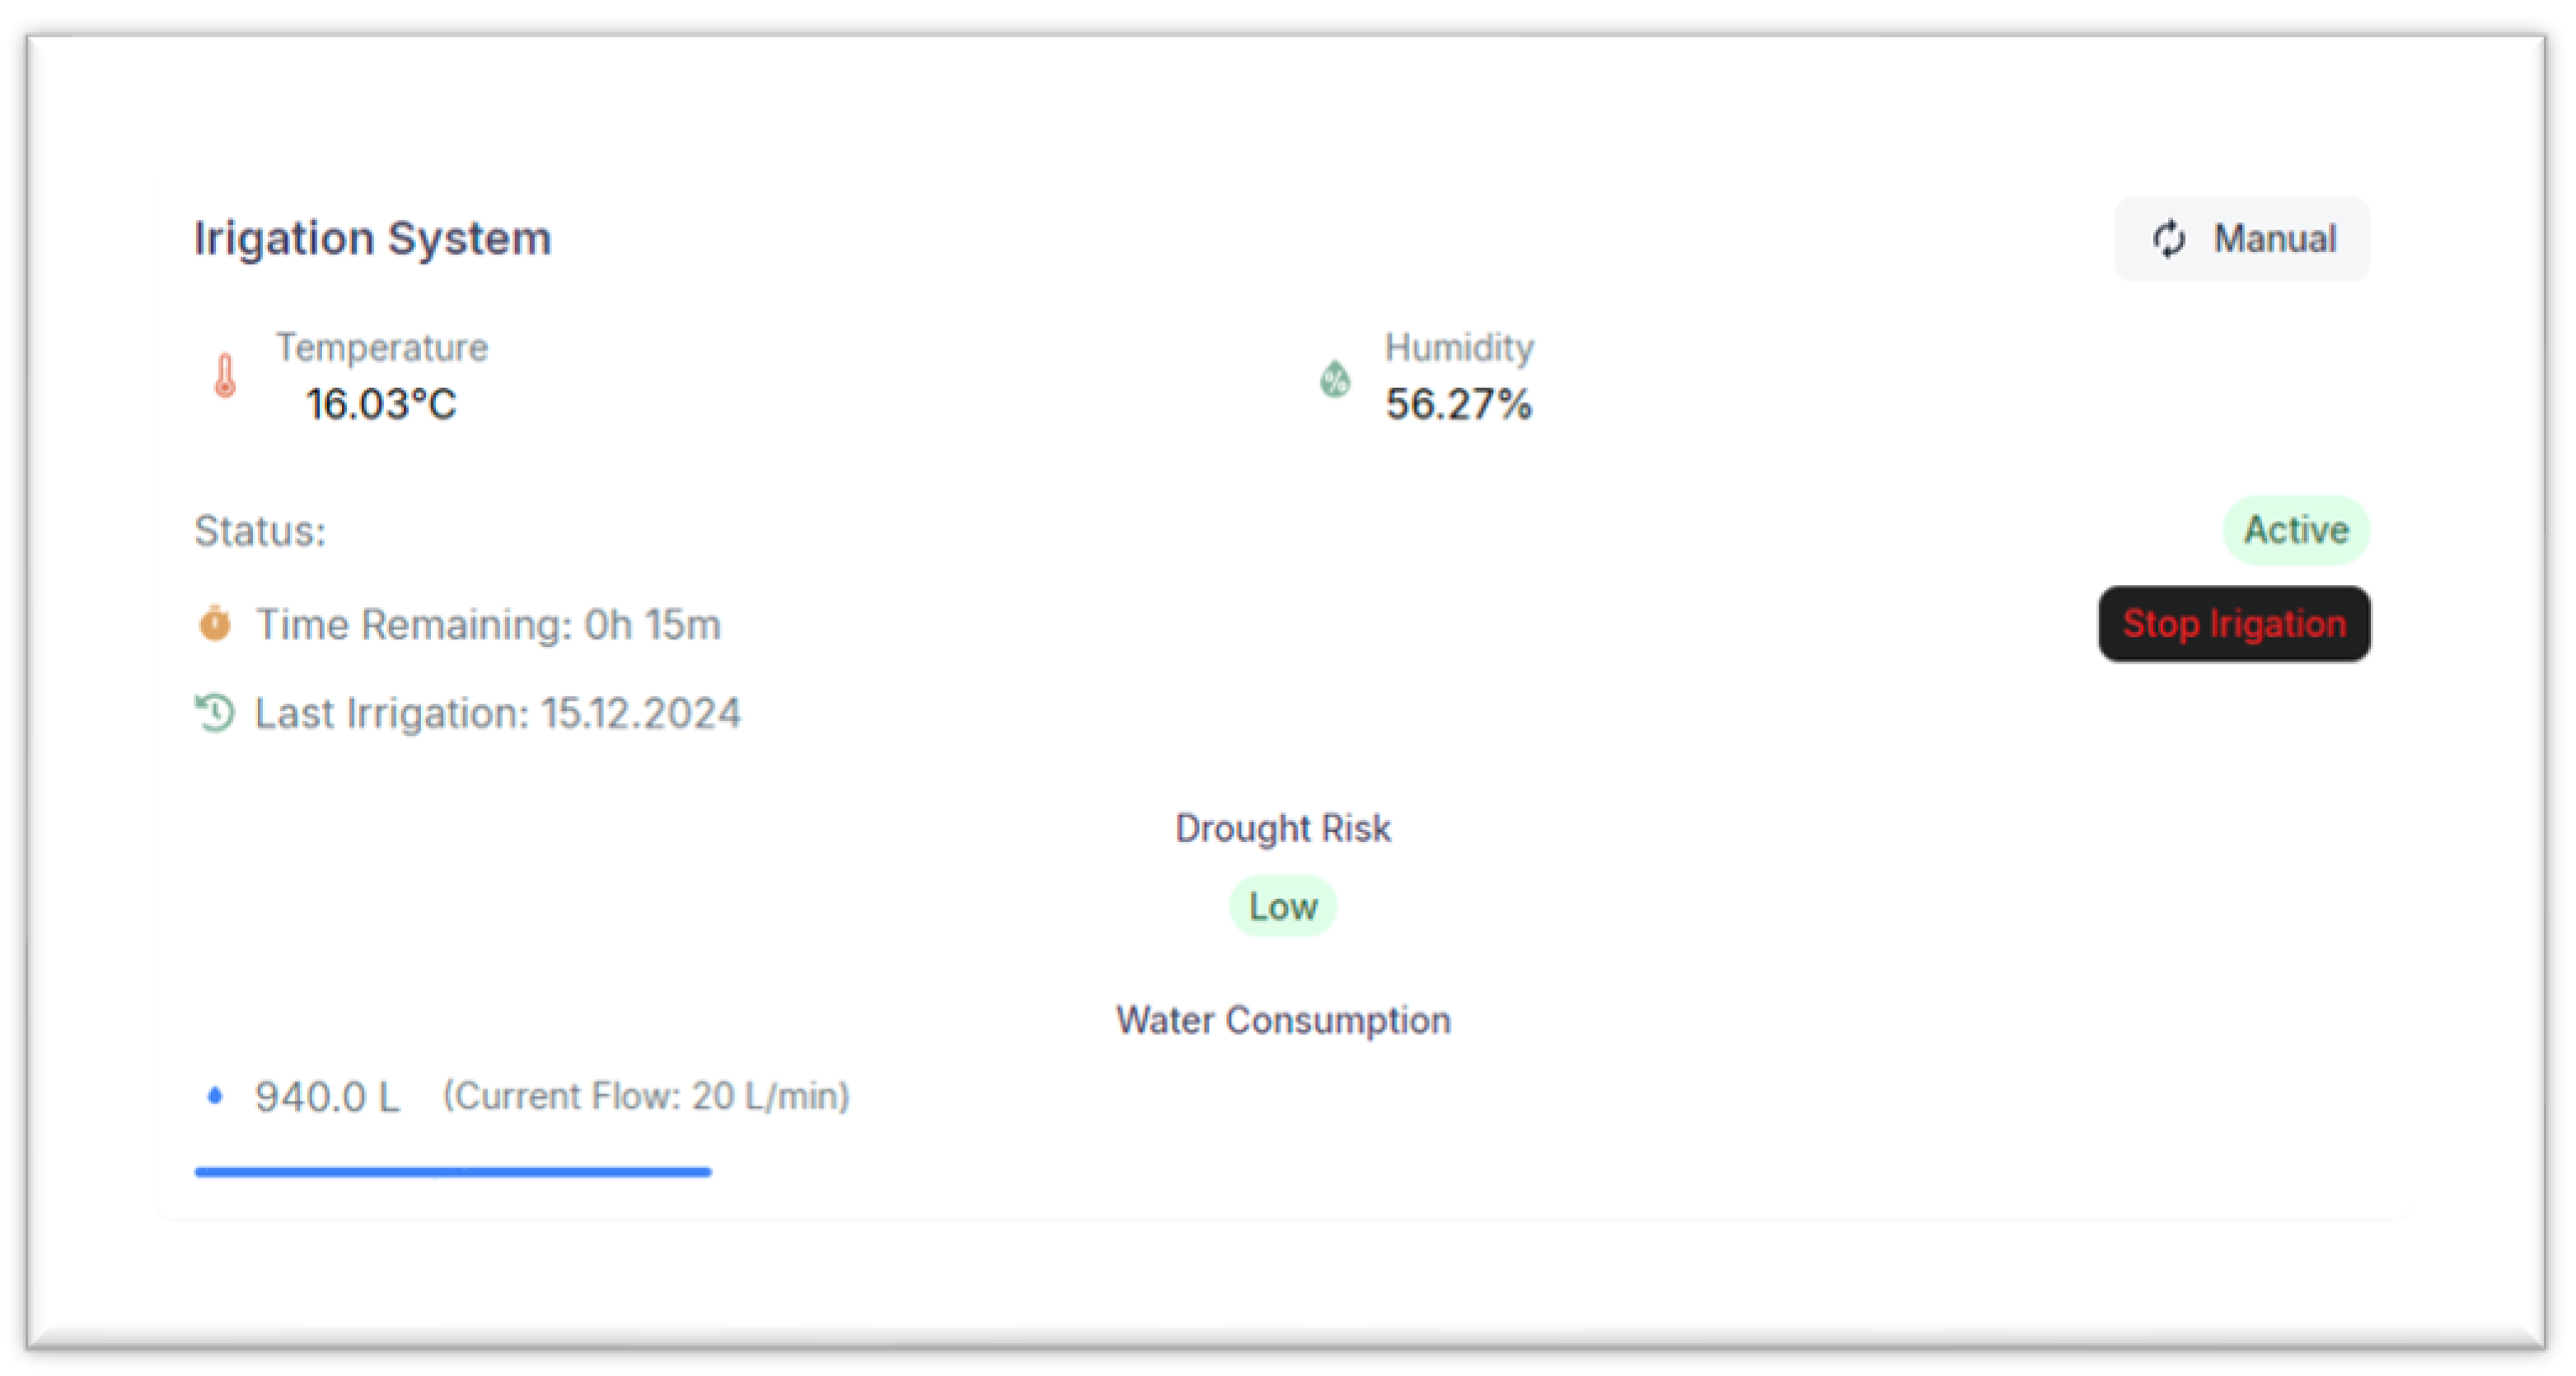
Figure 6.
Heat Map.
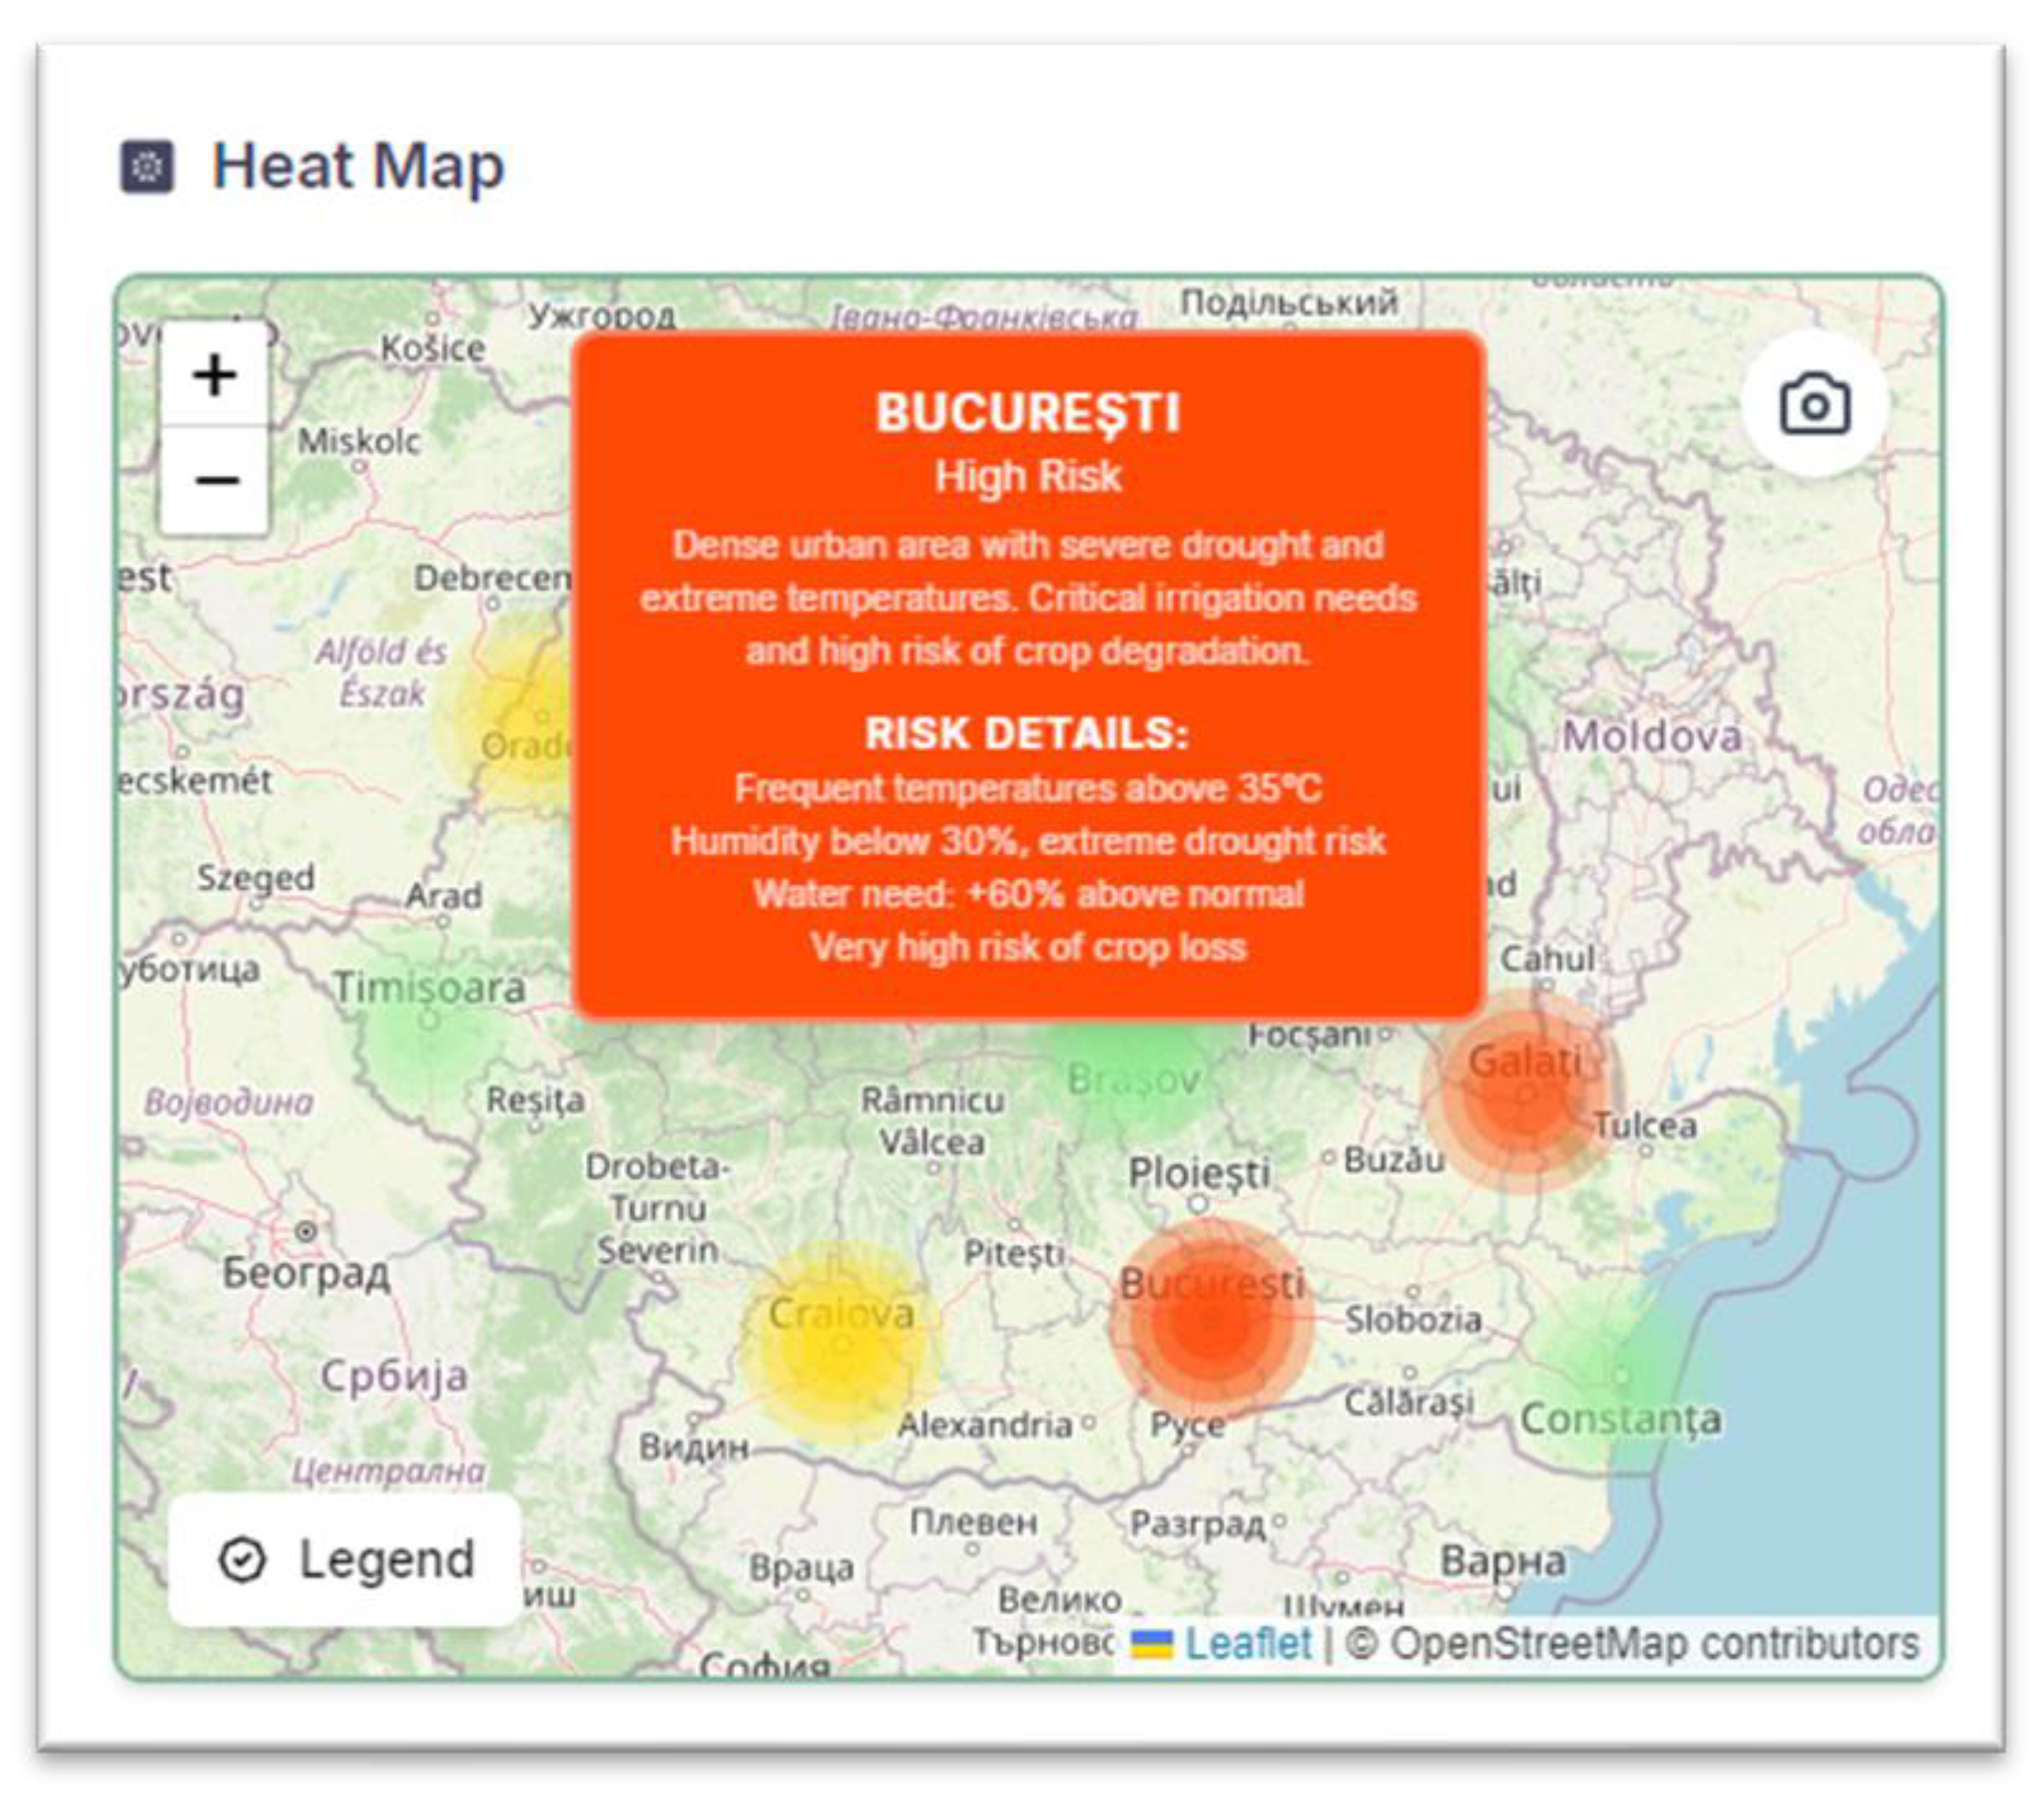
Figure 7.
History page for monitoring.
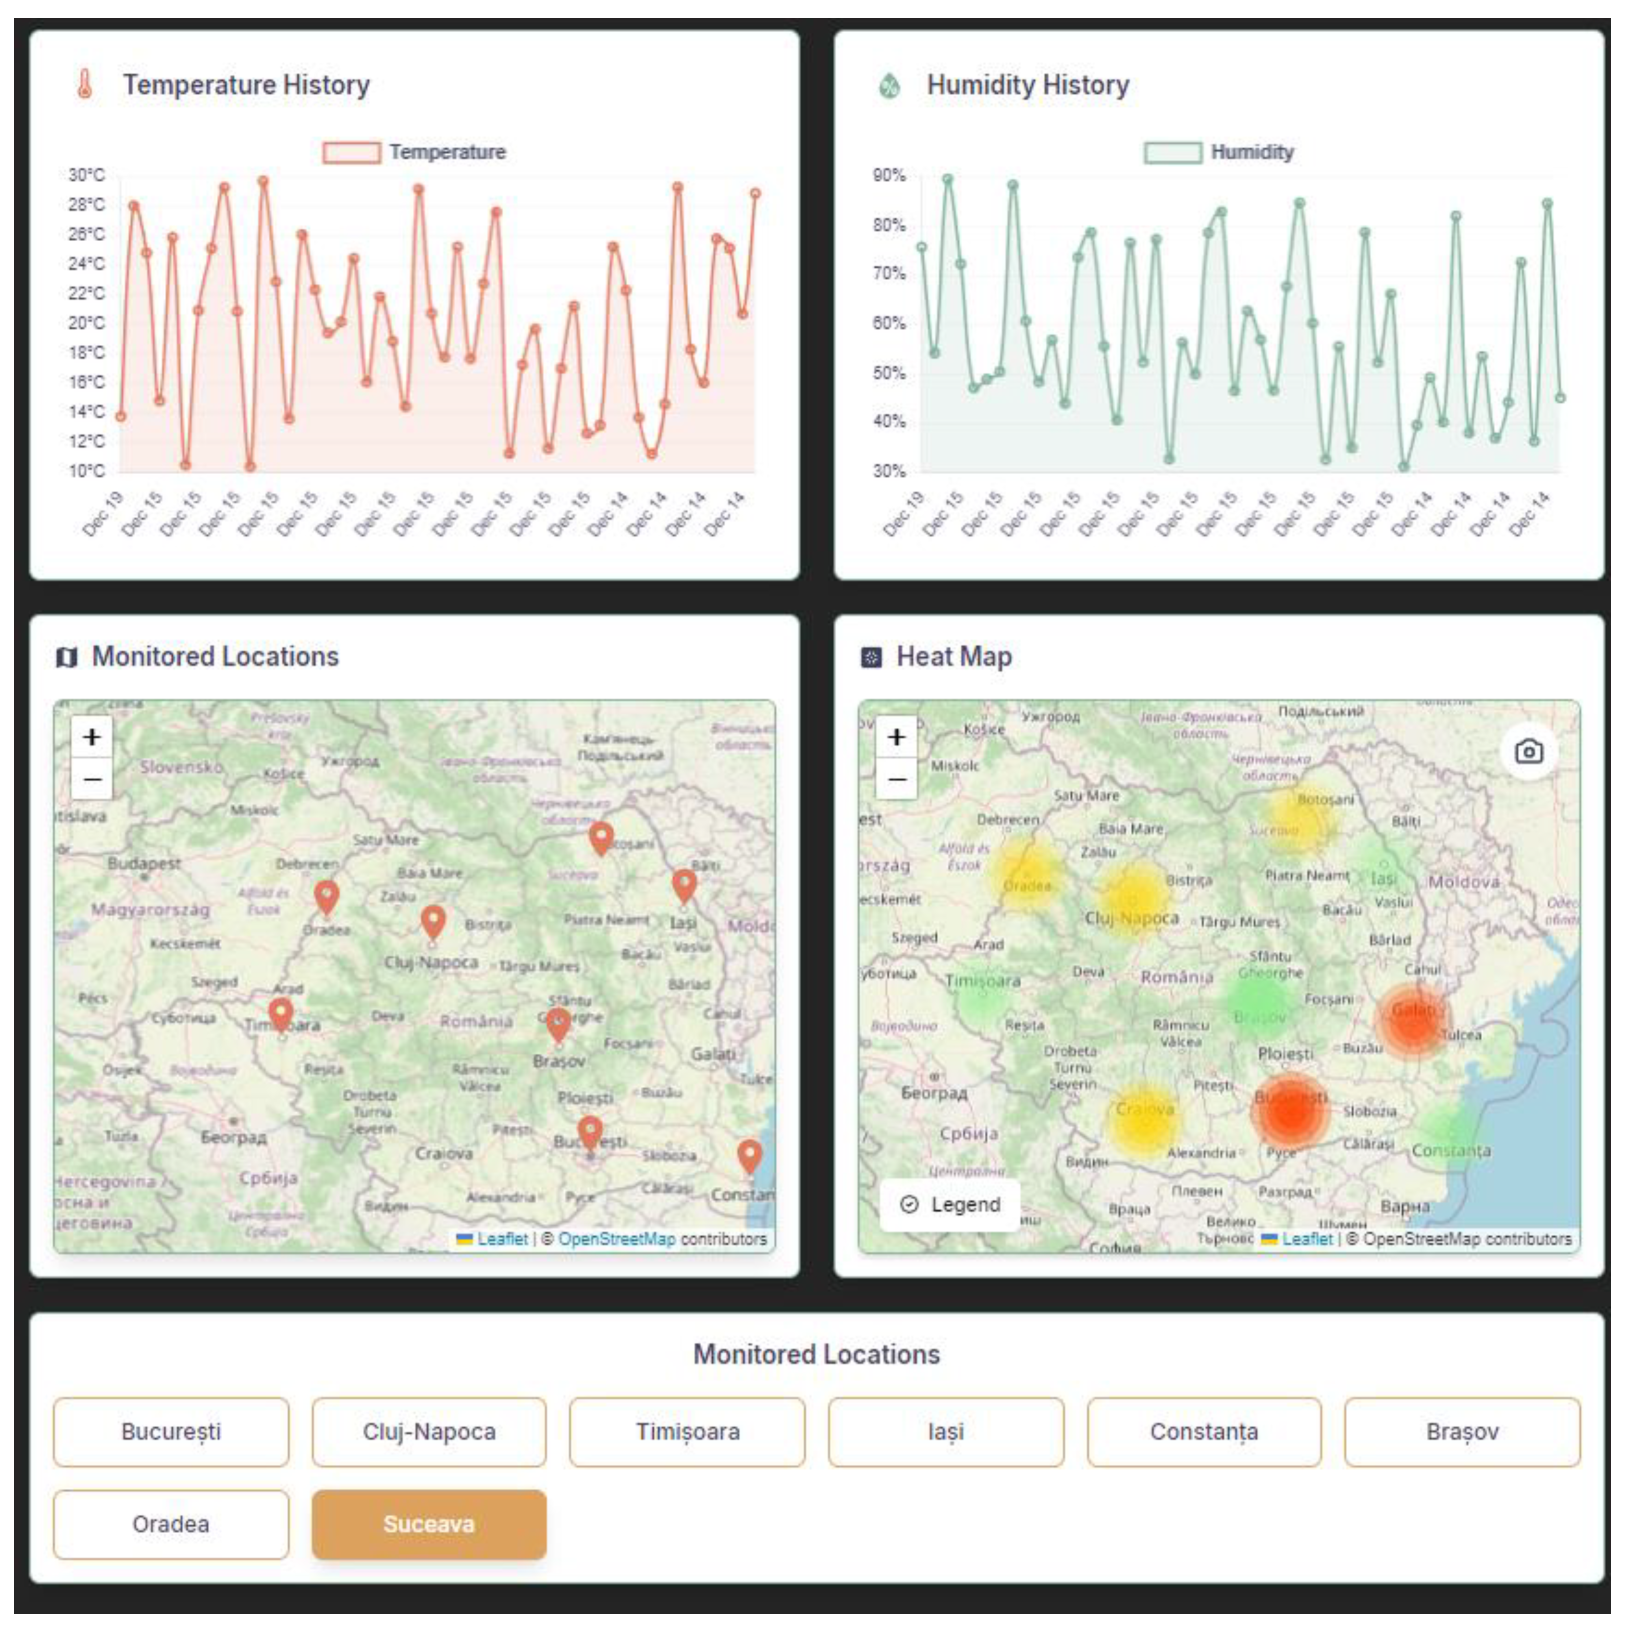
Figure 8.
Decision Graph at 02:00-08:00 VS at 11:00-15:00.
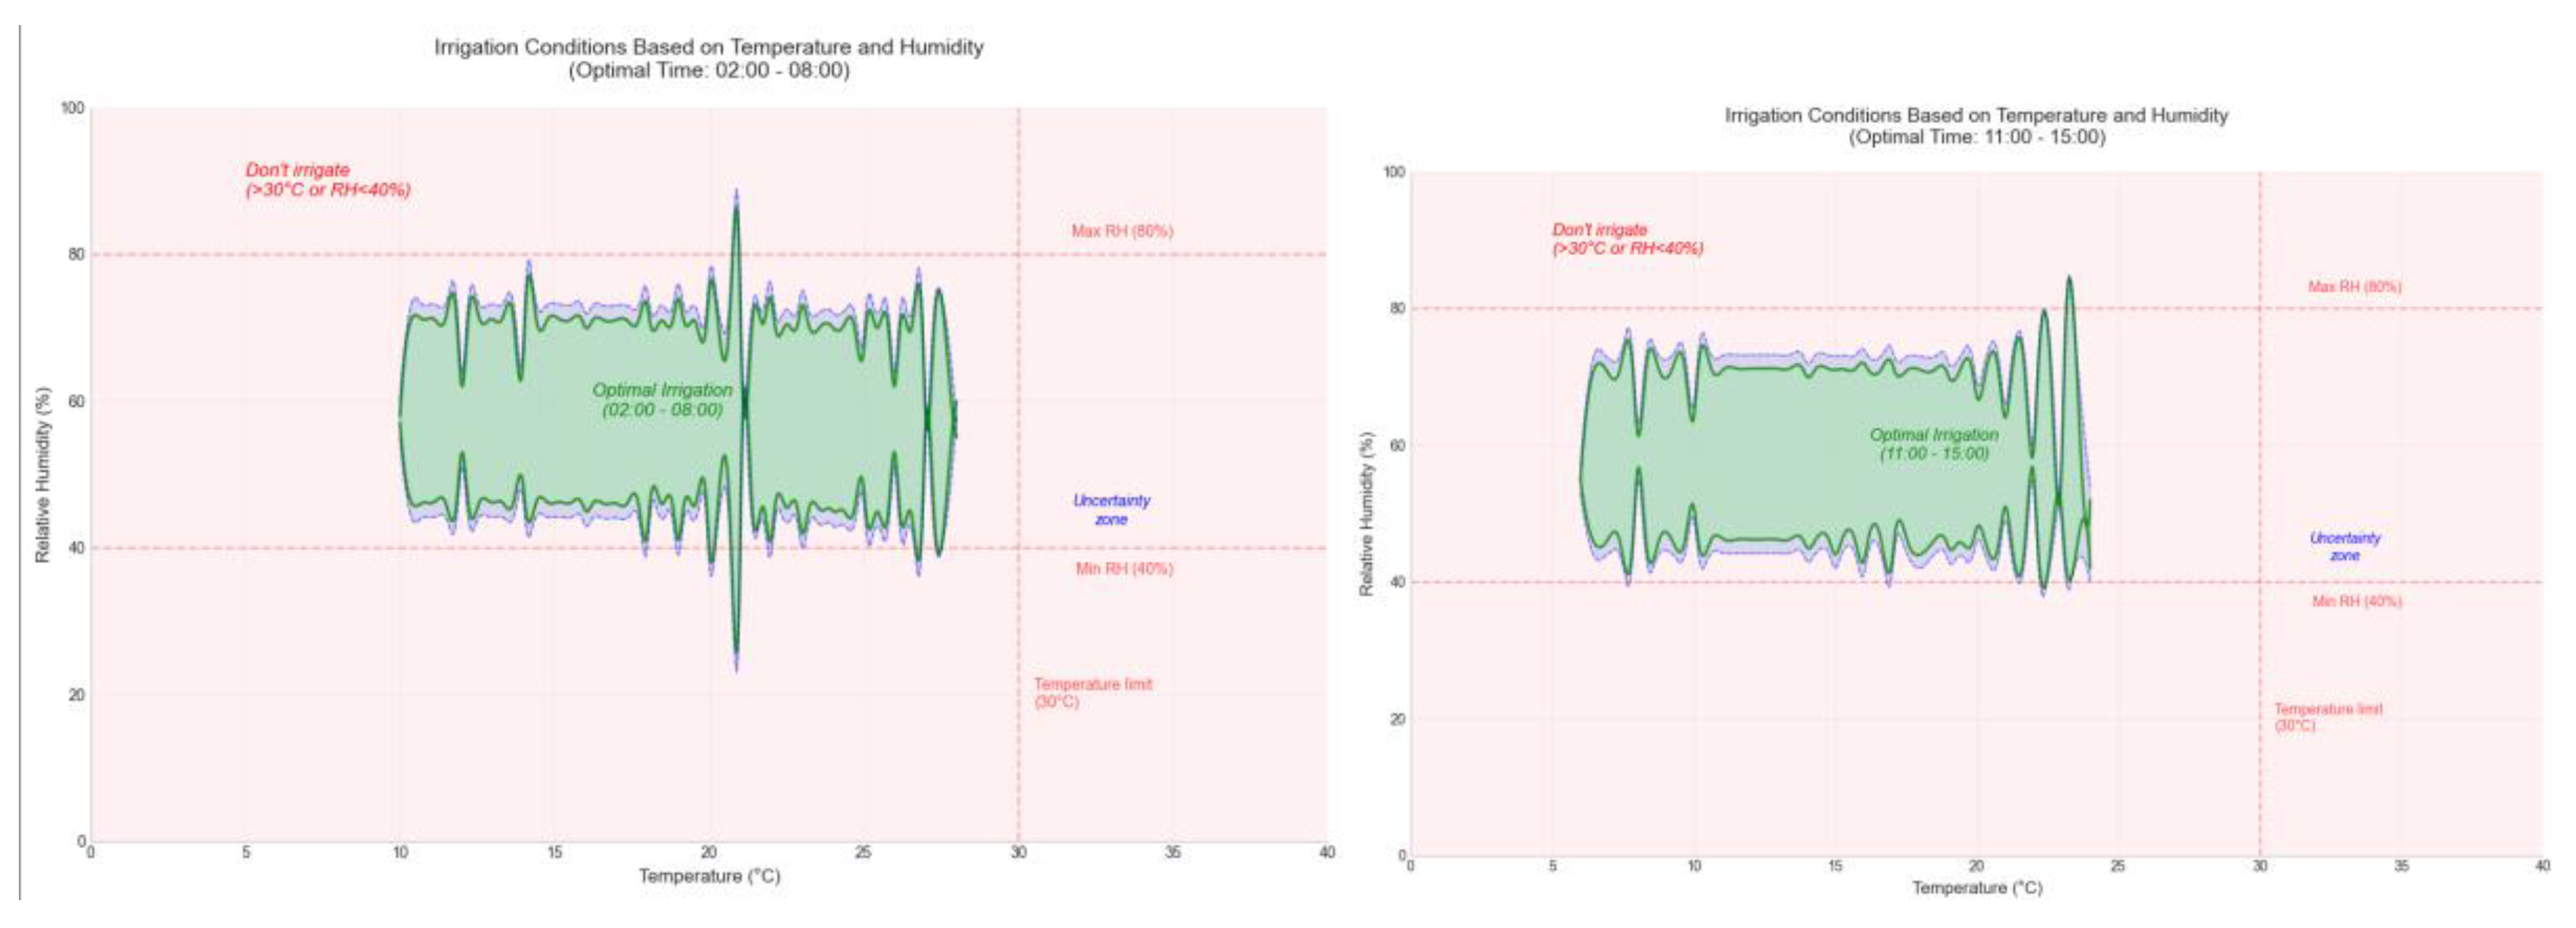
Figure 9.
Graphical display of temperature and humidity.
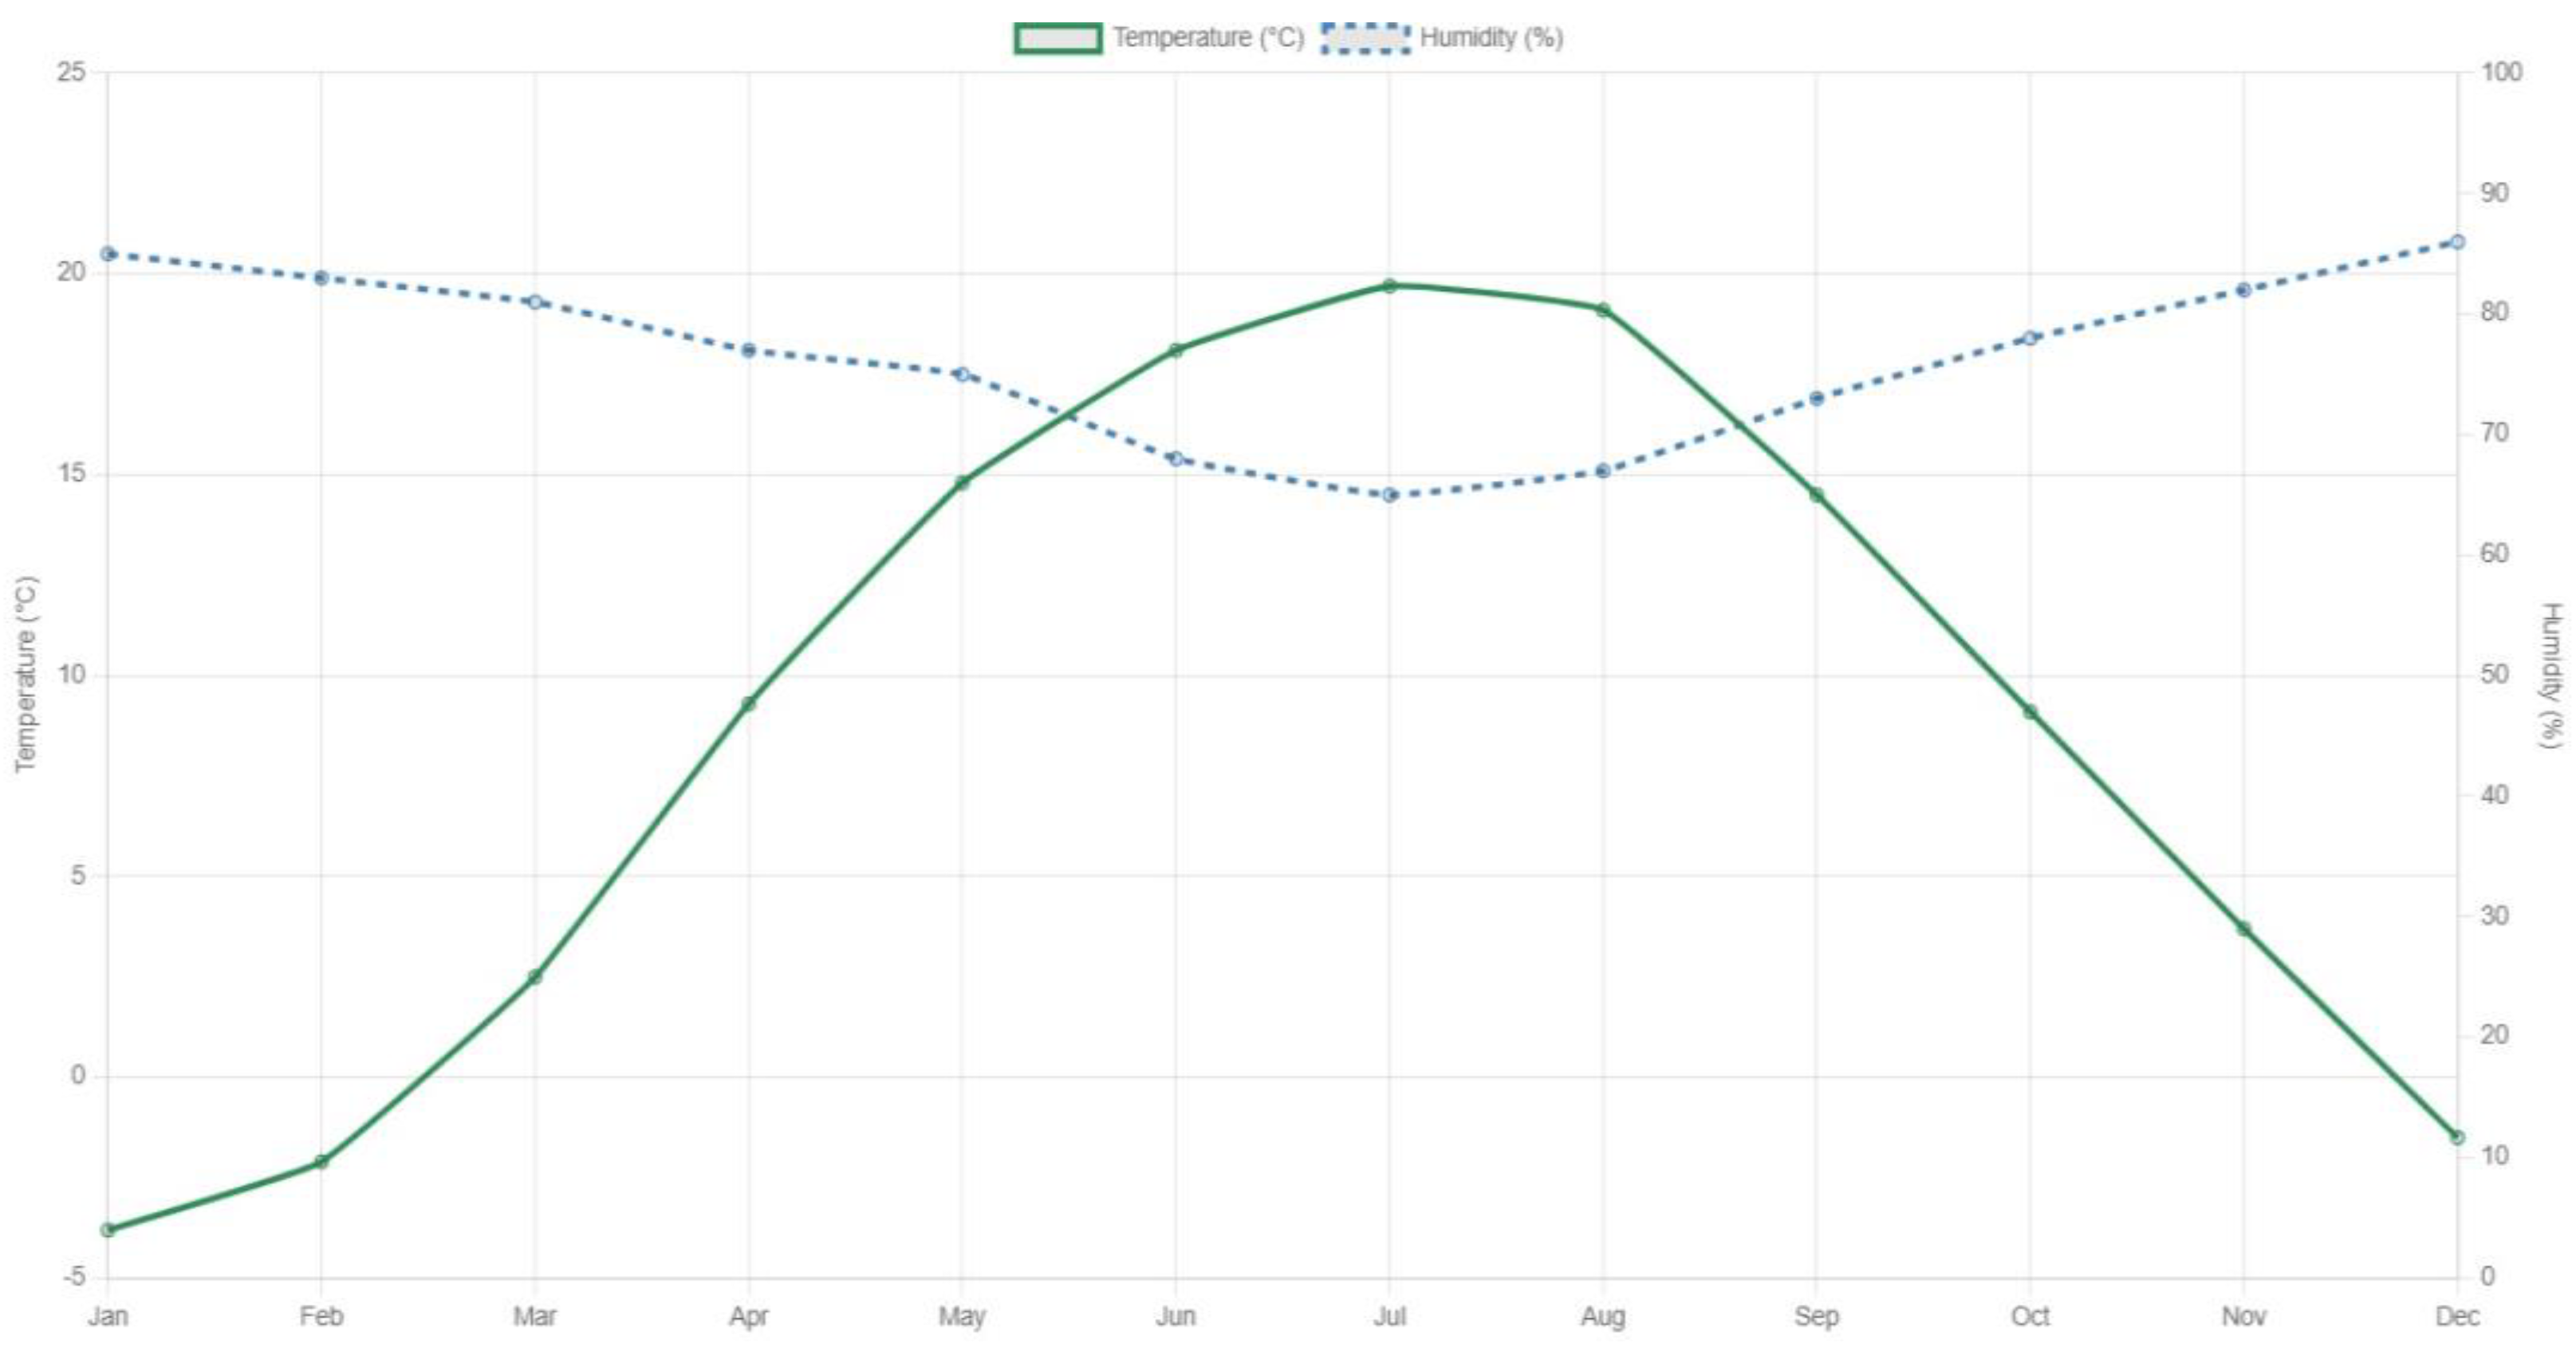
Figure 10.
Comparison of temperature evolution between 2023 and 2024.

Figure 11.
Comparison of humidity evolution between 2023 and 2024.
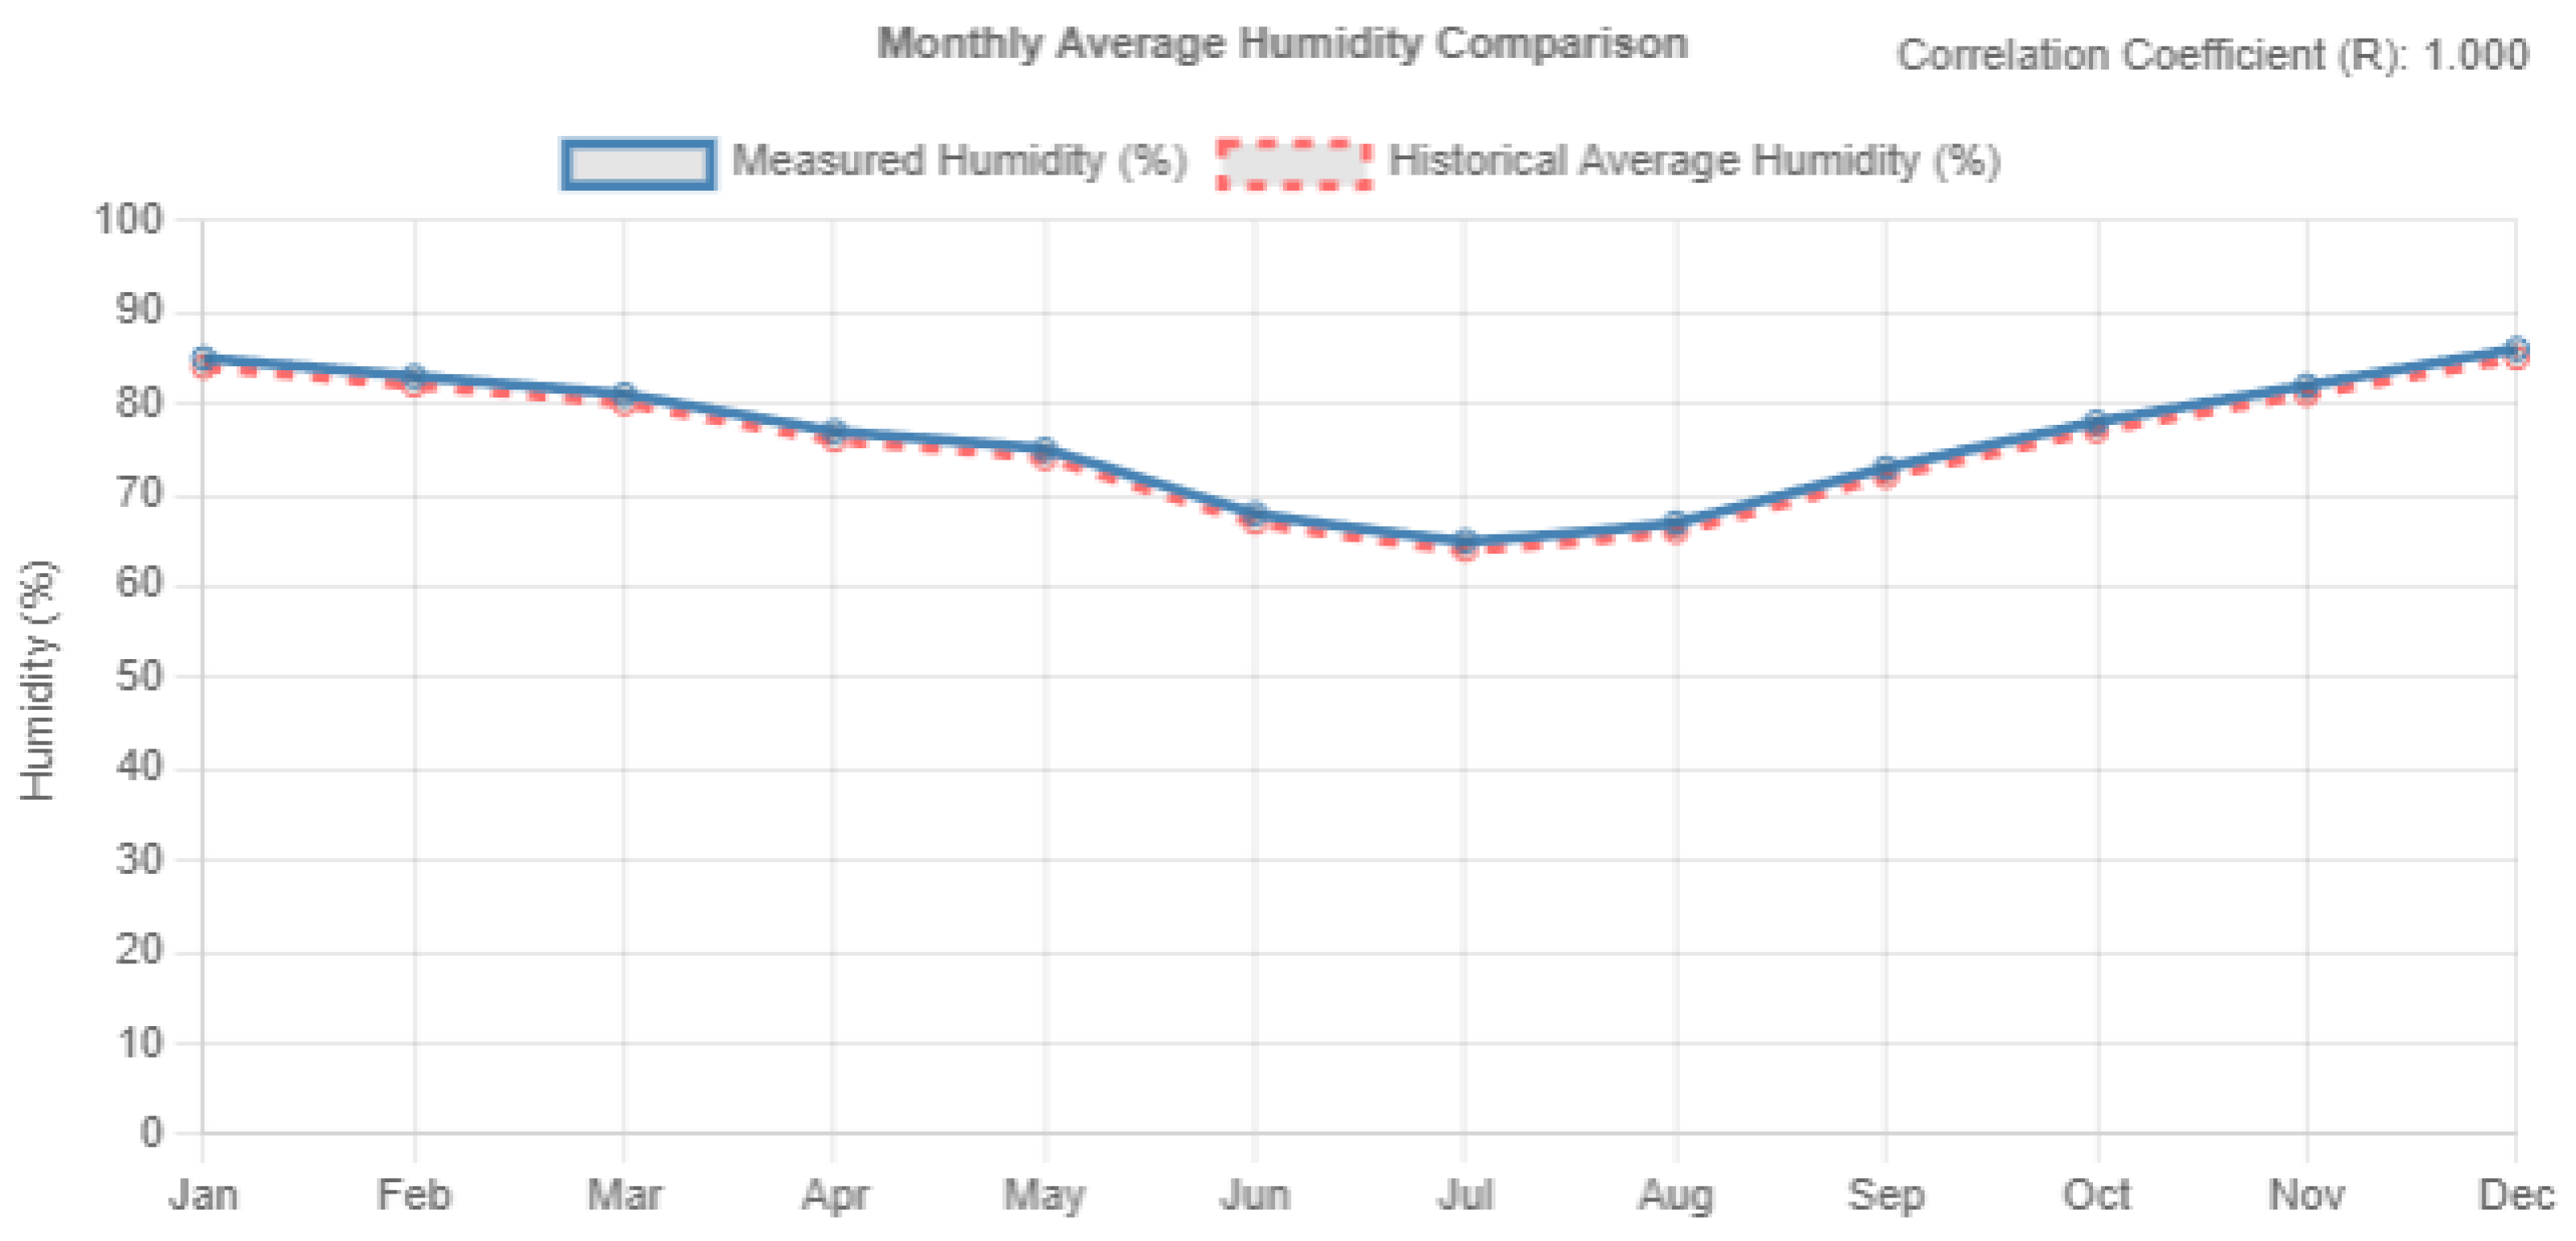
Figure 12.
Graficul precipitatiilor si cantitatii de apa inregistrate de sistem.
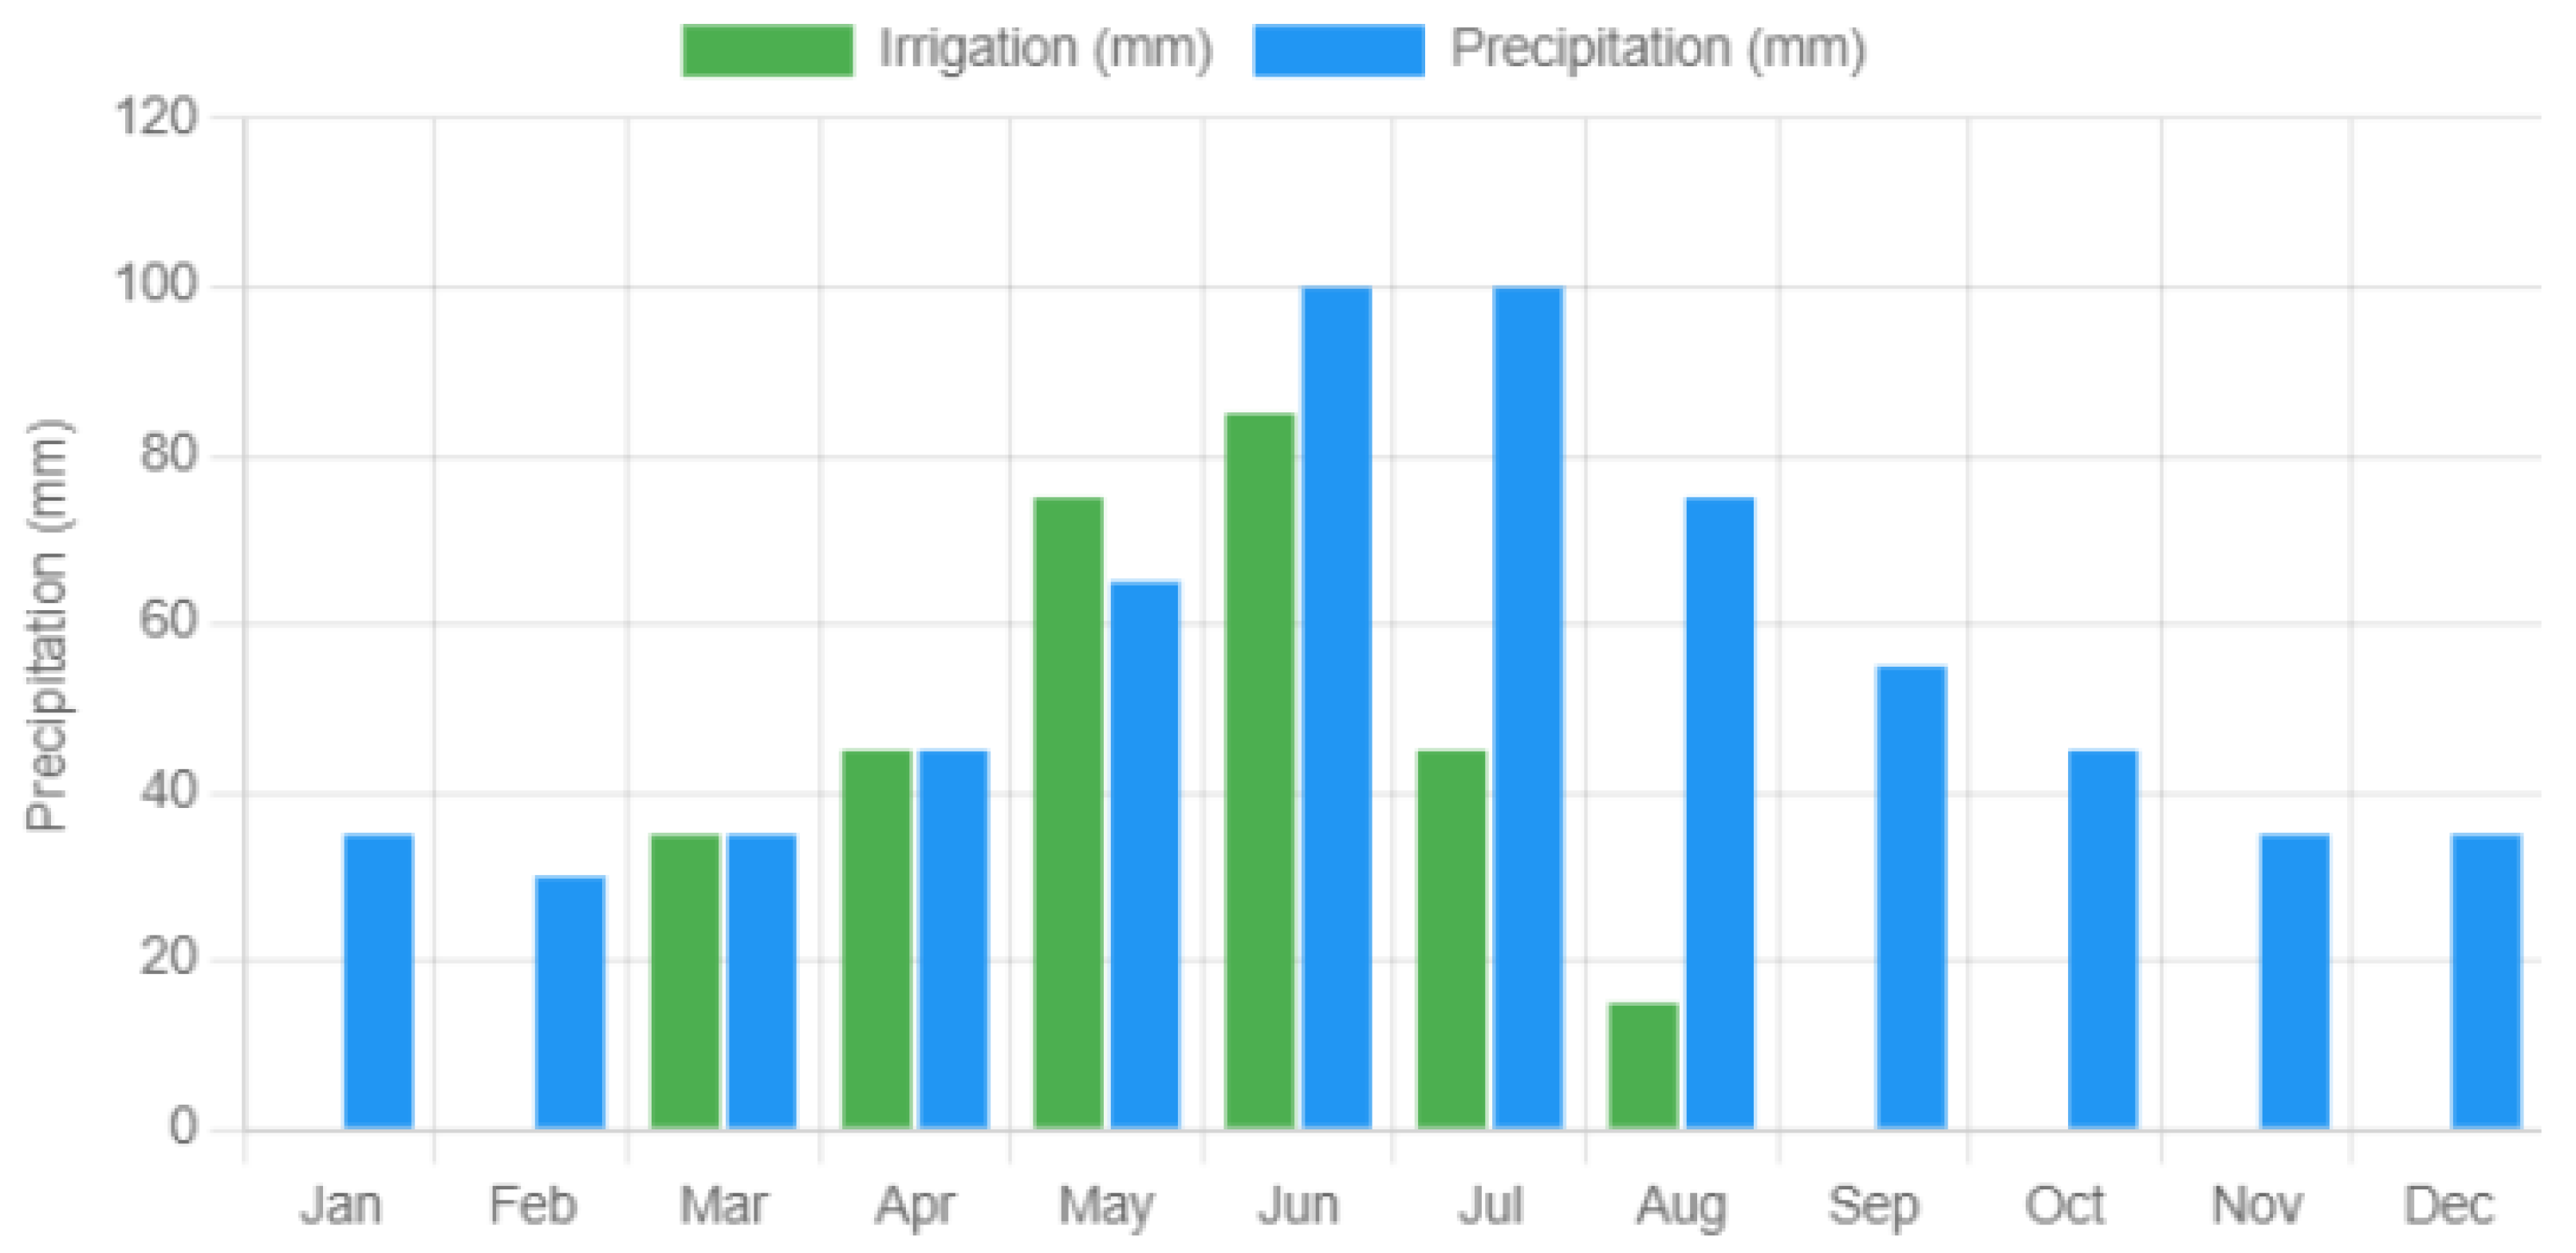

Table 1.
Temperature and humidity data recorded.
| Month | Temperature (°C) | Humidity (%) |
|---|---|---|
| January | -3.8 | 85.0 |
| February | -2.1 | 83.0 |
| March | 2.5 | 81.0 |
| April | 9.3 | 77.0 |
| May | 14.8 | 75.0 |
| June | 18.1 | 68.0 |
| July | 19.7 | 65.0 |
| August | 19.1 | 67.0 |
| September | 14.5 | 73.0 |
| October | 9.1 | 78.0 |
| November | 3.7 | 82.0 |
| December | -1.5 | 86.0 |
Disclaimer/Publisher’s Note: The statements, opinions and data contained in all publications are solely those of the individual author(s) and contributor(s) and not of MDPI and/or the editor(s). MDPI and/or the editor(s) disclaim responsibility for any injury to people or property resulting from any ideas, methods, instructions or products referred to in the content. |
© 2024 by the authors. Licensee MDPI, Basel, Switzerland. This article is an open access article distributed under the terms and conditions of the Creative Commons Attribution (CC BY) license (http://creativecommons.org/licenses/by/4.0/).
Copyright: This open access article is published under a Creative Commons CC BY 4.0 license, which permit the free download, distribution, and reuse, provided that the author and preprint are cited in any reuse.


