
Submitted:
12 December 2025
Posted:
17 December 2025
You are already at the latest version
Abstract
In a rapidly urbanized world, 2.5 billion people are projected to shift from rural to urban areas by 2050, with close to 90% of this shift occurring in Africa and Asia. Likewise, in Southeast Asia, the Phnom Penh capital city of Cambodia, is rapidly urbanizing, faces significant challenges in improving the quality of life and achieving social sustainability. Hence, this research aims to assess this capital on social sustainability aspects to find out the strong and weak points of its 14 districts in order to verify the improvement potentials for each district. The research developed and applied an urban social sustainability index based on national development priorities, SDG11, and the New Urban Agenda, and other SDGs that incorporated human wellbeing and social inclusiveness, such as SDGs1-6, SDG8, SDG10, and SDG12. The AHP technique has been used to prioritize the selected indicators, and the standard viable model has been used to assess the 14 districts of Phnom Penh, whereas the data were sourced from the Phnom Penh Capital Socio-Economic Data. The results showed that the most sustainable district was Chamkarmon, followed by Boeng Keng Kang and Doun Penh. Prek Pnov was found to be weak in income generation and welfare, while Kamboul was weak in gender inclusive. Prampir Makara was more resilient to vulnerability, while Sen Sok was weak in this dimension. Boeng Keng Kang was strong in welfare and sanitation, while Kamboul was weak in sanitation. Doun Penh was strong in water supply, while Mean Chey was weak in this dimension.
Keywords:
new urban agenda
; sustainable cities
; sustainable development goals
; SDGs
; Cambodia
; Phnom Penh
; urban sustainability assessment
; urban social sustainability
1. Introduction
In the United Nations Conference on Sustainable Development, known as the Rio+20 Earth Summit [1], which was a follow-up to the 1992 Rio Earth Summit and the 2002 Rio+10 Earth Summit [2], the UN member states agreed to launch a process to formulate a set of sustainable development goals (SDGs) [1]. This was one of the global agendas to address global issues, which urbanization is known as the major issue since the world is rapidly urbanizing. The UN statistics showed that more than half of the world population has lived in urban areas [3]. The UN projected that nearly 70 percent of the world population is expected to live in urban areas by 2050 [4,5]. The projection showed that with the gradual shift of population from rural to urban areas, 2.5 billion people will possibly be added to urban areas by 2050, with close to 90 percent of this shift occurring in Asia and Africa [4]. This can be elaborated that rapid urbanization is mostly occurring in developing countries. Particularly, in Southeast Asia, rapid urbanization is occurring in Cambodia and six other countries, such as Indonesia, Malaysia, Philippines, Singapore, Thailand, and Vietnam, according to the Martin Prosperity Institute, and this region’s urban population was expected to grow by another 100 million people by 2030, adding to the current population of 280 million people [6]. Therefore, improving the quality of urban life and urban inclusion and sustainability are needed for these countries in Southeast Asia, including Cambodia.
In 2015, the Sustainable Development Goals (SDGs) were adopted by 193 countries towards ending poverty and creating continuous peace and prosperity for the people and planet, which set to be achieved by the year 2030 [7,8]. In particular, SDG11 aims to make cities and human settlements inclusive, safe, resilient, and sustainable, known in short as sustainable cities and communities [9]. Especially, Target 11.a was set to support positive economic, social, and environmental links between urban, peri-urban, and rural areas by strengthening national and regional development planning [10]. Specifically, the New Urban Agenda (NUA), adopted by 167 countries in 2016, is aimed for setting a new global standard for planning, management, and living in cities [11]. The NUA has served as an important tool for sustainable development of cities in both developed and developing countries by offering a series of sustainable urban development standards that aim at offering basic services for all citizens and ensuring that all citizens have access to equal opportunities and face no discrimination [12,13]. The basic services provided includes the access to adequate housing, nutritious food, clean water and sanitation, healthcare, education, and family planning while ensuring that all citizens have equally access to opportunities and face no discrimination (everyone has the right to benefit from what their cities offer, while calling on city authorities to take into account the inclusiveness) [12]. This means the NUA is significantly addressing SDG4 (quality education) [14] and SDG5 (gender equality) [15].
Literature showed that education significantly has a direct influence on environmental attitudes and an indirect influence on environmental behavior [16,17,18]. Consequently, education is a core component of pro-environmental behavior and influences the long-term development of sustainable cities and communities. According to OECD [19], improved gender equality in decision-making and the professions related to urban planning have also contributed to the optimization of settlements and urban infrastructure investments to meet the needs of all people, achieved social inclusion, particularly underrepresented groups. Moreover, since urban children’s populations have rapidly increased, there is a strong commitment, globally, in promoting child-friendly cities and communities [3]. The UNICEF has developed a framework for action to build child-friendly cities and communities, which outlined the steps to build a governance system [20,21]. Especially, UNICEF produced a guide book, setting building blocks for developing child-friendly cities and communities, providing good practices and lessons learned to guide the city governments and relevant stakeholders [22]. This brings local stakeholders together with the UNICEF to create cities and communities to offer safe, inclusive, and responsive conditions for children [23,24,25], which is the indicator for a successful city for everyone [26].
In Cambodia, the government successfully implemented the Triangular Strategy (1998–2003) and the Rectangular Strategy in four distinct phases (2004–2023), with significant achievements in all areas, including economy, society, and politics, enabling Cambodia to proudly return its image of the last 25 years with full peace, territorial integrity, and national unity achieved through a win–win policy [27]. This has significantly contributed to a positive socioeconomic development in the country [28,29]. The notable results are (i) Cambodia obtained a lower-middle-income status in 2015 (World Bank [30]) and became a New Tiger Economy in Asia in 2016 (ADB [31]). With its Rectangular Strategy, the government identified four priority areas for the development, which set people (human resource) as the first priority, followed by road, electricity, and water [32]. Thus, the government has increased the national budget for the education sector. The education budget has increased from 278.87 million in 2015 to 724.80 million USD in 2020 [33], and kept growing in the following years. Moreover, literature also showed that the first key priority of finance strategy for archiving SDGs in Cambodia was also the education sector, including gender mainstreaming [34].
By realizing the past 25 years of achievements, especially global and regional trend assessments, and for the next 25-year prognostications, the government upgraded its Rectangular Strategy to a new strategy, namely Pentagonal Strategy. The Pentagonal Strategy Phase I (2023-2028) has set the national development priorities centered on the themes of growth, employment, equity, efficiency, and sustainability [35]. The main objective of this new strategy is to obtain an upper-middle-income status in 2030 and to realize the Cambodia Vision 2050, become a high-income country, toward meeting its people’s aspirations. Thus, the strategy aims to boost growth, create jobs, ensure equity, increase efficiency, and maintain sustainability [24]. This strategy serves as a guideline to direct activities of all relevant stakeholders to continue to maintain peace and the momentum and accumulation of past achievements, as well as to build the foundation towards accelerating medium- and long-term development through targeted reforms across all sectors [36]. In particular, the objective of the “Pentagon 4” is for “resilient, sustainable, and inclusive development” in which the “priority 4” is aimed at strengthening urban management, focusing on existing urban areas in the capital city and provinces, to ensure safety, beauty, good environment, and well-being of people, as well as socio-economic efficiency [35].
The summary above showed that literature in the field and global agendas, SDGs and NUA, especially national development priorities of Cambodia centered around sustainability and inclusiveness as important for sustainable urban development and management. This research reflects these aspects with the development of the Cambodia’s Phnom Penh capital city. Currently, the Phnom Penh capital city has a population of more than two million and faces rapid urban development issues [37,38,39] and challenges in improving the quality of life and in achieving sustainable development goals on social dimensions [9]. In this regard, the assessment of this capital city, particularly its 14 capital districts (known in Khmer as capital khans) based on social sustainability dimensions would find out its strengths and weaknesses, especially the improvement potential. Hence, this research aims to assess the social sustainability of the Phnom Penh capital city, to find out the strengths and weaknesses of its districts (14 khans), and then provide recommendations on improvement potentials for each district. This research developed an urban social sustainability assessment framework based on the national development priorities, the New Urban Agenda, SDG11 (sustainable cities), and other SDGs that incorporated human well-being, such as SDGs1-6, SDG8, SDG10, and SDG12. The standard variable model was applied to standardize indicators before comparison to obtain high accuracy, and the data were sourced from the Phnom Penh capital socio-economic data (commune database). This research is also the update and expansion of the article “Assessing urban sustainability and the potential to improve the quality of education and gender equality in Phnom Penh” [11], which is the latest series of the following studies: development and prioritization of sustainable city indicators for Cambodia (2019) [40,41]; sustainability of the capital and emerging cities of Cambodia (2020) [42]; child-friendly urban development in Phnom Penh, Cambodia (2021) [5]; urban quality assessment of Cambodia’s Phnom Penh capital khans (2022) [43].
2. Methodology
2.1. Assessment Framework
As summarized in the above section, this research developed an urban social sustainability assessment framework based on existing literature, the global sustainable urban development agenda (NUA), and SDGs such as SDG11 (sustainable cities and communities), and other SDGs that incorporated human well-being, including SDGs1-6, SDG8, SDG10, and SDG12. Especially, the framework was based on the national development priorities of Cambodia indicated in the Pentagonal Strategy, particularly the “Pentagon 4—Resilient, Sustainable, and Inclusive Development” and its priority 4—strengthening urban management, focusing on existing urban areas in the capital city and provinces, to ensure safety, beauty, good environment, and well-being of people, as well as socio-economic efficiency [44].
The assessment framework was so-called Urban Sustainability and Inclusiveness (USI) integration as shown in Figure 1. The first cycle “U” referred to the national development priorities for cities/urban areas indicated in the Pentagonal Strategy, particularly the “Pentagon 4—resilient, sustainable, and inclusive development” and its priority 4—strengthening urban management, focusing on existing urban areas in the capital city and provinces, to ensure safety, beauty, good environment, and well-being of people, as well as socio-economic efficiency. The second cycle “S” referred to the sustainable development goal 11 (SDG11—make cities and human settlements inclusive, safe, resilient, and sustainable) [45,46] and the New Urban Agenda (NUA—offering basic services for all citizens and ensuring that all citizens have access to equal opportunities and face no discrimination) [12,13]. The third cycle “I” referred to the other SDGs that incorporated human well-being and social inclusion, which included SDG1 (end poverty in all its forms everywhere), SDG2 (end hunger, achieve food security and improved nutrition and promote sustainable agriculture), SDG3 (ensure healthy lives and promote well-being for all at all ages), SDG4 (ensure inclusive and equitable quality education and promote lifelong learning opportunities for all), SDG5 (achieve gender equality and empower all women and girls), SDG6 (ensure availability and sustainable management of water and sanitation for all), SDG8 (promote sustained, inclusive, and sustainable economic growth, full and productive employment, and decent work for all), SDG10 (reduce inequality within and among countries), and SDG12 (ensure sustainable consumption and production patterns) [47].
Furthermore, the crosscutting sections are U-S (integrated urban national priorities and SDG11 and NUA), U-I (integrated urban national priorities and SDGs1-6, SDG8, SDG10, and SDG12), and S-I (integrated SDGs1-6, SDG8, SDG10, and SDG12 and SDG11 and NUA). Thus, urban social sustainability assessment index was the USI set of indicators. Based on this assessment framework and data availability from the Phnom Penh capital city’s socio-economic data (commune database) [48], this research consequently obtained 32 indicators for urban social sustainability assessment of the Phnom Penh capital city’s 14 districts. These indicators are divided into 8 categories “income, gender, welfare, education, vulnerability, clean water, sanitation, and safety, as shown in Table 1.
2.2. Indicator Weighting Analysis
This research analyzed the weights of urban social sustainability indicators in order to find out their relative weight which is very important to improve the accuracy of the comparative assessment. Therefore, the analytic hierarchy process (AHP) was used to analyze their relative weight. AHP is widely known as a structured technique for organizing and analyzing complex decisions based on mathematics and psychology. It was founded by Thomas L. Saaty in the 1970s [49,50], who partnered with Ernest Forman to develop Expert Choice in 1983 and has been extensively studied and improved since then [51,52]. It represents a valid method for weighing analysis of any criteria or indicators. Individual experts’ experiences are utilized to estimate the relative magnitudes of factors through pairwise comparisons while these pairwise comparisons must be consistent [49,51]. Therefore, the consistency ratio must be less than or equal to 0.1 (CR ≤ 0.1 or CR ≤ 10%). The AHP structure of the urban social sustainability assessment indicators (32 indicators) classified by 8 categories are shown in Figure 2.
The weights of all indicators were analyzed by calculating the principal eigenvector through the AHP matrix. Its consistency was assessed through the consistency index (CI) and the consistency ratio (CR), as shown in the following Equations (1) and (2):
and
where, λmax corresponds to the maximum eigenvalue of the pairwise comparison matrix; n is the number of the pairwise-comparison indicators demonstrated in table above; and RI is a random consistency index that depends on the number of pairwise-comparison indicators. More importantly, the consistency ratio (CR) must be lower than or equal to 0.1 (CR ≤ 0.1) [49,51].
In particular, this research followed the theories and practical applications of Soldatou et al. (2022) [52] and Dongmin et al. (2020) [53], as well as AHP-based research [54,55], to analyze the weights of indicators by the AHP technique since the author has applied this technique extensively in analyzing the weights of urban sustainability indicators in Cambodia. Therefore, the relative weights of urban social sustainability assessment indicators were analyzed based on the author’s experiences and his practical applications in the following series of research publications: Chan and Lee 2019 [40]; Chan and Lee 2019a [41]; Chan 2020 [42]; Chan 2021 [5]; Chan 2022 [56]; and Chan et al. 2023 [11]. In summary, the survey obtained 102 consistent respondents from the offline (face-to-face) interview, mainly with the government officials, and online surveys through E-mail, Facebook, and LinkedIn. The surveyed respondents were experienced in working in the fields of sustainable cities and community planning, development, management, and assessment in Cambodia.
2.3. Standardizing Variables
Standardizing variables is a statistical technique that makes different variables more comparable, which can be useful for a number of reasons, including: Ensuring equal contribution (standardization ensures that all variables contribute evenly to a scale when items are added together), revealing essential findings (standardization can help reveal essential findings that you would otherwise miss), determining which variable is most important (standardization can help determine which variable is the most important), comparing regression coefficients (when variables have the same variances, it is easier to compare the relative magnitudes of different regression coefficients), and simplifying computation (standardization simplifies the computation of sample covariances and correlations) [57,58]. There are some ways to standardize variables. For example, subtracting the mean from the value for each case and dividing the difference between the individual’s score and the mean by the standard deviation. Based on these reasons, this research consequently standardized variables, values of indicators, before the comparison.
Therefore, comparative assessments by standardizing variables, values of indicators, and using indicator weights were found to be a significant approach to improve the accuracy of the comparison, especially for this research of comparative urban social sustainability assessment of Phnom Penh’s 14 capital khans (14 districts). Based on the normal distribution model, statistical standard variables, or Z-values, or standard scores defined the number of standard deviations with the value of a raw score (for example, the indicator values or data observed) being higher or lower than the mean value of what was observed or measured [42]. The above-average raw scores or raw values resulted in positive standard scores, while the below-average scores or values resulted in negative standard scores, as shown in Figure 3.
Furthermore, the Z-values were calculated by subtracting the mean of population from each raw score (variable), and then dividing the difference by the deviation from the population (variables). The process of converting raw scores into standardized scores is termed normalization; however, normalization can refer to a wide range of ratios. Calculating the Z-values requires the specification of a mean value (average), and the standard deviation of the full population (variables) with which the data points were associated. If only a sample of population observations is available, then approximation with the sample mean value (average) and standard deviation gives the T-statistic [61].
Kreyszig [62] claimed that the analyzed population mean value and standard deviation of raw score X was converted into a standard score by the following formula, with μ standing for the mean of the population, and σ representing the standard deviation of the population:
The absolute value of Z represents the distance between the raw score X and the population mean in units of standard deviation; Z is negative when the raw score is below the average, and positive when it is above the average. The standard normal distribution tables developed by Claude et al. in 2016, and revised by Claude in 2017 [60], were to provide P-values (probability). According to the developed tables [60], Z values (values in the left column and on the top row) are points on the horizontal scale, whereas probabilities (values in the body of the table) are the regions bounded by the normal curve and horizontal scale.
In this research after obtaining the Z values, Phnom Penh’s 14 capital khans (14 districts) were then classified ranks based on the probability values (P-values). Since there were 14 districts, the ranking has been resulted in between 1 and 14. Furthermore, the scoring scales were then made based on the ranking, which means that the 1st rank received 14 scores, 2nd rank got 13 scores, and 3rd rank got 12 scores; this continued till the 13th rank got 2 scores, and 14th (last) rank got 1 score. After obtaining the scores of all 14 districts by each indicator, this research subsequently analyzed the weighted values (W-values) by multiplying the ranked scores by the total weights of urban social sustainability assessment indicators.
2.4. Data Source and Analysis
As mentioned in the above section, this research comparatively assessed urban social sustainability of the 14 districts (khans) of Phnom Penh, the capital and largest city of Cambodia with a total population of 2,129,371 in 2019 [63]. The Phnom Penh capital is located at the intersection of four rivers (locally called four-face river), namely Sap River (Tonle Sap), Upper Mekong River, Lower Mekong River, and Bassac River. Figure 4 below illustrates the capital map with the location and population of each district.
The data by each indicator of all 14 districts that have been used in this research were sourced from the Phnom Penh Capital Socio-Economic Data in 2019 (the government’s source), which was prepared and published by Phnom Penh Capital Department of Planning under the Ministry of Planning of Cambodia [48]. The data used for all urban social sustainability indicators were verified and translated from the Cambodian language, and calculated based on the required unit of each indicator.
By using the standard variable model to comparatively assess urban social sustainability of Phnom Penh’s 14 districts allowed this research to find out the strengths and weaknesses of each capital district by each urban social sustainability indicator. According to the first and second clean city contests conducted by the National Committee for Clean City Assessment [64], many capital districts have been awarded Clean City Romduol III (1st rank) and Romduol II (2nd rank). More importantly, each of these districts has its own strong points to be followed and learnt from, especially for the districts that have low or weak points on that indicator, which can learn and improve based on the best practices of the strong districts.
Furthermore, the ASEAN (11 countries) has developed the ASEAN Sustainable Cities Award, which is an initiative to keep ASEAN cities clean, green, and livable even as they continue to grow as centers of economic and industrial activity. It is not only promoting environmentally sustainable practices and monitoring progress towards environmental sustainability, but also enhancing environmental education and awareness among city communities, stimulating public participation in city pro-grams, recognizing efforts towards improving sustainability, and encouraging partnership between public authorities, the private sector, and non-governmental organizations. Additionally, Phnom Penh has also won this Award [65,66]. This confirmed that this capital really has strong points of indicators and best practices to follow.
Therefore, forming a standard average based on each district’s strong points of indicators and best practices will help to find out the weak points of its peers after comparison and reveal the improvement potentials for the preference of Cambodian people and the context of urban social sustainability in Cambodia. Hence, this research followed this concept to form a standard average based on the use of the Z-score technique to assess the 14 districts through the application of the urban social sustainability index.
3. Results and Discussion
Priority weights of urban social sustainability index development: After conducting the AHP pairwise comparison analysis to prioritize the selected potential indicators for urban social sustainability index development, this research obtained the priority weights as shown in Table 2. The highest-weight section was Safety (0.1454), followed by Income (0.1448) and Education (0.1413). The highest-weight indicator was career (0.0691), followed by primary education (0.0568) and habit (0.0552).
The above priority index development results also showed that the highest-weight indicator under the ‘Income’ section was the ‘Ratio of employees in production and services per 1000 population’, while the highest-weight indicator under the ‘Gender’ section was the ‘Ratio of technical female workers to total employees in production and services’, which also related to employment. In this sense, the careers or employment dimensions were considered the first priority for urban development to achieve social sustainability in Phnom Penh. It is also the same with one of the five main priorities of the Cambodian government, indicated in the ‘Pentagonal Strategy’, while the first three of the five strategic priorities of this Strategy aimed to promote this dimension. Those three priorities are (i) ensuring economic growth, (ii) creating more jobs, and (iii) achieving poverty reduction [32]. Therefore, achieving urban social sustainability in Phnom Penh should be given more consideration on employment dimensions. UN and WB reports recently also claimed that employment is crucial for Cambodia’s urban social sustainability by reducing poverty, improving living standards, fostering inclusive growth, and building community resilience, as decent jobs provide income, access to services (health, education), and integrate the poor into the economy, preventing the social strains of rapid urbanization such as inequality and poor basic services. Strong employment creates purpose, engages workers, and supports the ‘Green Jobs’ agenda, aligning economic development with environmental and social goals for balanced, long-term urban well-being [67,68,69].
Results of urban social sustainability index application to assess 14 districts are demonstrated as following sections:
3.1. Income Section
The results of the urban social sustainability index application to assess the 14 capital districts of Phnom Penh at the ‘Income’ section showed that the strongest in-come sustainability district was Chamkarmon (1.9892), followed by Doun Penh (1.5644) and Boeng Keng Kang (1.5481), as shown in Figure 5a.
Chamkarmon was the strongest income sustainability district, compared to others because this district had maintained the highest ratio of employees working in production and services per 1000 population and the highest percentage of households living in quality houses, while also higher in the ratio of populations, aged 18–35, who joined vocational training per 1000 population and the percentage of main and secondary non-agricultural jobs by women, as shown in Figure 5b.
Doun Penh was the stronger income sustainability district after Chamkarmon because this district had maintained a higher ratio of employees working in production and services per 1000 population, which is the indicator to obtain the highest weight.
Boeng Keng Kong was another stronger income sustainability district after Chamkarmon and Doun Penh because this district had maintained a higher ratio of employees working in production and services per 1000 population as well.
Prampir Makara was the strongest district in maintaining the highest ratio of populations, aged 18–35, who joined vocational training per 1000 population. Mean Chey was a stronger district after Prampir Makara and Chamkarmon in maintaining the higher ratio of populations, aged 18–35, who joined vocational training per 1000 population.
Kamboul was the strongest district in maintaining the highest percentage of main and secondary non-agricultural jobs by women.
Pou Senchey was a stronger district after Chamkarmon in maintaining the higher percentage of households living in quality houses, and after Kamboul and Chamkarmon in maintaining the higher percentage of main and secondary non-agricultural jobs by women.
3.2. Gender Section
The results of the urban social sustainability index application to assess the 14 capital districts of Phnom Penh at the ‘Gender’ section showed that the strongest gender-inclusive district was Doun Penh (1.2891), followed by Chbar Ampov (1.1634) and Boeng Keng Kang (1.1332), as shown in Figure 6a.
Doun Penh was the strongest gender-inclusive district, compared to others, because this district had maintained the highest ratio of female students to male students studied at high schools and universities, while the higher ratio of female employees to total employees in production and services and the higher percentage of commune’s and district’s council members as women, as shown in Figure 6b.
Chbar Ampov was another stronger gender-inclusive district after Doun Penh because this district had also maintained the highest ratio of female to male students studied at high schools and universities, which is the indicator to obtain the highest weight.
Boeng Keng Kong was another stronger gender-inclusive district after Doun Penh and Chbar Ampov because this district had maintained the highest ratio of female students to male students studying at high schools and universities, as well.
Tuol Kouk, Dangkao, Sen Sok, and Prek Pnov were the other strongest districts in maintaining the highest ratio of female students to male students studying at high schools and universities, but they were not good in other indicators.
Prampir Makara was the strongest district in maintaining the highest percentage of female teachers teaching at primary and secondary schools.
Chroy Changvar was the strongest district in maintaining the highest ratio of female employees to total employees in production and services.
Kamboul was the strongest district in maintaining the highest percentage of commune and district council members as women.
3.3. Welfare Section
The results of the urban social sustainability index application to assess the 14 capital districts of Phnom Penh at the ‘Welfare’ section showed that the strongest welfare-inclusive district was Boeng Keng Kang (1.5254), followed by Prampir Makara (1.4363) and Doun Penh (1.4206), as shown in Figure 7a.
Boeng Keng Kang was the strongest welfare-inclusive district, compared to others, because this district had maintained the highest ratio of pharmacies and clinics per 100,000 population and of the number of households without family violence per 1000 households. This district was also stronger in maintaining the higher percentage of children who have joined childcare/kindergarten programs aged 3–5 and the higher ratio of under-five survivals per 1000 births, as shown in Figure 7b.
Prampir Makara was the stronger welfare-inclusive district after Boeng Keng Kong because this district had maintained a higher percentage of children who had joined childcare/kindergarten programs aged 3–5, which is the indicator to obtain the highest weight, the higher ratio of pharmacies and clinics per 100,000 population, and the higher ratio of under-five survivals per 1000 births.
Doun Penh was another stronger welfare-inclusive district after Boeng Keng Kong and Prampir Makara because this district had maintained a higher ratio of pharmacies and clinics per 100,000 population, a higher ratio of under-five survivals per 1000 births, and a higher number of households without family violence per 1000 households.
Tuol Kouk was the strongest district in maintaining the highest percentage of children who had joined childcare/kindergarten programs aged 3–5. This district was also stronger in maintaining a higher number of households without family violence per 1000 households.
3.4. Education Section
The results of the urban social sustainability index application to assess the 14 districts of Phnom Penh at the ‘Education’ section showed that the strongest educational sustainability district was Chamkarmon (1.9307), followed by Boeng Keng Kang (1.6225) and Kamboul (1.5371), as shown in Figure 8a.
Chamkarmon was the strongest educational sustainability district, compared to others, because this district had maintained the highest percentage of children studied at primary schools aged 6–11, the highest percentage of literate youth aged 15–24, and the highest percentage of literate adults and middle-aged groups (25–45). This district was also stronger in maintaining the higher percentage of children studied at secondary schools aged 12–14, as shown in Figure 8b.
Boeng Keng Kang was the stronger educational sustainability district after Chamkarmon because this district had maintained a higher percentage of literate adults and middle-aged groups, and a higher percentage of literate youth aged 15–24.
Kamboul was another stronger educational sustainability district after Chamkarmon and Boeng Keng Kang because this district had maintained a higher percentage of children studied at primary schools aged 6–11, a higher percentage of children studied at secondary schools aged 12–14, a higher percentage of literate youth aged 15–24, and a percentage of literate adults and middle-aged groups.
Prampir Makara was a stronger district in maintaining the higher percentage of children studied at secondary schools aged 12–14, a higher percentage of literate youth aged 15–24, and a higher percentage of literate adults and middle-aged groups.
Pou Senchey was a stronger district in maintaining the higher percentage of literate youth aged 15–24 and the higher percentage of literate adults and middle-aged groups.
3.5. Vulnerability Section
The results of the urban social sustainability index application to assess the 14 capital districts of Phnom Penh at the ‘Vulnerability’ section showed that the strongest social resilience district was Prampir Makara (1.2233), followed by Chamkarmon (1.1817) and Tuol Kouk (1.0970), as shown in Figure 9a.
Prampir Makara was the strongest social resilience district, compared to others, because this district had maintained the lowest ratio of land conflict cases per 1000 households, a lower ratio of households living on public land (informal/illegal settlements) per 1000 households, as shown in Figure 9b.
Chamkarmon was the stronger social resilience district after Prampir Makara because this district had a lower ratio of vulnerable groups (i.e., orphans, homeless, disabled, and elders) per 1000 population, and a lower ratio of household members with drug abuse per 1000 households.
Tuol Kouk was another stronger social resilience district after Prampir Makara and Chamkarmon because this district had a lower ratio of vulnerable groups (i.e., orphans, homeless, disabled, and elders) per 1000 population, a lower ratio of land conflict cases per 1000 households, and a lower ratio of household members with drug abuse per 1000 households.
Doun Penh was stronger in maintaining the lowest ratio of households living on public land (informal/illegal settlements) per 1000 households.
Kamboul was stronger in maintaining the lower ratio of land conflict cases per 1000 households, a lower ratio of households living on public land (informal/illegal settlements) per 1000 households, and a lower ratio of household members with drug abuse per 1000 households.
3.6. Sanitation Section
The results of the urban social sustainability index application to assess the 14 capital districts of Phnom Penh at the ‘Sanitation’ section showed that the strongest sanitation sustainability district was Boeng Keng Kang (1.2585), followed by Prampir Makara (1.2557) and Chamkarmon (1.2506), as shown in Figure 10a.
Boeng Keng Kang was the strongest sanitation sustainability district, compared to others, because this district had maintained a higher ratio of primary, secondary, and high schools that have installed proper toilets per one hundred students, and a higher percentage of households that have installed proper toilets as shown in Figure 10b.
Prampir Makara was a stronger sanitation sustainability district after Boeng Keng Kang because this district had maintained the lowest percentage of households that have been affected by environmental pollution, and a higher ratio of primary, secondary, and high schools that have installed proper toilets per one hundred students.
Chamkarmon was another stronger sanitation sustainability district after Boeng Keng Kang and Prampir Makara because this district had maintained a lower percentage of households that have been affected by environmental pollution, and a higher percentage of households that have installed proper toilets.
Doun Penh was the strongest district in maintaining the highest percentage of households that have installed proper toilets, and a higher percentage of households accessible to waste collection services.
Tuol Kouk and Chbar Ampov were stronger in maintaining the highest percentage of households accessible to waste collection services.
Prek Pnov was stronger in maintaining the higher ratio of primary, secondary, and high schools that have installed proper toilets per one hundred students.
3.7. Water Section
The results of the urban social sustainability index application to assess the 14 capital districts of Phnom Penh at the ‘Water’ section showed that the strongest clean water sustainability district was Doun Penh (1.6919), followed by Prek Pnov (1.6191) and Tuol Kouk (1.4789), as shown in Figure 11a.
Doun Penh was the strongest clean water sustainability district, compared to others, because this district had maintained the highest percentage of households with potable water drinking and consuming habits, a higher percentage of primary, secondary, and high schools with potable water access to use/drink, and a higher percentage of households with potable water access to use/drink, as shown in Figure 11b.
Prek Pnov was the stronger clean water sustainability district after Doun Penh because this district had maintained the highest percentage of primary, secondary, and high schools with potable water access to use/drink, the highest percentage of households with potable water access to use/drink, and a higher percentage of households with potable water drinking and consuming habits.
Tuol Kouk was another stronger clean water sustainability district after Doun Penh and Prek Pnov because this district had maintained a higher percentage of households with potable water drinking and consuming habits, and the highest percentage of households with potable water access to use/drink.
Russey Keo, Mean Chey, and Pou Senchey were the strongest districts as they had the highest percentage of households located close to water sources (less than 150 m).
Chamkarmon, Prampir Makara, Chroy Changvar, and Boeng Keng Kang were stronger in maintaining the highest percentage of households and primary, secondary, and high schools with potable water access to use/drink.
3.8. Safety Section
The results of the urban social sustainability index application to assess the 14 capital districts of Phnom Penh at the ‘Safety’ section showed that the strongest district for urban safety was Mean Chey (1.8914), followed by Chamkarmon (1.8159) and Prampir Makara (1.7726), as shown in Figure 12a.
Mean Chey was the strongest district for urban safety, compared to other districts, because this district had maintained the lowest ratio of criminal cases per 100,000 population, the lowest ratio of households affected by floods per 1000 households, and the lowest ratio of deaths by diseases, such as malaria, dengue fevers, and tuberculosis, per 100,000 population, as shown in Figure 12b.
Chamkarmon was the stronger district for urban safety after Mean Chey because this district had maintained the lowest ratio of criminal cases per 100,000 population, the lowest ratio of households affected by floods per 1000 households, and the lowest ratio of deaths by traffic accidents per 100,000 population.
Prampir Makara was another stronger district for urban safety after Mean Chey and Chamkarmon because this district had maintained the lowest ratio of criminal cases per 100,000 population, and a lower ratio of deaths by traffic accidents per 100,000 population.
Tuol Kouk, Sen Sok, Prek Pnov, and Boeng Keng Kang were stronger in maintaining the lowest ratio of households affected by floods per 1000 households.
Pou Senchey and Chroy Changvar were stronger in maintaining the lowest ratio of criminal cases per 100,000 population.
Doun Penh was stronger in maintaining the lowest ratio of deaths by traffic accidents per 100,000 population.
3.9. Comparative Urban Assessment Results of 14 Districts by Categories
Urban income was assessed through the following indicators: employees in both production and services (Careers), skilled populations (Training), income impacts on housing and settlements (Housing), and women’s incomes of both main and secondary nonagricultural jobs (W-jobs). The most sustainable khan for urban income was Chamkarmon (1.9892) whereas the last rank was Prek Pnov (0.4077).
Urban gender was assessed through the following indicators: female students have studied until high-school or university levels (Students), female teachers have taught at primary or secondary schools (Teachers), female technical trained or skilled workers in production and services (T-workers), and female council members at commune or district levels that have roles in making decision (M-decision). The most sustainable khan for gender-inclusive was Doun Penh (1.2891) whereas the last rank was Kamboul (0.5203).
Urban welfare was assessed through the following indicators: family violence (F-violence), sufficiency and closeness of healthcare clinics or pharmacy within a district (Healthcare), children have joined childcare or kindergarten programs (Childcare), and survivals of newborns to under-five babies (Newborn). The most sustainable khan for urban welfare was Boeng Keng Kang (1.5254) whereas the last rank was Prek Pnov (0.3228). The comparative assessment results of all khans by categories are shown in Figure 13.
Urban education was assessed through the following indicators: enrolled primary education aged 6-11 (Primary), enrolled secondary education aged 12-14 (Secondary), youth literacy aged 15-24 (Y-literacy), and adults and middle-aged group literacy aged 25-45 (A-literacy). The most sustainable khan for urban education was Chamkarmon (1.9307) whereas the last rank was Sen Sok (0.3495).
Urban vulnerability was assessed through the following indicators: vulnerable groups of orphans, homeless, disables, and elder populations (V-groups), informal settlements on the public land (I-settlements), land conflicts (L-conflicts), and households who have members with drug abuse (D-abuse). The most sustain-able khan (low vulnerability) was Prampir Makara (1.2233) whereas the last rank was Sen Sok (0.4626).
Urban sanitation was assessed through the following indicators: household waste collection (Wastes), households affected by polluted environments (Polluted), schools have installed proper toilets (School) and households have installed proper toilets (Home). The most sustainable khan for urban sanitation was Boeng Keng Kang (1.2585) whereas the last rank was Kamboul (0.3430).
Urban clean water was assessed through the following indicators: accessible and close to water sources (Access), schools that have potable water to use/drink (S-water), households that have potable water to use/drink (H-water), and potable water drinking/consuming habits (Habit). The most sustainable khan for urban clean water was Doun Penh (1.6919) whereas the last rank was Mean Chey (0.5022).
Urban safety and security were assessed through the following indicators: criminal cases (Crimes), households that have been affected by floods (Floods), the ratio of the deaths by diseases (Diseases), and the ratio of the deaths by traffic accidents (Accidents). The most sustainable khan for urban safety was Mean Chey (1.8914) whereas the last rank was Chbar Ampov (0.4725).
The top-five khans were Chamkarmon (10.7896), Boeng Keng Kang (10.6996), Doun Penh (10.6766), Prampir Makara (10.6553), and Tuol Kouk (9.2817), respectively, whereas the fourteenth (last) rank was Dangkao (5.1188). Chamkarmon got the first rank because this khan obtained the first rank for two categories (Income and Education) that these categories had high relative weights. More than that, this khan also obtained the second rank for two categories (Safety and Resilience), as well as the third rank for one category (Sanitation). Boeng Keng Kang got the second rank because this khan obtained the first rank for two categories (Welfare and Sanitation) that these categories had upper-middle relative weights. Furthermore, this khan also obtained the second rank for one category (Education), as well as the third rank for two categories (Income and Gender). Doun Penh got the third rank because this khan obtained the first rank for two categories (Gender-inclusive and Clean Water) that one of these categories had the upper-middle relative weight. Moreover, this khan also obtained the second rank for one category (Income), as well as the third rank for one category (Welfare). All urban social sustainability ranks of 14 districts (khans) are shown in Figure 14.
3.10. Strong and Weak Points of Each District by Urban Social Sustainability Indicators
By standardizing variables (indicators’ values) to comparatively assess urban social sustainability of 14 capital khans (14 districts) of the Cambodian capital, Phnom Penh, this research obtained a standard to measure the strong and weak points of each capital khan by each urban social sustainability assessment indicator. According to the first and second clean city contests conducted by the National Committee for Clean City Assessment [64], many capital districts have been awarded Clean City Romduol III (1st rank) and Romduol II (2nd rank). Especially, each of these capital districts has its own strong level or strong point by each indicator. Therefore, developing a standard based on their good levels or strong points of indicators would be much appropriate to assess other districts and/or its peers to reveal the potential for urban social sustainability improvement in the Cambodia context and the preference of Cambodian people.
Therefore, this research obtained the standard level (orange color), which was significant to find out the strong and weak points ‘current level’ (blue color) of each district by each assessment indicator. Based on the consolidated assessment results of urban social sustainability indicators, this research also revealed urban improvement potential ‘weakness’ as demonstrated in the following pages’ paragraphs and figures.
Towards achieving urban social sustainability of each district, particularly the national development priorities, the New Urban Agenda, SDG11, and other SDGs that incorporated human wellbeing, such as SDGs1-6, SDG8, SDG10, and SDG12, the indicators that are lower than the standard need to be improved. This improvement can be made based on the (strong) districts’ achievements and/or best practices.
According to Figure 15, in the case of Chamkarmon, improvement potentials for urban social sustainability indicators were on eight (8) indicators, especially on clean water and gender-inclusive categories. This research strongly suggests improving the following indicators: clean water drinking/consuming habits, accessibility and closeness to water sources, female technical or skilled workers in production and services, and female council members at commune or district level that have roles in making decision. According to this figure again, in the case of Doun Penh, improvement potentials for urban social sustainability indicators were on seven (7) indicators, especially on the vulnerability category. This research strongly suggests improving the following indicators: vulnerable groups of orphans, homeless, disables, and elder populations, land conflicts, and households that have members with drug abuse.
According to Figure 16, in the case of Prampir Makara, improvement potentials for urban social sustainability indicators were on five (5) indicators, especially on the income category. This research strongly suggests improving the following indicators: income impacts on housing conditions, and women’s income of both main and secondary nonagricultural jobs.
According to this figure again, in the case of Tuol Kouk, improvement potentials for urban social sustainability indicators were on twelve (12) indicators, especially on gender-inclusive and sanitation categories. This research strongly suggests improving the following indicators: female students has studied until high-school/university level, female teachers has taught at primary/secondary schools, households who have been affected by polluted environments, and schools has installed proper toilets.
According to Figure 17, in the case of Dangkao, improvement potentials for urban social sustainability indicators were on twenty-four (24) indicators, especially all clean water indicators and three indicators for each of other categories, except the vulnerability category (two indicators). This research strongly suggests improving the following indicators: clean water indicators (potable water drinking/consuming habits, accessibility or closeness to water sources, schools that have potable water to use/drink, and households that have potable water to use/drink); and the income indicators (employees in both production and services, skilled populations, and income impacts on housing conditions).
According to this figure again, in the case of Mean Chey, improvement potentials for urban social sustainability indicators were on twenty-one (21) indicators, especially all indicators of education and sanitation categories, as well as three indicators for each of clean water and vulnerability categories. This research strongly suggests improving education indicators (primary education, secondary education, youth literacy, and adults and middle-aged group literacy); and sanitation indicators (household waste collection, households who have been affected by polluted environments, schools have installed proper toilets, and households have installed proper toilets.
According to Figure 18, in the case of Russey Keo, improvement potentials for urban social sustainability indicators were on eighteen (18) indicators, especially on income, welfare, vulnerability, and safety categories. This research strongly suggests improving income indicators (employees in both production and services, skilled populations, and income impacts on housing conditions); safety indicators (criminal cases, households affected by floods, and deaths by diseases); and welfare indicators (sufficiency of clinics/ pharmacy, children joined childcare/kindergarten programs, and survivals of newborns to under-five baby).
According to this figure again, in the case of Sen Sok, improvement potentials for urban social sustainability indicators were on twenty-one (21) indicators, especially on all indicators of education and three indicators for each of gender-inclusive, vulnerability, sanitation, and clean water categories. This research strongly suggests improving the following education indicators (primary education, secondary education, youth literacy, and adults and middle-aged group literacy).
According to Figure 19, in the case of Pou Senchey, improvement potentials for urban social sustainability indicators were on fourteen (14) indicators, especially on gender-inclusive and income indicators. This research strongly suggests improving the following indicators: gender-inclusive indicators (female students have studied until high school/university level, female teachers taught at primary/secondary schools, and female council members at commune/district level with having roles in making decision); and income indicators (employees in both production and services, and skilled populations).
According to this figure again, in the case of Chroy Changvar, improvement potentials for urban social sustainability indicators were on seventeen (17) indicators, especially on welfare indicators. This research strongly suggests improving the following indicators: family violence, sufficiency/closeness of healthcare clinics and pharmacy within a district or khan, children have joined childcare/kindergarten programs, and survivals of newborns to under-five babies.
According to Figure 20, in the case of Prek Pnov, improvement potentials for urban social sustainability indicators were on twenty-two (22) indicators, especially on income, gender, welfare, education, vulnerability, sanitation, and safety categories. This research highly suggests improving the following income and welfare indicators (employees in both production and services, skilled populations, and income impacts on housing conditions, family violence, sufficiency/closeness of healthcare clinics and pharmacy within a district or khan, and children have joined childcare/kindergarten programs).
According to this figure again, in the case of Chbar Ampov, improvement potentials for urban social sustainability indicators were on twenty-four (24) indicators, especially on income, education, vulnerability, and safety categories. This research strongly suggests improving the following high-weight income and safety indicators (employees in both production and services, skilled populations, income impacts on housing conditions, women’s income of both main and secondary nonagricultural jobs, criminal cases, households affected by floods, deaths by diseases, and deaths by traffic accidents).
According to Figure 21, in the case of Boeng Keng Kang, improvement potentials for urban social sustainability indicators were on seven (7) indicators, especially on income and gender-inclusive categories. This research strongly suggests improving the following indicators: women’s income of both main and secondary jobs, accessibility to water sources/reservoirs, and deaths by traffic accidents).
According to this figure again, in the case of Kamboul, improvement potentials for urban social sustainability indicators were on twenty (20) indicators, especially the vulnerability category (all indicators), as well as gender-inclusive, sanitation, and safety categories (three indicators for each). This research strongly suggests improving the following vulnerability indicators (vulnerable groups of orphans, homeless, disables, and elder populations, informal/illegal settlements on public land, land conflicts, and households that have members with drug abuse); and the high-weight safety indicators (criminal cases, households have been affected by floods, and deaths by traffic accidents).
4. Conclusions
This research developed an urban social sustainability index based on national development priorities demonstrated in the Pentagonal Strategy, particularly Pentagon 4—resilient, sustainable, and inclusive development and its Priority 4—strengthening urban management, focusing on existing urban areas in the capital city and provinces, to ensure safety, beauty, good environment, and well-being of people, as well as socio-economic efficiency; SDG11 (make cities inclusive, safe, resilient, and sustainable), New Urban Agenda (providing basic services and ensuring that all citizens have access to equal opportunities), and other SDGs that incorporated human wellbeing, such as SDGs1-6, SDG8, SDG10, and SDG12. By standardizing variables (weighted indicators’ values) to comparatively assess urban social sustainability of 14 khans (14 districts) of the Cambodian capital, Phnom Penh, this research obtained a standard to measure the strong and weak points of each capital district by each urban social sustainability assessment indicator.
The results showed that Chamkarmon was found to be the strongest district in social sustainability, followed by Boeng Keng Kang and Doun Penh, whereas Prampir Makara and Tuol Kouk were ranked fourth and fifth, respectively. The strongest district for urban income was Chamkarmon whereas Prek Pnov was found to be the weakest. The strongest district for urban gender-inclusive was Doun Penh whereas Kamboul was found to be the weakest. The strongest district for urban welfare was Boeng Keng Kang whereas Prek Pnov was found to be the weakest. The strongest district for urban education, excluding vocational training, was Chamkarmon whereas Sen Sok was found to be the weakest. The strongest district for urban resilience, less vulnerable, was Prampir Makara whereas Sen Sok was found to be the weakest. The strongest district for urban sanitation was Boeng Keng Kang whereas Kamboul was found to be the weakest. The strongest district for urban clean water supply and consumption habit was Doun Penh whereas Mean Chey was found to be the weakest. The strongest district for urban safety was Mean Chey whereas Chbar Ampov was the weakest.
The findings showed that Chamkarmon got the first rank because this district obtained the first rank for income and education, that these categories had high relative weights. Furthermore, Chamkarmon obtained the second rank for safety and resilience categories as well. This district also obtained the third rank for sanitation. Subsequently, Boeng Keng Kang got the second rank because this district obtained the first rank for welfare and sanitation, that these categories had upper-middle relative weights. Moreover, Boeng Keng Kang obtained the second rank for education as well. This district also obtained the third rank for income and gender-inclusive, excluding vocational training. Consequently, Doun Penh got the third rank because this district obtained the first rank for clean water and gender-inclusive, but only one of these two categories had an upper-middle relative weight. This district also obtained the second rank for income and the third rank for welfare.
This research considered technical and vocational trainings as skilled labor-force indicators and included them in the income category. Therefore, the education and gender-inclusive indicators in this research did not cover technical and vocational training indicators. In this case, the weighted and/or ranked assessment results might be slightly different if these indicators were included in education and gender-inclusive categories, not in the income category. Furthermore, this research considered the income had impacts on housing conditions, which mean if households were living in poor quality houses, ex. palm-leaf or less-than-20-zinc houses, their income would be low. However, not all households with good incomes spent their money on house upgrading or development, but this ratio was very low and would not impact much on the results.
In this regard, future research exploring these aspects in detail would be more interesting and further improving the understanding of income-spending behaviors of Phnom Penh residents, particularly in each of the 14 districts. In addition, gender-inclusive in decision making in this research was limited to the management levels of public administration. Therefore, this gender-inclusive assessment results could not reflect the management levels of non-governmental organizations, private companies, development partners, and/or civil societies in each district. The future research taking these aspects into account could contribute to a wider understanding of gender-inclusive in decision making across those organizations.
Funding
This research received no external funding.
Acknowledgments
The author expresses his gratitude to the Asia Research Center and CHEY Institute for Advanced Studies for a small grant to support this research.
Conflicts of Interest
The author declares no conflict of interest.
References
- United Nations. Report of the United Nations Conference on Sustainable Development; A/CONF.216/16; United Nations: New York, NY, USA, 2012. [Google Scholar]
- Chan, P. A Study on the Mechanism of Green Economic Development in Cambodia. Master’s Thesis, the Build Bright University, Phnom Penh, Cambodia, 2016. [Google Scholar]
- Angel, S.; Parent, J.; Civco, D.L.; Blei, A.M. The Atlas of Urban Expansion; Lincoln Institute of Land Policy: Cambridge, MA, USA, 2012. [Google Scholar]
- United Nations. 68% of the World Population Projected to Live in Urban Areas by 2050, Says UN, 2018. Available online: https://www.un.org/development/desa/en/news/population/2018-revision-of-world-urbanization-prospects.html (accessed on 2 July 2024).
- Chan, P. Child-Friendly Urban Development: Smile Village Community Development Initiative in Phnom Penh. World 2021, 2, 505–520. [Google Scholar] [CrossRef]
- Richard, F. Does Urbanization Drive Southeast Asia’s Development? Available online: https://www.citylab.com/life/2017/01/southeast-asia-martin-prosperity-institute/511952/ (accessed on 2 July 2024).
- Janoušková, S.; Hák, T.; Moldan, B. Global SDGs Assessments: Helping or Confusing Indicators? Sustainability 2018, 10, 1540. [Google Scholar] [CrossRef]
- Chan, P. Sustainable City Assessment Indicators for Cambodia: Relevance, Development and Application; Lambert Academic Publishing: Chisinau, Moldova; European Union, 2019. [Google Scholar]
- UN-Habitat, *!!! REPLACE !!!*. SDG Goal 11 Monitoring Framework, 2016. Available online: http://unhabitat.org/sdg-goal-11-monitoring-framework/ (accessed on 10 August 2024).
- United Nations. Transforming Our World: The 2030 Agenda for Sustainable Development; Resolution adopted by the General Assembly; United Nations: New York, NY, USA, 2015. [Google Scholar]
- Chan, P.; Gulbaram, K.; Schuetze, T. Assessing Urban Sustainability and the Potential to Improve the Quality of Education and Gender Equality in Phnom Penh, Cambodia. Sustainability 2023, 15, 8828. [Google Scholar] [CrossRef]
- UN-Habitat. The New Urban Agenda Illustrated. Available online: https://unhabitat.org/the-new-urban-agenda-illustrated (accessed on 22 July 2024).
- United Nations. New Urban Agenda. Habitat III in Quito, Ecuador, on 20 October 2016. Available online: https://habitat3.org/wp-content/uploads/NUA-English.pdf (accessed on 10 August 2024).
- United Nations Department of Economic and Social Affairs. Sustainable Development Goal 4 (SDG 4). Available online: https://sdgs.un.org/goals/goal4 (accessed on 10 August 2024).
- United Nations Department of Economic and Social Affairs. Sustainable Development Goal 5 (SDG 5). Available online: https://sdgs.un.org/goals/goal5 (accessed on 10 August 2024).
- Kalantari, K.; Fami, H. S.; Asadi, A.; Mohammadi, H. M. Investigating factors affecting environmental behavior of urban residents: A case study in Tehran City-Iran. American Journal of Environmental Sciences 2007, 3, 67–74. [Google Scholar] [CrossRef]
- Kim, J.W.; Jeon, E.C; Chung, S.O. Promoting Public Participation and Environmental Education in the Republic of Korea. Journal of Environmental Studies 1991, 29, 82–97. [Google Scholar]
- Chan, P. Influence of Urban Child-Friendly Initiative on Environmental Behavior; The Center for Khmer Studies: Phnom Penh, Cambodia, 2022. [Google Scholar]
- OECD. Gender and the Environment: Building Evidence and Policies to Achieve the SDGs. Available online: https://www.oecd-ilibrary.org/sites/db5d855d-en/index.html?itemId=/content/component/db5d855d-en (accessed on 22 July 2024).
- United Nations Children’s Fund. Building Child Friendly Cities: A Framework for Action; UNICEF Innocenti Research Centre’s International Secretariat for Child Friendly Cities: Florence, Italy, 2004. [Google Scholar]
- Chan, P. Child-Friendly Cities and Communities: 10 Initiatives from 10 Countries; Scholars’ Press: Chisinau, Republic of Moldova, 2020. [Google Scholar]
- United Nations Children’s Fund. Child Friendly Cities and Communities Handbook. 2018. Available online: https://s25924.pcdn.co/wp-content/uploads/2018/04/unicef-child-friendly-cities-and-communities-handbook.pdf (accessed on 18 June 2024).
- Wilks, J. Child-friendly cities: A place for active citizenship in geographical and environmental education. Int. Res. Geogr. Environ. Educ. 2010, 19, 25–38. [Google Scholar] [CrossRef]
- Visscher, S.D.; Bie, M.B.-D. Recognizing Urban Public Space as a Co-Educator: Children’s Socialization in Ghent. Int. J. Urban Reg. Res. 2008, 32, 604–616. [Google Scholar] [CrossRef]
- Nour, O.E.H.M. Building Child Friendly Cities in the MENA region. Int. Rev. Educ. 2013, 59, 489–504. [Google Scholar] [CrossRef]
- Freeman, C.; Tranter, P. Children and Their Urban Environment: Changing Worlds; Earthscan LLC: Washington, DC, USA, 2011. [Google Scholar]
- Chan, P. Cambodian Green Economy Transition: Background, Progress, and SWOT Analysis. World 2024, 5, 413–452. [Google Scholar] [CrossRef]
- Royal Government of Cambodia. National Strategic Development Plan (NSDP) 2019-2023; Ministry of Planning: Phnom Penh, Cambodia, 2019. [Google Scholar]
- Chan, P. Cambodian Green Economy; Lambert Academic Publishing: Chisinau, Moldova, European Union, 2019. [Google Scholar]
- World Bank. Cambodia is now a lower-middle income economy: What does this mean? The World Bank Group: New York, USA, 2015. [Google Scholar]
- Asian Development Bank. Here Comes Cambodia: Asia’s New Tiger Economy; Asian Development Bank (ADB) Headquarters: Manila, the Philippines, 2016. [Google Scholar]
- Royal Government of Cambodia. Rectangular Strategy Phase IV for Growth, Employment, Equity and Efficiency: Building the Foundation toward Realizing the Cambodia Vision 2050; Royal Government of Cambodia: Phnom Penh, Cambodia, 2018. [Google Scholar]
- United Nations Capital Development Fund. CSDG Financing in Cambodia - Synthesis Report; United Nations Capital Development Fund (UNCDF): New York, USA, 2021. [Google Scholar]
- United Nations Capital Development Fund; Frankfurt School of Finance; Management; and Ministry of Economy and Finance. Development of Cambodia SDG-based INFF Financing Strategy; Frankfurt School of Finance & Management: Frankfurt, Germany, 2022. [Google Scholar]
- Royal Government of Cambodia. Pentagonal Strategy for Growth, Employment, Equity, Efficiency, and Sustainability; The Office of the Council of Ministers: Phnom Penh, Cambodia, 2023. [Google Scholar]
- Royal Government of Cambodia. Introducing the “Pentagonal Strategy–Phase I” and the “Key Measures of the Royal Government for the Seventh Legislature of the National Assembly” by Samdech Hun Manet, Prime Minister of Cambodia at the First Plenary Session of the Council of Ministers; Peace Palace: Phnom Penh, Cambodia, 2023. [Google Scholar]
- Chan, P.; Khoeng, K.; Ung, H.K.; Tang, T.; Eung, K.; Uth, S.; Meng, S.; Sun, L.; Em, S.; Toum, H.; et al. Sustainable Building Plan-Design, Construction, Performance, and Renovation Criteria. Preprints 2021, 3, 2021080295. [Google Scholar] [CrossRef]
- Baker, J.L.; Kikutake, N.; Lin, S.X.; Johnson, E.C.; Yin, S.; Ou, N. Urban Development in Phnom Penh; The World Bank Group: Washington, DC, USA, 2017. [Google Scholar]
- Chan, P. Validation of Sustainable Building Planning and Design Criteria for Cambodia: A Delphi Study. Preprints 2022, 3. [Google Scholar] [CrossRef]
- Chan, P.; Lee, M.-H. Developing Sustainable City Indicators for Cambodia through Delphi Processes of Panel Surveys. Sustainability 2019, 11, 3166. [Google Scholar] [CrossRef]
- Chan, P; Lee, M-H. Prioritizing Sustainable City Indicators for Cambodia. Urban Science 2019, 3(4), 104. [Google Scholar] [CrossRef]
- Chan, P. Assessing Sustainability of the Capital and Emerging Secondary Cities of Cambodia Based on the 2018 Commune Database. Data 2020, 5, 79. [Google Scholar] [CrossRef]
- Chan, P. Urban Quality Assessment of Cambodian Capital Khans: Focusing on Urban Education and Gender Equality; Chey Institute for Advanced Studies: Seoul, Republic of Korea, 2022. [Google Scholar]
- Chan, P. Understanding Green Economic Development in Cambodia. Proceedings of 10th Annual Macroeconomic Conference on “Climate Risks and Green Economy Transition”, Phnom Penh, Cambodia, 8 December 2023. [Google Scholar]
- United Nations Department of Economic and Social Affairs. Sustainable Development Goal 11. Available online: https://sdgs.un.org/goals/goal11 (accessed on 10 August 2024).
- Petrucci, A.L; Trasi, N. Involving SDG4 in achieving SDG11 through problem-solving and learning-by-doing practices towards the 2030 Agenda, 2021. Available online: https://www.g20-insights.org/policy_briefs/involving-higher-education-sdg4-in-achieving-sustainable-cities-and-communities-sdsg11/ (accessed on 22 July 2024).
- UN Department of Economic and Social Affairs: Sustainable Development. Available online: https://sdgs.un.org/goals (accessed on 22 July 2024).
- Phnom Penh Capital Department of Planning. Phnom Penh Capital Socio-Economic Data 2019. In Phnom Penh Capital Department of Planning; Ministry of Planning: Phnom Penh, Cambodia, 2019. [Google Scholar]
- Saaty, T. L. A Scaling Method for Priorities in Hierarchical Structures. J. Math. Psycho 1977, 15, 234–281. [Google Scholar] [CrossRef]
- Chan, P. Delphi and AHP Techniques: A Method to Develop a Priority-based Index for Urban Sustainability Assessment in Cambodia; Scholars’ Press: Chisinau, Moldova, 2020. [Google Scholar]
- Saaty, T. L. The Analytical Hierarchy Process—What it is and how it isused. Math. Modell. 1987, 9, 161–176. [Google Scholar] [CrossRef]
- Soldatou, N.; Chatzianastasiadou, P.; Vagiona, D.G. Assessment of Carbon-Related Scenarios for Tourism Development in the Island of Lefkada in Greece. Tour. Hosp. 2022, 3, 345–361. [Google Scholar] [CrossRef]
- Lee, D.; Lee, D.; Lee, M.; Kim, M.; Kim, T. Analytic Hierarchy Process-Based Construction Material Selection for Performance Improvement of Building Construction: The Case of a Concrete System Form. Materials 2020, 13, 1738. [Google Scholar] [CrossRef] [PubMed]
- Han, S.M. A Study on the Development and Application of Evaluation Indicators for Sustainable Urban Development and Management. Ph.D. Thesis, Hanyang University, Seoul, Korea, August 2019. [Google Scholar]
- Lee, D.J. Evaluation of Urban Growth Management in Metropolis of Korea. Ph.D. Thesis, Hanyang University, Seoul, Korea, February 2015. [Google Scholar]
- Chan, P. An Empirical Study on Data Validation Methods of Delphi and General Consensus. Data 2022, 7, 18. [Google Scholar] [CrossRef]
- When Do You Need to Standardize the Variables in a Regression Model? By Jim Frost. Available online: https://statisticsbyjim.com/regression/standardize-variables-regression/ (accessed on 17 December 2024).
- Linear regression with standardized variables by Marco Taboga, PhD. Available online: https://www.statlect.com/fund (accessed on 17 December 2024).
- Ward, A.W.; Murray-Ward, M. Assessment in the Classroom; Wadsworth: Belmont, the United State of America, 1999. [Google Scholar]
- Claude, L.; Svitlana, P.; Joshua, E. Using the Normal Distribution, 2016, A Revision Version on Introduction to Statistics by Claude, 2017. Available online: http://legacy.cnx.org/content/col11969/1.10.
- Chan, P. The Development and Prioritization of Consensus Sustainable City Indicators for Cambodia. Ph.D. Thesis, Hanyang University, Seoul, Korea, August 2020. [Google Scholar]
- Kreyszig, E. Advanced Engineering Mathematics, 4th ed.; John Wiley & Sons, Inc.: Hoboken, NJ, the United State of America, 1979. [Google Scholar]
- National Institute of Statistics (NIS). The General Population Census of the Kingdom of Cambodia, 2019; National Institute of Statistics, Ministry of Planning: Phnom Penh, Cambodia, 2019. [Google Scholar]
- The First and Second Clean City Contests; the National Committee for Clean City Assessment. Available online: https://www.cambodiacleancity.gov.kh/ (accessed on 25 October 2021).
- ASEAN Celebrates the 2nd ASEAN Environmentally Sustainable Cities Award. Available online: https://asean.org/asean-celebrates-the-2nd-asean-environmentally-sustainable-cities-award/ (accessed on 7 December 2025).
- Chan, P. How Cambodia has defined sustainable urban development: The influence of regional and global urban agendas on local practices; Workshop on Environmental Transformations and the Impact of Urbanization, Land Use Changes, and Migration on Cambodian Life: The University of Chicago Hong Kong, HK, China, May 2025. [Google Scholar]
- ILO. Cambodia: Employment and Environmental Sustainability—Fact Sheets 2019; ILO Regional Office for Asia and the Pacific: Geneva, Switzerland, 2019. [Google Scholar]
- World Bank. Cambodia—Achieving the Potential of Urbanization; World Bank Group: Washington, DC, USA, 2018. Available online: http://documents.worldbank.org/curated/en/935031540584687638 (accessed on 8 December 2025).
- UNDP. Cambodia’s Path to Sustainability: Accelerating National Priorities Through Climate Actions; UNDP: Phnom Penh, Cam-bodia; New York, NY, USA, 2025. [Google Scholar]
Figure 1.
Urban social sustainability assessment framework.
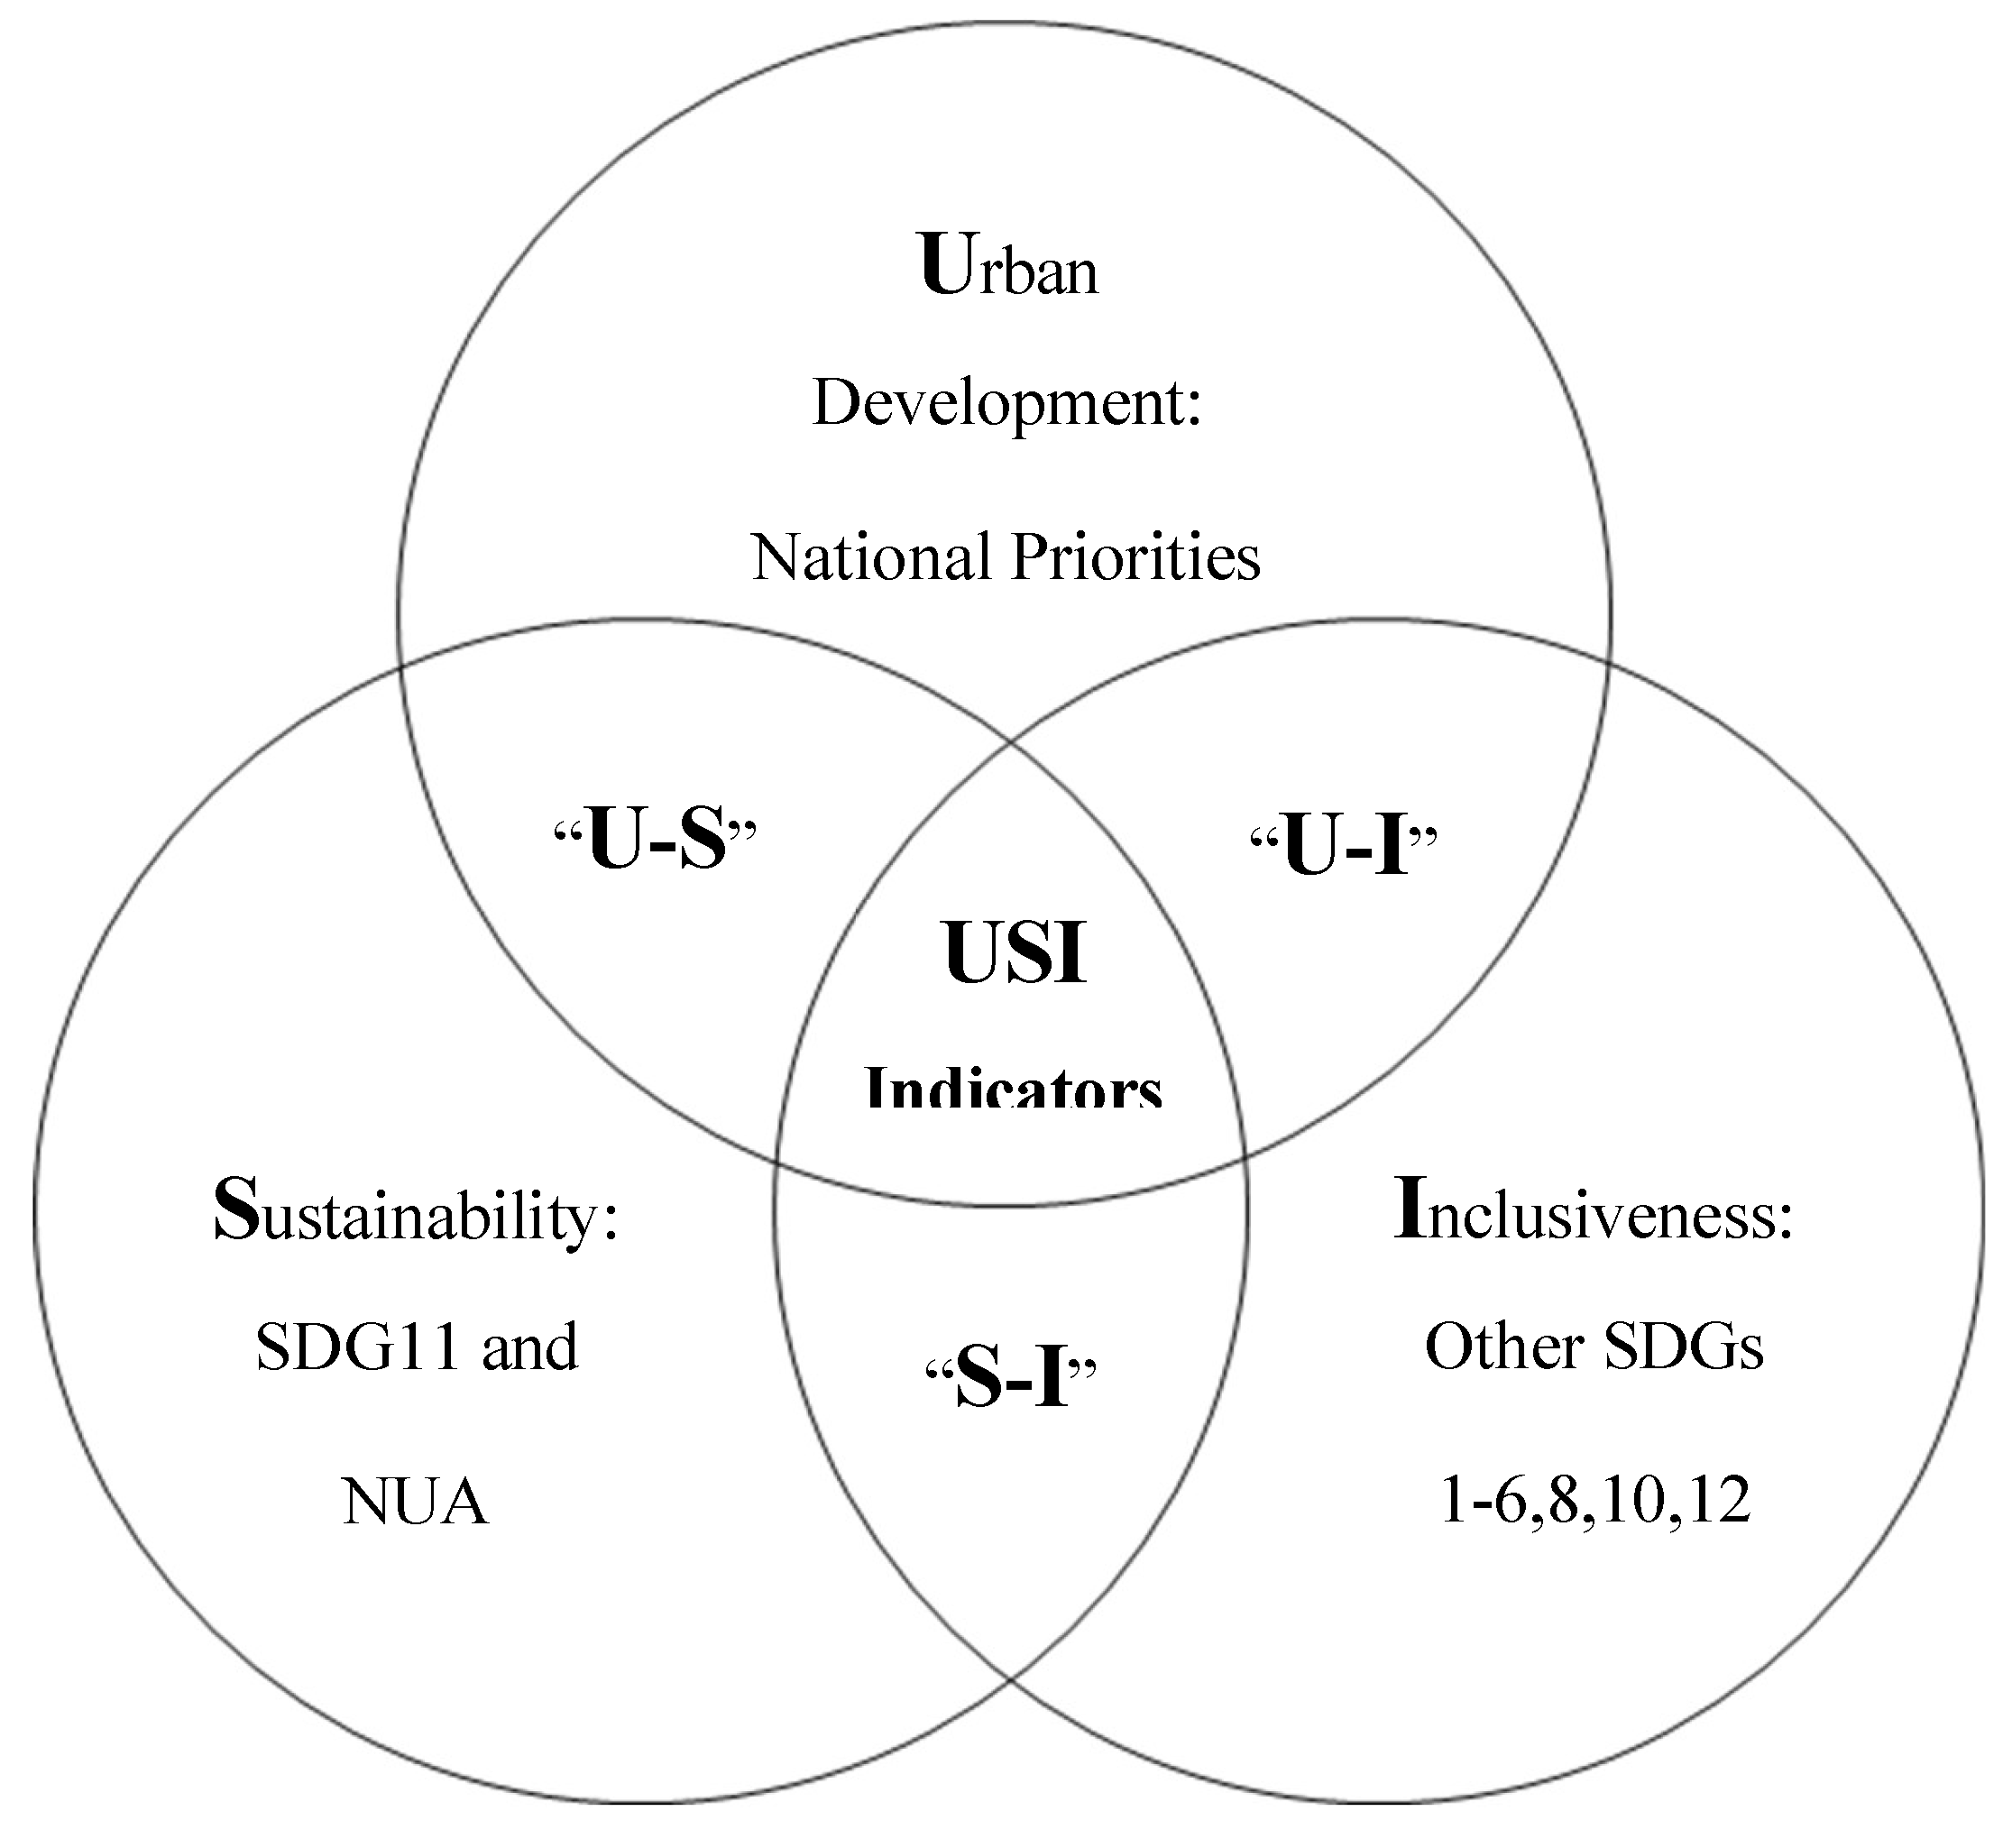
Figure 2.
AHP structured urban social sustainability index.
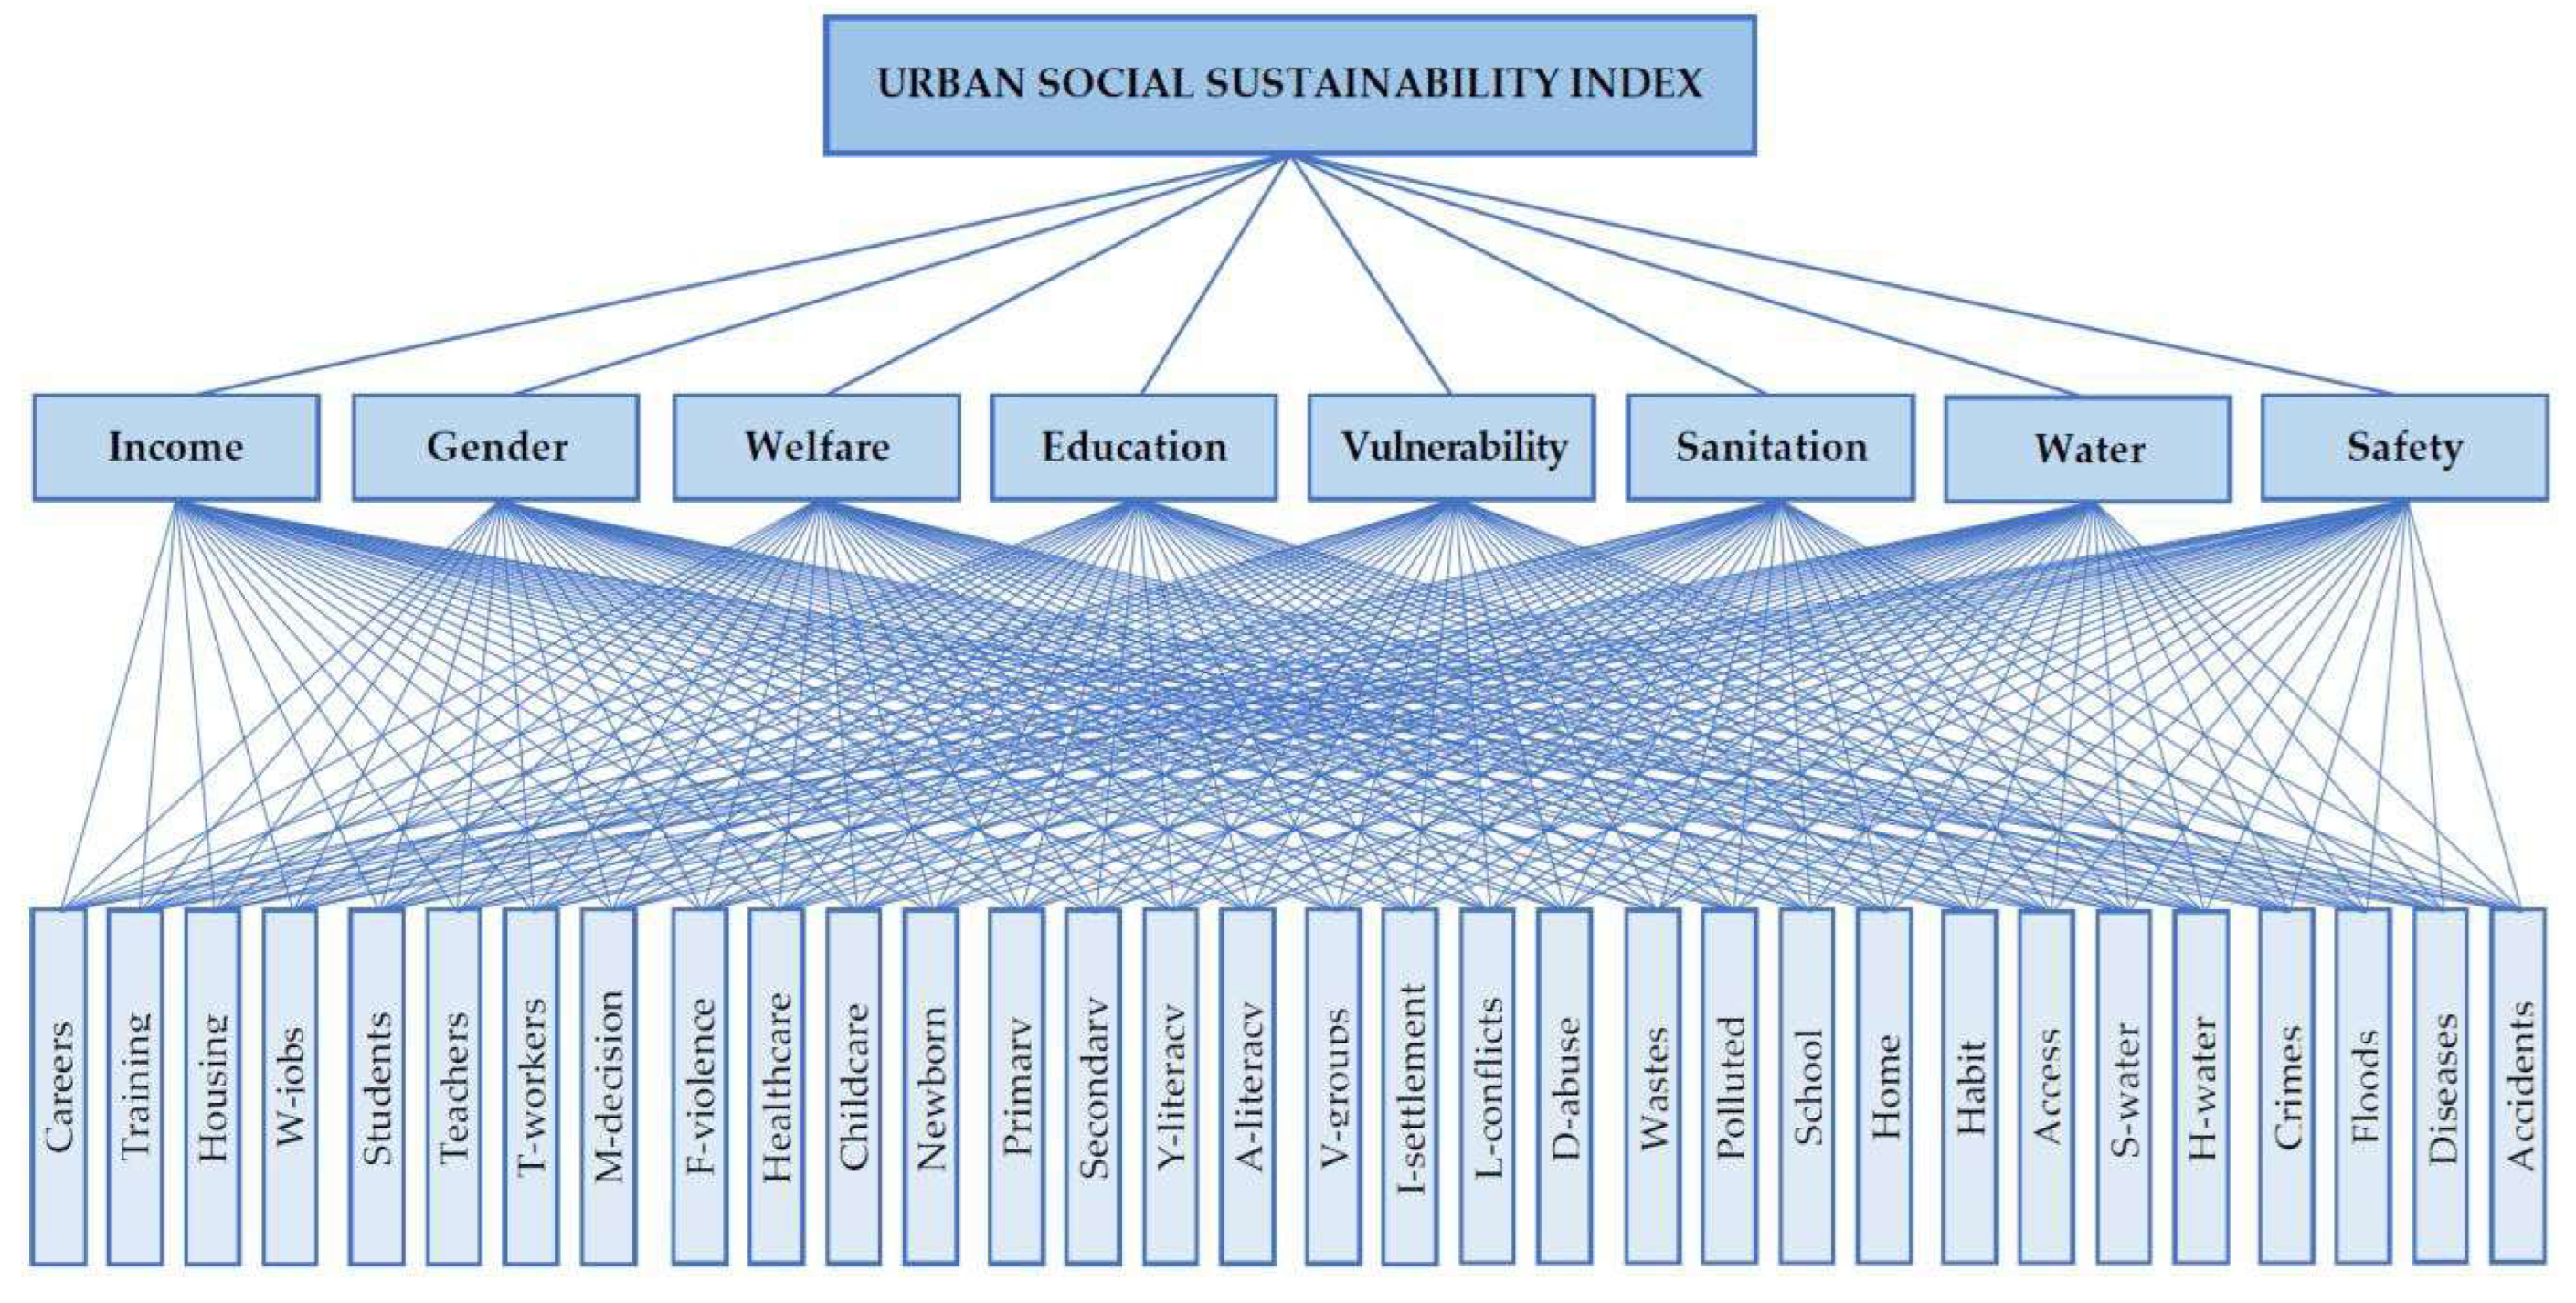
Figure 3.
Standardizing variable approach before comparison. Source: Chan 2020 [42], adapted from Ward and Murray and Claude et al. 2016 [59,60].
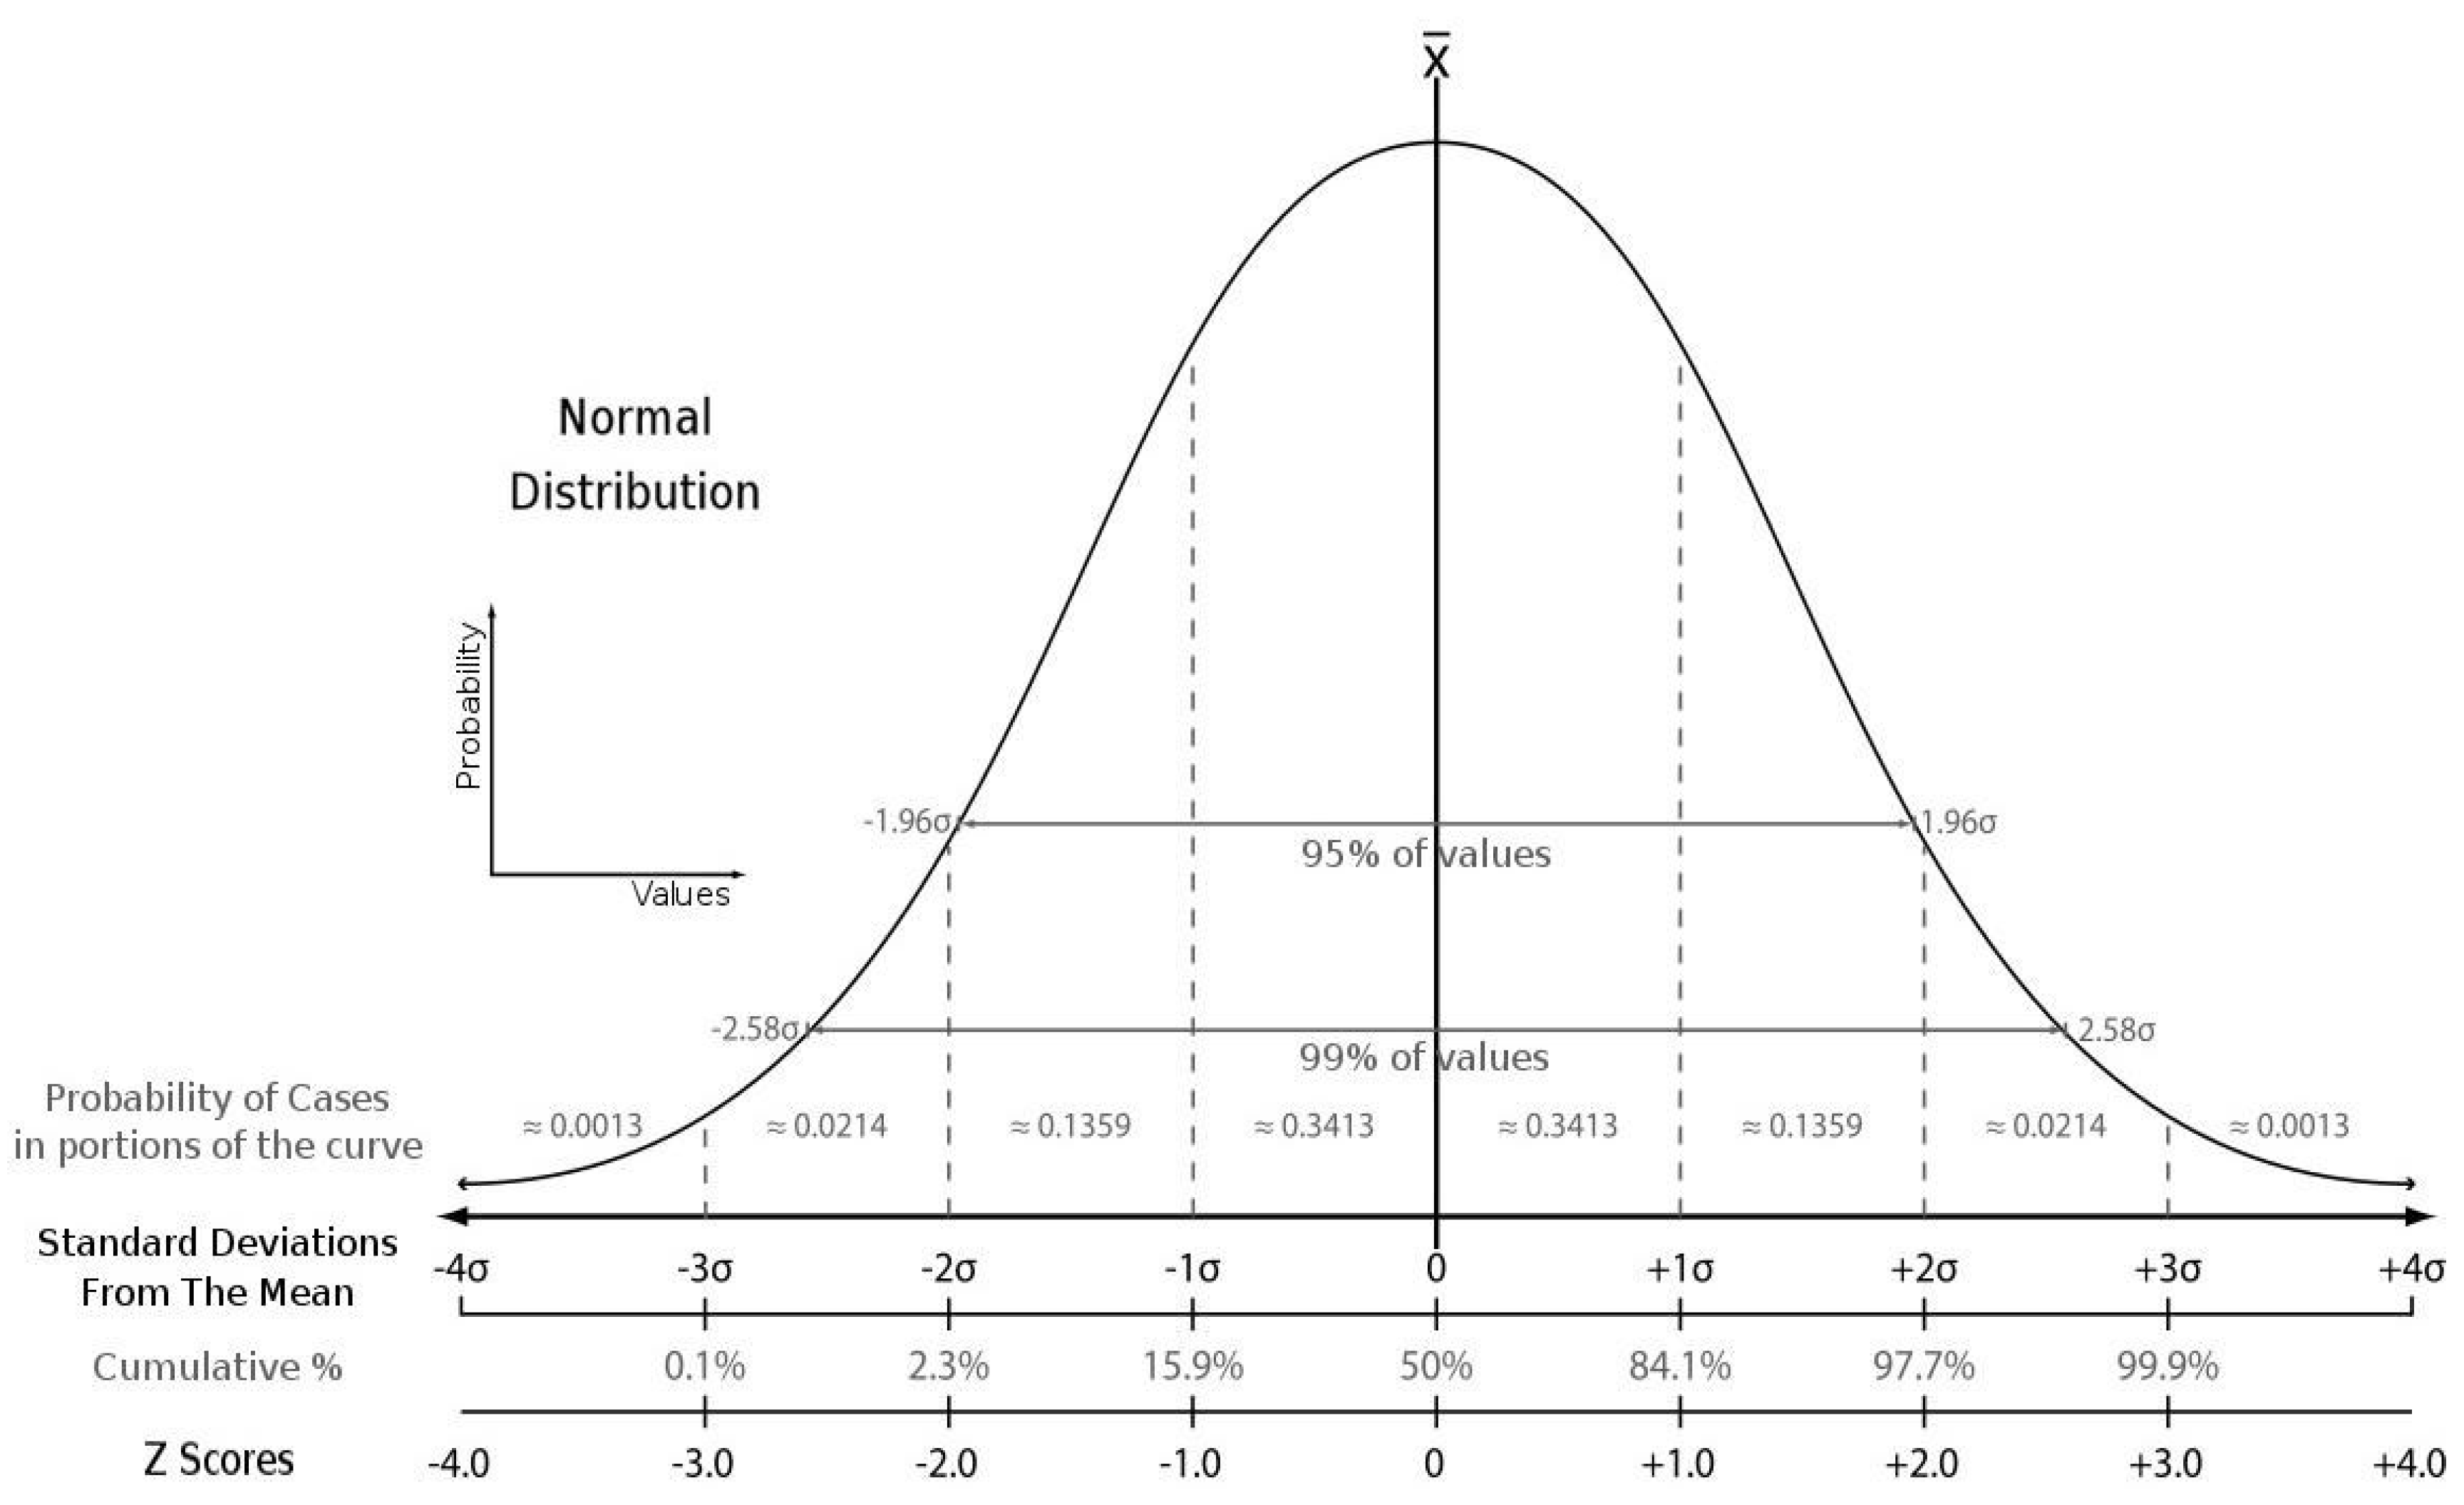
Figure 4.
Populations of 14 capital districts (khans) and their location on the Phnom Penh capital map. Source: Chan 2022 [43], adapted from Sovan Dara and capital socio-economic data [48].
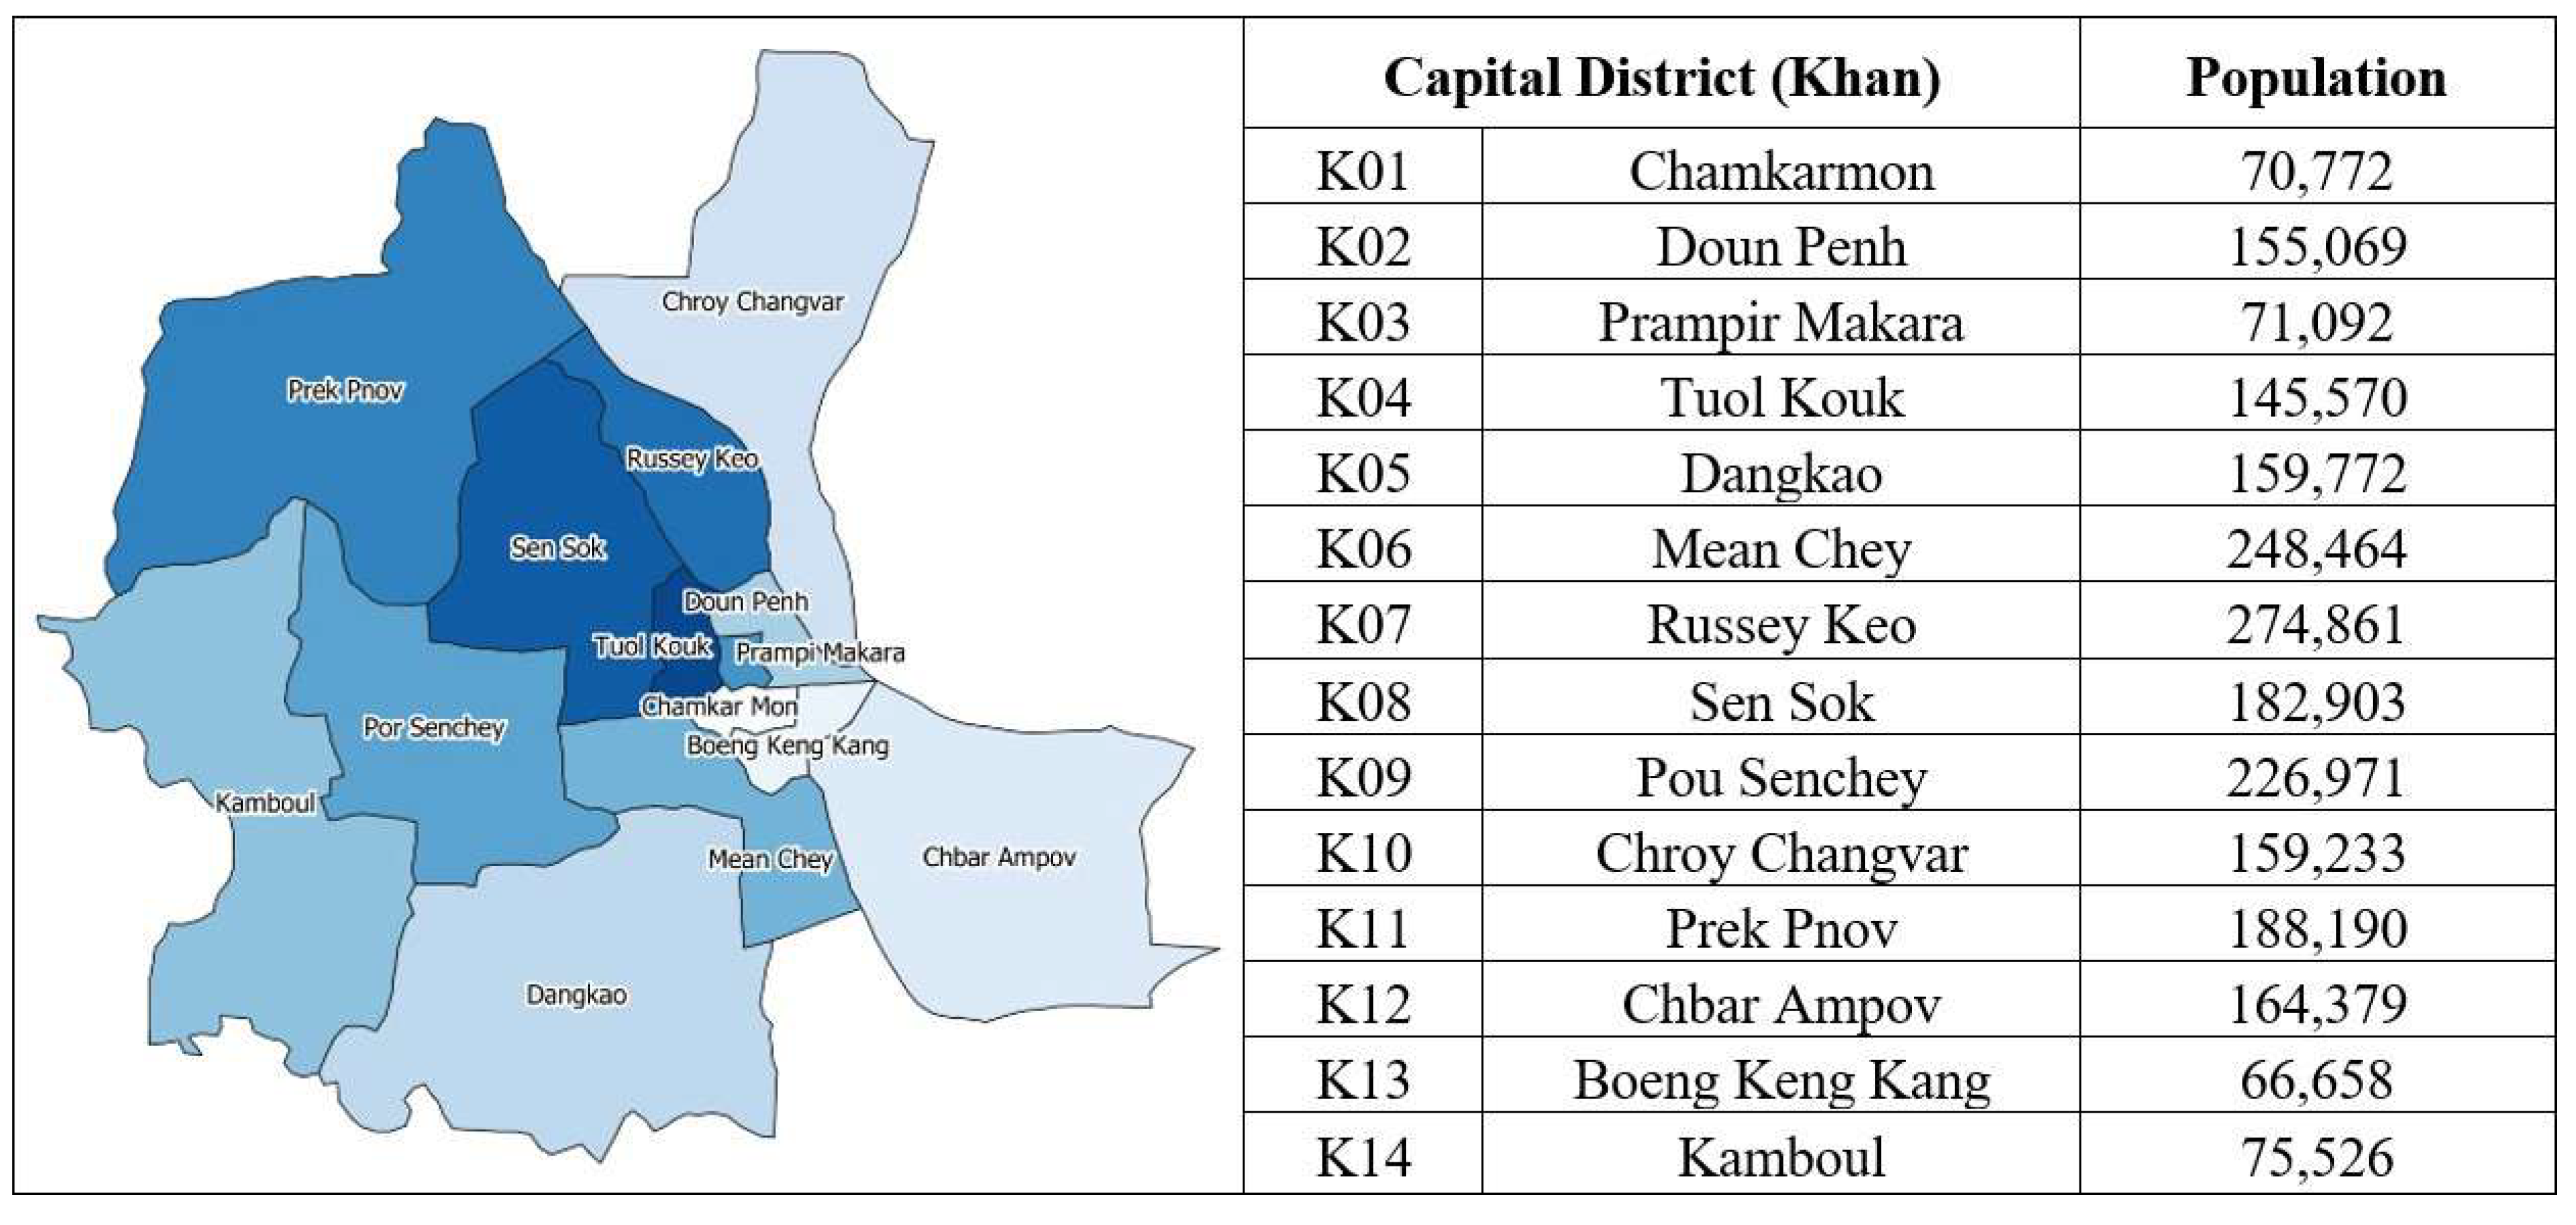
Figure 5.
Assessment results of the ‘Income’ section (a) and indicators (b).
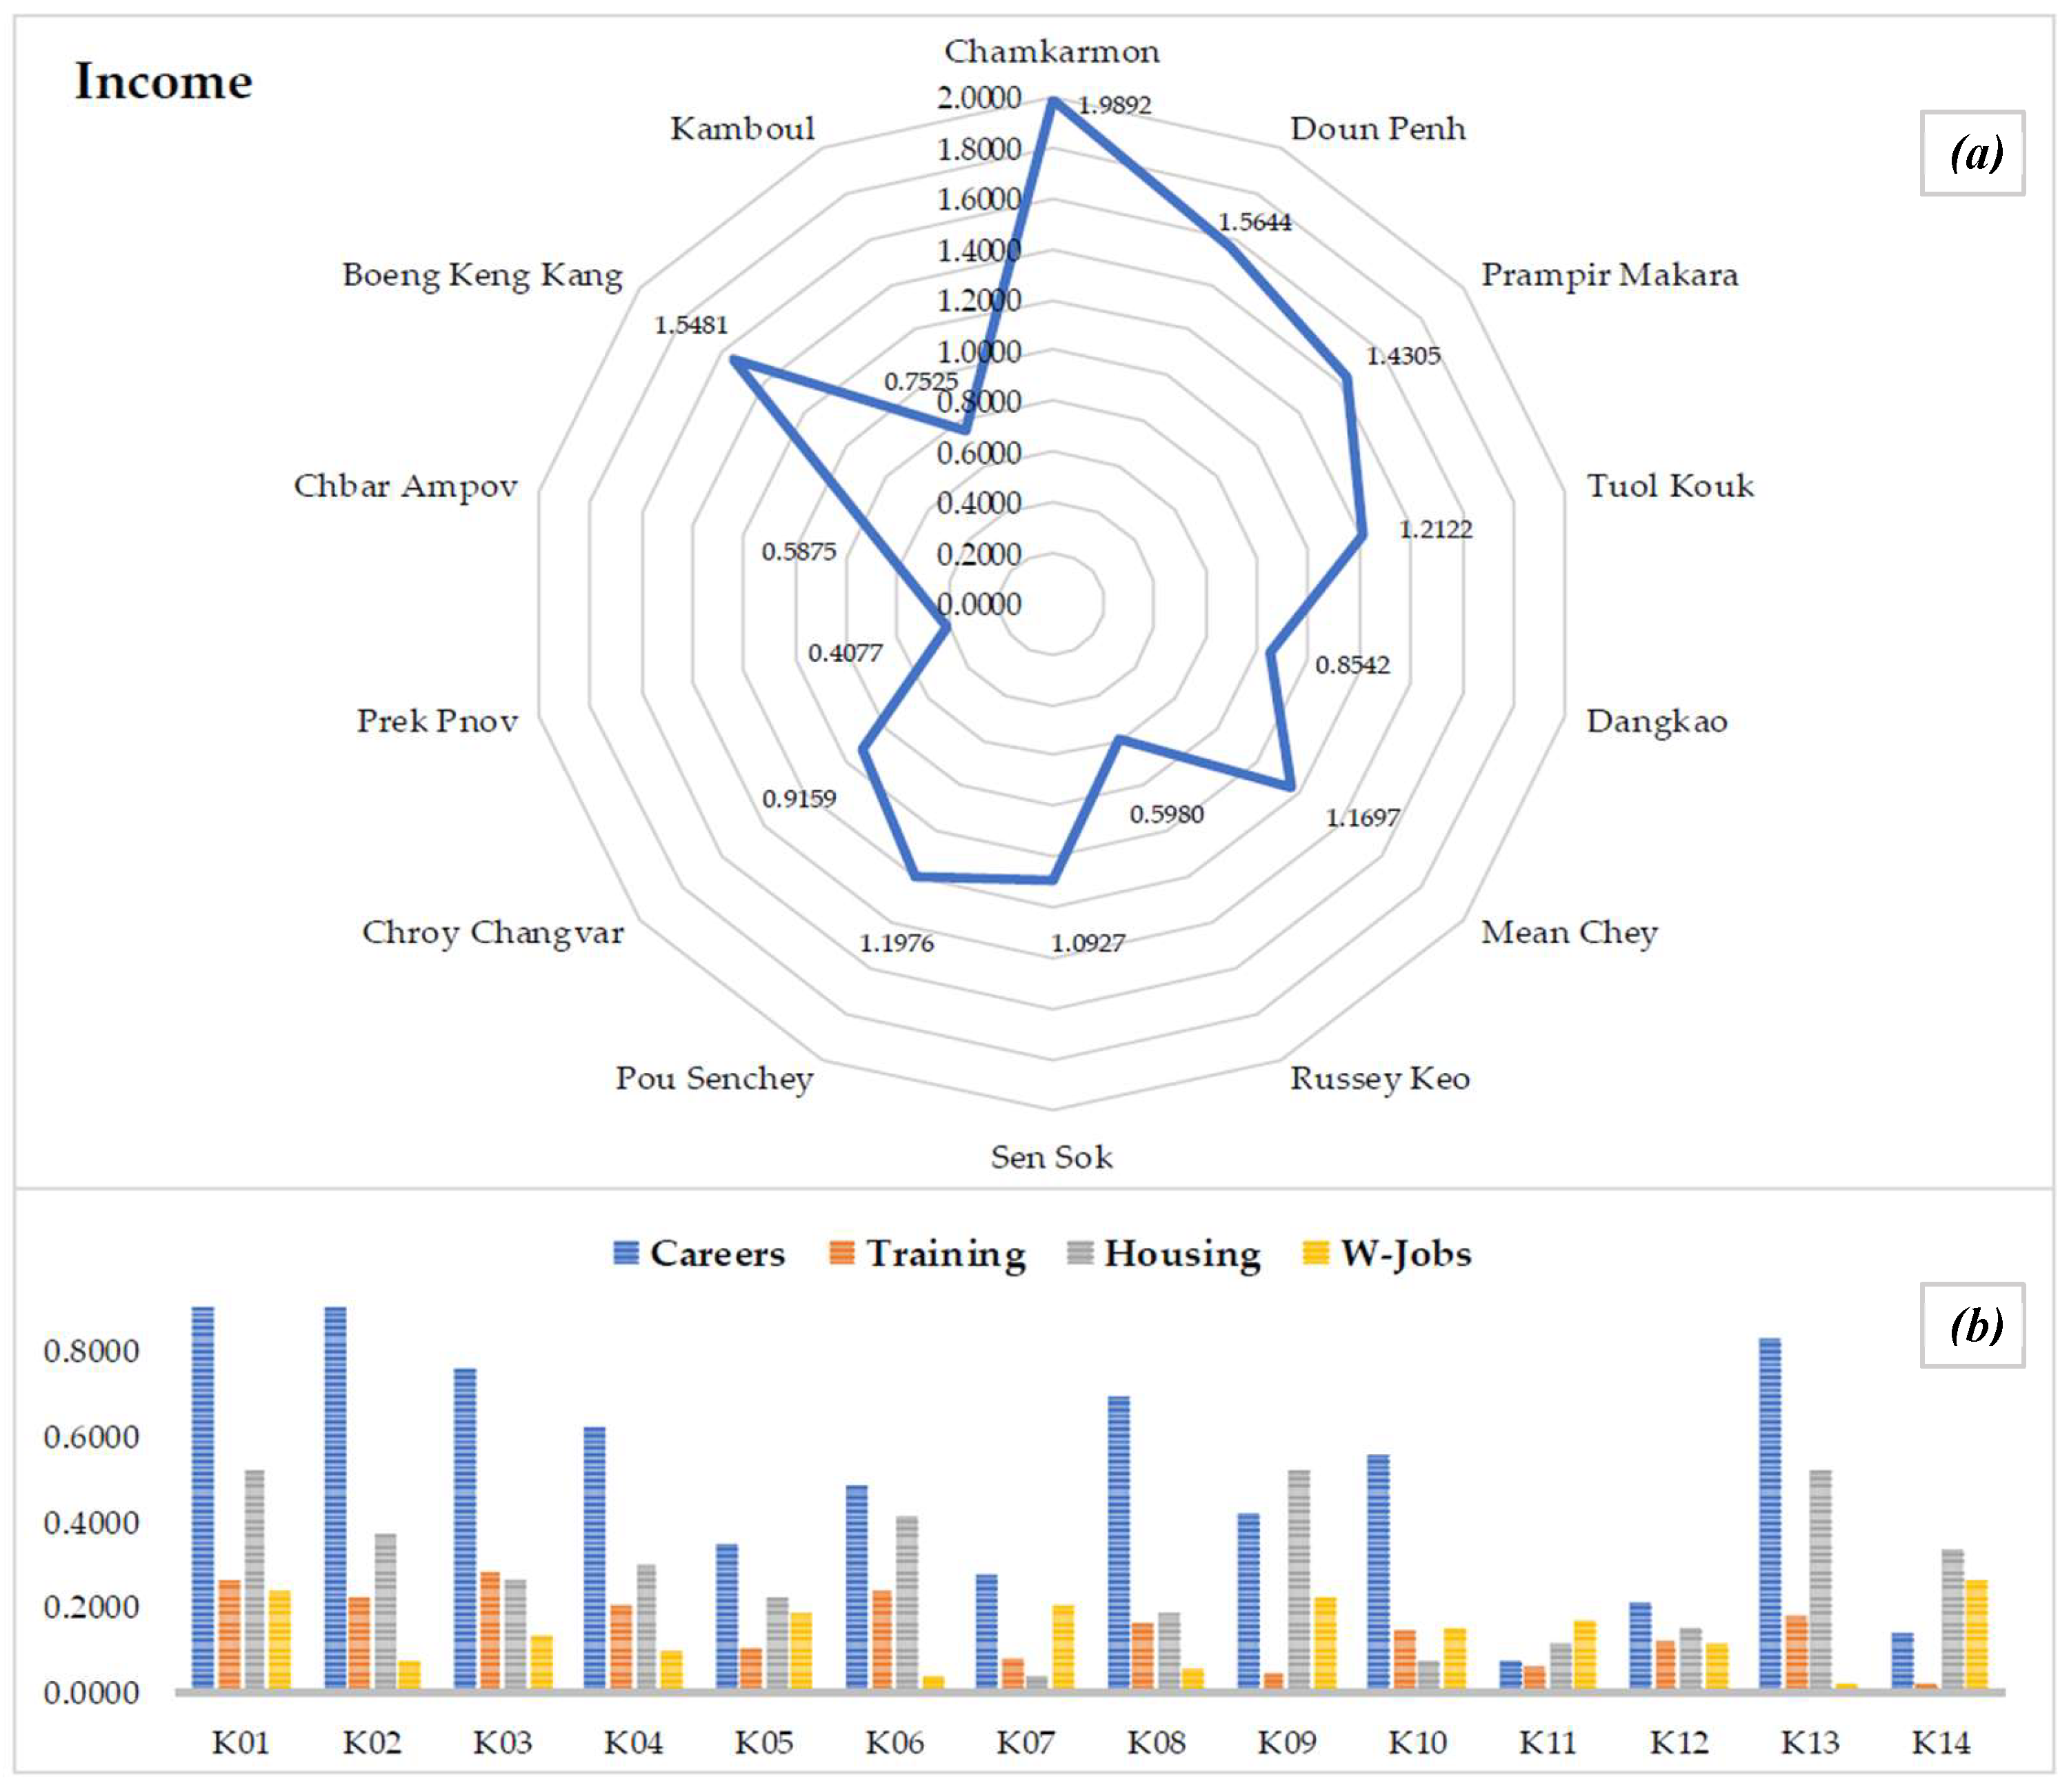
Figure 6.
Assessment results of the ‘Gender’ section (a) and indicators (b).
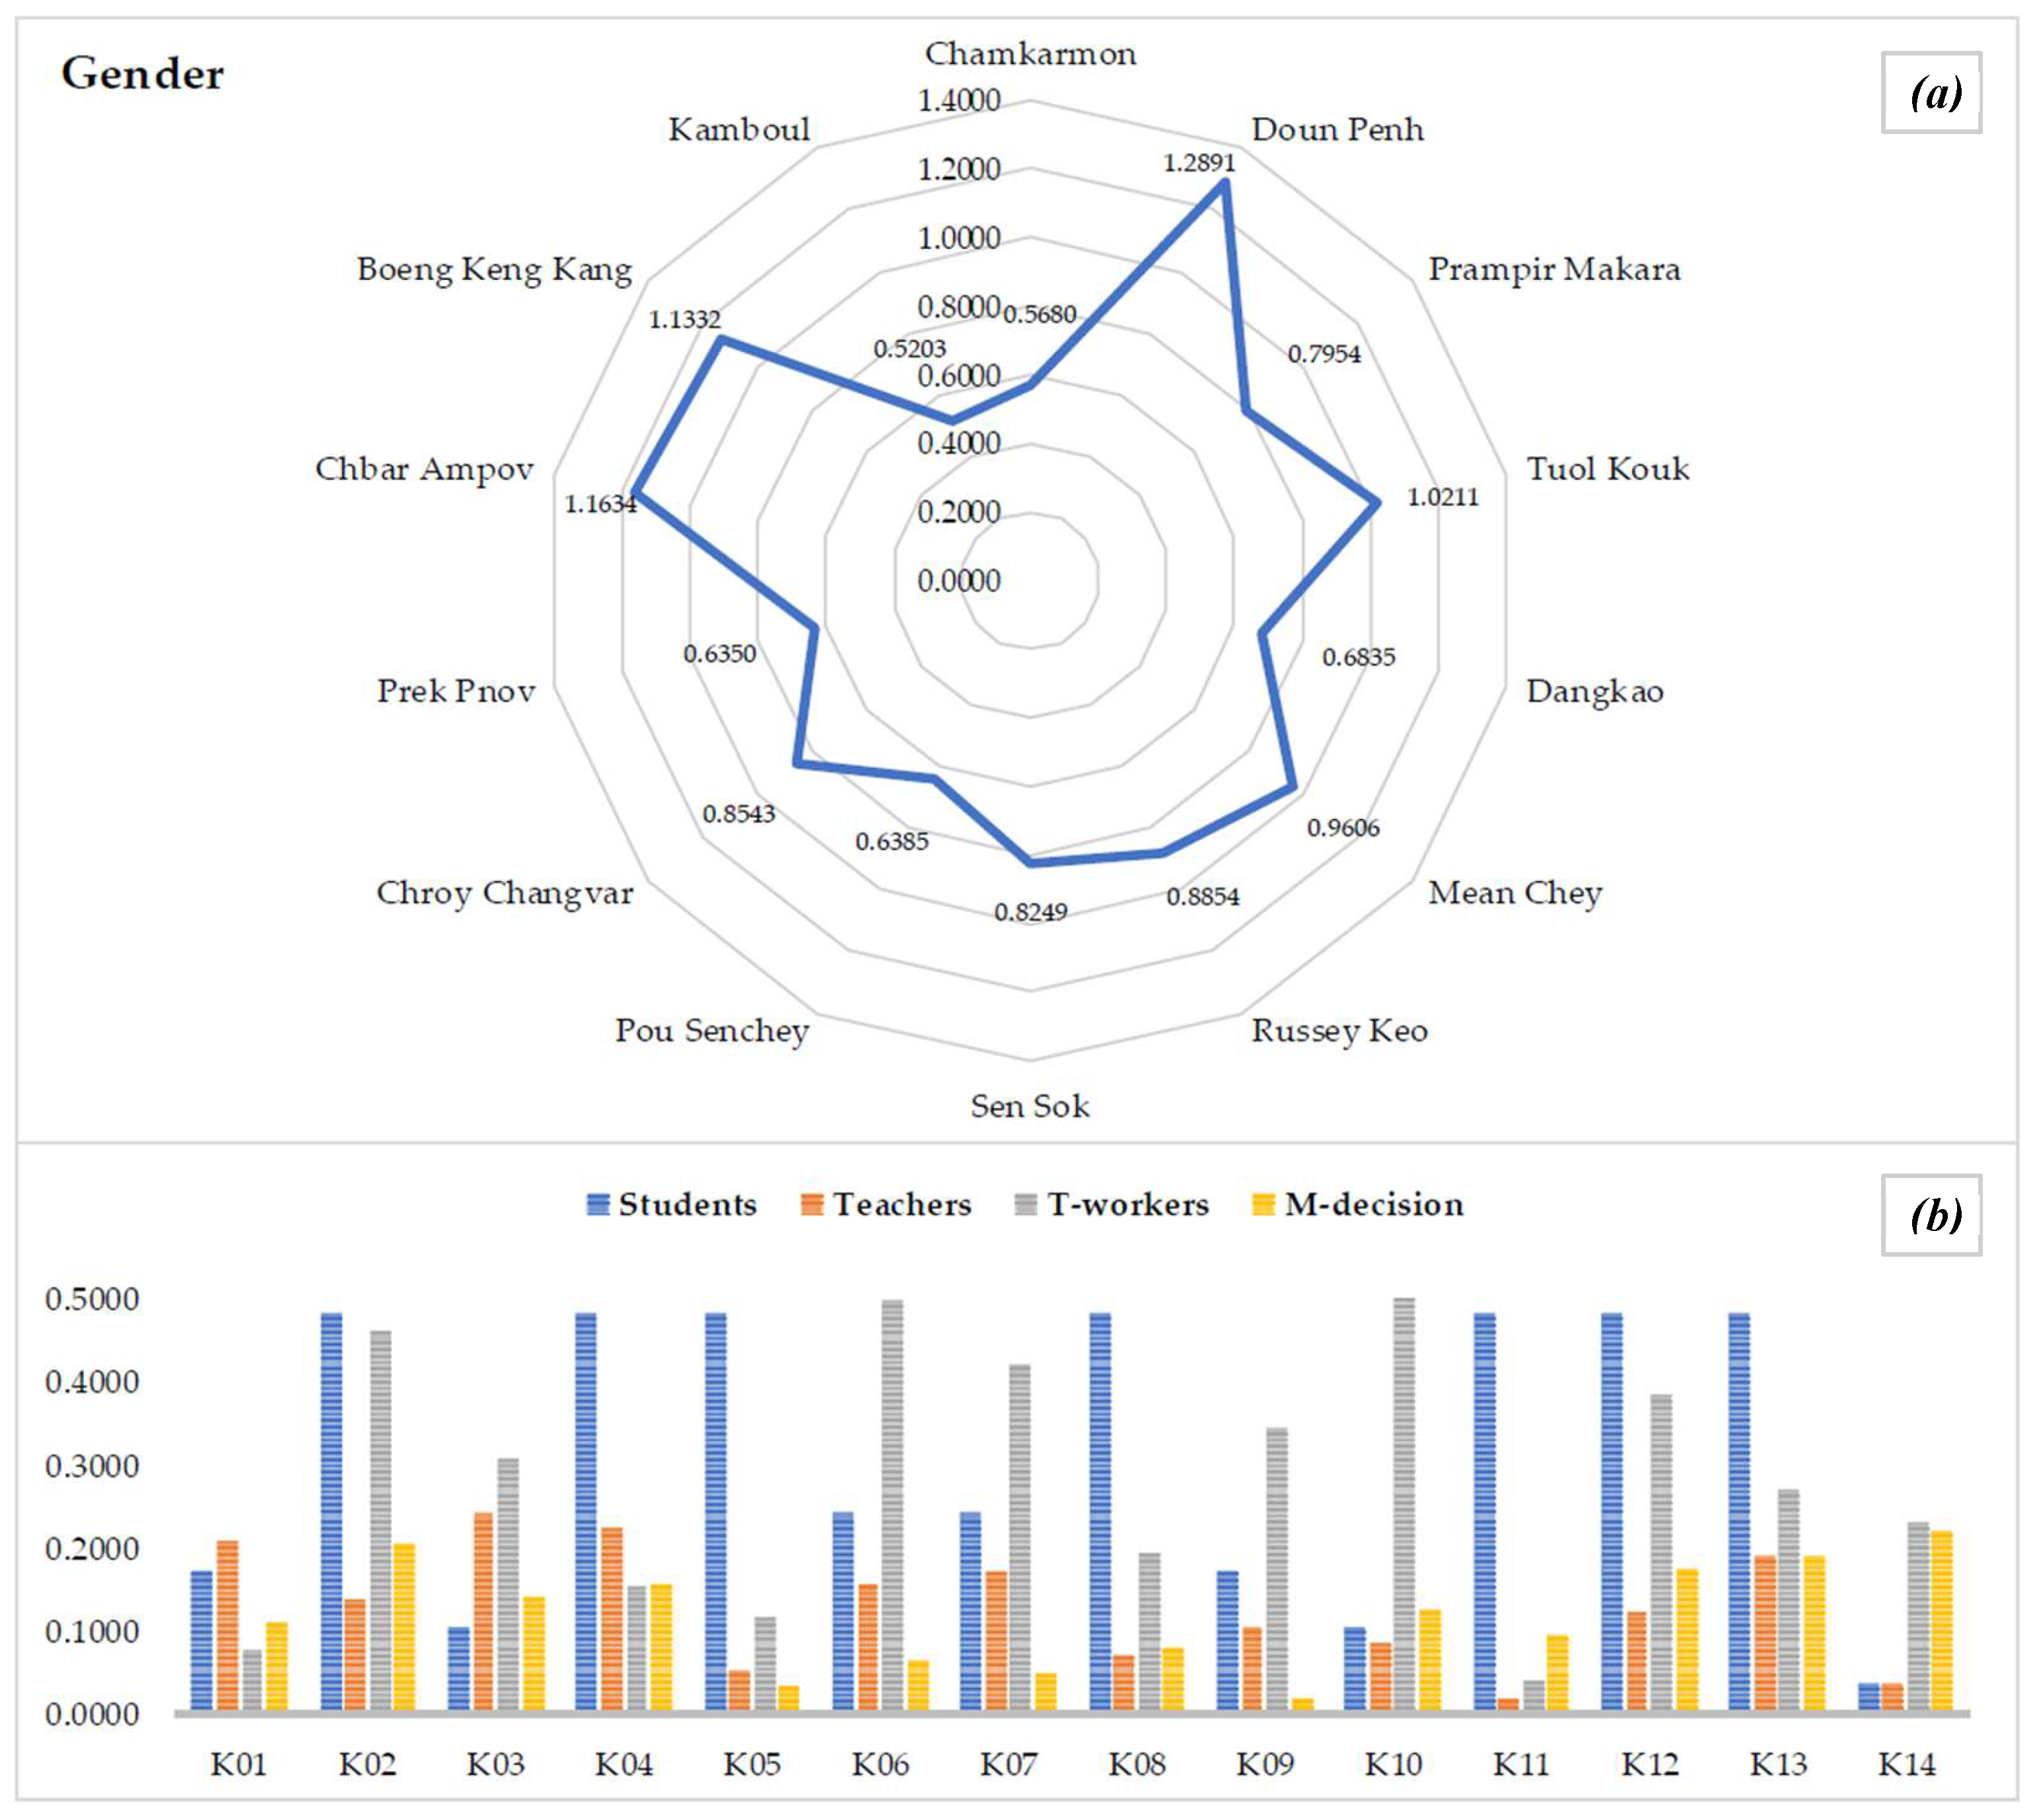
Figure 7.
Assessment results of the ‘Welfare’ section (a) and indicators (b).
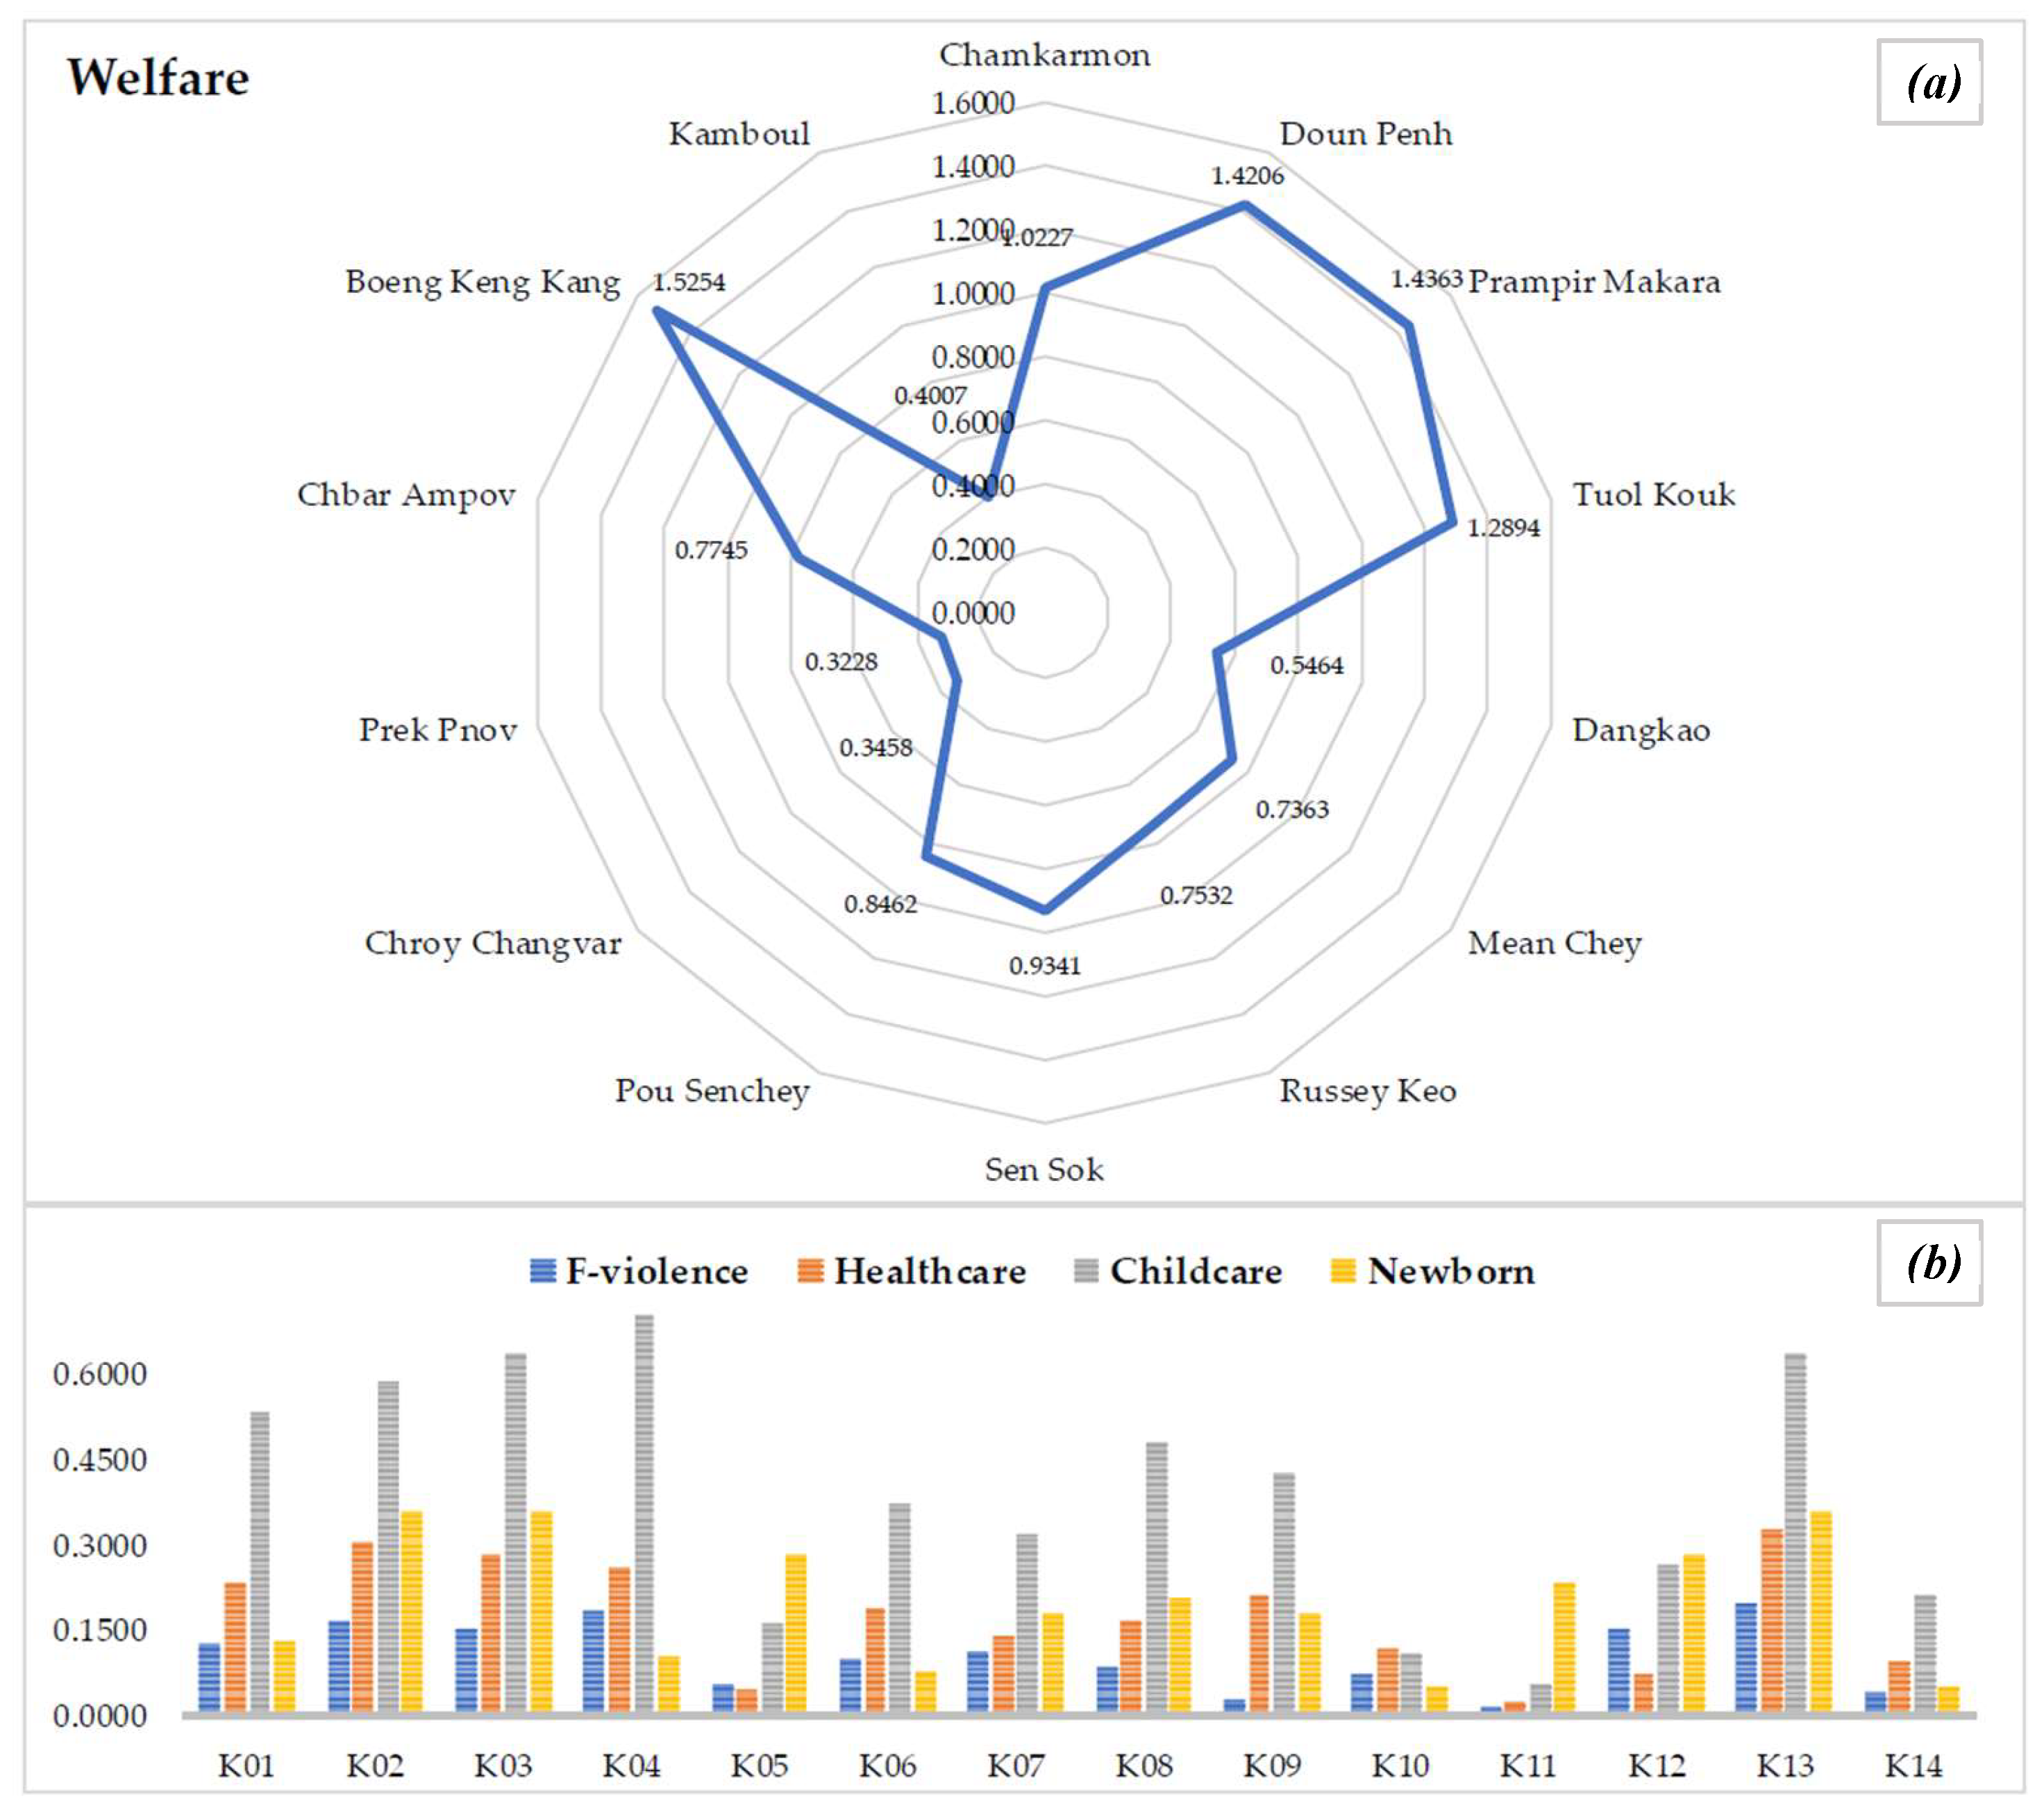
Figure 8.
Assessment results of the ‘Education’ section (a) and indicators (b).
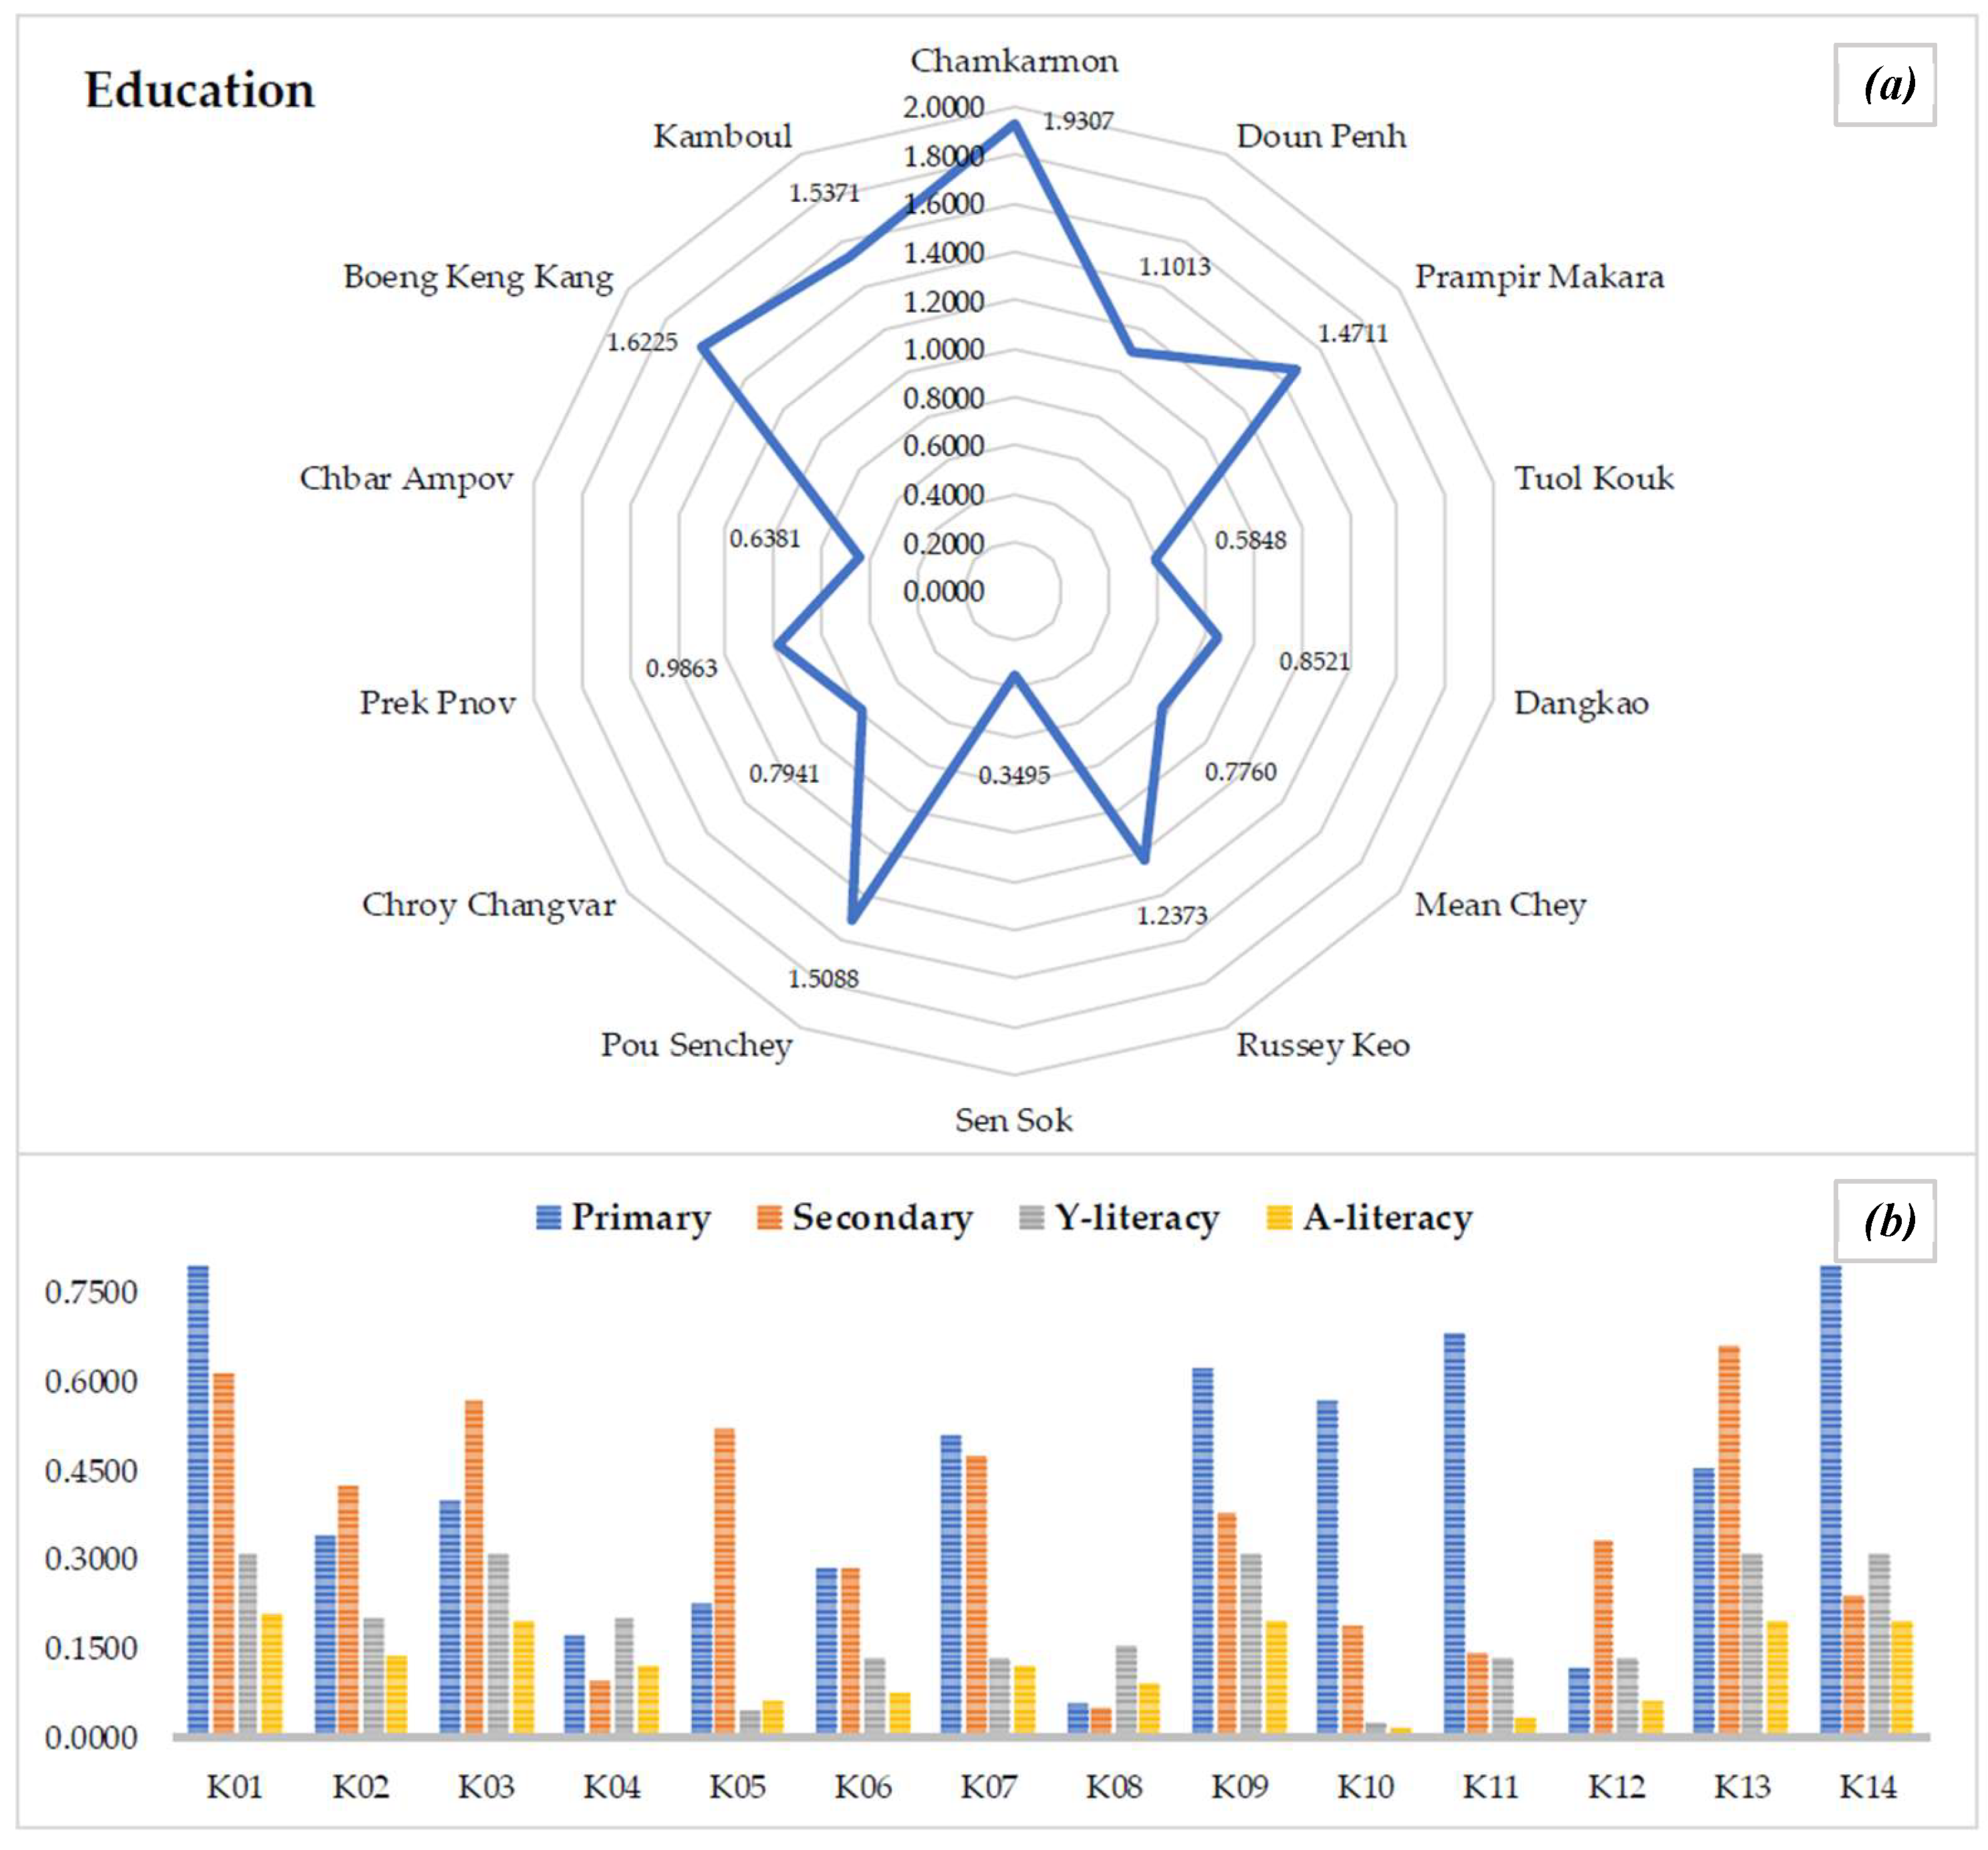
Figure 9.
Assessment results of the ‘Vulnerability’ section (a) and indicators (b).
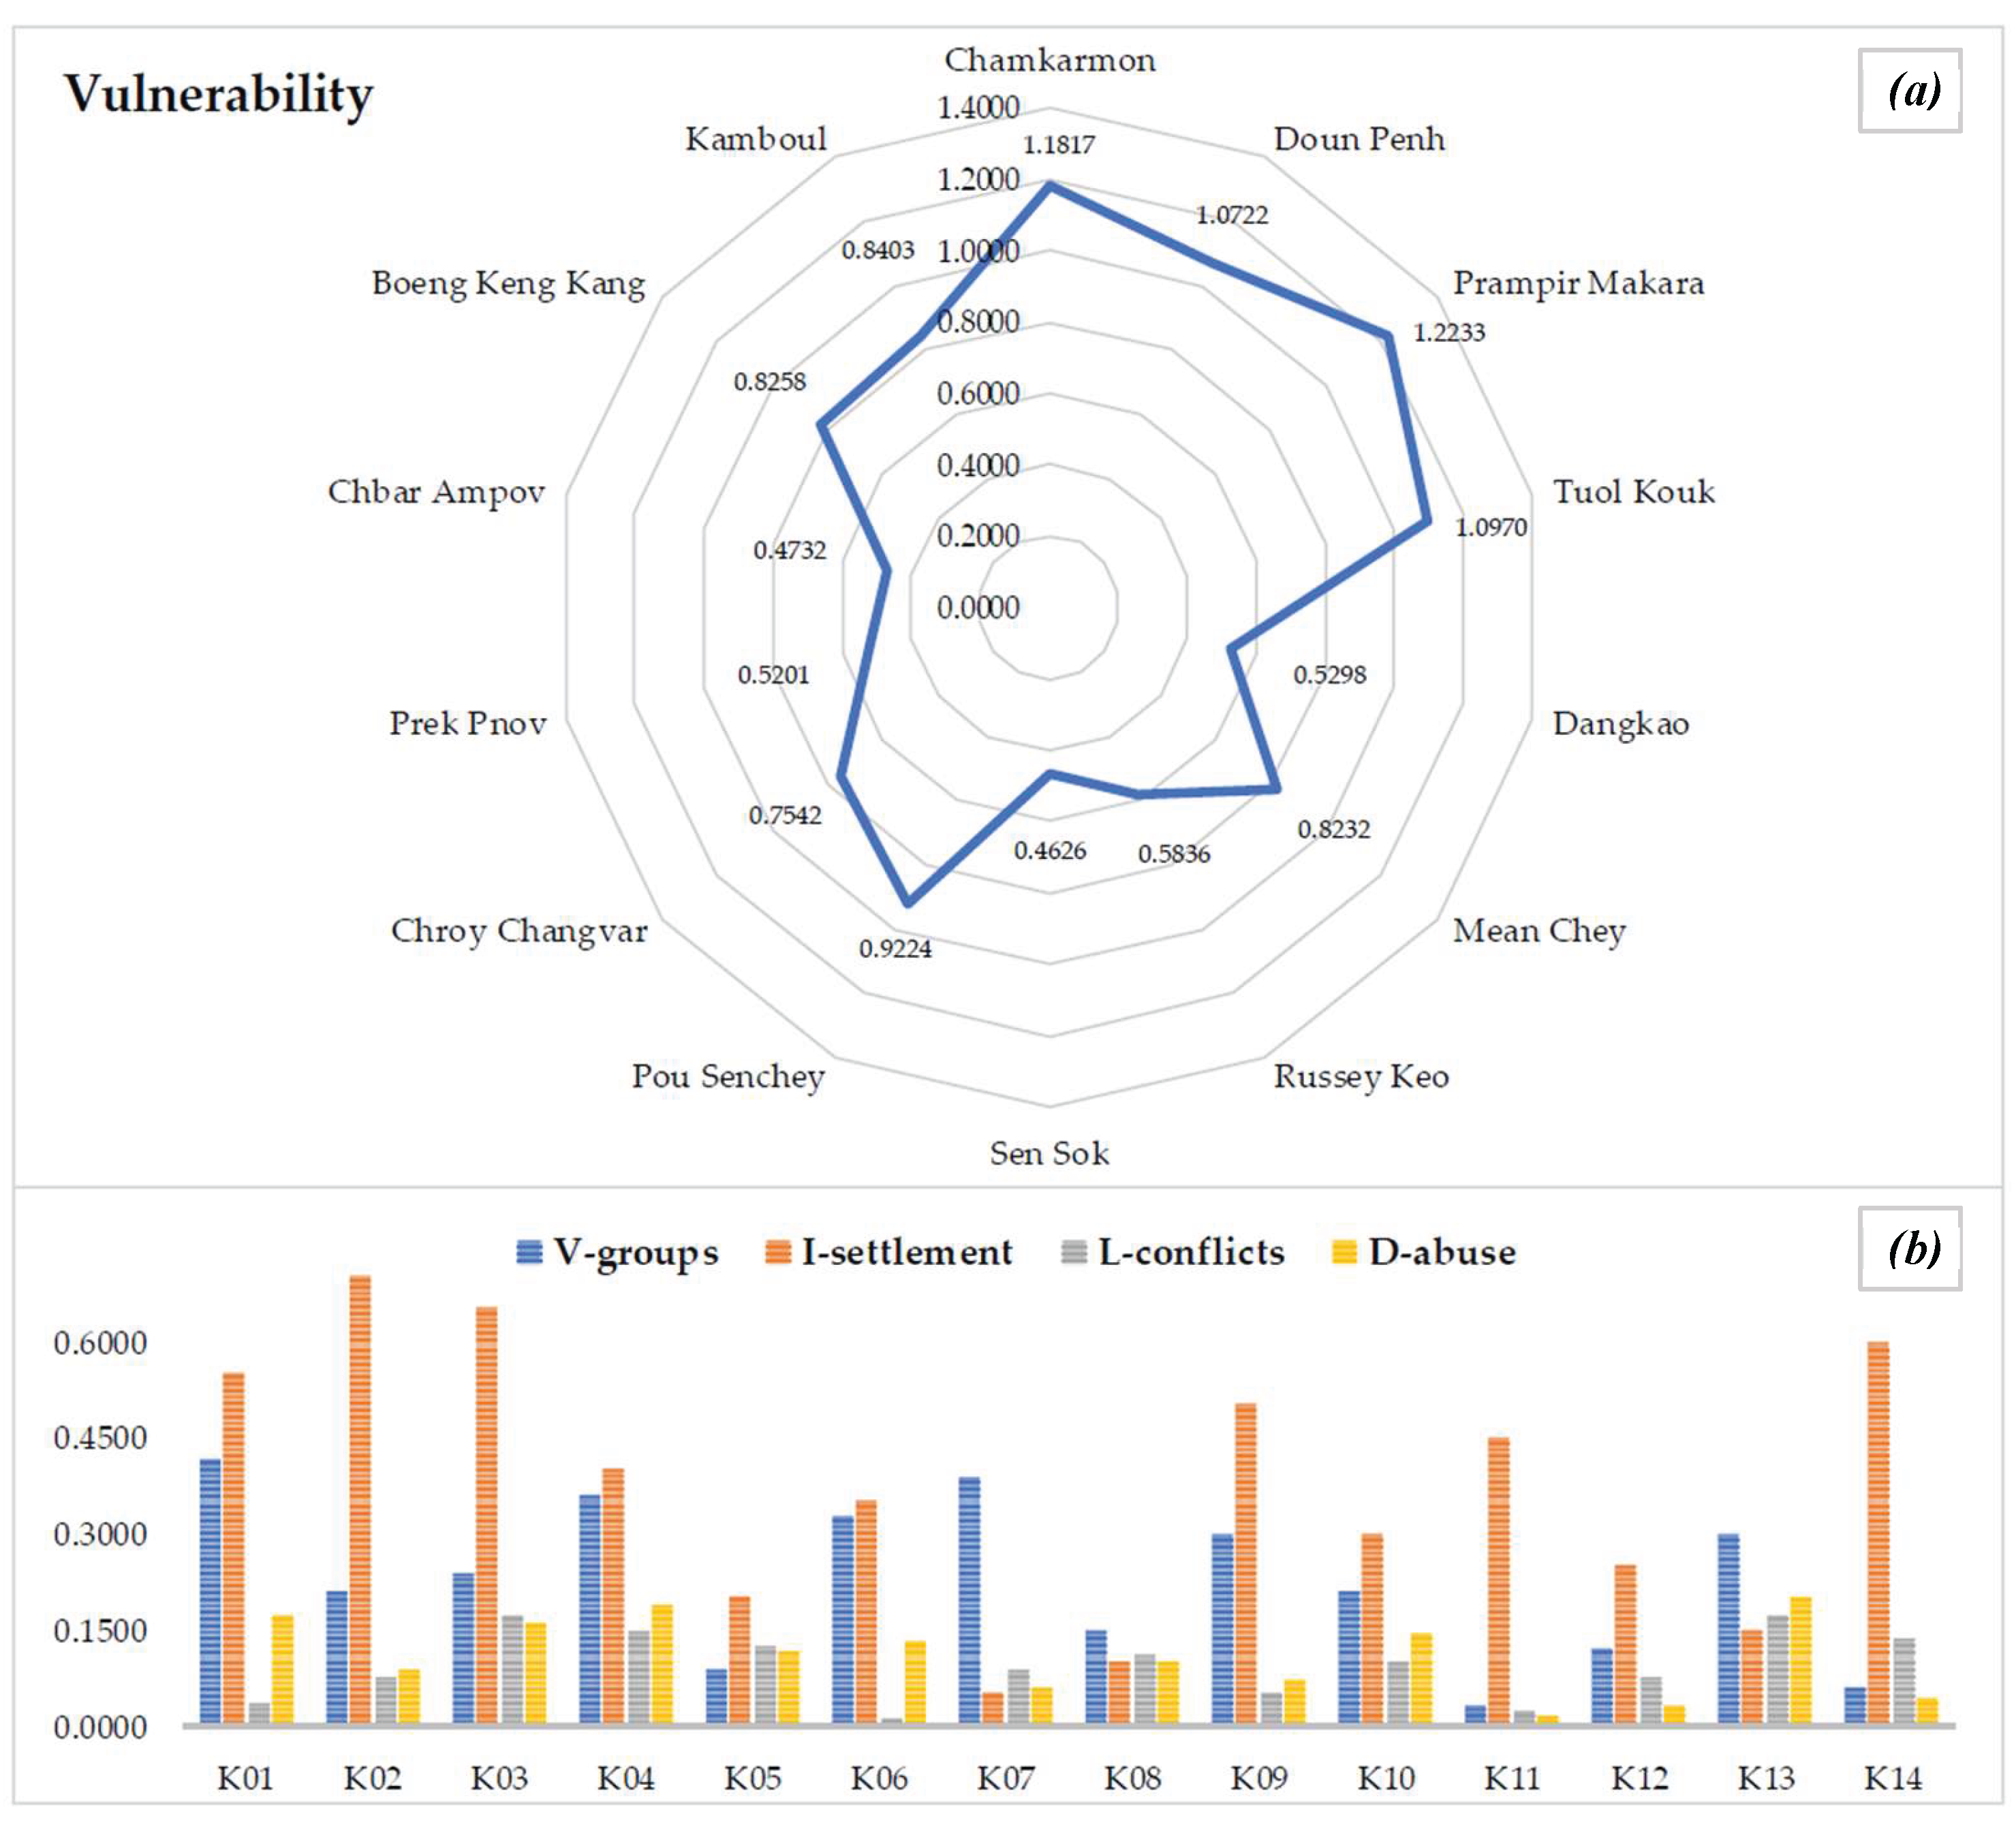
Figure 10.
Assessment results of the ‘Sanitation’ section (a) and indicators (b).
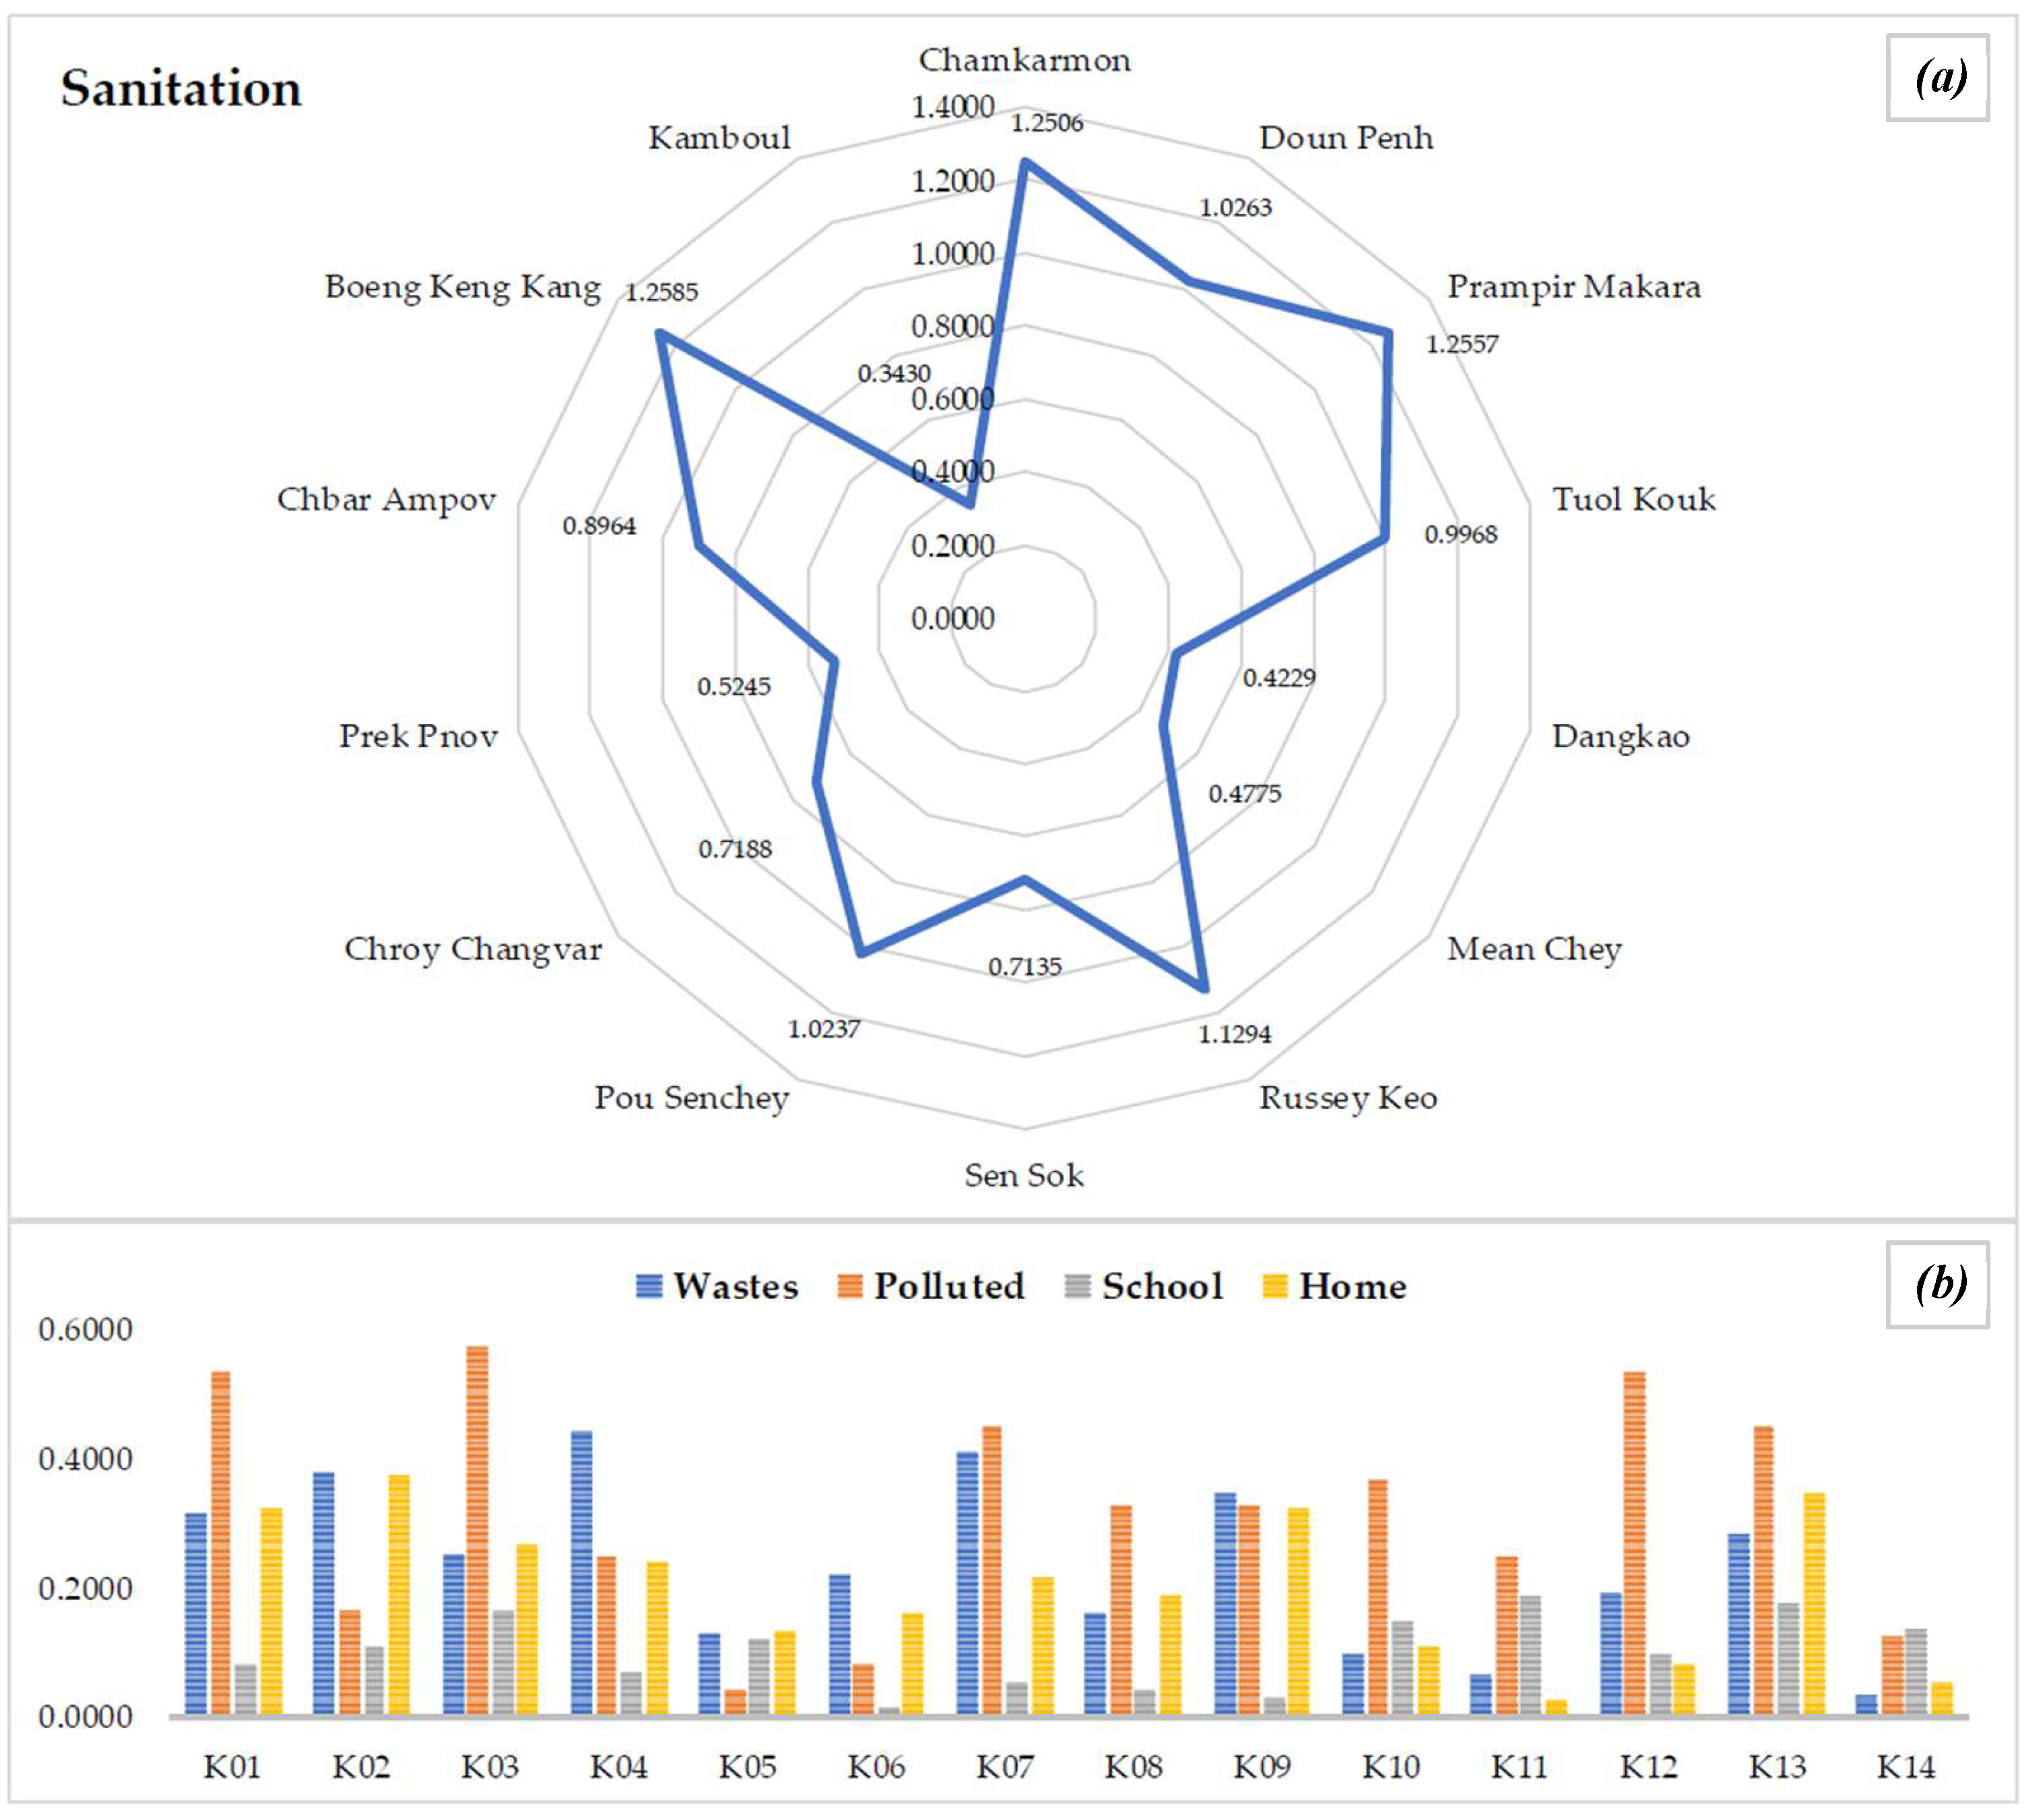
Figure 11.
Assessment results of the ‘Water’ section (a) and indicators (b).
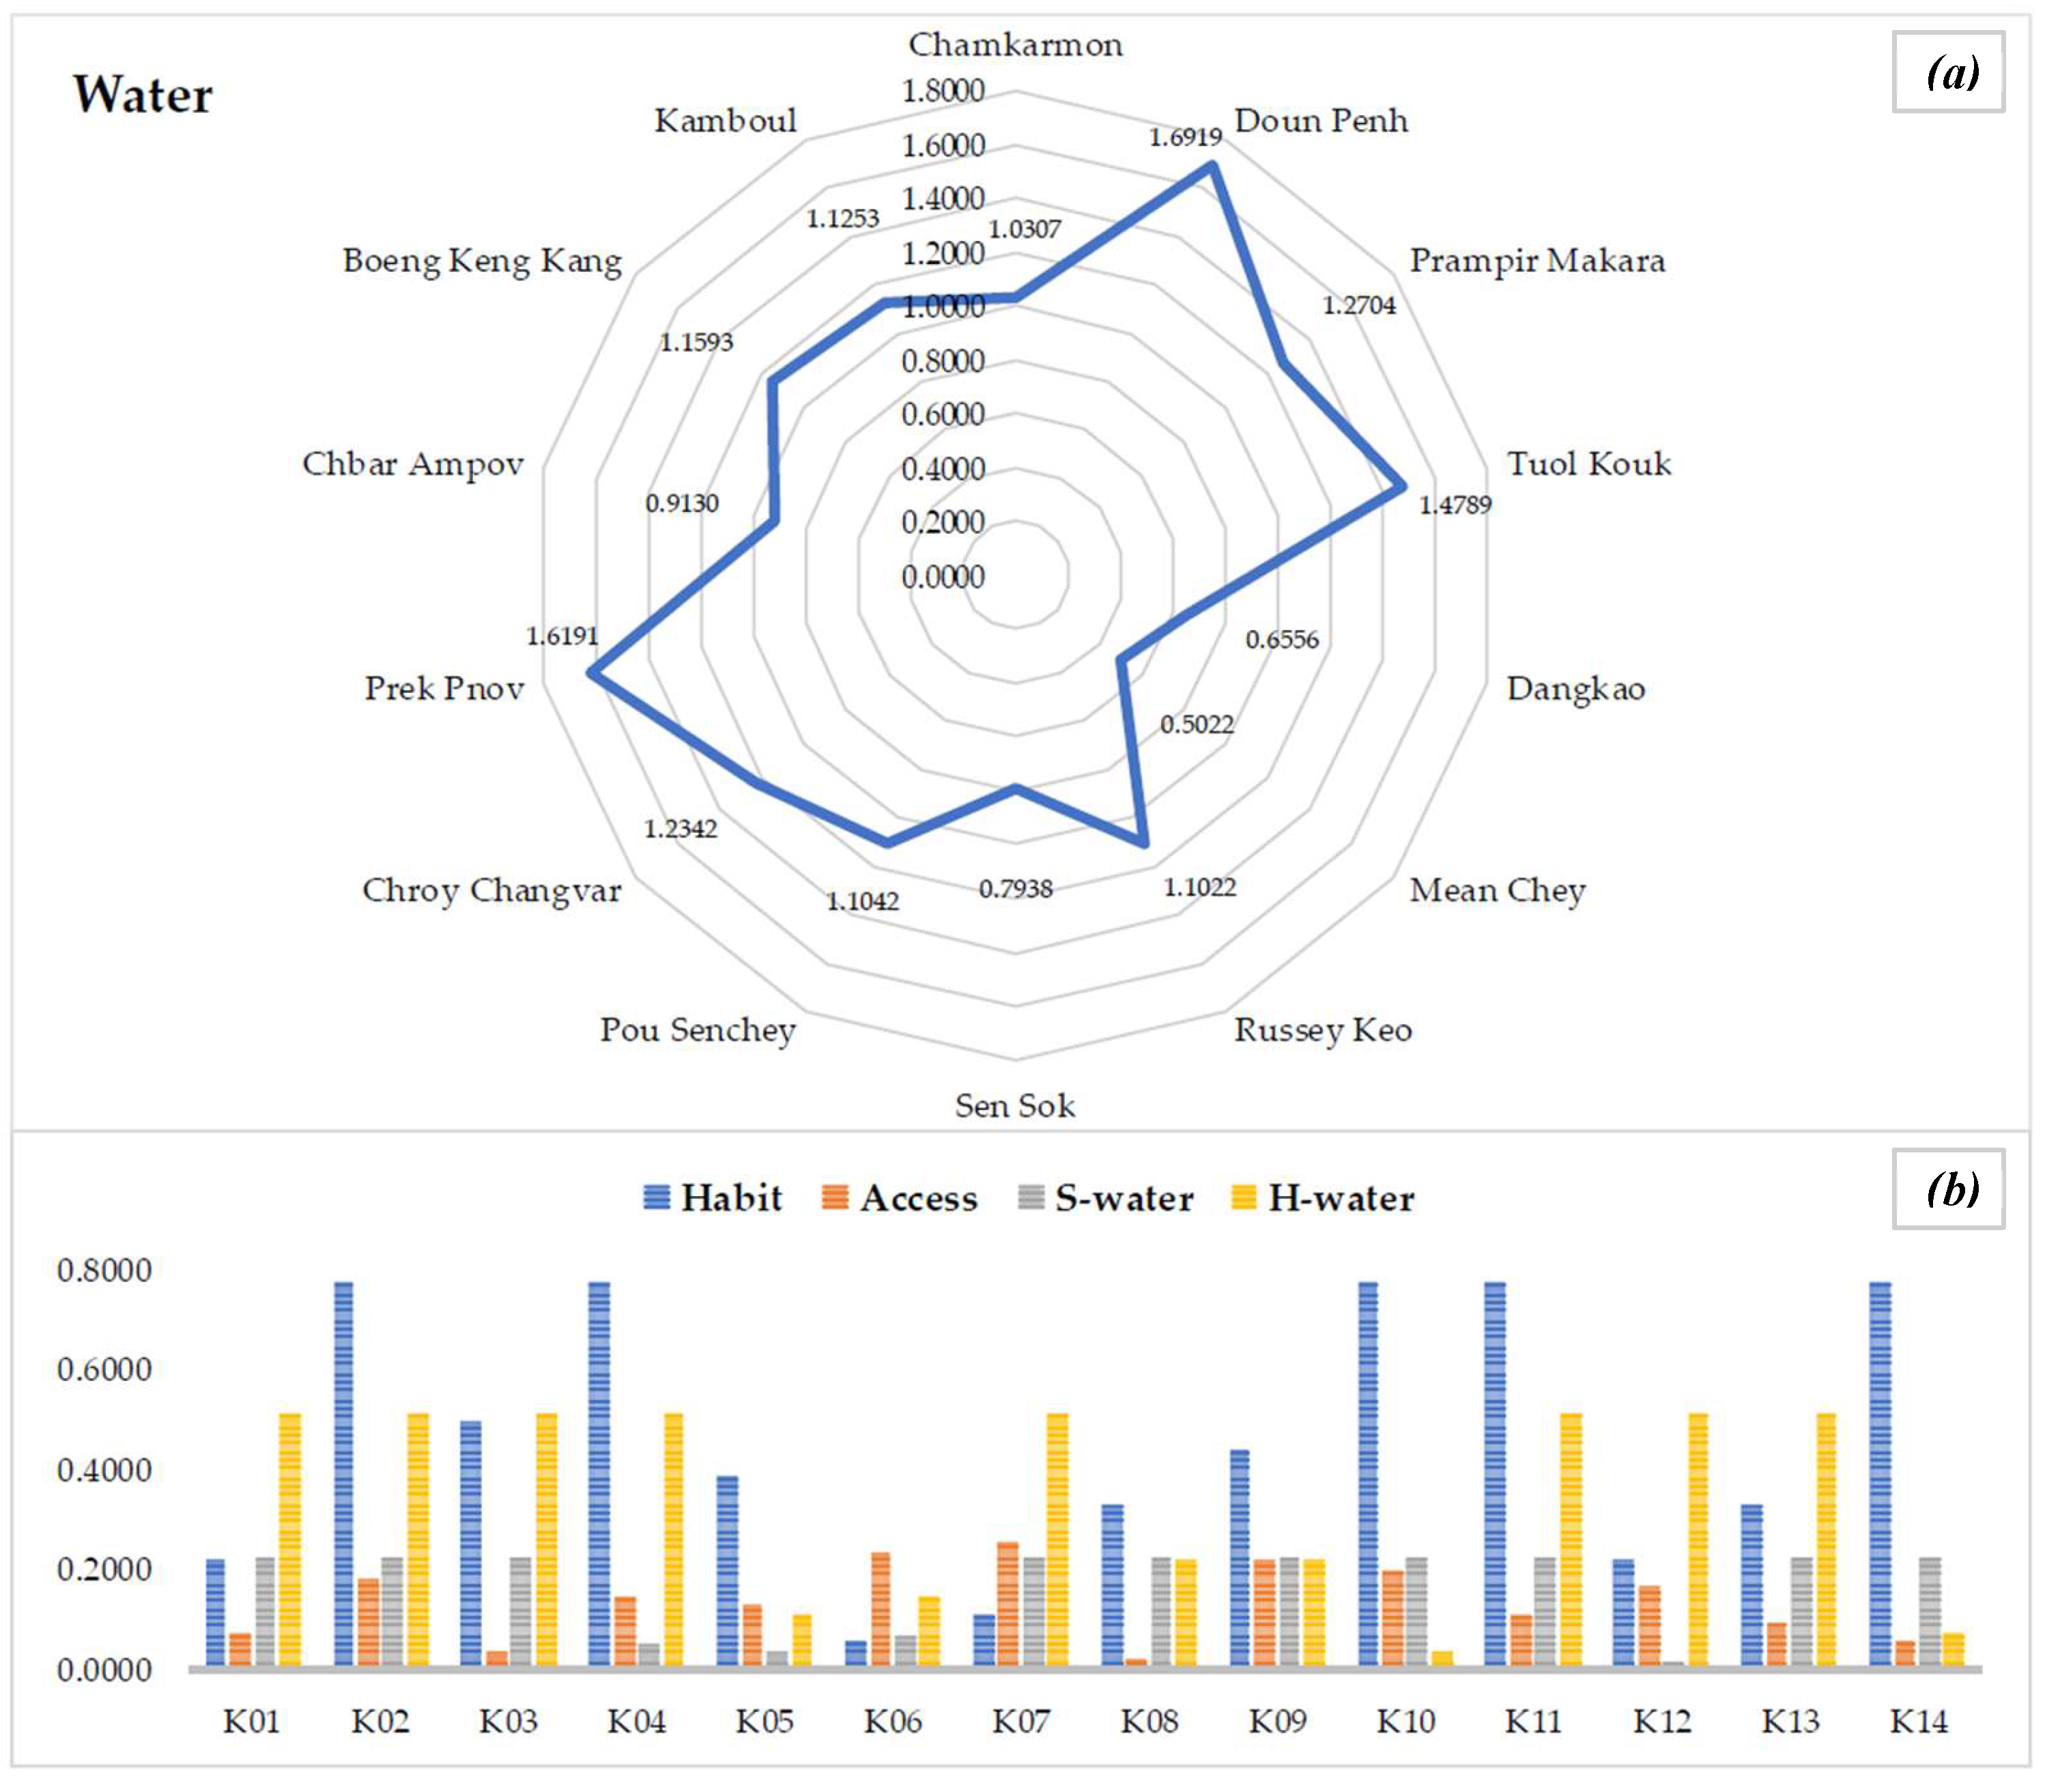
Figure 12.
Assessment results of the ‘Safety’ section (a) and indicators (b).
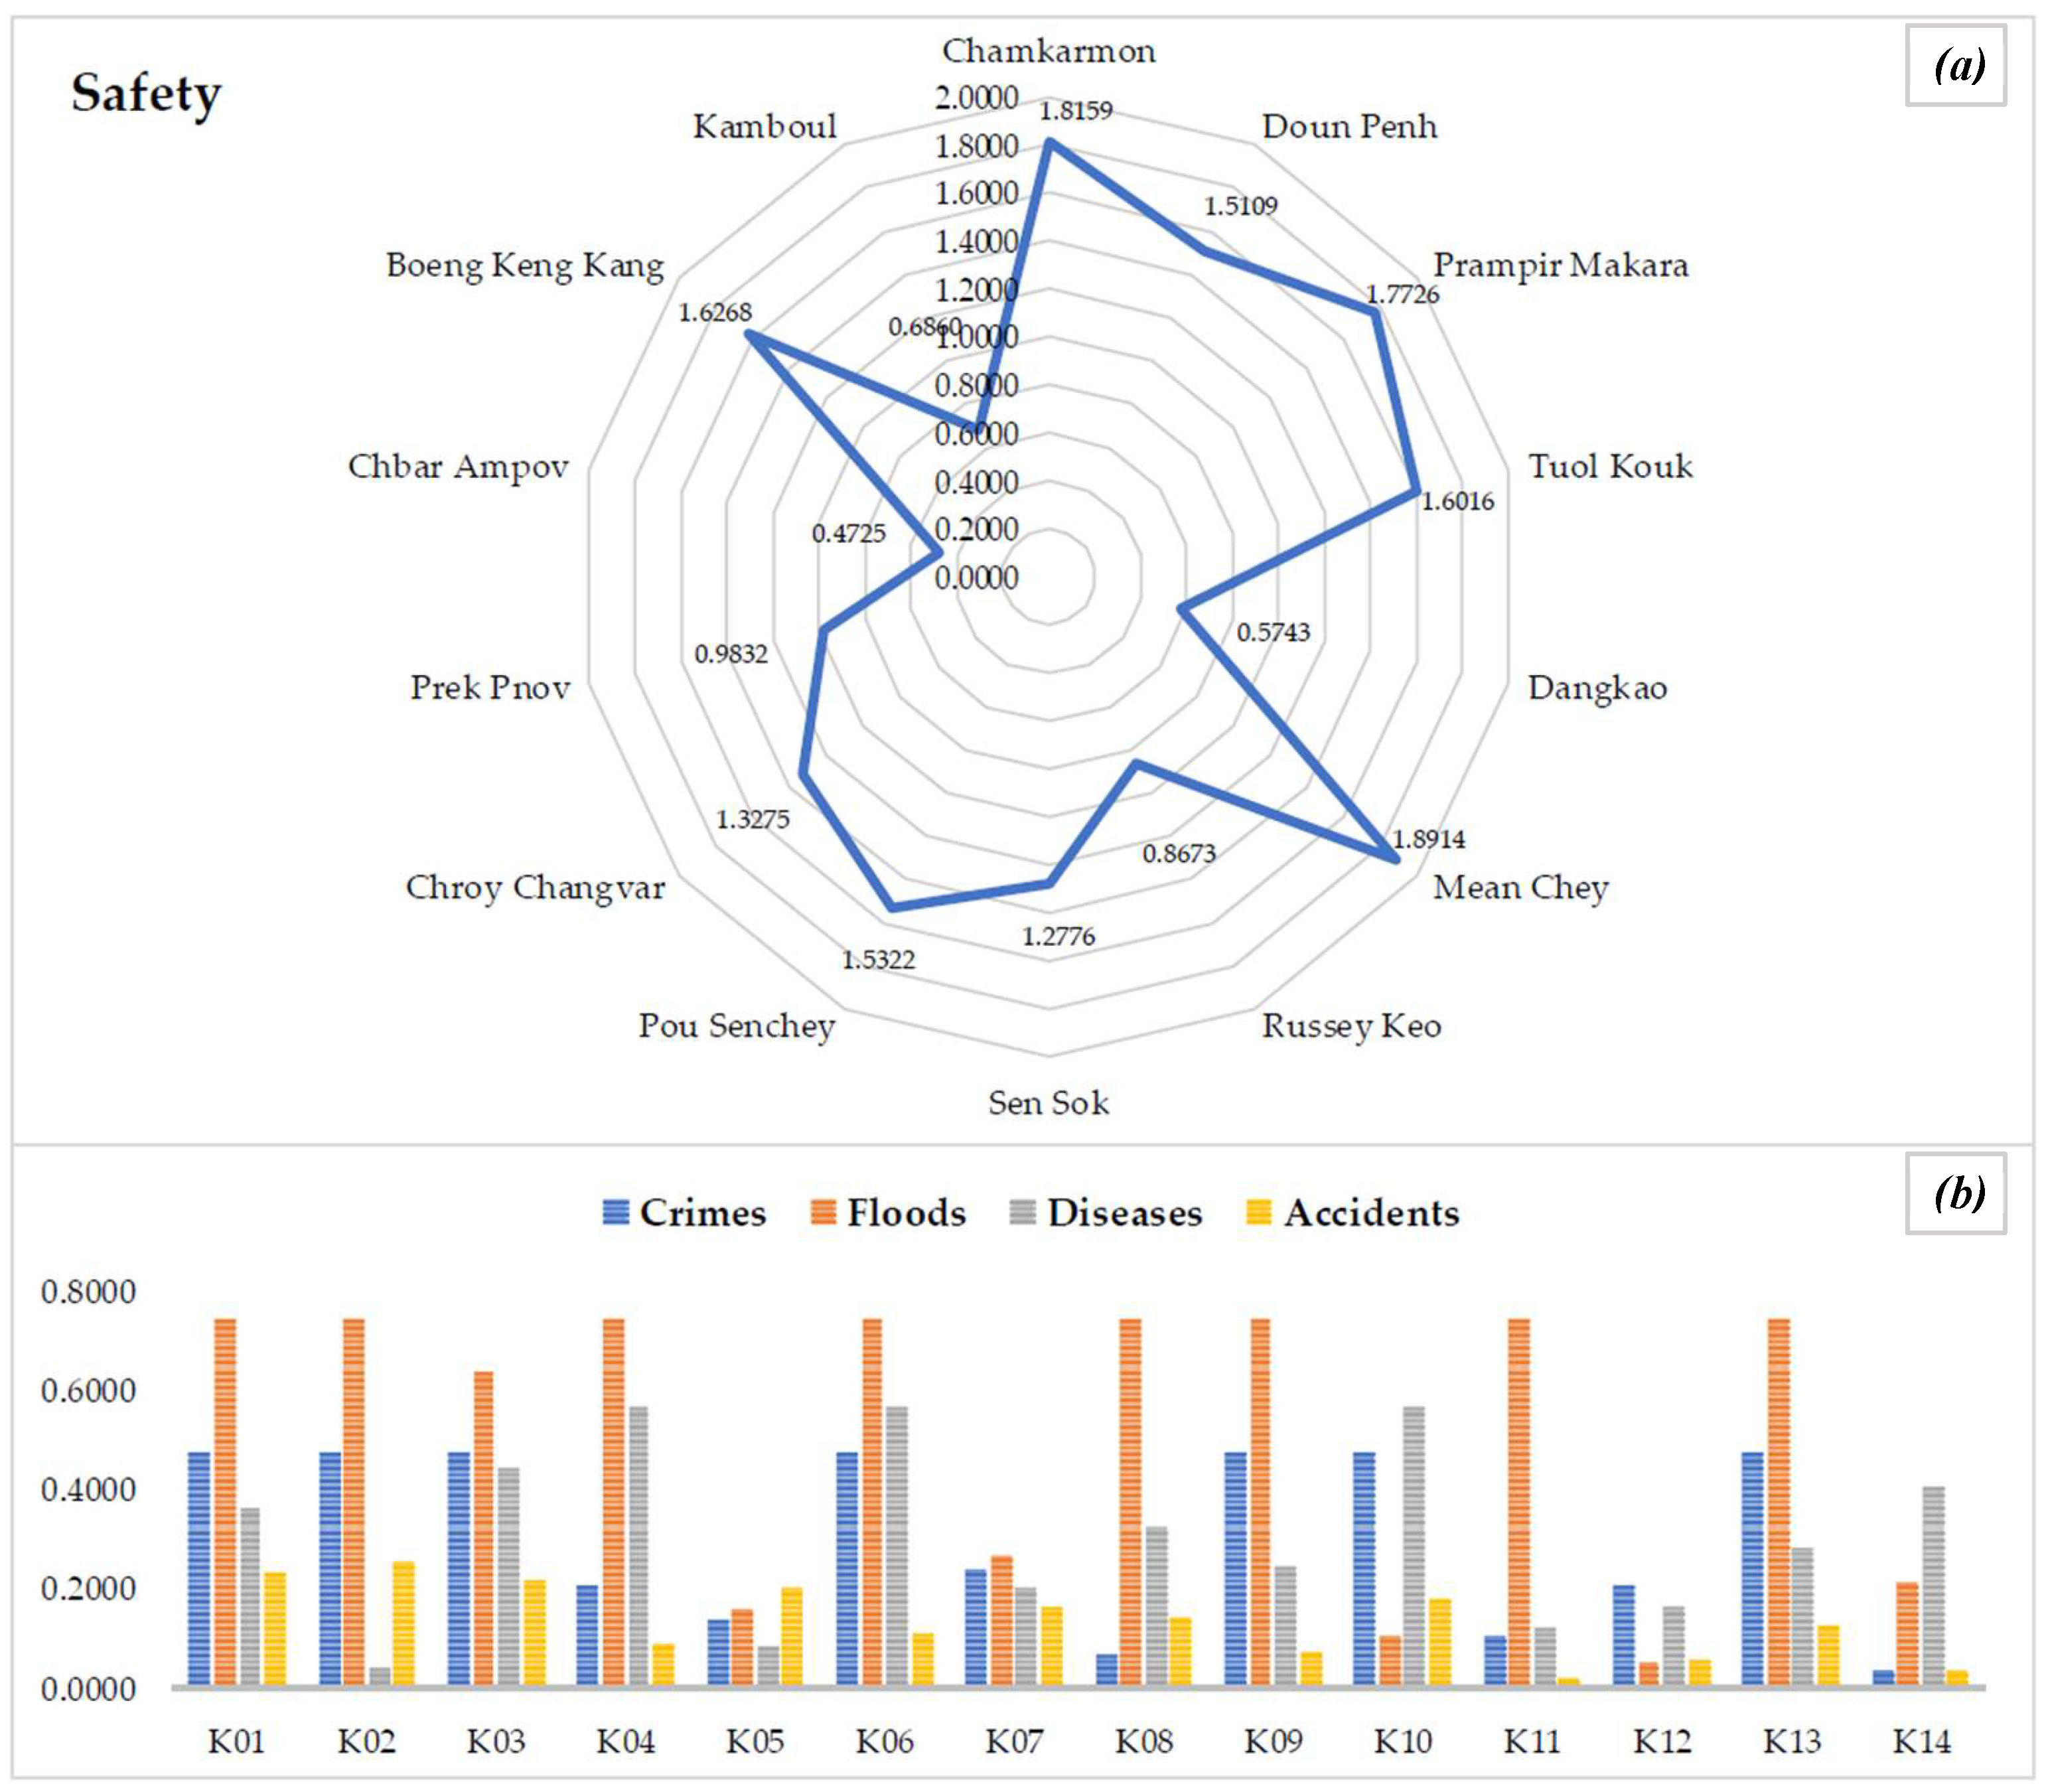
Figure 13.
Comparative urban assessment results of all districts by categories.
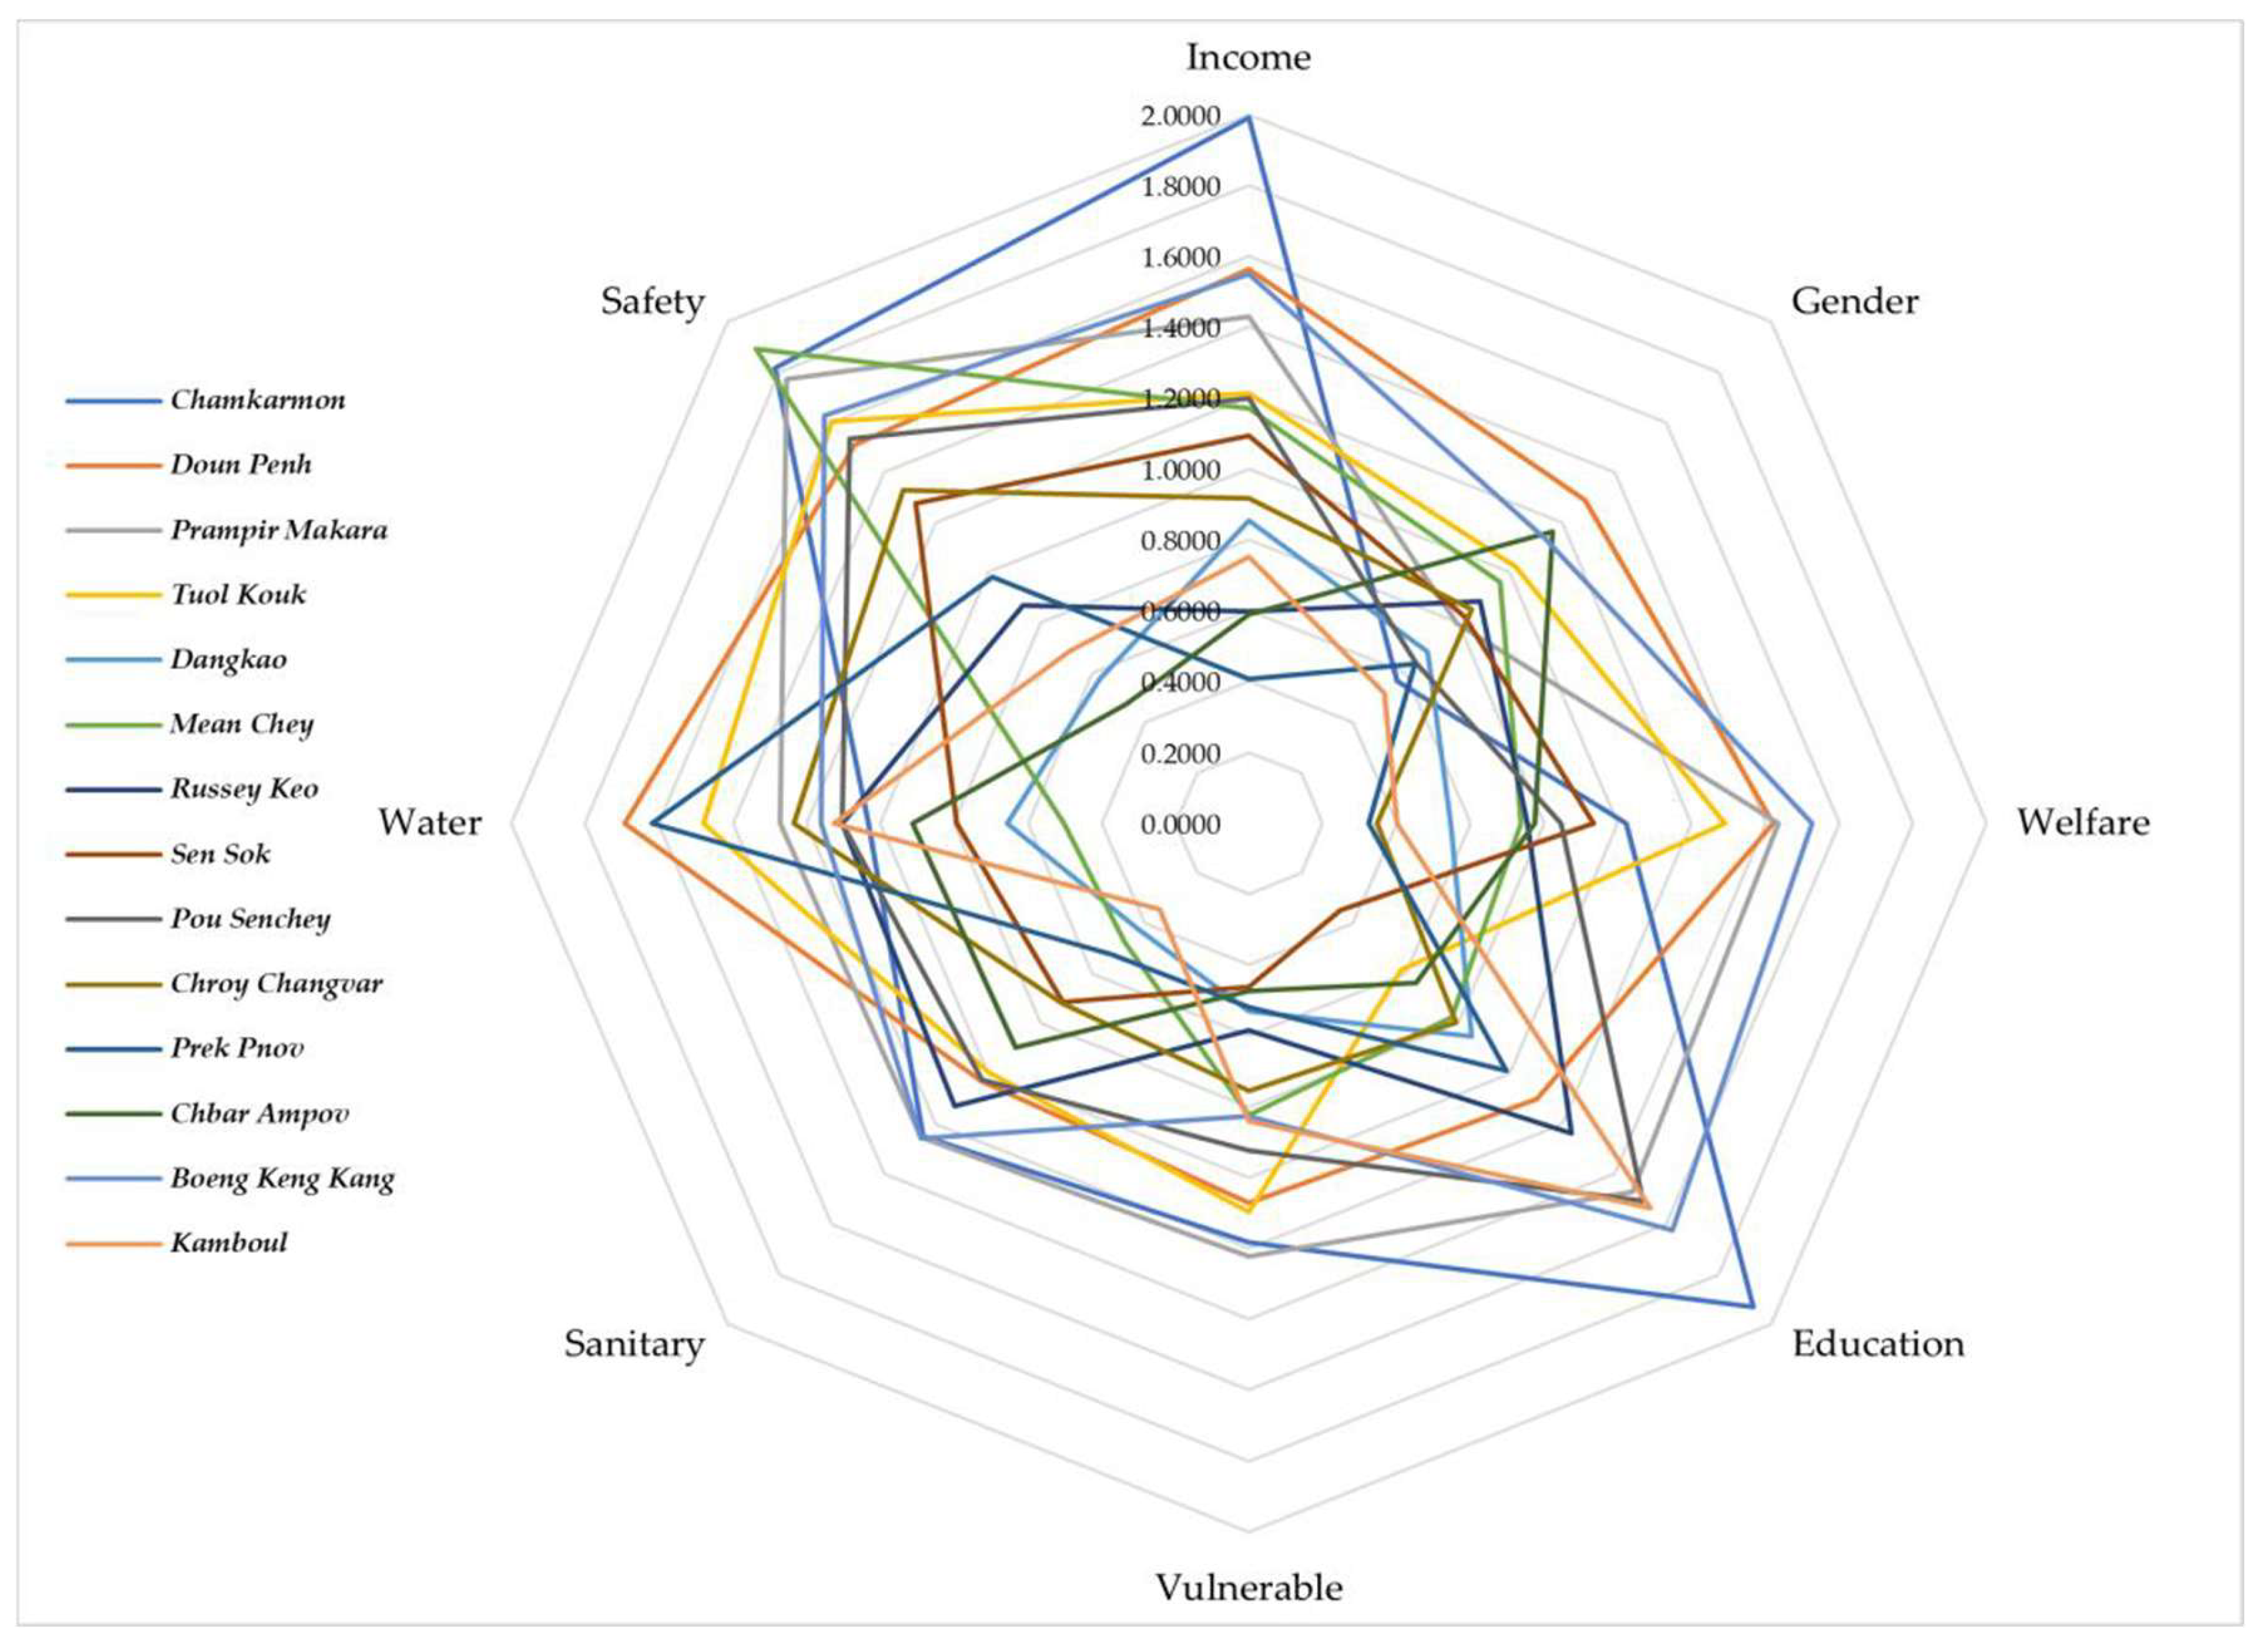
Figure 14.
Urban social sustainability ranking of 14 capital districts.
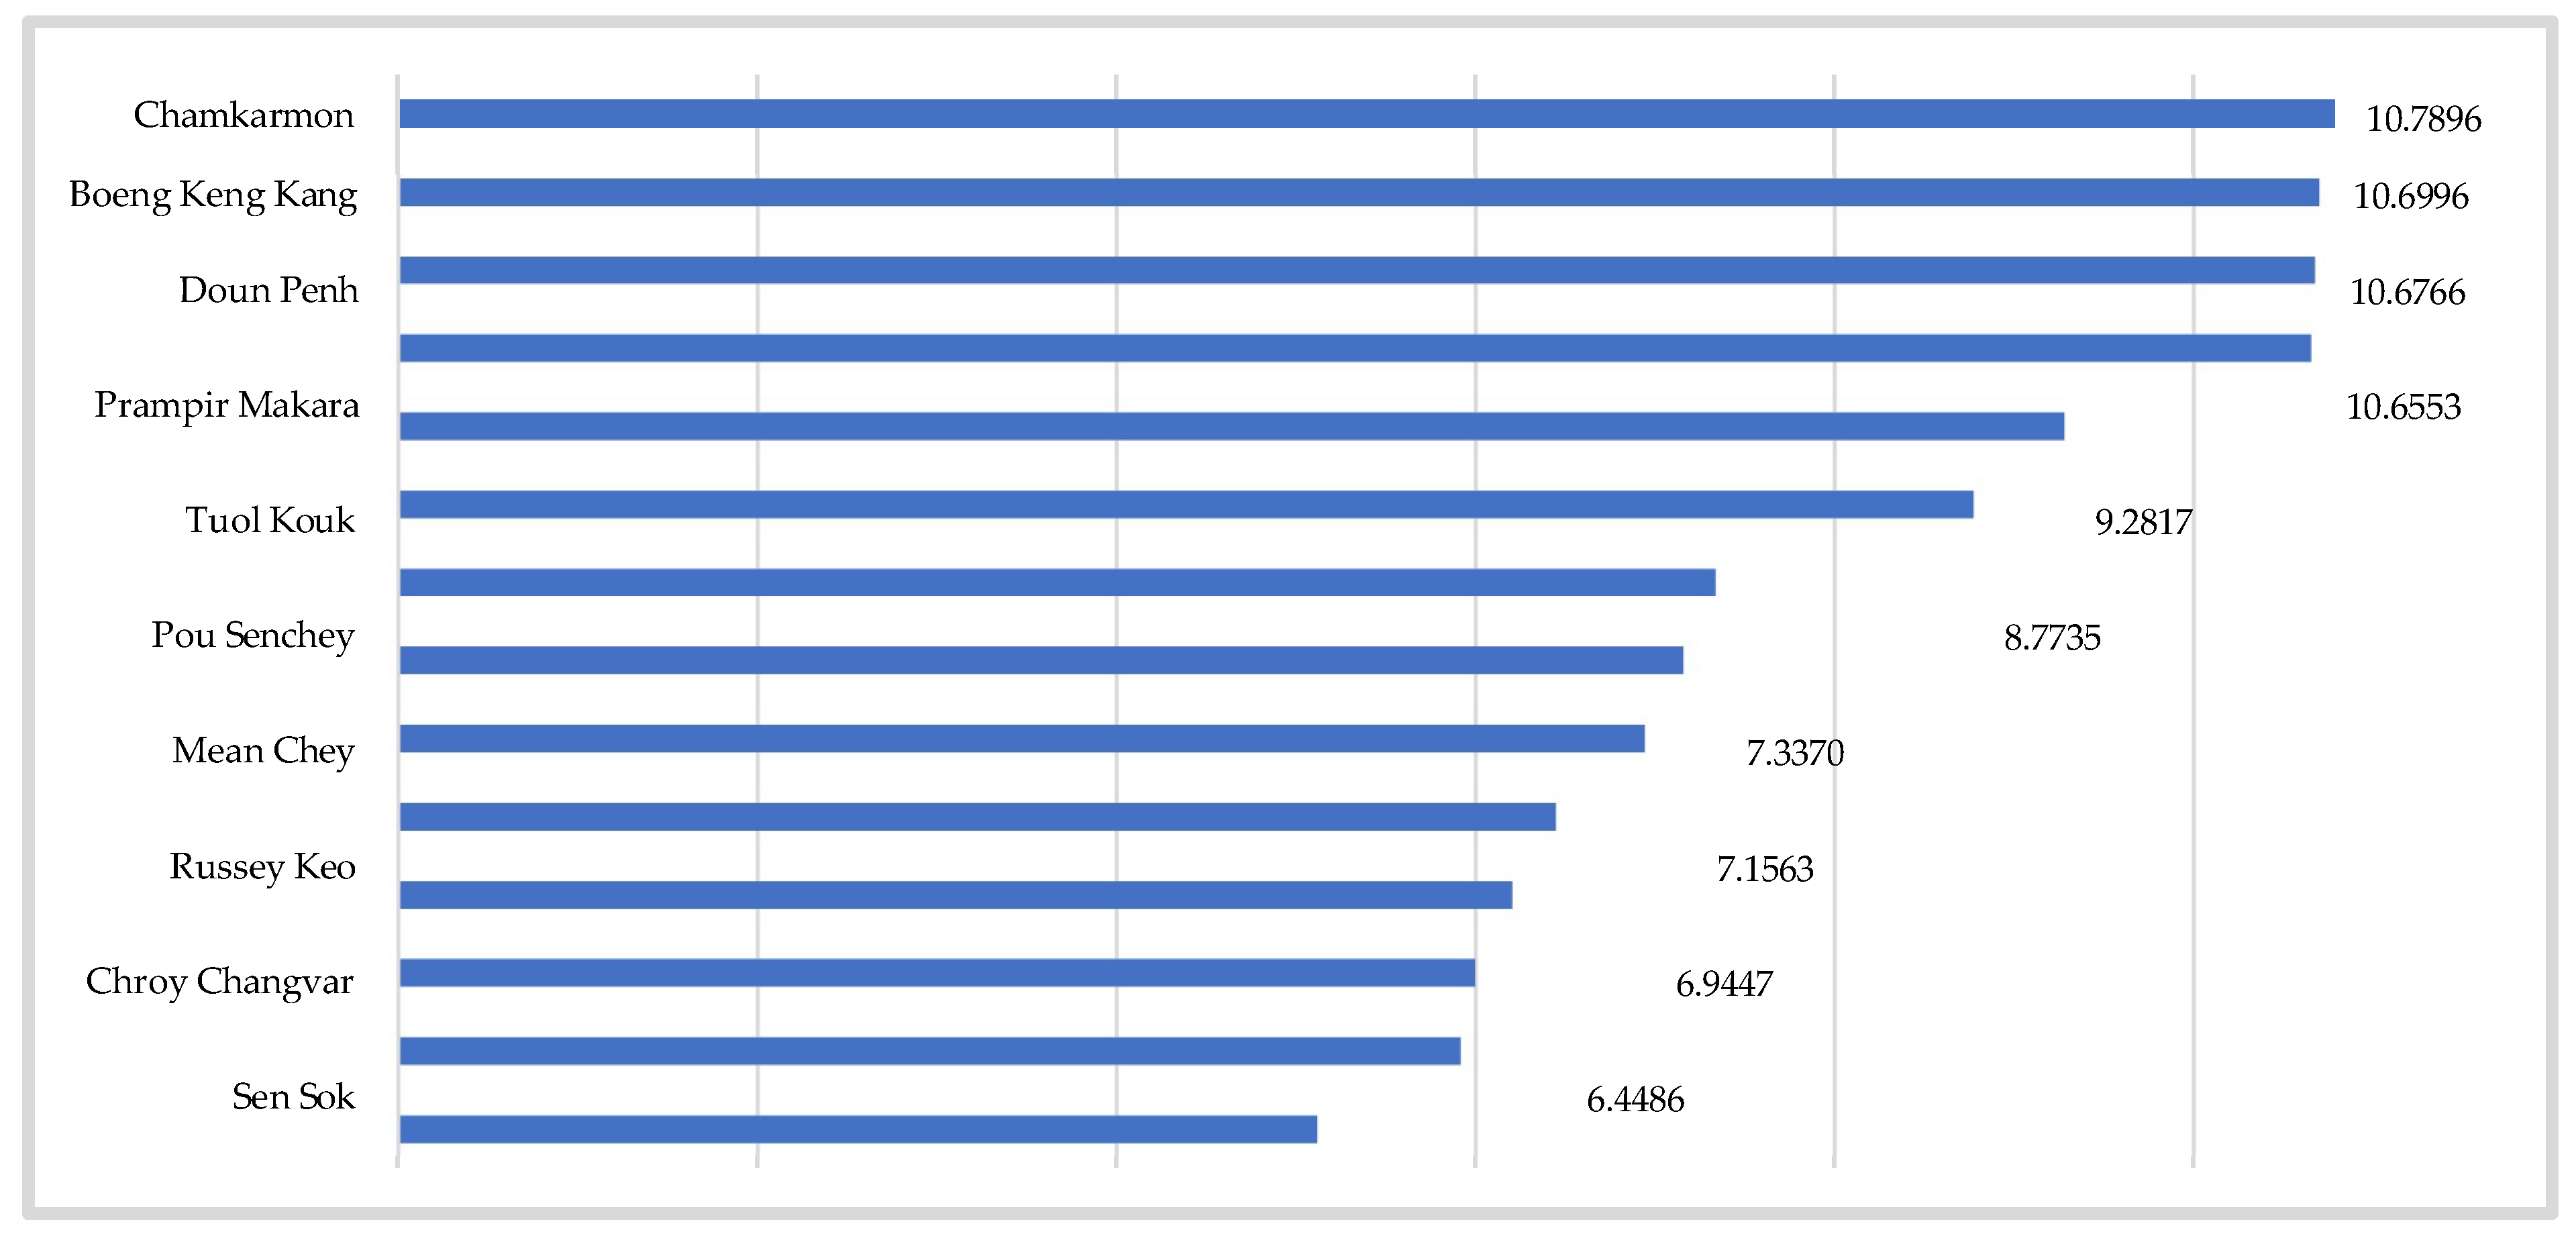
Figure 15.
Urban social sustainability assessment results of Chamkarmon and Doun Penh districts.
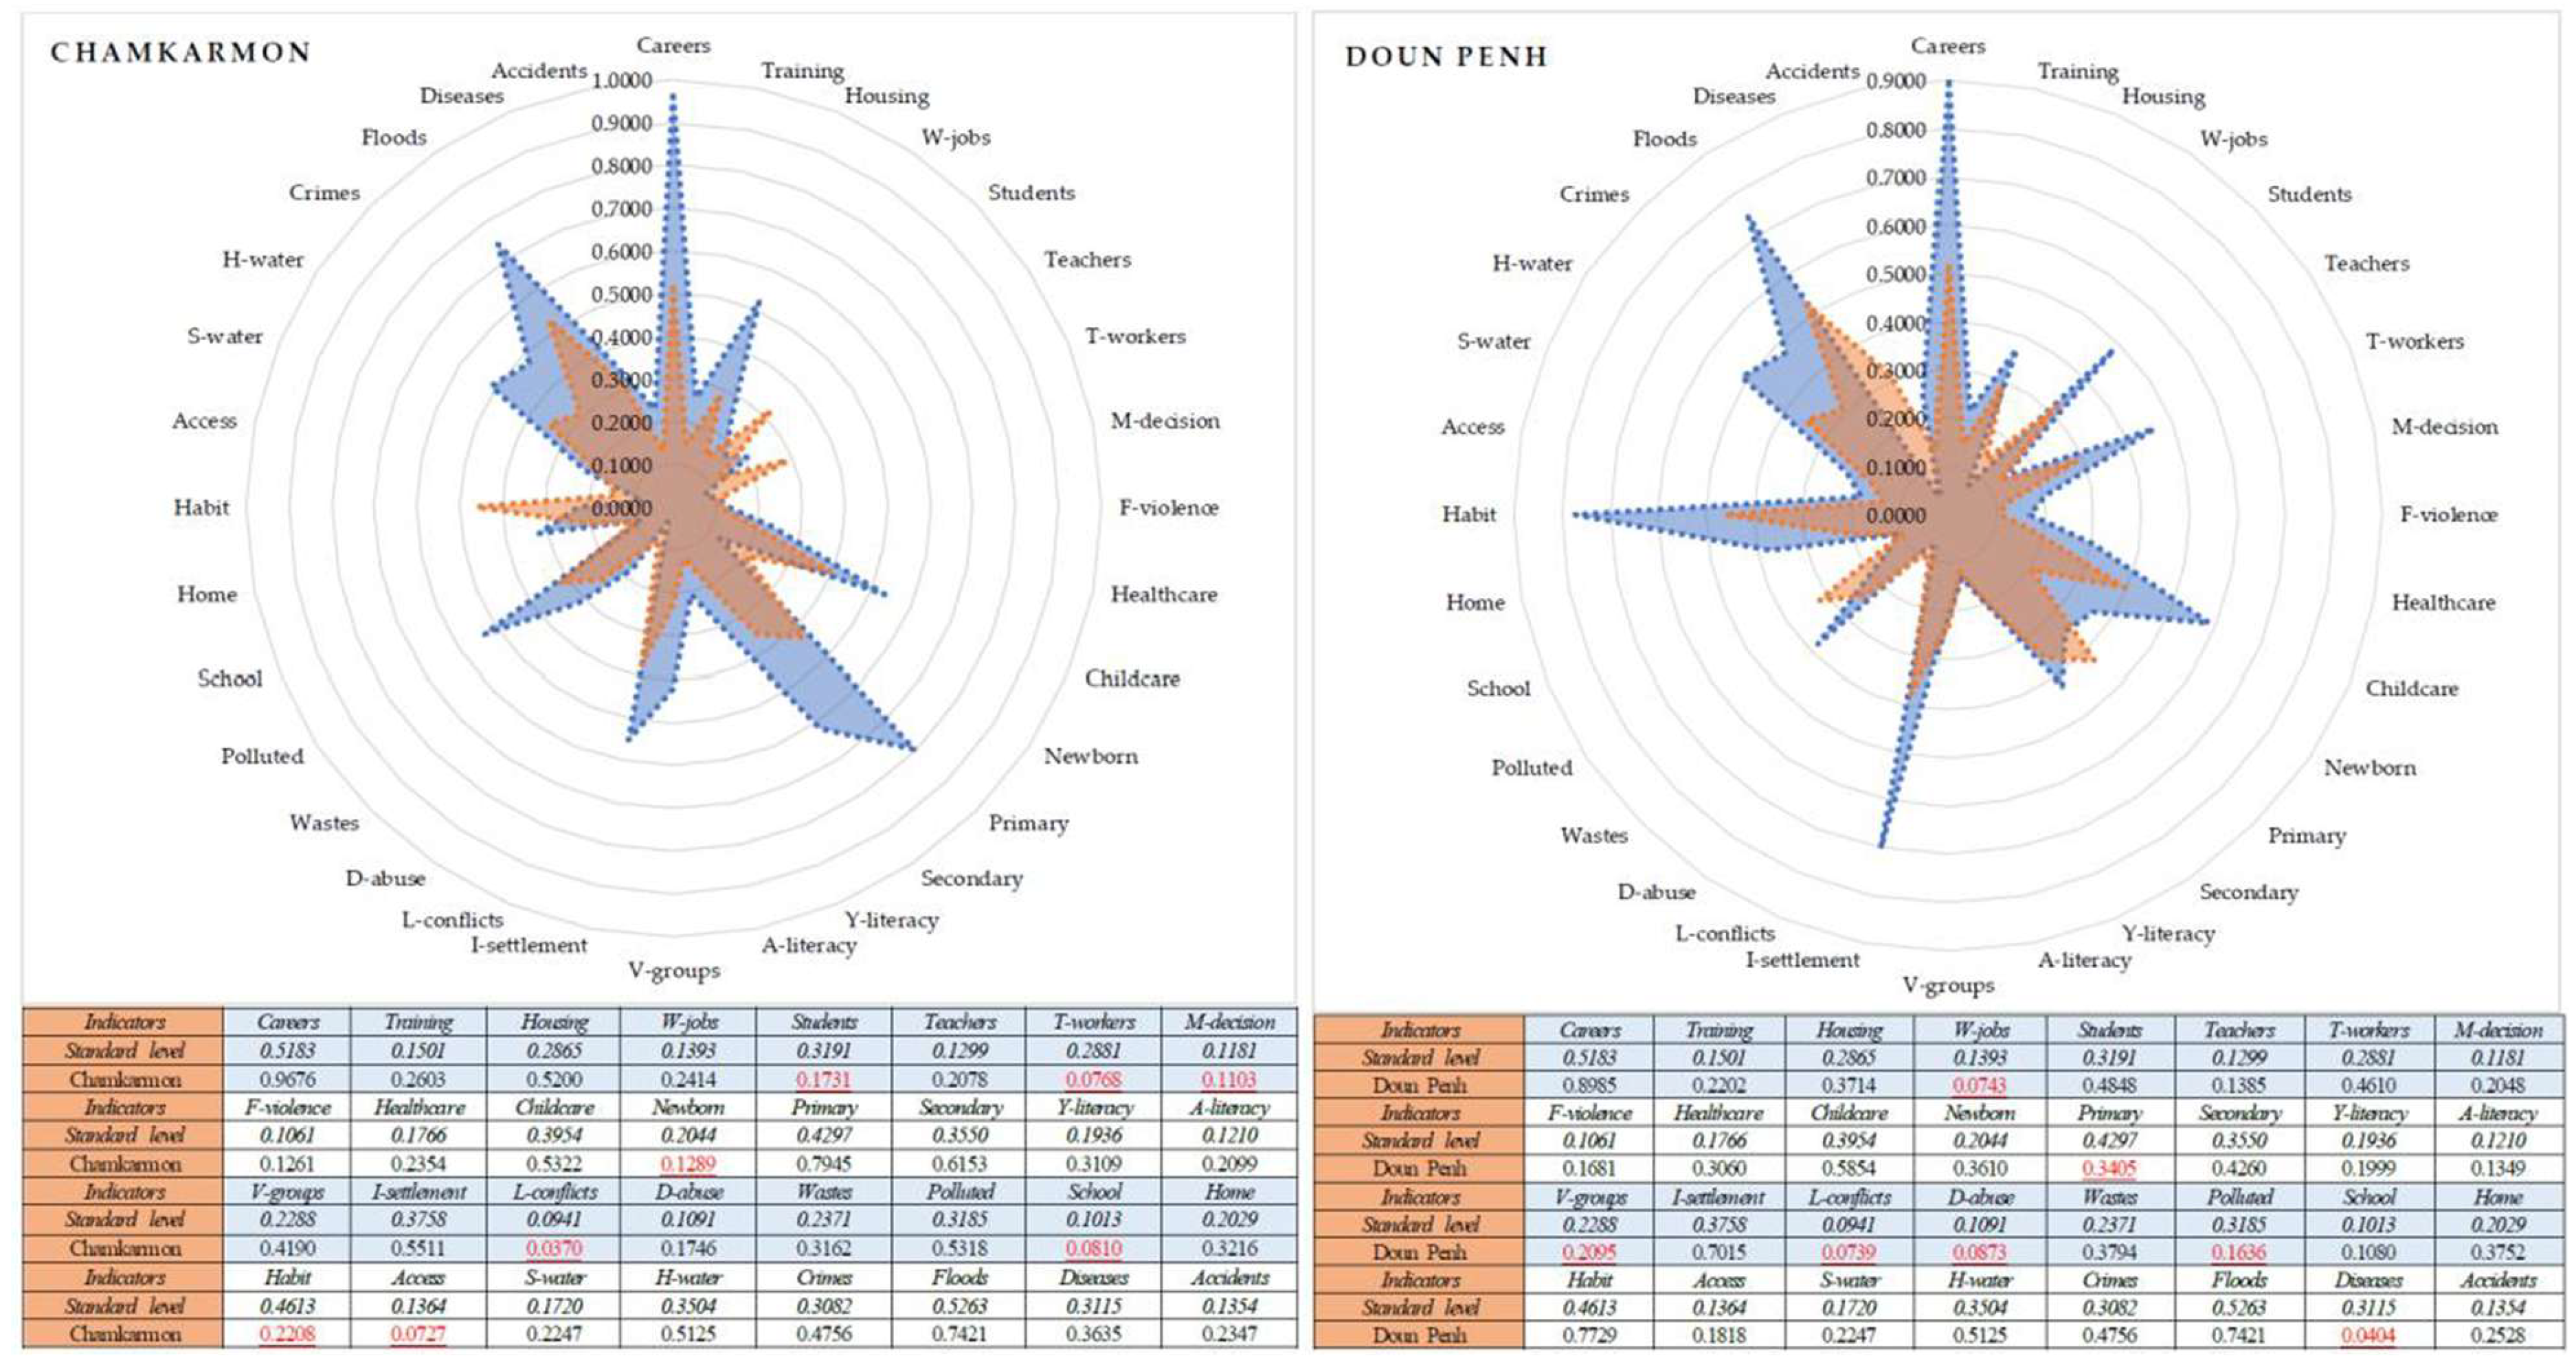
Figure 16.
Urban social sustainability assessment results of Prampir Makara and Tuol Kouk districts.
Figure 16.
Urban social sustainability assessment results of Prampir Makara and Tuol Kouk districts.
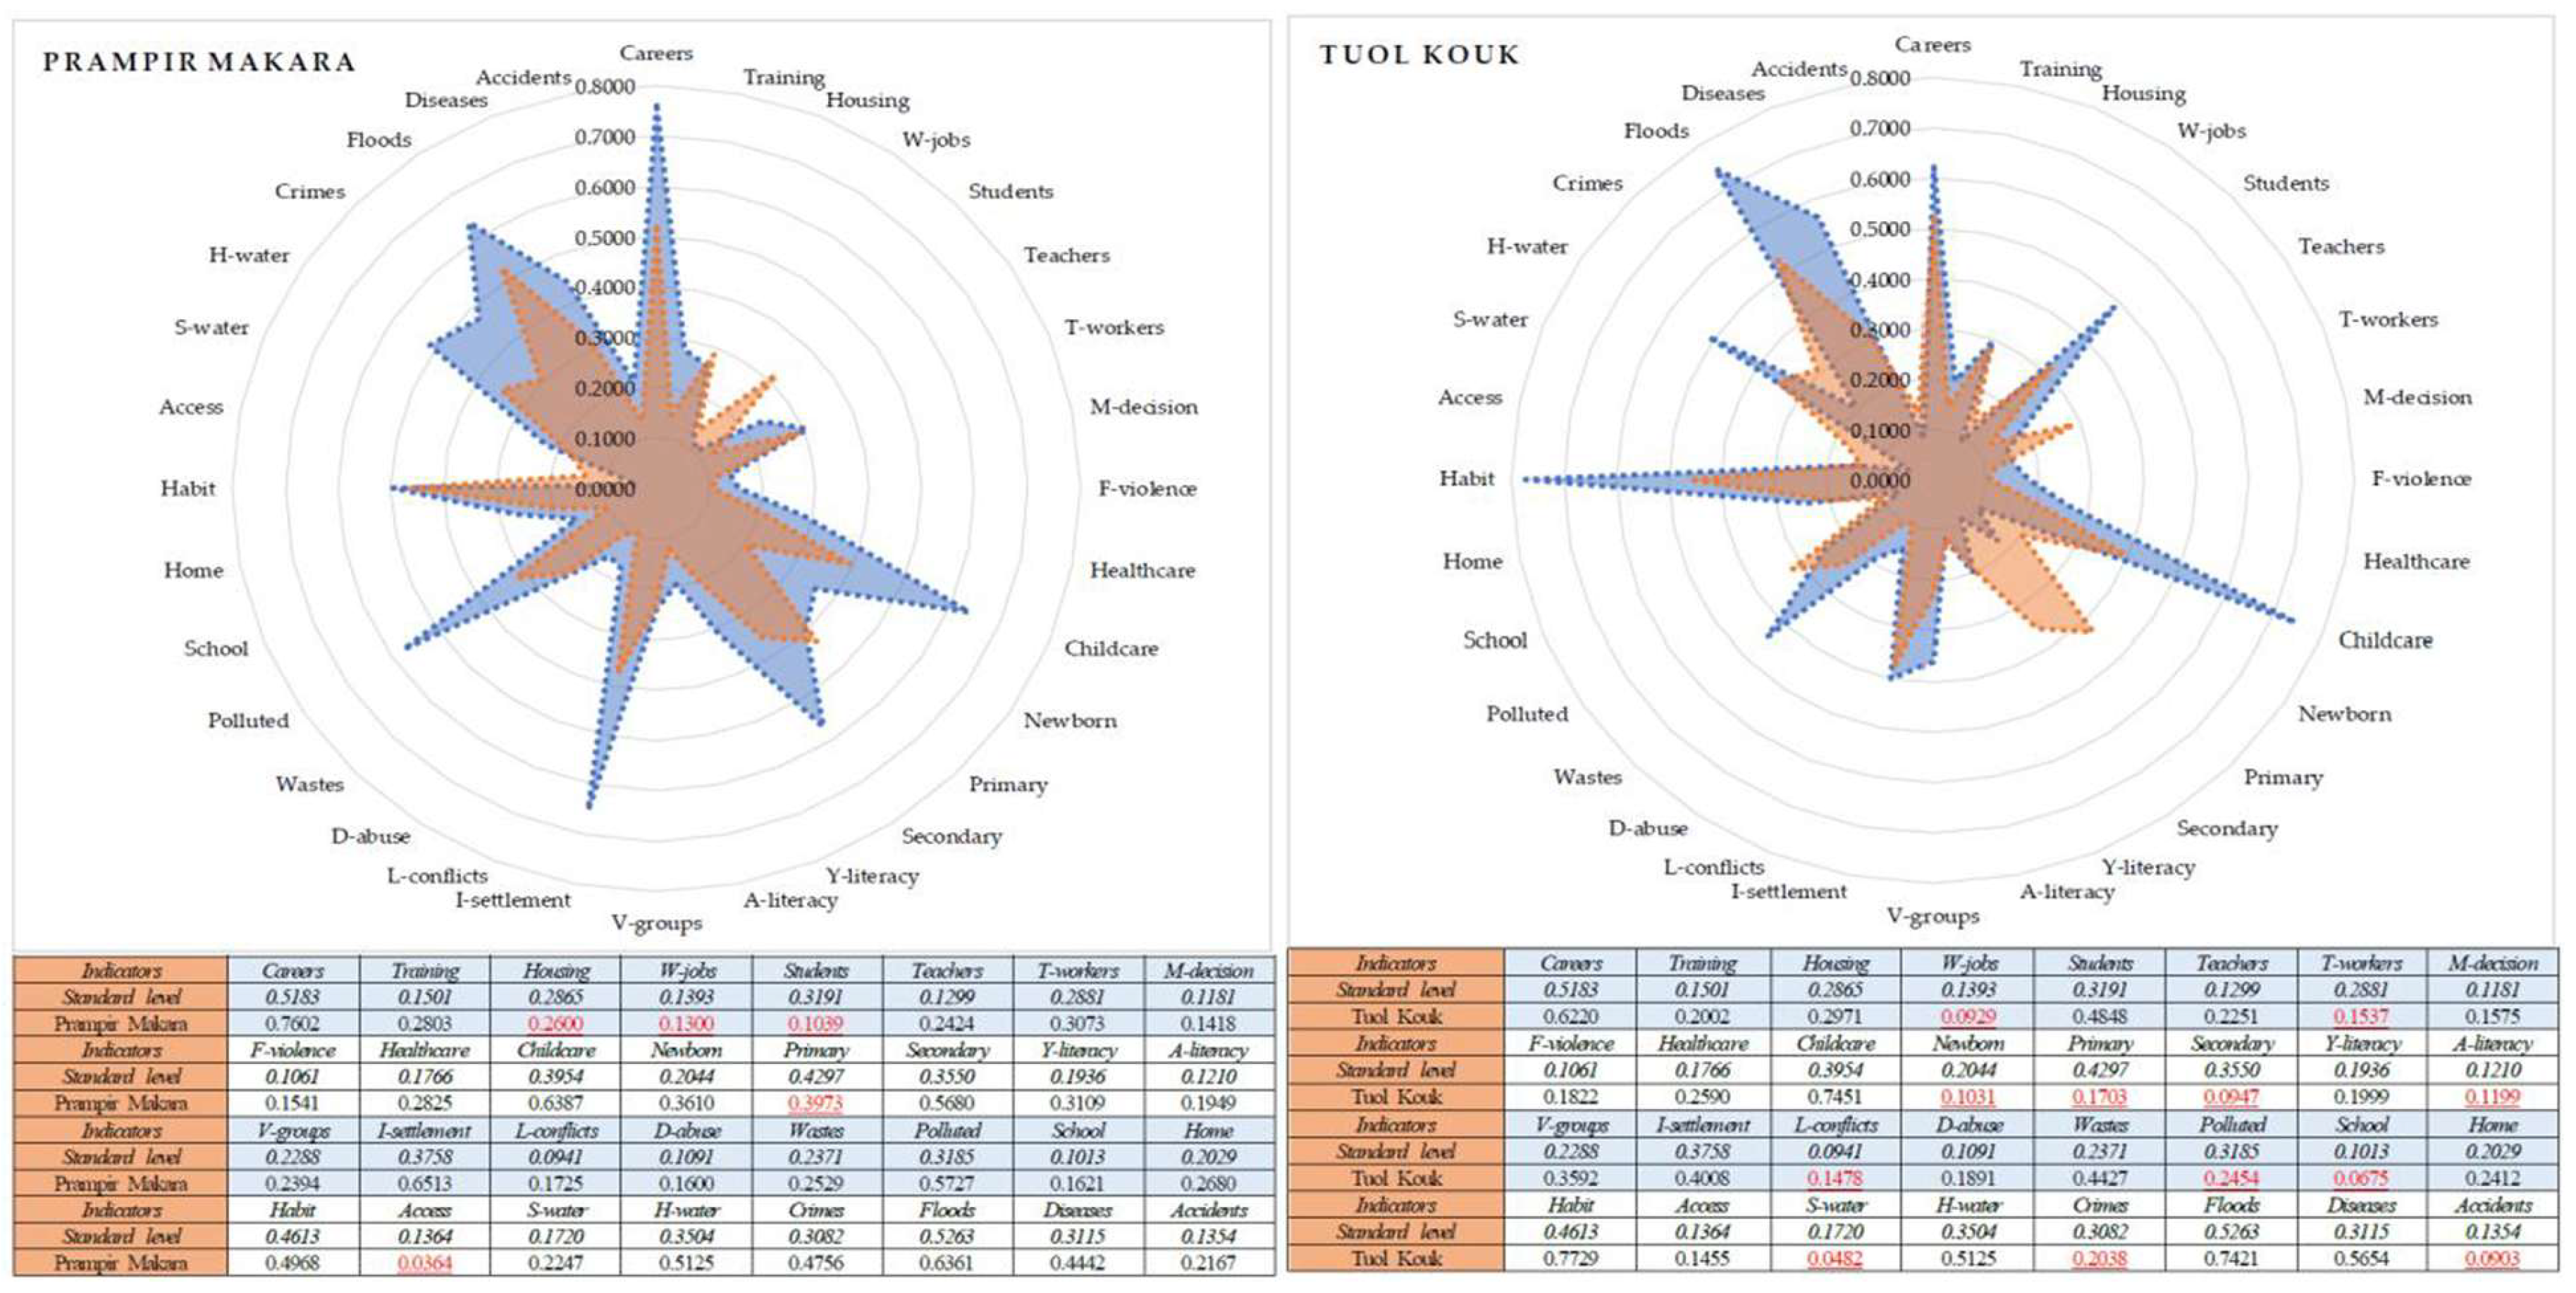
Figure 17.
Urban social sustainability assessment results of Dangkao and Mean Chey districts.
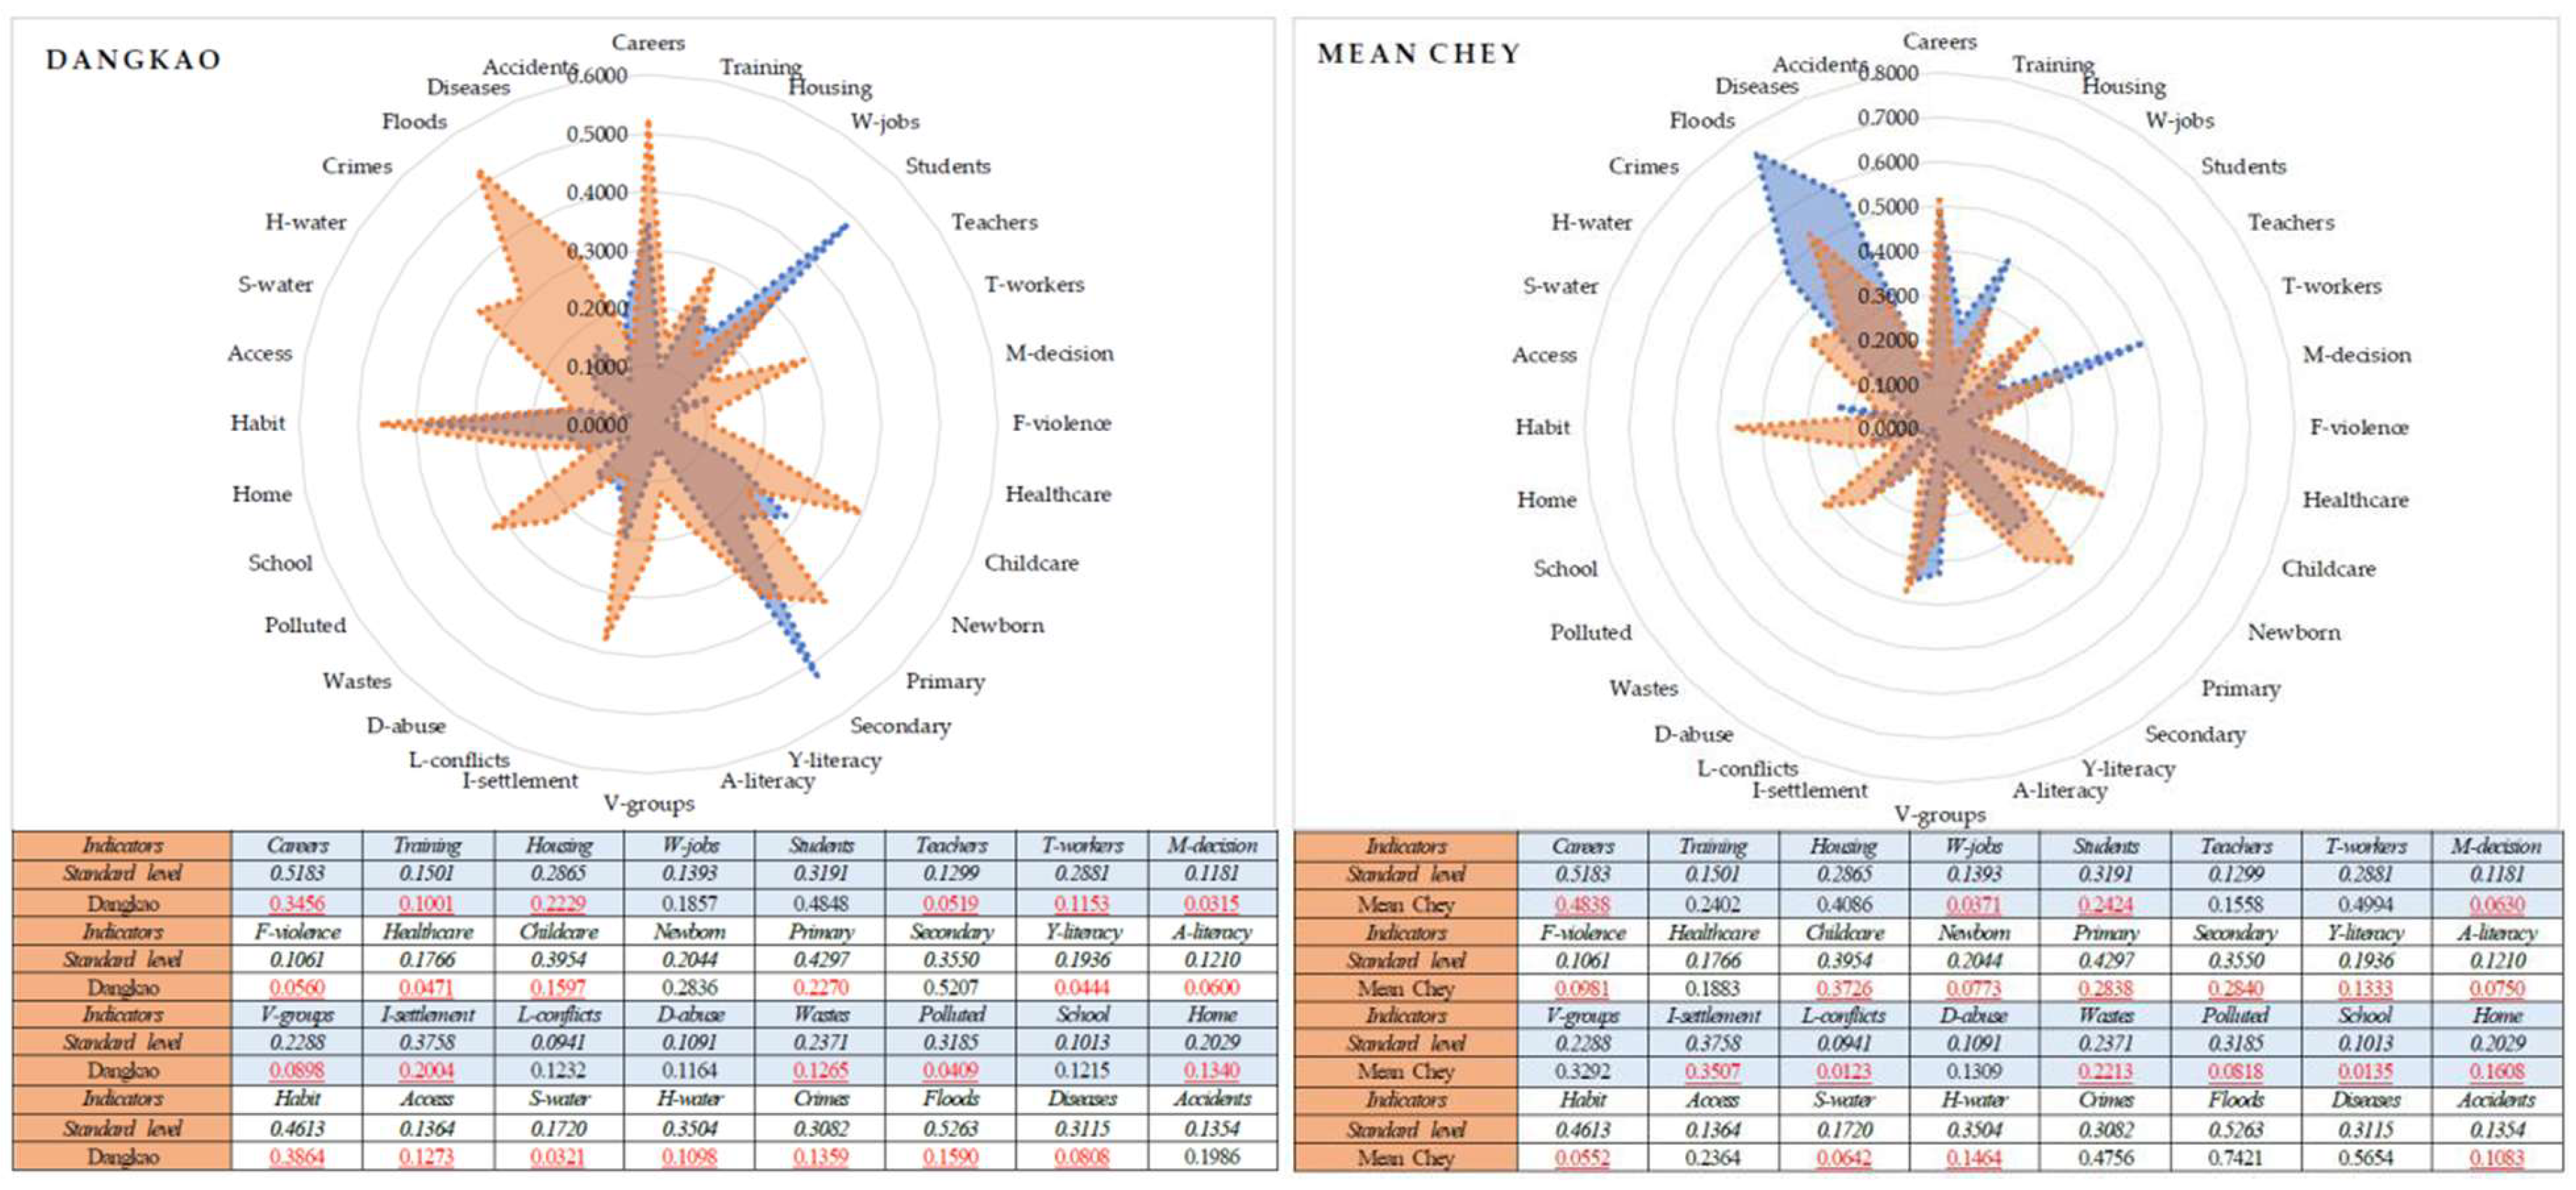
Figure 18.
Urban social sustainability assessment results of Russey Keo and Sen Sok districts.
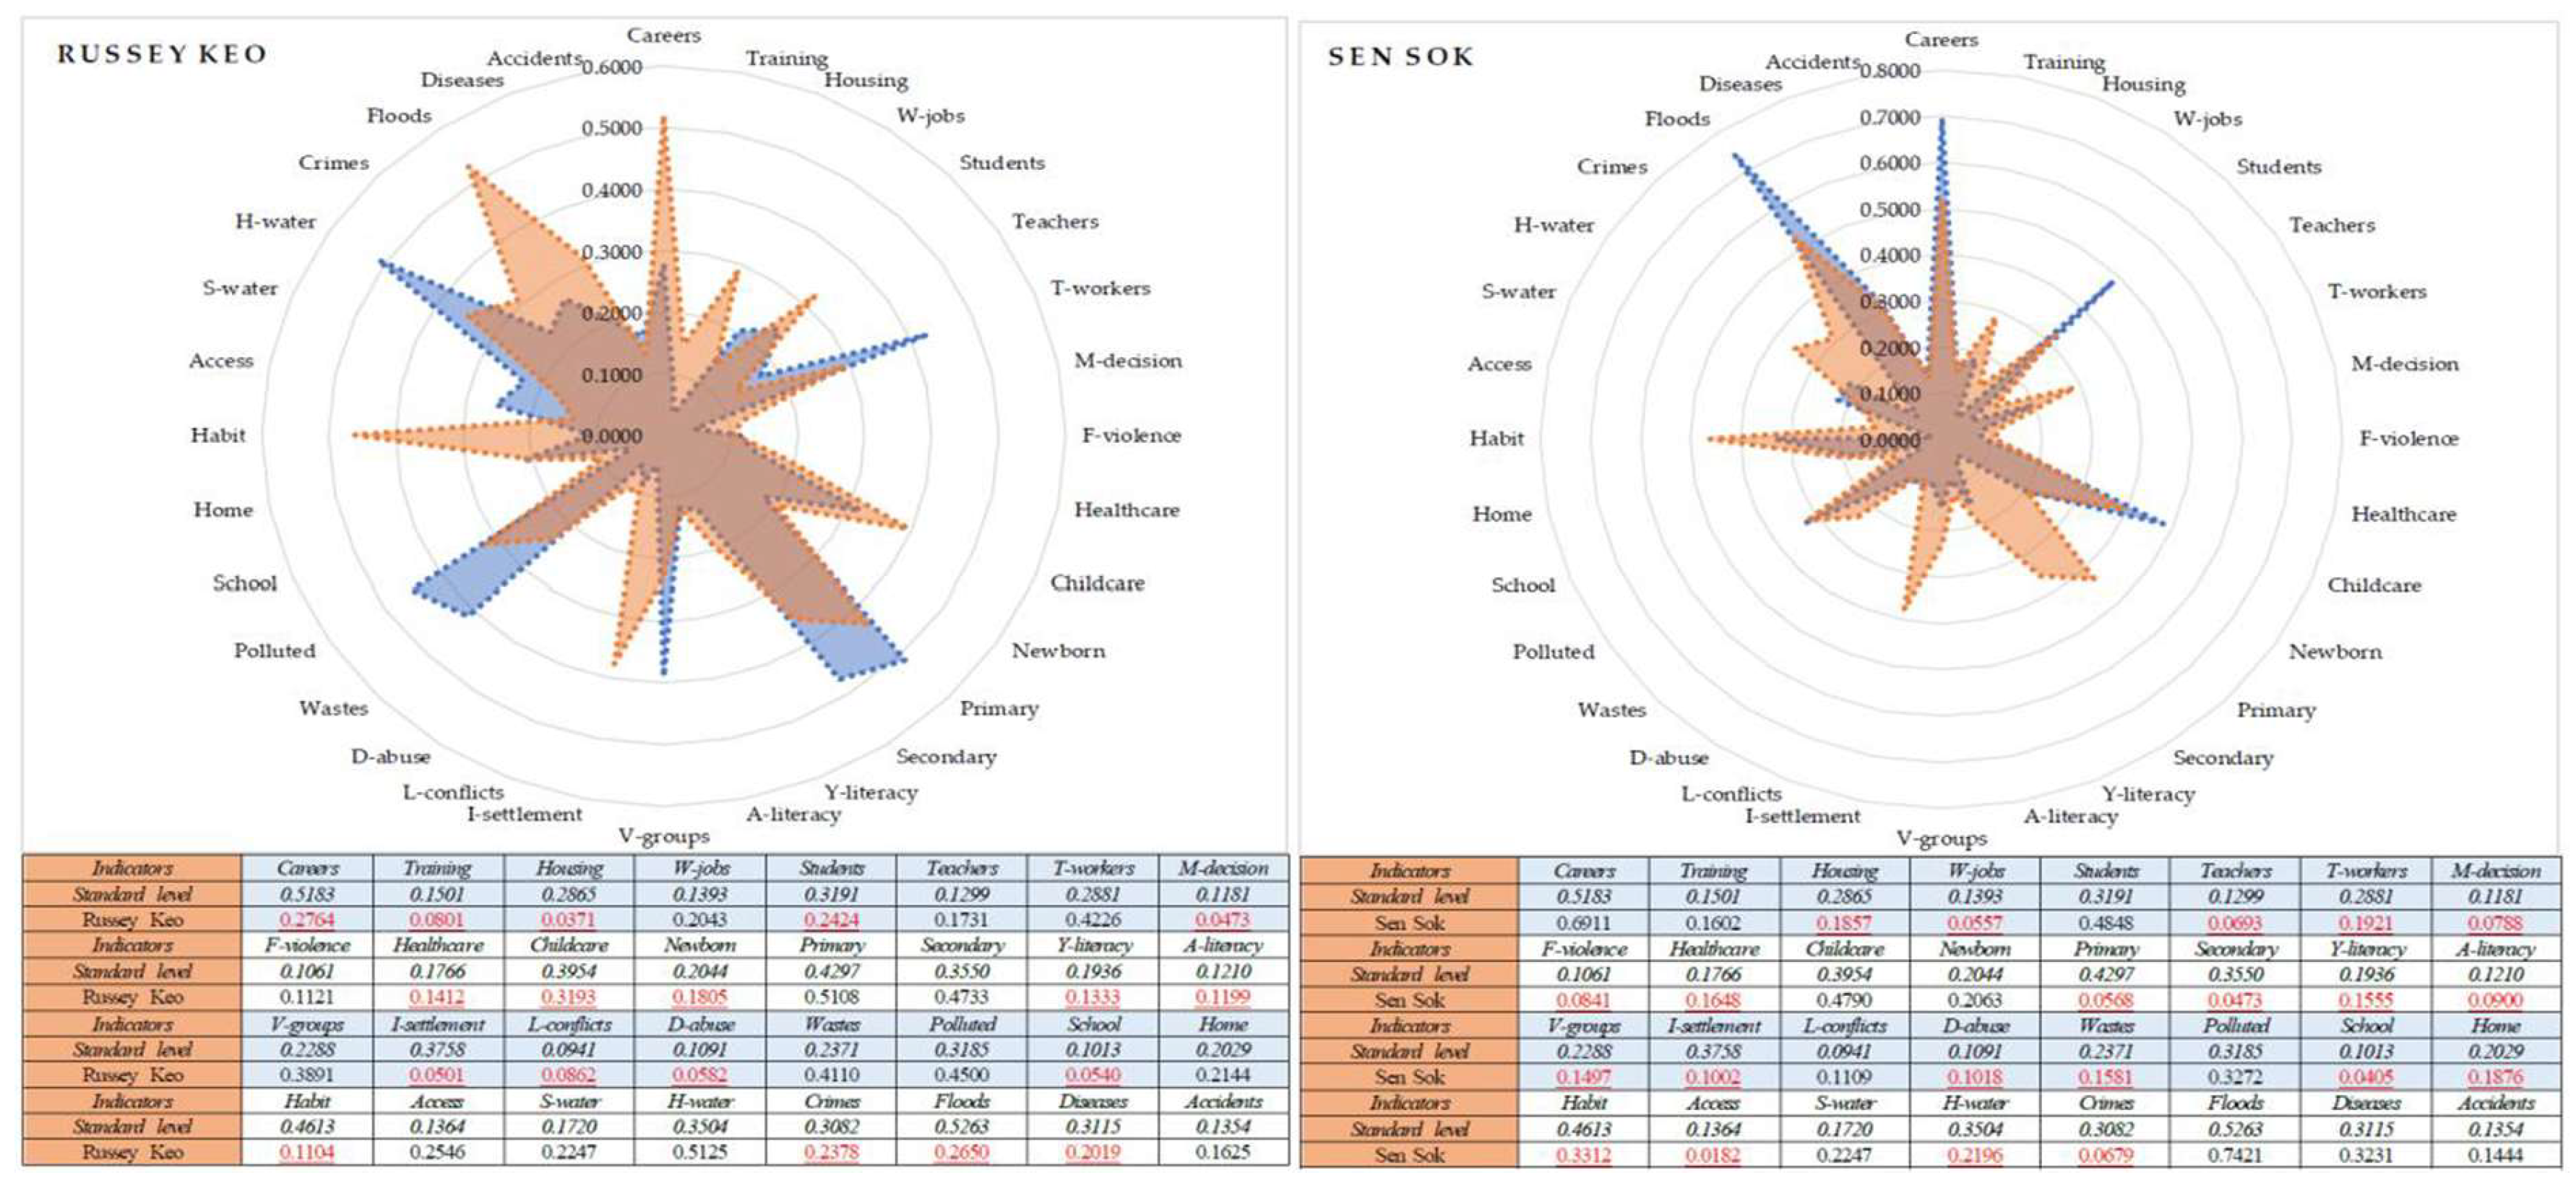
Figure 19.
Urban social sustainability assessment results of Pou Senchey and Chroy Changvar districts.
Figure 19.
Urban social sustainability assessment results of Pou Senchey and Chroy Changvar districts.
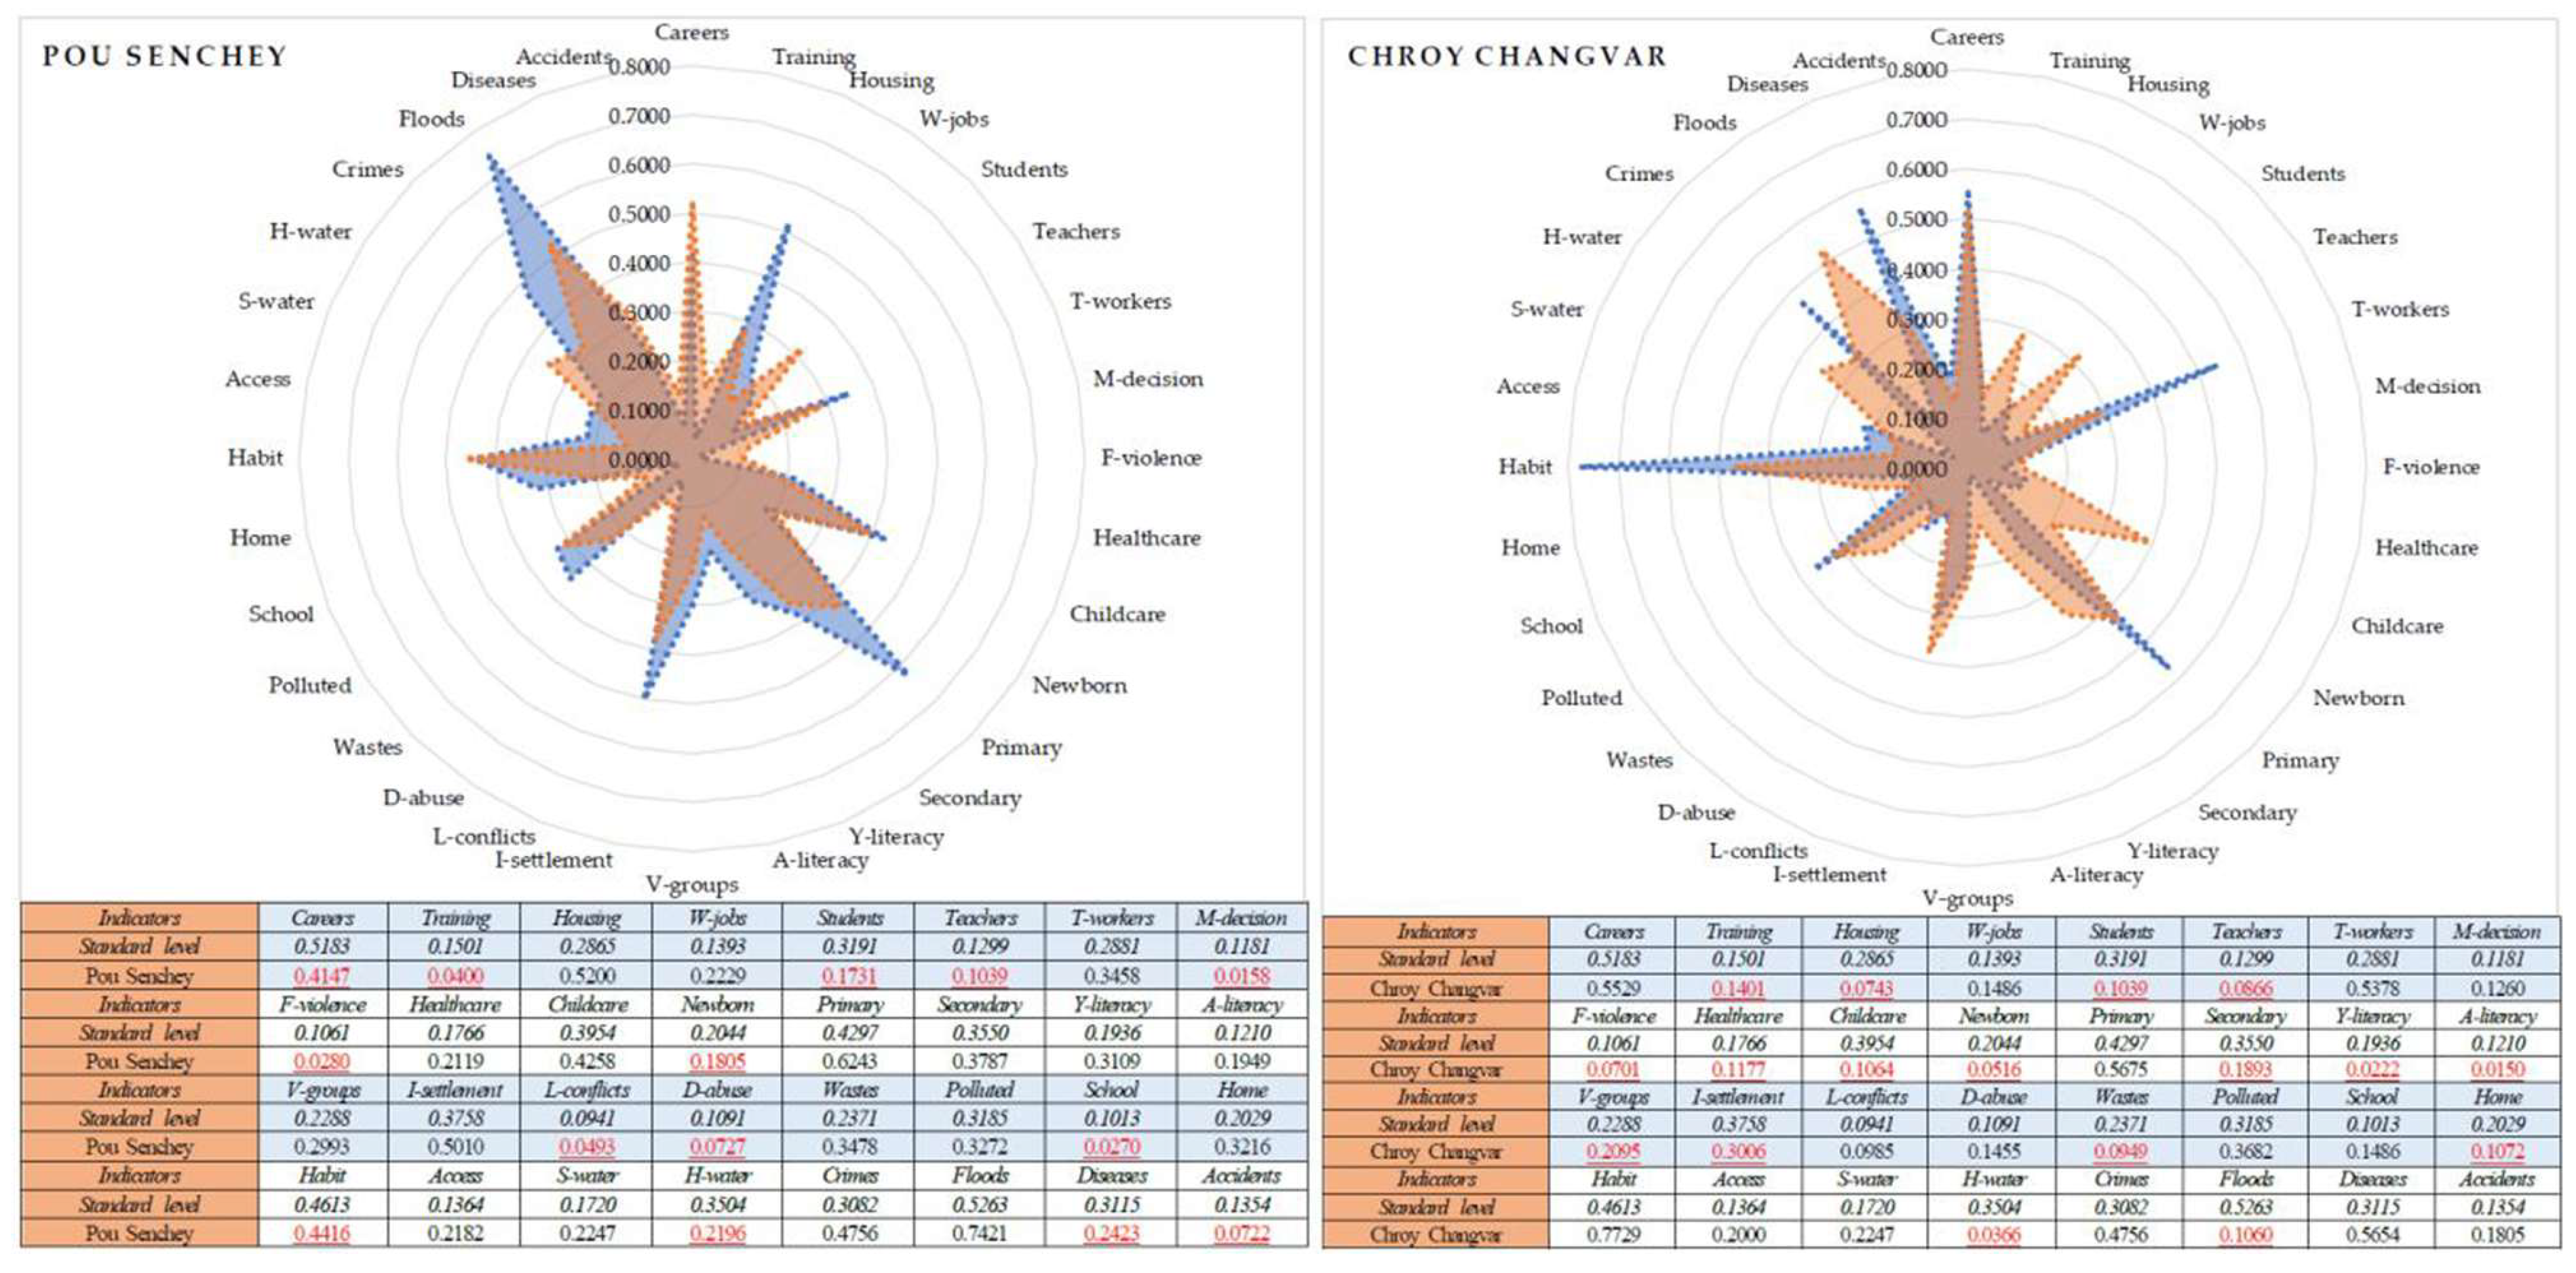
Figure 20.
Urban social sustainability assessment results of Prek Pnov and Chbar Ampov districts.
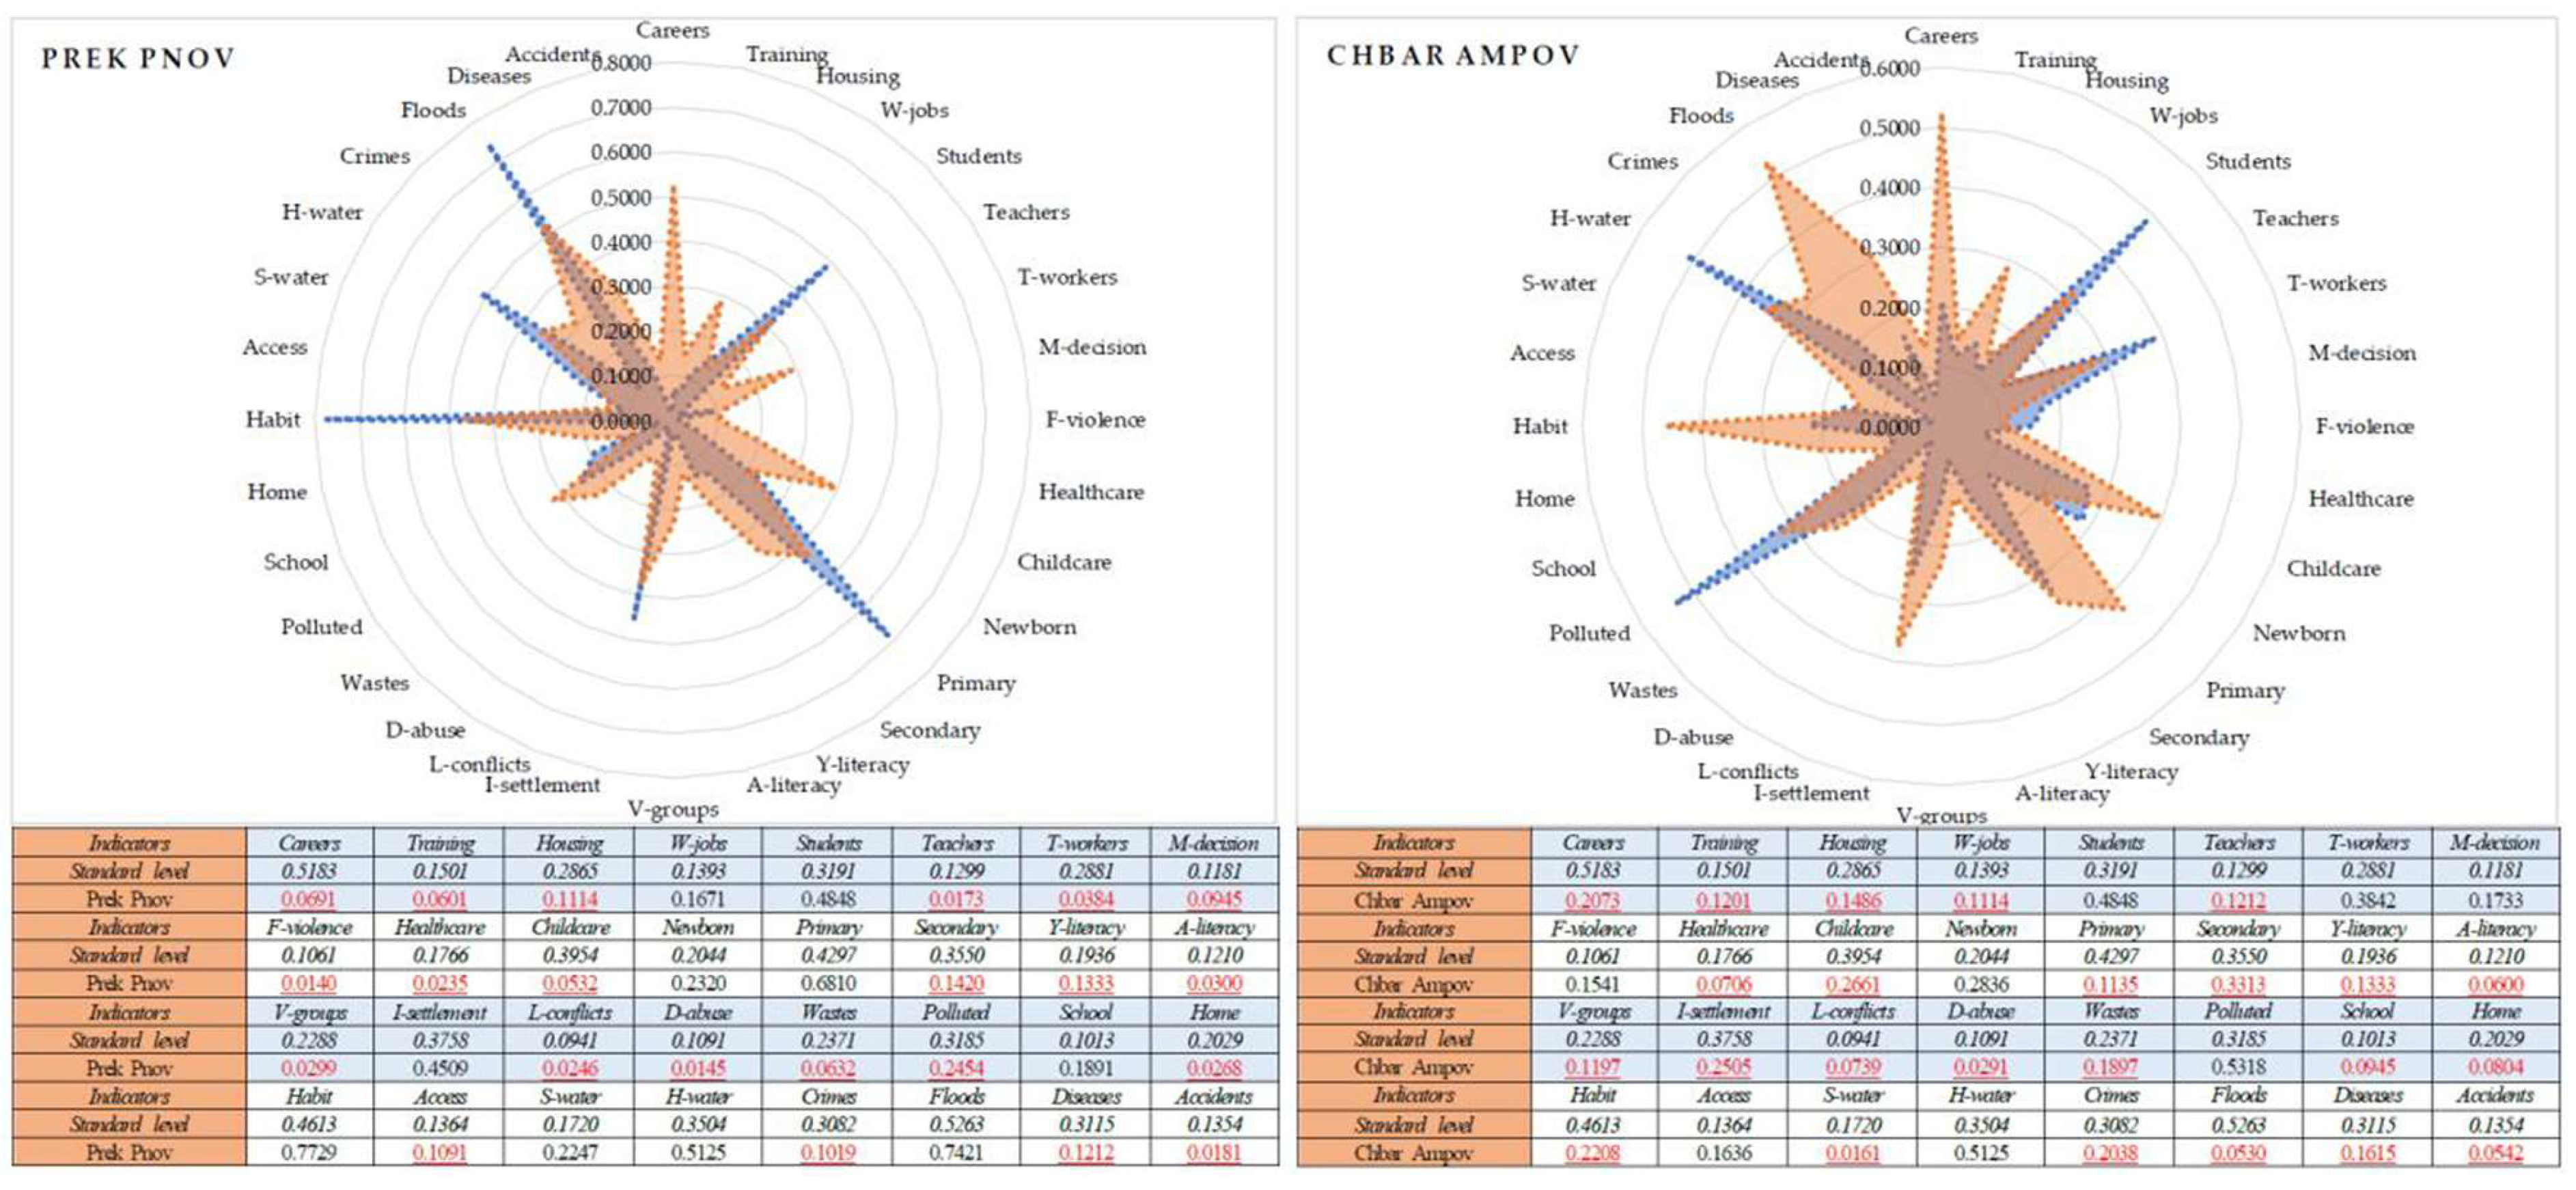
Figure 21.
Urban social sustainability assessment results of Boeng Keng Kang and Kamboul districts.
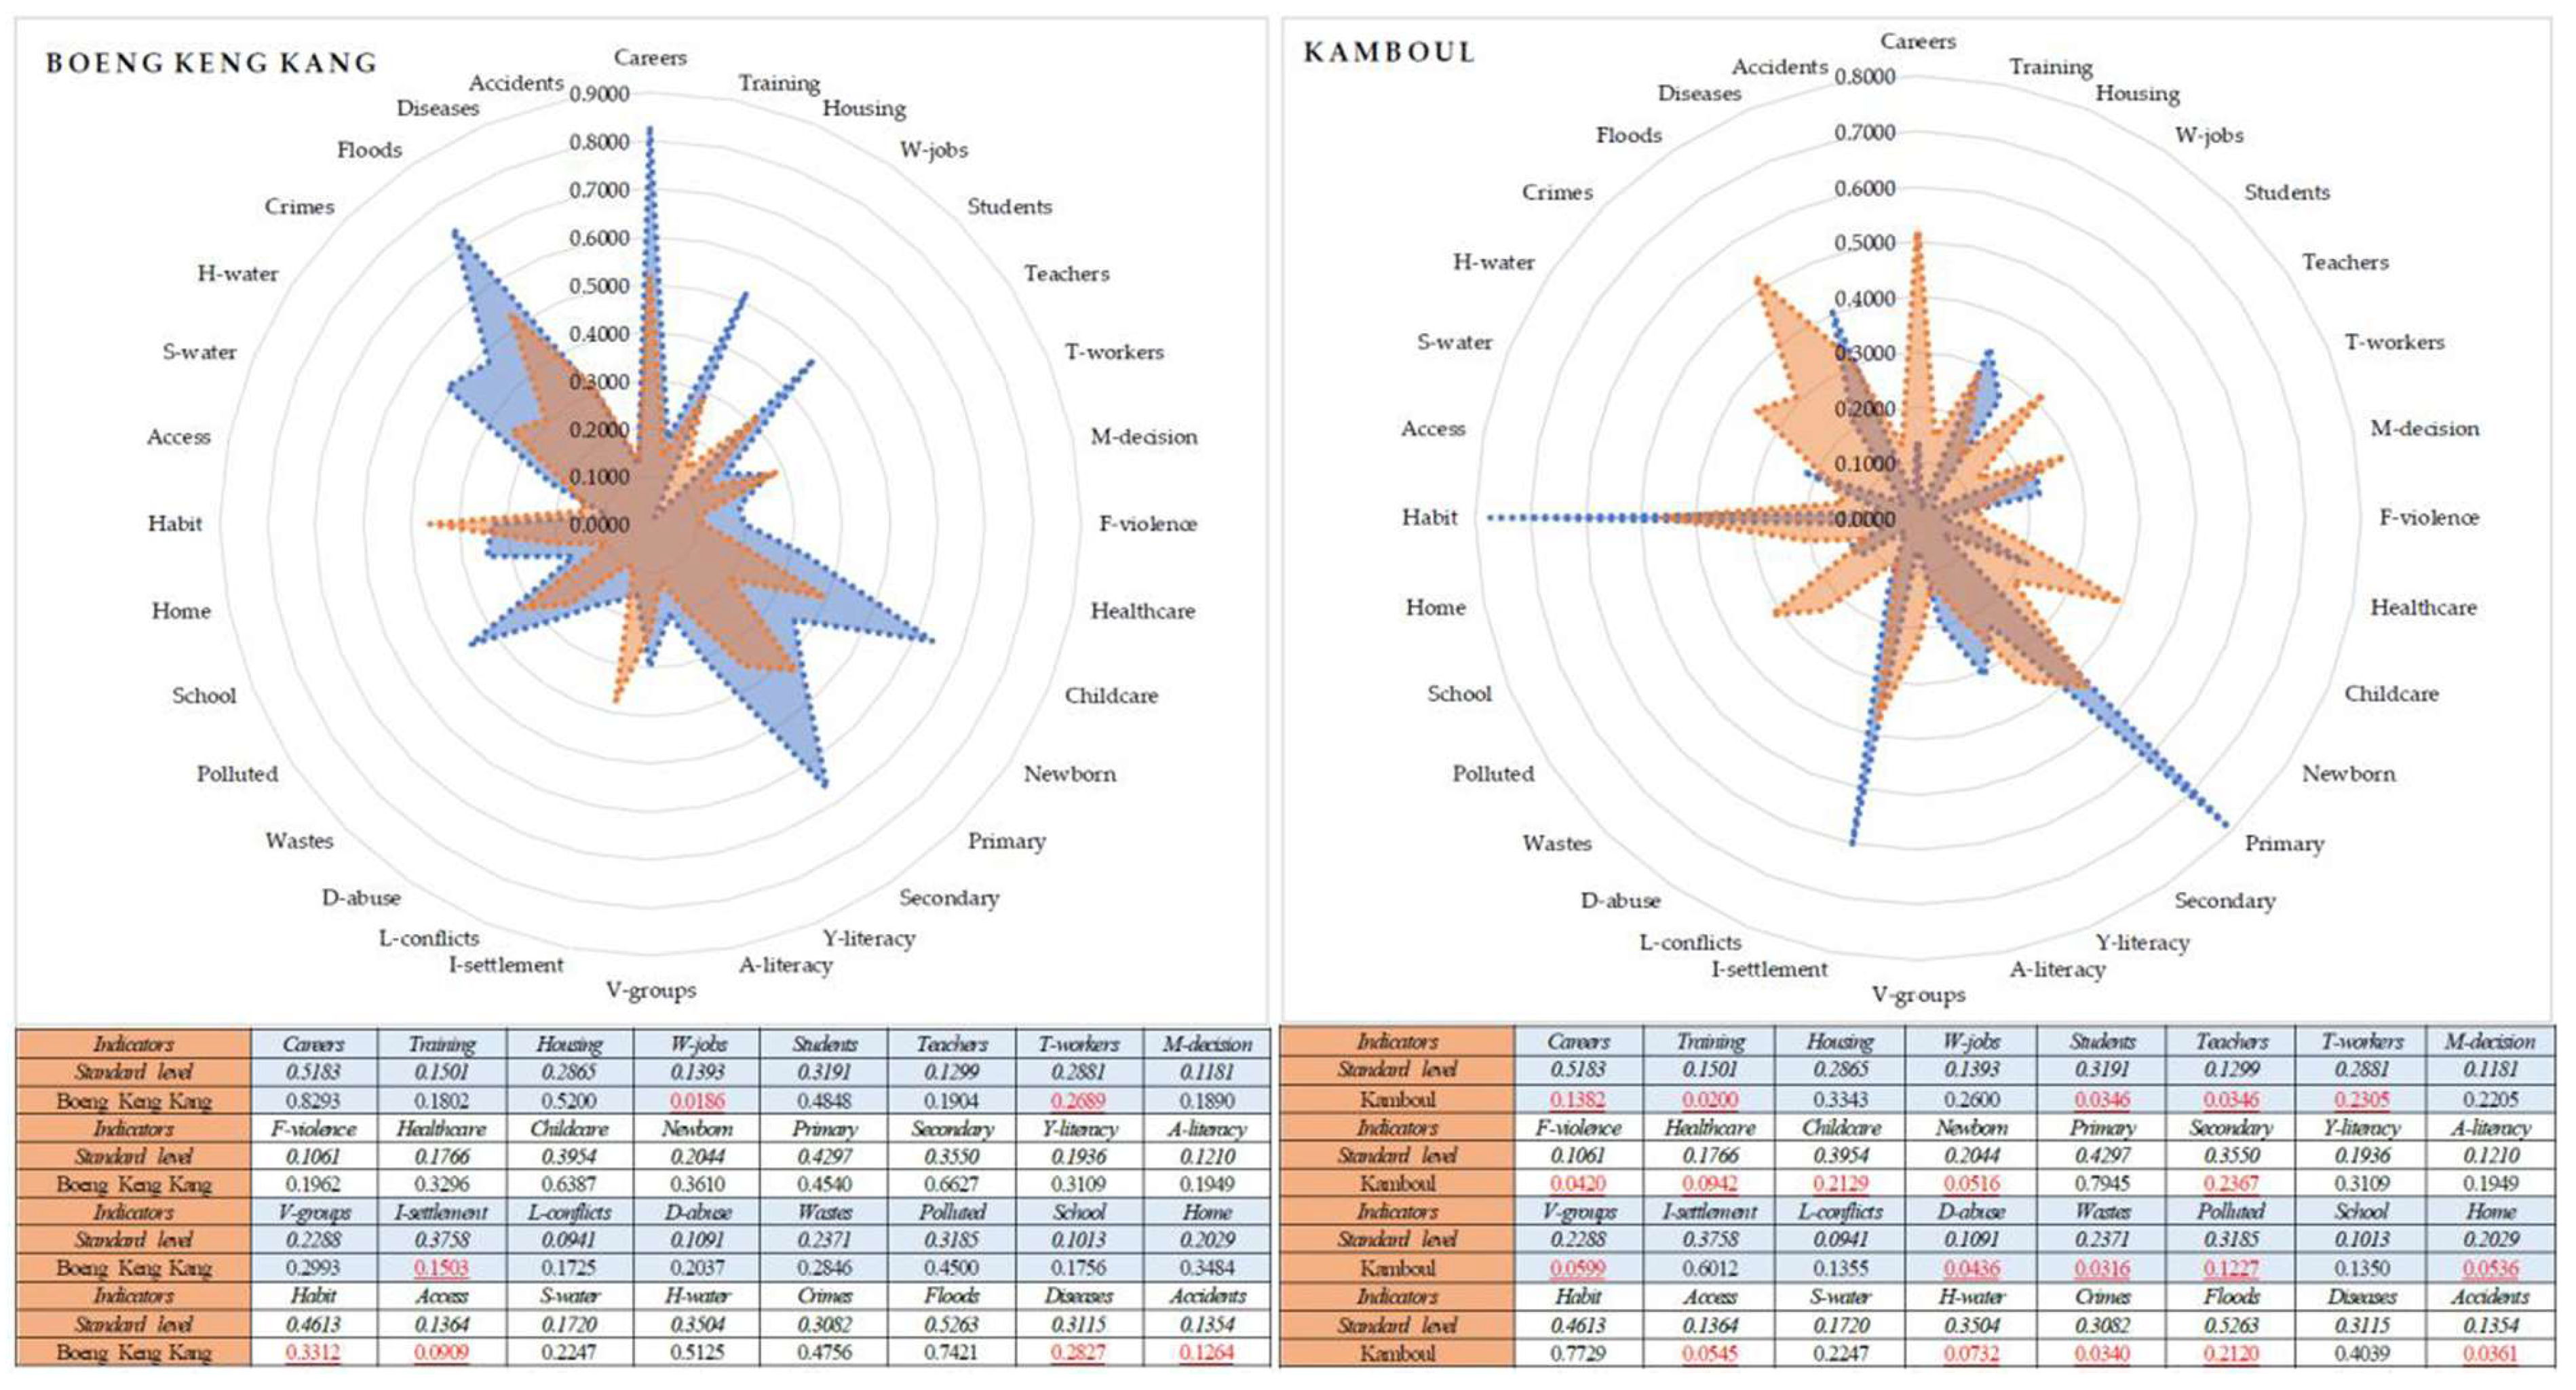

Table 1.
Urban social sustainability assessment indicators.
| No. | Reviewed Indicators | Shortened | Category |
| 1 | Ratio of employees in production and services per 1000 population | Careers | Income |
| 2 | Ratio of populations with vocational training per 1000 population | Training | |
| 3 | Percentage of households living in poor-quality houses | Housing | |
| 4 | Percentage of main and secondary jobs by Women (nonagricultural) | W-jobs | |
| 5 | Ratio of female students to male students at high schools and universities | Students | Gender |
| 6 | Percentage of female teachers who taught at primary and secondary schools | Teachers | |
| 7 | Ratio of Technical female workers to total employees in production and services | T-workers | |
| 8 | Percentage of commune/district council members (Making-decision) as women | M-decision | |
| 9 | Ratio of the number of households (Families) with violence per 1000 households | F-violence | Welfare |
| 10 | Ratio of pharmacies and clinics per 100,000 population | Healthcare | |
| 11 | Percentage of children joined childcare/kindergarten (aged 3–5) | Childcare | |
| 12 | Ratio of under-five mortality per 1000 births | Newborn | |
| 13 | Percentage of children enrolled at primary schools (aged 6–11) | Primary | Education |
| 14 | Percentage of children enrolled at secondary schools (aged 12–14) | Secondary | |
| 15 | Percentage of illiterate Youth (aged 15–24) | Y-literacy | |
| 16 | Percentage of illiterate Adults and middle-aged groups (25–45) | A-literacy | |
| 17 | Ratio of Vulnerable groups/people per 1000 population | V-groups | Vulnerability |
| 18 | Ratio of households Informally settled/living on public land per 1000 households | I-settlement | |
| 19 | Ratio of Land conflict cases per 1000 households | L-conflicts | |
| 20 | Ratio of households having Drug-abuse members per 1000 households | D-abuse | |
| 21 | Percentage of households accessible to waste collection services | Wastes | Sanitation |
| 22 | Percentage of households affected by environmental pollution | Polluted | |
| 23 | Ratio of schools that installed proper toilets per 100 students | School | |
| 24 | Percentage of households that installed proper toilets | Home | |
| 25 | Percentage of households with potable water consuming habits | Habit | Water |
| 26 | Percentage of households located close to water sources (less than 150 m) | Access | |
| 27 | Percentage of Schools having potable water to use or drink | S-water | |
| 28 | Percentage of Households having potable water to use or drink | H-water | |
| 29 | Ratio of criminal cases per 100,000 population | Crimes | Safety |
| 30 | Ratio of households affected by floods per 1000 households | Floods | |
| 31 | Ratio of deaths by diseases per 100,000 population | Diseases | |
| 32 | Ratio of deaths by traffic accidents per 100,000 population | Accidents |
Table 2.
Relative weights of urban social sustainability assessment indicators.
| Section | Weight | Indicator | Weight | Priority Weight | Rank |
| Income | 0.1448 | Careers | 0.4771 | 0.0691 | 1 |
| Training | 0.1382 | 0.0200 | 21 | ||
| Housing | 0.2564 | 0.0371 | 11 | ||
| W-jobs | 0.1282 | 0.0186 | 22 | ||
| Gender | 0.1061 | Students | 0.3263 | 0.0346 | 13 |
| Teachers | 0.1632 | 0.0173 | 25 | ||
| T-workers | 0.3620 | 0.0384 | 10 | ||
| M-decision | 0.1485 | 0.0158 | 27 | ||
| Welfare | 0.1166 | F-violence | 0.1202 | 0.0140 | 30 |
| Healthcare | 0.2020 | 0.0235 | 19 | ||
| Childcare | 0.4566 | 0.0532 | 4 | ||
| Newborn | 0.2212 | 0.0258 | 18 | ||
| Education | 0.1413 | Primary | 0.4017 | 0.0568 | 2 |
| Secondary | 0.3350 | 0.0473 | 7 | ||
| Y-literacy | 0.1572 | 0.0222 | 20 | ||
| A-literacy | 0.1061 | 0.0150 | 28 | ||
| Vulnerability | 0.1069 | V-groups | 0.2800 | 0.0299 | 16 |
| I-settlement | 0.4687 | 0.0501 | 6 | ||
| L-conflicts | 0.1152 | 0.0123 | 32 | ||
| D-abuse | 0.1361 | 0.0145 | 29 | ||
| Sanitation | 0.1128 | Wastes | 0.2802 | 0.0316 | 15 |
| Polluted | 0.3625 | 0.0409 | 8 | ||
| School | 0.1197 | 0.0135 | 31 | ||
| Home | 0.2375 | 0.0268 | 17 | ||
| Water | 0.1260 | Habit | 0.4380 | 0.0552 | 3 |
| Access | 0.1443 | 0.0182 | 23 | ||
| S-water | 0.1274 | 0.0161 | 26 | ||
| H-water | 0.2904 | 0.0366 | 12 | ||
| Safety | 0.1454 | Crimes | 0.2336 | 0.0340 | 14 |
| Floods | 0.3645 | 0.0530 | 5 | ||
| Diseases | 0.2777 | 0.0404 | 9 | ||
| Accidents | 0.1242 | 0.0181 | 24 | ||
| Total | 1.0000 | - | 8.0000 | 1.0000 | - |
Disclaimer/Publisher’s Note: The statements, opinions and data contained in all publications are solely those of the individual author(s) and contributor(s) and not of MDPI and/or the editor(s). MDPI and/or the editor(s) disclaim responsibility for any injury to people or property resulting from any ideas, methods, instructions or products referred to in the content. |
© 2025 by the authors. Licensee MDPI, Basel, Switzerland. This article is an open access article distributed under the terms and conditions of the Creative Commons Attribution (CC BY) license (http://creativecommons.org/licenses/by/4.0/).
Copyright: This open access article is published under a Creative Commons CC BY 4.0 license, which permit the free download, distribution, and reuse, provided that the author and preprint are cited in any reuse.


