
Submitted:
23 December 2024
Posted:
24 December 2024
You are already at the latest version
Abstract
Tinnitus is a prevalent and distressing medical symptom, and no effective pharmacological treatment currently exists. Despite significant advances, tinnitus remains a scientific enigma. To explore the molecular underpinnings of tinnitus, we developed a noise-induced tinnitus model in mice and utilized metabolomics to identify key differences in metabolic pathways. Our results revealed that oxidative stress-related pathways, including glutathione (GSH) metabolism, were significantly enriched in the auditory cortex of mice exhibiting tinnitus-like behavior. To further explore the role of oxidative stress, we examined the involvement of nuclear factor erythroid 2-related factor 2 (Nrf2) in tinnitus by conducting experiments in Nrf2 knockout (Nrf2-KO) mice. While Nrf2-deficient mice did not develop spontaneous tinnitus or hearing loss, they displayed increased susceptibility to prolonged tinnitus-like behavior after noise exposure. This was accompanied by heightened microglial activation, neuroinflammation, and significant alterations in gut microbiota composition, including greater diversity and dysbiosis. Our findings highlight a novel mechanism underlying tinnitus, emphasizing the role of oxidative stress in the auditory cortex and its connection to noise-induced tinnitus. The deficiency of Nrf2 in mice increases their susceptibility to tinnitus, suggesting that Nrf2 may serve as a promising therapeutic target for preventing noise-induced tinnitus.
Keywords:
tinnitus
; Nrf2
; oxidative stress
; glutathione
; gut microbiota dysbiosis
1. Introduction
Tinnitus is the perception of sound without an external source. Recent estimates suggest that it affects 14.4% of adults worldwide, impacting approximately 749 million individuals [1]. Chronic tinnitus can severely disrupt daily life, leading to sleep disturbances, mood disorders, anxiety, and depression, often diminishing overall quality of life. In extreme cases, it can even contribute to suicidal thoughts and behaviors [2]. Although significant advancements have been made in understanding tinnitus and its treatment over the past two decades [3,4,5,6], the exact mechanisms and neural patterns responsible for its onset and persistence remain unclear. To address these gaps, a comprehensive approach that combines animal models and human studies is crucial.
Noise exposure and acquired hearing loss are well-established risk factors for tinnitus [4]. It is commonly believed that hearing loss diminishes afferent impulses from the auditory nerve to central auditory structures, leading to neuroplastic changes in the central nervous system that subsequently trigger tinnitus perception [7,8]. Animal studies have demonstrated increased expression of tumor necrosis factor α (TNF-α) and microglial activation in the auditory cortex following noise-induced hearing loss, highlighting a strong connection between neuroinflammation and tinnitus [9]. However, tinnitus does not always correlate with hearing loss. Around 8% of tinnitus patients have normal pure-tone hearing thresholds, suggesting that tinnitus can occur without traditional hearing loss [10,11]. Some researchers argue that a normal audiogram does not exclude hearing loss, as these patients may experience "hidden hearing loss", which refers to damage to the auditory peripheral nerve that is not detectable through standard audiometric testing [12,13]. This type of damage, often called "cochlear synaptopathy", results from noise exposure causing a loss of synapses between cochlear hair cells and auditory nerve fibers, without affecting hair cell survival or audiometric thresholds [14]. A case-control study by Guest et al. found that tinnitus in individuals with normal audiograms was linked to significantly higher lifetime noise exposure [11]. However, auditory brainstem responses (ABRs) and envelope-following responses (EFRs) did not indicate noise-induced synaptopathy, suggesting that tinnitus may stem from other mechanisms related to noise exposure. Further research by Malfatti et al. [15] identified a critical role for Ca²⁺/calmodulin kinase IIα-positive neurons in the dorsal cochlear nucleus in sustaining tinnitus perception in mice with noise-induced tinnitus, despite the absence of permanent hearing loss. These findings, however, suggest that such neural changes may not directly initiate tinnitus. The exact mechanisms by which noise exposure leads to tinnitus in individuals with normal hearing thresholds remain uncertain and warrant further investigation.
Animal studies using tinnitus models in subjects with unilateral deafness have identified several potential pathways contributing to tinnitus, with new pathways continually being discovered [9,16]. The advent of omics technologies has enabled researchers to explore tinnitus in greater detail using these advanced techniques [17,18]. However, a key challenge remains: it is unclear whether the findings from models involving unilateral deafness are consistent with those from models using subjects with normal binaural hearing. Separating the neural mechanisms of tinnitus from the effects of hearing loss is a significant hurdle in tinnitus research. To achieve a clearer understanding, it is crucial to fully dissociate tinnitus from hearing loss and distinguish the underlying neural processes [16].
To explore the neural mechanisms underlying pure tinnitus, we developed a mouse model of noise-induced tinnitus without significant hearing loss. Using metabolomics, we analyzed the metabolic changes and molecular characteristics in the auditory cortex, revealing a notable enrichment of oxidative stress-related pathways in tinnitus-affected mice. To further investigate the role of oxidative stress, we conducted noise exposure experiments on nuclear factor erythroid 2-related factor 2 (Nrf2)-knockout (Nrf2-KO) mice. Our results showed that while Nrf2 deficiency did not trigger spontaneous tinnitus, it increased the mice's susceptibility to noise-induced tinnitus and worsened neuroinflammation. Additionally, we examined the gut microbiome and metabolic changes in Nrf2-KO mice, uncovering further factors contributing to their heightened vulnerability. These findings suggest that Nrf2 plays a critical role in modulating susceptibility to noise-induced tinnitus by regulating glutathione (GSH) levels, positioning Nrf2 as a potential therapeutic target for preventing this condition.
2. Materials and Methods
2.1. Animals
We used 6-week-old male C57BL/6J mice (obtained from the Experimental Animal Center of Tongji Medical College, Huazhong University of Science and Technology) and 6-week-old male Nrf2 knockout mice (B6.129X1-Nfe2l2tm1Ywk/J, purchased from Jackson Laboratory, Bar Harbor, ME) for the experiments. All animal procedures were approved by the Institutional Animal Care and Use Committee (IACUC) of Huazhong University of Science and Technology (IACUC number 3638) and were conducted following their guidelines. The animals were housed on a 12-hour light/dark cycle with free access to food and water, and all experiments were performed during the light phase of the cycle.
2.2. Auditory Brainstem Response
Hearing thresholds were assessed using the Tucker-Davis Technology (TDT) System before and at several time points after noise exposure, as described in a previous study [19]. Mice were anesthetized with Zoletil 50 (75 mg/kg, intraperitoneal injection [i.p.]) and xylazine (10 mg/kg, i.p.), and their body temperature was maintained at 37°C using a thermostatic electric blanket. Erythromycin eye ointment was applied to prevent eye dryness, and the scalp was disinfected with 10% povidone-iodine. Recording and reference electrodes were inserted under the skin of the skull and the tested ear, respectively. ABRs were recorded at seven frequencies (8, 12, 16, 20, 24, 28, and 32 kHz), with sound pulses presented at decreasing intensities (from 80 to 10 dB SPL in 5 dB SPL steps) and a 10-second pause between intensity levels. SigGen32 software (Tucker-Davis Technologies) was used to amplify and record ABR signals for each frequency. The ABR threshold for each frequency was defined as the lowest sound level that elicited detectable ABRs.。
2.3. Noise Exposure
Anesthetized mice were treated with erythromycin ointment on both eyes and placed in a soundproof chamber. Their body temperature was maintained at 37°C using a thermostatic electric blanket. Speakers, positioned 15 cm above their heads, delivered narrow-band white noise (90 dB or 100 dB SPL) centered at 8 kHz for 60 minutes. This was followed by 120 minutes of continuous silence. The soundproof environment ensured that no external noise interfered with the development of tinnitus during and after the exposure [15,20,21]. Throughout both the noise exposure and the silent period, the animals were monitored every 15 minutes and returned to their cages afterward.
2.4. Behavioral Test of Tinnitus
Tinnitus behavior was assessed using the gap prepulse inhibition of acoustic startle (GPIAS) test [22], which has become widely adopted due to its increasing use in tinnitus research [9,15,23,24]. During testing, each mouse was placed in an acoustically transparent, unrestrained acrylic cage (9.8 × 5 × 5.5 cm) within an anechoic chamber (startle reflex chamber, XR-XZ208, Xinruan, Shanghai, China). The chamber, lined with open-cell foam to absorb sound, contained a cage resting on an accelerometer to measure the startle response. Acoustic stimuli were delivered through an open-field speaker positioned above the cage. All testing was conducted within this soundproof environment. The gap detection task measured the acoustic startle response to a brief white noise pulse, and how this response was attenuated when preceded by a silent gap in the continuous background sound. Each session consisted of 15 gap trials and 15 no-gap trials, presented in random paired order with variable intervals between trials (17–23 s). A 300-second acclimation period was provided at the start of each session. In the no-gap trials, the background noise was a 70-dB SPL pure tone at 16 kHz, followed by a 50-ms white noise burst at 110 dB SPL to elicit the startle response. In cued trials, a 50-ms silent gap was introduced into the background sound 100 ms before the loud noise burst. The startle response ratio was calculated after each session to assess the mouse's gap detection ability.
In our study, we used the "modified ratio" method for GPIAS data analysis, as introduced by Longenecker et al. [24]. This approach minimizes variance in the startle response ratio. Each experimental session consisted of three blocks, each containing five Gap and five No-Gap trials. Only startle responses deemed valid by an automatic classifier were included in the analysis. A block was considered valid if it contained at least one valid Gap and one valid No-Gap trial. For each valid block, the mean amplitudes for Gap and No-Gap trials were calculated. The ratio for each block was determined based on the following criteria: if the mean Gap amplitude was lower than the mean No-Gap amplitude, the block was classified as gap-induced inhibition (ratio = mean Gap / mean No-Gap). Conversely, if the mean Gap amplitude was higher than the mean No-Gap amplitude, the block was classified as gap-induced facilitation (ratio = mean No-Gap / mean Gap). The gap detection ratio for each session was then represented by the average ratio across all valid blocks. This method accounts for both gap-induced inhibition and facilitation as indicators of gap detection, with the ratio range constrained between 0 and 1. A lower startle response ratio reflects better detection of the silent gap, while a ratio of 1 indicates an inability to detect the gap.
The gap detection test relies on the animal’s natural defensive reflex, specifically the auditory startle reflex (ASR). To perform this test, it is essential to assess both the animal’s auditory sensitivity and its ability to exhibit pre-pulse inhibition (PPI) of the startle response. The gap detection test measures the animal’s ability to detect silent intervals within continuous pure tones, while PPI assesses the animal's response to pure tone pulses presented during silent intervals. Essentially, the gap detection test is a variant of the PPI test, with the main distinction being that PPI occurs in a quiet environment 100 ms before a burst of white noise (50 ms at 110 dB SPL), preceded by a 50 ms pure tone (16 kHz, 70 dB SPL). Given that PPI response rates are generally stable, the “grand ratio” method is used to analyze PPI data [24], calculated as the ratio of the mean response to the Cue over the mean response to the No-cue. An animal is considered to show signs of tinnitus if it meets three criteria: 1) an elevated gap detection ratio, 2) normal or slightly elevated ABR thresholds, and 3) a normal PPI response ratio.
Long-term habituation of the ASR is commonly observed across species and under various testing conditions. In studies involving repeated measurements, where the same animal is tested on multiple days, the ASR typically decreases as the number of tests increases [24]. For this reason, it is important to ensure that the ASR has stabilized before testing animals. In our study, animals were trained to habituate, and ASR data were collected once this stable habituation state was reached. Prior to noise exposure, animals were screened, and those with a gap detection test ratio above 0.7 were re-tested the following day. Any animals still showing a ratio greater than 0.7 were excluded from further experimentation [15,25].
2.5. Metabolomics
Mice were deeply anesthetized before undergoing cardiac perfusion with ice-cold phosphate-buffered saline (PBS, 20 ml). Brain samples from the auditory cortices (primary and secondary) of both control and tinnitus groups (n = 4) were collected 24 hours post-noise exposure using sterile techniques. The samples were immediately frozen in liquid nitrogen and stored at -80°C for later analysis. Metabolite extraction followed the protocol described by Huang et al. [26], using methanol as the solvent. Samples were freeze-dried with a SpeedVac (Thermo Fisher Scientific, Wilmington, NC, USA) and kept at -80°C. Prior to analysis, metabolites were reconstituted in 200 µL of 80% acetonitrile (HPLC grade, Macklin, Shanghai, China). After vortexing and centrifuging at 14,000g for 10 minutes at 4°C, the supernatant was collected for targeted metabolomics analysis. A 20 µL aliquot of the supernatant was analyzed using an AB SCIEX QTRAP 5500 LC/triple quadrupole mass spectrometer (Applied Biosystems SCIEX, Foster City, CA, USA). Data were processed with MultiQuant software (version 2.1, Applied Biosystems SCIEX) [26]. Further analysis, including principal component analysis (PCA), differential metabolite screening, and pathway enrichment analysis, was conducted using MetaboAnalyst 6.0 (https://www.metaboanalyst.ca/MetaboAnalyst/, accessed May 27, 2024) [27]. For data normalization, the peak area of each metabolite was adjusted relative to the total ion count of the corresponding sample. The normalized data were log-transformed (base 10), centered to the mean, and scaled by dividing by the standard deviation of each variable.
Fecal samples were collected from 6-week-old wild-type (WT) and Nrf2-KO mice (n = 6), without prior noise exposure, using sterile techniques to avoid contamination. The samples were immediately frozen in liquid nitrogen and stored at -80°C for later analysis. A 20 mg portion of each sample was weighed and extracted with 400 µL of 70% methanol containing an internal standard. The extraction process included ultrasonic treatment in an ice bath for 10 minutes, followed by vortex mixing. Samples were then incubated at -20°C for 30 minutes before centrifugation at 12,000 rpm for 10 minutes at 4°C, discarding the pellet. The supernatant was further centrifuged at 12,000 rpm for 3 minutes at 4°C, and 50 µL of the resulting supernatant was prepared for liquid chromatography-tandem mass spectrometry (LC-MS) analysis. Non-targeted metabolomics was performed using a Q Exactive HF-X mass spectrometer (Thermo Fisher Scientific, MA, USA). The samples were analyzed using both full-scan MS and data-dependent MSn scans with dynamic exclusion. MS analysis was carried out in both positive and negative ion modes via electrospray ionization, with full-scan detection covering m/z 75–1000 at a resolution of 35,000. Raw data were processed according to the method described by Chen et al. [28]. Correlation analysis was performed using R software (version 4.1.2, The R Foundation for Statistical Computing, https://www.r-project.org/, accessed August 15, 2024)
2.6. Gut Microbiome Analyses
Fecal samples were collected from WT mice (n = 5) and Nrf2-KO mice (n = 10) from the same litter, all of which had not been exposed to noise. The samples were collected using standard procedures for fecal metabolomics studies, commonly employed in intestinal microbiota analysis. To assess changes in gut bacterial composition, the bacterial 16S rRNA gene was sequenced. DNA was extracted from the fecal samples using the DNeasy PowerSoil Kit (Qiagen, Hilden, Germany). The V3-V4 hypervariable region of the 16S rRNA gene was PCR-amplified with primer pairs 343F (5'-TACGGRAGCAGCAG-3') and 798R (5'-AGGGTATCTAATCCT-3'). Sequencing was performed on an Illumina NovaSeq 6000 (Illumina, San Diego, CA, USA). Raw data processing followed the protocol outlined by Li et al. [29]. Microbial diversity was analyzed using both α- and β-diversity measures. Linear discriminant analysis (LDA) with effect size measurements (LEfSe) was employed to identify significant differences in bacterial relative abundance at various taxonomic levels between the groups. Additionally, predicted microbial functions were analyzed through Kyoto Encyclopedia of Genes and Genomes (KEGG) pathway analysis.
2.7. Immunofluorescence Staining
After inducing deep anesthesia in the mice, heart perfusion was performed with 20 mL of ice-cold PBS, followed by 20 mL of 4% paraformaldehyde. The brain was then carefully extracted and fixed overnight in 4% paraformaldehyde at 4°C. Next, the brain tissue underwent gradient dehydration in 20% and 30% sucrose solutions. Coronal frozen sections of the auditory cortex, each 25 μm thick, were prepared after embedding in Tissue-Tek. The sections were air-dried, washed three times for 5 minutes each in 0.3% Triton X-100 in PBS (PBS-Triton), and then blocked with 1% bovine serum albumin (BSA) in PBS for 2 hours at room temperature. The sections were then incubated with the primary antibody against ionized calcium binding adaptor molecule 1 (IBA1) (1:500, Wako, Japan) in 1% BSA-PBS at 4°C for 42 hours. After incubation, the sections were washed four times in PBS-Triton for 10 minutes each, followed by incubation with the secondary antibody, Alexa Fluor 488 donkey anti-rabbit IgG (1:200, AntGene, China), for 2 hours at room temperature. After four additional washes, the nuclei were stained with DAPI (Beyotime Biotechnology, China), and the slides were mounted using AntGene sealer. Immunofluorescence images were randomly captured from the auditory cortex using a Nikon Ax laser confocal microscope (Nikon, Tokyo, Japan).
To assess the morphological changes in microglia, digital images of IBA1-stained sections were captured with a 60x objective. Each section was imaged at 12 focal planes, spaced 2 μm apart, and the images were then stacked to create a composite for further analysis. Morphological evaluation of IBA1-positive microglia was performed using ImageJ software (version 1.54f) [30].
2.8. Measurement of GSH Levels and Quantitative Real-Time Polymerase Chain Reaction (RT-PCR)
Mice were deeply anesthetized and transcardially perfused with 20 mL of ice-cold PBS to eliminate residual blood, minimizing potential interference with GSH levels and RT-PCR analysis of the auditory cortex. Tissue samples were then collected for further analysis. GSH and oxidized glutathione (GSSG) concentrations were measured using the GSH and GSSG Assay Kit (Beyotime, S0053, China), following the manufacturer’s instructions. Absorbance at 405 nm was recorded every 5 minutes using a BioTek ELX800 microplate reader (BioTek Instruments, USA). A standard curve was generated, allowing the calculation of GSH, GSSG, and total GSH concentrations in the samples.
For RT-PCR analysis, total RNA was extracted from fresh tissue using the FastPure Cell/Tissue Total RNA Isolation Kit V2 (Vazyme, Nanjing, China). cDNA synthesis was performed with the PrimeScript™ RT Reagent Kit (Takara, RR047A, Japan). Quantitative PCR was conducted on the cDNA using the 2 × Q3 SYBR qPCR Master Mix (ToloBio, 22204-01, China) on an Applied Biosystems 7900HT real-time PCR system (Applied Biosystems, Foster City, CA, USA). mRNA expression levels were normalized to Gapdh, and relative expression was determined using the comparative Ct method (2−∆∆Ct). Ct values greater than 35 cycles were excluded. Primer sequences for RT-PCR are provided in Table S1.
2.9. Statistical Analysis
Statistical analyses were conducted using IBM SPSS Statistics software (version 26.0, IBM, Chicago, IL, USA) and GraphPad Prism (version 8.2.1, GraphPad Software, San Diego, CA, USA) for data visualization. Most experimental data were primarily analyzed using one-way analysis of variance (ANOVA). The normality of data for each experiment was evaluated with the Shapiro-Wilk test (P ≥ 0.05). Results are expressed as mean ± SEM, unless stated otherwise. A P-value of < 0.05 was considered statistically significant. Significance levels are denoted by asterisks (*, **, ***) for P < 0.05, P < 0.01, and P < 0.001, respectively.
3. Results
3.1. Noise-Induced Tinnitus Model Was Constructed and Verified
Bilateral ears of anesthetized C57BL/6J mice were exposed to 8 kHz narrowband noise at a sound pressure level (SPL) of 100 dB for 60 minutes, followed by a 2-hour silent period in a soundproof chamber. Prior to exposure, the mice's auditory and gap detection abilities were assessed using the Gap Detection/GPIAS test (Figure 1a). Tinnitus-related behavioral tests were performed both one day before and one day after noise exposure. These tests included: 1) measuring the response to a 50 ms gap in the background sound (16 kHz pure tone, 70 dB SPL), presented 100 ms before a loud startle pulse (110 dB SPL, 50 ms duration); and 2) assessing the response to a 50 ms pre-pulse (16 kHz pure tone, 70 dB SPL) in a quiet environment, also presented 100 ms before the startle pulse (110 dB SPL, 50 ms duration), which reflects PPI of the acoustic startle (Figure 1b). Under anesthesia, hearing thresholds were repeatedly assessed using ABR recordings (Figure 1a).
No significant differences were observed in ABR thresholds before, 5 days, or 14 days following noise exposure (Figure 1c; repeated measures ANOVA, P > 0.05 for all frequencies). The hearing of the noise-exposed mice remained within the normal range, with no apparent impairment. Gap detection and PPI ratios were measured before noise exposure, and at 1-, 3-, 7-, and 14-days post-exposure (Figure 1a). Prior to exposure, there were no significant differences in gap detection ratios between the control and noise-exposed groups. However, one day after exposure, the gap detection ratio of noise-exposed mice was significantly higher than that of the controls (Figure 1d; noise exposure × time two-way repeated measures ANOVA, interaction, F1.785,10.709 = 8.100, P = 0.008; pairwise analysis between groups: F1,6 = 18.014, P = 0.005). This increase persisted on days 3 and 7, with gap detection ratios still elevated in the noise-exposed group compared to controls (Noise 3d: F1,6 = 16.969, P = 0.006; Noise 7d: F1,6 = 45.820, P = 0.001). By day 14, some mice showed a decrease in gap detection ratios, with no significant difference from the controls (F1,6 = 0.096, P = 0.767). In contrast, no significant differences in PPI ratios were found between groups at any time point (Figure 1e; main effect of noise exposure: F1,6 = 0.070, P = 0.800; main effect of time: F4,24 = 3.592, P = 0.020; pairwise comparisons: P > 0.05 at all time points), suggesting that noise exposure did not affect the mice's resistance to the startle reflex. Overall, these results indicate that within one week of exposure to 100 dB noise, the mice exhibited behavioral evidence of tinnitus, despite no significant hearing loss. However, by 14 days post-exposure, tinnitus symptoms began to diminish in some mice (Figure 1d).
3.2. Oxidative Stress and Redox-Related Pathways Were Significantly Enriched in the Auditory Cortex of Mice with Noise-Induced Tinnitus
To investigate the molecular mechanisms underlying tinnitus, we employed metabolomics, a comprehensive approach that integrates various "omics" technologies. Metabolomics is valued for its sensitivity, reliability, and ability to detect biological changes linked to diseases or treatments [31]. Following the protocol outlined in Figure 1a, mice displaying behavioral signs of tinnitus 24 hours after noise exposure were assigned to the tinnitus group (Figure S1). The control group underwent sham noise exposure with identical procedures. Bilateral auditory cortex tissues, including both primary and secondary auditory cortices, were collected for targeted metabolomics analysis (n = 4). PCA was performed on the molecular data using MetaboAnalyst 6.0, which visually highlighted the clustering within groups and the separation between the tinnitus and control groups. The PCA results revealed distinct metabolic profiles between the two groups (Figure 2a). Using a significance threshold of P < 0.05 (Student's t-test), we identified 34 differentially abundant metabolites in the tinnitus group, including 19 that were downregulated and 15 that were upregulated (Figure 2b-c, Table S2). The most notably upregulated metabolite was DL-Pipecolic acid (a lysine derivative), while the most significantly downregulated metabolite was S-ribosyl-L-homocysteine (an intermediate in homocysteine metabolism). Among the metabolites, acadesine, an AMPK activator that enhances energy metabolism, showed the greatest increase, while citrate, a metabolite in amino acid metabolism, exhibited the largest decrease.
Several of the differential metabolites were linked to oxidative stress and redox reactions, such as GSH, nicotinamide adenine dinucleotide (NAD+), and flavin mononucleotide (FMN) (Figure 2b, highlighted in green). Notably, substances with antioxidant properties, including α-ketoglutarate and GSH, were significantly elevated in the tinnitus group (Figure 2c, highlighted in bold). Pathway enrichment analysis using the KEGG pathway database revealed significant associations with several oxidative stress-related pathways in the tinnitus group, including "nicotinate and nicotinamide metabolism", "riboflavin metabolism", "ether lipid metabolism" and "glutathione metabolism" (Figure 2d, highlighted in bold).
Given that GSH is a critical intracellular antioxidant involved in regulating cytokine balance, immune responses, and the cell cycle [32], we focused on the GSH metabolism pathway. We measured the levels of GSH and GSSG in the auditory cortex of mice (Figure 2e-f). Our results showed that, compared to controls, tinnitus mice had significantly higher levels of both GSH and total GSH (Figure 2f; unpaired two-tailed t-test, P = 0.014 for both), while GSSG levels remained unchanged. Consequently, the GSH/GSSG ratio was significantly increased (Figure 2e; P = 0.023). This elevated GSH/GSSG ratio suggests enhanced antioxidant capacity, indicating a compensatory upregulation of GSH production in response to tinnitus. Our findings demonstrate that even at noise levels that do not cause significant hearing loss, the auditory cortex in mice with noise-induced tinnitus shows signs of oxidative stress, prompting a rapid activation of antioxidant mechanisms to maintain cellular redox balance.
3.3. The Deficiency of the Oxidative Stress Response Transcription Factor Nrf2 Did Not Induce Spontaneous Tinnitus or Hearing Loss
GSH plays a crucial role as an antioxidant in the body, with Nrf2 acting as a key regulator of the GSH system. Nrf2 controls the expression of enzymes involved in GSH metabolism, thus influencing its synthesis and antioxidant functions [33]. To better understand the relationship between GSH metabolism and noise-induced tinnitus, we examined Nrf2-KO mice. Our results showed that the auditory cortex of Nrf2-deficient mice had a significantly lower GSH/GSSG ratio (Figure 3a; unpaired two-tailed t-test, P = 0.0003) and marked reductions in both GSH and total GSH levels (Figure 3b; P < 0.0001). These findings suggest that Nrf2 deficiency compromises antioxidant capacity in the auditory cortex, highlighting Nrf2's role in maintaining GSH levels and redox balance.
We also conducted audiological and behavioral assessments on the Nrf2-KO mice to evaluate their tinnitus-related responses. Compared to WT mice at 6 weeks of age, there were no significant differences in gap detection (Figure 3c), PPI (Figure 3d), or ABR thresholds (Figure 3e) in age-matched Nrf2-KO mice. Over a 14-day period, from 6 to 8 weeks of age, we continued to monitor tinnitus behavior and hearing responses. During this time, gap detection (Figure 3f) and PPI (Figure 3g) remained stable in Nrf2-KO mice, showing no significant differences compared to WT controls. At 8 weeks, ABR thresholds were slightly higher in Nrf2-KO mice than in WT mice, but the difference was not statistically significant (Figure 3h). These results suggest that Nrf2 deficiency does not affect the startle response, hearing function, or lead to spontaneous tinnitus or hearing loss in mice.
3.4. Nrf2 Deficiency Increases Susceptibility to Noise-Induced Tinnitus-Like Behavior
After confirming that the deletion of the Nrf2 gene alone did not affect baseline tinnitus in mice, we next examined the behavioral effects of noise exposure in Nrf2-KO and WT mice. Both groups were exposed to narrowband noise at intensities of 90 dB SPL or 100 dB SPL, using previously established protocols. Exposure to 90 dB SPL noise resulted in a stable gap detection ratio in WT mice, while Nrf2-KO mice showed a slight increase compared to baseline values. Although the increase in the Nrf2-KO group was greater than that in the WT group, this difference did not reach statistical significance (Figure 4a, b; genotype × noise exposure two-way repeated measures ANOVA, P > 0.05). No significant hearing loss was observed in either group on days 5 and 14 post-exposure (Figure 4c, d; multiple t-tests, P > 0.05).
When exposed to 100 dB SPL noise, both WT and Nrf2-KO mice exhibited increased gap detection ratios, indicating tinnitus-like behavior (Figure 4e; main effect of post-exposure days, F4,24 = 16.513, P < 0.001; pairwise comparisons: Nrf2-KO group 1d vs. Baseline, 7d vs. Baseline, P < 0.05; WT group 3d vs. Baseline, 7d vs. Baseline, P < 0.05). PPI remained unchanged across all groups (Figure 4f; P > 0.05). On day 5 post-exposure, Nrf2-KO mice showed a transient increase in ABR thresholds, which returned to baseline by day 14. In contrast, no such changes were observed in WT mice (Figure 4g, h; multiple t-tests).
These results suggest that, under lower-intensity noise exposure, Nrf2-KO mice exhibit a higher propensity for tinnitus-like behavior and are more vulnerable to noise-induced tinnitus compared to WT mice. Additionally, at higher noise intensities, Nrf2-KO mice not only displayed tinnitus-like symptoms but also experienced a temporary shift in hearing thresholds.
3.5. Nrf2 Deficiency Predisposes Mice to Noise-Induced Microglial Deramification in the Auditory Cortex
Neuroinflammation in the auditory cortex has been linked to the development of tinnitus in rodent models [9]. During neuroinflammation, microglia become activated and undergo a morphological change from a branched, ramified shape to an amoeboid form. In a unilateral deafness tinnitus model, this transformation begins by the 5th day post-noise exposure [9]. To further explore this, we examined microglial morphology in the auditory cortex of animals at 5 and 14 days after noise exposure. We used IBA1, a common marker for microglia, for immunostaining.
Under 90 dB SPL noise exposure, most microglia in both Nrf2-KO mice and control WT mice exposed to pseudo-noise displayed a typical, branched morphology. However, after 5 days of noise exposure, WT mice showed minimal morphological changes, while Nrf2-KO mice exhibited significant alterations. By day 14, microglia in the WT group maintained their branched morphology, whereas a subset of microglia in Nrf2-KO mice adopted a non-ramified or amoeboid shape (Figure 5a). To quantify these morphological changes, we assessed the average number of branches per cell, total branch length, and the ratio of somatic to total cell size [30]. Fewer branches, shorter total branch lengths, and a higher somatic-to-total cell size ratio are indicative of microglial activation. At 5 days post-exposure, Nrf2-KO mice showed a significant reduction in the number of microglial branches (Figure 5b; genotype × noise exposure two-way ANOVA: main effect of genotype, F1,20 = 8.561, P = 0.008; main effect of exposure, F2,20 = 6.572, P = 0.006; pairwise comparison, day 5 vs. control, P = 0.007). Additionally, Nrf2-KO mice exhibited shorter total branch lengths (Figure 5c; main effect of genotype, F1,20 = 17.174, P = 0.001; main effect of exposure, F2,20 = 6.820, P = 0.006; pairwise comparison, P = 0.013 for day 5 vs. control, P = 0.018 for day 14 vs. control). Furthermore, the ratio of somatic to total cell size was significantly higher in Nrf2-KO mice (Figure 5d; genotype × time interaction, F2,21 = 12.274, P < 0.001; group difference, F1,21 = 50.285, P < 0.001 for day 5, F1,21 = 13.508, P = 0.001 for day 14; time effect, the Nrf2-KO group, P < 0.001 for day 5 vs. control, P < 0.001 for day 14 vs. control).
Five days after exposure to 100 dB SPL noise, microglia in the auditory cortex of both Nrf2-KO and WT mice showed signs of activation, as indicated by reduced branching (Figure 6a). Specifically, there was a significant decrease in the number of microglial branches (Figure 6b; genotype × noise exposure two-way ANOVA: main effect on exposure, F2,23 = 16.740, P < 0.001; pairwise comparisons, P < 0.001 for day 5 vs. control, P < 0.001 for day 14 vs. control), along with shorter total branch length (Figure 6c; main effect on exposure, F2,23 = 19.162, P < 0.001; pairwise comparisons, P < 0.001 for day 5 vs. control, P < 0.001 for day 14 vs. control). Additionally, the ratio of soma to total cell size increased (Figure 6d; main effect on exposure, F2,21 = 30.308, P < 0.001; pairwise comparisons, P < 0.001 for day 5 vs. control, P < 0.001 for day 14 vs. control). These morphological changes were sustained for at least 14 days following the noise exposure (Figure 6).
3.6. Mice Deficient in Nrf2 Exhibit More Pronounced Noise-Exposure-Induced Neuroinflammation in the Auditory Cortex
Behavioral and histological evidence indicates that Nrf2-KO mice are more vulnerable to noise-induced tinnitus. In support of this, we observed a significant increase in the levels of GSH in the auditory cortex of these mice following noise exposure (Figure 7a-b). Specifically, the GSH/GSSG ratio (P = 0.0496), total GSH (P = 0.001), and GSH levels (P < 0.001) were all significantly elevated in Nrf2-KO mice. These results suggest that tinnitus behavior in mice is consistently linked to an increase in total GSH levels in the auditory cortex, irrespective of Nrf2 expression.
We then investigated the expression of inflammatory markers in the auditory cortex of mice with noise-induced tinnitus, focusing on TNF-α, the microglial marker CD86, and inducible nitric oxide synthase (iNOS) at 12 hours, 1 day, 3 days, and 10 days post-exposure. Real-time PCR analysis revealed that TNF-α mRNA levels did not significantly change in WT mice after noise exposure. However, in Nrf2-KO mice, TNF-α levels were notably elevated on days 3 and 10 post-exposure (Figure 7c; genotype × noise exposure two-way ANOVA: interaction, F4,48 = 5.075, P = 0.002; genotype effect: 3d, F1,48 = 6.299, P = 0.016; 10d, F1,48 = 20.731, P < 0.001; time effect: Nrf2-KO, F4,48 = 8.339, P < 0.001; pairwise analysis: day 10 vs. control, P < 0.001). Additionally, the levels of CD86 and iNOS, markers of microglial activation, were significantly higher in Nrf2-KO mice (Figure 7d-e; main effect of genotype: CD86, F1,48 = 21.886, P < 0.001; iNOS, F1,44 = 10.112, P = 0.003).
After confirming that Nrf2-deficient mice exhibit a heightened neuroinflammatory response to noise exposure, we examined the expression of downstream phase II detoxifying enzymes regulated by Nrf2. Noise exposure led to a significant increase in the expression of key enzymes—heme oxygenase 1 (HO-1), NAD(P)H dehydrogenase quinone 1 (Nqo1), and glutathione S-transferase alpha 2 (Gsta2)—in Nrf2-KO mice (Figure 7f-h; main effect of genotype: HO-1, F1,44 = 46.810, P < 0.001; Gsta2, F1,45 = 31.892, P < 0.001; Nqo1, interaction effect, F4,32 = 8.190, P < 0.001; group effect: 12h, F1,32 = 5.820, P = 0.022; 3d, F1,32 = 19.178, P < 0.001; 10d, F1,32 = 63.922, P < 0.001; time effect: Nrf2-KO, F4,32 = 13.764, P < 0.001; pairwise analysis: day 10 vs. control, P < 0.001). These findings suggest that in the absence of Nrf2, compensatory mechanisms are activated, upregulating antioxidant and detoxification pathways to help maintain cellular homeostasis.
3.7. The Dysbiosis of the Gut Microbiota and the Hypermetabolic State of the Intestine Associated with Nrf2 Deficiency May Contribute to the Increased Susceptibility to Noise-Induced Tinnitus
From birth to senescence, the composition and activity of the gut microbiota evolve alongside the host, influenced by a complex interplay of the host genome, diet, and lifestyle [34]. To investigate this relationship, we collected fecal samples from 6-week-old Nrf2-KO and WT mice, sourced from the same litter, for comparison. 16S rRNA gene sequencing revealed significant differences in gut microbiota composition and biomarkers between the two groups (Figure S2a-c). Principal coordinate analysis (PCoA) based on β-diversity clearly separated the Nrf2-KO and WT mice (Figure S2a). At the phylum level, Nrf2-KO mice exhibited a higher abundance of Firmicutes (40.12% vs. 6.8%) and a marked decrease in Bacteroidetes (53.61% vs. 90.21%) compared to the WT group (Figure S2b). This shift resulted in a significantly elevated Firmicutes-to-Bacteroidetes (F/B) ratio, a common indicator of gut dysbiosis. Alpha diversity analysis further revealed that the gut microbiota in Nrf2-KO mice was more diverse and richer than that in the control group (Figure S2d). At the species level, we identified several differential species, including Lactobacillus iners, Helicobacter bilis, and Helicobacter hepaticus, which are linked to intestinal inflammation and were more abundant in the Nrf2-KO mice (Figure S2e). KEGG functional predictions highlighted that metabolic pathways and biosynthesis of secondary metabolites were the most affected in Nrf2-KO mice (Figure S2f). These findings suggest that Nrf2 deficiency leads to gut microbiota dysbiosis and alterations in intestinal metabolism.
Further fecal metabolomics analysis revealed upregulation of pathways related to oxidative stress and redox processes, such as “nicotinate and nicotinamide metabolism”, as well as “pathways of neurodegeneration-multiple diseases” in Nrf2-KO mice. Additionally, pathways involved in nutrient metabolism, including “biotin metabolism”, “D-amino acid metabolism”, and “degradation of valine, leucine, and isoleucine” were also elevated (Figure S2g). Together, these results suggest that gut microbiota dysbiosis, coupled with hypermetabolism and disrupted gut homeostasis, may contribute to the increased susceptibility of Nrf2-deficient mice to noise-induced tinnitus.
4. Discussion
In this study, we developed a mouse model of tinnitus in which the animals exhibited tinnitus-like behavior without significant hearing loss. Metabolomics analysis revealed upregulation of oxidative stress-related pathways, including GSH metabolism, in the tinnitus-exhibiting mice. Glutathione, the primary cellular antioxidant, is compensatorily upregulated in mice with tinnitus. To explore the role of oxidative stress further, we used Nrf2-KO mice, which are characterized by reduced GSH expression. While these mice did not develop spontaneous tinnitus or hearing loss, they were more vulnerable to noise-induced tinnitus. Specifically, Nrf2-KO mice displayed a longer tinnitus duration, along with increased microglial activation and neuroinflammation in the auditory cortex. Additionally, we examined the gut microbiome and metabolism in Nrf2-KO mice using 16S rRNA sequencing and fecal metabolomics. Our results revealed disruptions in the gut microbiota and dysregulation of metabolic pathways in these animals. These alterations likely contribute to their reduced resistance to external noise and increased susceptibility to tinnitus.
Tinnitus is not merely an auditory disorder; it is a complex condition that also involves psychological and neurophysiological factors. Due to the limitations of animal models and the challenges in obtaining human tissue samples, the precise mechanisms behind tinnitus remain poorly understood. Metabolomics studies have examined molecular changes in the plasma of tinnitus patients [35,36,37], but these findings provide limited insight and have not substantially advanced our understanding of the condition. While oxidative stress has been identified as a key mechanism in noise-induced hearing loss [38], the direct link between oxidative stress and noise-induced tinnitus has yet to be clearly established. Few studies in animal models have investigated the relationship between oxidative stress and tinnitus, or explored the underlying mechanisms. However, indirect evidence suggests that oxidative stress may contribute to tinnitus development [39,40,41,42]. For example, Ekinci et al. found significantly higher total oxidative state and oxidative stress index in the serum of tinnitus patients compared to healthy controls [41]. Additionally, a study by Lai et al. showed a negative correlation between oxidative balance score (the equilibrium between antioxidants and pro-oxidants influenced by lifestyle factors) and tinnitus prevalence [39]. This suggests that an antioxidant-rich diet and lifestyle may help reduce tinnitus risk. Furthermore, a randomized, double-blind clinical trial found that patients receiving antioxidant treatments (multivitamin-multimineral and alpha-lipoic acid tablets), experienced significant improvements in tinnitus loudness, frequency, and minimum masking level after three months, as well as reductions in Tinnitus Handicap Inventory and Visual Analogue Scale scores compared to the placebo group [42]. Building on this evidence, our research confirms a direct link between oxidative stress and noise-induced tinnitus, supporting the potential use of antioxidant therapies in the treatment of tinnitus.
Our research further confirmed that mice lacking the Nrf2 gene had reduced levels of GSH and an increased susceptibility to noise-induced tinnitus. This highlights the protective roles of Nrf2 and GSH against tinnitus caused by noise exposure. Nrf2 is a key regulator of antioxidants and detoxification enzymes, and its activity has been shown to decrease in both mice and humans, increasing the risk of various diseases [43,44]. Mice deficient in Nrf2 are more vulnerable to noise-induced hearing loss [43], and humans with genetic variations that lower Nrf2 expression are at higher risk for neuro-auditory impairments following occupational noise exposure [43]. These individuals are also more prone to developing acute lung injury after major trauma [44]. Our findings further emphasize the strong connection between oxidative stress and the development of noise-induced tinnitus. Specifically, the reduced antioxidant capacity linked to decreased Nrf2 expression appears to be a significant risk factor for tinnitus.
In our tinnitus model, we did not observe an increased expression of TNF-α in the auditory cortex of WT mice with tinnitus-like behavior. This contrasts with findings by Wang et al. [9]. We thought this discrepancy may stem from differences between the models used. In Wang et al.'s study, a unilateral deafness model was employed, where animals experience substantial hearing loss in one ear, potentially leading to higher levels of inflammatory markers in the auditory cortex. Our tinnitus model, however, does not involve hearing loss, which could account for the differences in TNF-α expression. No specific biomarker has yet been identified to correlate with tinnitus in the absence of hearing loss, suggesting that a future direction in this field should be to discover and validate such a biomarker. Additionally, while Wang et al. focused their analysis on the primary auditory cortex, our study examined the entire auditory cortex, which may have reduced our ability to detect localized changes in TNF-α expression.
The intestinal microbiota plays a vital role in regulating metabolic processes and influencing various organs, including the gut, liver, heart, and brain. The concept of the "gut-brain-ear axis" has emerged, linking imbalances in the gut microbiota (dysbiosis) to the development of hearing loss [45], exposure to environmental noise stress [46], and chronic tinnitus [36]. Given this, the gut microbiota is increasingly recognized as a potential target for preventing and treating noise-induced tinnitus. In our study, we observed that Nrf2-KO mice exhibited increased diversity in their gut microbiota. Specifically, there was a significant rise in the relative abundance of Helicobacter bilis and Helicobacter hepaticus, both of which are associated with inflammatory bowel disease and inflammatory tumors [47], as well as Lactobacillus iners, which is linked to vaginal microecological disruptions [48], and the opportunistic pathogen Serratia marcescens. In contrast, the abundance of Parabacteroides distasonis, a probiotic known to support intestinal barrier integrity and suppress inflammatory signaling [49], was notably reduced. These changes suggest that the absence of Nrf2 not only diminishes the host's antioxidant defenses but also weakens intestinal immune function, impairing its ability to control harmful gut bacteria. This dysbiosis may, in turn, disrupt intestinal immunity and homeostasis, contributing to systemic inflammation and perpetuating a harmful feedback loop. By modulating the composition of the gut microbiota in Nrf2-KO mice, particularly by increasing probiotic abundance, it may be possible to enhance resistance to noise-induced tinnitus.
This study has certain limitations. First, we focused solely on Nrf2-KO mice to explore the effects of Nrf2 deficiency on noise-induced tinnitus, without examining how upregulation of Nrf2 expression might influence tinnitus development. As a result, our ability to fully evaluate Nrf2 and GSH as potential therapeutic targets for noise-induced tinnitus remains limited. Additionally, including immunohistochemical staining for oxidative stress markers could have strengthened the evidence for oxidative stress in the auditory cortex of tinnitus models, thereby enhancing the robustness of our findings.
In conclusion, our results highlight a significant link between noise-induced tinnitus and oxidative stress in the auditory cortex, with Nrf2 playing a critical role in regulating GSH levels to mitigate tinnitus. This study uncovers a novel mechanism underlying tinnitus and lays the groundwork for the development of therapeutic and preventive strategies. Furthermore, these findings offer valuable insights into how redox signaling and neuroinflammatory interventions (such as pharmacological agents, dietary modifications, and physical exercise) impact tinnitus.
Supplementary Materials
The following supporting information can be downloaded at the website of this paper posted on Preprints.org, Figure S1. Behavioral evidence of tinnitus in mice for metabolomics analysis; Figure S2. Nrf2 deficiency induces gut microbiota dysbiosis and metabolic alterations in mice; Table S1. Gene primer sequences for RT-PCR; Table S2. Volcano plot data of 34 differential metabolites.
Author Contributions
Conceptualization, Y.S., H.W. and J.Y.; methodology, J.Y., M.S., Y.C., Y.X. and F.H.; software, H.Y. and M.S.; validation, Y.L. and M.S.; formal analysis, H.Y.; investigation, H.Y., Y.X. and Q.C.; resources, H.Y. and Y.C.; data curation, H.Y. and Y.S.; writing—original draft preparation, H.Y. and Y.X.; writing—review and editing, Y.S., H.W., J.Y., Z.Y. and F.H.; visualization, H.Y. and Y.X.; supervision, Y.S.; project administration, Y.S.; funding acquisition, Y.S. and Q.C. All authors have read and agreed to the published version of the manuscript.
Funding
This research was funded by the Key Program of the National Natural Science Foundation of China (No. 82430035), the Foundation for Innovative Research Groups of Hubei Province (No. 2023AFA038), the National Key Research and Development Program of China (Nos. 2021YFF0702303, 2024YFC2511101, 2023YFE0203200), the Fundamental Research Funds for the Central Universities (No.2024BRA019) and the Fundamental Research Funds for the Central Universities (No. YCJJ20242120).
Institutional Review Board Statement
The animal study protocol was approved by the Institutional Animal Care and Use Committee (IACUC) of Huazhong University of Science and Technology (IACUC number 3638, approval date October 13, 2021).
Informed Consent Statement
Not applicable.
Data Availability Statement
The raw data supporting the conclusions of this article will be made available by the authors on request.
Acknowledgments
We would like to express our sincere gratitude to Professor Zhentao Zhang from the Department of Neurology at Renmin Hospital, Wuhan University, for his invaluable guidance and support throughout this research.
Conflicts of Interest
The authors declare no conflicts of interest.
References
- Jarach, C.M.; Lugo, A.; Scala, M.; van den Brandt, P.A.; Cederroth, C.R.; Odone, A.; Garavello, W.; Schlee, W.; Langguth, B.; Gallus, S. Global Prevalence and Incidence of Tinnitus: A Systematic Review and Meta-analysis. JAMA Neurol. 2022, 79, 888–900. [Google Scholar] [CrossRef] [PubMed]
- Mølhave, M.; Udholm, S.; Hawton, K.; Ovesen, T.; Erlangsen, A. Association between hospital-diagnosed tinnitus and suicide: A Nationwide Danish longitudinal study. J. Psychosom. Res. 2024, 185, 111879. [Google Scholar] [CrossRef]
- Henton, A.; Tzounopoulos, T. What’s the buzz? The neuroscience and the treatment of tinnitus. Physiol. Rev. 2021, 101, 1609–1632. [Google Scholar] [CrossRef]
- Baguley, D.; McFerran, D.; Hall, D. Tinnitus. Lancet 2013, 382, 1600–1607. [Google Scholar] [CrossRef] [PubMed]
- Lockwood, A.H.; Salvi, R.J.; Burkard, R.F. Tinnitus. N Engl J Med 2002, 347, 904–910. [Google Scholar] [CrossRef]
- Shore, S.E.; Wu, C. Mechanisms of Noise-Induced Tinnitus: Insights from Cellular Studies. Neuron 2019, 103, 8–20. [Google Scholar] [CrossRef] [PubMed]
- Schaette, R. Tinnitus in men, mice (as well as other rodents), and machines. Hear. Res. 2014, 311, 63–71. [Google Scholar] [CrossRef]
- Henry, J.A.; Roberts, L.E.; Caspary, D.M.; Theodoroff, S.M.; Salvi, R.J. Underlying Mechanisms of Tinnitus: Review and Clinical Implications. J. Am. Acad. Audiol. 2014, 25, 5–22, quiz 126. [Google Scholar] [CrossRef]
- Wang, W.; Zhang, L.S.; Zinsmaier, A.K.; Patterson, G.; Leptich, E.J.; Shoemaker, S.L.; Yatskievych, T.A.; Gibboni, R.; Pace, E.; Luo, H.; et al. Neuroinflammation mediates noise-induced synaptic imbalance and tinnitus in rodent models. PLOS Biol. 2019, 17, e3000307. [Google Scholar] [CrossRef] [PubMed]
- Sanchez, T.G.; de Medeiros, R.T.; Levy, C.P.D.; Ramalho, J.d.R.O.; Bento, R.F. Tinnitus in normally hearing patients: clinical aspects and repercussions. Braz. J. Otorhinolaryngol. 2015, 71, 427–431. [Google Scholar] [CrossRef]
- Guest, H.; Munro, K.J.; Prendergast, G.; Howe, S.; Plack, C.J. Tinnitus with a normal audiogram: Relation to noise exposure but no evidence for cochlear synaptopathy. Hear. Res. 2017, 344, 265–274. [Google Scholar] [CrossRef] [PubMed]
- Gu, J.W.; Herrmann, B.S.; Levine, R.A.; Melcher, J.R. Brainstem Auditory Evoked Potentials Suggest a Role for the Ventral Cochlear Nucleus in Tinnitus. J. Assoc. Res. Otolaryngol. 2012, 13, 819–833. [Google Scholar] [CrossRef] [PubMed]
- Schaette, R.; McAlpine, D. Tinnitus with a Normal Audiogram: Physiological Evidence for Hidden Hearing Loss and Computational Model. J. Neurosci. 2011, 31, 13452–13457. [Google Scholar] [CrossRef] [PubMed]
- Liberman, M.C.; Kujawa, S.G. Cochlear synaptopathy in acquired sensorineural hearing loss: Manifestations and mechanisms. Hear. Res. 2017, 349, 138–147. [Google Scholar] [CrossRef] [PubMed]
- Malfatti, T.; Ciralli, B.; Hilscher, M.M.; Leao, R.N.; Leao, K.E. Decreasing dorsal cochlear nucleus activity ameliorates noise-induced tinnitus perception in mice. BMC Biol. 2022, 20, 102. [Google Scholar] [CrossRef]
- Miyakawa, A.; Wang, W.; Cho, S.-J.; Li, D.; Yang, S.; Bao, S. Tinnitus Correlates with Downregulation of Cortical Glutamate Decarboxylase 65 Expression But Not Auditory Cortical Map Reorganization. J. Neurosci. 2019, 39, 9989–10001. [Google Scholar] [CrossRef]
- Liu, P.; Xue, X.; Zhang, C.; Zhou, H.; Ding, Z.; Wang, L.; Jiang, Y.; Shen, W.; Yang, S.; Wang, F. Transcriptional Profile Changes after Noise-Induced Tinnitus in Rats. Brain Sci. 2023, 13, 573. [Google Scholar] [CrossRef]
- He, J.; Zhu, Y.; Aa, J.; Smith, P.F.; De Ridder, D.; Wang, G.; Zheng, Y. Brain Metabolic Changes in Rats following Acoustic Trauma. Front. Neurosci. 2017, 11, 148. [Google Scholar] [CrossRef]
- Chen, S.; Sun, Y.; Lin, X.; Kong, W. Down regulated connexin26 at different postnatal stage displayed different types of cellular degeneration and formation of organ of Corti. Biochem. Biophys. Res. Commun. 2014, 445, 71–77. [Google Scholar] [CrossRef] [PubMed]
- Noreña, A.J.; Eggermont, J.J. Enriched acoustic environment after noise trauma abolishes neural signs of tinnitus. NeuroReport 2006, 17, 559–563. [Google Scholar] [CrossRef] [PubMed]
- Sturm, J.J.; Zhang-Hooks, Y.-X.; Roos, H.; Nguyen, T.; Kandler, K. Noise Trauma-Induced Behavioral Gap Detection Deficits Correlate with Reorganization of Excitatory and Inhibitory Local Circuits in the Inferior Colliculus and Are Prevented by Acoustic Enrichment. J. Neurosci. 2017, 37, 6314–6330. [Google Scholar] [CrossRef] [PubMed]
- Turner, J.G.; Brozoski, T.J.; Bauer, C.A.; Parrish, J.L.; Myers, K.; Hughes, L.F.; Caspary, D.M. Gap detection deficits in rats with tinnitus: A potential novel screening tool. Behav. Neurosci. 2006, 120, 188–195. [Google Scholar] [CrossRef]
- Park, S.Y.; Kim, M.J.; Park, J.M.; Park, S.N. A Mouse Model of Tinnitus Using Gap Prepulse Inhibition of the Acoustic Startle in an Accelerated Hearing Loss Strain. Otol Neurotol 2020, 41, e516–e525. [Google Scholar] [CrossRef]
- Longenecker, R.J.; Kristaponyte, I.; Nelson, G.L.; Young, J.W.; Galazyuk, A.V. Addressing variability in the acoustic startle reflex for accurate gap detection assessment. Hear. Res. 2018, 363, 119–135. [Google Scholar] [CrossRef] [PubMed]
- Li, S.; Choi, V.; Tzounopoulos, T. Pathogenic plasticity of Kv7. 2/3 channel activity is essential for the induction of tinnitus. Proc Natl Acad Sci U S A 2013, 110, 9980–9985. [Google Scholar] [CrossRef] [PubMed]
- Huang, F.; Huffman, K.E.; Wang, Z.; Wang, X.; Li, K.; Cai, F.; Yang, C.; Cai, L.; Shih, T.S.; Zacharias, L.G.; et al. Guanosine triphosphate links MYC-dependent metabolic and ribosome programs in small-cell lung cancer. J. Clin. Investig. 2021, 131. [Google Scholar] [CrossRef] [PubMed]
- Pang, Z.; Lu, Y.; Zhou, G.; Hui, F.; Xu, L.; Viau, C.; Spigelman, A.F.; MacDonald, P.E.; Wishart, D.S.; Li, S.; et al. MetaboAnalyst 6.0: towards a unified platform for metabolomics data processing, analysis and interpretation. Nucleic Acids Res. 2024, 52, W398–W406. [Google Scholar] [CrossRef]
- Chen, Y.; Zhang, R.; Song, Y.; He, J.; Sun, J.; Bai, J.; An, Z.; Dong, L.; Zhan, Q.; Abliz, Z. RRLC-MS/MS-based metabonomics combined with in-depth analysis of metabolic correlation network: finding potential biomarkers for breast cancer. Analyst 2009, 134, 2003–2011. [Google Scholar] [CrossRef] [PubMed]
- Li, N.; Cai, Q.-M.; Hu, N.-Y.; Jiang, S.-L.; Chen, F.-Q.; Hu, Q.-Q.; Yang, F.; He, C.-Z. Pyrosequencing analysis of bacterial community changes in dental unit waterlines after chlorogenic acid treatment. Front. Cell. Infect. Microbiol. 2024, 14, 1303099. [Google Scholar] [CrossRef] [PubMed]
- Dang, D.-K.; Shin, E.-J.; Nam, Y.; Ryoo, S.; Jeong, J.H.; Jang, C.-G.; Nabeshima, T.; Hong, J.-S.; Kim, H.-C. Apocynin prevents mitochondrial burdens, microglial activation, and pro-apoptosis induced by a toxic dose of methamphetamine in the striatum of mice via inhibition of p47phox activation by ERK. J. Neuroinflammation 2016, 13, 12. [Google Scholar] [CrossRef]
- Noto, A.; Piras, C.; Atzori, L.; Mussap, M.; Albera, A.; Albera, R.; Casani, A.P.; Capobianco, S.; Fanos, V. Metabolomics in Otorhinolaryngology. Front. Mol. Biosci. 2022, 9, 934311. [Google Scholar] [CrossRef]
- Iskusnykh, I.Y.; Zakharova, A.A.; Pathak, D. Glutathione in Brain Disorders and Aging. Molecules 2022, 27, 324. [Google Scholar] [CrossRef]
- Lu, S.C. Regulation of glutathione synthesis. Mol. Asp. Med. 2009, 30, 42–59. [Google Scholar] [CrossRef] [PubMed]
- Saeedi, B.J.; Liu, K.H.; Owens, J.A.; Hunter-Chang, S.; Camacho, M.C.; Eboka, R.U.; Chandrasekharan, B.; Baker, N.F.; Darby, T.M.; Robinson, B.S.; et al. Gut-Resident Lactobacilli Activate Hepatic Nrf2 and Protect Against Oxidative Liver Injury. Cell Metab. 2020, 31, 956–968.e5. [Google Scholar] [CrossRef] [PubMed]
- Zeleznik, O.A.; Welling, D.B.; Stankovic, K.; Frueh, L.; Balasubramanian, R.; Curhan, G.C.; Curhan, S.G. Association of Plasma Metabolomic Biomarkers With Persistent Tinnitus: A Population-Based Case-Control Study. JAMA Otolaryngol Head Neck Surg 2023, 149, 404–415. [Google Scholar] [CrossRef]
- Wang, J.; Xiang, J.-H.; Peng, X.-Y.; Liu, M.; Sun, L.-J.; Zhang, M.; Zhang, L.-Y.; Chen, Z.-B.; Tang, Z.-Q.; Cheng, L. Characteristic alterations of gut microbiota and serum metabolites in patients with chronic tinnitus: a multi-omics analysis. Microbiol. Spectr. 2024, e0187824. [Google Scholar] [CrossRef] [PubMed]
- Tan, Y.; Lu, C.; Jiang, M.; Zhao, N.; Li, L.; Shen, S.; Guan, F.; He, B.; Xiao, C.; Aiping L; et al. Exploring pathogenesis in subjects with subjective Tinnitus having kidney deficiency pattern in terms of Traditional Chinese Medicine based on serum metabolic profiles. J Tradit Chin Med 2018, 38, 773–780. [Google Scholar]
- Maniaci, A.; La Via, L.; Lechien, J.R.; Sangiorgio, G.; Iannella, G.; Magliulo, G.; Pace, A.; Mat, Q.; Lavalle, S.; Lentini, M. Hearing Loss and Oxidative Stress: A Comprehensive Review. Antioxidants 2024, 13, 842. [Google Scholar] [CrossRef] [PubMed]
- Lai, H.; Yin, J.; Yang, H. Association of oxidative balance score with hearing loss and tinnitus: NHANES 1999–2018. Front. Nutr. 2024, 11, 1421605. [Google Scholar] [CrossRef] [PubMed]
- Tomanic, M.; Belojevic, G.; Jovanovic, A.; Vasiljevic, N.; Davidovic, D.; Maksimovic, K. Dietary Factors and Tinnitus among Adolescents. Nutrients 2020, 12, 3291. [Google Scholar] [CrossRef] [PubMed]
- Ekinci, A.; Kamasak, K. Evaluation of serum prolidase enzyme activity and oxidative stress in patients with tinnitus. Braz. J. Otorhinolaryngol. 2020, 86, 405–410. [Google Scholar] [CrossRef] [PubMed]
- Petridou, A.I.; Zagora, E.T.; Petridis, P.; Korres, G.S.; Gazouli, M.; Xenelis, I.; Kyrodimos, E.; Kontothanasi, G.; Kaliora, A.C. The Effect of Antioxidant Supplementation in Patients with Tinnitus and Normal Hearing or Hearing Loss: A Randomized, Double-Blind, Placebo Controlled Trial. Nutrients 2019, 11, 3037. [Google Scholar] [CrossRef]
- Honkura, Y.; Matsuo, H.; Murakami, S.; Sakiyama, M.; Mizutari, K.; Shiotani, A.; Yamamoto, M.; Morita, I.; Shinomiya, N.; Kawase, T.; et al. NRF2 Is a Key Target for Prevention of Noise-Induced Hearing Loss by Reducing Oxidative Damage of Cochlea. Sci. Rep. 2016, 6, 19329–19329. [Google Scholar] [CrossRef]
- Marzec, J.M.; Christie, J.D.; Reddy, S.P.; Jedlicka, A.E.; Vuong, H.; Lanken, P.N.; Aplenc, R.; Yamamoto, T.; Yamamoto, M.; Cho, H.-Y.; et al. Functional polymorphisms in the transcription factor NRF2 in humans increase the risk of acute lung injury. FASEB J. 2007, 21, 2237–2246. [Google Scholar] [CrossRef] [PubMed]
- Kondo, T.; Saigo, S.; Ugawa, S.; Kato, M.; Yoshikawa, Y.; Miyoshi, N.; Tanabe, K. Prebiotic effect of fructo-oligosaccharides on the inner ear of DBA/2 J mice with early-onset progressive hearing loss. J. Nutr. Biochem. 2020, 75, 108247. [Google Scholar] [CrossRef]
- Cui, B.; Su, D.; Li, W.; She, X.; Zhang, M.; Wang, R.; Zhai, Q. Effects of chronic noise exposure on the microbiome-gut-brain axis in senescence-accelerated prone mice: implications for Alzheimer’s disease. J. Neuroinflammation 2018, 15, 190. [Google Scholar] [CrossRef]
- Maggio-Price, L.; Bielefeldt-Ohmann, H.; Treuting, P.; Iritani, B.M.; Zeng, W.; Nicks, A.; Tsang, M.; Shows, D.; Morrissey, P.; Viney, J.L. Dual infection with Helicobacter bilis and Helicobacter hepaticus in p-glycoprotein-deficient mdr1a-/- mice results in colitis that progresses to dysplasia. Am J Pathol 2005, 166, 1793–1806. [Google Scholar] [CrossRef] [PubMed]
- Bloom, S.M.; Mafunda, N.A.; Woolston, B.M.; Hayward, M.R.; Frempong, J.F.; Abai, A.B.; Xu, J.; Mitchell, A.J.; Westergaard, X.; Hussain, F.A.; et al. Cysteine dependence of Lactobacillus iners is a potential therapeutic target for vaginal microbiota modulation. Nat. Microbiol. 2022, 7, 434–450. [Google Scholar] [CrossRef] [PubMed]
- Wang, K.; Liao, M.; Zhou, N.; Bao, L.; Ma, K.; Zheng, Z.; Wang, Y.; Liu, C.; Wang, W.; Wang, J.; et al. Parabacteroides distasonis Alleviates Obesity and Metabolic Dysfunctions via Production of Succinate and Secondary Bile Acids. Cell Rep. 2019, 26, 222–235.e5. [Google Scholar] [CrossRef]
Figure 1.
Noise exposure induces tinnitus behaviors without affecting hearing thresholds. (a) Experimental timeline. (b) Schematic representation of the protocol for the gap detection test/GPIAS and PPI. (c) Auditory thresholds of the animals were assessed before noise exposure (gray), 5 days after exposure (blue), and 14 days after exposure (red) (n = 5). Error bars represent SEM. (d-e) Exposure to 100 dB noise results in tinnitus in mice. Tinnitus was assessed using the gap detection test and PPI. Mice showing an increased gap detection ratio and no change in PPI were considered to exhibit behavioral evidence of tinnitus. No significant difference in the gap detection ratio was observed between the noise-exposed group (red) and the control group (gray) before exposure. However, the gap detection ratio of the noise-exposed mice was significantly higher than that of the control group on days 1, 3, and 7 post-exposure, indicating tinnitus-like behavior (d). By day 14 post-exposure, the gap detection ratio of some mice returned to baseline levels, suggesting the resolution of tinnitus-like behavior (d). The PPI responses of both the noise-exposed and control groups remained stable before and after exposure, with no significant differences observed (e). Each group consisted of 7 mice, with each dot representing a single mouse. The dashed lines between the dots indicate changes in the startle response rate for each individual mouse. ** and *** denote P < 0.01 and P < 0.001, respectively. GPIAS, the gap pre-pulse inhibition of acoustic startle test; PPI, pre-pulse inhibition; SEM, standard error of the mean.
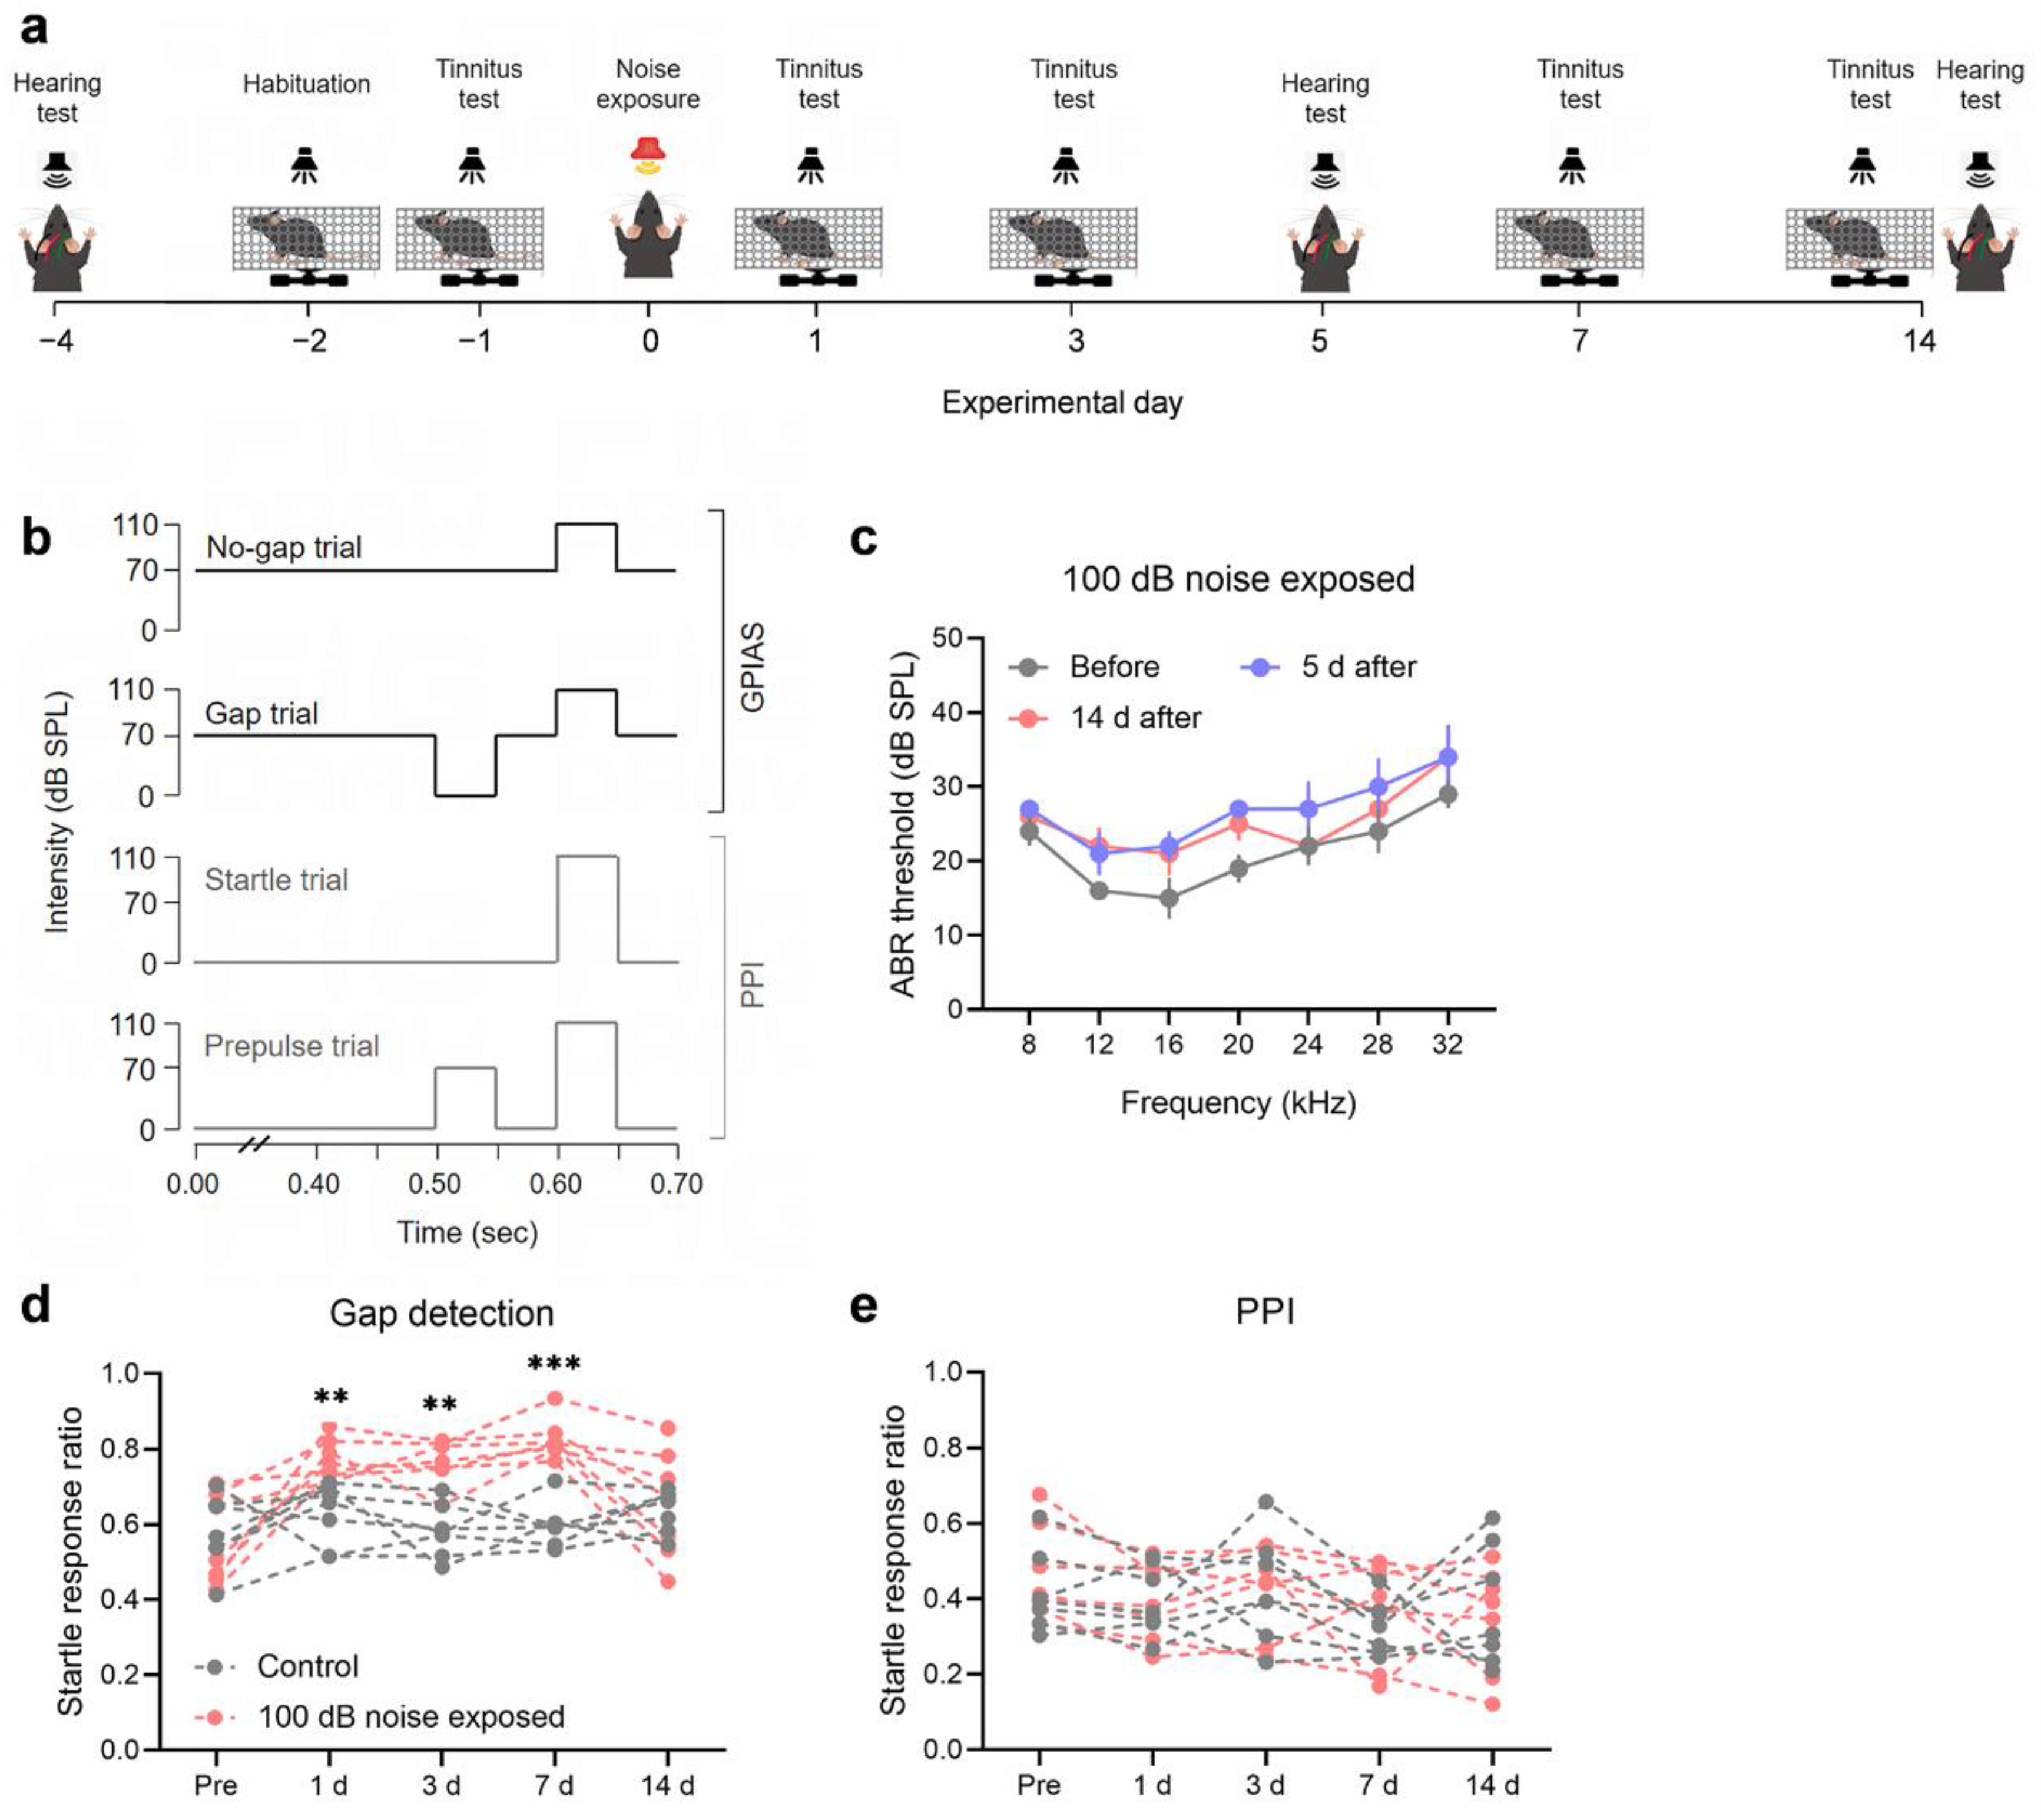
Figure 2.
Oxidative stress and redox-related pathways are enriched in the tinnitus group. (a) PCA of metabolomics data from the auditory cortex. A significant separation is observed between the tinnitus group (red) and the control group (grey) (n = 4). The ellipse represents the 95% confidence interval of the normal distribution, and each principal component is labeled with its corresponding percentage variance. (b) Volcano plot showing differential metabolites in the tinnitus group compared to the control group, with upregulated metabolites highlighted in red and downregulated metabolites in blue. The threshold for significance is set at a P-value < 0.05. Metabolites involved in oxidative stress and redox processes are highlighted in green. (c) Heatmap of the top 25 differentially regulated metabolites (upregulated in red and downregulated in blue) in the tinnitus group relative to the control group. Values are based on normalized data, as described in the Methods section. (d) Overview of the top 25 enriched metabolite sets related to pathways in the tinnitus group compared to the control group. (e-f) Quantification of glutathione in the auditory cortex. Panel (e) shows the ratio of reduced glutathione (GSH) to oxidized glutathione (GSSG) (GSH/GSSG), while panel (f) displays the levels of GSH, GSSG, and total GSH. Statistical significance was assessed using a non-paired two-tailed t-test. *P < 0.05. Data are presented as mean ± SEM (n = 4). PCA, Principal Component Analysis; SEM, standard error of the mean.
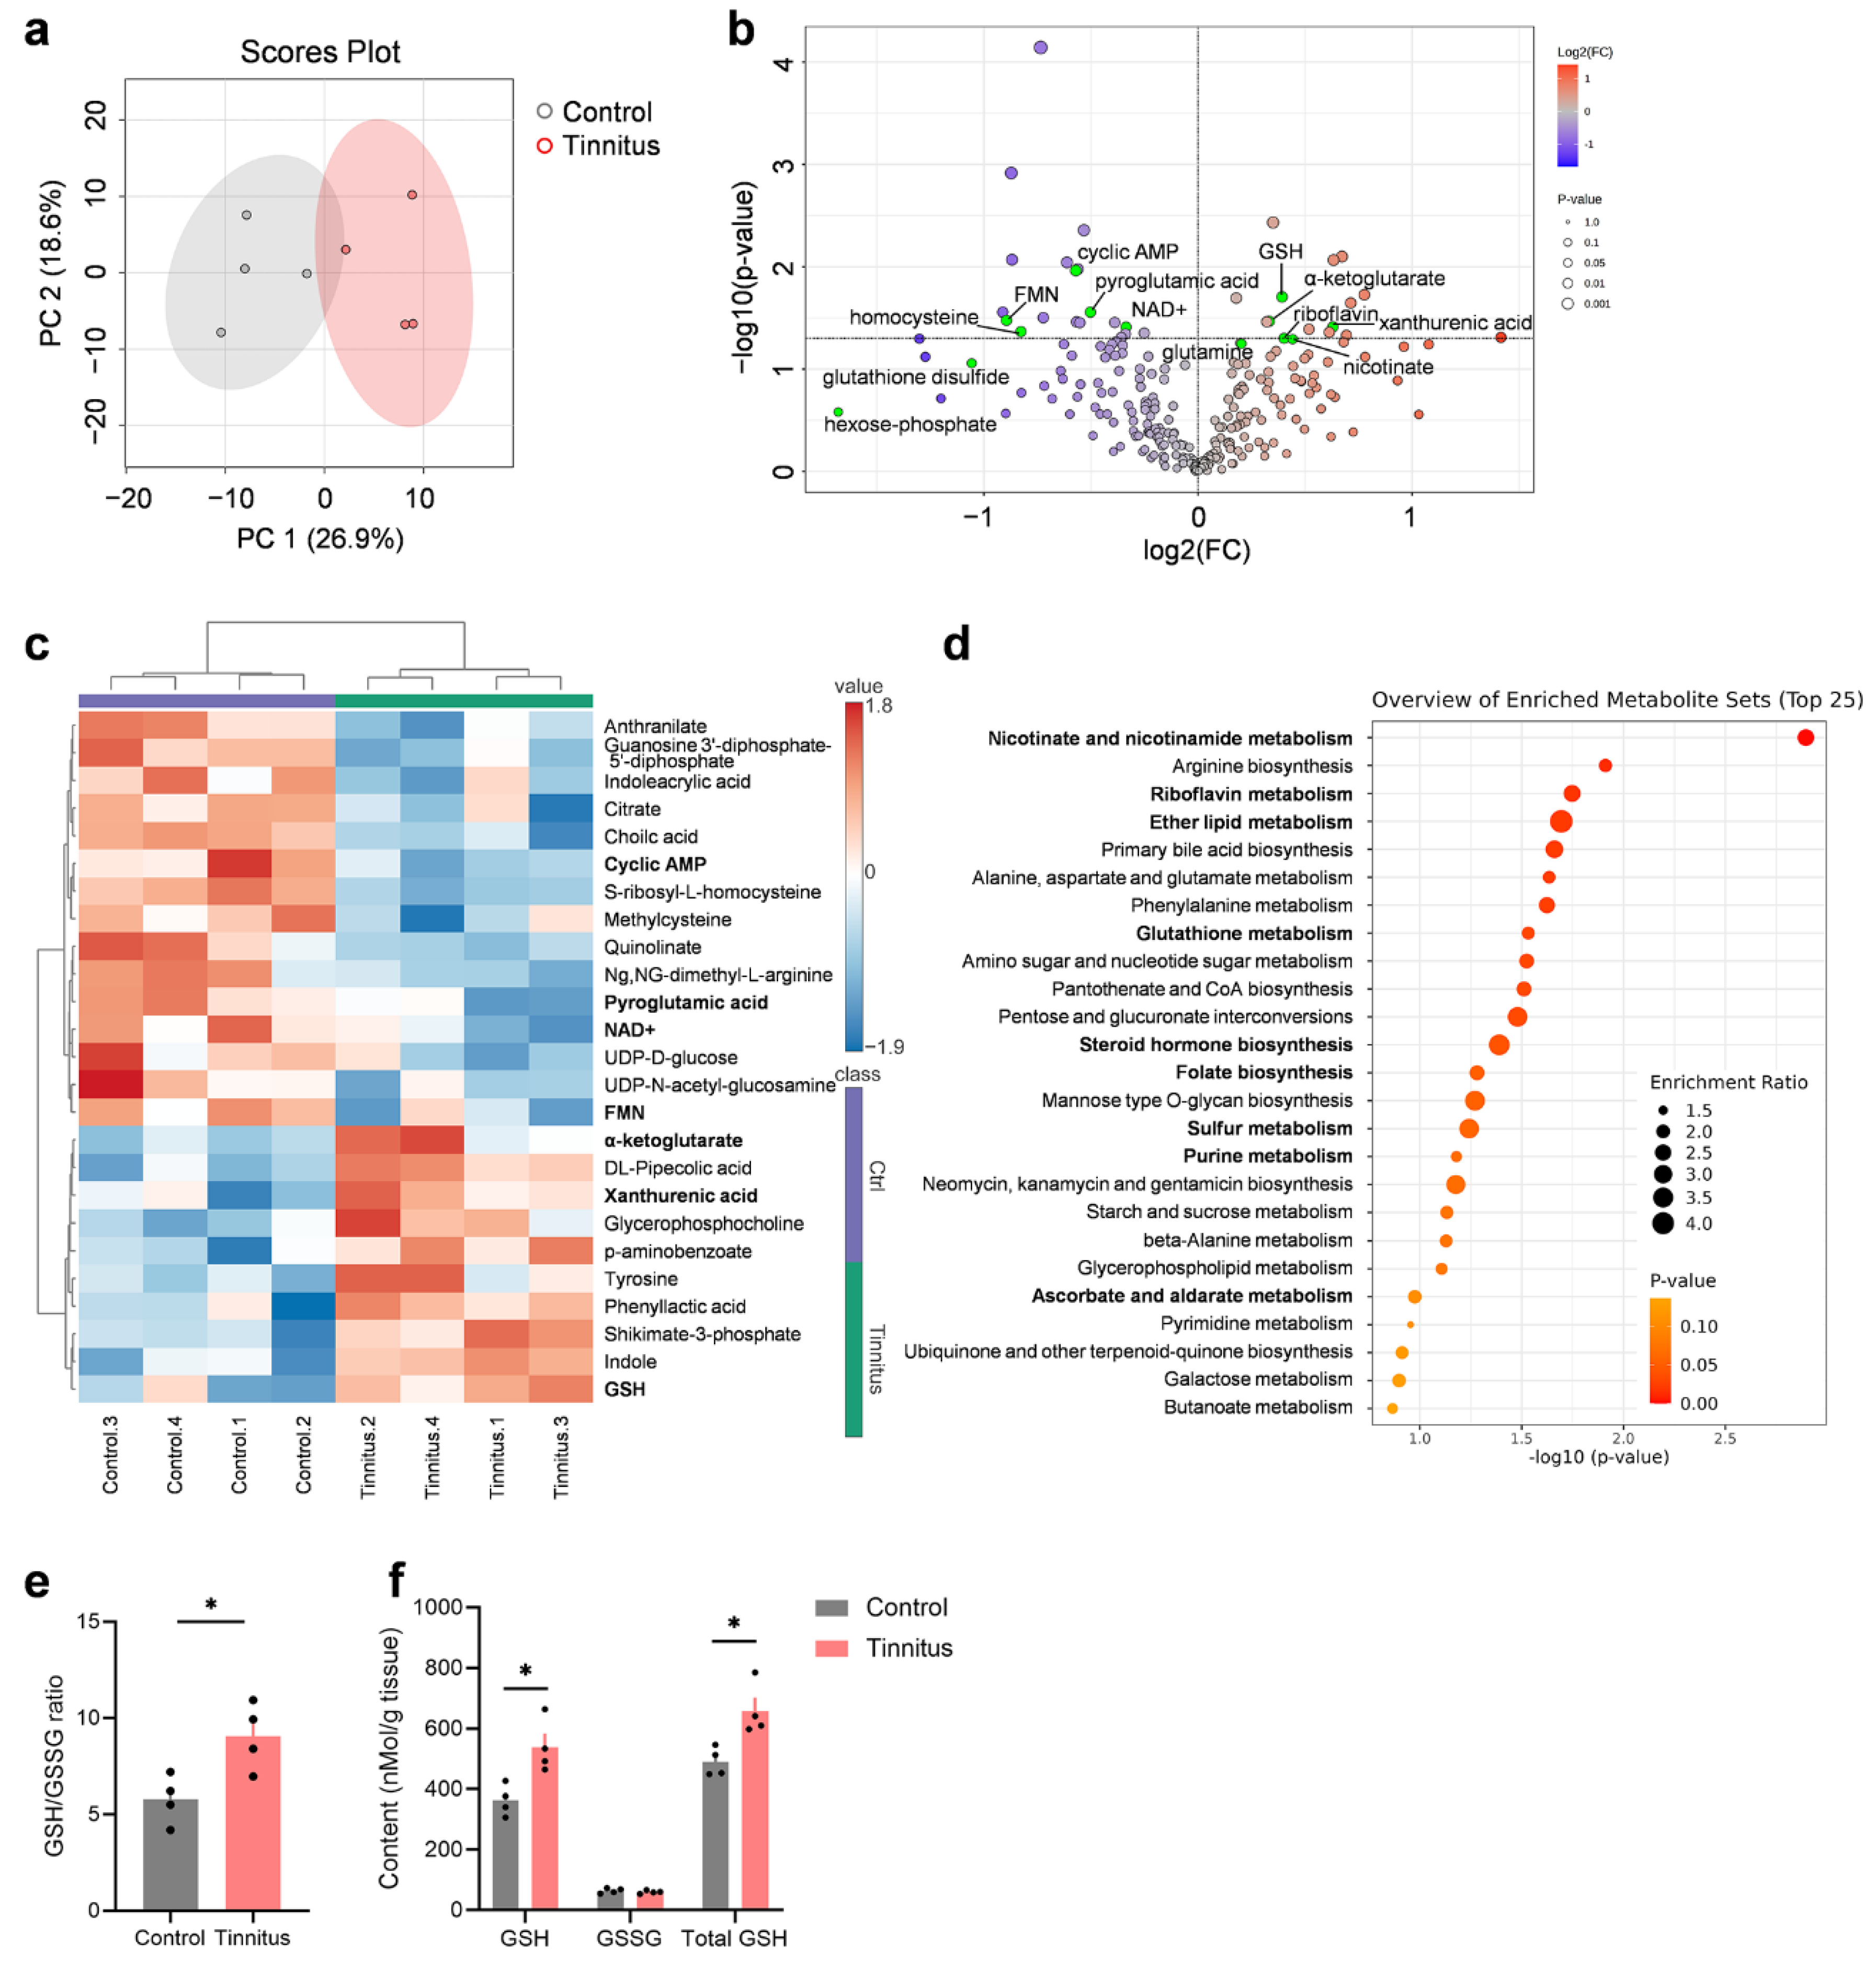
Figure 3.
Nrf2 deficiency results in a significant reduction in GSH levels in the auditory cortex but does not induce spontaneous tinnitus or hearing loss in mice. (a-b) Quantification of GSH in the auditory cortex shows a decreased GSH/GSSG ratio (a) and reduced levels of GSH and total GSH (b) in Nrf2-KO mice (n = 4). (c-e) No significant differences were observed in the gap detection test (c), PPI (d), or ABR thresholds (e) between 6-week-old Nrf2-KO mice and age-matched WT mice. Statistical analysis was performed using an unpaired two-tailed t-test. For behavioral tests, 33 mice were included per group, and for auditory tests, 29 mice per group were used. (f-g) The gap detection test (f) and PPI (g) results in Nrf2-KO mice remained stable throughout a 2-week monitoring period. Statistical analysis was conducted using a two-way repeated measures ANOVA (n = 7). (h) No significant differences were found in ABR thresholds between 8-week-old Nrf2-KO and WT mice (n = 4). Error bars represent the SEM. Statistical significance is indicated by ***P < 0.001 and ****P < 0.0001. Nrf2, nuclear factor erythroid 2-related factor 2; GSH, glutathione; Nrf2-KO, Nrf2 knockout; WT, wild-type; PPI, pre-pulse inhibition; ABR, auditory brainstem response; ANOVA, analysis of variance; SEM, standard error of the mean.
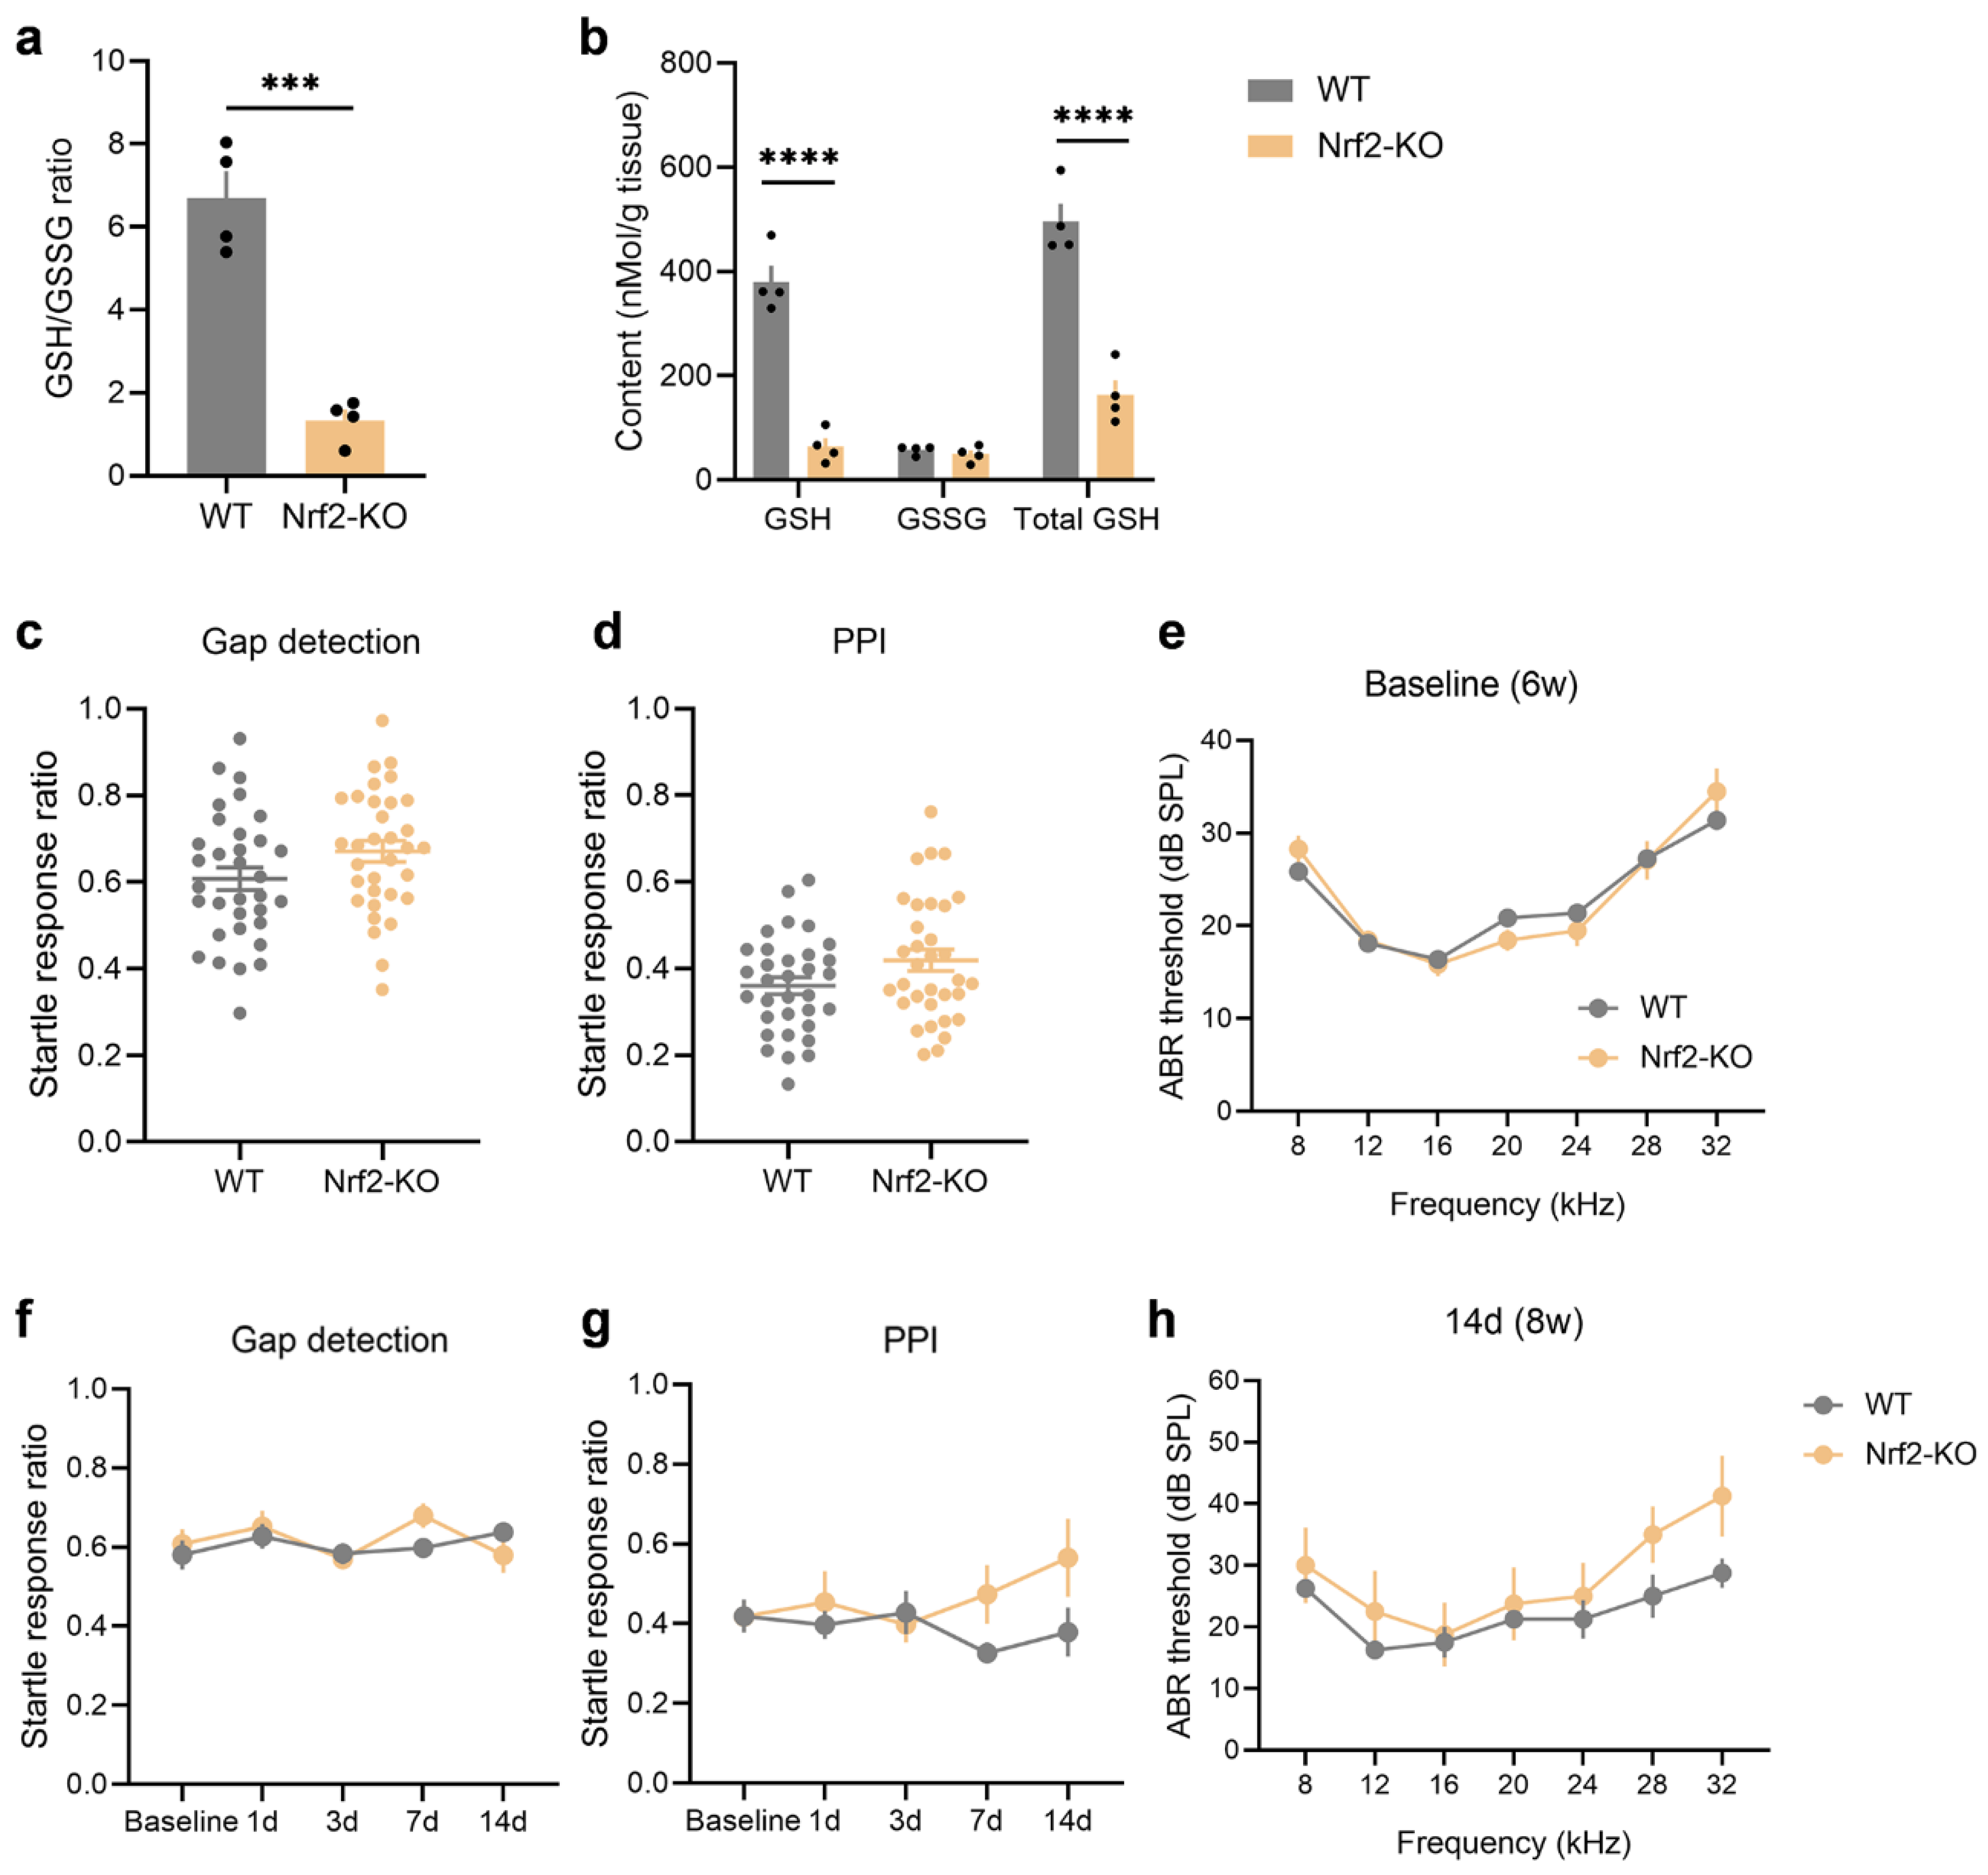
Figure 4.
Nrf2-KO mice exhibit increased susceptibility to noise-induced tinnitus. (a-b) Gap detection tests (a) and PPI (b) were assessed over a 14-day period following exposure to 90 dB SPL noise (n = 7). Statistical analysis was conducted using a genotype × noise exposure two-way repeated measures ANOVA. (c-d) ABR thresholds were evaluated 5 days (c) and 14 days (d) post-exposure to 90 dB SPL noise, with statistical comparisons made using multiple t-tests (n = 4). (e-f) Gap detection tests (e) and PPI (f) were also monitored over 14 days after exposure to 100 dB SPL noise (n = 7). Asterisk (*) indicates statistically significant differences compared to baseline values (P < 0.05), with colors representing the respective animal group. (g-h) ABR thresholds were assessed 5 days (g) and 14 days (h) after 100 dB SPL noise exposure (n = 3 for the Nrf2-KO group and n = 4 for the WT group). All error bars represent the SEM. ***P < 0.001. Nrf2-KO, nuclear factor erythroid 2-related factor 2 knockout; PPI, pre-pulse inhibition; ANOVA, analysis of variance; ABR, auditory brainstem response; WT, wild-type; SEM, standard error of the mean.
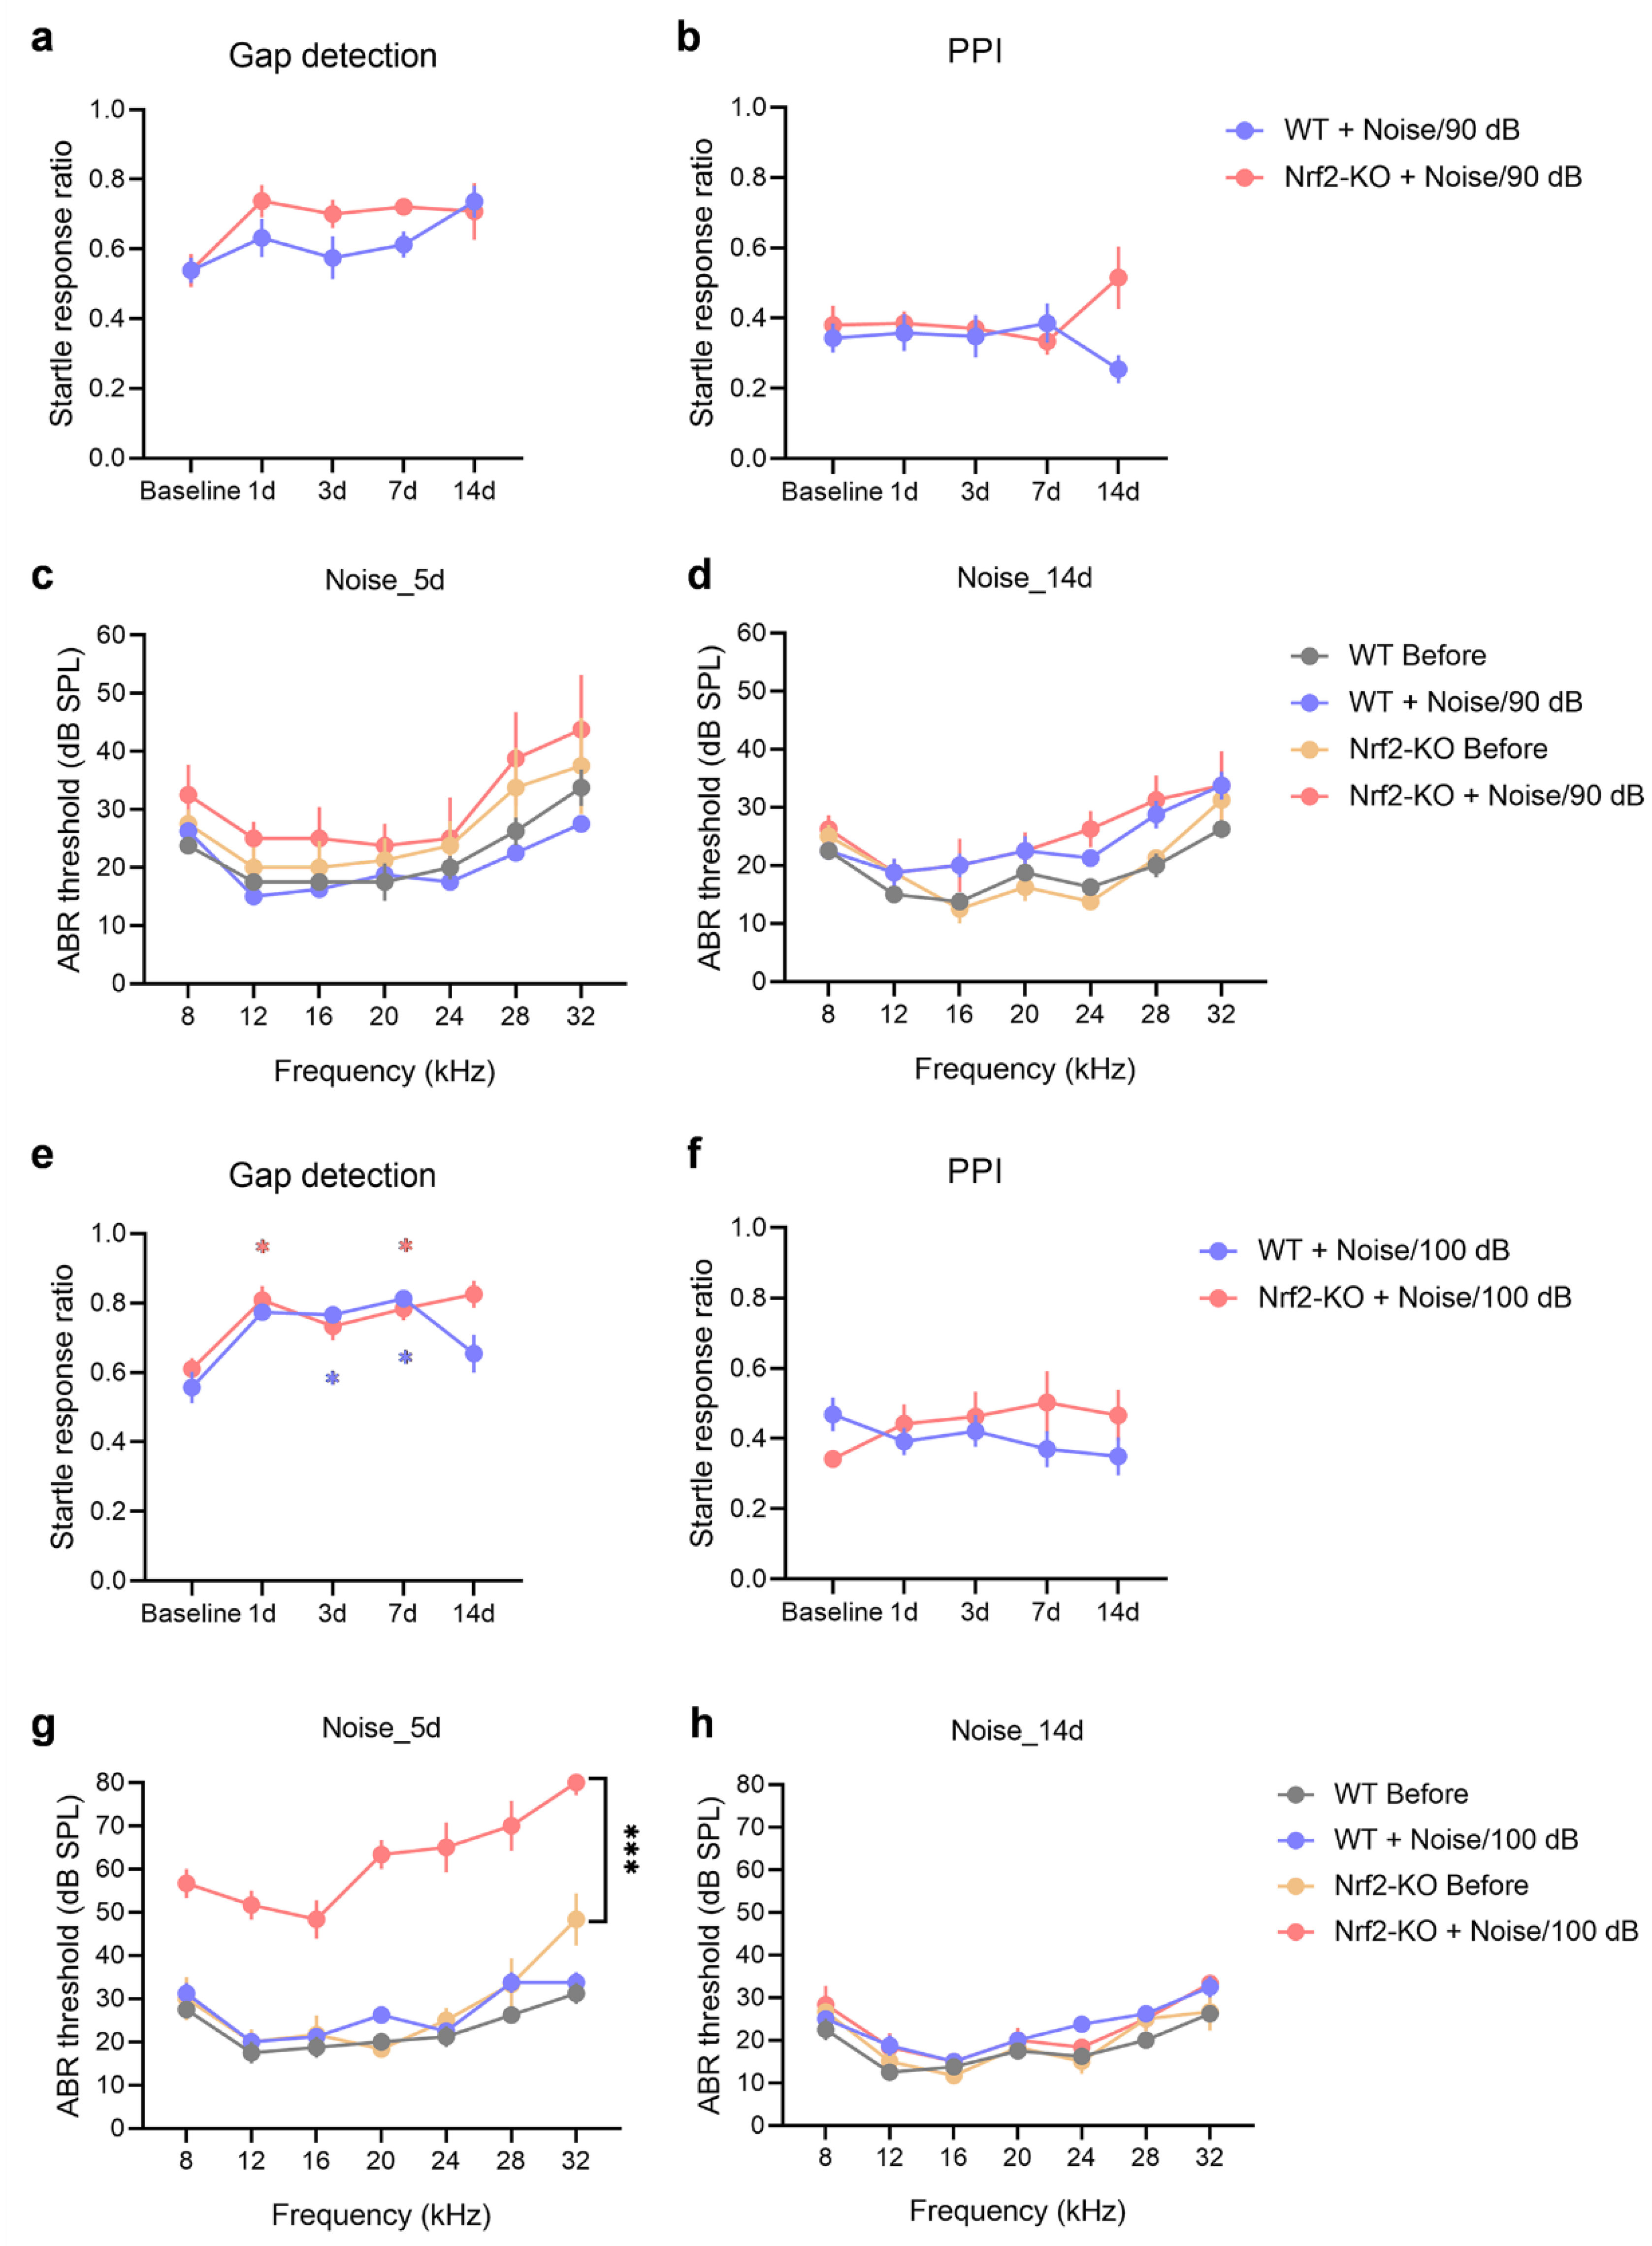
Figure 5.
Microglial deramification is observed in Nrf2-KO mice after 90 dB SPL noise exposure, but not in WT mice. (a) Representative images of IBA1-stained microglia in the auditory cortex of Nrf2-KO and WT mice under control conditions and following noise exposure. In the control group, microglia displayed a ramified morphology, indicative of a resting state. After 5 and 14 days of noise exposure, some microglia in the Nrf2-KO group exhibited activated morphology (white arrows), whereas no morphological changes were observed in the WT group. (b-d) Microglial morphological alterations were quantified as indicators of activation. Five days post-exposure, the number of microglial branches significantly decreased in the Nrf2-KO group (b). At both 5 and 14 days after noise exposure, the total branch length of microglia in the Nrf2-KO group was significantly reduced (c), and the ratio of the cell body to total cell size increased (d), suggesting enhanced microglial activation. No significant differences were observed in the microglial activation index in the WT group (n = 4 or 5). Scale bars = 50 μm and 10 μm. Data are expressed as mean ± SEM. *, **, and *** denote P < 0.05, P < 0.01, and P < 0.001, respectively, for comparisons between Nrf2-KO and WT groups. ### indicates P < 0.001 compared to control groups, with color coding representing the group being compared. Nrf2-KO, nuclear factor erythroid 2-related factor 2 knockout; WT, wild-type; IBA1, ionized calcium-binding adapter molecule 1; SEM, standard error of the mean.
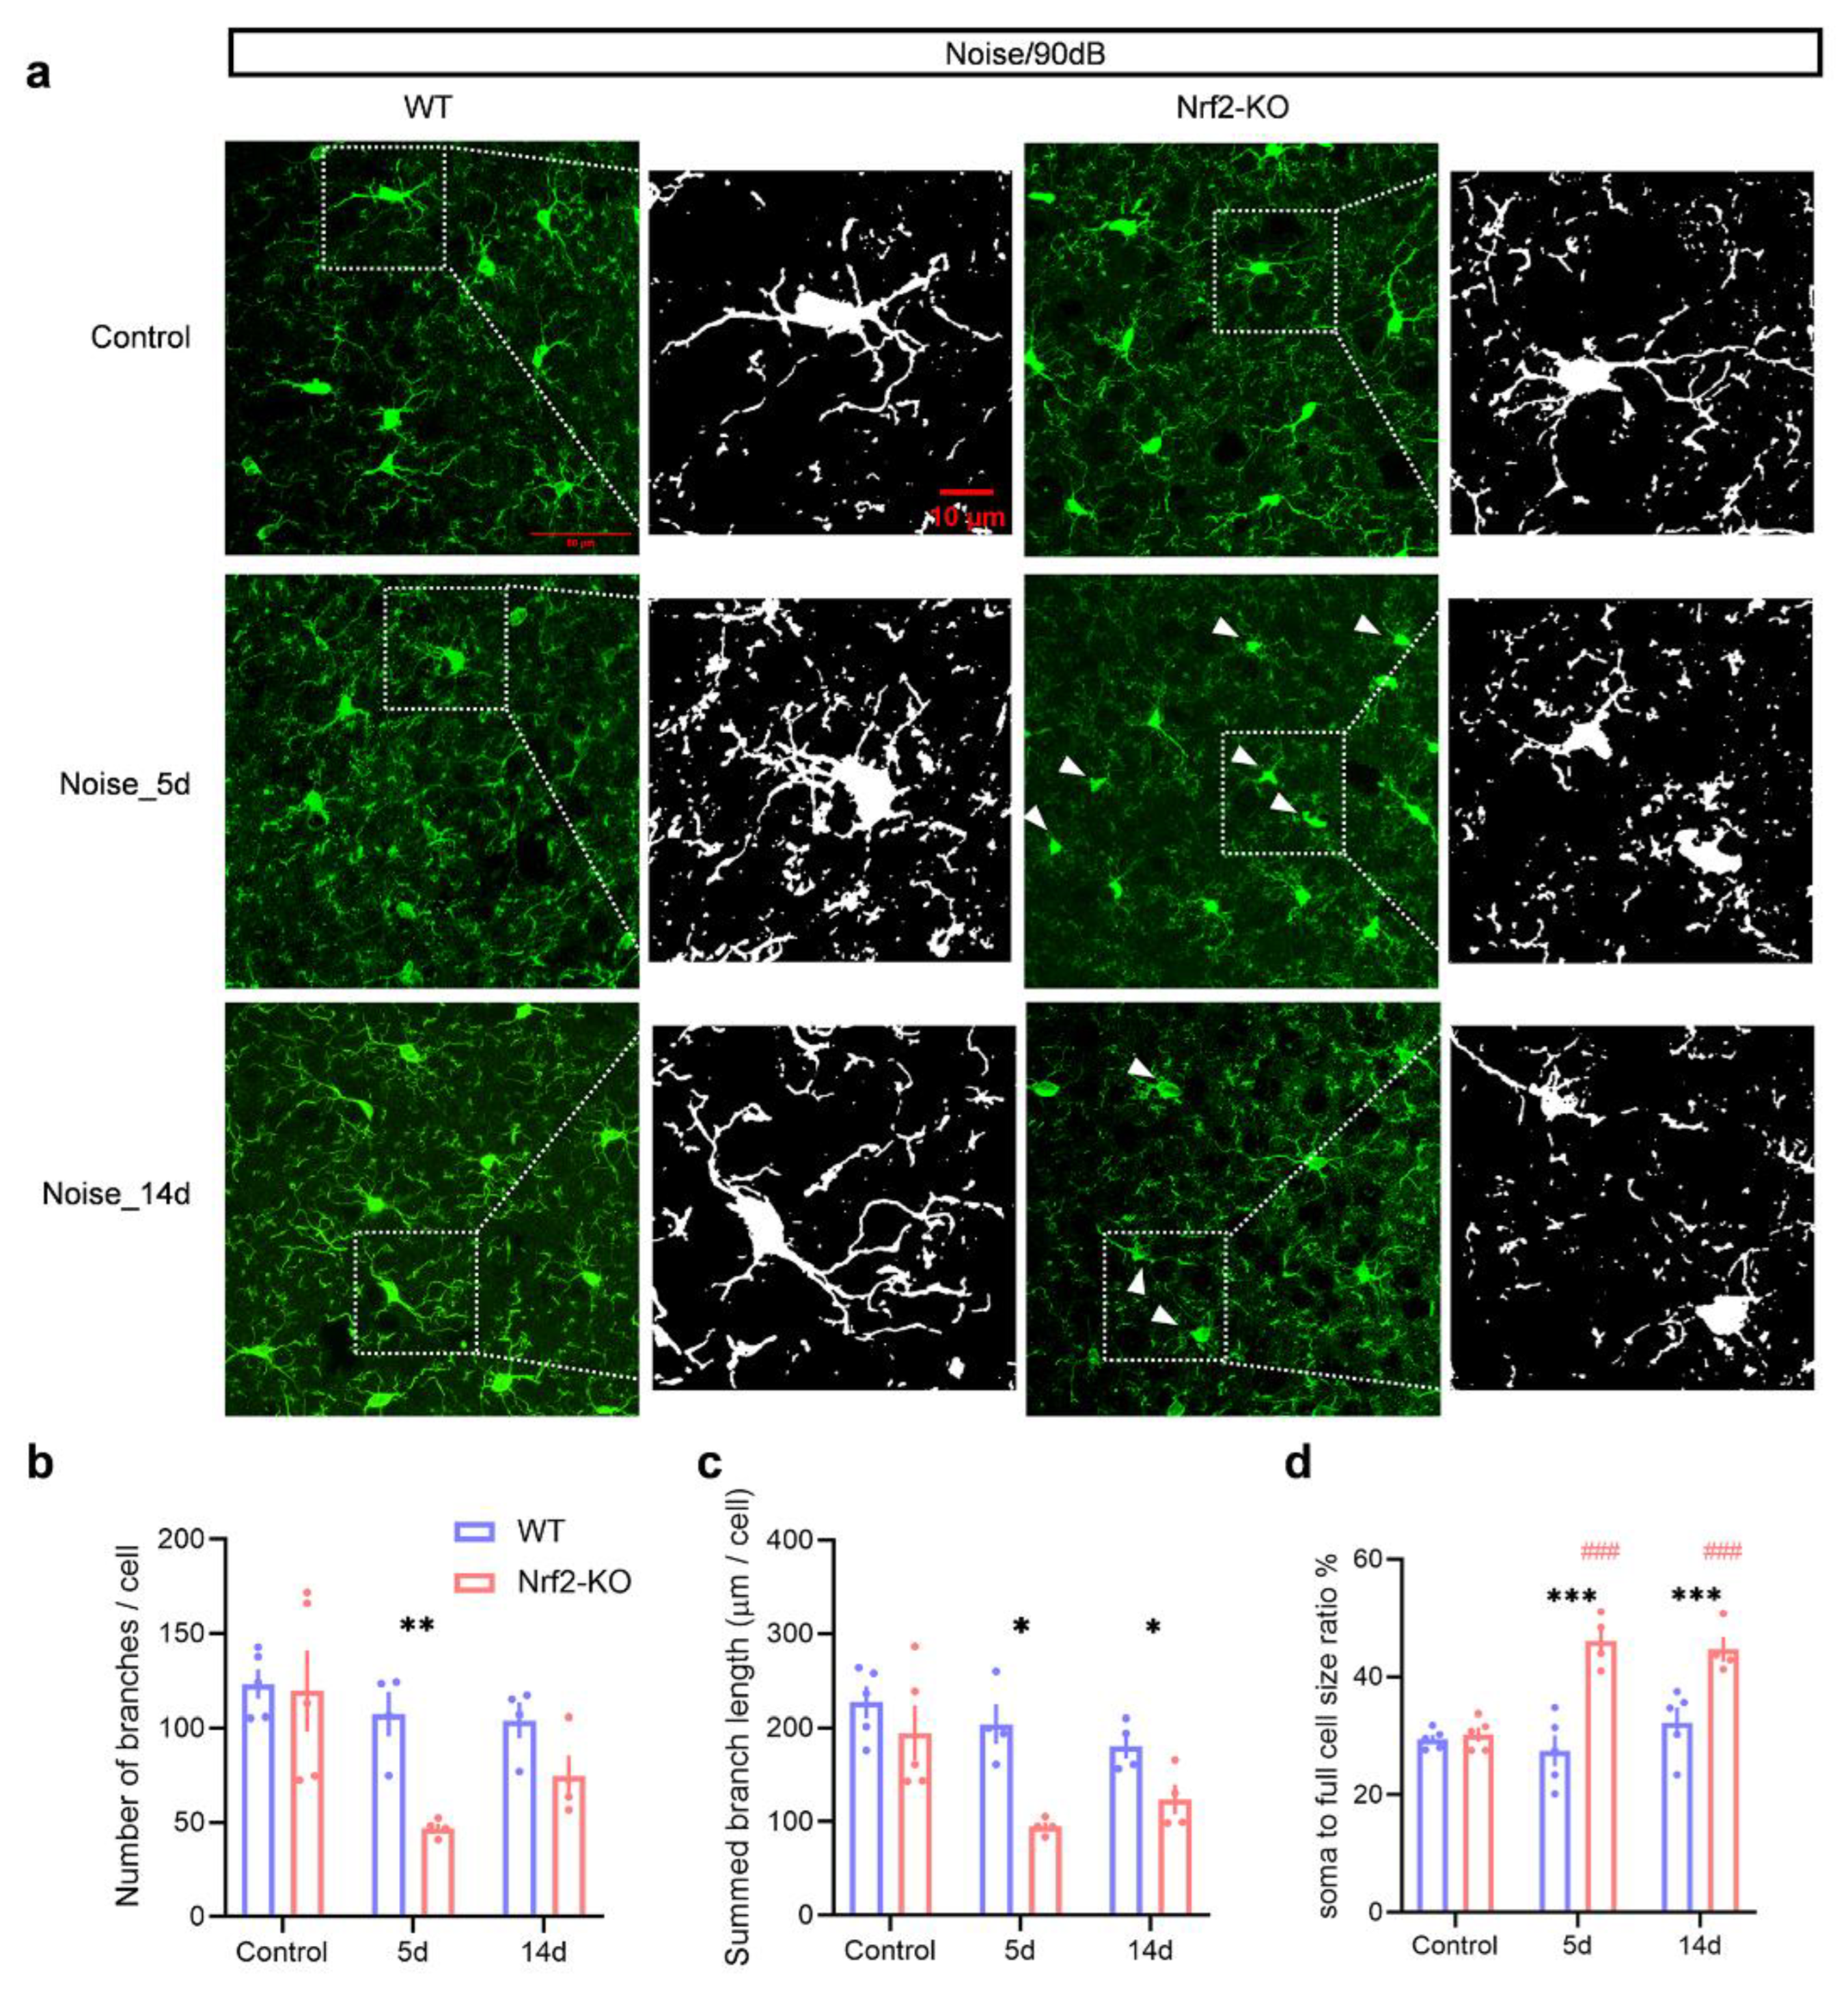
Figure 6.
Microglial deramification in both Nrf2-KO and WT mice following 100 dB SPL noise exposure. (a) Representative images of IBA1-stained microglia in the auditory cortex of Nrf2-KO and WT mice under control conditions, and at 5- and 14-days post-exposure. Both groups showed activated microglia at 5- and 14-days post-exposure (white arrowheads). (b-d) From 5 to 14 days after exposure, both Nrf2-KO and WT mice exhibited significant reductions in the number of microglial branches (b), total branch length (c), and an increase in the soma-to-cell size ratio (d). Activation indices were also elevated in both groups. No significant differences were observed between the Nrf2-KO and WT groups (n = 4 or 5). Scale bars = 50 μm and 10 μm. Error bars represent the SEM. ### indicates P < 0.001 compared to control. Nrf2-KO, nuclear factor erythroid-2-related factor 2 (Nrf2) knockout; WT, wild-type; IBA1, ionized calcium-binding adapter molecule 1; SEM, standard error of the mean.
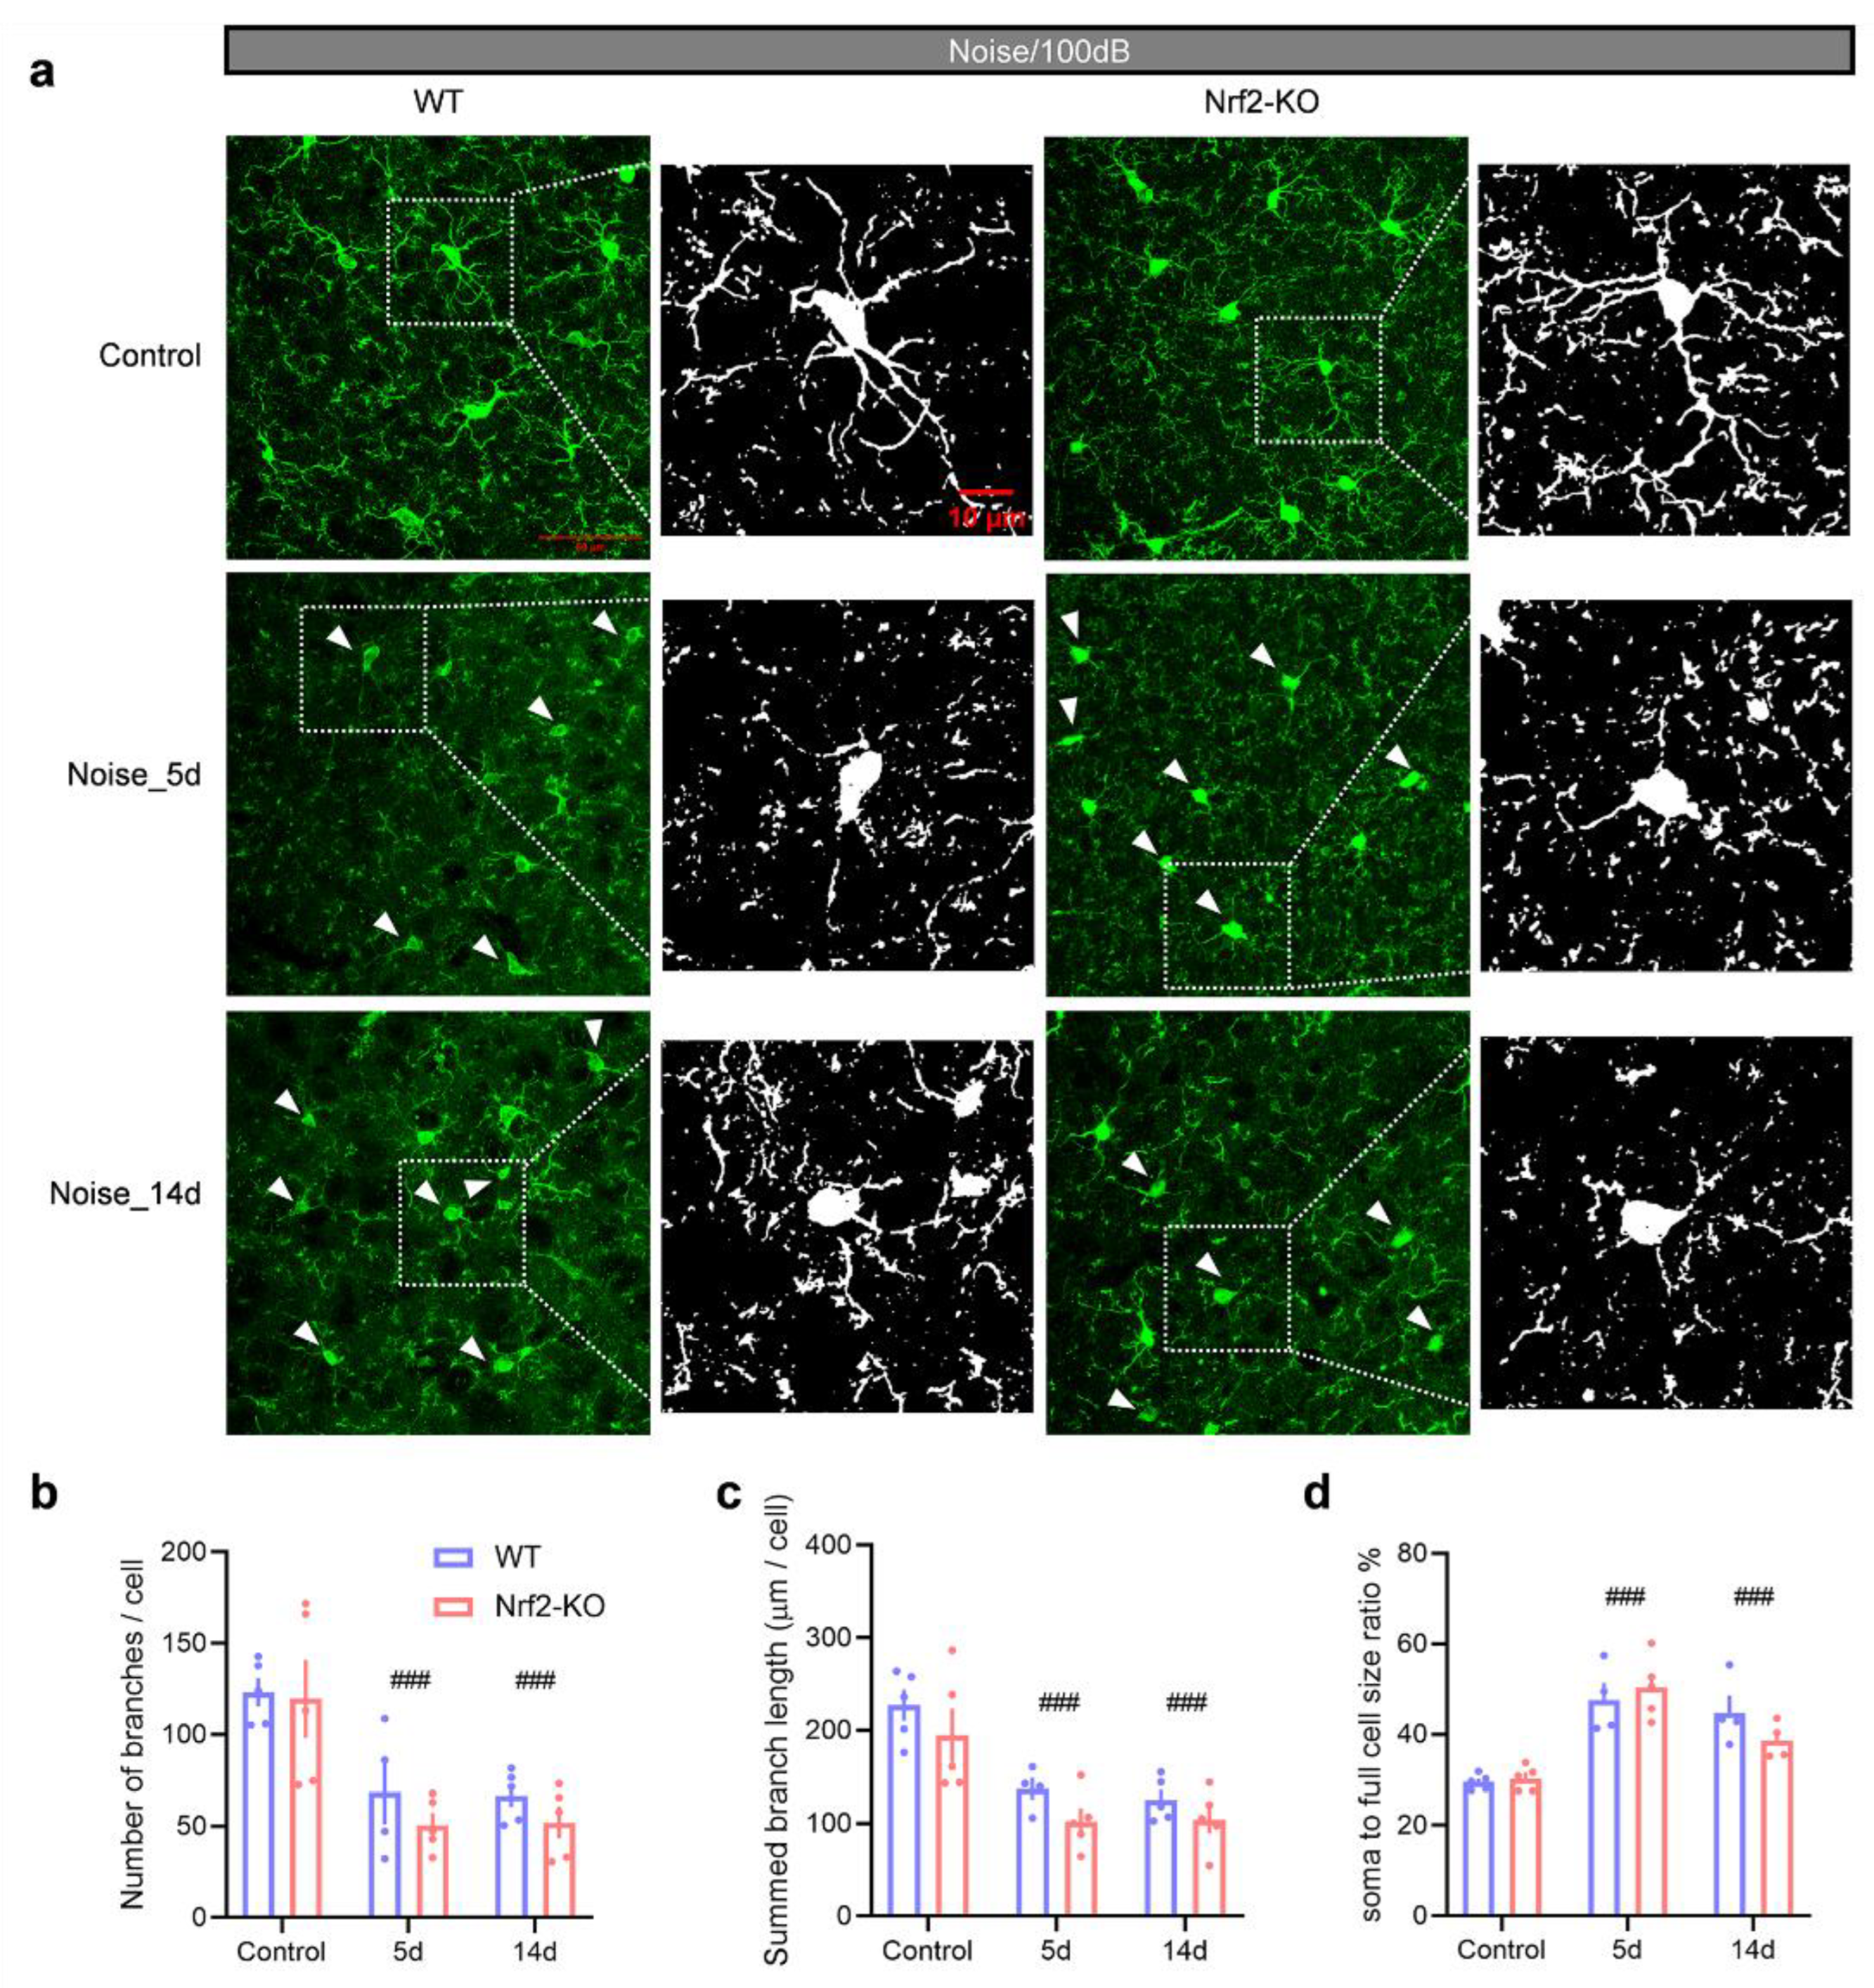
Figure 7.
Noise exposure induces enhanced neuroinflammation in the auditory cortex of Nrf2-KO mice. (a-b) Quantification of GSH in the auditory cortex reveals an increase in the GSH/GSSG ratio (a) and elevated levels of GSH and total GSH (b) in Nrf2-KO mice following noise exposure. Unpaired two-tailed t-tests were performed (n = 3 for the control group and n = 4 for the Nrf2-KO group). (c) TNF-α mRNA levels do not show a significant increase in WT mice after noise exposure, but are elevated in Nrf2-KO mice on days 3 and 10 post-exposure. (d-e) Expression of the microglial markers CD86 and iNOS is exclusively elevated in Nrf2-KO mice. (f-h) The expression of Nrf2 downstream genes HO-1, Nqo1, and Gsta2 is significantly increased in Nrf2-KO mice (n = 4-6 mice per time point). Error bars represent the SEM. *P < 0.05, **P < 0.01, ***P < 0.001 indicate statistical significance; ### denotes P < 0.001 compared to the control group, with the color of # representing the group being compared. Nrf2-KO, nuclear factor erythroid-2-related factor 2 knockout; GSH, glutathione; TNF-α, tumor necrosis factor-alpha; iNOS, inducible nitric oxide synthase; HO-1, heme oxygenase 1; Nqo1, NAD(P)H dehydrogenase quinone 1; Gsta2, glutathione S-transferase alpha 2; SEM, standard error of the mean.
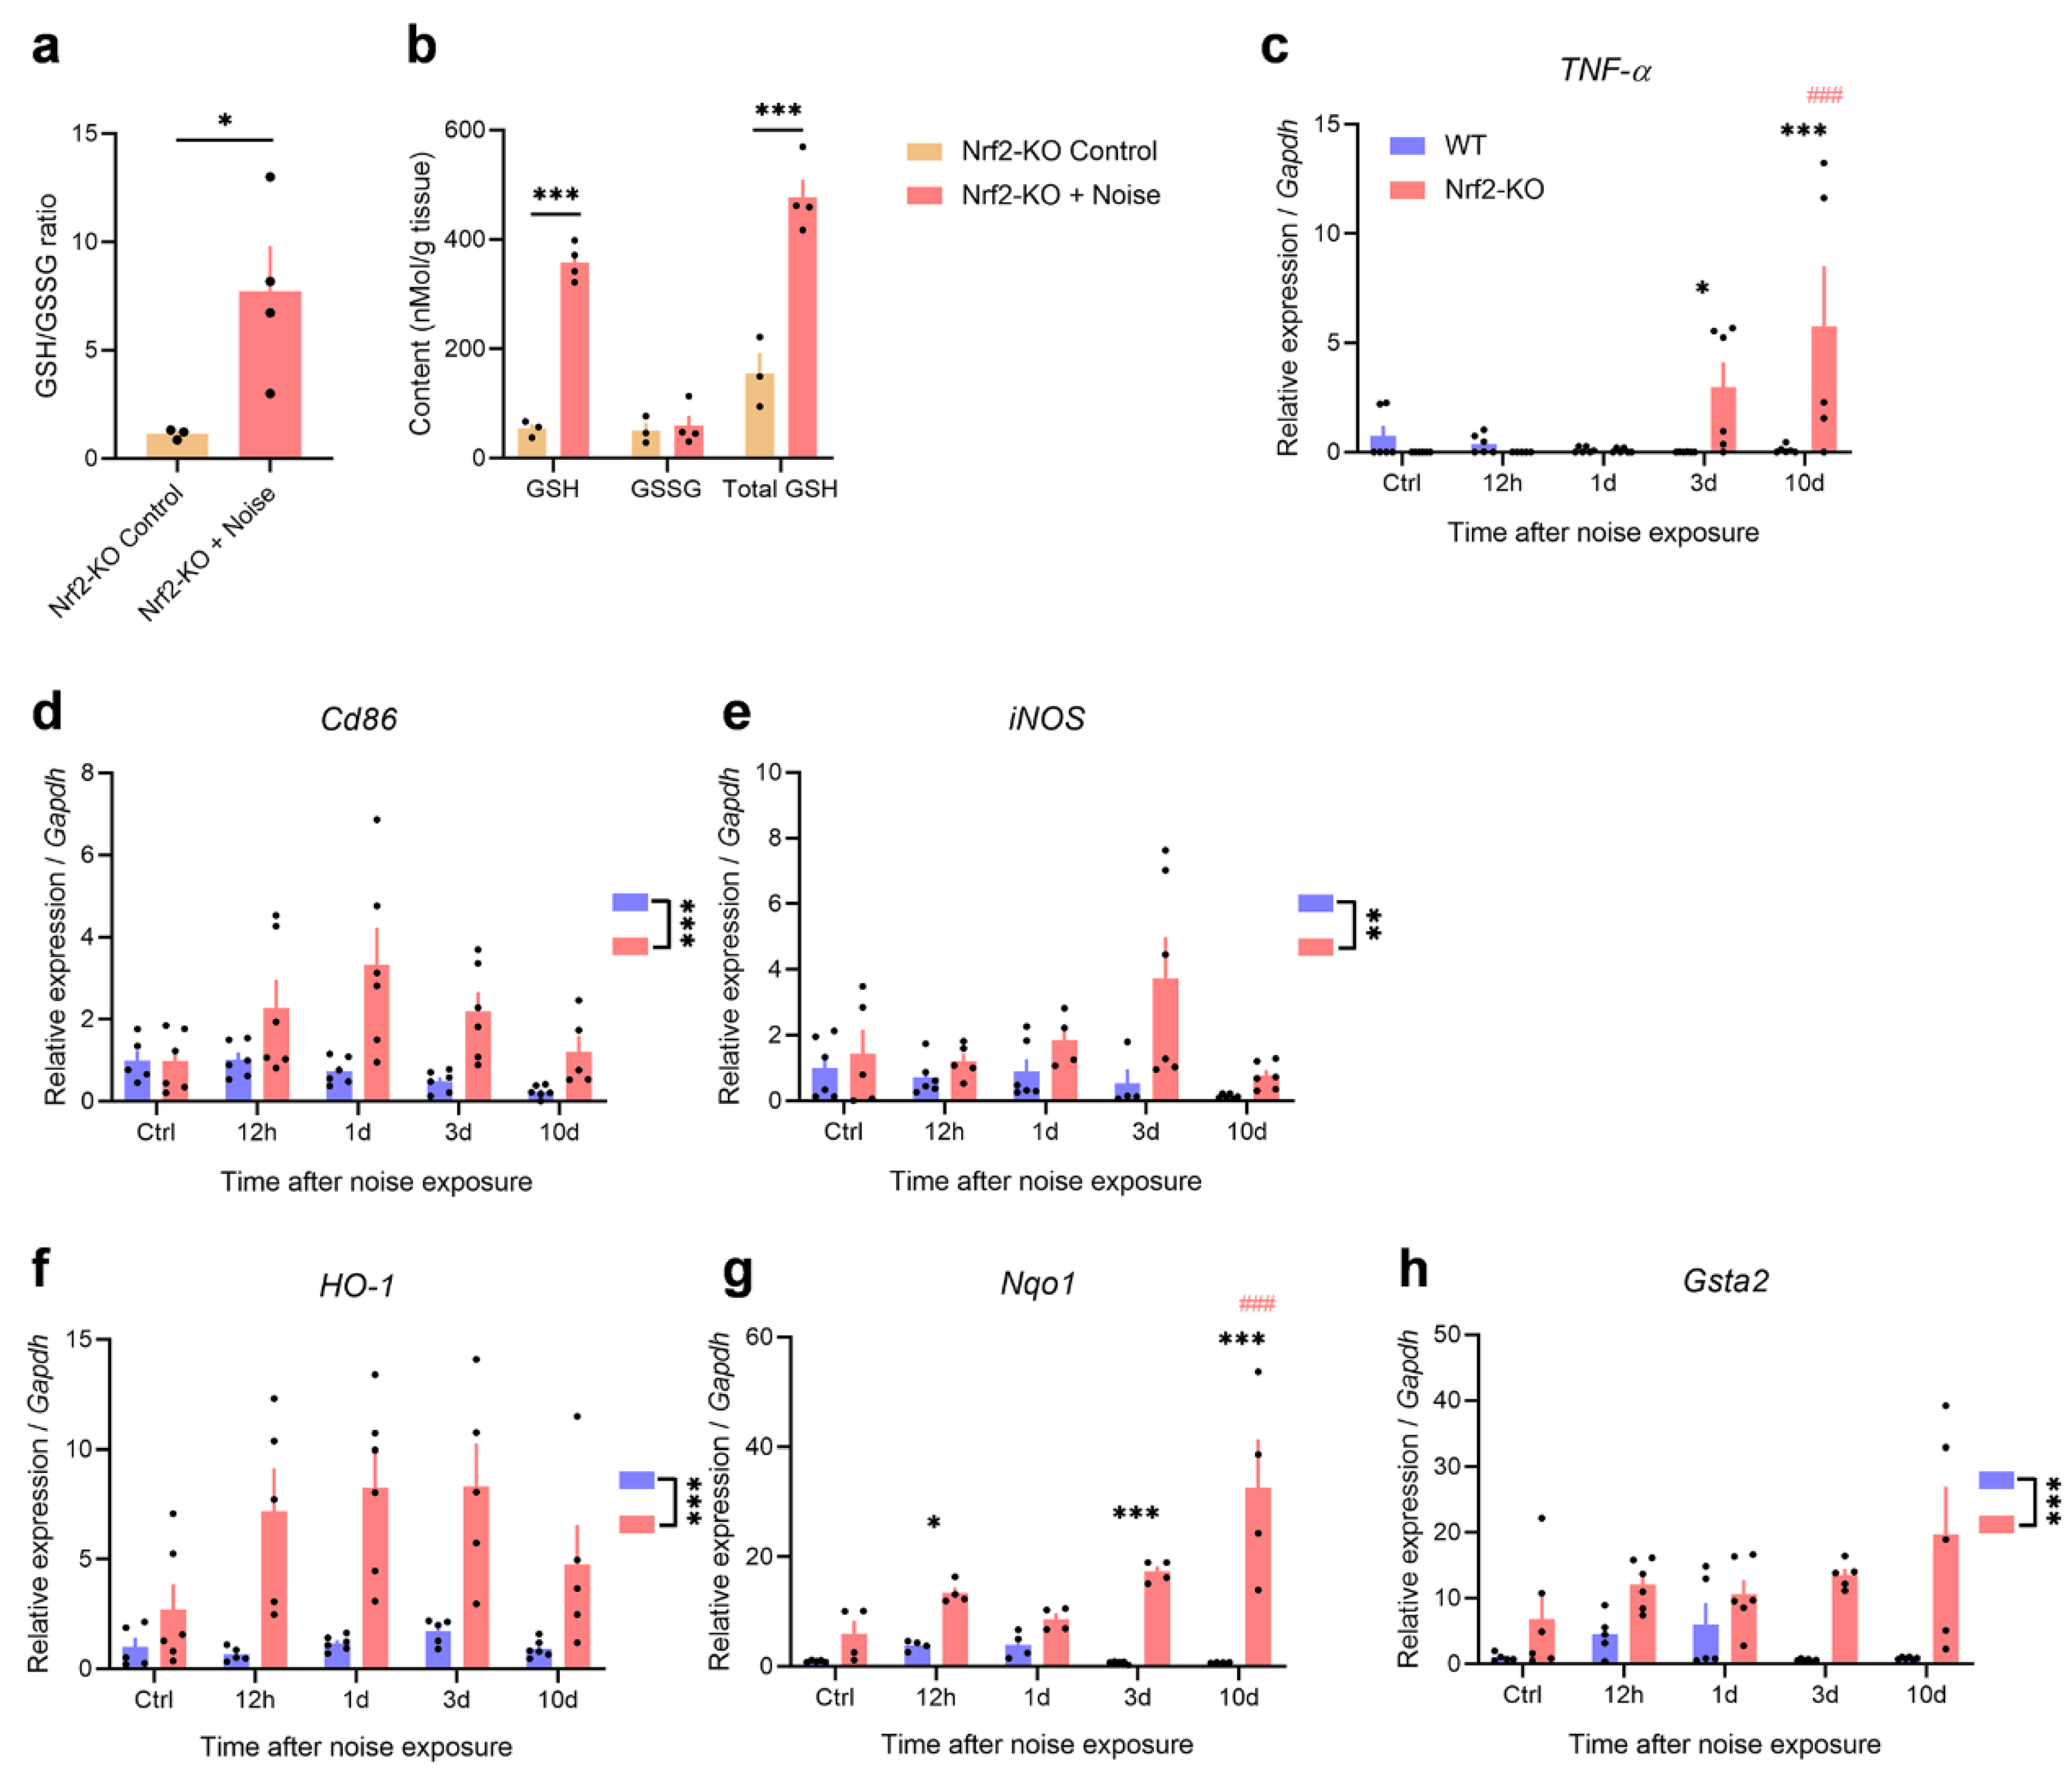
Disclaimer/Publisher’s Note: The statements, opinions and data contained in all publications are solely those of the individual author(s) and contributor(s) and not of MDPI and/or the editor(s). MDPI and/or the editor(s) disclaim responsibility for any injury to people or property resulting from any ideas, methods, instructions or products referred to in the content. |
© 2024 by the authors. Licensee MDPI, Basel, Switzerland. This article is an open access article distributed under the terms and conditions of the Creative Commons Attribution (CC BY) license (http://creativecommons.org/licenses/by/4.0/).
Copyright: This open access article is published under a Creative Commons CC BY 4.0 license, which permit the free download, distribution, and reuse, provided that the author and preprint are cited in any reuse.


