Preprint
Article

This version is not peer-reviewed.

Photocatalytic Performance of Cu/ZnO Synthesized Using Hydrothermal Oxidation

Submitted:

23 December 2024

Posted:

23 December 2024

You are already at the latest version

Abstract

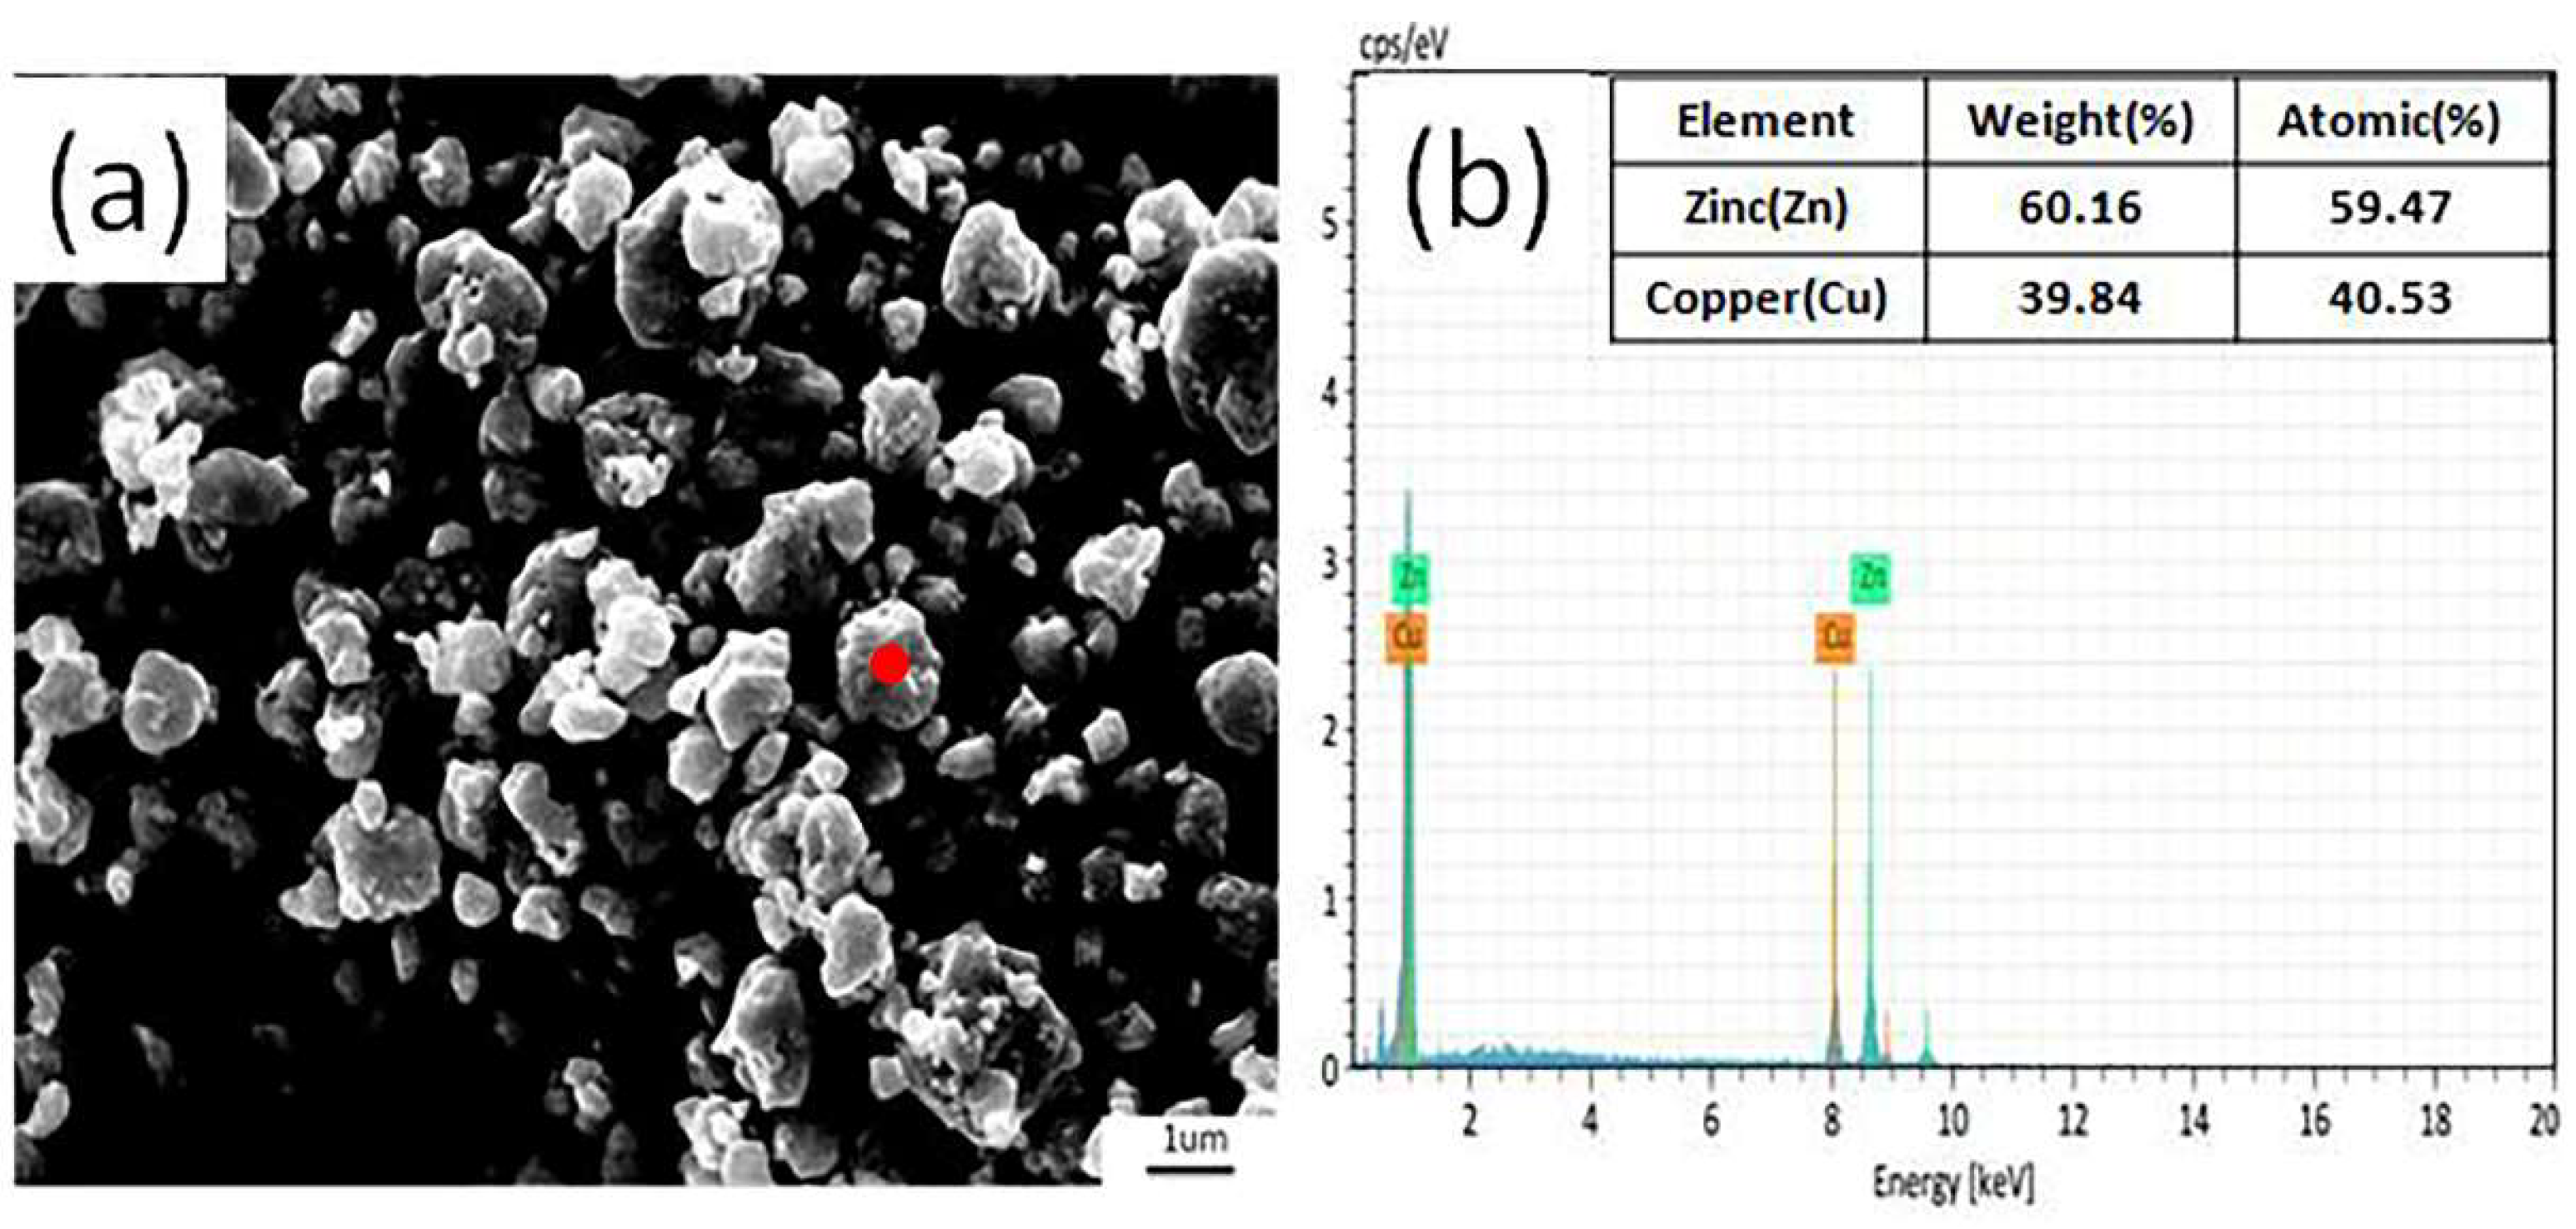
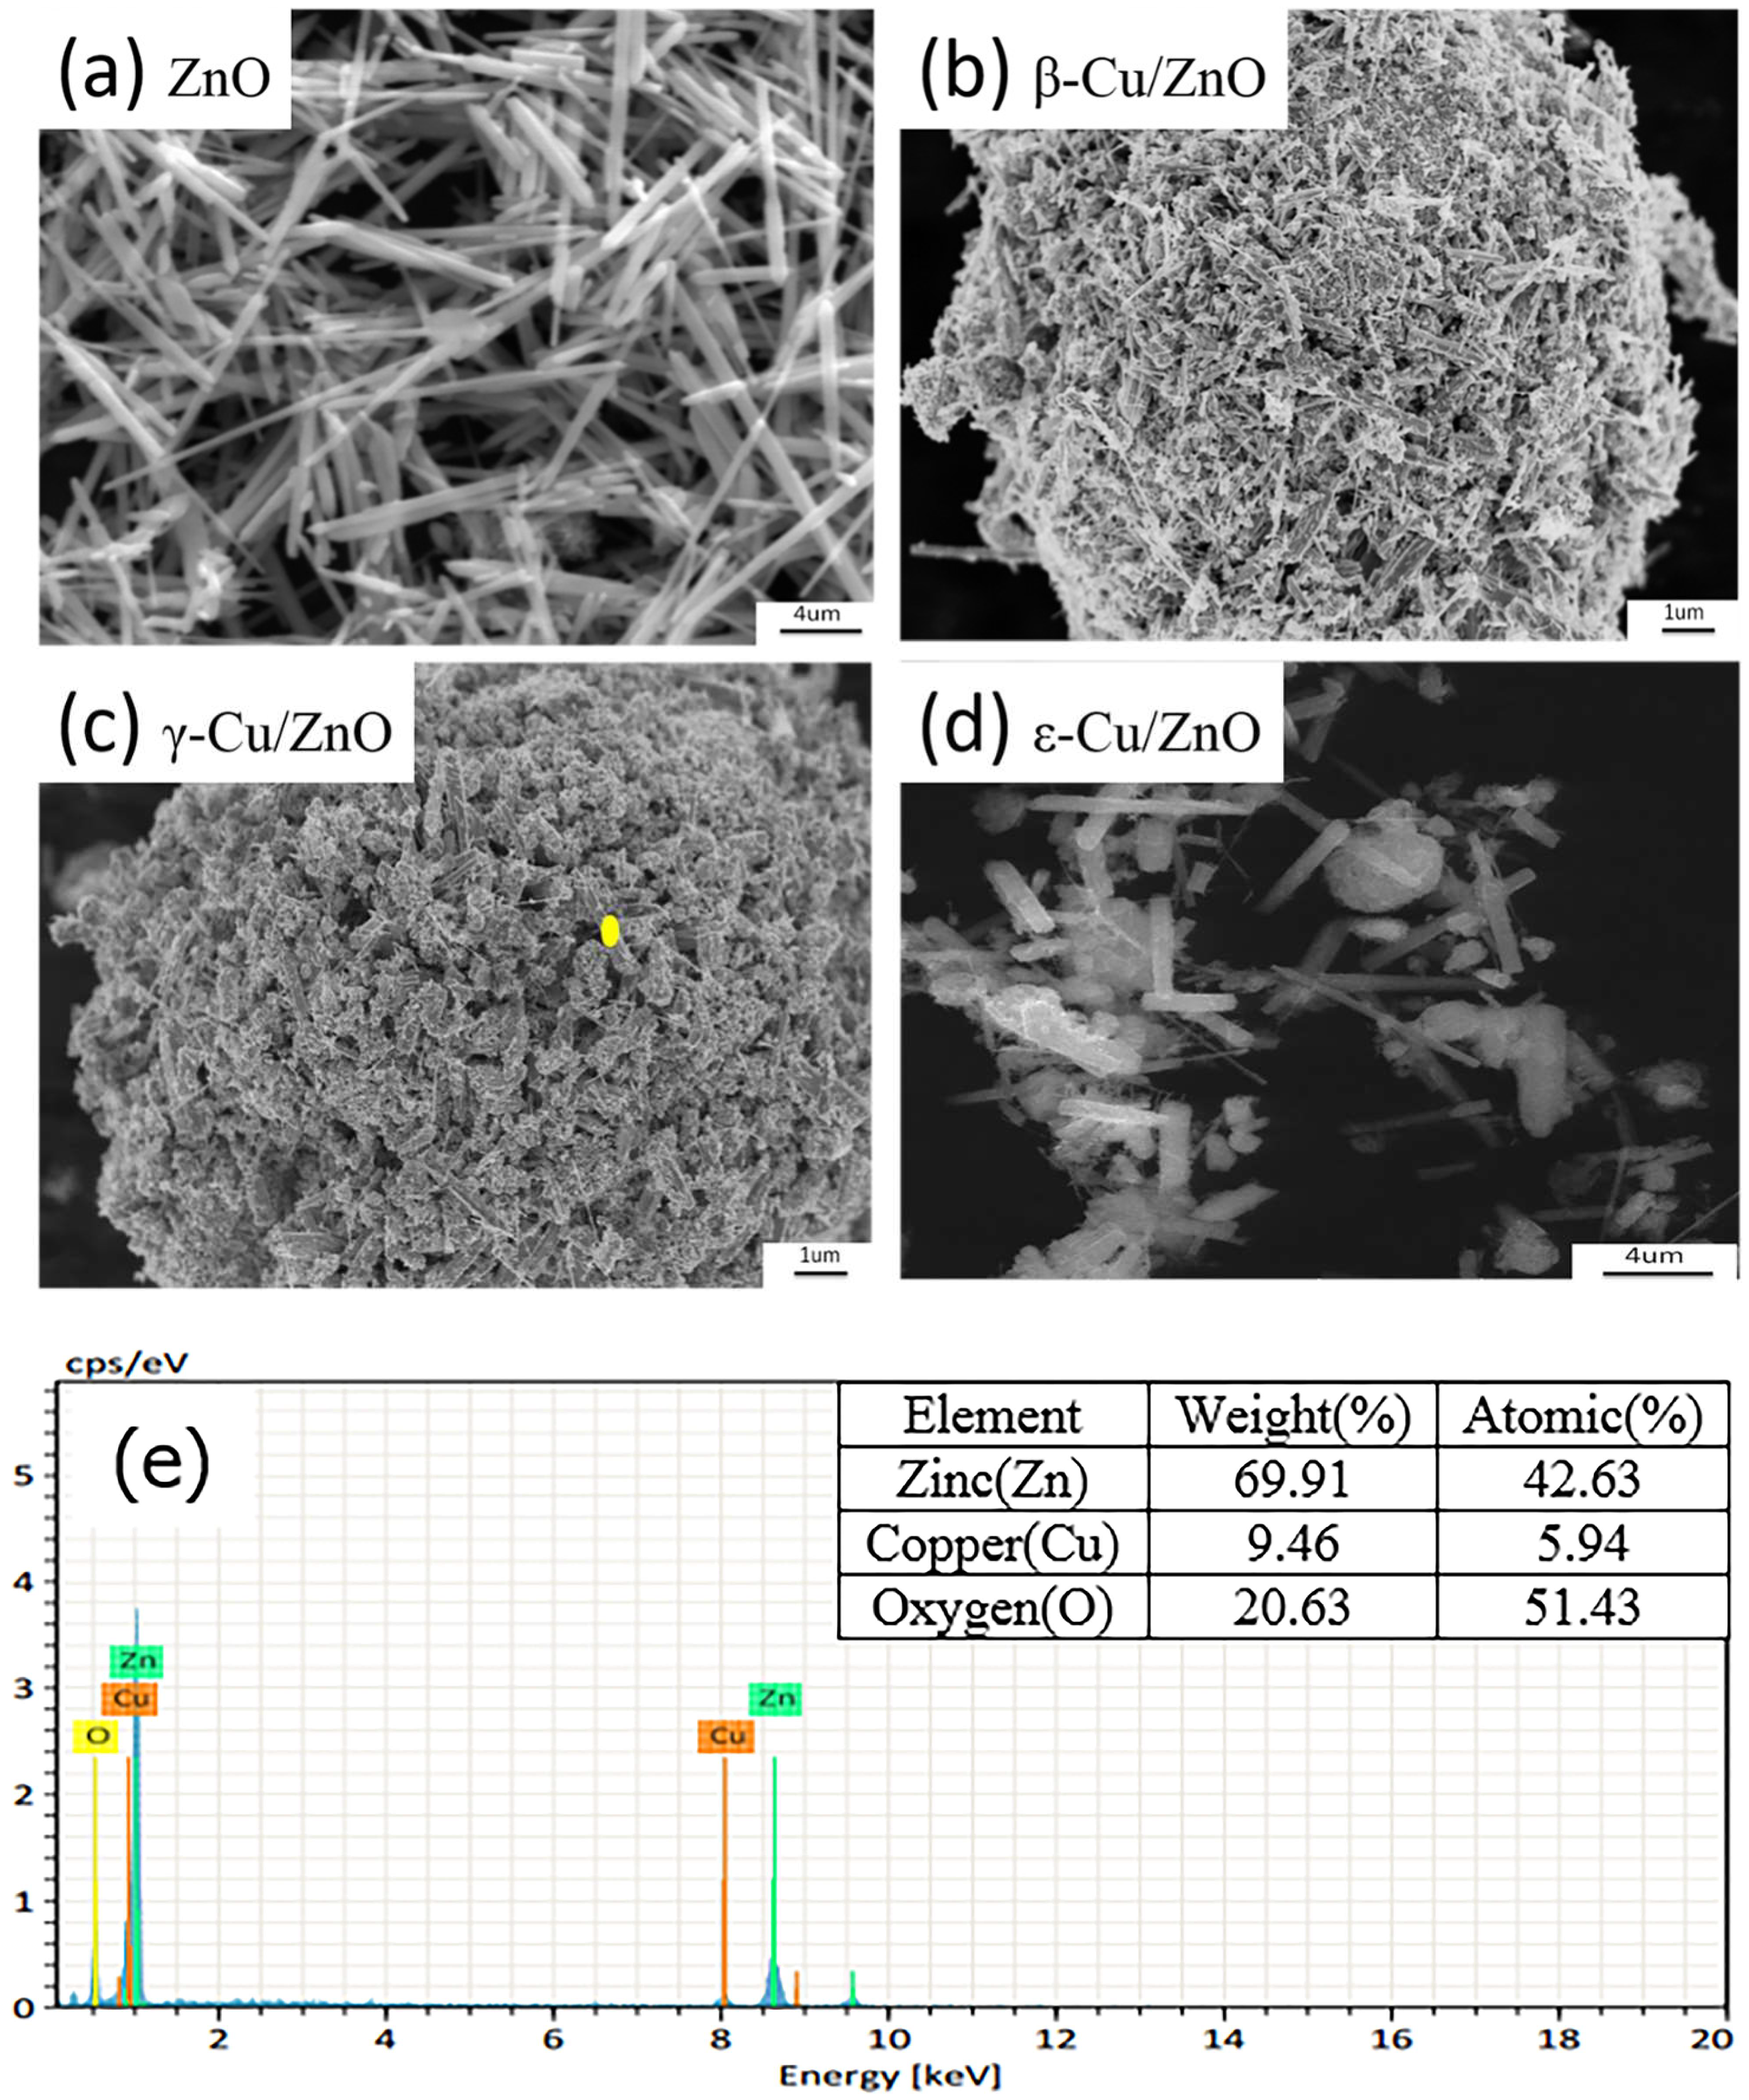
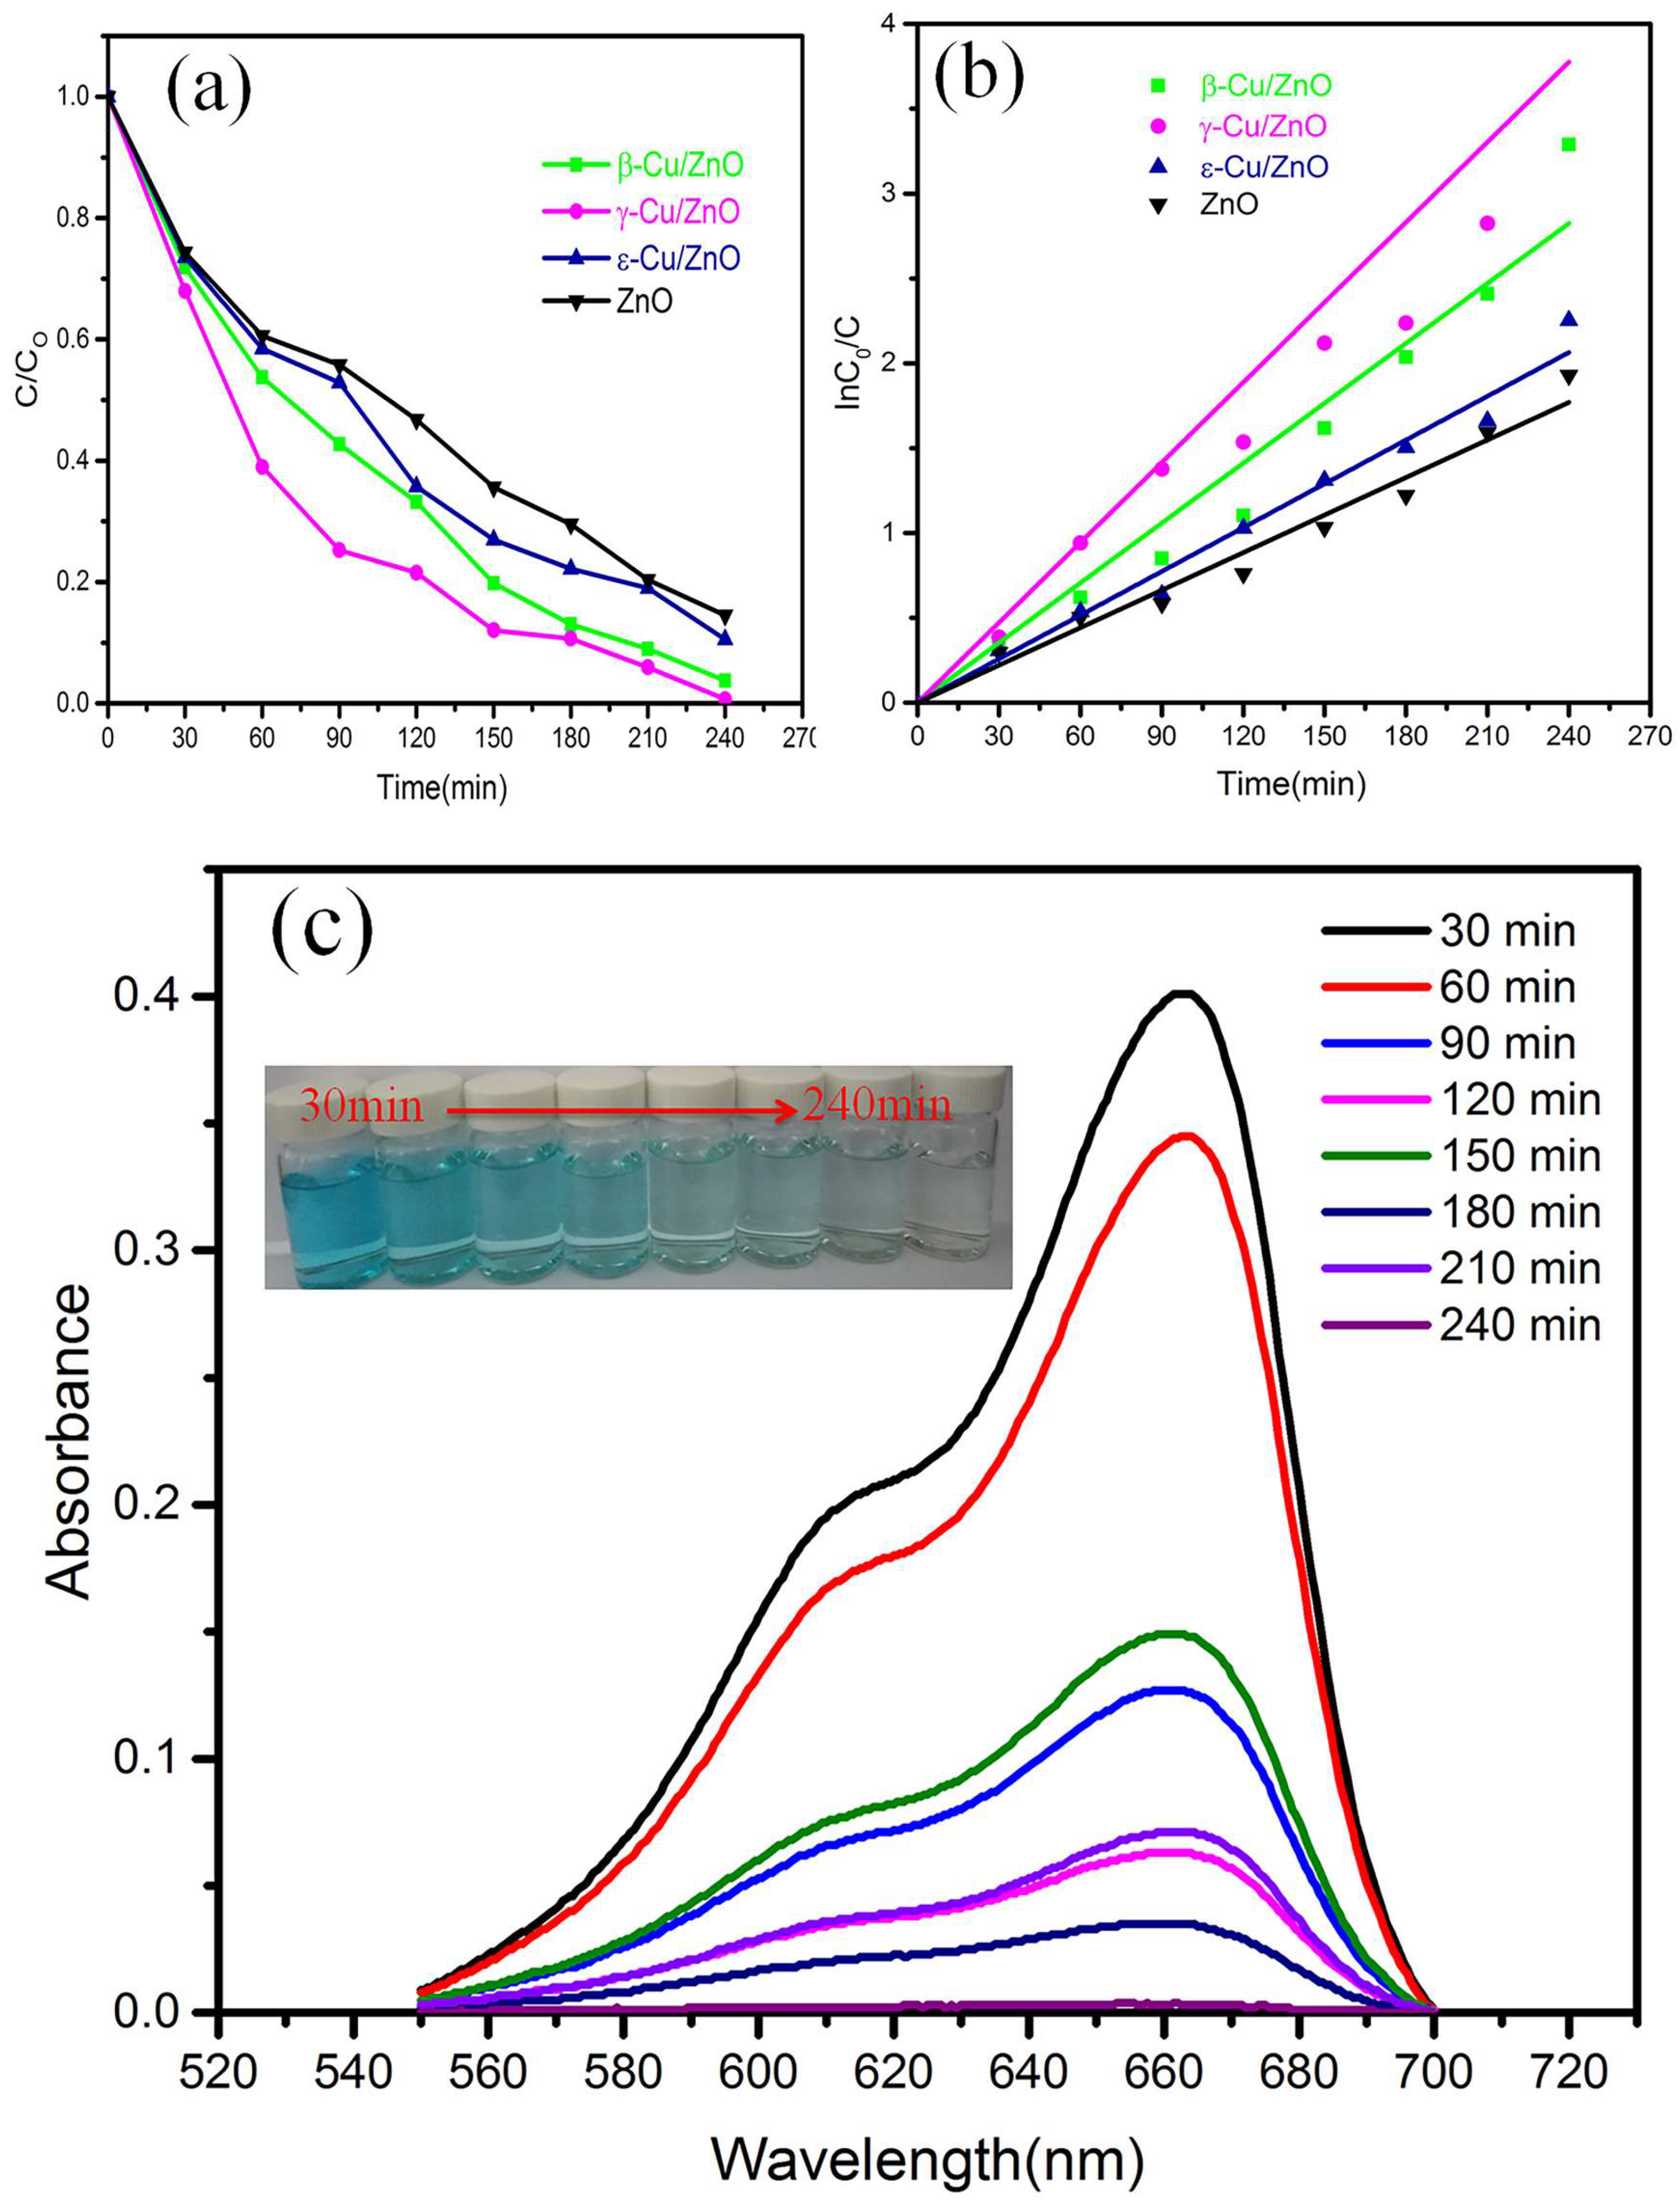
The β, γ, and ε phases of a CuZn alloy were fabricated using the mechanical alloy technique, and this was used as a precursor to synthesize a Cu/ZnO photocatalyst. The CuZn alloy phase structure was characterized using X-ray diffraction (XRD), and its particle size was 2-3 μm. The Cu/ZnO microstructure was observed using scanning electron microscopy (SEM), and energy dispersive scanning (EDS) was used to characterize the element distribution. The experimental results showed that Cu/ZnO possessed a smaller band-gap than ZnO. In addition, the photocatalytic Cu/ZnO performances synthesized using different CuZn alloys were detected when methylene blue (MB) was applied as a simulated pollution source. The results showed that the Cu/ZnO synthesized using the γ-CuZn alloy possessed the best photocatalytic performance, and its degradation was as high as 99.6%.

Keywords: 
;  ;  ;  

1. Introduction

The use of a semiconductor photocatalyst is a feasible method to mitigate environmental pollution due to continued environmental deterioration and increased energy consumption [1,2,3,4,5,6,7]. An organic pollutant can be decomposed as inorganic salt, such as moisture and carbon dioxide, via a photocatalyst. Photocatalyst advantages include: 1) environmentally friendly degradation of harmful products [8,9]; 2) high organic decomposition rates [10]; and 3) the photocatalyst technique can be applied for heavy metal recovery.
ZnO is one of the most researched semiconductor photocatalysts as it has a large band-gap, is inexpensive, has low toxicity, is highly active, and environmentally friendly [11,12,13,14]. ZnO possesses a similar band-gap and photocatalytic mechanism as titanium oxide (TiO2). ZnO is cheaper and has extensive sources of raw materials compared to TiO2, and these aspects are favorable for mass production [15,16]. According to some research, we know that the ZnO photocatalytic performance is related to its crystalline structure, lattice defect, microstructure, particle size, and other characteristics [17,18,19]. Methods to improve the ZnO photocatalytic performance include metal doping, ion doping, composite semiconductor, and surface sensitization have been applied to this material [20,21,22,23]. In addition, the precipitation method, hydrothermal method, sol-gel method, and chemical vapor deposition method have also been applied to synthesize copper (Cu) doping ZnO to improve the photocatalytic performance [24,25,26]. Shreya et al. recently synthesized Zn1-xEuxO nanoparticles (x = 0, 0.25, and 0.5) using a co-precipitation technique. By breaking down MB under UV light, it was shown that Eu-doped nanoparticles had better photocatalytic activity (94.83% vs. 83.75% for undoped ZnO nanoparticles)[27]. Wu et al. manufactured Fe-doped ZnO ceramic nanofibers (CNFs). Pristine ZnO had a removal rate of 79.9% for methylene blue (MB) after 60 minutes, and this rate went up to 96.05% when 1% Fe was added [28]. F.Z. Nouasria et al. synthesized Cu-doped ZnO thin films via electrodeposition. When exposed to UV light for 150 minutes, MB breaks down at a rate of 74% in the presence of undoped ZnO. But, using Cu-doped ZnO makes the photocatalytic activity better, and it can break down MB at a rate of 95% [29].
The precursor of the CuZn alloy was synthesized in this study using the mechanical alloying technique. Cu and zinc (Zn) powders were used as the raw materials. The Cu/ZnO photocatalyst was synthesized using hydrothermal oxidation using different phases (β, γ, ε) of the CuZn alloy as the precursors. The photocatalytic performance of these series materials were characterized using methylene blue (MB). The results indicated that γ-Cu/ZnO exhibited the best photocatalytic performance among these materials.

2. Materials and Methods

The raw materials of the Cu and Zn powders had purities of over 99.9%, and different weight ratios of the Cu/ZnO materials were synthesized. The weight ratios of Cu to Zn were 1:1, 5:8, and 4:21. A 1.5wt.% stearic acid was added prior to ball milling. These powders were ball milled to obtain the different phases of the CuZn alloy (1300 r/min, 16, and 28 and 16 h for the β, γ and ε phases, respectively). A total of 2.5 g of the CuZn alloy was weighed and then added into 70 ml of tetramethyl ammonium bicarbonate (0.55 mol/L). This was heated at 200°C for 15 h. The solution was filtered after hydrothermal oxidation until the pH was approximately 7, and Cu/ZnO was obtained after heated at 80°C for 10 h. These samples were remarked as β-Cu/ZnO, γ-Cu/ZnO, and ε-Cu/ZnO.
At room temperature, 50 ml of methylene blue (MB) (10 mg/L) was used as a pollution source, and a 15 W UV light was used as a light source to test the Cu/ZnO photocatalytic performance. In addition, the distance between light source and the solution was approximately 15 cm, and 50 mg of the Cu/ZnO powders were used in each experiment. The solution was stirred (500 mot) for 30 min prior to illumination. X-ray diffraction (XRD, Bruker D8 Advance) was used to characterize the phase structure. UV-vis spectrophotometer (UV-Vis) was used to measure the band-gap and absorbance. Scanning electron microscopy (SEM, SU8000) was used to observe the microstructure. The particle size was tested using a laser particle analyzer (LS 900).

3. Results and Discussion

3.1. Phase Structure, Particle Size, and Microstructure of the CuZn Alloy

The XRD patterns of different phases of the CuZn alloy are shown in Figure 1. The β, γ, and ε phases of the CuZn were consistent with the standard PDF cards of PDF#65-9061, PDF#1228, and PDF#39-0400, respectively. The characteristic XRD peaks of the γ-CuZn was (422), and they were (311) and (320) for the ε-CuZn compared with the β-CuZn. The XRD patterns indicated different phases CuZn (β, γ, ε) were successfully synthesized via ball-milling. The average particle sizes were 2.8, 2.4, and 2.9 μm for β-CuZn, γ-CuZn, and ε-CuZn, respectively.
The typical microstructure and surface EDS result of the γ-CuZn are shown in Figure 2. Figure 2 (a) shows that there was no regular shape of the γ-CuZn and no obvious agglomeration was observed. The particle sizes ranged from 2 to 3 μm, and this result was consistent with the laser particle analyzer results. The EDS result of the γ-CuZn is shown in Figure 2 (b), and this result was consistent with the XRD patterns. Thus, it is believed these different CuZn alloy phases were successfully synthesized, and they could be used as a precursor to synthesize the Cu/ZnO photocatalyst.

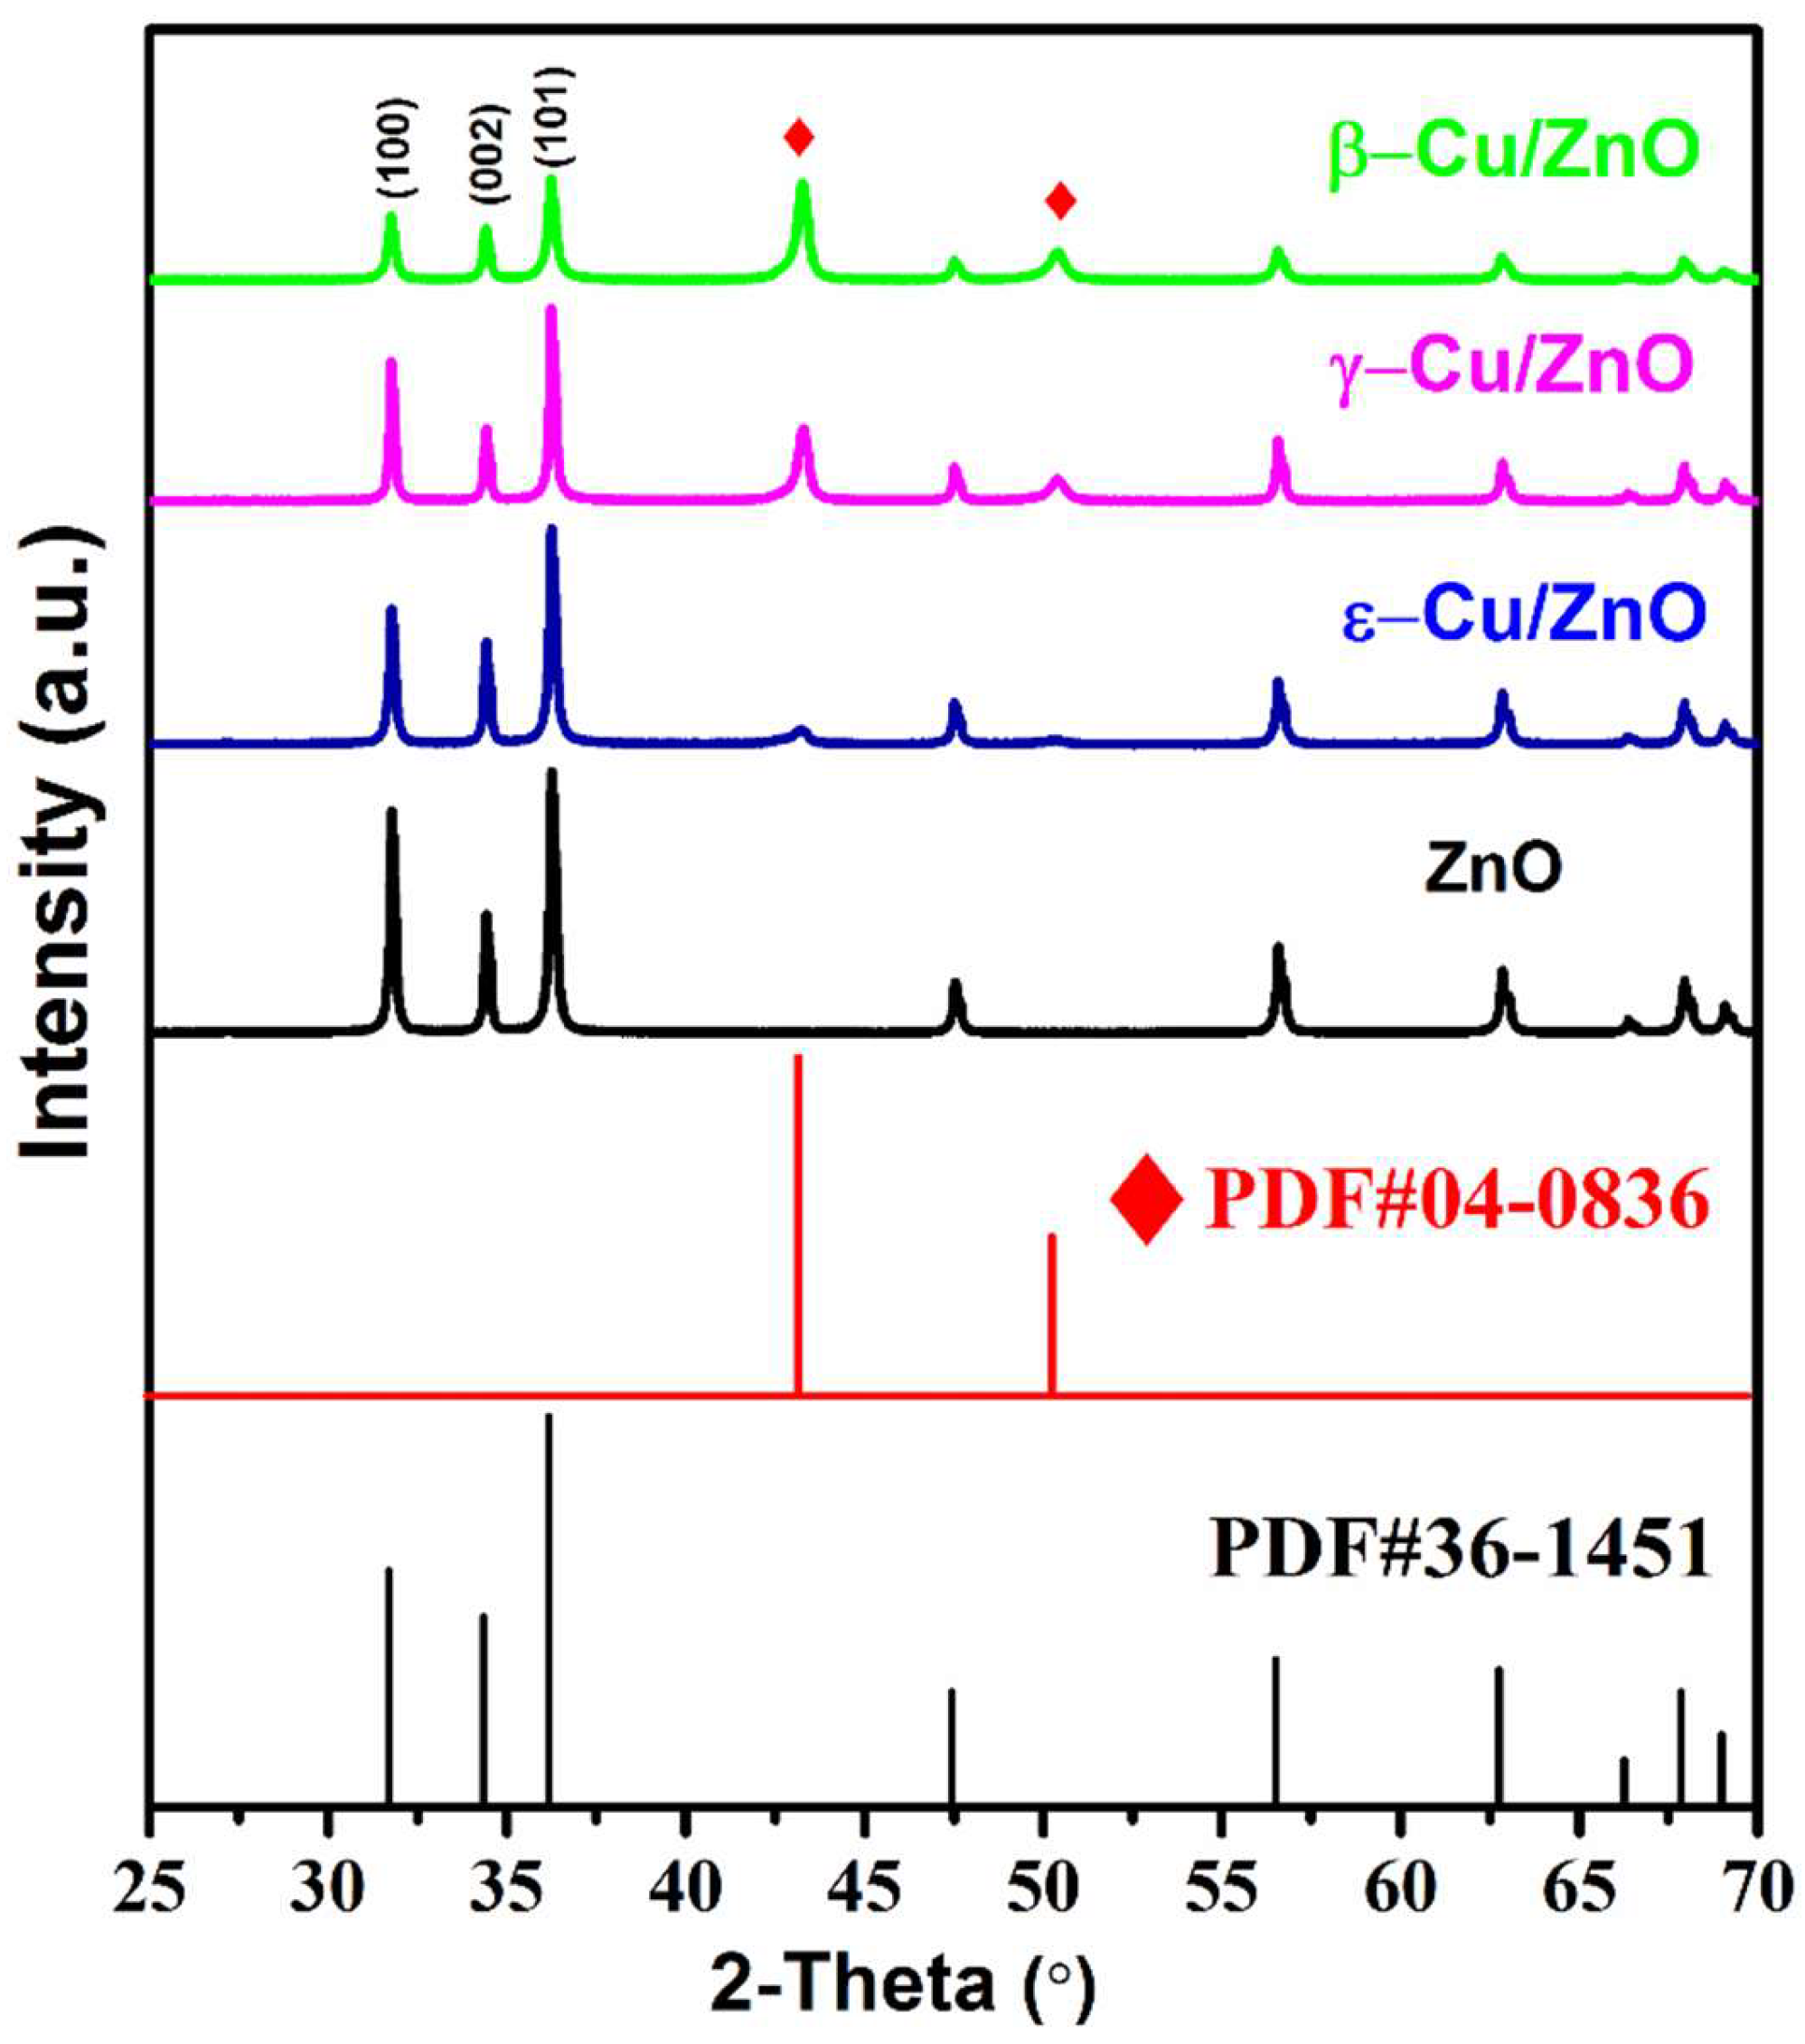
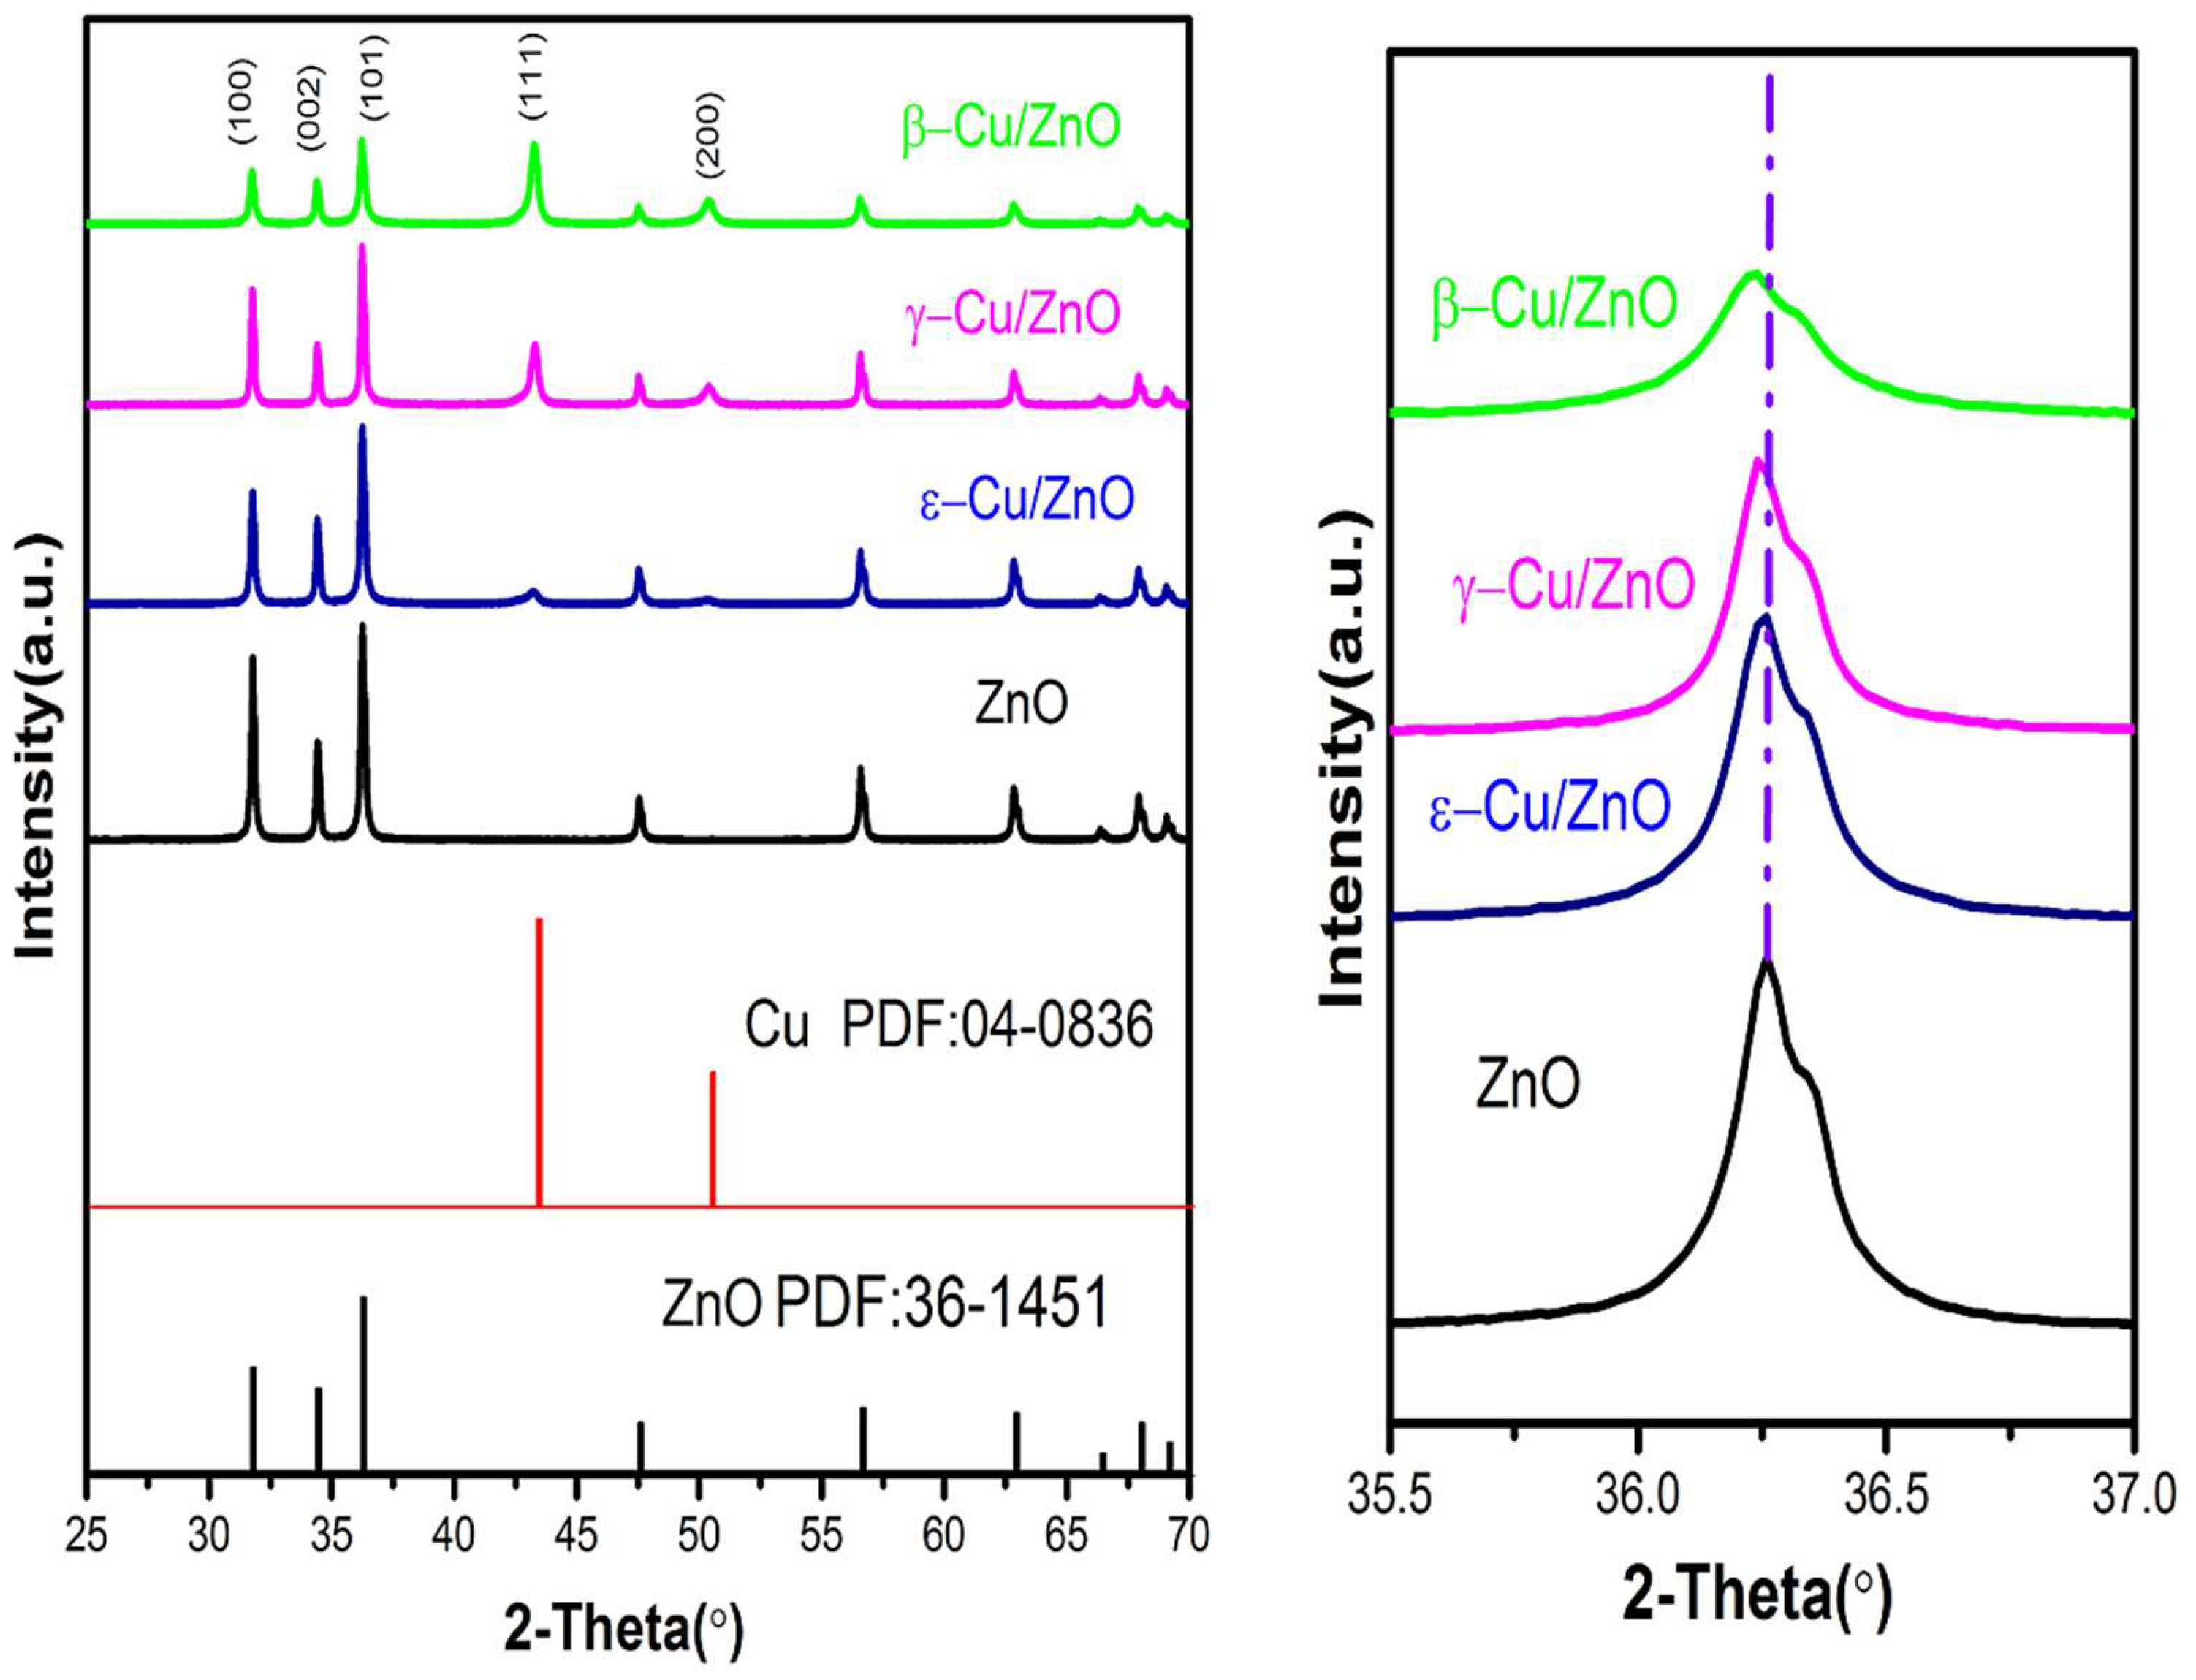
3.2. Cu/ZnO Photocatalyst Phase Characterization
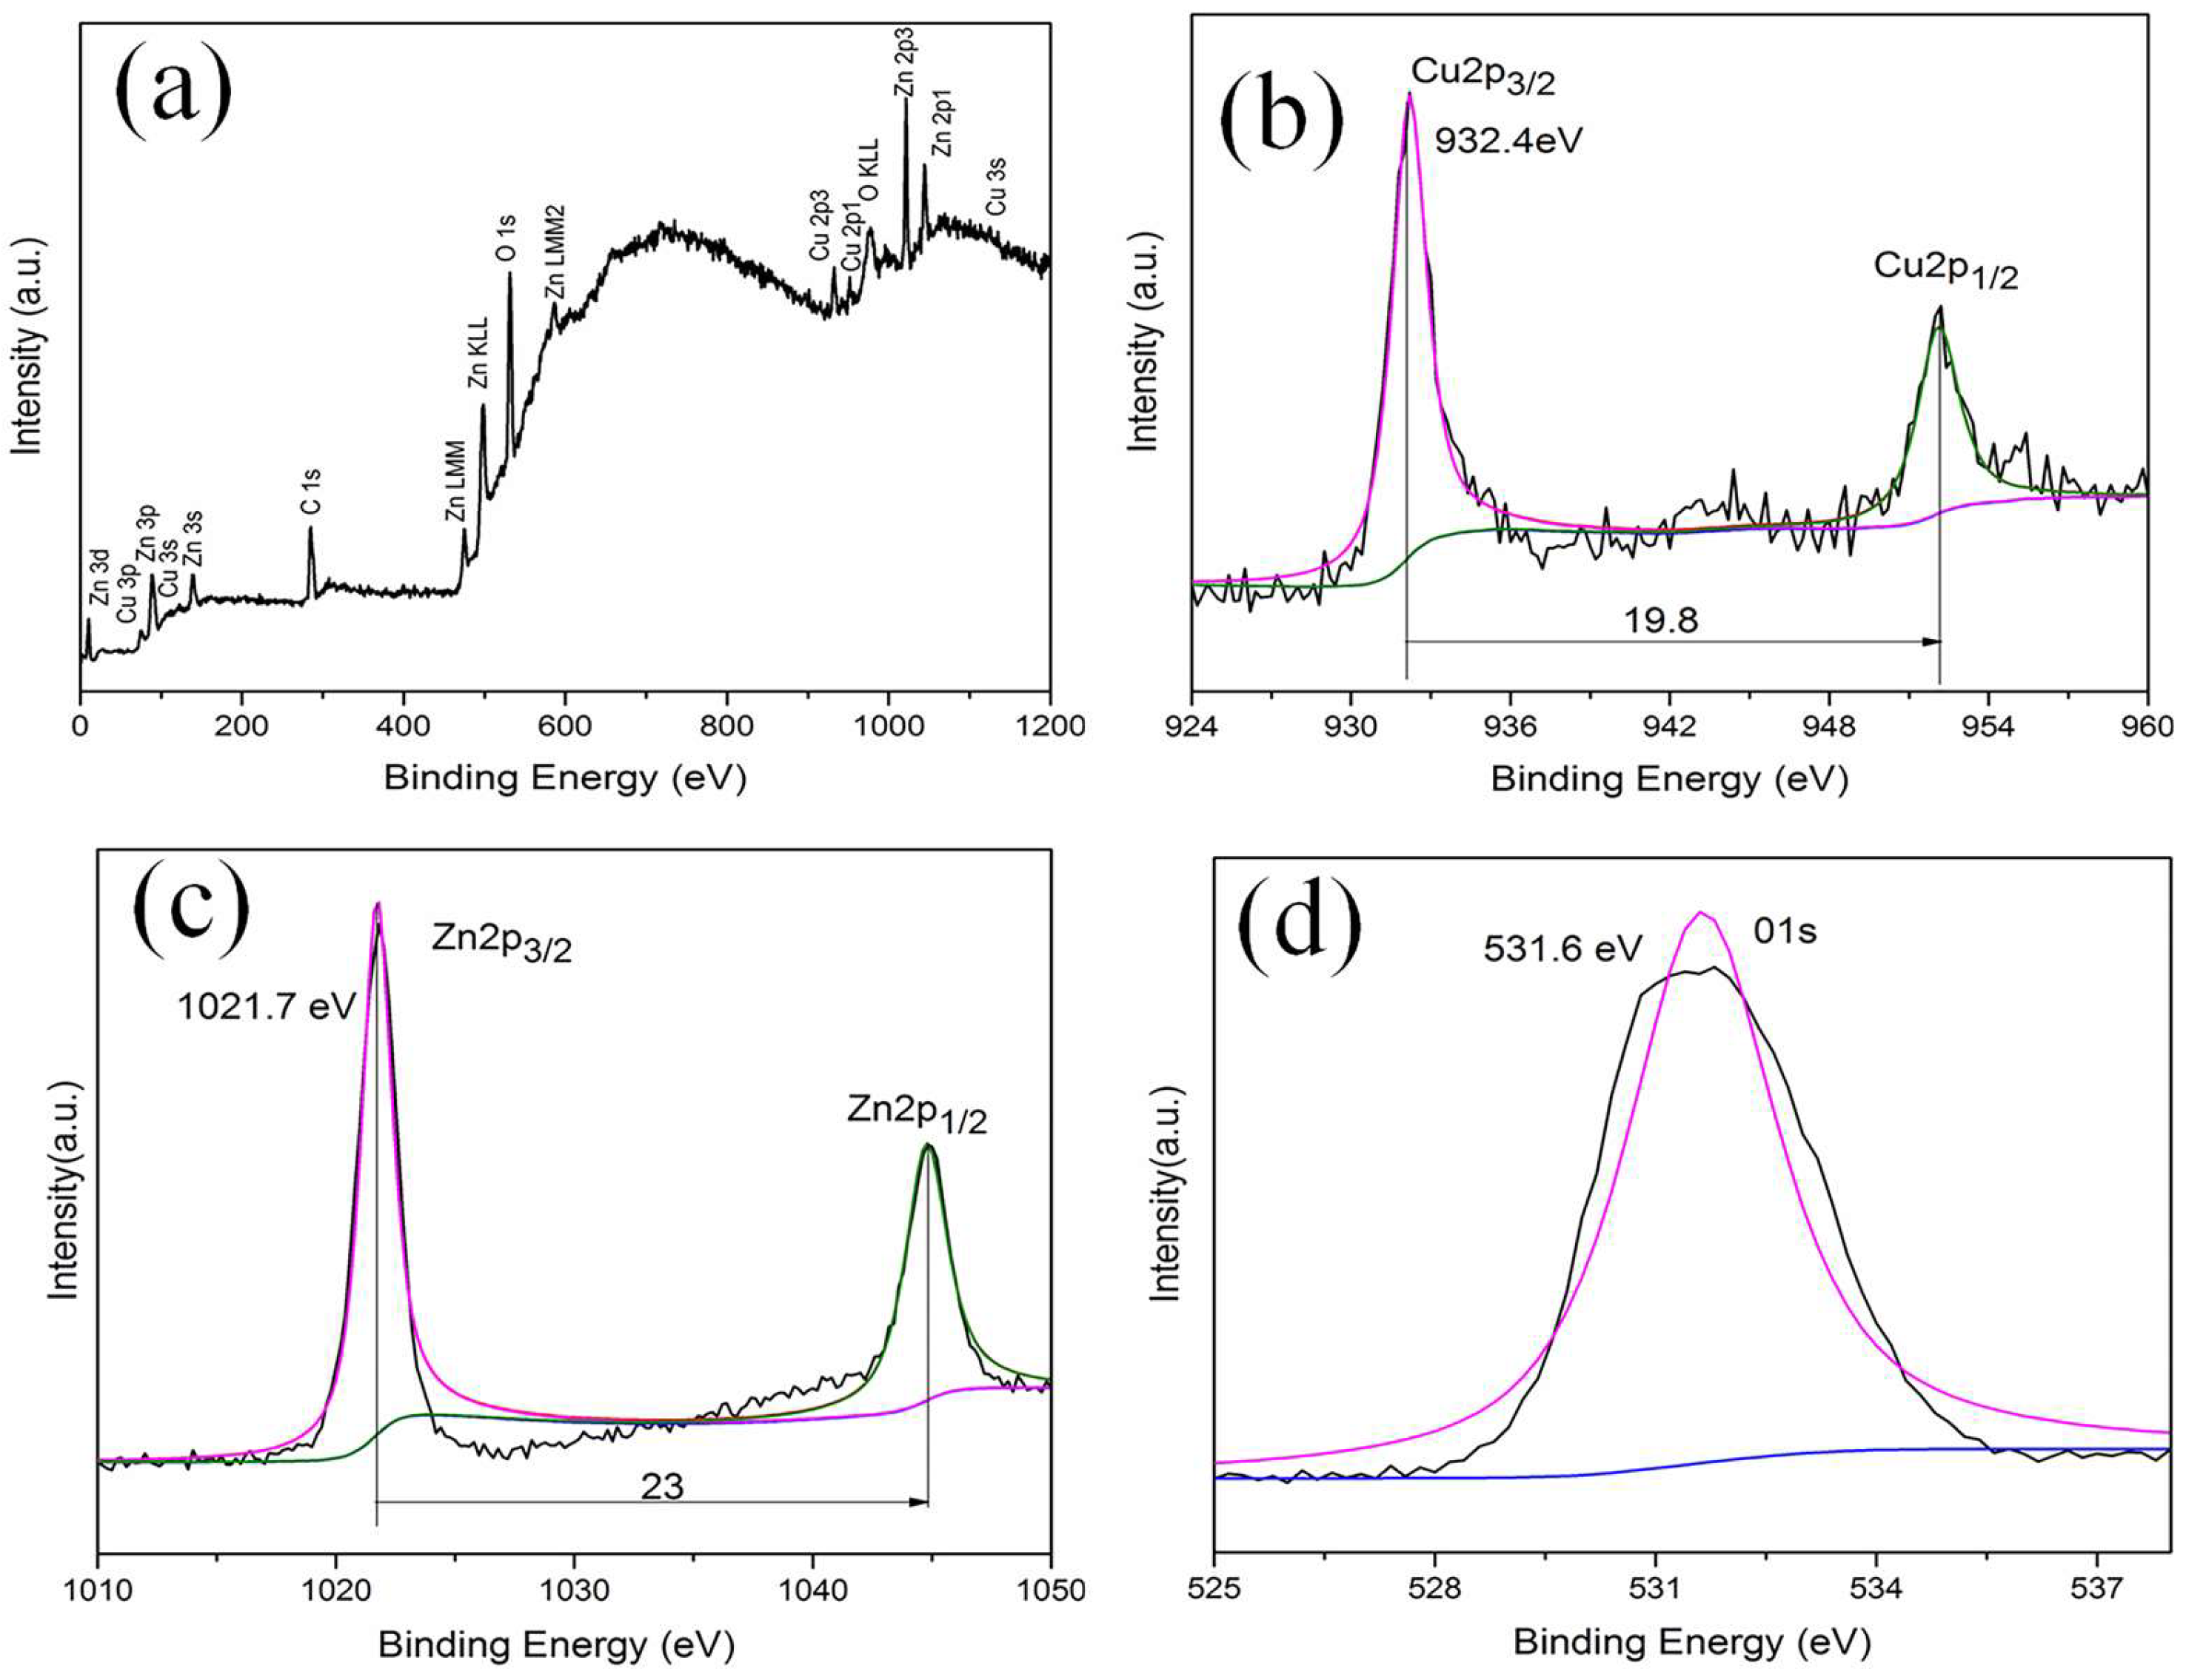
The XRD patterns of the Cu/ZnO synthesized via the different CuZn alloy phases by hydrothermal oxidation and ZnO photocatalyst are shown in Figure 3. A comparison with the standard PDF cards showed that all of the Cu/ZnO and ZnO photocatalysts were consistent with PDF#36-1451, and all of the samples had hexagonal wurtzite structures. Due to the increase content of copper (Cu), the characteristic peaks of Cu, (111) and (200), were increasingly obvious, and they were consistent with the PDF#36-1451. The Cu/ZnO primary peak shifted to lower degree in comparison to ZnO. This was due to an increase in the Cu content, as shown in Figure 3 (b). This increased the Cu/ZnO crystalline structure. According to the equation:
λ = 2dsinϴ,
it is believed an increase of d can decrease ϴ and then lead to peak shifts. It was inferred the Cu may have existed as an interstitial atom in these samples and then increased the crystalline structure. However, the interstitial Cu atom content was limited, as Cu (0.128 nm) has a much larger radius than Zn2+ (0.074 nm). Thus, the Cu/ZnO photocatalyst was successfully synthesized using hydrothermal oxidation, and no impurity was detected.
The typical microstructures of ZnO and different Cu/ZnO photocatalysts are shown in Figure 4. Figure 4 shows that (a) the ZnO photocatalyst was long and acicular, and the length was shorter than 20 μm. Further, β-Cu/ZnO and γ-Cu/ZnO had hexagonal columnar shapes, and the hexagon edges were obvious. The increased Cu content caused the polar crystallographic plane (0001) of ZnO to be more obvious, and ZnO uniformly distributed on the Cu surface [30,31]. Figure 4 (d) shows the typical microstructure of the ε-Cu/ZnO. There only was a little ZnO that distributed in the CU surface when most of the hexagonal columnar ZnO dispersed around it. Figure 4 (e) shows the EDS results, and that there were Cu, Zn, and O in the γ-Cu/ZnO, and the Cu content was minor. This result may indicate that some of the Cu may have been doped in the ZnO crystal. In addition, the O content was higher than in Zn. This result may have been because some elements were removed during the test.

3.3. XPS Analysis

The detailed XPS spectra of this sample are discussed below to investigate the crystal chemistry of the γ-Cu/ZnO powders. This is because XPS is sensitive to the chemical state and chemical environment of elements in materials. The full XPS spectra of the γ-Cu/ZnO are depicted in Figure 5 (a). The binding energies of the different elements showed that the elements detected in this sample were copper, zinc, oxygen, and carbon. Carbon is used to correct the precise binding energy of other elements, as we know that the standard binding energy of C1s is 284.8 eV. The detailed XPS spectra of Cu, Zn, and O are shown in Figure (b-d). Figure 5 (b) shows that the binding energies of Cu2p3/2 and Cu2p1/2 were 932.4 and 952.2 eV, respectively. These are consistent with the standard binding energy of metallic copper. Thus, it was believed Cu was stable in this sample, and it did not react with other elements. Figure 5 (c) shows that the binding energies of Zn2p3/2 and Zn2p1/2 were 1021.7 and 1044.7 eV, respectively. These are consistent with the standard binding energy of Zn2+[17]. Further, the binding energy of O1S was 530 eV, and this was consistent with the standard binding energy of O2-[32]. Therefore, the XPS results were consistent with the XRD results, and there were no impurities in these samples.

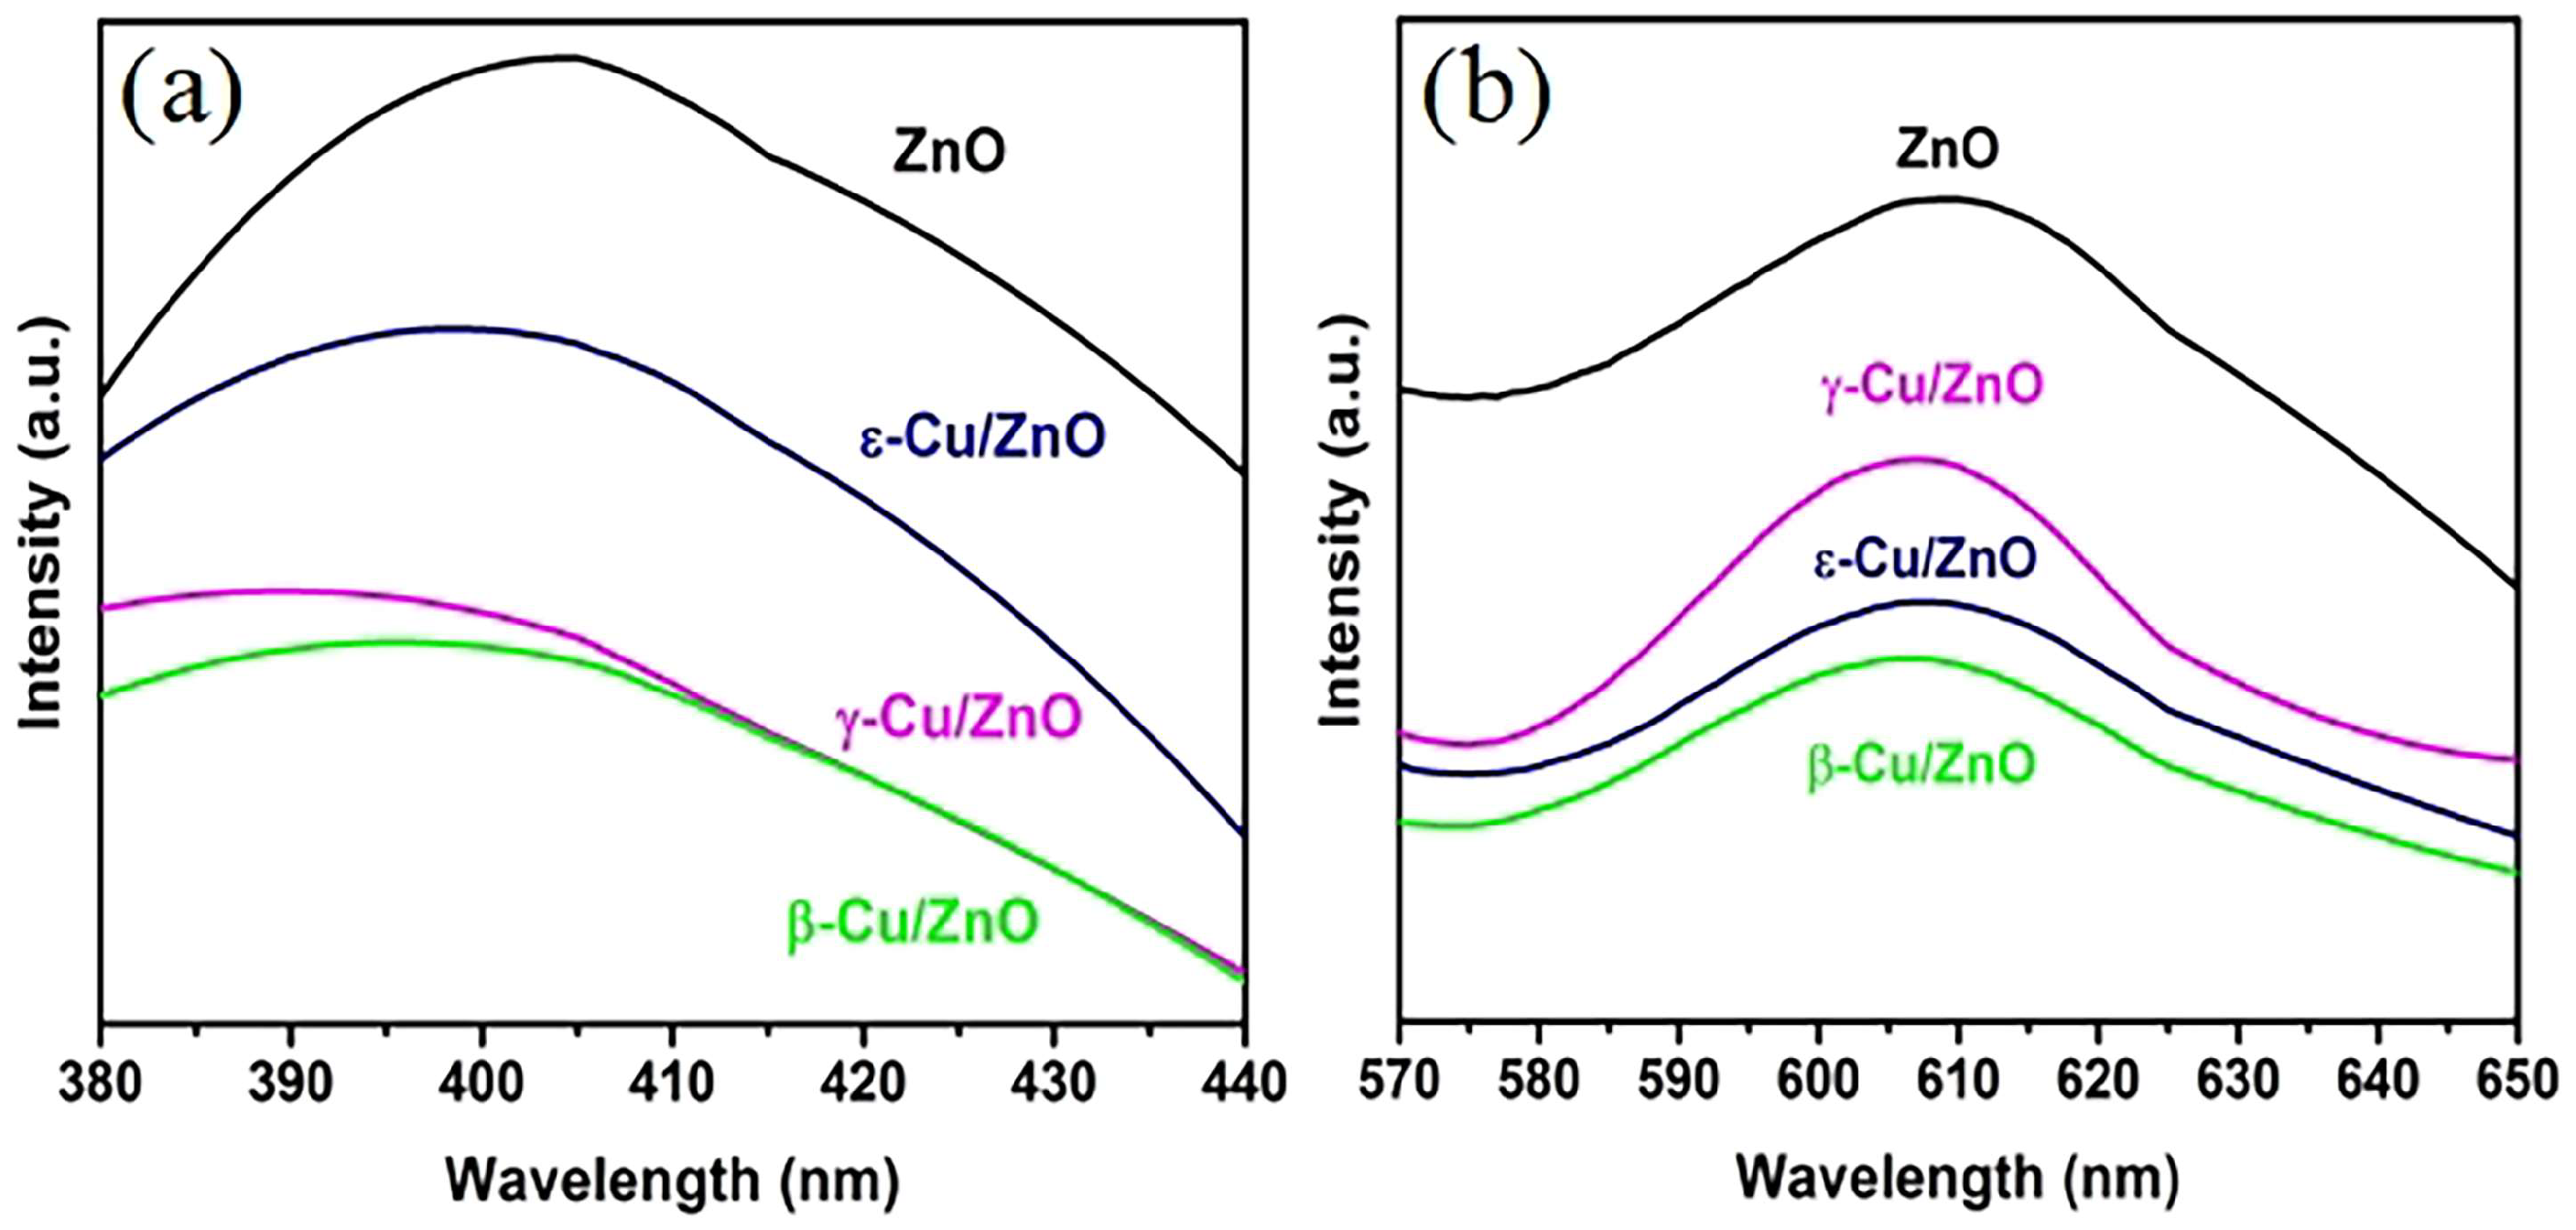
3.4. Photoluminescence Spectroscopy
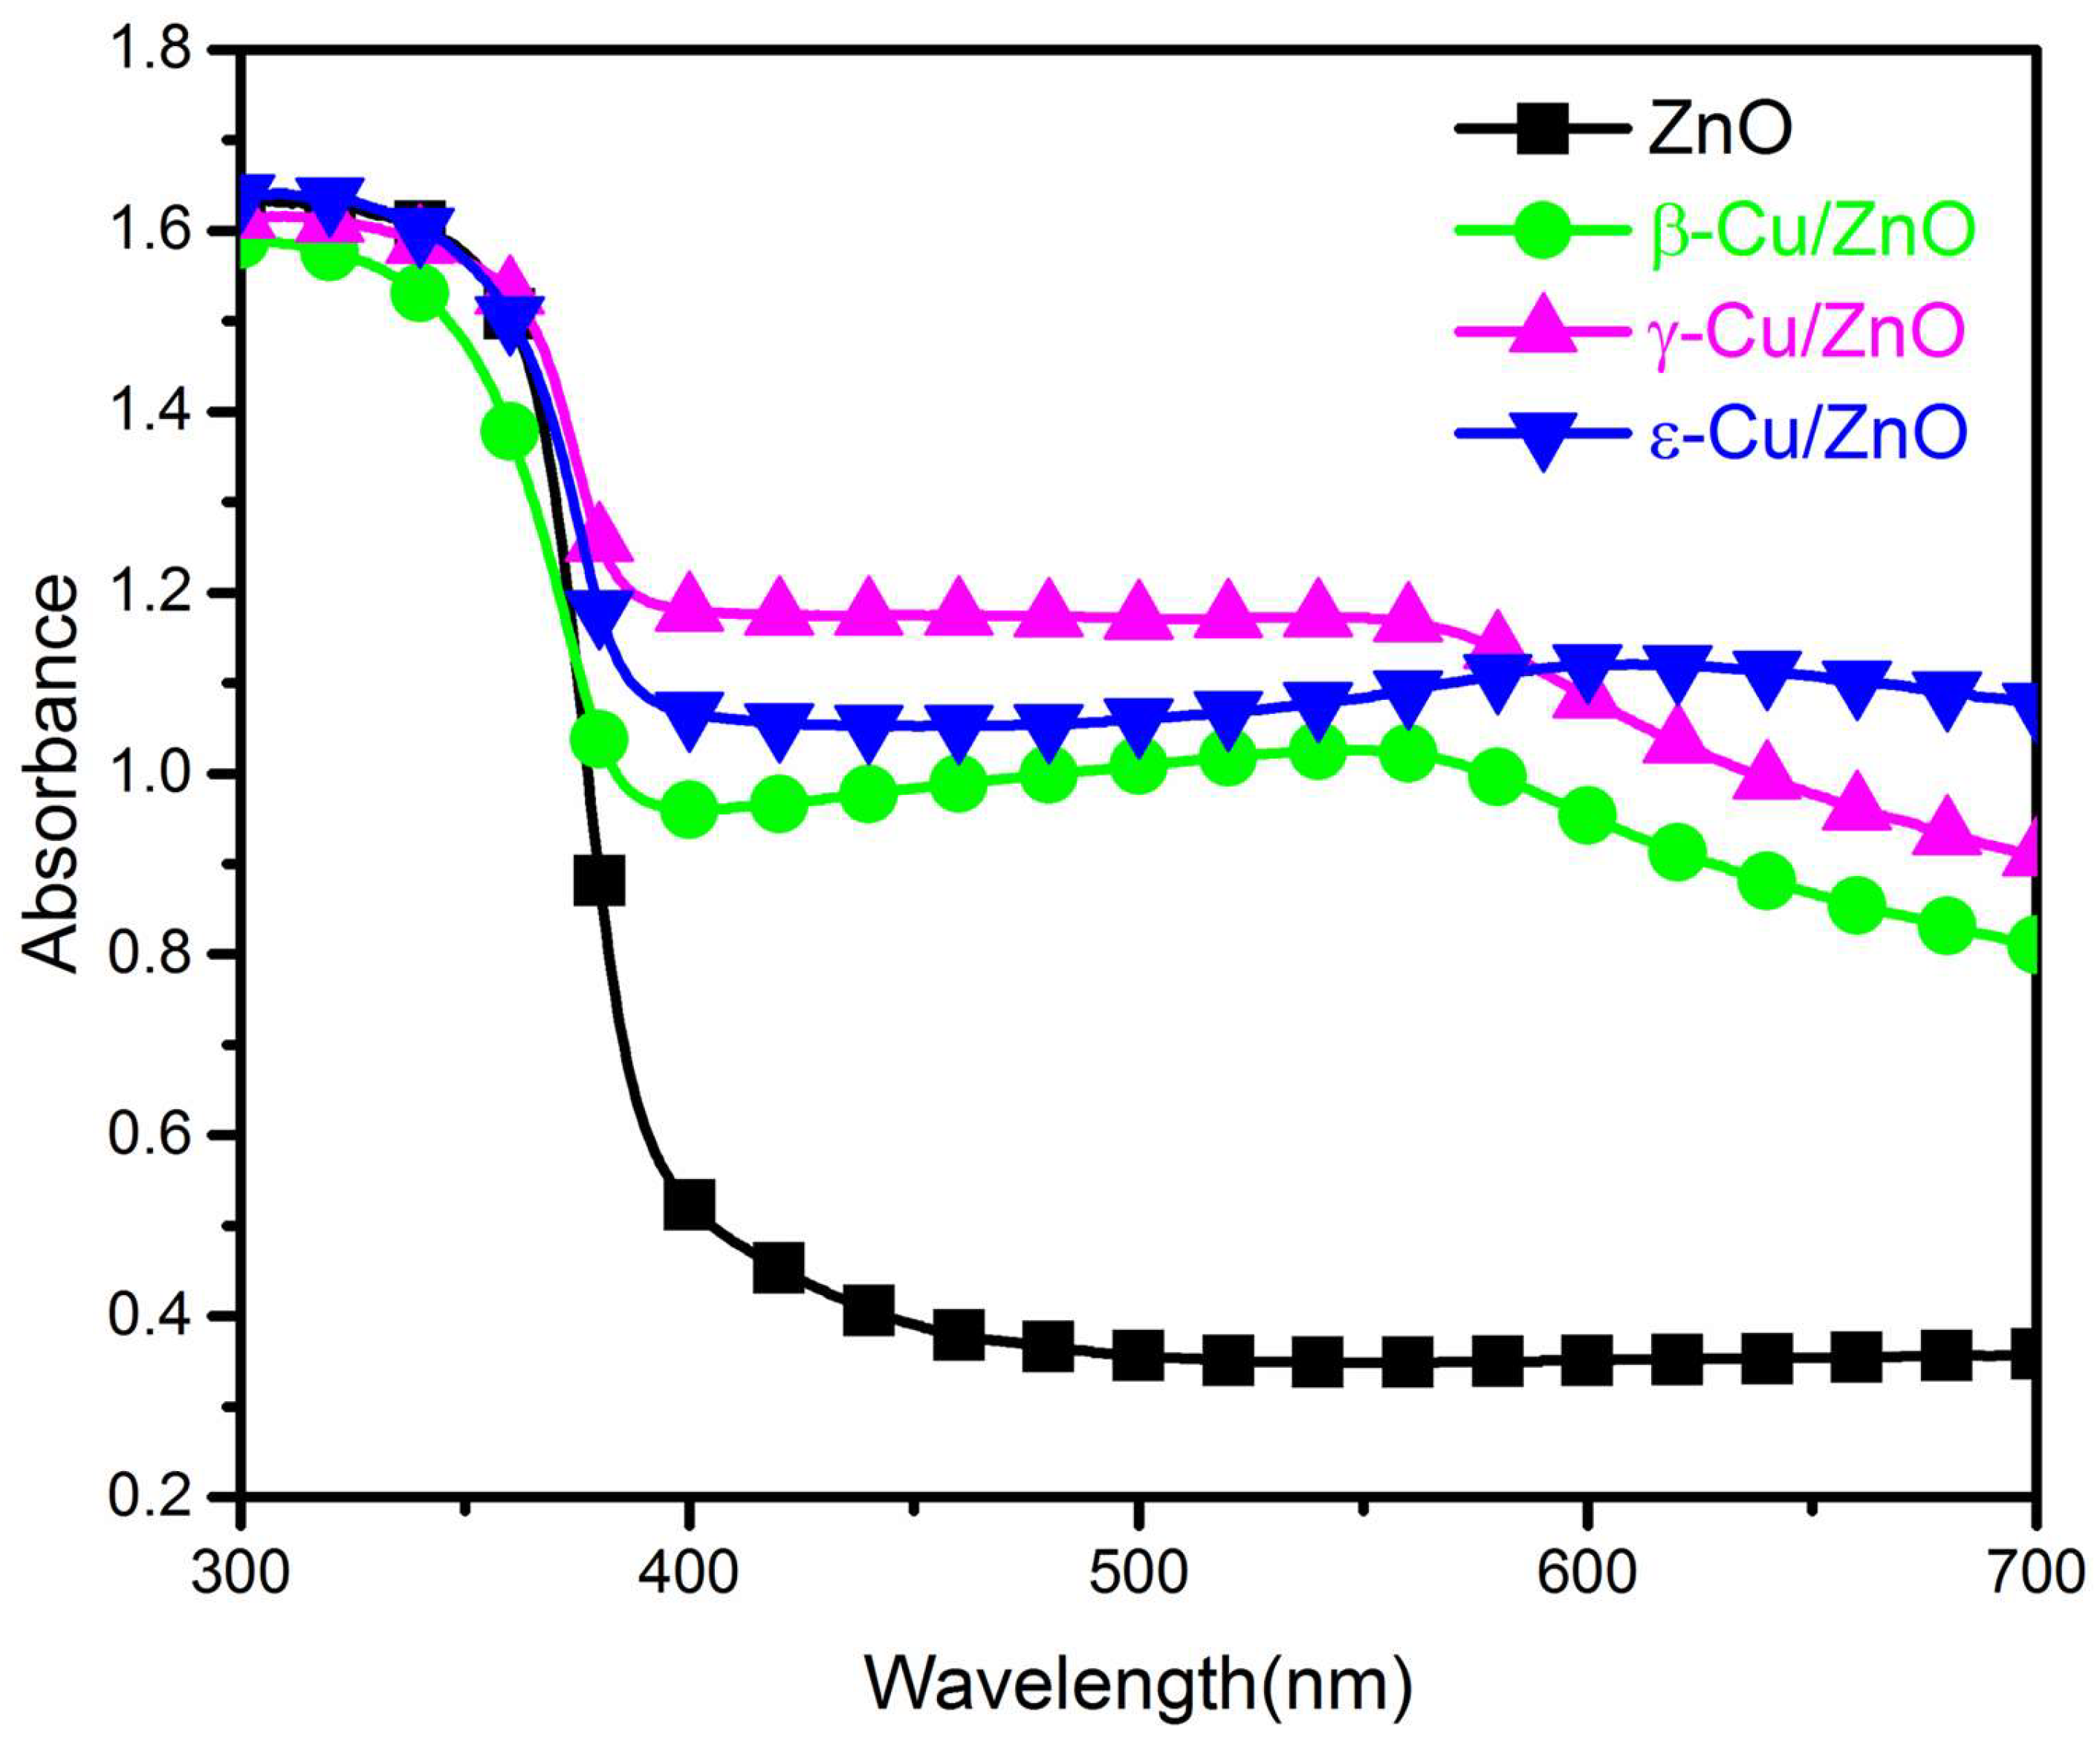
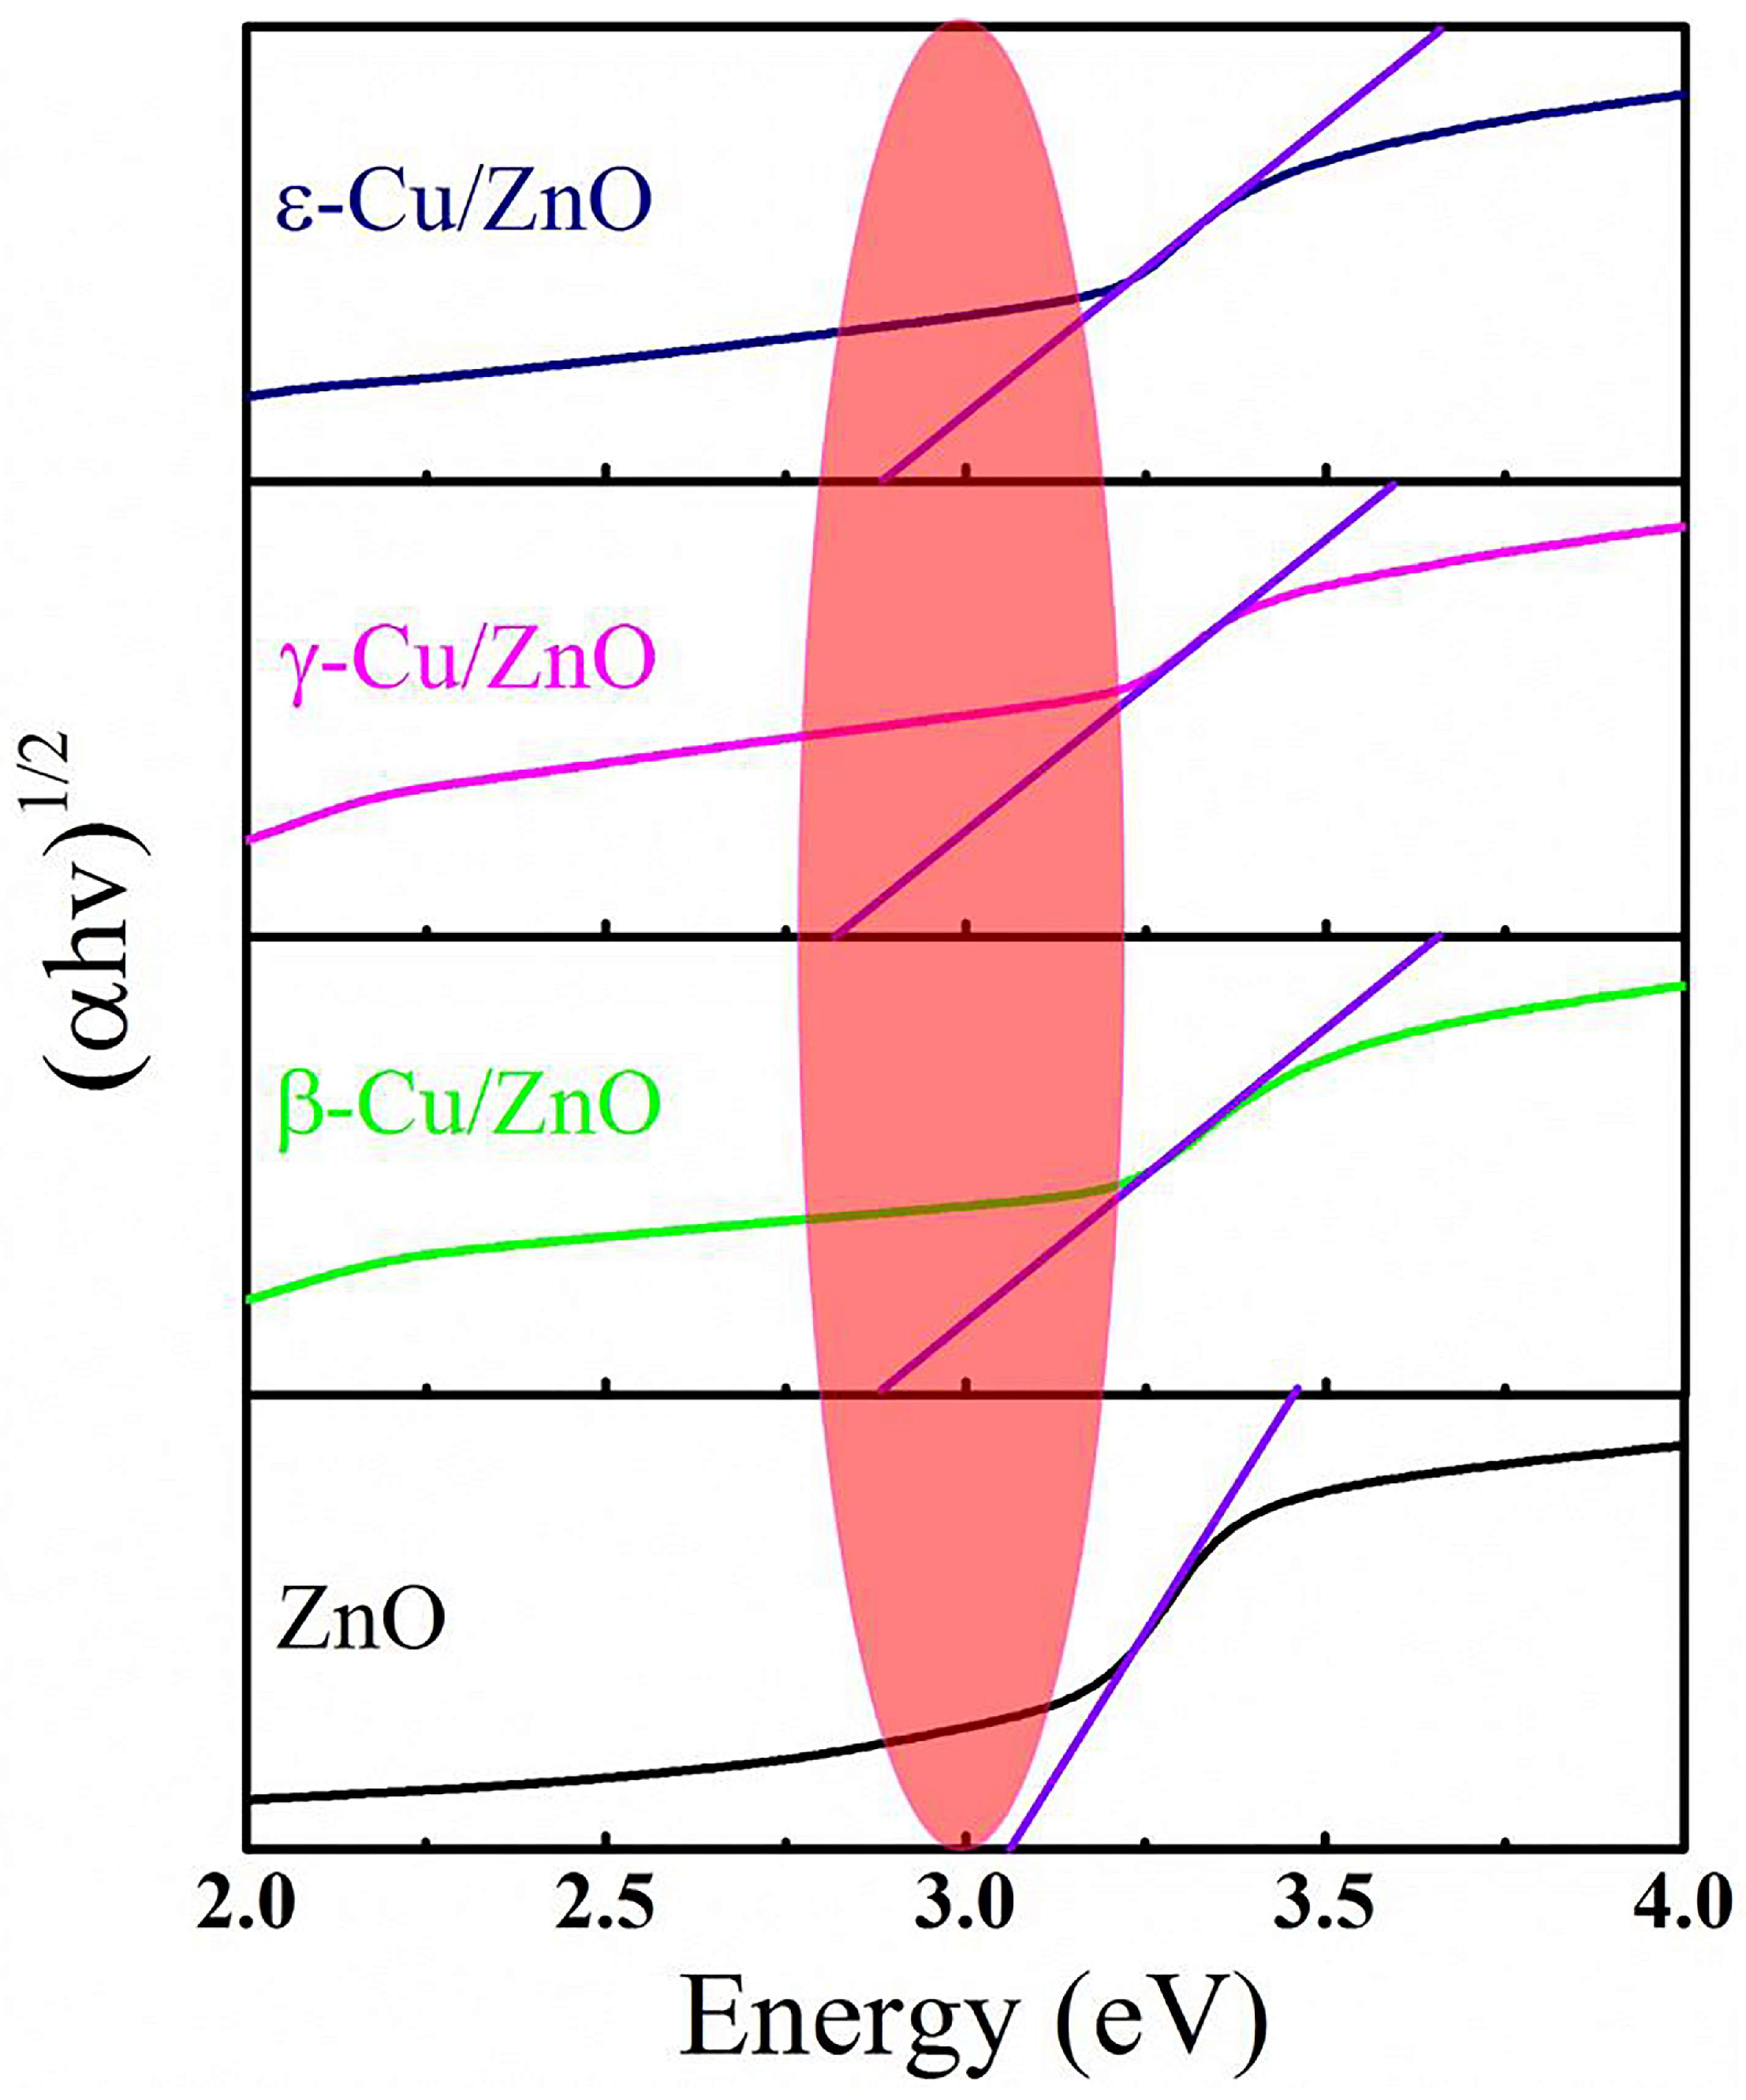
The photoluminescence spectroscopy (PL) of ZnO and Cu/ZnO synthesized using different ZnO phases under an excitation wavelength of 325 nm is shown in Figure 6. Typically, the PL of ZnO includes the near side with ultraviolet light and deep level visible light. Figure 6 (a) shows the UV light area of ZnO at approximately 400 nm, and this is typically caused by near edge band free exciton recombination [33]. Figure 6 (a) shows that the ZnO intensity was stronger than those of β-Cu/ZnO, γ-Cu/ZnO, and ε-Cu/ZnO. Figure 6 (b) shows the ZnO deep level visible light emission that is related to crystal defects (typically oxygen vacancies) and dopants [34].

3.5. Absorbance

The absorbances of ZnO and Cu/ZnO synthesized using different ZnO phases between the wavelengths of 300 and 700 nm are shown in Figure 7. Obviously, the ultraviolet light absorbance is higher than that of visible light, and this situation is typically termed an absorbance edge. This is because the wavelength of the ultraviolet region exhibited enough energy to excite the electrons to the conduction band. For the wavelength in the visible region, the energy was not strong enough to excite the electrons; hence, the light could be transmitted or reflected. The absorbance between 350 and 400 nm showed red shifts of γ-Cu/ZnO and ε-Cu/ZnO. Figure 7 shows that β-Cu/ZnO possessed a higher absorbance than ZnO when γ-Cu/ZnO and ε-Cu/ZnO exhibited lower absorbances than ZnO. A similar situation was reported by J Marselie et al., and this phenomena is caused by Cu. Further, there was an extra peak at approximately 570 nm that belonged to Cu. This was caused by the surface plasmon effect of Cu, it can used to confirm the existent of metallic copper. The calculated band-gap of ZnO and Cu/ZnO synthesized via different ZnO phases are shown in Figure 8. The figure shows that copper effectively decreased the band gap of ZnO. The band gaps of ZnO, β-Cu/ZnO, γ-Cu/ZnO, and ε-Cu/ZnO were 3.02, 2.61, 2.48, and 2.51 eV [35], respectively. An obvious red shift was observed in these samples.

3.6. Photocatalytic Performances

The degradation curves of ZnO and Cu/ZnO synthesized using different ZnO phases are shown in Figure 9. MB was used as the simulated pollution source in this work. Figure 9 (a) shows the degradation rates of ZnO, β-Cu/ZnO, γ-Cu/ZnO, and ε-Cu/ZnO, which are 85.4%, 89.5%, 96.2% and 99.6%, respectively. Cu/ZnO exhibited a higher degradation rate than ZnO. In addition, doped Cu/ZnO exhibits higher degradation efficiency for MB compared to other elements [27,28]. Figure 9 (b) was calculated based on the relationship between InC0/C and time. The linear correlation coefficients of ZnO, β-Cu/ZnO, γ-Cu/ZnO, and ε-Cu/ZnO were 0.99, 0.98, 0.95, and 0.99, respectively.Therefore, the MB degradation followed first order reaction kinetics. According to the first order reaction kinetics equation:
In(C0/C) = Kt,
where C0 represents the initial MB concentration, and C represents the MB concentration at a certain moment, we know that the rate constants, K, of ZnO, β-Cu/ZnO, γ-Cu/ZnO, and ε-Cu/ZnO were 0.008, 0.0137, 0.0208, and 0.0094 min-1[17,31], respectively. Figure 9 (c) shows the MB color change after different times and absorbance to the UV light when γ-Cu/ZnO was used as the photocatalyst. The absorbance wavelength was approximately 664 nm, and the absorbance strength decreased with increasing time. In addition, the absorbance strength reached zero after 240 min. We know that the Cu existed as an interstitial atom in the crystalline structure of ZnO according to the XRD results, and this could have increased the lattice defects. The existence of the interstitial atom could have enhanced the exposure of the polar crystallographic plane (0001) in ZnO based on the SEM results. Due to the higher activity of the polar crystallographic plane, the ZnO could have uniformly distributed around the Cu. According to the results of PL, the Cu could have reduced the ZnO excitation strength and then reduced the recombination probability of electron hole pairs. Based on the UV-Vis spectrum, Cu could have led to the red shift of ZnO, and we know that the band gap was reduced. The absorbance in the visible light region of Cu/ZnO was observed and compared with that of ZnO. Therefore, Cu/ZnO possessed better photocatalyst properties than ZnO.

4. Conclusions

The phase structure, microstructure, and photocatalytic performance of Cu/ZnO synthesized via hydrothermal oxidation and ball milling were investigated in this study. The results showed that Cu reduced the agglomeration of ZnO, enhanced the polar crystallographic plane, reduced the recombination probability of electron hole pairs and band gaps, and improved the photocatalytic performance. The γ-CuZnO was synthesized successfully when the mole ratio of Cu and Zn was 5:8. The γ-Cu/ZnO photocatalyst exhibited the best photocatalytic performance, the MB and degradation was as high as 99.6% under UV-light for 4 h.

Author Contributions

Conceptualization, Kaijun Wang and Jin Hu; Formal analysis, Jianchao Liu and Jin Hu; Funding acquisition, Zheng Liu; Investigation, Zheng Liu and Jianchao Liu; Methodology, Zheng Liu, Kaijun Wang and Jianchao Liu; Resources, Jin Hu; Software, Zheng Liu and Jianchao Liu; Supervision, Kaijun Wang and Jin Hu; Validation, Zheng Liu, Kaijun Wang, Jianchao Liu and Jin Hu; Writing – original draft, Zheng Liu; Writing – review & editing, Zheng Liu, Kaijun Wang and Jin Hu.

Funding

This work was supported by the Analysis and Testing Foundation of Kunming University of Science and Technology with number 2020P20191130012.

Institutional Review Board Statement

Not applicable.

Informed Consent Statement

Not applicable.

Data Availability Statement

Data will be made available on request.

Conflicts of Interest

The authors declare no conflicts of interest.

References

  1. Alvarez-Corena, J.R.; Bergendahl, J.A.; Hart, F.L. Advanced Oxidation of Five Contaminants in Water by UV/TiO2: Reaction Kinetics and Byproducts Identification. Journal of Environmental Management 2016, 181, 544–551. [Google Scholar] [CrossRef]
  2. Ahmed, S.; Rasul, M.G.; Brown, R.; Hashib, M.A. Influence of Parameters on the Heterogeneous Photocatalytic Degradation of Pesticides and Phenolic Contaminants in Wastewater: A Short Review. Journal of environmental management 2011, 92, 311–330. [Google Scholar] [CrossRef]
  3. Sugihara, M.N. UV-TIO2 Photocatalytic Degradation of the X-RAY Contrast Agent Diatrizoate: Kinetics and Mechanisms in Oxic and Anoxic Solutions. 2010. [Google Scholar]
  4. Sugihara, M.N.; Moeller, D.; Paul, T.; Strathmann, T.J. TiO2-Photocatalyzed Transformation of the Recalcitrant X-Ray Contrast Agent Diatrizoate. Applied Catalysis B: Environmental 2013, 129, 114–122. [Google Scholar] [CrossRef]
  5. Carbonaro, S.; Sugihara, M.N.; Strathmann, T.J. Continuous-Flow Photocatalytic Treatment of Pharmaceutical Micropollutants: Activity, Inhibition, and Deactivation of TiO2 Photocatalysts in Wastewater Effluent. Applied Catalysis B: Environmental 2013, 129, 1–12. [Google Scholar] [CrossRef]
  6. Omidi, A.; Habibi-Yangjeh, A.; Pirhashemi, M. Application of Ultrasonic Irradiation Method for Preparation of ZnO Nanostructures Doped with Sb+ 3 Ions as a Highly Efficient Photocatalyst. Applied surface science 2013, 276, 468–475. [Google Scholar] [CrossRef]
  7. Rezaei, M.; Habibi-Yangjeh, A. Simple and Large Scale Refluxing Method for Preparation of Ce-Doped ZnO Nanostructures as Highly Efficient Photocatalyst. Applied surface science 2013, 265, 591–596. [Google Scholar] [CrossRef]
  8. Zhu, C.; Lu, B.; Su, Q.; Xie, E.; Lan, W. A Simple Method for the Preparation of Hollow ZnO Nanospheres for Use as a High Performance Photocatalyst. Nanoscale 2012, 4, 3060–3064. [Google Scholar] [CrossRef] [PubMed]
  9. Wang, D.; Wang, Z.; Ping, G.; Chen, D.; Fan, M.; Bai, L.; Qin, L.; Lv, C.; Shu, K. Facile Synthesis of Waxberry-like ZnO Nanospheres for High Performance Photocatalysis. Science of Advanced Materials 2013, 5, 1642–1648. [Google Scholar] [CrossRef]
  10. Sharma, M.; Das, D.; Baruah, A.; Jain, A.; Ganguli, A.K. Design of Porous Silica Supported Tantalum Oxide Hollow Spheres Showing Enhanced Photocatalytic Activity. Langmuir 2014, 30, 3199–3208. [Google Scholar] [CrossRef] [PubMed]
  11. Mane, R.S.; Lee, W.J.; Pathan, H.M.; Han, S.-H. Nanocrystalline TiO2/ZnO Thin Films: Fabrication and Application to Dye-Sensitized Solar Cells. The journal of physical chemistry B 2005, 109, 24254–24259. [Google Scholar] [CrossRef] [PubMed]
  12. Tiwana, P.; Docampo, P.; Johnston, M.B.; Snaith, H.J.; Herz, L.M. Electron Mobility and Injection Dynamics in Mesoporous ZnO, SnO2, and TiO2 Films Used in Dye-Sensitized Solar Cells. ACS nano 2011, 5, 5158–5166. [Google Scholar] [CrossRef] [PubMed]
  13. Chou, C.-M.; Chang, Y.-C.; Lin, P.-S.; Liu, F.-K. Cu-Doped ZnO Nanowires as Highly Efficient Continuous-Flow Photocatalysts for Dynamic Degradation of Organic Pollutants. Journal of Photochemistry and Photobiology A: Chemistry 2017, 347, 1–8. [Google Scholar] [CrossRef]
  14. Shahpal, A.; Aziz Choudhary, M.; Ahmad, Z. An Investigation on the Synthesis and Catalytic Activities of Pure and Cu-Doped Zinc Oxide Nanoparticles. Cogent Chemistry 2017, 3, 1301241. [Google Scholar] [CrossRef]
  15. Vijayaprasath, G.; Murugan, R.; Mahalingam, T.; Hayakawa, Y.; Ravi, G. Enhancement of Ferromagnetic Property in Rare Earth Neodymium Doped ZnO Nanoparticles. Ceramics International 2015, 41, 10607–10615. [Google Scholar] [CrossRef]
  16. Ullattil, S.G.; Periyat, P.; Naufal, B.; Lazar, M.A. Self-Doped ZnO Microrods High Temperature Stable Oxygen Deficient Platforms for Solar Photocatalysis. Industrial & Engineering Chemistry Research 2016, 55, 6413–6421. [Google Scholar]
  17. Kadam, A.N.; Kim, T.G.; Shin, D.S.; Garadkar, K.M.; Park, J. Morphological Evolution of Cu Doped ZnO for Enhancement of Photocatalytic Activity. Journal of Alloys and Compounds 2017, 710, 102–113. [Google Scholar] [CrossRef]
  18. Chow, L.; Lupan, O.; Chai, G.; Khallaf, H.; Ono, L.K.; Cuenya, B.R.; Tiginyanu, I.M.; Ursaki, V.V.; Sontea, V.; Schulte, A. Synthesis and Characterization of Cu-Doped ZnO One-Dimensional Structures for Miniaturized Sensor Applications with Faster Response. Sensors and Actuators A: Physical 2013, 189, 399–408. [Google Scholar] [CrossRef]
  19. Iribarren, A.; Hernández-Rodríguez, E.; Maqueira, L. Structural, Chemical and Optical Evaluation of Cu-Doped ZnO Nanoparticles Synthesized by an Aqueous Solution Method. Materials Research Bulletin 2014, 60, 376–381. [Google Scholar] [CrossRef]
  20. Kumaresan, S.; Vallalperuman, K.; Sathishkumar, S.; Karthik, M.; SivaKarthik, P. Synthesis and Systematic Investigations of Al and Cu-Doped ZnO Nanoparticles and Its Structural, Optical and Photo-Catalytic Properties. Journal of Materials Science: Materials in Electronics 2017, 28, 9199–9205. [Google Scholar] [CrossRef]
  21. Chongsri, K.; Mekprasart, W.; Pecharapa, W. Structural and Optical Properties of F-Doped ZnO Nanoparticles Synthesized by Co-Precipitation Process. Key Engineering Materials 2016, 675, 69–72. [Google Scholar] [CrossRef]
  22. Chithra, M.J.; Pushpanathan, K.; Loganathan, M. Structural and Optical Properties of Co-Doped ZnO Nanoparticles Synthesized by Precipitation Method. Materials and Manufacturing Processes 2014, 29, 771–779. [Google Scholar] [CrossRef]
  23. Reddy, B.S.; Reddy, S.V.; Lakshmi, R.V. Structural and Optical Properties of Ag and Co Doped ZnO Nanoparticles. Proceedings of the AIP Conference Proceedings 2012, 1447, 431–432. [Google Scholar]
  24. Sharma, D.; Jha, R. Transition Metal (Co, Mn) Co-Doped ZnO Nanoparticles: Effect on Structural and Optical Properties. Journal of Alloys and Compounds 2017, 698, 532–538. [Google Scholar] [CrossRef]
  25. Ullah, R.; Dutta, J. Synthesis and Optical Properties of Transition Metal Doped ZnO Nanoparticles. In Proceedings of the 2007 International Conference on Emerging Technologies, Rawalpindi, Pakistan, 12-13 November 2007; pp. 306–311. [Google Scholar]
  26. Kumaresan, S.; Vallalperuman, K.; Sathishkumar, S.; Karthik, M.; SivaKarthik, P. Synthesis and Systematic Investigations of Al and Cu-Doped ZnO Nanoparticles and Its Structural, Optical and Photo-Catalytic Properties. Journal of Materials Science: Materials in Electronics 2017, 28, 9199–9205. [Google Scholar] [CrossRef]
  27. Shreya, A.; Bhojya Naik, H.S.; Vishnu, G.; Barikara, S.; Adarshgowda, N.; Hareeshanaik, S. Facile Synthesis of Eu-Doped ZnO Nanoparticles for the Photodegradation of the MB Dye and Enhanced Latent Fingerprint Imaging. New J. Chem. 2024, 48, 9262–9276. [Google Scholar] [CrossRef]
  28. Wu, F.; Yuan, Q.; Wang, X.; Luo, J.; Song, Y.; Lu, W.; Xu, H. Photocatalytic Activity of Electrospun Fe-doped ZnO Nanofibers: Synthesis, Characterization and Applications. Env Prog and Sustain Energy 2023, 42, e13986. [Google Scholar] [CrossRef]
  29. Nouasria, F.Z.; Selloum, D.; Henni, A.; Tingry, S.; Hrbac, J. Improvement of the Photocatalytic Performance of ZnO Thin Films in the UV and Sunlight Range by Cu Doping and Additional Coupling with Cu2O. Ceramics International 2022, 48, 13283–13294. [Google Scholar] [CrossRef]
  30. Wei, A.; Sun, X.W.; Xu, C.X.; Dong, Z.L.; Yang, Y.; Tan, S.T.; Huang, W. Growth Mechanism of Tubular ZnO Formed in Aqueous Solution. Nanotechnology 2006, 17, 1740. [Google Scholar] [CrossRef] [PubMed]
  31. Meshram, S.P.; Adhyapak, P.V.; Amalnerkar, D.P.; Mulla, I.S. Cu Doped ZnO Microballs as Effective Sunlight Driven Photocatalyst. Ceramics International 2016, 42, 7482–7489. [Google Scholar] [CrossRef]
  32. Lang, J.; Li, X.; Yang, J.; Yang, L.; Zhang, Y.; Yan, Y.; Han, Q.; Wei, M.; Gao, M.; Liu, X. Rapid Synthesis and Luminescence of the Eu3+, Er3+ Codoped ZnO Quantum-Dot Chain via Chemical Precipitation Method. Applied surface science 2011, 257, 9574–9577. [Google Scholar] [CrossRef]
  33. Tarat, A.; Nettle, C.J.; Bryant, D.T.; Jones, D.R.; Penny, M.W.; Brown, R.A.; Majitha, R.; Meissner, K.E.; Maffeis, T.G. Microwave-Assisted Synthesis of Layered Basic Zinc Acetate Nanosheets and Their Thermal Decomposition into Nanocrystalline ZnO. Nanoscale Research Letters 2014, 9, 1–8. [Google Scholar] [CrossRef]
  34. Cheng, W.; Wu, P.; Zou, X.; Xiao, T. Study on Synthesis and Blue Emission Mechanism of ZnO Tetrapodlike Nanostructures. Journal of applied physics 2006, 100. [Google Scholar] [CrossRef]
  35. Marselie, J.; Fauzia, V.; Sugihartono, I. The Effect of Cu Dopant on Morphological, Structural and Optical Properties of ZnO Nanorods Grown on Indium Tin Oxide Substrate. Proceedings of the Journal of Physics: Conference Series 2017, 817, 012014. [Google Scholar] [CrossRef]
Figure 1. XRD patterns of the different phases of the CuZn alloy.
Preprints 143845 g001
Figure 2. Typical microstructure (a) and surface EDS results of the γ-CuZn (b).
Preprints 143845 g002
Figure 3. XRD patterns of the Cu/ZnO synthesized via different phases of the CuZn alloy using hydrothermal oxidation (a) and the ZnO photocatalyst (b).
Preprints 143845 g003
Figure 4. Typical ZnO microstructure (a), different Cu/ZnO photocatalysts, (b)-(d) and the surface EDS result of the γ-CuZn (e).
Preprints 143845 g004
Figure 5. Representative XPS spectra of the γ-Cu/ZnO: (a) survey spectra, (b) Cu2p spectra, (c) Zn2p spectra, and (d) O1s spectra.
Preprints 143845 g005
Figure 6. The photoluminescence spectroscopy (PL) of ZnO and the synthesized Cu/ZnO.
Preprints 143845 g006
Figure 7. UV-Visible absorption spectra of ZnO and Cu/ZnO.
Preprints 143845 g007
Figure 8. The band-gaps of ZnO and Cu/ZnO.
Preprints 143845 g008
Figure 9. MB photocatalytic degradation over the as-prepared samples under UV irradiation for 240 min. (a) Photocatalytic activities, (b) MB photocatalytic degradation kinetics of (ln(C0/C)) versus irradiation time, and (c) the representative absorption spectra of MB over γ-Cu/ZnO during the photocatalytic process.
Preprints 143845 g009
Disclaimer/Publisher’s Note: The statements, opinions and data contained in all publications are solely those of the individual author(s) and contributor(s) and not of MDPI and/or the editor(s). MDPI and/or the editor(s) disclaim responsibility for any injury to people or property resulting from any ideas, methods, instructions or products referred to in the content.
Copyright: This open access article is published under a Creative Commons CC BY 4.0 license, which permit the free download, distribution, and reuse, provided that the author and preprint are cited in any reuse.
Prerpints.org logo

Preprints.org is a free preprint server supported by MDPI in Basel, Switzerland.

Subscribe

Disclaimer

Terms of Use

Privacy Policy

Privacy Settings

© 2025 MDPI (Basel, Switzerland) unless otherwise stated