
Submitted:
10 December 2024
Posted:
23 December 2024
You are already at the latest version
Abstract
Bone age assessments are critical for evaluating the growth and skeletal development of children and adolescents, influenced by factors such as genetics, ethnicity, culture, and nutrition. It is essential that clinical standards for these assessments are tailored to the specific populations being examined. This study validates the use of the TW3 (Tanner-Whitehouse 3) method for determining bone age in pediatric and adolescent populations in the Canary Islands, based on posteroanterior left-hand and wrist radiographs from 80 females and 134 males across various developmental stages. Our findings showed strong intra-rater reliability across all three raters. The Radiologist Specialist (Rater 1) and General Practitioner (Rater 2) demonstrated excellent consistency, with intra-class correlation coefficients (ICCs) between 0.990 and 0.996. The Medical Student (Rater 3) showed slightly lower but still robust reliability, with ICCs ranging from 0.921 to 0.976. Inter-rater agreement was high between Raters 1 and 2 but decreased between Rater 3 and the others, highlighting the impact of experience (ICCs from 0.812 to 0.912). The accuracy analysis indicated an underestimation of bone age relative to chronological age in preschool children (mean difference = 3.712 months; 95% CI: 1.290 to 6.130; p = 0.199) and school-age males (mean difference = 3.978 months; 95% CI: -12.550 to 4.590; p = 0.926), while this trend was minimal in females (mean difference = 4.110 months; 95% CI: -8.250 to 16.470; p = 0.945). Conversely, in teenagers, the TW3 method showed slight overestimation (mean difference = -0.360 months; 95% CI: -0.770 to -0.954; p = 0.299). These results underscore the TW3 method’s precision and accuracy across diverse developmental stages, suggesting that discrepancies between chronological age and estimated bone age are not significant and may reflect normal physiological variations.
Keywords:
diagnostic imaging
; skeletal maturation
; Tanner-Whitehouse 3 method
; bone age assessment
; pediatric radiology
; Canary Islands
1. Introduction
Maturation is the process through which an individual undergoes physical and psychological development, progressing from childhood to adulthood [1].These changes occur across various systems, affecting the structure and function of organs, tissues, and bodily systems. Physical changes during maturation encompass a series of biological processes through which the body undergoes significant transformations as it grows and develops. One of the most outstanding physical changes is skeletal maturation, where the bones grow in size and strength.
Methods of evaluating skeletal maturation include several approaches, with X-ray techniques being the most common and reliable. These procedures involve the use of radiographs to visually assess the stages of bone development. One of the most widely used X-ray methods for evaluation of skeletal maturity is the Greulich and Pyle (GP) Atlas, introduced in 1959. This method uses a set of standardized wrist radiographs from children of high socioeconomic status, mainly from Euro-American backgrounds. These reference images show different stages of skeletal maturation and are used to compare an individual´s X-ray to visually assess their bone age (BA) [2]. While simple and effective, it has limitations due to its focus on a specific population [3,4].
The Tanner-Whitehouse (TW) method, developed in the 1950s and 1960s, is a precise and widely used tool for assessing BA based on hand and wrist radiographs. It assigns scores according to the ossification of 20 bones, with a maximum of 1000 points upon reaching full maturity. It has evolved through three versions: TW1 (1962), based on radiographs of white European children [5], TW2 (1975), which was updated to reflect contemporary populations [6], and TW3 (2001), which introduces a two-phase process. First, 13 regions of interest (ROIs) are evaluated instead of the 20 bones in the original version, and then the total score is compared with reference charts to estimate BA in relation to chronological age (CA) [7].
A recent study by Martín Pérez et al. (2023) evaluated the precision of BA assessment methods in children across different ethnic groups. According to their results, both the GP Atlas and TW3 method were reliable tools; however, their accuracy differs depending on the ethnicity of the child being assessed. In this regard, the GP Atlas was accurate for Caucasian and Hispanic children, but overestimated BA in Asian and Arab adolescents, while TW3 showed higher accuracy in African children. All these findings suggest that ethnic bias may influence BA estimation, highlighting the need for methods tailored to different populations [4].
Regarding the study population, the peoples of the Canary Islands are notably diverse, resulting from the intermixing among Indigenous peoples [8,9], Europeans, and immigrants from various regions, creating a unique ethnic mosaic [10]. With high density and urban concentration in Gran Canaria and Tenerife, the population is clustered in coastal and metropolitan areas [11], while the higher regions experience depopulation [12]. Since the 1980s, there has been demographic aging and a decline in birth rates. The cities of Las Palmas de Gran Canaria and Santa Cruz de Tenerife stand out as population and economic centers, driven by tourism and centralized services [13].
Previous studies suggest that Canarian children have higher BA than British children but slightly lower than North American. Toledo (1978) arrived at this conclusion in his doctoral thesis after analyzing bone growth and development in a sample of 2,829 children (1,421 boys and 1,408 girls) from Santa Cruz de Tenerife. When comparing the Canarian and the American samples, the latter showed a slightly higher BA at the same CA. Using the TW2 method, it was observed that the BA of Canarian children were higher than those of the British population in all age groups, except during the first three years of life, where British BA exceeded the Canarian children by an average of 2.4 months [14]. In another place, this author and colleagues stated that in the case of BA, both males and females showed significantly different values compared to the English and North American samples, with our data, in any case, being closer to the latter [15].
The society's composition changes that have occurred in the Canary Islands over the past 50 years could have led to variations in infant maturation patterns compared to historical data, highlighting the need to update the reference values for BA in this specific population. While the GP-Canary Atlas has been recently validated for the pediatric population in the Canary Islands by Martín Pérez et al. (2024) [16,17], confirming its accuracy in assessing bone maturation, the latest version of the TW3 remains unvalidated for this population. This study aims to assess the precision of the TW3 method by analyzing intra-rater reliability and inter-rater agreement in Canarian children. It also seeks to evaluate the accuracy of BA assessments, considering differences based on developmental stages and gender.
2. Materials and Methods
2.1. Study Design
A cross-sectional study was conducted between September 1, 2023, and June 20, 2024, within the Departments of Pediatrics at the Complejo Hospitalario Universitario de Canarias (Tenerife, Canary Islands, Spain), a tertiary-level referral healthcare institution located in Tenerife, Spain. This study adhered to the STARD 2015 guidelines [18], which provide a comprehensive checklist for reporting diagnostic accuracy studies, thereby ensuring adherence to high methodological and reporting standards. Ethical approval was granted by the Ethics Committee of the Complejo Hospitalario Universitario de Canarias (reference number CHUC_2023_86), with approval obtained on July 13, 2023. The study protocol conformed strictly to the ethical principles set forth in the Declaration of Helsinki.
To provide robust contextual data for analysis, sociodemographic variables, including age and gender, as well as anthropometric measurements such as height, weight, and body mass index (BMI), were meticulously extracted from the SAP Logon database (IBM®, Armonk, NY, USA) at the Complejo Hospitalario Universitario de Canarias. Standardized PA-HW radiographs, securely stored in the Centricity PACS system (GE HealthCare®, Chicago, IL, USA), were systematically analyzed for all participants. The analysis was conducted according to a rigorously predefined protocol aimed at ensuring consistency and precision in data collection and interpretation.
As part of this verification process, each PA-HW radiograph was carefully reviewed to confirm proper positioning of the patient’s left hand, with the fingers slightly spread and the wrist appropriately aligned with the forearm. Radiographs were meticulously examined to ensure that all relevant anatomical landmarks, including the phalanges, metacarpals, carpal bones, and distal radius and ulna, were clearly visible and accurately captured. Furthermore, the imaging parameters—such as exposure, focus, and contrast—were thoroughly checked to confirm adherence to established protocol standards, thereby ensuring the reliability and reproducibility of imaging data.
2.2. Participants
2.2.1. Inclusion and Exclusion Criteria
The inclusion and exclusion criteria for this study were meticulously established to guarantee a representative and homogeneous cohort of healthy children and adolescents from the Canary Islands, facilitating an accurate assessment of BA through posteroanterior hand and wrist (PA-HW) radiographs. Eligibility requirements included: (1) participants had to be healthy children aged 0 to 18 years who had resided in the Canary Islands for at least five years. Additionally, (2) at least one parent was required to be of Canary Island descent, verified through comprehensive medical and family history records, to ensure consistency in the genetic profile of the study group. Furthermore, (3) participants had to possess medical records dating from 2016 onwards, and (4) their PA-HW radiographs had to meet specific quality criteria, including proper hand positioning, clear visualization of critical anatomical landmarks, and adherence to standardized imaging protocols.
The exclusion criteria were established to eliminate potential confounders that could impact normal bone development or compromise the accuracy of BA estimation. Participants were excluded if they had (1) medical conditions known to influence bone maturation, including endocrine–metabolic disorders (e.g., growth hormone deficiency, hypothyroidism, hyperthyroidism), neurological disorders (e.g., cerebral palsy, muscular dystrophy), or genetic syndromes (e.g., Down syndrome, Turner syndrome, Marfan syndrome). In addition, (2) children receiving medical treatments known to affect skeletal growth, such as growth hormone therapy, corticosteroids, or chemotherapy, were not eligible for participation. PA-HW radiographs were excluded if they (3) exhibited fractures, major skeletal deformities, or (4) were of insufficient quality, such as inadequate resolution, poor exposure, or obscured anatomical landmarks, which could hinder the BA assessment process.
2.2.2. Sample Size Calculation
The sample size for this study was calculated to ensure precise and accurate BA measurements using the TW3, with a 95% confidence level and a 5% margin of error. Due to the lack of standard deviation data for BA in the Canary Islands’ population, estimates from similar studies in comparable populations were used to approximate expected variability [16]. Based on these estimates, a minimum of a total sample size of n = 200 children was determined to be sufficient for validating the TW3 method in this pediatric population, ensuring reliable and generalizable findings.
2.3. Test Methods
To ensure objective and unbiased BA determination, three blinded raters independently assessed the PA-HW radiographs. Specifically, the raters included a Radiology Specialist (Rater 1), a General Practitioner (Rater 2), and a Medical Student (Rater 3), thereby representing varying levels of expertise and training in radiological evaluation. This diverse composition was intentionally chose to analyze the influence of professional experience on the precision and accuracy of BA assessments. Consequently, each rater determined BA by comparing observed skeletal features with the reference images provided by the TW3 method.
To further evaluate intra-rater precision, each rater assessed BA at two separate time points (T1 and T2), which were spaced less than six weeks apart. Importantly, the PA-HW radiographs were presented in a randomized and blinded order during both assessments to minimize interpretation bias and prevent recall of prior evaluations. Thus, this strategy enabled a thorough examination of intra-rater reliability by comparing each rater’s measurements from T1 to T2, thereby assessing the consistency of their evaluations over time.
Moreover, inter-rater precision was examined by comparing BA determinations across the three raters to analyze their levels of agreement and reliability in interpreting the same set of radiographs. This comparative analysis was essential for assessing the reproducibility of the BA assessment method across raters with differing expertise levels. Additionally, the accuracy of the BA assessments was evaluated by comparing the estimated BA using TW3 to the subjects’ CA, calculated as the difference between their birth date and the date of the radiological exam.
With respect to the BA, it was estimated by the TW3 that is a radiological method widely recognized for assessing BA through PA-HW radiographs [5-7]. It challenges the validity of correlating age with height, dentition, and bone development, arguing that bone maturation does not follow a uniform trajectory but varies by individual developmental stages. Unlike qualitative approaches as GP Atlas, numerical methods provide a more objective quantification of bone maturation, assigning specific scores to each bone based on gender and developmental stage.
This method employs a structured scoring system for individual bones, assigning maturity scores according to predefined criteria such as shape, size, and ossification degree. This evaluation focuses on the radius, ulna, metacarpals, phalanges, and select carpal bones. The scores are tailored to the individual's sex and developmental stage, then summed to generate a total maturity score. This score is compared with established reference values corresponding to CA ranges, yielding an estimated BA. This standardized and precise approach enhances comparability across different populations and allows for accurate assessments of skeletal development.
2.4. Analysis
Statistical analyses were conducted using IBM® SPSS Statistics 29.0.1.0 software (Armonk, NY, USA). Descriptive statistics were first calculated for age (in mos.), weight (kg), height (m), and body mass index (BMI) (kg/m2). The data were stratified according to developmental stages as defined by Fraga and Fernández (2014) [19]—preschool children (1 to 5 years), school-age children (5 to 12 years), and teenagers (12 to 18 years)—and further segmented by gender to account for potential differences in bone maturation between males and females. These descriptive measures included calculations of central tendency (mean) and dispersion (standard deviation, minimum, and maximum) for both CA and BA as estimated by TW3 method. To confirm the suitability of the data for further statistical analyses, the Shapiro–Wilk test was applied to assess the normality of the data distribution, while Levene’s test was used to evaluate homoscedasticity.
For precision assessment, the intra-class correlation coefficient (ICC) was calculated to evaluate both intra-rater and inter-rater agreement. The ICC provided a robust quantitative measure of consistency within and between raters, indicating the degree of agreement when using the TW3 method for BA estimation. Bland–Altman plots were also built to visually assess inter-rater reliability and detect any systematic bias or limits of agreement between the raters’ BA measurements. Moreover, the accuracy of the BA estimations was evaluated through a paired samples test, comparing the discrepancies between the estimated BA through TW3 and the actual children’ CA.
3. Results
3.1. Characteristics of the Sample
A total of 214 posteroanterior hand and wrist (PA-HW) radiographs from healthy children were analyzed, including 80 females and 134 males. Among females in the preschool group, the mean age was 39.33 mos. (SD = 15.18), with an average weight of 14.52 kg (SD = 2.05) and an average height of 0.91 m (SD = 0.07). Conversely, males had a mean age of 46.49 mos. (SD = 13.33), a mean weight of 13.09 kg (SD = 2.17), and a mean height of 0.94 m (SD = 0.05). In the school-age group, the female group showed a mean age of 92.00 mos. (SD = 26.08), a mean weight of 29.58 kg (SD = 7.14), and a mean height of 1.14 m (SD = 0.07).
Conversely, the male group presented with a mean age of 100.16 mos. (SD = 20.33), a mean weight of 23.67 kg (SD = 4.85), and a mean height of 1.16 m (SD = 0.05). Among teenager, both females and males recorded a mean height of 1.33 m. Females had an average age of 144.17 mos. (SD = 23.81) and a mean weight of 33.84 kg (SD = 4.62), while males demonstrated a mean age of 151.53 mos. (SD = 20.17) and a mean weight of 34.21 kg (SD = 3.19). The Shapiro–Wilk test confirmed the normal distribution of all variables within these groups. Further details are presented in Table 1.
3.2. Main Results
3.2.1. Precision
- Intra-rater Agreement
The ICC results showed strong precision and consistency in intra-rater reliability across all three raters when assessing BA using the TW3 technique, with slight gender-based variations. Specifically, Radiologist Specialist (Rater 1) exhibited high consistency, achieving an ICC of 0.996 (95% CI: 0.991–0.998) for females and 0.994 (95% CI: 0.989–0.997) for males. Similarly, General Practitioner (Rater 2) displayed strong reliability, with an ICC of 0.988 (95% CI: 0.976–0.994) for females and 0.993 (95% CI: 0.980–0.997) for males. Medical Student (Rater 3), while showing slightly lower but still strong ICC values, recorded 0.928 (95% CI: 0.845–0.968) for females and 0.970 (95% CI: 0.935–0.986) for males. Additional details are provided in Table 2.
- Inter-rater agreement
The inter-rater agreement in determining the BA using the TW3 method showed distinct differences between female and male participants. For females, there was excellent agreement between the Radiologist Specialist (Rater 1) and the General Practitioner (Rater 2), with an ICC of 0.976 (95% CI: 0.950, 0.987). However, the agreement was lower between the Radiologist Specialist and the Medical Student (Rater 3), as well as between the General Practitioner and the Medical Student, with ICCs of 0.812 (95% CI: 0.702, 0.896) and 0.880 (95% CI: 0.820, 0.922), respectively.
For males, the Radiologist Specialist and the General Practitioner demonstrated strong consistency, with an ICC of 0.968 (95% CI: 0.940, 0.982). In contrast, the agreement between the Radiologist Specialist (Rater 1) and the Medical Student (Rater 3), and between the General Practitioner (Rater 2) and the Medical Student (Rater 3), was lower, with ICCs of 0.857 (95% CI: 0.770, 0.921) and 0.912 (95% CI: 0.860, 0.946), respectively. These findings emphasize the high level of agreement between trained evaluators, while the reduced consistency with the Medical Student highlights the need for standardized training to ensure consistent use of the TW3 method. Further details are provided in Table 3.
The Bland–Altman plots in Figure 1 display the agreement among the three raters (Rater 1, Rater 2, and Rater 3) for the BA assessment using the TW3. For female participants, Rater 1 and Rater 2 exhibited high agreement, reflected by a narrow range of differences, indicating strong consistency. In contrast, the agreements between Rater 1 and Rater 3, as well as Rater 2 and Rater 3, were moderate, with wider limits of agreement, suggesting greater variability due to differences in training. A similar pattern emerged for male participants: Rater 1 and Rater 2 demonstrated strong agreement, while Rater 1 and Rater 3, and particularly Rater 2 and Rater 3, showed lower levels of agreement with broader ranges of differences, emphasizing the challenges of achieving consistent assessments among less experienced raters.
3.2.2. Accuracy
The TW3 method demonstrated limited accuracy in estimating BA compared to CA in the preschool cohort. Specifically, for children aged 1 to 5 years, the method yielded a slight underestimation of BA, with a mean difference MD = 3.712 mos. (95% CI: 1.29 to 6.13 mos., p = 0.199). This underestimation was less pronounced in males (MD = 0.106 mos., 95% CI: -4.83 to 5.05 mos., p = 0.935) compared to females, who exhibited a larger difference (MD = 4.200 mos., 95% CI: 0.78 to 7.62 mos., p = 0.164).
In the school-age group (ages >5 to 12 years), the TW3 method similarly demonstrated a minor underestimation of BA, with an MD of 3.522 mos. (95% CI: 1.05 to 5.99 mos., p = 0.888). The magnitude of this underestimation was less significant in males (MD = 3.978 mos., 95% CI: -12.55 to 4.59 mos., p = 0.926) compared to females (MD = 4.110 mos., 95% CI: -8.25 to 16.47 mos., p = 0.945).
In the teenager group, the TW3 method showed a slight overestimation of BA relative to CA, with an MD = -0.360 mos. (95% CI: -0.77 to -0.954 mos., p = 0.299). When stratified by sex, females exhibited a mean difference of -0.380 mos. (95% CI: -4.84 to 5.50 mos., p = 0.256), indicating no statistically significant difference. Similarly, in males, the mean difference was -0.330 mos.(95% CI: -1.03 to 1.78 mos., p = 0.222), also reflecting no significant discrepancy between BA and CA. Further details are provided in Table 4 and visually summarized in Figure 2.
4. Discussion
4.1. Precision of TW3
The assessment of an instrument's precision ensures that it meets essential criteria for accuracy and consistency, which are necessary for the generalization of research findings. Reliability refers to the degree of precision with which an instrument measures what it is intended to measure [29].
4.1.1. Intra-Rater Agreement
Our findings on the precision of the TW3 method align with existing literature for diverse populations, including Caucasian cohorts. Our study showed a high intra-rater precision in TW3-based BA assessments across various raters. The radiology specialist (Rater 1) achieved near-perfect intra-class correlation coefficients ICC = 0.995 for females and 0.996 for males. Similarly, the general practitioner (Rater 2) demonstrated high precision with ICC = 0.990 for females and ICC = 0.992 for males. While medical students (Rater 3) also exhibited strong precision, their ICCs were slightly lower at ICC = 0.921 for females and ICC = 0.976 for males.
These findings are consistent with other studies that have previously studied TW3 precision. In Europe, Pinchi et al. (2014) [20] reported high intra-examiner reliability among Caucasian Italian children, with correlation coefficients of r = 0.843 for boys and r = 0.910 for girls. Although these values are somewhat lower than ours, such variations may reflect differences in rater training, population characteristics, or even the sample sizes.
Furthermore, in South America, the evidence for TW3 precision is provided by López et al. (2008) [21], who documented high accuracy for the TW3 RUS method in Venezuelan children aged 7 to 14 years, with a correlation of r = 0.91 for the entire sample and r = 0.93 for girls. In contrast, the TW3 Carpal method showed reduced accuracy, with r = 0.89 for boys and r = 0.82 for girls.
Comparable precision results have been observed by Kowo-Nyakoko et al. (2023) [22] in Zimbabwean children, where the TW3-RUS method displayed a very strong intra-examiner reliability, with correlations coefficients of r = 0.95 for boys and r = 0.93 for girls. On the other hand, Kim et al. (2015) [23] similarly demonstrated strong intra-examiner agreement for TW3, with a Pearson’s correlation coefficient of r = 0.93 for Korean children aged 7 and 12 years.
The results obtained for children from the Canary Islands are consistent with findings from other studies, particularly among experienced raters, reinforcing the robustness of the TW3 method across various ethnic and geographic contexts [24]. However, these findings also point to potential variability influenced by the rater's level of training and cognitive biases, underscoring the critical need for standardized training and protocols to enhance reliability and consistency across diverse populations.
4.1.2. Inter-Rater Agreement
Our findings on the inter-rater agreement of the TW3 method for BA assessment align with previous studies in various populations, while also highlighting unique differences. Specifically, we observed excellent agreement between the Radiologist Specialist (Rater 1) and the General Practitioner (Rater 2), with ICC = 0.976 for females and ICC = 0.968 for males. Concordance was lower when the Medical Student (Rater 3) was involved, indicating that experience and training significantly affect precision.
Comparatively, Benjavongkulchai et al. (2018) [25] reported kappa values ranging from k = 0.66 to k = 0.88 for the TW3-RUS method in Thai children, reflecting moderate to high agreement but with greater variability compared to our findings among professional raters. Similarly, Geng et al. (2024) [26] found Kendall's W values of W = 0.833 for the radius, ulna, and short finger (TW3-RUS) system, and W = 0.944 for the carpal system in a sample of children living in Beijing, China.
Moreover, Alshmarani et al. (2019) [27] reported strong inter-examiner reliability for the TW3 method in Saudi children, with intraclass correlation coefficients (ICCs) of 0.972 for females and 0.963 for males. This finding aligns with the high agreement observed among our trained raters and highlights consistent gender-related differences in reliability. Similarly, Yuh et al. (2023) [28] documented comparable inter-rater agreement for the TW3-RUS method, ranging from 0.985 to 0.984, and for the TW3-Carpal method, ranging from 0.981 to 0.973, in a sample of Taiwanese children.
Our findings underscore the fundamental role of rater training and experience in achieving consistent assessments using the TW3 method [29]. The variability observed among less experienced raters, such as medical students, can be attributed to the complexity introduced by this method in radiological BA assessments.
While the hand offers a large number of areas of interest for studying radiological maturity, inter-observer variation or systematic error tends to be more pronounced in non-expert raters with the TW3 method. Unlike the GP Atlas, which relies on a single general judgment due to its primarily visual approach, the TW3 method requires at least 20 distinct evaluations for each radiological region of interest, thereby increasing the potential for variability in results.
4.2. Accuracy of TW3
The evaluation of an instrument's validity ensures precision and accuracy [30], with reliability targeting consistency and validity assessing accuracy. This study seeks to develop a tool for skeletal maturity assessment, emphasizing the need for updated, population-specific normative data due to the influence of hereditary, ethnic, behavioral, and nutritional factors. While Toledo’s 1978 study established early TW2 references for the Canary Islands [14], outdated data and methods limited its relevance [7,31]. Updated standards are crucial for applicability, as high population variability challenges the generalization of methods, necessitating tailored normative data.
Our study is the first to assess the suitability of TW3 method in the contemporary pediatric population of the Canary Islands. Differentiating between normal and pathological variations is essential, and our study expands the threshold for skeletal maturity from 2 to 2.5 standard deviations to identify normal variants more flexibly.
Previous studies have demonstrated that Canarian children show a higher BA than British children but a slightly lower BA compared to North American children. The abovementioned study of Toledo (1978) [14] carried out a comparative analysis of Canarian and United States and Canada populations, finding that North American children showed a somewhat higher BA. Using the TW2 method, he observed that children from the Canary Islands had a higher BA than their British counterparts, except during the first three years of life, when British children exceeded the Canarian cohort by an average of 2.4 mos.
Our findings align with those of Toledo (1978) [14], particularly concerning the underestimation of BA in Canarian preschool children (1–5 yrs.). Moreover, consistent with Toledo's observations, we confirmed a slight overestimation of BA using the TW method in teenagers (12–18 yrs.). This overestimation, however, was notably lower than that reported in other regions of Spain, such as Aragón, where Ebrí-Torné (2021) observed that the TW2 method overestimated BA by 4 to 6 mos. in a comparable sample of Aragonese children [32]. However, in the school-age population (5–12 yrs.), we have identified an underestimation of BA using the TW3 method, in contrast with the overestimation reported by Toledo (1978) in the late Seventies [14]. Therefore, despite the small differences that exist, we can affirm that the accuracy of the TW method identified in our study for Canarian children is consistent with historical findings for the same population. Thus, variants detected within the school-age population should be interpreted as physiological and within the normal range, i.e., reflecting constitutional developmental differences without clinical significance.
Regarding the differences in bone maturation seen in the present study, while not significant, may be attributed to factors such as natural individual variability and sexual dimorphism [33]. Studies utilizing databases such as those from Colorado Longitudinal Twin Study (Colorado, 1985) and the Fels Longitudinal Study (Ohio, 1929) suggest a hereditary predisposition, as specific ossification sequences tend to recur within families, pointing to a genetic pattern [34]. This process is primarily influenced by genetic factors through multifactorial polygenic inheritance, which, under ideal conditions, explains between 80% and 90% of bone maturation [35]. It is estimated that 25% of the variability in hand bone ossification is explained by genetic factors, and a similar phenomenon is observed in the order of ossification [34].
Furthermore, it is important to consider that during the preschool stage, growth deceleration is observed, influenced by both environmental and genetic factors [34,36]. Linkage studies suggest that, although genetic factors affect skeletal maturation during childhood, some have a limited impact over time [37,38]. In early childhood, bone ossification predominates, and structural genes are believed to be responsible for the initial formation of bones [39-41]. The growth deceleration after 6 months may be partly due to environmental factors, although genetic factors may also influence this process [34,42].
In the preschool stage (1-5 yrs.), the TW3 method tends to slightly underestimate BA, with a MD = 3.712 mos. This underestimation is more pronounced in girls, while the difference is smaller in boys. These results may reflect sexual dimorphism, which, although subtle in the early years, becomes more evident with development [43,44]. The difference in BA estimation between sexes may be due to the ossification process following a different sequence in boys and girls, influenced by genetic and hormonal factors [45]. According to Thomis et al. (2006) [36], hormones play a key role in stimulating linear growth and in the acceleration or deceleration of bone maturation. Growth and thyroid hormones are fundamental in this process, with thyroid hormones having a more pronounced impact on ossification than on height growth [46-48]. Additionally, thyroid hormones stimulate the synthesis of growth hormone (GH) and regulate the synthesis of somatomedin, interacting with the TRH-TSH-thyroid axis [49,50].
In the schoolar stage (5-12 yrs.), small sexual differences in BA were observed, with an underestimation of BA identified, showing a mean discrepancy of 3.522 mos., which was more pronounced in girls. Contrary to previous studies, our findings suggest an acceleration in bone maturation in girls, leading to a convergence in skeletal development between the sexes, thereby overcoming the delay observed in earlier stages. Recent research has established that global differences in bone maturation rates between genders are narrowing, resulting in more synchronized developmental trajectories [53]. However, in contrast to this general trend, and in line with other studies [51,52], we report a consistent developmental gap during the preschool stage (5-12 yrs.), with girls maturing faster than boys. It is well established that changes in bone maturation occur in both sexes, characterized by increases in length (proceritas prima and secunda) and weight (turgor secundus). These findings may be further explained by the pubertal growth spurt, which, at least in the Canarian pediatric population, occurs earlier in girls (ages 11-13), leading to greater height and strength compared to boys [53].
In our study, we observed that girls had an average BMI of 22.76 kg/m², which was significantly higher than that of boys (17.59 kg/m²). This difference may contribute to earlier puberty, which is often associated with obesity [54,55]. Leptin, a hormone associated with body fat profile, is believed to play a role in stimulating puberty in girls. However, its relationship with the onset of puberty in boys remains less clear, suggesting that it may not be the primary trigger for them [56]. Although the specific mechanisms behind this acceleration are not fully understood, it is suggested that factors such as exposure to endocrine disruptors, chronic stress, and calorie-rich diets may play a significant role in influencing this phenomenon [57,58]. These complex factors require further research to understand their impact on pubertal development and bone maturation in the child population of the Canary Islands.
Lastly, in the adolescent stage (12-18 yrs.), the TW3 method showed a slight overestimation of BA with a MD = -0.360 mos. Girls presented a difference of MD = -0.380 mos. and boys MD = -0.330 mos., with no significant differences. In boys, the increase in androgens accelerates bone maturation, completing skeletal growth. In girls, estrogens are key to bone maturation, with their influence being greater than on height growth, regulating bone metabolism and accelerating the completion of skeletal growth [49,59,60].
4.3. Limitations
One of the main limitations of this study is that it does not provide a comprehensive view of the evolution of bone maturation throughout the entire childhood and adolescent development, which limits its clinical applicability for making accurate bone age estimations during the early preschool years and late adolescence. However, the study could be useful in other contexts, such as the assessment of bone age in specific populations, such as juvenile offenders or migrants, where monitoring bone maturation may be relevant for determining biological age or assessing the risk of participation in certain activities.
5. Conclusions
In summary, the TW3 method proves to be a reliable tool for estimating BA in the pediatric population, with particular accuracy in preschool and school-aged children. However, its precision varies across sex, with underestimations being more pronounced in females, and across developmental stages, where heterogeneity within age groups, such as 5–12 years, may influence outcomes. These findings underscore the need for further refinement of the method to improve its applicability across diverse clinical and demographic settings, ultimately enhancing its value as a diagnostic tool. Future research should prioritize addressing these variations to ensure greater consistency and broader utility.
Author Contributions
Conceptualization, I.M.M.P and S.E.M.P; methodology, I.M.M.P.; validation, I.M.M.P., S.E.M.P and R.M.S..; formal analysis, I.M.M.P; investigation, I.M.M.P; resources, R.M.S.; data curation, I.M.M.P; writing—original draft preparation, I.M.M.P; writing—review and editing, I.M.M.P; I.M.M.P, S.E.M.P and R.M.S. visualization, I.M.M.P; supervision, A.M.G.H and J.M.V.G.; project administration, I.M.M.P.
Funding
This research received no external funding.
Institutional Review Board Statement
The study was conducted in accordance with the Declaration of Helsinki, and approved by the Institutional Review Board (or Ethics Committee) of Complejo Hospitalario Universitario de Canarias (CHUC) (CHUC_2023_86, 13 July 2023).
Informed Consent Statement
Not applicable.
Data Availability Statement
Data are contained within the article.
Conflicts of Interest
The authors declare no conflicts of interest.
References
- Tanner, J.M. Growth at Adolescence; Blackwell Scientific Publications: Oxford, UK, 1962; pp. 1–350.
- Greulich, W.W.; Pyle, S.I. Radiographic Atlas of Skeletal Development of the Hand and Wrist, 2nd ed.; Stanford University Press: California, CA, USA, 1959; pp. 1–272.
- Ebrí Torné, B. Maduración ósea: Metodología numérica sobre tarso y carpo; [s.n.]: 1988; pp. 1–320.
- Martín Pérez, S.E.; Martín Pérez, I.M.; Vega González, J.M.; Molina Suárez, R.; León Hernández, C.; Rodríguez Hernández, F.; Herrera Pérez, M. Precision and Accuracy of Radiological Bone Age Assessment in Children among Different Ethnic Groups: A Systematic Review. Diagnostics 2023, 13, 3124. [CrossRef]
- Tanner, J.M.; Whitehouse, R.; Healy, M. A New System for Estimating Skeletal Maturity from the Hand and Wrist, with Standards Derived from a Study of 2,600 Healthy British Children. Part II: The Scoring System; Centre International de L’Enfance: Paris, France, 1962; pp. 1–100.
- Tanner, J.M.; Whitehouse, R.H.; Marshall, W.A., et al. Assessment of Skeletal Maturity and Prediction of Adult Height (TW2 Method); Academic Press: New York, NY, USA, 1975; pp. 1–142.
- Tanner, J.M.; Realy, J.; Goldstein, H. Assessment of Skeletal Maturity and Prediction of Adult Height (TW3 Method); Harcourt Publishers: New York, NY, USA, 2001; pp. 1–200.
- Fregel, R.; Ordóñez, A.C.; Serrano, J.G. The Demography of the Canary Islands from a Genetic Perspective. Hum. Mol. Genet. 2021, 30, R64–R71.
- Tejera Gaspar, A. Tenerife y los guanches; Centro de la Cultura Popular Canaria: Tenerife, Spain, 2002; p. 17.
- Afonso, L. Esquema de geografía física de las islas canarias; Ediciones Idea: Tenerife, Spain, 2004; p. 210.
- Martín Ruiz, J.F. La población de Canarias: Análisis sociodemográfico y territorial (El debate actual); Anroart Ediciones: Las Palmas, Spain, 2005; p. 116.
- Burriel de Orueta, E.L. Canarias: Población y agricultura en una sociedad dependientes; Oikos-Tau: Barcelona, Spain, 1982; pp. 46–47.
- Hernandez Hernández, P. Natura y Cultura de las Islas Canarias, 8th ed.; 2003; pp. 56, 63.
- Toledo Trujillo, F.M. Maduración Ósea en una Muestra de Población Urbana de las Islas Canarias. Ph.D. Thesis, Universidad de La Laguna, San Cristóbal de La Laguna, Spain, 1978.
- Toledo, F.; Cruz, M.; Pastor, S.; Paz, G.; Fernández, J.; Machado, M. Estudios radio-antropométrico de una muestra preadulta de la población canaria. In Actualizaciones en Medicina del Hospital Universitario de Canarias; Cabildo de Tenerife: Tenerife, Spain, 1992; pp. 25–35.
- Martín Pérez, I.M.; Martín Pérez, S.E.; Vega González, J.M.; Molina Suárez, R.; García Hernández, A.M.; Rodríguez Hernández, F.; Herrera Pérez, M. The Validation of the Greulich and Pyle Atlas for Radiological Bone Age Assessments in a Pediatric Population from the Canary Islands. Healthcare 2024, 12, 1847. [CrossRef]
- Martín Pérez, S.E.; Martín Pérez, I.M.; Vega González, J.M.; Molina Suárez, R.; León Hernández, C.; Rodríguez Hernández, F.; Herrera Pérez, M. Análisis comparativo de dos métodos radiográficos para determinar la edad ósea en la población pediátrica canaria. In Proceedings of the III Congreso Internacional de Jóvenes por la Investigación, San Cristóbal de La Laguna, Spain, 14–16 November 2019; Universidad de La Laguna: Tenerife, Spain, pp. 15–20.
- Cohen, J.F.; Korevaar, D.A.; Altman, D.G.; Bruns, D.E.; Gatsonis, C.A.; Hooft, L.; Irwig, L.; Levine, D.; Reitsma, J.B.; de Vet, H.C.; Bossuyt, P.M. STARD 2015 guidelines for reporting diagnostic accuracy studies: Explanation and elaboration. BMJ Open 2016, 6, e012799. [CrossRef]
- Fraga Bermúdez, J.M.; Fernández Lorenzo, J.R. La Pediatría, el Niño y el Pediatra: Una Aproximación General. In Tratado de Pediatría, 1st ed.; Moro Serrano, M., Málaga Guerrero, S., Madero López, L., Eds.; Editorial Médica Panamericana: Madrid, Spain, 2014; Volume 1, pp. 1–18.
- Pinchi, V.; De Luca, F.; Ricciardi, F.; Focardi, M.; Piredda, V.; Mazzeo, E.; Norelli, G.-A. Skeletal age estimation for forensic purposes: A comparison of GP, TW2, and TW3 methods on an Italian sample. Forensic Sci. Int. 2014, 238, 83–90.
- López, P.; Morón, A.; Urdaneta, O. Maduración ósea de niños escolares (7–14 años) de las etnias Wayúu y Criolla del Municipio Maracaibo, Estado Zulia. Estudio Comparativo. Cienc. Odontológica 2020, 5, 99–111. Available online:https://produccioncientificaluz.org/index.php/cienciao/article/view/33940 (accessed on 12 November 2024).
- Kowo-Nyakoko, F.; Gregson, C.L.; Madanhire, T.; Stranix-Chibanda, L.; Rukuni, R.; Offiah, A.C.; Micklesfield, L.K.; Cooper, C.; Ferrand, R.A.; Rehman, A.M.; et al. Evaluation of two methods of bone age assessment in peripubertal children in Zimbabwe. Bone 2023, 170, 116725.
- Kim, J.R.; Lee, Y.S.; Yu, J. Assessment of bone age in prepubertal healthy Korean children: Comparison among the Korean Standard Bone Age Chart, Greulich-Pyle Method, and Tanner-Whitehouse Method. Korean J. Radiol. 2015, 16, 201–205.
- Shin, N.Y.; Lee, B.D.; Kang, J.H.; Kim, H.R.; Oh, D.H.; Lee, B.I.; Kim, S.H.; Lee, M.S.; Heo, M.S. Evaluation of the Clinical Efficacy of a TW3-Based Fully Automated Bone Age Assessment System Using Deep Neural Networks. Imaging Sci. Dent. 2020, 50, 237–243. [CrossRef]
- Benjavongkulchai, S.; Pittayapat, P. Age estimation methods using hand and wrist radiographs in a group of contemporary Thais. Forensic Sci. Int. 2018, 287, 218.e1–218.e8.
- Geng, J.; Zhang, W.; Ge, Y.; Wang, L.; Huang, P.; Liu, Y.; Shi, J.; Zhou, F.; Ma, K.; Blake, G.M.; Xu, G.; Yan, D.; Cheng, X. Inter-Rater Variability and Repeatability in the Assessment of the Tanner-Whitehouse Classification of Hand Radiographs for the Estimation of Bone Age. Skeletal Radiol. 2024, 53, 2635–2642. [CrossRef]
- Alshamrani, K.; Offiah, A.C. Applicability of Two Commonly Used Bone Age Assessment Methods to Twenty-First Century UK Children. Eur. Radiol. 2019, 30, 504–513.
- Yuh, Y.S.; Chou, T.Y.; Tung, T.H. Bone Age Assessment: Large-Scale Comparison of Greulich-Pyle Method and Tanner-Whitehouse 3 Method for Taiwanese Children. J. Chin. Med. Assoc. 2023, 86, 246–253. [CrossRef]
- Toledo, F.; Rodríguez, I. Atlas radiológico de referencia de la edad ósea en la población canaria; Fundación Canaria Salud y Sanidad, Cabildo de Tenerife: Tenerife, Spain, 2009; p. 22.
- Ferrante, L.; Cameriere, R. Statistical methods to assess the reliability of measurements in the procedures for forensic age estimation. Int. J. Legal Med. 2009, 123, 277–283. [CrossRef]
- Ahmed, M.L.; Warner, J.T. TW2 and TW3 Bone Ages: Time to Change? Arch. Dis. Child. 2007, 92, 371–372. [CrossRef]
- Ebrí-Torné, B. Comparative Study Between Bone Ages: Carpal, Metacarpophalangic, Carpometacarpophalangic Ebrí, Greulich and Pyle, and Tanner Whitehouse 2. Med. Res. Arch. 2021, 9. [CrossRef]
- Wells, J.C. Sexual Dimorphism of Body Composition. Best Pract. Res. Clin. Endocrinol. Metab. 2007, 21(3), 415–430. [CrossRef]
- Roberts, D.F. Race, Genetics and Growth. J. Biosoc. Sci. 1969, 1(S1), 43–67.
- Díaz Gómez, N.M. Crecimiento y Desarrollo Físico del Niño; Tenerife, 1992; p. 18.
- Lejarraga, H. Growth in Infancy and Childhood: A Pediatric Approach. In Human Growth and Development; 2nd ed.; 2002.
- Thomis, M.A.; Towne, B. Genetic Determinants of Prepubertal and Pubertal Growth and Development. Food Nutr. Bull. 2006, 27(4 Suppl Growth Standard), S257–S278. [CrossRef]
- Bianchi, M.L.; Sawyer, A.J.; Bachrach, L.K. Rationale for Bone Health Assessment in Childhood and Adolescence. In Bone Health Assessment in Pediatrics; Fung, E., Bachrach, L., Sawyer, A., Eds.; Springer: Cham, Switzerland, 2016; pp. 1–21.
- López, J.M. Bone Development and Growth. Int. J. Mol. Sci. 2024, 25, 6767. [CrossRef]
- Perrone, S.; Caporilli, C.; Grassi, F.; Ferrocino, M.; Biagi, E.; Dell’Orto, V.; Beretta, V.; Petrolini, C.; Gambini, L.; Street, M.E.; et al. Prenatal and Neonatal Bone Health: Updated Review on Early Identification of Newborns at High Risk for Osteopenia. Nutrients 2023, 15, 3515. [CrossRef]
- Boyanov, M.A. Bone Development in Children and Adolescents. In Puberty; Kumanov, P., Agarwal, A., Eds.; Springer: Cham, Switzerland, 2016; pp. 105–123. [CrossRef]
- Johnson, L.; Llewellyn, C.H.; van Jaarsveld, C.H.; Cole, T.J.; Wardle, J. Genetic and Environmental Influences on Infant Growth: Prospective Analysis of the Gemini Twin Birth Cohort. PLoS One 2011, 6(5), e19918. [CrossRef]
- Iuliano-Burns, S.; Hopper, J.; Seeman, E. The Age of Puberty Determines Sexual Dimorphism in Bone Structure: A Male/Female Co-Twin Control Study. J. Clin. Endocrinol. Metab. 2009, 94(5), 1638–1643. [CrossRef]
- Plotkin, L.I.; Bruzzaniti, A.; Pianeta, R. Sexual Dimorphism in the Musculoskeletal System: Sex Hormones and Beyond. J. Endocr. Soc. 2024, 8(10), bvae153. [CrossRef]
- Patel, B.; Reed, M.; Patel, S. Gender-Specific Pattern Differences of the Ossification Centers in the Pediatric Elbow. Pediatr. Radiol. 2009, 39, 226–231. [CrossRef]
- Bakos, B.; Takacs, I.; Stern, P.H.; et al. Skeletal Effects of Thyroid Hormones. Clin. Rev. Bone Miner. Metab. 2018, 16, 57–66. [CrossRef]
- Bassett, J.H.D.; Williams, G.R. Role of Thyroid Hormones in Skeletal Development and Bone Maintenance. Endocr. Rev. 2016, 37(2), 135–187. [CrossRef]
- Zhu, S.; Pang, Y.; Xu, J.; Chen, X.; Zhang, C.; Wu, B.; Gao, J. Endocrine Regulation on Bone by Thyroid. Front. Endocrinol. (Lausanne) 2022, 13, 873820. [CrossRef]
- Leung, A.M.; Brent, G.A. The Influence of Thyroid Hormone on Growth Hormone Secretion and Action. In Growth Hormone Deficiency; Cohen, L., Ed.; Springer: Cham, Switzerland, 2016; pp. 221–237. [CrossRef]
- Petrie, K.A.; Burbank, K.; Sizer, P.S.; James, C.R.; Zumwalt, M. Considerations of Sex Differences in Musculoskeletal Anatomy Between Males and Females. In The Active Female; Robert-McComb, J.J., Zumwalt, M., Fernandez-del-Valle, M., Eds.; Springer: Cham, Switzerland, 2023; pp. 45–61. [CrossRef]
- Satoh, M.; Hasegawa, Y. Factors Affecting Prepubertal and Pubertal Bone Age Progression. Front. Endocrinol. (Lausanne) 2022, 13, 967711. [CrossRef]
- Nieves, J.W. Sex-Differences in Skeletal Growth and Aging. Curr. Osteoporos. Rep. 2017, 15, 70–75. [CrossRef]
- Papalia, D.E.; Martorell, G. Desarrollo Humano; 13th ed.; McGraw Hill: Ciudad de México, 2017.
- Gavela-Pérez, T.; Garcés, C.; Navarro-Sánchez, P.; López Villanueva, L.; Soriano-Guillén, L. Earlier Menarcheal Age in Spanish Girls Is Related with an Increase in Body Mass Index Between Pre-Pubertal School Age and Adolescence. Pediatr. Obes. 2015, 10, 410–415. [CrossRef]
- De Bont, J.; Díaz, Y.; Casas, M.; García-Gil, M.; Vrijheid, M.; Duarte-Salles, T. Time Trends and Sociodemographic Factors Associated with Overweight and Obesity in Children and Adolescents in Spain. JAMA Netw. Open 2020, 3. [CrossRef]
- Rogol, A.D. Leptin and Puberty. J. Clin. Endocrinol. Metab. 1998, 83(4), 1089–1090. [CrossRef]
- Calcaterra, V.; Verduci, E.; Magenes, V.C.; Pascuzzi, M.C.; Rossi, V.; Sangiorgio, A.; Bosetti, A.; Zuccotti, G.; Mameli, C. The Role of Pediatric Nutrition as a Modifiable Risk Factor for Precocious Puberty. Life 2021, 11, 1353. [CrossRef]
- Du, Y.; Yan, W.; Bigambo, F.M.; et al. Association Between Dietary Behavior and Puberty in Girls. BMC Pediatr. 2024, 24, 349. [CrossRef]
- Noirrit-Esclassan, E.; Valera, M.-C.; Tremollieres, F.; Arnal, J.-F.; Lenfant, F.; Fontaine, C.; Vinel, A. Critical Role of Estrogens on Bone Homeostasis in Both Male and Female: From Physiology to Medical Implications. Int. J. Mol. Sci. 2021, 22, 1568. [CrossRef]
- Khosla, S.; Monroe, D.G. Regulation of Bone Metabolism by Sex Steroids. Cold Spring Harb. Perspect. Med. 2018, 8(1), a031211. [CrossRef]
Figure 1.
Bland–Altman plots illustrating BA assessments using the Tanner-Whitehouse 3 (TW3). The plots compare the assessments of Rater 1 with Rater 2 for both females (a) and males (b), Rater 1 with Rater 3 for females (c) and males (d), and Rater 2 with Rater 3 for females (e) and males (f). The dashed lines represent the mean differences, while the shaded areas in orange and green show the limits of agreement (±1.96 standard deviations). The purple lines represent the confidence intervals for the limits of agreement.
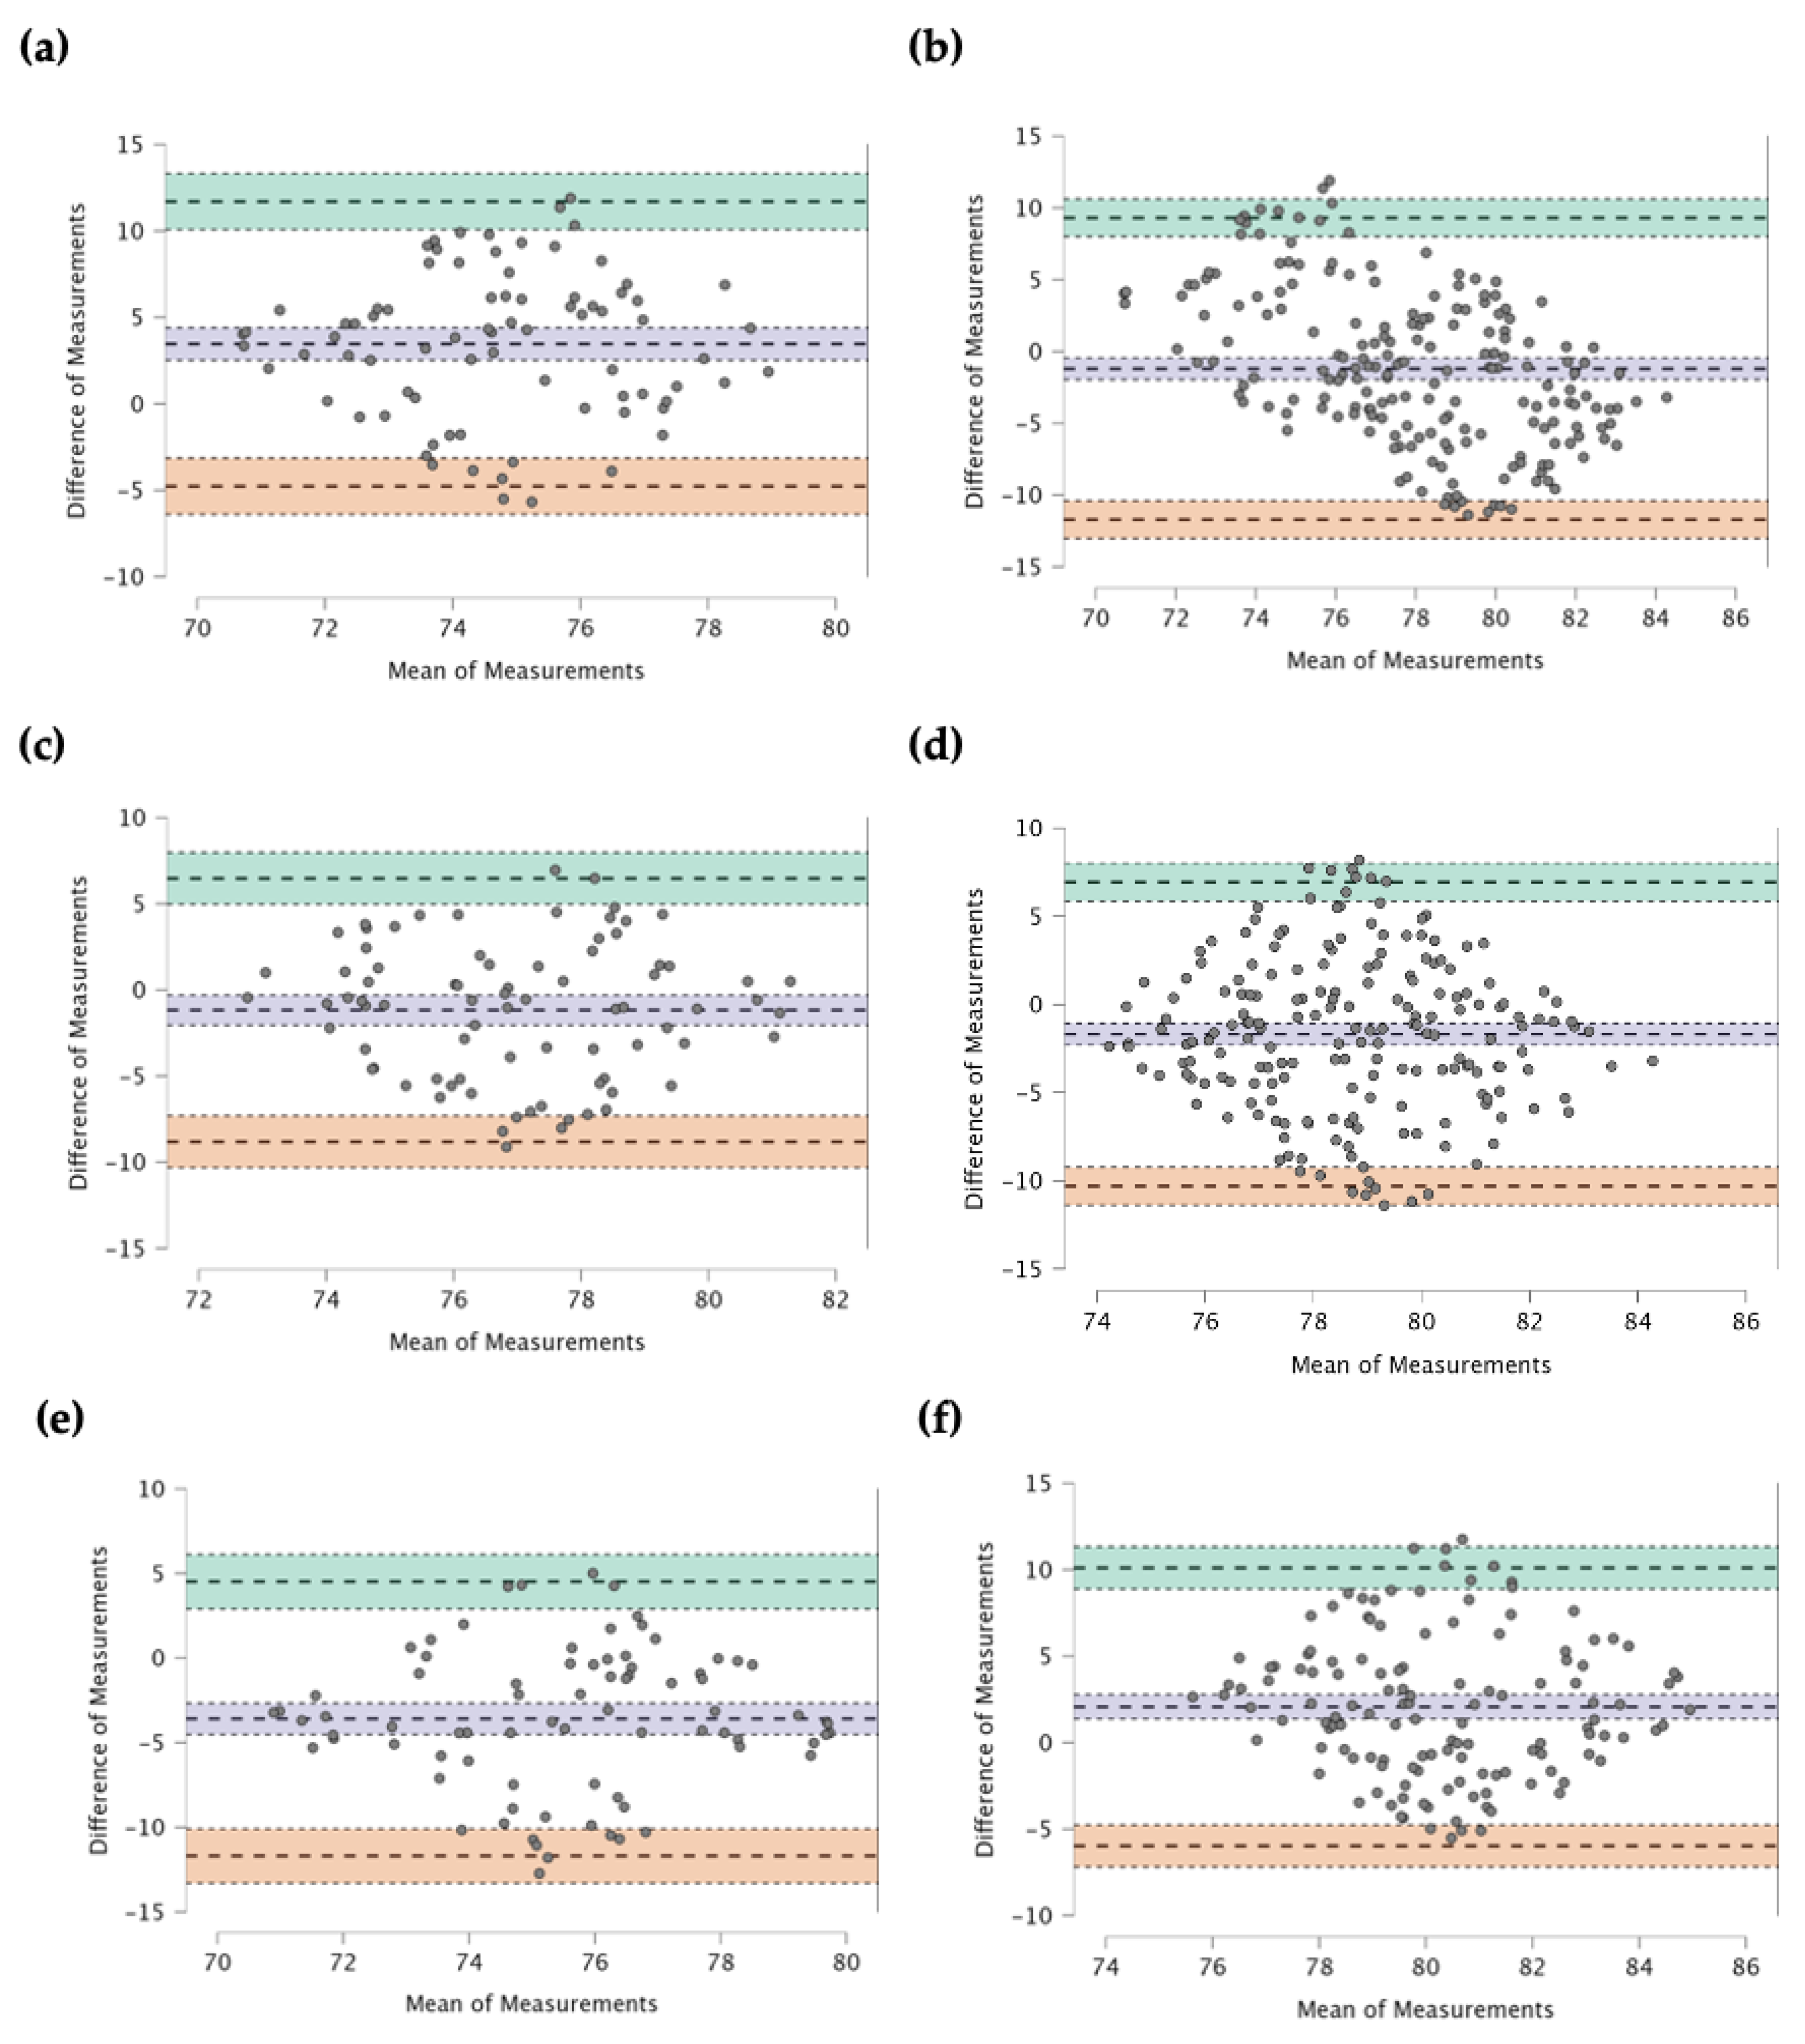
Figure 2.
Accuracy of BA determination using TW3 across different developmental stages. Raincloud plots display BA accuracy in (a) preschool (1 to 5 years), (b) school-age (>5 to 12 years), and (c) teenager (>12 to 18 years) groups. Method shows significant BA underestimation and variability in preschool and school-age groups, while accuracy improves in the teenager group with no significant overestimation between CA and BA.
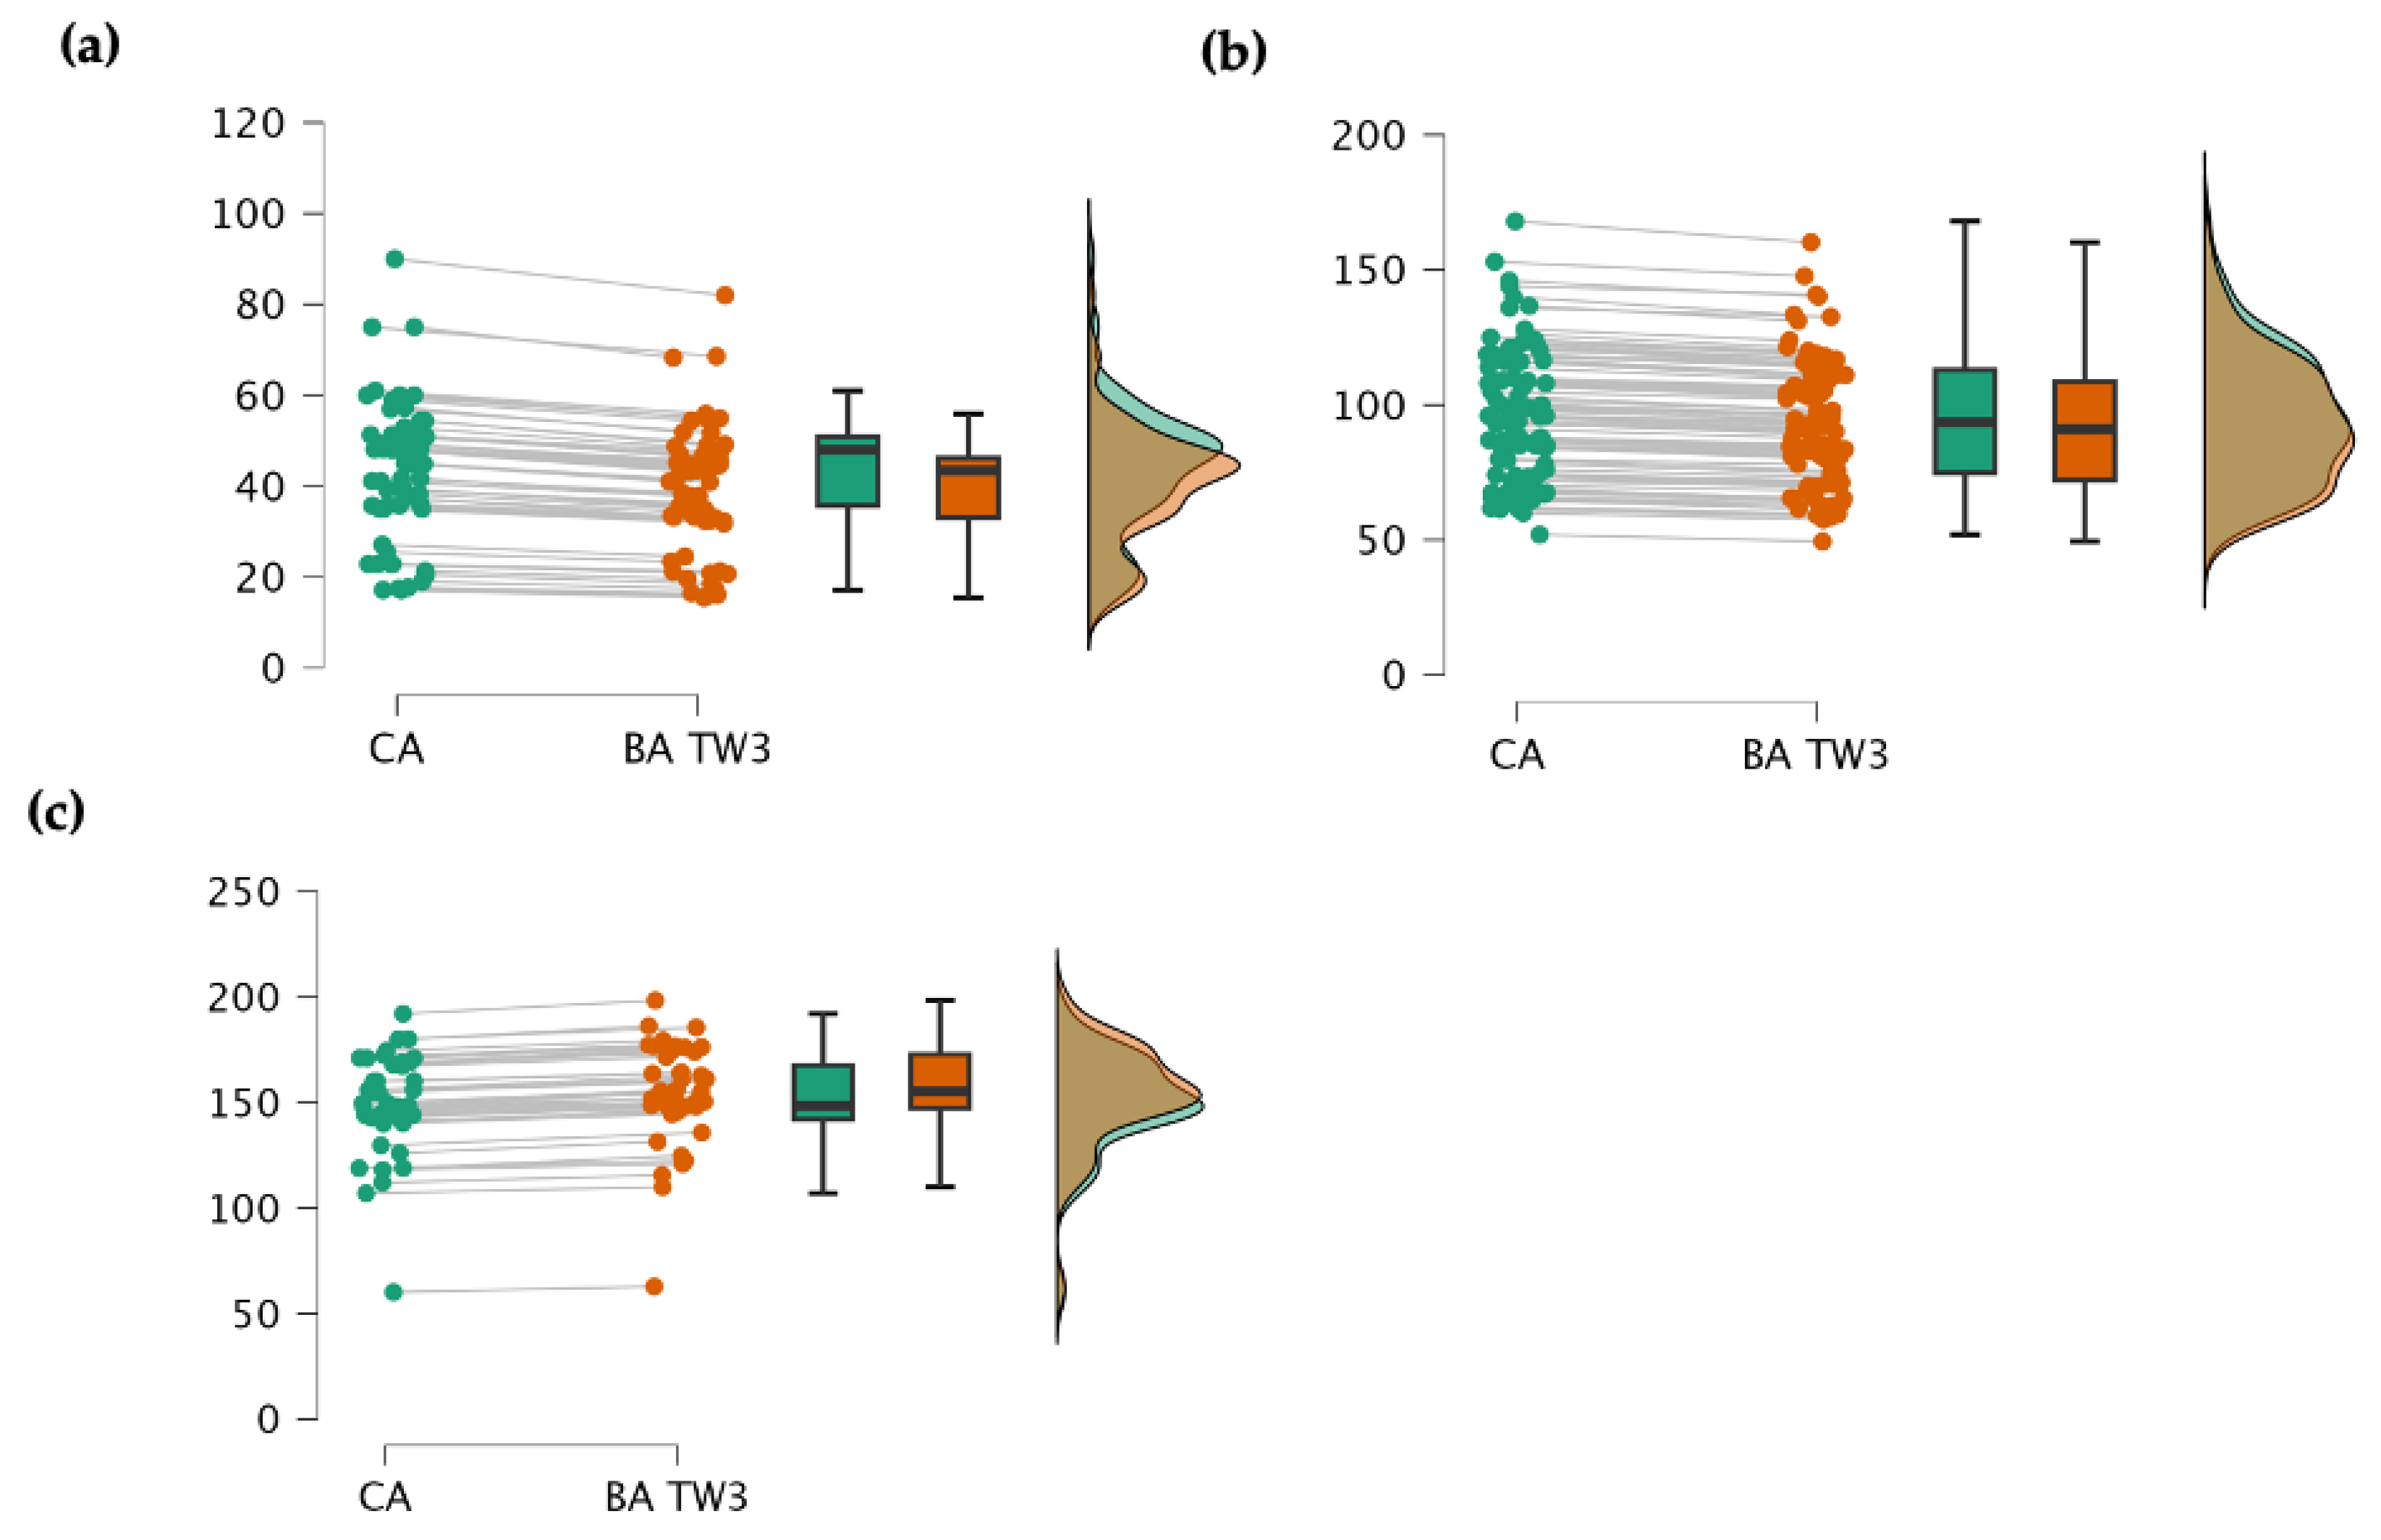

Table 1.
Characteristics of sample.
| Stage | Gender | N | Mean | SD | Min | Max | p-Value | |
|---|---|---|---|---|---|---|---|---|
| Preschool | Female | 24 | 39.33 | 15.18 | 20.00 | 67.00 | 0.235 | |
| Male | 45 | 46.49 | 13.33 | 18.00 | 69.00 | 0.105 | ||
| Age (mos.) | Scholar | Female | 40 | 92.00 | 26.08 | 85.00 | 118.00 | 0.310 |
| Male | 62 | 100.16 | 20.33 | 75.00 | 109.00 | 0.089 | ||
| Teenager | Female | 16 | 144.17 | 23.81 | 102.00 | 168.00 | 0.150 | |
| Male | 27 | 151.53 | 20.17 | 107.00 | 192.00 | 0.080 | ||
| Preschool | Female | 24 | 14.52 | 2.05 | 9.80 | 18.60 | 0.215 | |
| Male | 45 | 13.09 | 2.17 | 7.40 | 18.00 | 0.175 | ||
| Weight (kg) | Scholar | Female | 40 | 29.58 | 7.14 | 17.60 | 40.00 | 0.200 |
| Male | 62 | 23.67 | 4.85 | 14.20 | 44.00 | 0.115 | ||
| Teenager | Female | 16 | 33.84 | 4.62 | 22.00 | 39.50 | 0.250 | |
| Male | 27 | 34.21 | 3.19 | 23.80 | 45.70 | 0.140 | ||
| Preschool | Female | 24 | 0.91 | 0.07 | 0.77 | 1.05 | 0.289 | |
| Male | 45 | 0.94 | 0.05 | 0.80 | 1.10 | 0.175 | ||
| Height (m) | Scholar | Female | 40 | 1.14 | 0.07 | 0.99 | 1.30 | 0.200 |
| Male | 62 | 1.16 | 0.05 | 0.94 | 1.40 | 0.115 | ||
| Teenager | Female | 16 | 1.33 | 0.04 | 1.21 | 1.37 | 0.250 | |
| Male | 27 | 1.33 | 0.03 | 1.16 | 1.45 | 0.140 | ||
| Preschool | Female | 24 | 17.53 | 2.47 | 8.32 | 19.49 | 0.180 | |
| Male | 45 | 14.81 | 2.45 | 18.81 | 18.87 | 0.120 | ||
| BMI (kg/m2) | Scholar | Female | 40 | 22.76 | 5.49 | 13.45 | 20.29 | 0.175 |
| Male | 62 | 17.59 | 3.60 | 12.57 | 20.92 | 0.150 | ||
| Teenager | Female | 16 | 19.13 | 2.66 | 15.02 | 21.73 | 0.240 | |
| Male | 27 | 19.33 | 1.80 | 14.61 | 20.99 | 0.130 |
Abbreviation: BMI = Body Mass Index, mos. = months, Statistical significance: (*) p < 0.05, (**) p < 0.01, (***) p < 0.001. A p-value lower than these thresholds indicates a statistically significant deviation from normality.
Table 2.
Intra-rater agreement across time points and gender. The table presents mean BA values, intra-class correlation coefficients (ICC), and 95% confidence intervals (CI) for the lower and upper bounds for each rater (Rater 1, Rater 2, and Rater 3) during two measurement periods (T1 and T2) for female and male participants.
| Group | Time of Measurement | Gender | Mean | ICC | 95% CI Lower | 95% CI Upper |
|---|---|---|---|---|---|---|
| Rater 1 | T1 | Female | 76.82 | |||
| Male | 77.94 | |||||
| T2 | Female | 74.89 | 0.996 | 0.991 | 0.998 | |
| Male | 75.67 | 0.994 | 0.989 | 0.997 | ||
| Rater 2 | T1 | Female | 73.50 | |||
| Male | 81.32 | |||||
| T2 | Female | 71.12 | 0.988 | 0.976 | 0.994 | |
| Male | 79.58 | 0.993 | 0.980 | 0.997 | ||
| Rater 3 | T1 | Female | 77.45 | |||
| Male | 79.02 | |||||
| T2 | Female | 79.34 | 0.845 | 0.968 | 0.964 | |
| Male | 80.21 | 0.935 | 0.986 | 0.989 |
Table 3.
Inter-rater agreement of bone age assessment using the TW3 method by gender, showing mean bone age values, Intraclass Correlation Coefficient (ICC), and 95% Confidence Intervals (CI) for agreement between rater pairs (Radiologist Specialist vs. General Practitioner, Radiologist Specialist vs. Medical Student, and General Practitioner vs. Medical Student) for female and male participants.
| Groups | Gender | Mean | ICC | 95% CI Lower | 95% CI Upper |
|---|---|---|---|---|---|
| Rater 1–Rater 2 | Female | 76.82 | |||
| 73.50 | 0.976 | 0.950 | 0.987 | ||
| Male | 77.94 | ||||
| 81.32 | 0.968 | 0.940 | 0.982 | ||
| Rater 1–Rater 3 | Female | 76.82 | |||
| 77.45 | 0.812 | 0.702 | 0.896 | ||
| Male | 77.94 | ||||
| 79.02 | 0.857 | 0.770 | 0.921 | ||
| Rater 2–Rater 3 | Female | 73.50 | |||
| 77.45 | 0.880 | 0.820 | 0.922 | ||
| Male | 81.732 | ||||
| 79.02 | 0.912 | 0.860 | 0.946 |
Table 4.
Accuracy of BA assessments using TW3. Abbreviation: BA = bone age, CA = chronological age, MD = mean difference CA–BA, SD = standard deviation; W = Paired Samples Test or Wilcoxon signed-rank statistic. Statistical significance: (*) p < 0.05, (**) p < 0.01 and (***) p < 0.001.
Table 4.
Accuracy of BA assessments using TW3. Abbreviation: BA = bone age, CA = chronological age, MD = mean difference CA–BA, SD = standard deviation; W = Paired Samples Test or Wilcoxon signed-rank statistic. Statistical significance: (*) p < 0.05, (**) p < 0.01 and (***) p < 0.001.
| Stage | Mean | SD | MD | Lower CI 95% |
Superior CI 95% |
p | |
|---|---|---|---|---|---|---|---|
| Preschool (n = 69) | CA | 43.485 | 14.476 | ||||
| BA | 39.772 | 15.409 | 3.712 | 1.290 | 6.130 | 0.199 | |
| Female | CA | 39.331 | 15.182 | ||||
| BA | 35.131 | 16.896 | 4.200 | 0.780 | 7.620 | 0.164 | |
| Male | CA | 46.496 | 13.333 | ||||
| BA | 46.390 | 24.881 | 0.106 | -4.830 | 5.05 | 0.935 | |
| Scholar (n = 102) | CA | 95.684 | 23.906 | ||||
| BA | 92.161 | 35.572 | 3.522 | 1.050 | 5.990 | 0.888 | |
| Female | CA | 92.001 | 26.086 | ||||
| BA | 87.891 | 37.203 | 4.110 | -8.250 | 16.47 | 0.945 | |
| Male | CA | 100.168 | 20.338 | ||||
| BA | 96.190 | 33.876 | 3.978 | -12.55 | 4.59 | 0.926 | |
| Teenager (n = 43) | CA | 148.883 | 23.665 | ||||
| BA | 149.242 | 29.943 | −0.360 | -0.770 | −0.954 | 0.299 | |
| Female | CA | 144.170 | 23.810 | ||||
| BA | 144.549 | 24.231 | −0.380 | -4.840 | 5.500 | 0.256 | |
| Male | CA | 151.53 | 20.176 | ||||
| BA | 151.86 | 18.179 | −0.330 | -1.03 | 1.78 | 0.222 |
Disclaimer/Publisher’s Note: The statements, opinions and data contained in all publications are solely those of the individual author(s) and contributor(s) and not of MDPI and/or the editor(s). MDPI and/or the editor(s) disclaim responsibility for any injury to people or property resulting from any ideas, methods, instructions or products referred to in the content. |
© 2024 by the authors. Licensee MDPI, Basel, Switzerland. This article is an open access article distributed under the terms and conditions of the Creative Commons Attribution (CC BY) license (http://creativecommons.org/licenses/by/4.0/).
Copyright: This open access article is published under a Creative Commons CC BY 4.0 license, which permit the free download, distribution, and reuse, provided that the author and preprint are cited in any reuse.


