
Submitted:
20 December 2024
Posted:
23 December 2024
You are already at the latest version
Abstract
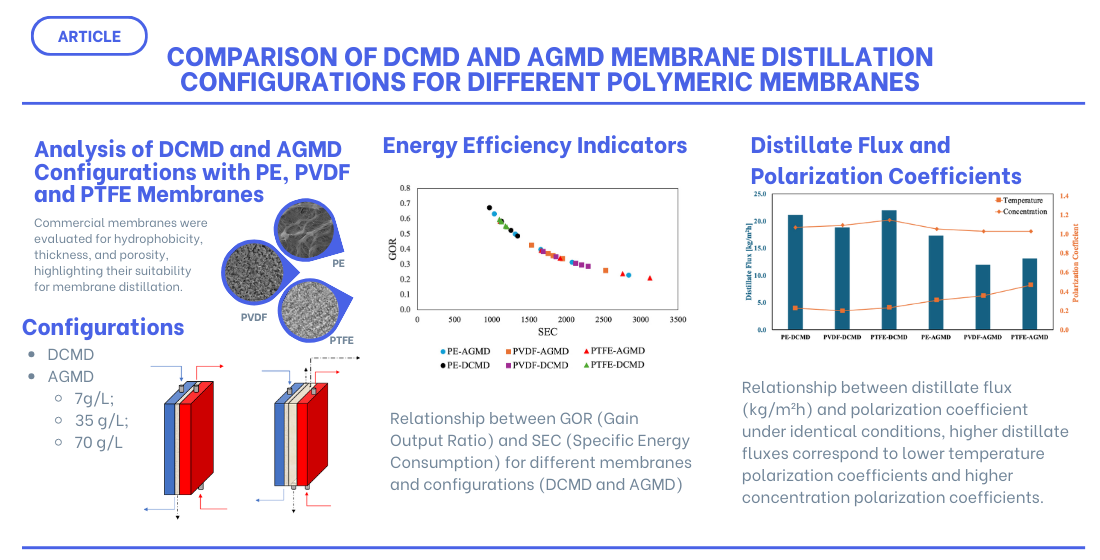
Membrane distillation (MD) has emerged as a promising thermal separation technology aimed mainly at water desalination, compatible with low-grade heat sources such as waste heat from thermal engines, solar collectors, and high concentration photovoltaic panels. This study presents a comprehensive theoretical-experimental evaluation of direct contact membrane distillation (DCMD) and air gap membrane distillation (AGMD), focusing on the influence of different membrane materials (PVDF, PTFE, and PE) and operational parameters on performance. Ex-periments were conducted in a flat-sheet MD module under varying NaCl concentrations (7 to 70 g/L), feed temperatures (65–85°C), and flow rates (0.2–0.8 L/min). The DCMD configuration achieved significantly higher permeate flux, with PTFE membranes achieving up to 33.59 kg/m²h at 85°C, attributed to the high hydrophobicity (contact angle: 143.4°) and porosity (85%). Con-versely, AGMD exhibited lower distillate fluxes (maximum 24.77 kg/m²h with PE) but outper-formed DCMD in specific energy consumption (SEC), achieving values as low as 1390.14 kWh/m³ with PTFE at 85°C, in a setup without any heat recovery from either the feed or distillate streams. The thermal efficiency of AGMD reached 0.54, 17% higher than DCMD with the same membrane. Salinity impacted performance differently: PTFE exhibited consistent flux across NaCl concen-trations, while PE showed a reduction of 31.3% at 70 g/L. The proposed heat and mass transfer reduced model showed good agreement with experimental data, with deviations within ±15%, effectively capturing the influence of operational parameters. These findings underscore the trade-offs between DCMD's higher fluxes and AGMD's higher energy efficiencies, offering quantitative insights to guide the design and optimization of MD systems for desalination and wastewater treatment.
Keywords:
Water desalination
; Air-gap membrane distillation
; Direct contact membrane distillation
; Heat and mass transfer
; Hydrophobic porous membrane
1. Introduction
Membrane distillation (MD) is an emerging thermal separation process that utilizes a hydrophobic porous membrane to selectively permit the transport of water vapor from a heated feed solution to a cooler permeate side. The driving force in MD is the vapor pressure gradient across the hydrophobic membrane surfaces, influenced by temperature differences and other operational and structural parameters [1,2,3,4,5]. Recent advancements in superhydrophobic membranes have demonstrated potential for enhancing mass flux by mitigating temperature polarization effects, which otherwise reduce the vapor pressure gradient. Such improvements have been explored through the development of novel membranes and modifications to existing commercial ones [6,7,8,9].
Compared to conventional desalination technologies, such as reverse osmosis (RO), MD offers several notable advantages. These include high rejection rates for non-volatile solutes, operation under low pressures, and compatibility with low-grade waste heat or renewable energy sources. The energy efficiency of MD distinguishes it from pressure-driven processes like nanofiltration (NF) and RO, positioning it as a viable alternative for diverse applications, including the removal of organic contaminants and heavy metals from wastewater [10,11]. Additionally, MD achieves near-total rejection of non-volatile solutes, making it particularly suitable for treating high-salinity brines, such as RO concentrate streams or integrating with multiple-effect distillation (MED) systems [12,13,14,15,16,17].
To evaluate and compare the performance of three commercial hydrophobic membranes for MD, an experimental setup was developed for the characterization of a flat-plate direct contact membrane distillation (DCMD) module. This setup allowed controlled variation of operational parameters, including feed and permeate temperatures and flow rates. DCMD is characterized by its simplicity, involving direct contact between the both the hot feed stream and the condensing liquid with the membrane, facilitating vapor transport and condensation [18,19]. However, alternative configurations, such as air-gap membrane distillation (AGMD), also hold significant promise. The AGMD configuration incorporates an air gap between the membrane and the condensing surface, acting as a thermal barrier that reduces heat losses through the membrane and enhances thermal efficiency [18,20]. While DCMD are known for offering ease of operation and higher vapor fluxes, AGMD provides superior thermal efficiency, requiring a trade-off based on specific process requirements. Thus, a second experimental setup was assembled, again with full control of the operational variables, to allow for critical comparisons of the two configurations with different commercially available polymeric membranes.
Therefore, this study provides a detailed comparative analysis of DCMD and AGMD configurations, employing three different membranes made of polyvinylidene fluoride (PVDF), polytetrafluoroethylene (PTFE), and polyethylene (PE). Experiments over a wide range of NaCl concentrations, from 7 to 70 g/L, in conjunction with theoretical modelling, were utilized to assess the effects of key operational parameters - feed concentration, feed temperature, and flow rates - on permeate flux and thermal efficiency. The present analysis aims to, while verifying the relative merits of the DCMD and AGMD configurations, inspect whether such differences are more or less marked for the three different membrane materials with their specific structural characteristics.
2. Materials and Methods
2.1. Membranes and Module Configuration
Three different commercial polymeric membranes were used in the experiments, namely, PVDF, PTFE, and PE. The membranes were characterized in terms of their structure, wettability, and thermal properties, as can be found in [5,21,22]. The detailed characteristics of each membrane, including thickness, mean pore size, and porosity, are provided in Table 1.
The membranes were tested in both the DCMD and AGMD configurations using flat-sheet modules designed and built for these setups. The DCMD module had an effective membrane area of 0.005062 m2, while the AGMD module had an effective membrane area of 0.006532 m2.
To design the geometry of a DCMD module with rectangular channels that ensure flow uniformity within the microchannels, CFD (computational fluid dynamics) simulations were conducted, with the platform OpenFOAM (2021). These simulations varied the shape and characteristics of the inlet and outlet plenums on both the feed and distillate sides (Naveira-Cotta et al., 2023). For the analyzed range of volumetric flow rates, the chosen best configuration with eight microchannels per side, is shown in Figure 1. Velocity profiles obtained from the OpenFOAM simulations for various volumetric flow rates (0.2, 0.8, and 1.2 L/min) are shown in Figures 2. Figure 2a, at a central plane of the channels’ length, illustrates the uniformity of the velocity profiles at the various channels. Figure 2b provides velocity profiles at three different cross-sections (near the inlet, center, and outlet), reconfirming the fairly uniform distributions at different longitudinal positions.
The DCMD module’s flow uniformity for all analyzed flow rates supports the simplification assumption in the theoretical model towards formulating the heat and mass transfer process for a single representative microchannel. The AGMD module was designed as shown in Figure 3 and incorporates a 2 mm air gap between the membrane surface and the condensation plate.
2.2. Experimental Setup
A desalination bench was designed and built at LabMEMS/UFRJ for the evaluation of the distillation unit performance and characterization of commercial and modified superhydrophobic membranes, initially with a module in the DCMD configuration. The proposed experimental system (Figure 4) consists of two hydraulic circuits: a feed circuit described by the orange lines, where the saline water flows, and a permeate circuit described by the blue lines, where the distillate water flows.
In the DCMD configuration, the membrane is the only existing barrier that separates the feed and the permeate streams. The heating of the feed stream and the cooling of the permeate stream are carried out with the aid of two compact heat exchangers connected to two ultra-thermostatic baths to control the inlet temperatures of both streams. The specification of operating parameters for this experimental setup are provided in Table 2.
The experimental setup includes temperature sensors (K-type thermocouples – chromel/alumel) at the inlet and outlet ports of the distillation module, four pressure sensors (Rucker, model RTP-420 0-0.6 bar), two microturbine volumetric flow rate meters (Badger BV1000-TRN-025-B), two probes for measuring feed and permeate electrolytic conductivity (Digimed DM32), and two fluid reservoirs, supported by precision scales (Marte AD 5002), where the instantaneous mass of the feed and permeate are measured and acquired to compute the mass flow rates.
The utilization of NaCl concentrations exceeding 35 g/L in membrane distillation experiments is crucial for accurately simulating the conditions found in saline water sources, such as industrial and mining wastewater and reverse osmosis brines. Membrane distillation is a promising desalination technology capable of treating high-salinity waters, including petroleum reservoirs production water, while achieving high solute rejection rates [23,24].
3. Theoretical Model
The modelling and simulation of the heat and mass transfer phenomena that occur in membrane distillation processes are crucial to theoretically evaluate the transport mechanisms and the interaction of parameters that influence the efficiency of the process. This task is essential to reduce costs and time in the experimental analysis for the various combinations of operational parameters, as well as to achieve a proper design and operational optimization. In this sense, in addition to the influence of membrane characteristics, one of the main factors that affects the performance of the membrane distillation process is the temperature polarization phenomenon, evaluated by the temperature polarization coefficient (TPC) as:
Temperature polarization refers to the effect that the thermal boundary layer causes in reducing the temperature difference between the membrane surfaces (- temperature at the feed-membrane interface, and - temperature at the membrane-permeate interface) with respect to the temperature difference between the fluid streams ( - average temperature of the fluid in the feed stream, and - average temperature of the fluid in the permeate stream). The mass transport of the volatile component (vapor) occurs through the pores of the membrane while heat is transferred both by the membrane solid matrix and by the vapor itself [25]. Also, the ratio between the total feed concentration and the concentration at the liquid-vapor interface on the feed side is called concentration polarization coefficient, and can be determined from [26]:
3.1. Heat Transfer
From the feed channel to the permeate channel, the heat transfer process in a DCMD configuration is modelled across the three regions (feed stream, membrane, and permeate stream) as a lumped system, as shown in Figure 5: (i) the convective heat transfer across the thermal layer of the feed stream in contact with the membrane, given by Eq. (2) (ii) the transmembrane heat transport () described by Eq. (3) and (iii) heat transfer by convection () across the thermal boundary layer of the permeate stream in contact with the other side of the membrane [25,27,28,29].
where is the heat transfer rate [W], is the convective heat transfer coefficient [W/m² K], is the area of the membrane normal to the heat flux [m²], is the permeate flux [ kg/m² s], is the latent heat of vaporization [J/kg], is the effective thermal conductivity of the membrane [W/m K] and is the nominal thickness of the membrane [m].
The effective conductivity, , can be estimated from the thermal conductivities of the solid and vapor phases and , and the membrane porosity ε [-]. The parallel-resistance model (thermal conductivity in series) is the most used effective thermal conductivity model, followed by series-resistance (thermal conductivity in parallel) and the Maxwell I model [29,30,31,32]. In all these models, the fluid thermal conductivity in the bulk membrane, , is made equal to the water vapor thermal conductivity, which is considered a temperature-dependent property. For the interface regions, however, the liquid water thermal conductivity is used. Here, the effective conductivity, , is described by the isostrain (parallel) model, Eq. (6), which the literature indicates as adequate for membranes with solid and gas phases approximately parallel to each other [33,34,35,36]
In the steady-state regime, the three Eqs. (3), (4) and (5) can be combined to determine the surface temperatures at the membrane interfaces ( and ), once the heat transfer coefficients are computed, equating the heat transfer rates in each region:
By means of the energy balance of Eq. (7), and rewriting as , the membrane surface temperatures on the feed () and permeate () sides can be obtained as:
The present geometric and operating conditions warrant laminar flow regime on both fluid streams, so the following correlation for Nusselt number, previously employed for the DCMD configuration [33,35], is adopted:
where k is the fluid thermal conductivity [W/m K], is the density [kg/m³], µ is the dynamic viscosity [Pa.s], and is the specific heat [J/kgK], is the feed or permeate mean velocity [m/s], dh is the hydraulic diameter of the channel, Re is the Reynolds number, is the Prandtl number, and is the channel length.
3.2. Mass Transfer
The permeate flux through the membrane () is described by the Dusty-Gas model, based on the Maxwell-Stefan relationships. Neglecting surface diffusion, the Dusty-Gas model is written as [34]:
where and are the molar fluxes of water vapor and air [mol/m² s], and are the partial pressures of water vapor and air inside the pore [Pa], is the Knudsen diffusivity, is the molecular diffusivity of water in the air, is the thermodynamic average temperature inside the pores, and R is the universal gas constant.
Therefore, the permeate flow, , is determined from the permeate molar flow, , from which is the result of Eq. (11) neglecting viscous transport and surface diffusion, zero airflows () inside the pores and considering Dalton’s law [37,38]:
where is the membrane apparent thickness, is the molecular mass of water, is the effective diffusion coefficient, and and are the partial vapor pressures at the membrane interface on the feed and permeate sides, respectively.
Considering that the phenomenon of capillary depression is a consequence of the hydrophobicity of the membrane, [39,40] proposed the two correction factors for the distillate mass flux, namely, and . The curved region formed at the entrance of the membrane pores increases the total area of the liquid-vapor interface according to the hydrophobicity degree (related to the contact angle, θ), which varies for each membrane. This effect is accounted for by the factor . Additionally, due to this increase on the interfacial surface, the distance between the two liquid/vapor interfaces is reduced, thus an apparent membrane thickness () was also introduced in the mass flux relation [41]:
The interface thickness () for the feed/mebrane interface, and for the membrane/distillate interface are evaluated as the lengths of the portion of the pore volume that is occupied by the liquid at the pore channel entrance, which is approximated as the volume of a spherical cap, being a function of the mean pore diameter, dp, and the contact angle, θ [41]:
The vapor partial pressure at the membrane interface, , is a function of the temperature, and it is estimated according to the Antoine equation [34]:
where is the fluid/membrane interface temperature (in Kelvin). For the feed side, the saline concentration (NaCl) must be considered, since the saline concentration will reduce the partial pressure. For non-ideal binary mixtures, the vapor partial pressure is often described as:
where is the water molar fraction, is the water vapor partial pressure given by the Antoine equation, Eq. (14), and is the activity coeficient, related to the feed sodium chloride molar fraction , as:
Finally, the effective diffusion coefficient is expressed as function of the Knudsen diffusivity , and the molecular diffusivity of water in air, , besides the total pressure inside the pores, P:
where ε is the membrane porosity, τ is the membrane tortuosity [42] and is the membrane pore diameter.
Several tortuosity models can be found in the literature [43,44,45,46,47]. A critical review of some tortuosity models was performed in [48]. Recently, to better understand the effects of the tortuosity on the distillate mass flux in DCMD systems, and to better evaluate their adequacy in describing this output parameter, [49], evaluated eleven tortuosity models (eight based on geometrical hypothesis and three based on fractal theory), comparing their predictions with experimental results. The geometry-based tortuosity models are supported by distribution of Euclidean distances between pores of the membrane structure. On the other hand, fractal theory-based porous media assumes that molecules diffuse along a path within a fractal system. Nevertheless, in both Euclidean and fractal models, tortuosity is always estimated from relationships in terms of membrane porosity. In the present work, for the morphology of the porous membrane used, we use the expression proposed by Iversen et al. (1997a), Jonsson (1980a) and Mackie et al. (1955):
For AGMD, the distillate mass flux can be calculated by compensating for the resistance of the air space, as follows [53]
where,
where Pc,f is the vapor pressure at the air gap interface of the condensing plate, Rag is the air gap resistance, δa is the air gap width, Pag,log is the log mean pressure in the air gap, and Tag,log is the log mean temperature in the air gap. The total resistance in the AGMD model can then be calculated by:
Then,
where δ, δag, ε, τ and r are the thickness of the membrane, the thickness of the air gap, the porosity of the membrane, the tortuosity of the pores and the average pore size of the membrane, respectively. Pa,log is the logarithmic mean air pressure between the two sides of the membrane, D is the diffusion coefficient of water vapor through the air gap, Pt is the total air and water vapor pressure.
3.3. Implementation of the Computational Model
The heat and mass transfer characteristics of the DCMD system (given by Eqs. (1-22)) are evaluated through a computational program developed and implemented in Matlab-Simulink platform (R2019a), for the theoretical prediction of the distillate mass flux, between other variables. Since there is an interdependency between distillate mass flux and the temperatures at the membrane/fluid interfaces, i.e., , and , it is necessary to employ an iterative procedure for the simultaneous convergence of all dependent variables. The flowchart of the iterative algorithm is depicted in Figure 6. Initially, all morphological membrane parameters must be defined, physical properties, module geometry, and process operating conditions. The thermophysical properties of water (density, specific heat, thermal conductivity and viscosity) are evaluated according to the database of the EES software (Engineering Equation Solver). The physical and chemical properties for the saline solutions were evaluated according to the correlations presented in [54]. After estimating the temperatures at the interfaces of the membrane, and determining the heat and mass transfer parameters, the convergence for the distillate mass flux is verified, in each iterative step, to within a predefined relative error criterion, .
Three performance metrics were used to evaluate the improvement associated with the implementation of an air gap configuration as compared to a direct contact configuration. The parameters are the gain output ratio (GOR), thermal efficiency (TE), and specific energy consumption (SEC). The GOR, defined as the ratio of heat transferred to water vapor against the total heat input, remains equal to or less than 1 in cases when latent heat is not recovered, and is given by:
Another essential parameter for such comparisons is the specific energy consumption (SEC), which assesses the energy efficiency of the process. By measuring the amount of energy consumed to produce a specific amount of distillate, SEC is a valuable indicator for optimizing the relationship between the energy input and the output obtained in membrane distillation. Minimizing SEC not only implies energy savings but also promotes more sustainable and economical practices. This parameter can be calculated as:
Thermal efficiency plays a critical role when membrane distillation is driven by sustainable heat sources such as solar energy. Maximizing thermal efficiency means optimizing the conversion of thermal energy into useful work, contributing not only to process efficiency, but also to the ongoing search for more sustainable and energy-efficient industrial solutions. The thermal efficiency of the membrane distillation process is defined as the fraction of heat transfer due to mass transfer through the membrane pores and total heat transferred through the membrane [55]. The thermal efficiency parameter is ideal for MD systems with little or no condensation energy recovery. The thermal efficiency of the MD process can be expressed by:
The interconnection of these indicators provides a comprehensive approach to understand the overall performance and improve efficiency and productivity in membrane distillation units.
4. Results and Discussion
This section presents the results obtained from both the bench experiments and the mathematical modelling. This study aimed to maximize the system performance and compare the effects on the main parameters for the three different membranes. The operating conditions including temperatures, salinity, and mass flow rates are as given in Table 2.
4.1. Distillate Fluxes in DCMD and AGMD Modules
Figure 7 illustrates the experimental results for distillate mass flux as a function of the different combinations of module configurations (DCMD and AGMD) and types of membranes (PVDF, PTFE and PE) used in the membrane distillation process, as indicated in the legends. It can be observed that the DCMD configuration provided significantly higher distillate fluxes compared to the AGMD configuration, especially for the PE and the PTFE membranes.
In Figure , it can be observed the influence of different NaCl concentrations (7, 35, and 70 g/L) on the performance of the membranes in both configurations (DCMD and AGMD). In the DCMD configuration with the PTFE membrane, Figure 8.c, the distillate flux values remained high and consistent, ranging from 21.87 kg/m²h (for 70 g/L) to 22.15 kg/m²h (for 7 g/L). This behavior indicates the adequacy of the PTFE membrane for high salinity conditions, attributed to its high hydrophobicity and porosity, which favor vapor transfer even under high salinity conditions. In contrast, the PE membrane in the DCMD configuration, Figure 8.a, showed a reduction in distillate flux as the NaCl concentration increased, starting from 23.82 kg/m²h (7 g/L), dropping to 21.07 kg/m²h (35 g/L), then to 20.01 kg/m²h (70 g/L). This behavior reflects a noticeable sensitivity to saline conditions, limiting its performance in environments with high NaCl concentrations.
In the AGMD configuration, the distillate fluxes were considerably lower regardless of the membrane type or salt concentration. For instance, the PVDF membrane exhibited fluxes ranging from 12.52 kg/m²h (for 7 g/L) to 11.32 kg/m² h (for 70 g/L). The lowest distillate flux overall was obtained through the PE membrane with the AGMD module, 10.27 kg/m² h for 70 g/L.
Figure 9 shows the required heat transfer rate for each of the three membranes, with both the DCMD and AGMD modules and the three NaCl concentrations (7, 35 and 70 g/L), now at the fixed feed temperature of 70°C, permeate temperature at 32.5°C, and feed and permeate flow rates of 0.5 L/min. The DCMD configuration consistently requires higher heat transfer rates for all membranes, reconfirming the direct relationship between the higher distillate flux and the higher energy consumption. The PVDF membrane presented the highest thermal energy consumption with the DCMD module, with consistent values of required thermal power over 150 W for all NaCl concentrations. This performance reflects its high efficiency in vapor transfer, as corroborated by the higher distillate flux values in Figure . On the other hand, the PTFE and PE membranes in the DCMD configuration showed a slight reduction in heat consumption as the NaCl concentration increased. For the PTFE membrane, consumption decreased from 155.47 W (7 g/L) to 145.06 W (70 g/L), while for the PE membrane, the decrease was from 124.21 W (7 g/L) to 104.74 W (70 g/L). This moderate reduction indicates a lower sensitivity in maintaining the vapor pressure gradient under high salinity conditions.
In the AGMD configuration, energy consumption was lower, but not in every case. For instance, the PE membrane in AGMD configuration required slightly more thermal energy than the same membrane in DCMD configuration at 70 g/L. The PTFE membrane led to thermal energy consumption ranging from 118.53 W (at 7 g/L) to 99.34 W (70 g/L), reflecting the greater thermal resistance of this configuration. For the PE membrane, however, the case of highest salinity (70 g/L) led to the highest energy requirements in the AGMD configuration, higher than in the DCMD module for the same salinity, as previously pointed out. Although the PVDF membrane demanded higher thermal energy values, such as 152.44 W for 7 g/L, these were still considerably lower than those observed in the DCMD configuration.
Figure 10 shows the comparative performance of the two module configurations in the distillation process, in terms of the ratio of permeate fluxes and the ratio of required heat input in the feed for AGMD and DCMD. These ratios are influenced by both the feed flow rate and the type of membrane used, as shown in Figure 10. For lower flow rates (0.2 L/min), Figure 10a, greater dispersion is observed in the values of both ratios, indicating that the differences in performance between the processes are more striking under these conditions. As the flow rate increases (0.5 L/min and 0.8 L/min), the points become more grouped, indicating greater uniformity in the behavior of the processes. PVDF membranes showed greater variation in the values of the ration analyzed, reflecting greater sensitivity to operating conditions. PTFE membranes, in turn, showed more uniform behavior in all conditions, which can be attributed to their thermal and hydrophobic properties. PE membranes, on the other hand, showed inferior performance in terms of permeate flux, especially for lower flow rates, limiting their applicability in scenarios that demand greater mass transport. The PVDF membrane results lead to larger values of the permeate fluxes ratio, thus closer values of the permeate fluxes between the two modules, with lower values of the heat input ratio, thus less power requirements for the AGMD module with respect to DCMD one. All graphs refer to a NaCl concentration of 70 g/L.
4.2. Concentration and Temperature Polarization
Figure 11 show results for the thermal polarization coefficient (TPC) and concentration polarization coefficient (CPC), for the two membrane module configurations and the three different membranes. Figure 11a shows that the thermal polarization coefficient (TPC) gradually decreases with increasing feed temperature for all membranes analyzed (PE, PVDF, and PTFE). In the DCMD configuration, the TPC values ranged from 0.179 (70 g/L) to 0.192 (7 g/L) for the PE membrane and from 0.142 to 0.220 for the PVDF membrane, while for the PTFE membrane, ranging from 0.106 to 0.229. These results indicate a progressive reduction in the ratio of the temperature difference between the membrane surfaces and the difference between the two fluid streams, as the feed temperature increases and the permeate stream is kept at the same inlet temperature, which reflects increased vapor transport efficiency under higher temperature conditions. In the AGMD configuration, TPC values remained relatively uniform. The PE membrane exhibited variations between 0.274 (70 g/L) and 0.326 (7 g/L), while the PVDF membrane varied between 0.302 and 0.347. The PTFE membrane showed values ranging from 0.334 to 0.386.
Figure 11b shows a non-monotonic behavior for the concentration polarization coefficient (CPC) in the DCMD configuration, with maximum values recorded around 75 °C in the cases shown here. This behavior can be attributed to the increased solute accumulation near the membrane surface within this temperature range, resulting from the higher distillate flux observed in the DCMD configuration. CPC values in the DCMD configuration reached peaks of 1.11 (PE), 1.14 (PVDF), and 1.19 (PTFE), while in the AGMD configuration, the values were lower and more uniform. This reflects a reduced concentration polarization, attributed to the presence of the air gap and the lower permeate flow, which limits the accumulation of solutes near the membrane surface. When comparing the TPC and CPC values between the different types of membranes at the feed temperature of 75 °C, as illustrated in Figure 11c, slight differences are observed. The PTFE membrane presented the highest TPC (0.368, AGMD) and CPC (1.19, DCMD) values, indicating larger temperature polarization (TPC) in AGMD and concentration polarization (CPC) in DCMD, in comparison with the PE (TPC-AGMD: 0.361; CPC - DCMD: 1.11) and PVDF (TPC- AGMD: 0.367; CPC-DCMD: 1.14) membranes. The AGMD configuration exhibited more uniformity in relation to both TPC and CPC, compared to the DCMD configuration.
4.3. Comparison of Energy Efficiency
The Gain Output Ratio (GOR), Specific Energy Consumption (SEC), and Thermal Efficiency (TE) were analyzed in Figs. 12, considering the effects of feed temperature and salinity. The results illustrated in Figure 8 show that the GOR varies moderately with increasing feed temperature in the DCMD process. For example, the PE membrane has slightly decreasing GOR values (0.72–0.62), while the PVDF and PTFE membranes exhibit gradual increase, reaching 0.47 and 0.52, respectively, at 85°C. This behavior reflects the increase in the vapor pressure gradient, which facilitates mass transfer through the membrane, resulting in greater permeate production. Comparing the materials, it is observed that PE outperforms PVDF and PTFE in DCMD. However, in AGMD, lower GOR values are observed, with PE and PVDF membranes increasing to 0.47 and 0.42, respectively, at 85°C. The PTFE membrane achieves the highest GOR in AGMD, reaching 0.48, benefiting from the air barrier that minimizes thermal losses. PE in DCMD demonstrates significant advantages, with GOR up to 60% higher than PTFE in DCMD. In AGMD, the performance is more balanced. Figure 8 confirms that the SEC decreases with increasing feed temperature in most situations. In DCMD, PE achieves the lowest SEC values, starting at 828.48 (65°C) and becoming fairly uniform at higher temperatures. Conversely, PVDF and PTFE membranes show higher initial SEC values, with PVDF reducing from 2252.31 to 1154.81 and PTFE varying between 1980.98 and 1180.67. These data show that AGMD in general consumes less thermal energy compared to DCMD. In addition, the intermediate thermal properties of the PVDF membrane resulted in a balanced performance between the two configurations. Figure 8 illustrates that DCMD presents a higher TE, which improves with increasing feed temperature. The PTFE membrane achieves the highest TE in DCMD, rising from 0.75 to 0.95, followed by PE with values up to 0.81 at 85°C. The PVDF exhibits a moderate increase in TE, reaching 0.76. In AGMD, PTFE also presents superior TE, rising to 0.60 at 85°C, PE to 0.58 at 85°C whereas PVDF demonstrate lower efficiencies (with 0.40 at 85°C). The results for TE demonstrate that AGMD reduces thermal losses, with improvements of up to 107% for PTFE compared to DCMD.
The NaCl rejection coefficient for the three different membranes — PE (polyethylene), PVDF (polyvinylidene fluoride) and PTFE (polytetrafluoroethylene) — under different operating conditions, considering variations in the feed temperature (65 °C to 85 °C) and in the NaCl concentrations, remained above 99.8%, indicating high efficiency of the membranes in retaining the solute, even with thermal and concentration parametric variations.
4.4. Comparison of Experimental Results and the Mathematical Models
Figure 13 compare results of the permeate fluxes obtained experimentally and predicted by the mathematical models previously described for the DCMD and AGMD membrane distillation configurations. Each graph represents a specific combination of configuration (DCMD and AGMD) and membrane type (PE, PVDF and PTFE), and shows the relation between the experimental values (on the x-axis) and the predicted values (on the y-axis) for different NaCl concentrations (7, 35 and 70 g/L) and different flow rates (0.2, 0.5, and 0.8 L/min). The figures include reference lines for 15% relative deviation, which allows to easily assess the accuracy of the mathematical model with respect to the experimental data. It can be seen that, in all graphs, most of the points are concentrated close to the line of equality (y=x), indicating that the mathematical model presents good agreement with the experimental data for both configurations and for all membranes analyzed. The great majority of points lie within the bounds of the ±15% deviation lines, indicating that the model is a reliable tool in predicting MD performance under a variety of operating conditions. Some slight discrepancies can be noted, especially for the PVDF membrane in the DCMD configuration, where some points exceed the 15% deviation bounds.
5. Conclusions
This study comparatively analyzed the DCMD and AGMD configurations in the membrane distillation process, using different membrane materials (PE, PVDF and PTFE) and evaluating their performances under a wide range of operating conditions. The results highlight that the choice of configuration and membrane type significantly influences thermal efficiency, destillate flux, energy consumption and resistance to polarization and salinity phenomena. The DCMD configuration showed superior performance in terms of distillate flux, especially when associated with the PTFE membrane, whose pertinent properties — high porosity, high hydrophobicity, and thermal resistance — favored vapor transfer, resulting in fluxes of up to 33.59 kg/m²h. However, this configuration required more thermal energy, reflected in the high energy consumption values, which reached up to 180 W. On the other hand, the AGMD configuration demonstrated lower distillate productivity, but offered advantages in terms of energy consumption and temperature variability, characteristics that make it suitable for operations that prioritize energy savings and thermal control. The effect of salinity was more evident in the PE membrane, which showed a significant reduction in distillate flux with increasing NaCl concentration, indicating less robustness for applications in highly saline environments. In contrast, the PTFE membrane maintained consistent performance even at NaCl concentrations of up to 70 g/L, confirming its suitability for severe conditions in applications. The PVDF membrane proved to be sensitive to high temperature and salinity conditions, highlighting the need for adjustments in its application to avoid performance limitations. The temperature (TPC) and concentration (CPC) polarization coefficients indicated that the DCMD configuration, although favoring high distillate fluxes, is more susceptible to polarization effects, especially in thick membranes such as the PTFE one. In contrast, AGMD presented greater uniformity in CPC values, standing out as an alternative to mitigate the effects of polarization in prolonged processes or in highly concentrated solutions. The energy efficiency indicators corroborated the observed trends. The GOR was maximized at lower temperatures, especially for the PE membrane in DCMD (up to 0.8 at 65°C), while AGMD presented more balanced values due to the lower heat losses associated with the air gap. The specific energy consumption (SEC) was consistently lower in the AGMD configuration, with emphasis on the PTFE membrane, which reached 1110.93 kWh/m³ at 85°C, confirming its efficiency in high temperature scenarios. Finally, the validation of the mathematical model revealed good agreement with the experimental data, with deviations predominantly within the 15% deviation bounds. This adherence demonstrates the reliability of the model as a predictive tool for process improvement in different configurations and membrane types, although adjustments are recommended for specific cases, such as in the behavior of the PTFE membrane in the DCMD configuration under extreme conditions.
In summary, the results of this study provide a solid basis for the selection of membranes and configurations in membrane distillation applications, considering the specific demands of energy efficiency, salt rejection rate, and permeate fluxes. The superior performance of the PTFE membrane in the DCMD configuration positions it as the most suitable choice among those here considered for applications requiring high distillate fluxes, while the AGMD, with lower energy consumption, presents itself as a viable alternative for scenarios that prioritize thermal efficiency and lower susceptibility to polarization. These findings contribute significantly to the advancement of membrane distillation technology, offering valuable guidelines for its development and implementation in a wide variety of application contexts.
Author Contributions
The individual contributions can be summarized as follows: Conceptualization, all authors; methodology, all authors; software, C.M.; validation, C.M. and A.O.C.G.; formal analysis, all authors; investigation, C.M. and A.O.C.G.; resources, C.P.N.C.; data curation, C.M. and A.O.C.G.; writing—original draft preparation, C.M. and A.O.C.G.; writing—review and editing, C.M. and R.M.C.; visualization, C.M., A.O.C.G., and R.M.C.; supervision, C.P.N.C.; project administration, C.P.N.C.; funding acquisition, C.P.N.C.. All authors have read and agreed to the published version of the manuscript.
Funding
This research was funded by Petrogal in partnership with ANP, Brazil, with additional support from FAPERJ, CAPES, and the Brazilian Navy, whose contributions were essential for the successful development of this work.
Data Availability Statement
The datasets presented in this article are not readily available because they are part of an ongoing study supported by a Petrogal-ANP contract with UFRJ. Requests to access the datasets should be directed to Prof. Carolina P. Naveira-Cotta (carolina@mecanica.coppe.ufrj.br).
Acknowledgments
The authors would like to express their gratitude to Engineer Paulo Roberto S. Costa Júnior for his invaluable assistance in performing the OpenFOAM simulations for the modules design.
Conflicts of Interest
The authors declare no conflicts of interest. The funders had no role in the design of the study; in the collection, analyses, or interpretation of data; in the writing of the manuscript; or in the decision to publish the results.
References
- Baghbanzadeh M, Lan CQ, Rana D, Matsuura T. Membrane Distillation. Nanostructured Polymer Membranes 2016;1:419–55. [CrossRef]
- Alklaibi AM, Lior N. Membrane-distillation desalination: Status and potential. Desalination 2005;171:111–31. [CrossRef]
- Drioli E, Ali A, Macedonio F. Membrane distillation: Recent developments and perspectives. Desalination 2015;356:56–84. [CrossRef]
- Ashoor BB, Mansour S, Giwa A, Dufour V, Hasan SW. Principles and applications of direct contact membrane distillation (DCMD): A comprehensive review. Desalination 2016;398:222–46. [CrossRef]
- Kebria MRS, Rahimpour A, Kebria MRS, Rahimpour A. Membrane Distillation: Basics, Advances, and Applications. Advances in Membrane Technologies 2020. [CrossRef]
- Hou Y, Shah P, Constantoudis V, Gogolides E, Kappl M, Butt HJ. A super liquid-repellent hierarchical porous membrane for enhanced membrane distillation. Nature Communications 2023 14:1 2023;14:1–11. [CrossRef]
- Giraldo-Mejía H, Quintero YM, Mery F, Rodriguez F, Curcio E, Estay H, et al. Plasma-grafting surface modifications to enhance membrane hydrophobicity for brine membrane distillation. Desalination 2023;567:116942. [CrossRef]
- Lobregas MOS, Rangkupan R, Riassetto D, Klaysom C. Advancing Surface-Enhanced Electrospun Nanofiber Membranes: Customizing Properties for Enhanced Performance in Membrane Distillation. Macromol Mater Eng 2024;309:2300461. [CrossRef]
- Yu L, Xie Y, Li L, Zhang M, Yu Y. Membrane hydrophobicity enhanced by non-solvent induced separation strategy for improving membrane distillation performance. Colloids and Surfaces C: Environmental Aspects 2024;2:100032. [CrossRef]
- Alkhudhiri A, Hakami M, Zacharof MP, Homod HA, Alsadun A. Mercury, Arsenic and Lead Removal by Air Gap Membrane Distillation: Experimental Study. Water 2020, Vol 12, Page 1574 2020;12:1574. [CrossRef]
- Shirazi MMA, Dumée LF. Membrane distillation for sustainable wastewater treatment. Journal of Water Process Engineering 2022;47:102670. [CrossRef]
- Elcik H, Fortunato L, Alpatova A, Soukane S, Orfi J, Ali E, et al. Multi-effect distillation brine treatment by membrane distillation: Effect of antiscalant and antifoaming agents on membrane performance and scaling control. Desalination 2020;493:114653. [CrossRef]
- Zhang Z, Lokoare OR, Gusa A V., Vidic RD. Pretreatment of brackish water reverse osmosis (BWRO) concentrate to enhance water recovery in inland desalination plants by direct contact membrane distillation (DCMD). Desalination 2021;508:115050. [CrossRef]
- Yadav A, Labhasetwar PK, Shahi VK. Membrane distillation using low-grade energy for desalination: A review. J Environ Chem Eng 2021;9:105818. [CrossRef]
- Leaper S, Abdel-Karim A, Gorgojo P. The use of carbon nanomaterials in membrane distillation membranes: a review. Frontiers of Chemical Science and Engineering 2021 15:4 2021;15:755–74. [CrossRef]
- Wijekoon KC, Hai FI, Kang J, Price WE, Cath TY, Nghiem LD. Rejection and fate of trace organic compounds (TrOCs) during membrane distillation. J Memb Sci 2014;453:636–42. [CrossRef]
- Salls KA, Won D, Kolodziej EP, Childress AE, Hiibel SR. Evaluation of semi-volatile contaminant transport in a novel, gas-tight direct contact membrane distillation system. Desalination 2018;427:35–41. [CrossRef]
- Eykens L, Reyns T, De Sitter K, Dotremont C, Pinoy L, Van der Bruggen B. How to select a membrane distillation configuration? Process conditions and membrane influence unraveled. Desalination 2016;399:105–15. [CrossRef]
- González D, Amigo J, Suárez F. Membrane distillation: Perspectives for sustainable and improved desalination. Renewable and Sustainable Energy Reviews 2017;80:238–59. [CrossRef]
- Janajreh I, El Kadi K, Hashaikeh R, Ahmed R. Numerical investigation of air gap membrane distillation (AGMD): Seeking optimal performance. Desalination 2017;424:122–30. [CrossRef]
- Park Y, Lee S. Analysis of thermal energy efficiency for hollow fiber membranes in direct contact membrane distillation. Environmental Engineering Research 2019;24:347–53. [CrossRef]
- Woldemariam D, Kullab A, Fortkamp U, Magner J, Royen H, Martin A. Membrane distillation pilot plant trials with pharmaceutical residues and energy demand analysis. Chemical Engineering Journal 2016;306:471–83. [CrossRef]
- Sabzekar M, Pourafshari Chenar M, Maghsoud Z, Mostaghisi O, García-Payo MC, Khayet M. Cyclic olefin polymer as a novel membrane material for membrane distillation applications. J Memb Sci 2021;621:118845. [CrossRef]
- Alklaibi AM, Lior N. Heat and mass transfer resistance analysis of membrane distillation. J Memb Sci 2006;282:362–9. [CrossRef]
- Khayet M, Matsuura T. Membrane Distillation. Membrane Distillation 2011. [CrossRef]
- Ali A, Macedonio F, Drioli E, Aljlil S, Alharbi OA. Experimental and theoretical evaluation of temperature polarization phenomenon in direct contact membrane distillation. Chemical Engineering Research and Design 2013;91:1966–77. [CrossRef]
- Eleiwi F, Ghaffour N, Alsaadi AS, Francis L, Laleg-Kirati TM. Dynamic modeling and experimental validation for direct contact membrane distillation (DCMD) process. Desalination 2016;384:1–11. [CrossRef]
- Qtaishat M, Matsuura T, Kruczek B, Khayet M. Heat and mass transfer analysis in direct contact membrane distillation. Desalination 2008;219:272–92. [CrossRef]
- Phattaranawik J, Jiraratananon R, Fane AG. Heat transport and membrane distillation coefficients in direct contact membrane distillation. J Memb Sci 2003;212:177–93. [CrossRef]
- Hitsov I, Maere T, de Sitter K, Dotremont C, Nopens I. Modelling approaches in membrane distillation: A critical review. Sep Purif Technol 2015;142:48–64. [CrossRef]
- Huang FYC, Reprogle R. Thermal Conductivity of Polyvinylidene Fluoride Membranes for Direct Contact Membrane Distillation. Https://HomeLiebertpubCom/Ees 2019;36:420–30. [CrossRef]
- García-Payo MC, Izquierdo-Gil MA. Thermal resistance technique for measuring the thermal conductivity of thin microporous membranes. J Phys D Appl Phys 2004;37:3008. [CrossRef]
- Andrjesdóttir Ó, Ong CL, Nabavi M, Paredes S, Khalil ASG, Michel B, et al. An experimentally optimized model for heat and mass transfer in direct contact membrane distillation. Int J Heat Mass Transf 2013;66:855–67. [CrossRef]
- Lawson KW, Lloyd DR. Membrane distillation. J Memb Sci 1997;124:1–25. [CrossRef]
- Lisboa KM, Moraes DB, Naveira-Cotta CP, Cotta RM. Analysis of the membrane effects on the energy efficiency of water desalination in a direct contact membrane distillation ( DCMD ) system with heat recovery. Appl Therm Eng 2021;182:116063. [CrossRef]
- Ali A, Macedonio F, Drioli E, Aljlil S, Alharbi OA. Experimental and theoretical evaluation of temperature polarization phenomenon in direct contact membrane distillation. Chemical Engineering Research and Design 2013; 91:1966–77. [CrossRef]
- Lisboa KM, Curcino IV, Cárdenas Gómez AO, Peñaranda Chenche LE, Cotta RM, Naveira-Cotta CP. A Reduced Model for Pilot-Scale Vacuum-Enhanced Air Gap Membrane Distillation (V-AGMD) Modules: Experimental Validation and Paths for Process Improvement. Separation and Purification Technology 2024; 350:1-12. [CrossRef]
- Deshmukh A, Elimelech M. Understanding the impact of membrane properties and transport phenomena on the energetic performance of membrane distillation desalination. J Memb Sci 2017;539:458–74. [CrossRef]
- Curcino IV, Costa Júnior PRS, Cárdenas Gómez AO, Peñaranda Chenche L.E., Lima JA, Naveira-Cotta CP, Cotta RM. Analysis of Effective Thermal Conductivity and Tortuosity Modeling in Membrane Distillation Simulation. Micro and Nano Engineering 2022; 17:100165. [CrossRef]
- Naveira-Cotta CP, Curcino IV, Reis BS, Cárdenas Gómez AO, Costa Jr. PRS, Carvalho JDCG, Peñaranda Chenche LE, Lima JA, Cotta RM. A Sustainable Polycogeneration Prototype for Decentralized Production of Electricity, Distilled Water and Biodiesel. Proc. of the 8th Thermal and Fluids Engineering Conference (TFEC), ASTFE, Paper # TFEC-2023-47412, p.703-707, College Park, MD, USA, th-29th, 2023. 26 March. [CrossRef]
- Liu J, Wang Q, Shan H, Guo H, Li B. Surface hydrophobicity based heat and mass transfer mechanism in membrane distillation. J Memb Sci 2019;580:275–88. [CrossRef]
- Deshmukh A, Boo C, Karanikola V, Lin S, Straub AP, Tong T, et al. Membrane distillation at the water-energy nexus: limits, opportunities, and challenges. Energy Environ Sci 2018;11:1177–96. [CrossRef]
- Delgado JMPQ. A Simple Experimental Technique to Measure Tortuosity in Packed Beds. Can J Chem Eng 2006;84:651–5. [CrossRef]
- Iversen N, Jørgensen BB. Diffusion coefficients of sulfate and methane in marine sediments: Influence of porosity. Geochim Cosmochim Acta 1993;57:571–8. [CrossRef]
- Beeckman, JW. Mathematical description of heterogeneous materials. Chem Eng Sci 1990;45:2603–10. [CrossRef]
- Tsai DS, Strieder W. EFFECTIVE CONDUCTIVITIES OF RANDOM FIBER BEDS†. Http://DxDoiOrg/101080/00986448608911698 2007;40:207–18. [CrossRef]
- Weissberg, HL. Effective Diffusion Coefficient in Porous Media. J Appl Phys 2004;34:2636. [CrossRef]
- Ghanbarian B, Hunt AG, Sahimi M, Ewing RP, Skinner TE. Percolation Theory Generates a Physically Based Description of Tortuosity in Saturated and Unsaturated Porous Media. Soil Science Society of America Journal 2013;77:1920–9. [CrossRef]
- Kim WJ, Campanella O, Heldman DR. Predicting the performance of direct contact membrane distillation (DCMD): Mathematical determination of appropriate tortuosity based on porosity. J Food Eng 2021;294:110400. [CrossRef]
- Mackie JS, Meares Katchalsky P, Shavit A, Eisenberg N, Kressman H, Kitchener RE, et al. The diffusion of electrolytes in a cation-exchange resin membrane I. Theoretical. Proc R Soc Lond A Math Phys Sci 1955;232:498–509. [CrossRef]
- Jonsson, G. The influence of the porous sublayer on the salt rejection and reflection coefficient of asymmetric CA membranes. Desalination 1980;34:141–57. [CrossRef]
- Iversen SB, Bhatia VK, Dam-Johansen K, Jonsson G. Characterization of microporous membranes for use in membrane contactors. J Memb Sci 1997;130:205–17. [CrossRef]
- Simone S, Figoli A, Criscuoli A, Carnevale MC, Alfadul SM, Al-Romaih HS, et al. Effect of selected spinning parameters on PVDF hollow fiber morphology for potential application in desalination by VMD. Desalination 2014;344:28–35. [CrossRef]
- El-Dessouky HT, Ettouney HMohamed. Fundamentals of salt water desalination. 1st Edition, Elsevier; 2002.
- Moreira VR, Lebron YAR, Gontijo D, Amaral MCS. Membrane distillation and dispersive solvent extraction in a closed-loop process for water, sulfuric acid and copper recycling from gold mining wastewater. Chemical Engineering Journal 2022; 435:133874. [CrossRef]
- Khayet M, Matsuura T. Membrane distillation: Principles and applications. Membrane Distillation: Principles and Applications 2011:1–477. [CrossRef]
Figure 1.
Drawings of the DCMD module designed through CFD-OpenFOAM (dimensions in mm).
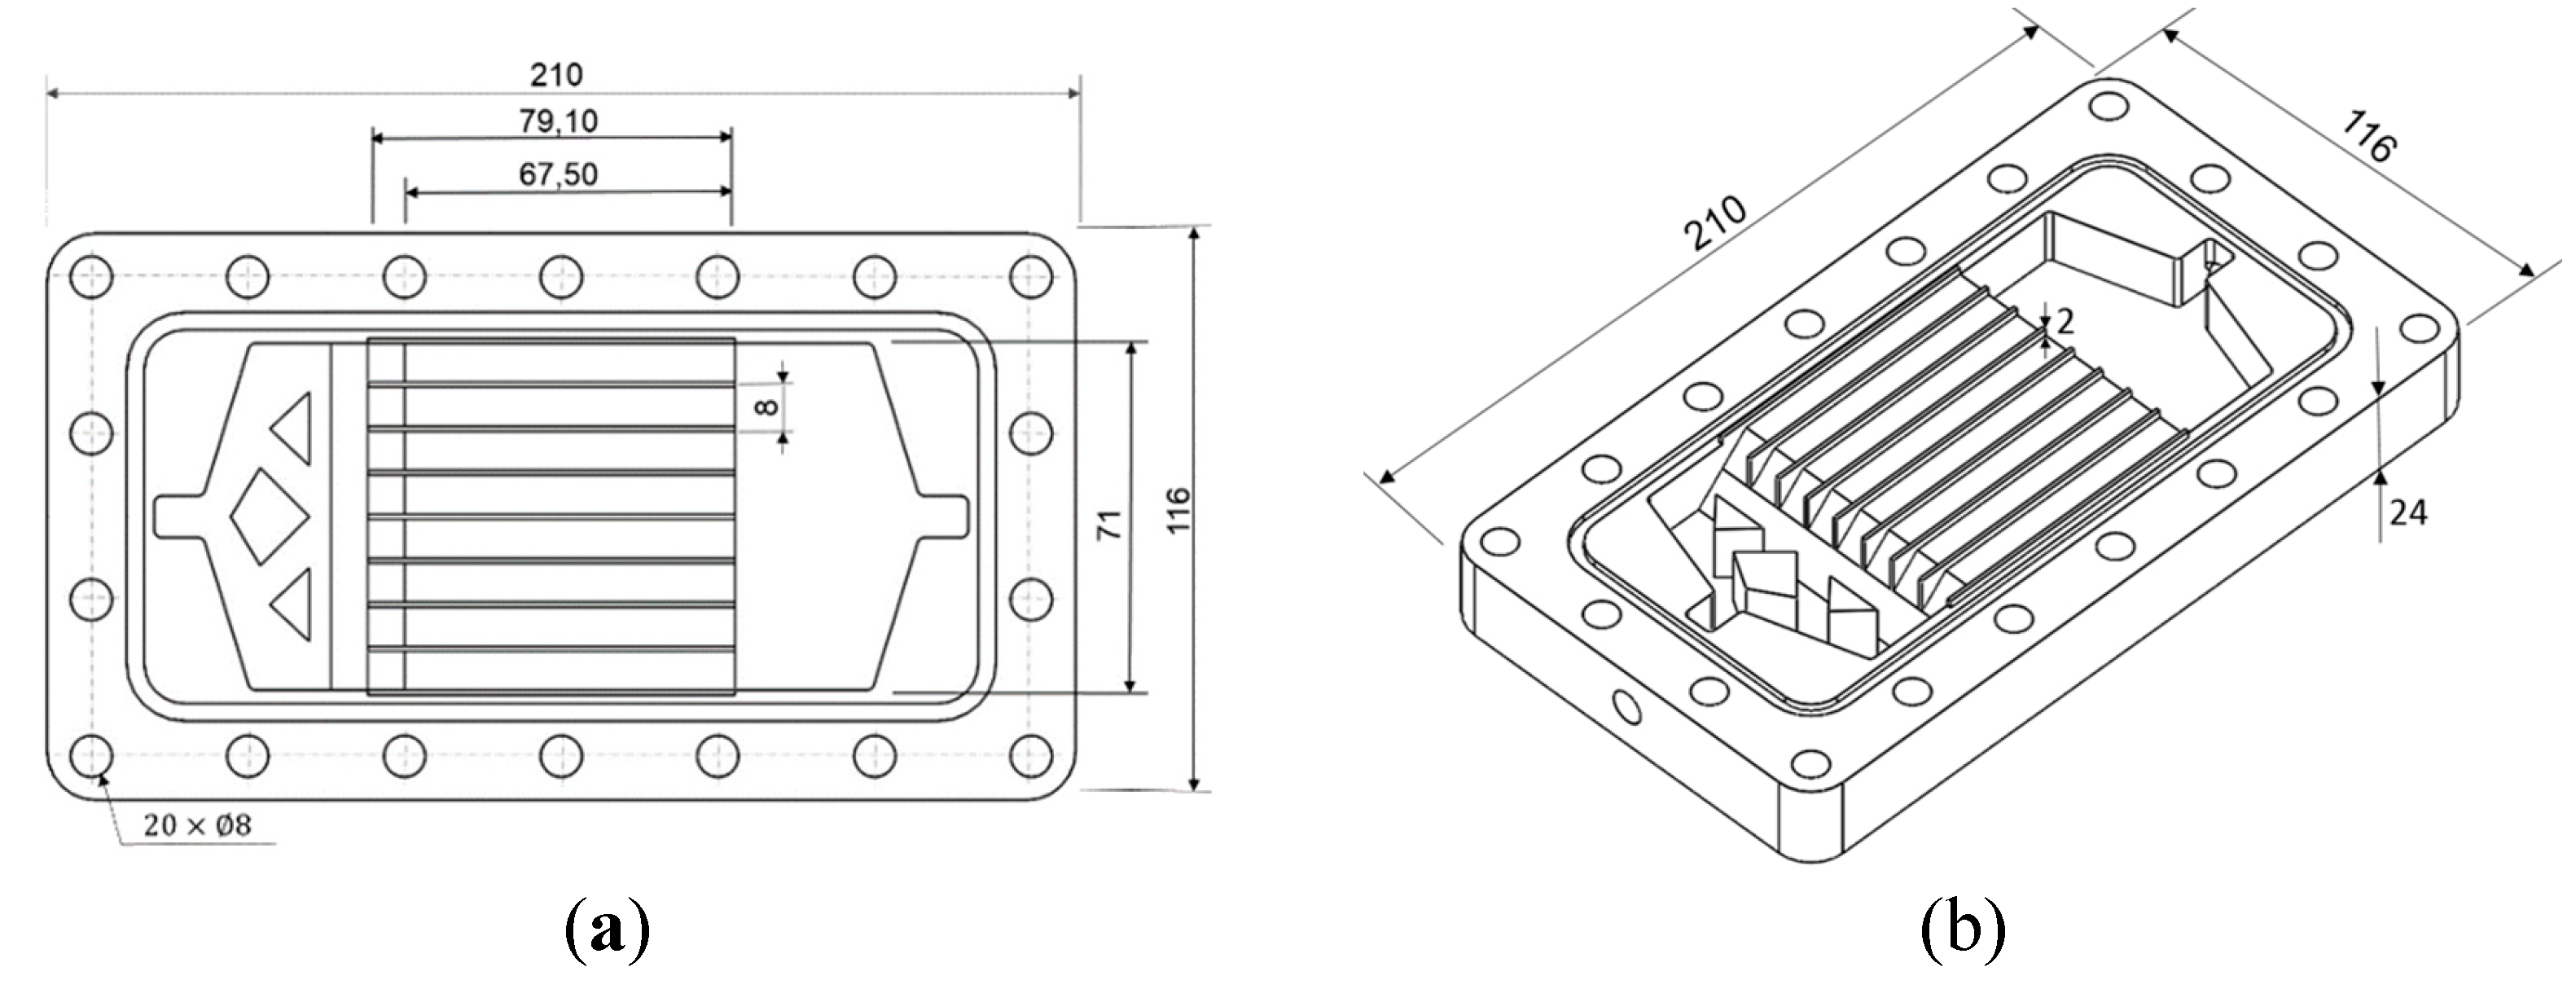
Figure 2.
Simulated transversal velocity component profiles inside the module microchannels: (a) in the longitudinally central section for different volumetric flow rates, (b) in transversal sections near the inlet, at the center, and near the exit of the module, for a volumetric flow rate of 1.2 L/min.
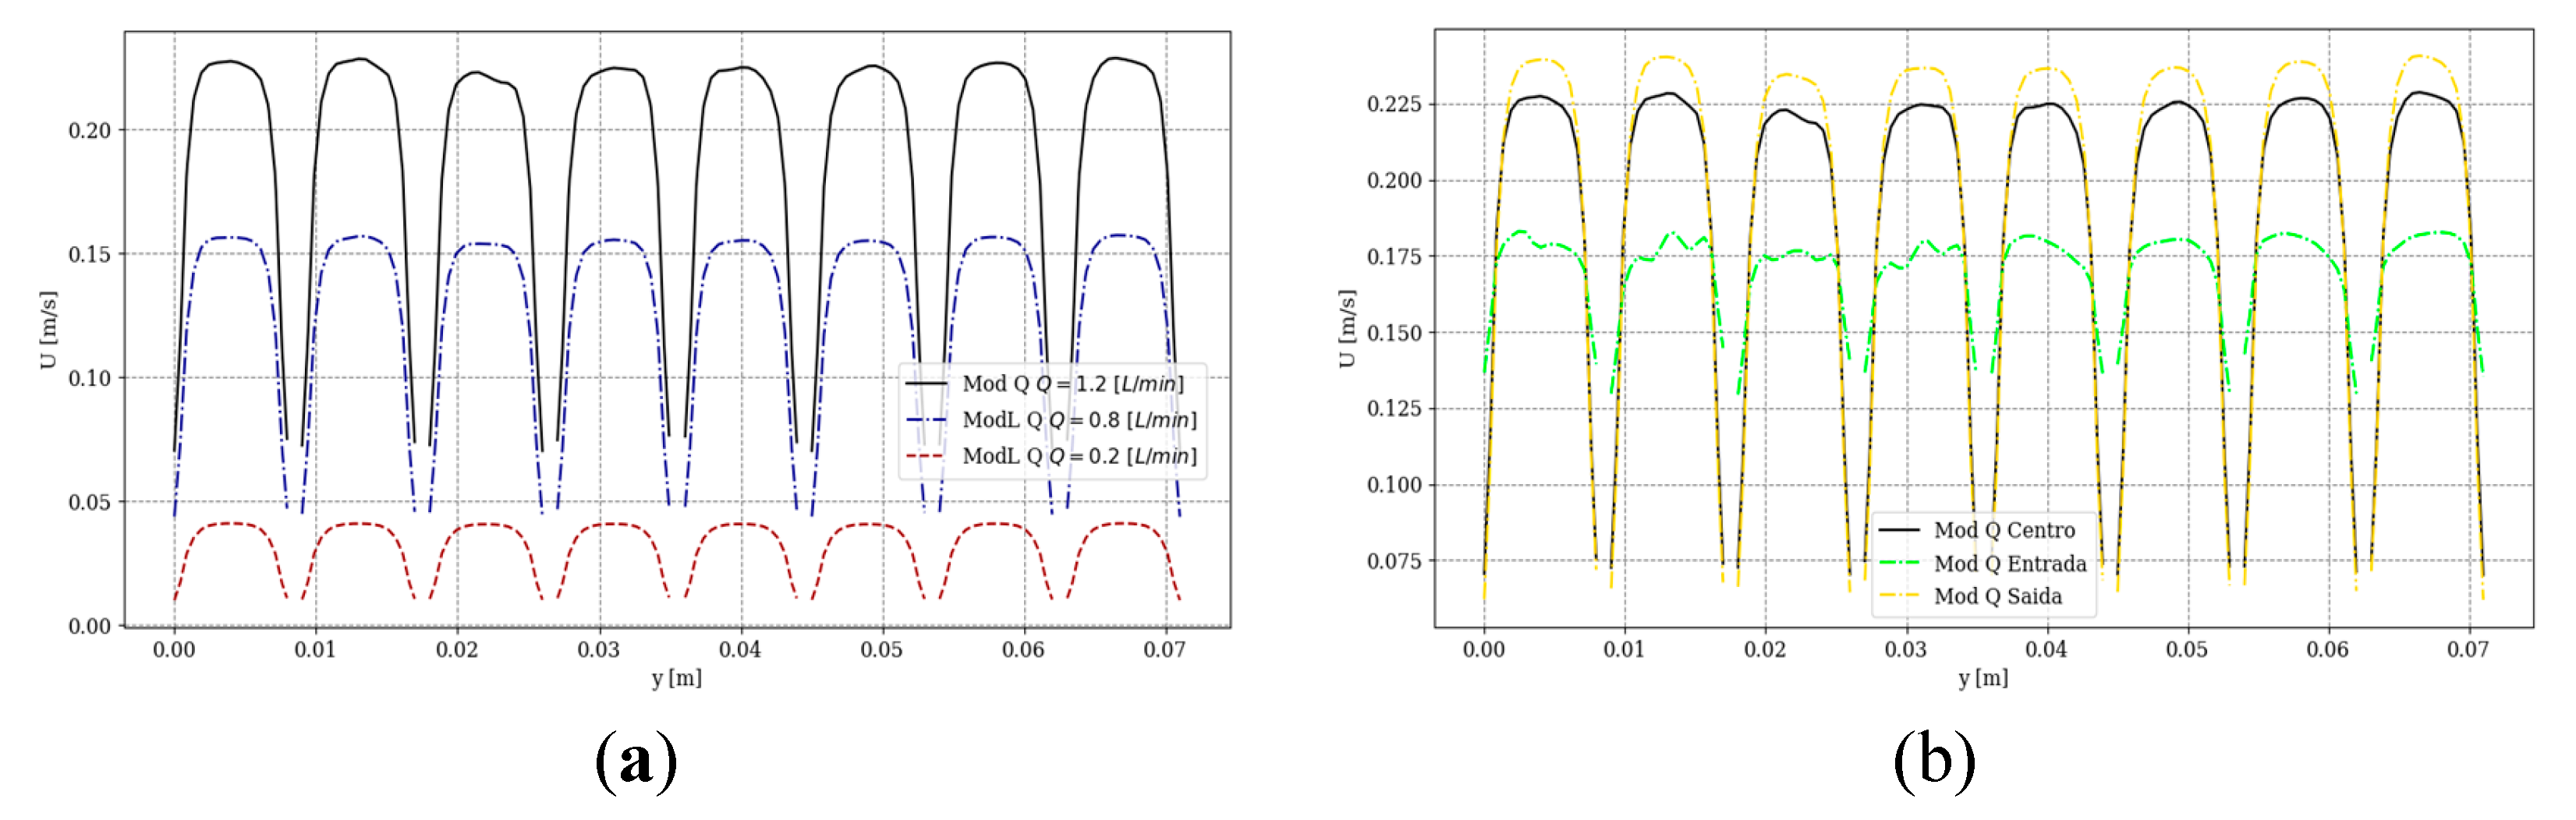
Figure 3.
Drawings of the AGMD module designed through CFD-OpenFOAM (dimensions in mm).
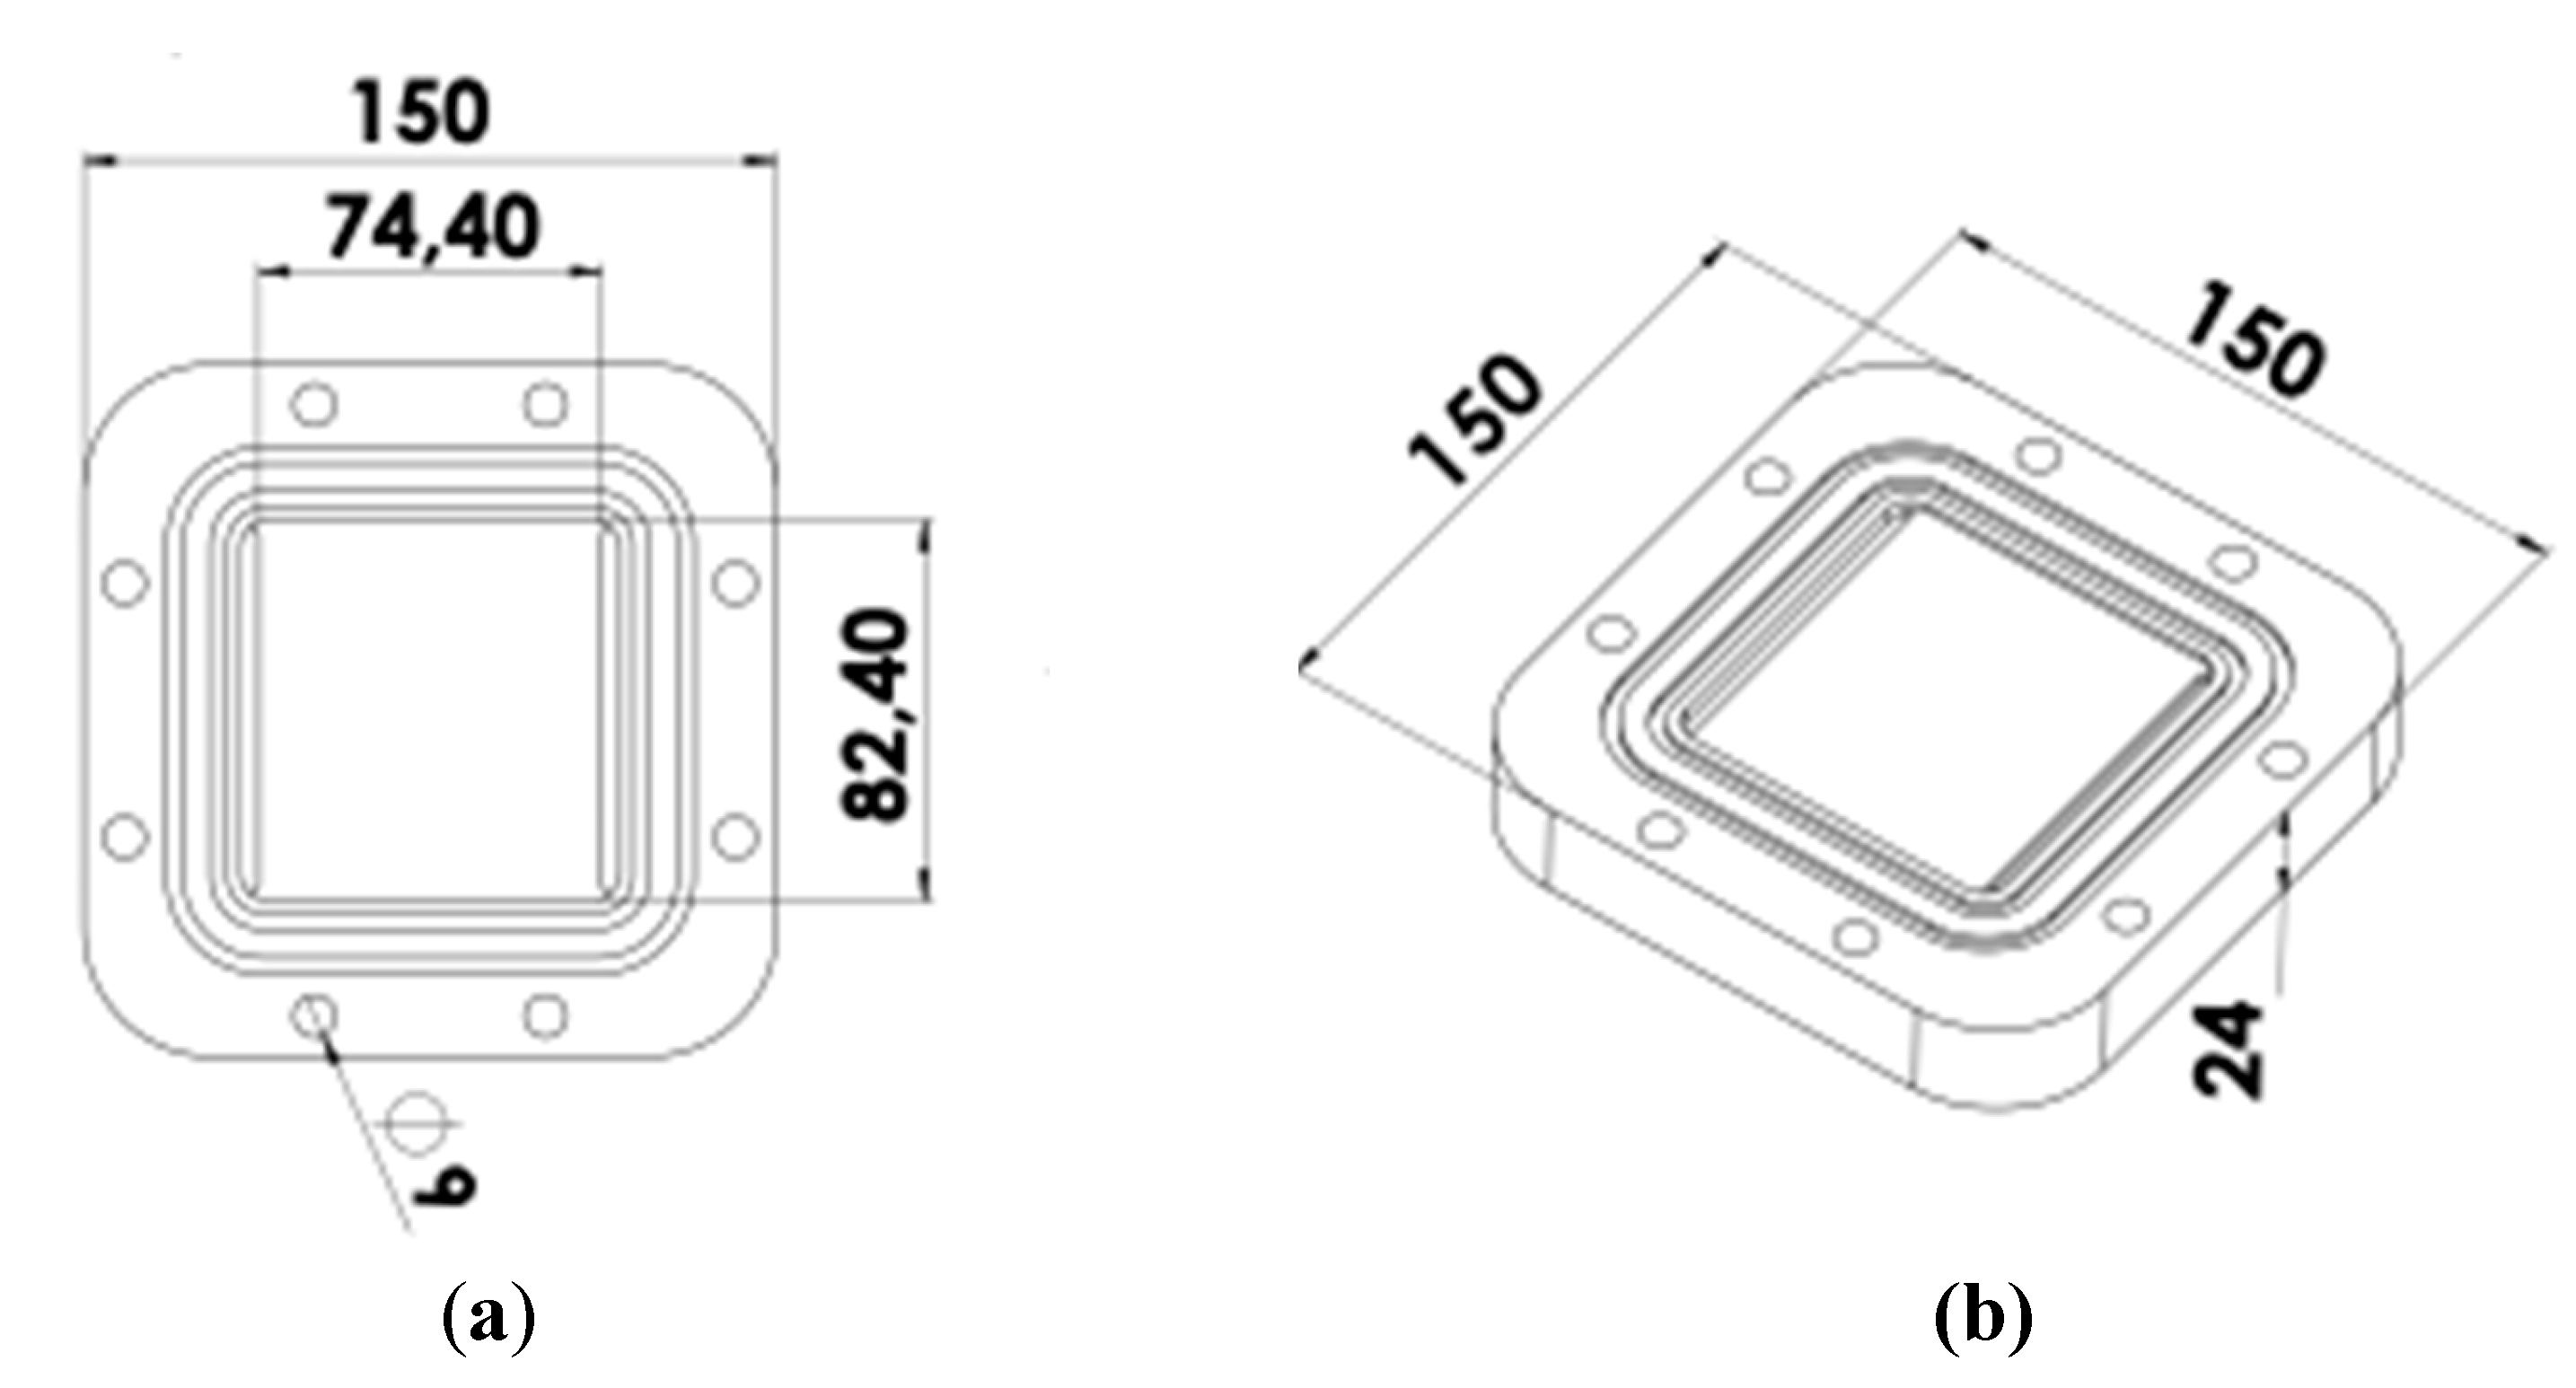
Figure 4.
Schematic drawing of the benchtop membrane distillation system designed and built at LabMEMS/UFRJ in (a) DCMD and (b) AGMD configuration, both with flat sheet modules.
Figure 4.
Schematic drawing of the benchtop membrane distillation system designed and built at LabMEMS/UFRJ in (a) DCMD and (b) AGMD configuration, both with flat sheet modules.
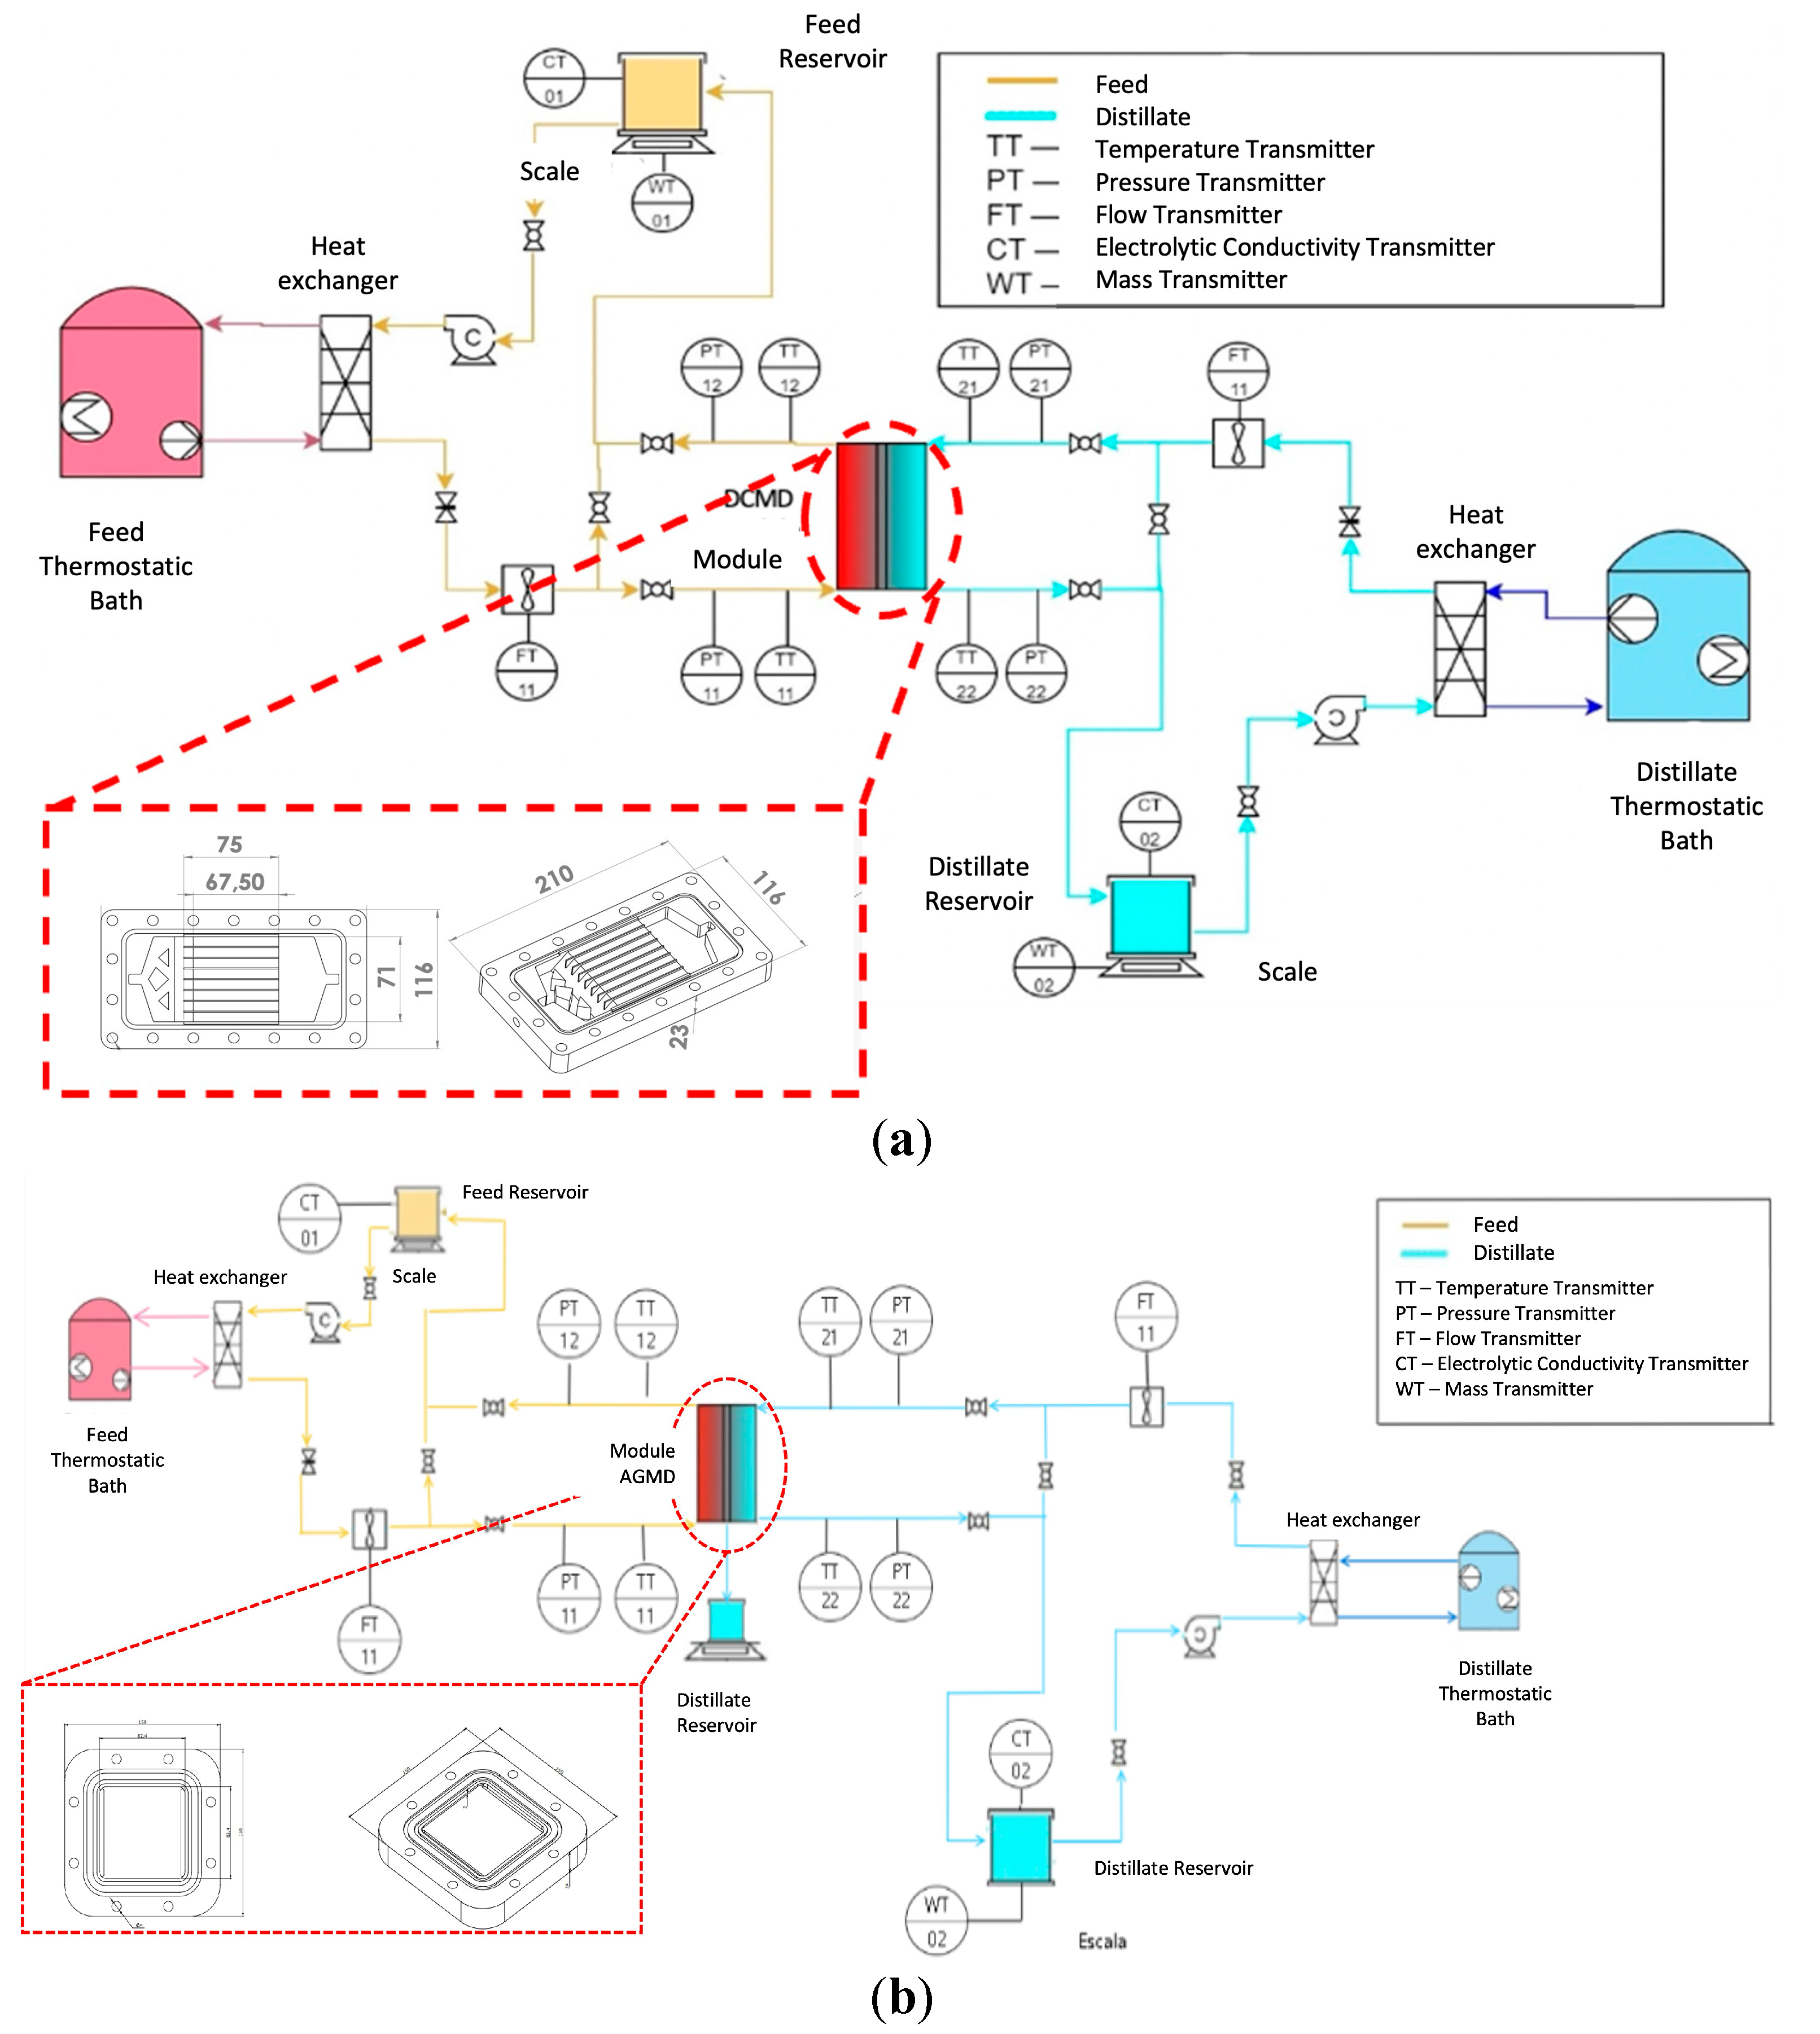
Figure 5.
Schematic drawing of thermal resistances in a DCMD module.
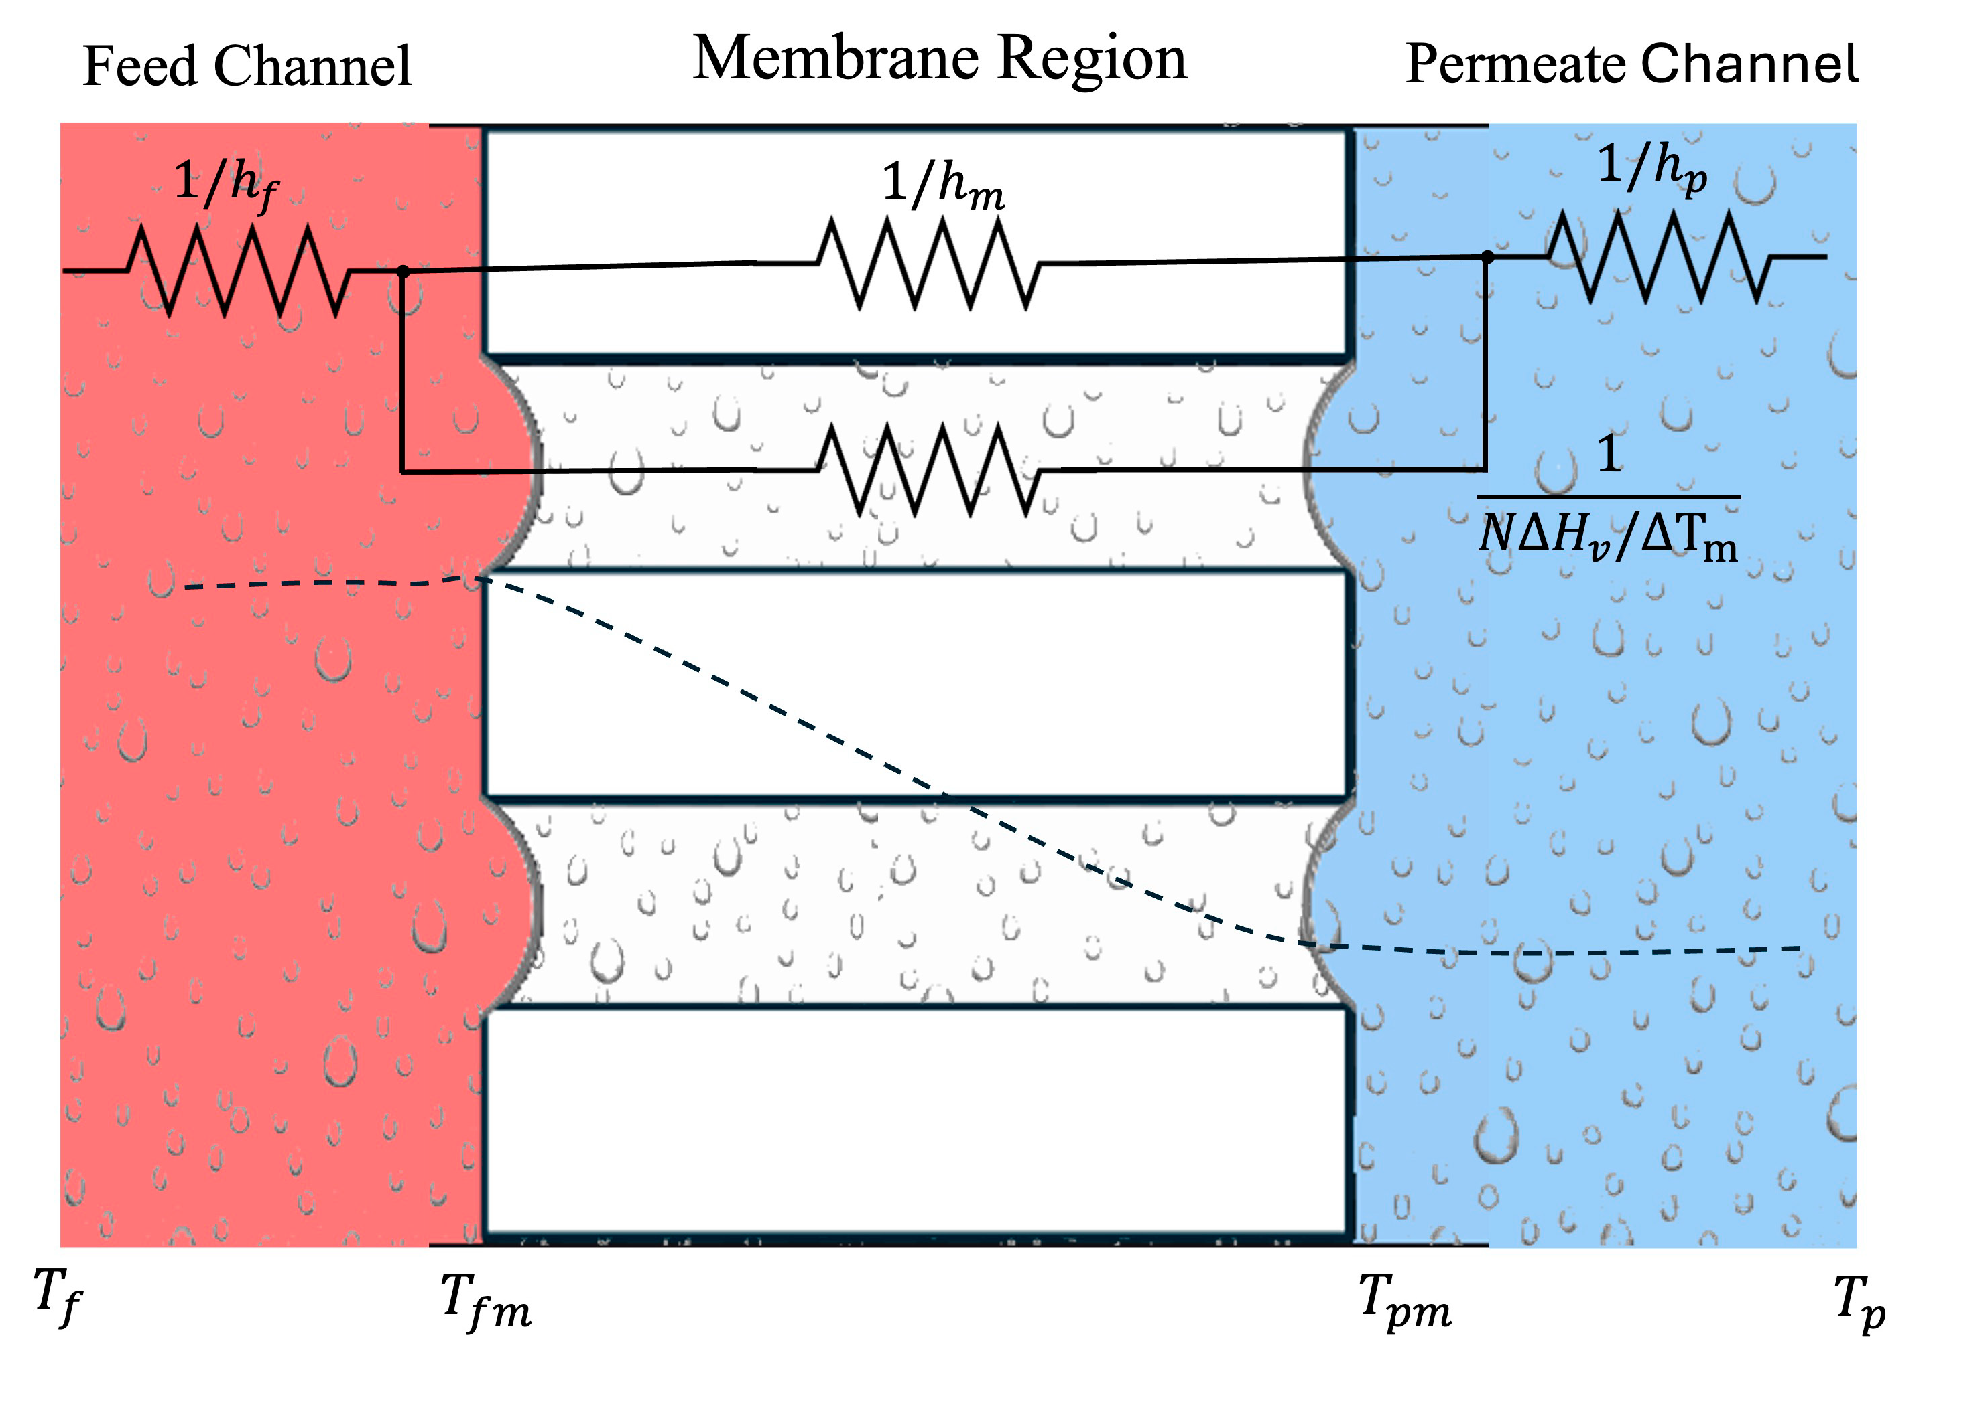
Figure 6.
Flowchart of the iterative algorithm for prediction of heat and mass transfer in the DCMD module.
Figure 6.
Flowchart of the iterative algorithm for prediction of heat and mass transfer in the DCMD module.
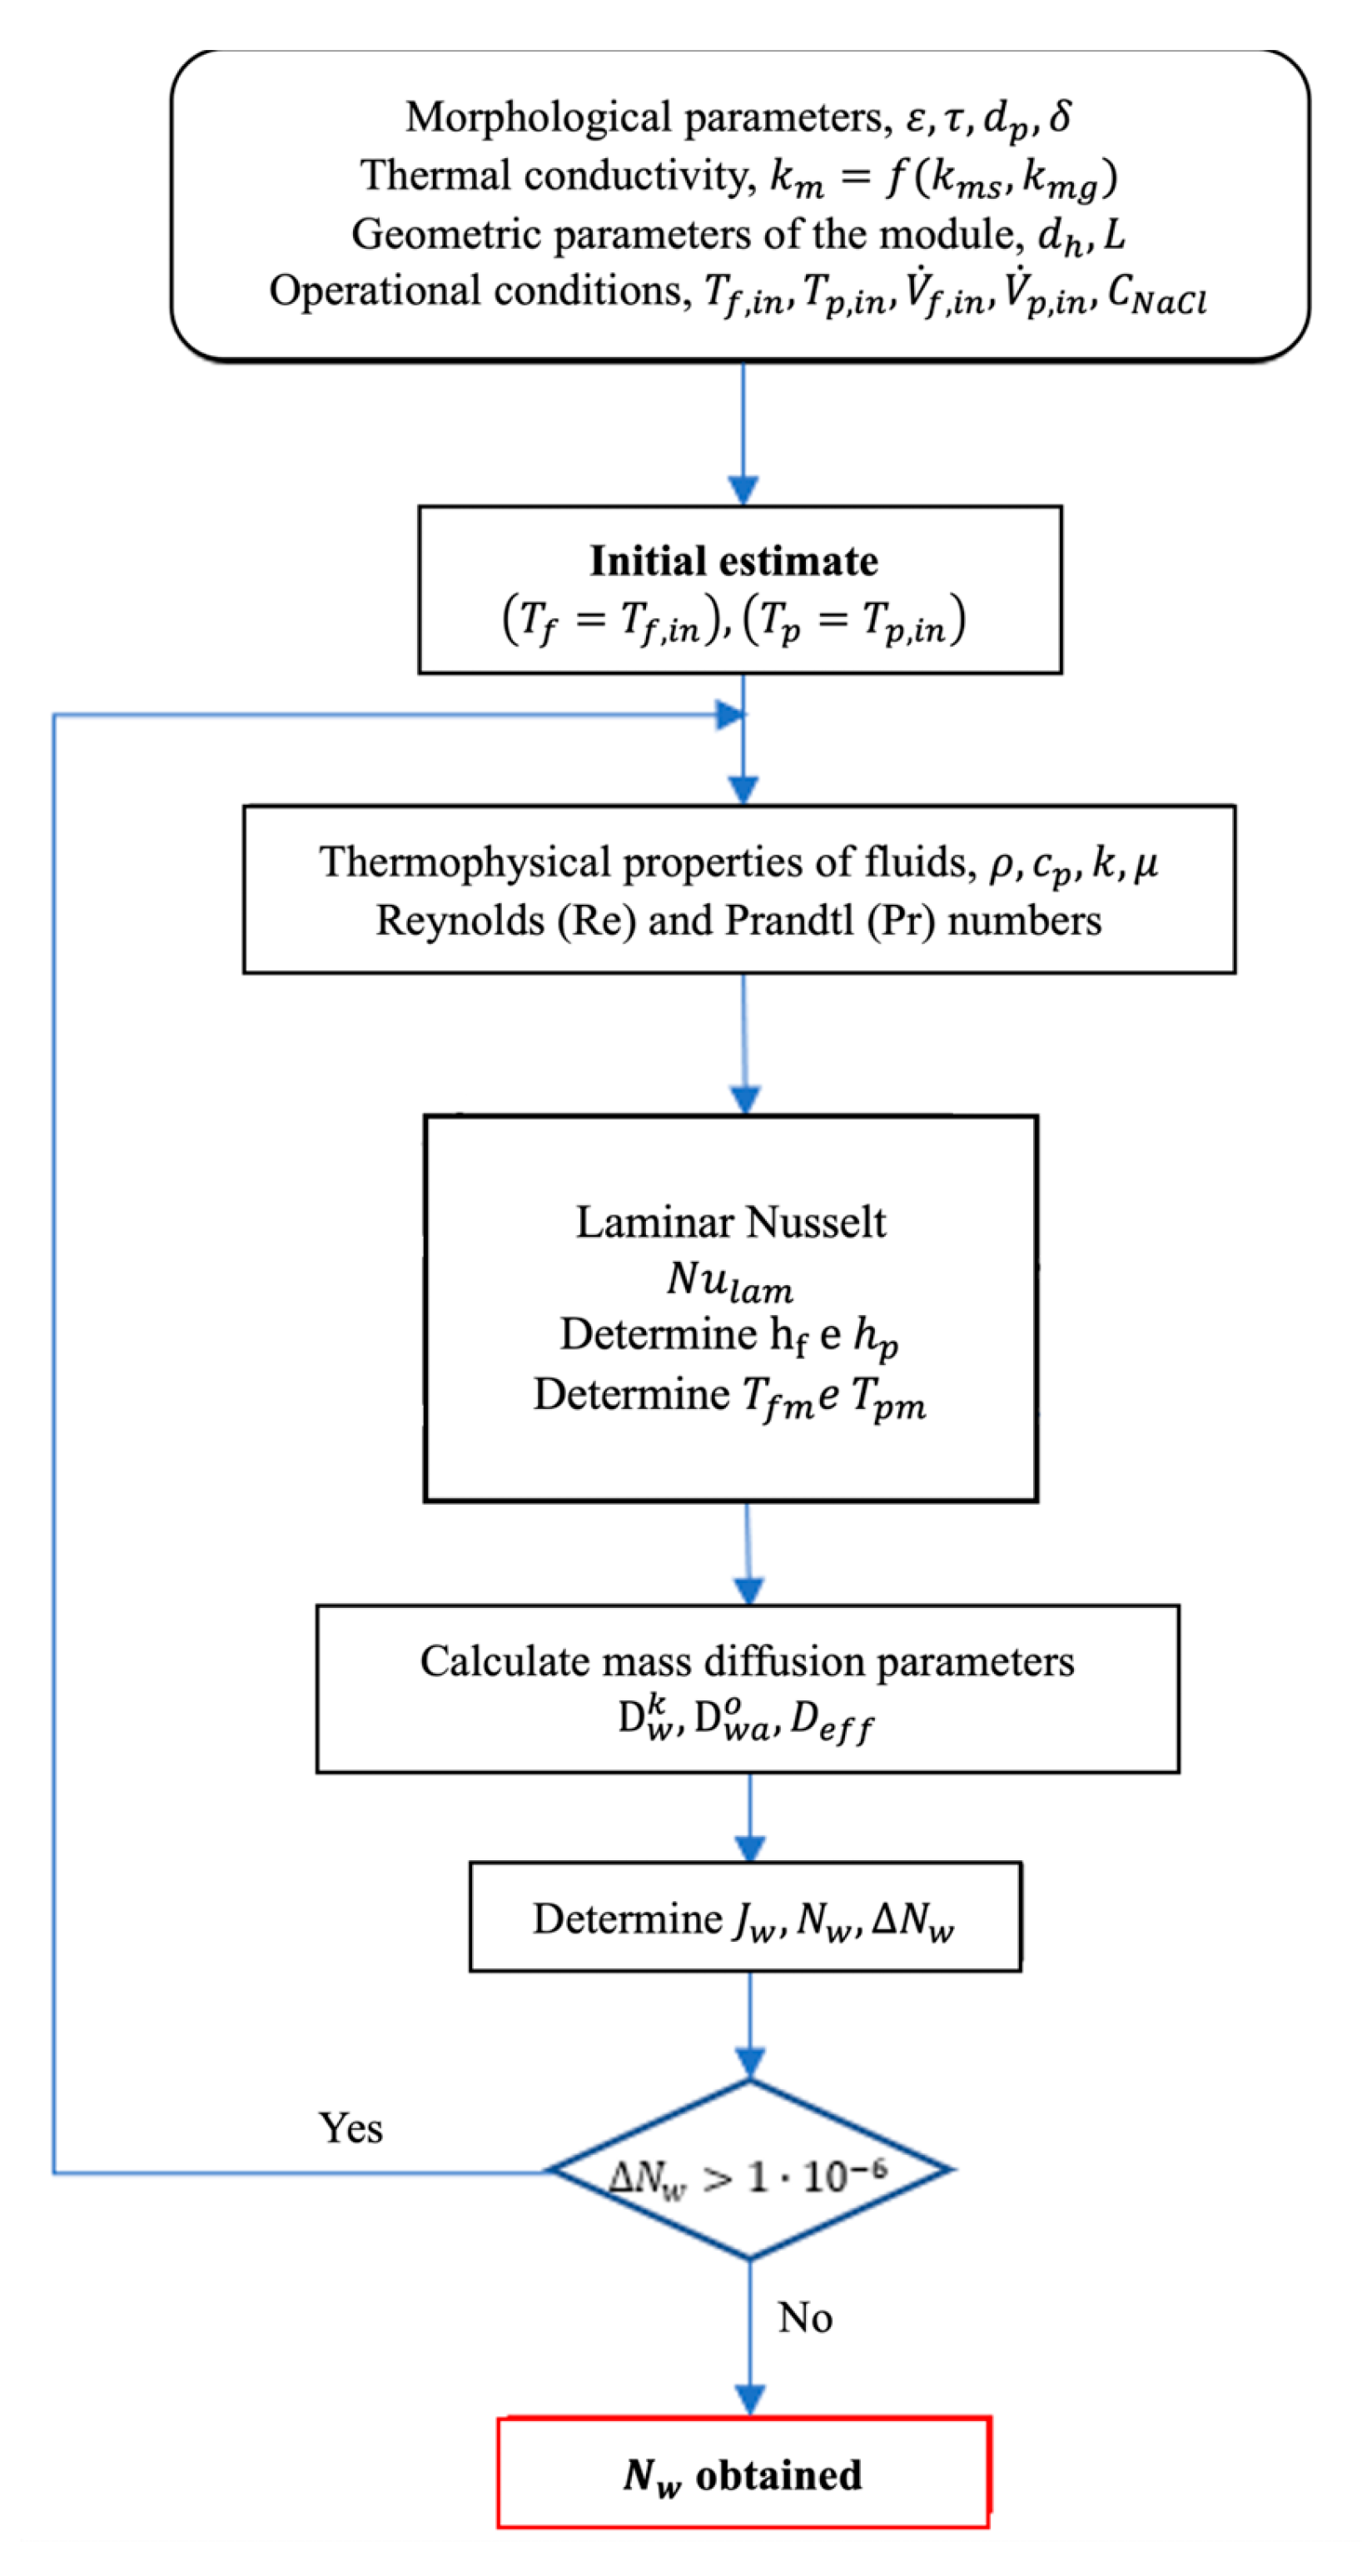
Figure 7.
Distillate mass flux as a function of feed temperature for air–gap membrane distillation (AGMD) and direct contact membrane distillation (DCMD), using different polymeric membranes made of polytetrafluoroethylene (PTFE), polyvinylidene fluoride (PVDF) and polyethylene (PE). Fixed operating conditions: Vp = 0.5 L/min; Vf = 0.2 L/min; Tf = 32.5 °C.
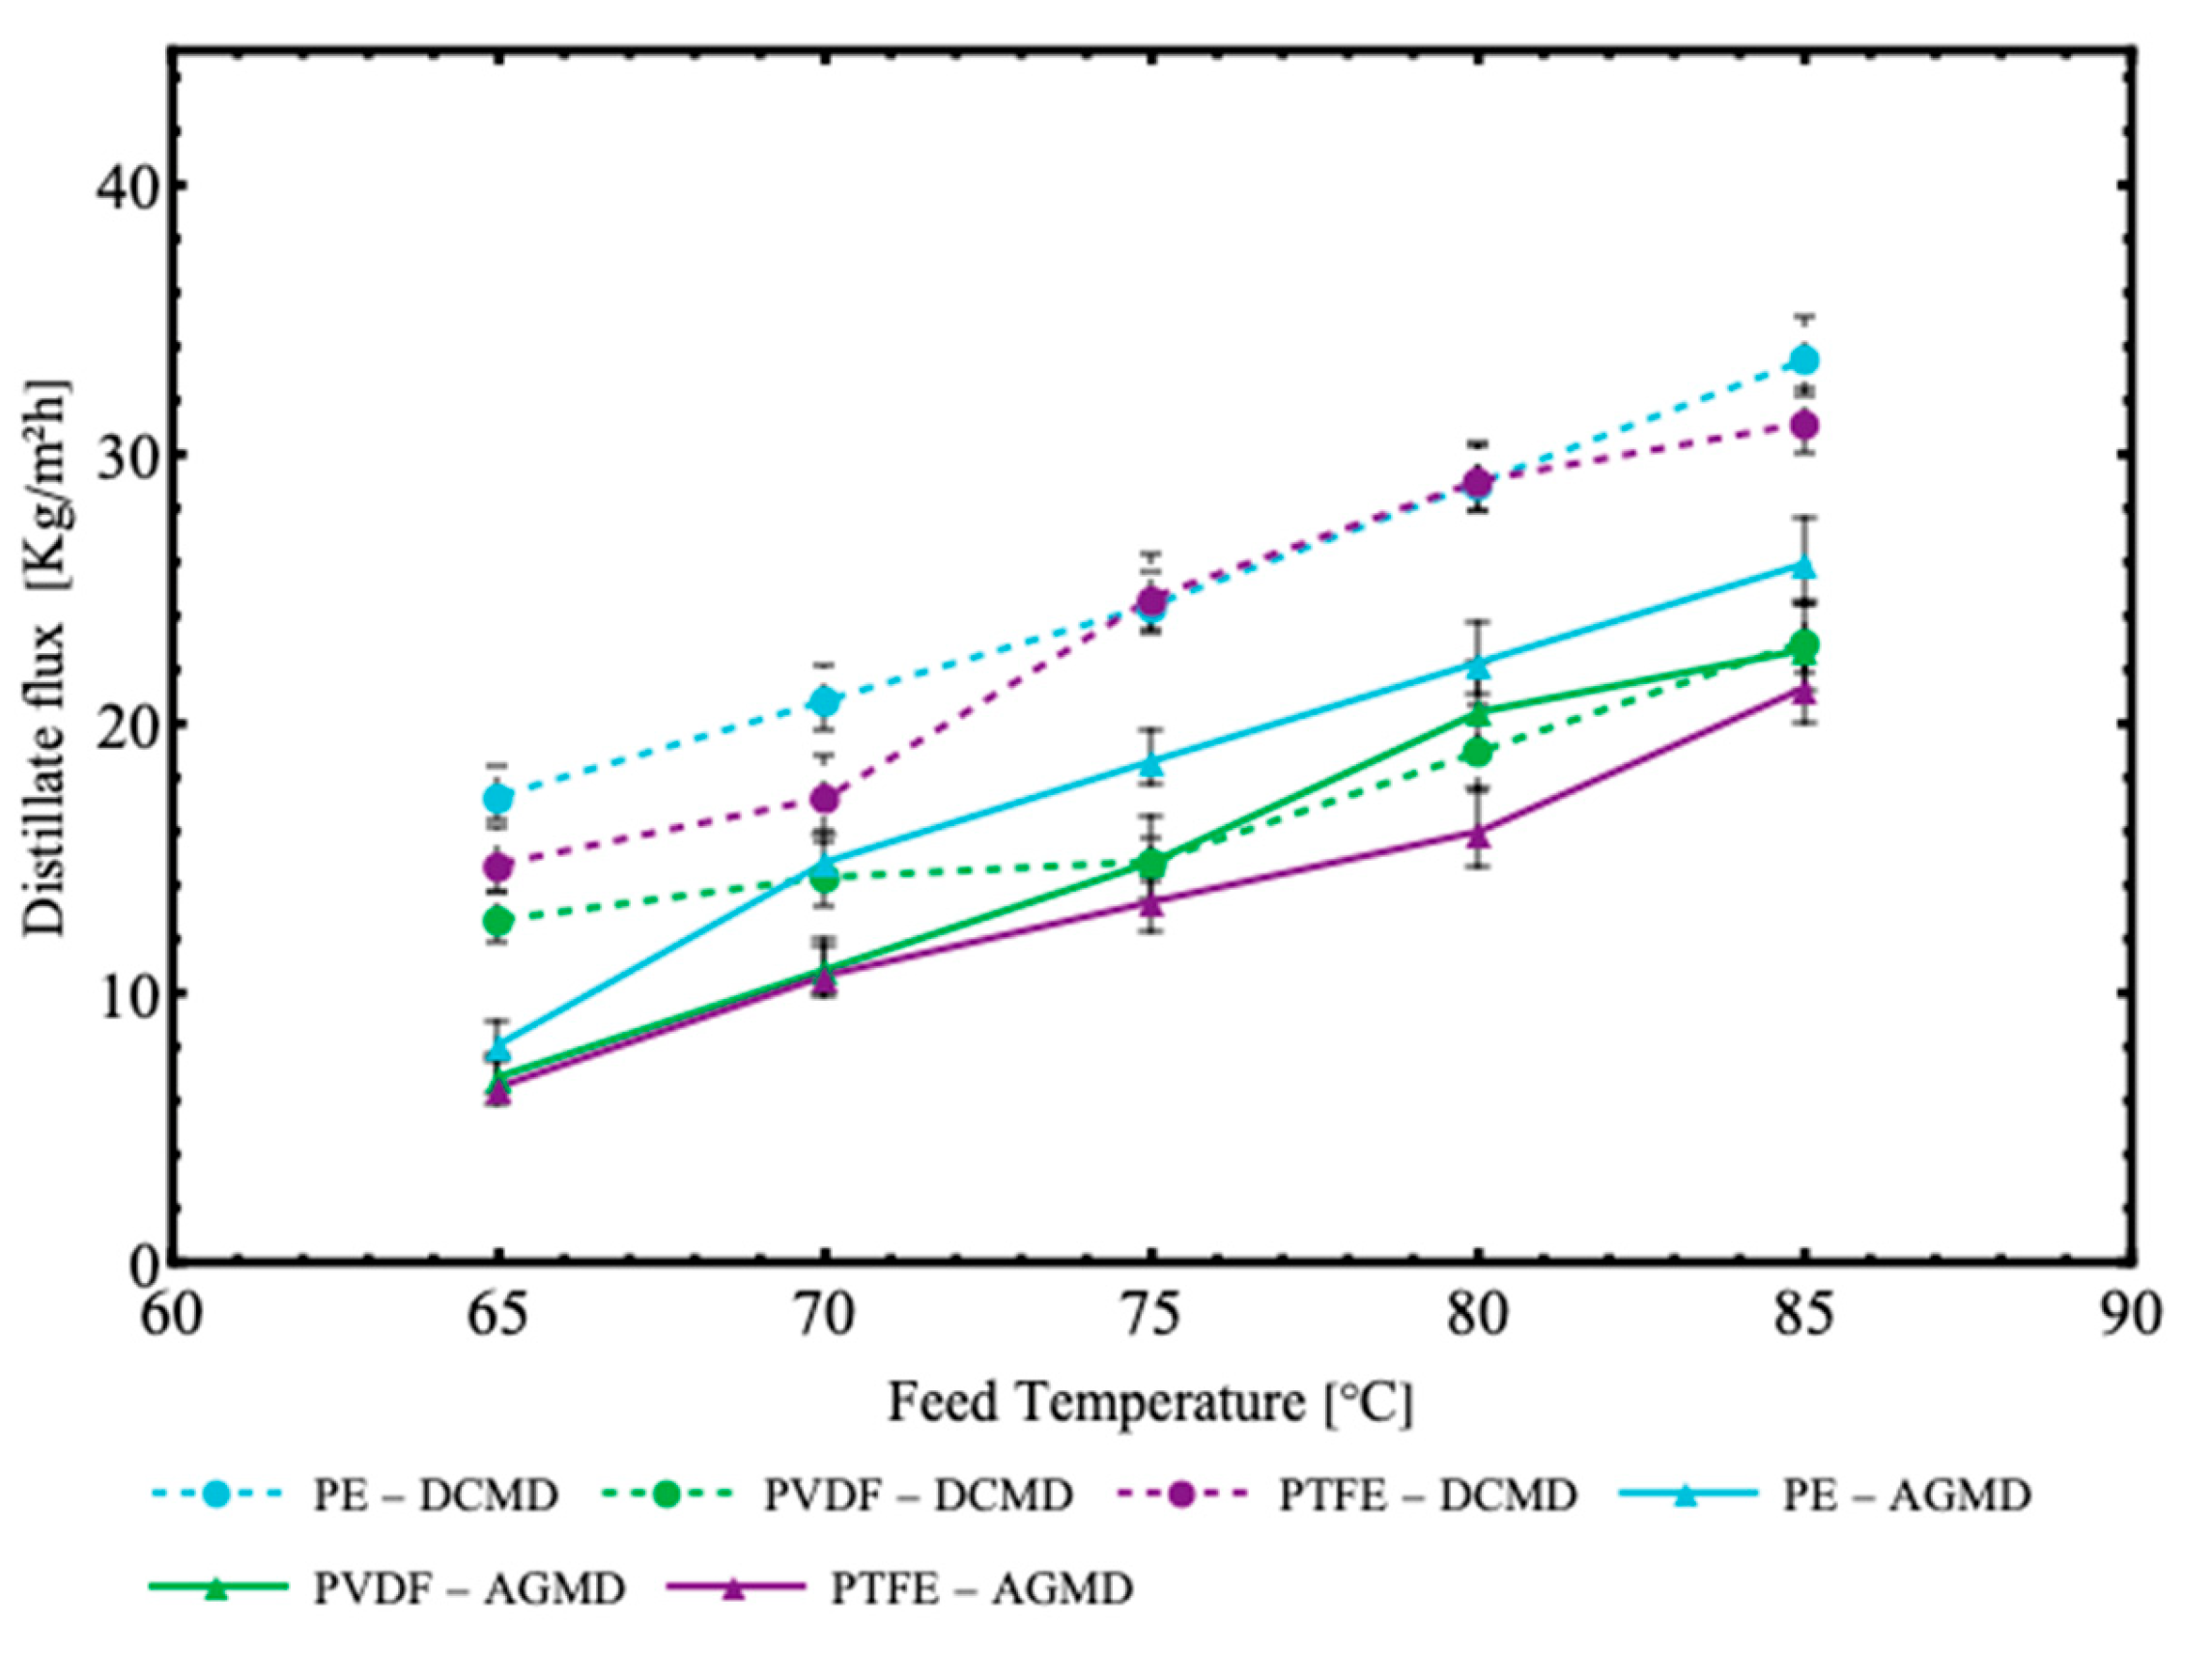
Figure 8.
Distillate mass flux as a function of NaCl concentrations (7, 35 and 70 g/L) in DCMD and AGMD configurations, using (a) polyethylene (PE), (b) polyvinylidene fluoride (PVDF) and (c) polytetrafluoroethylene (PTFE) membranes with feed temperature at 70°C and permeate temperature at 32.5°C, and feed and permeate (DCMD) and cooling (AGMD) flow rate of 0.5 L/min.
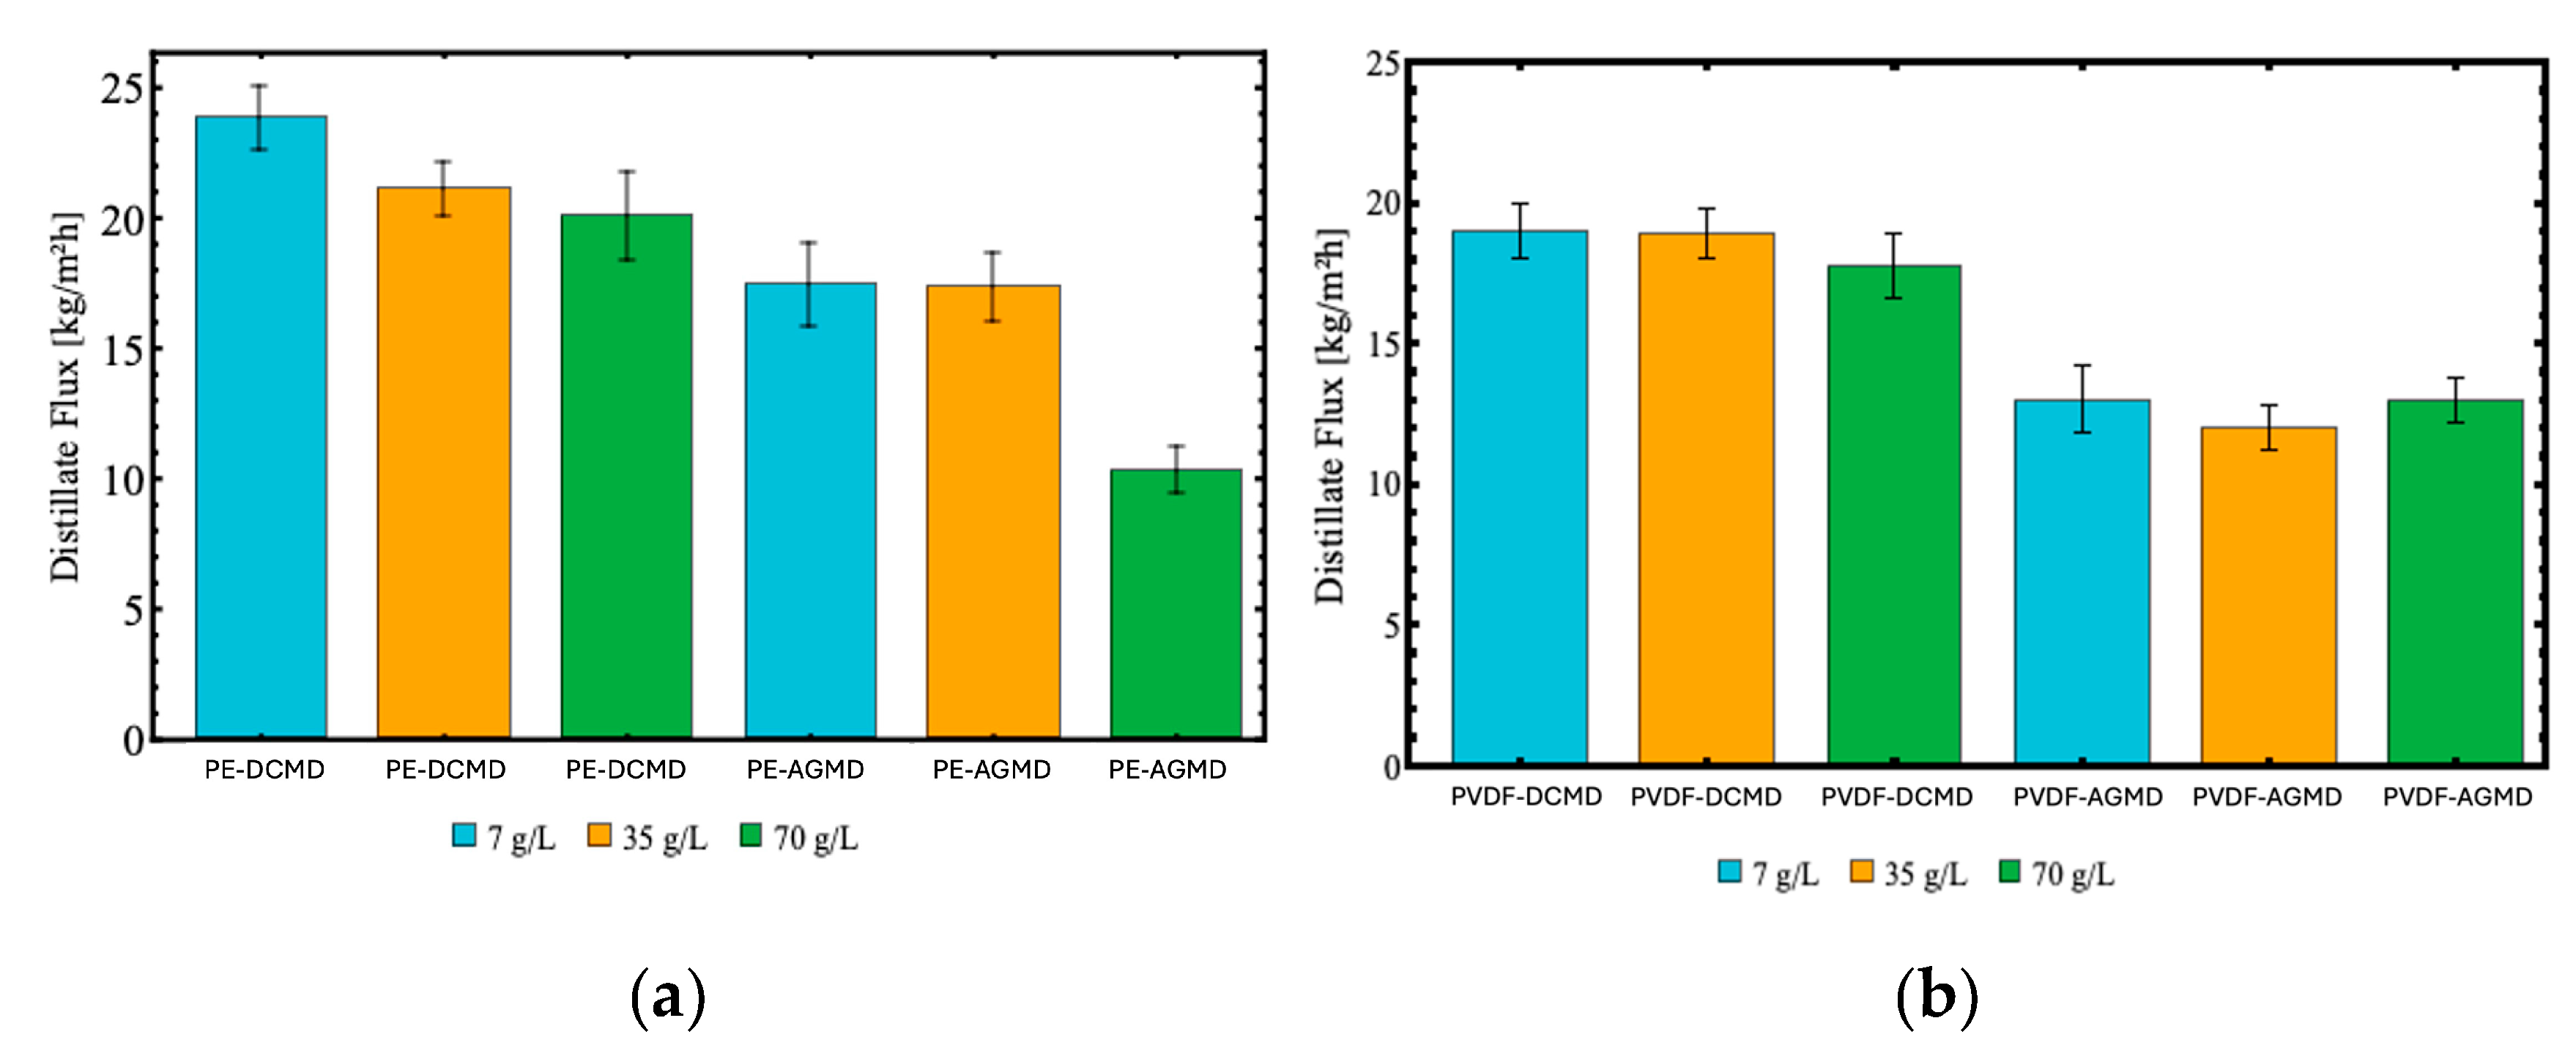
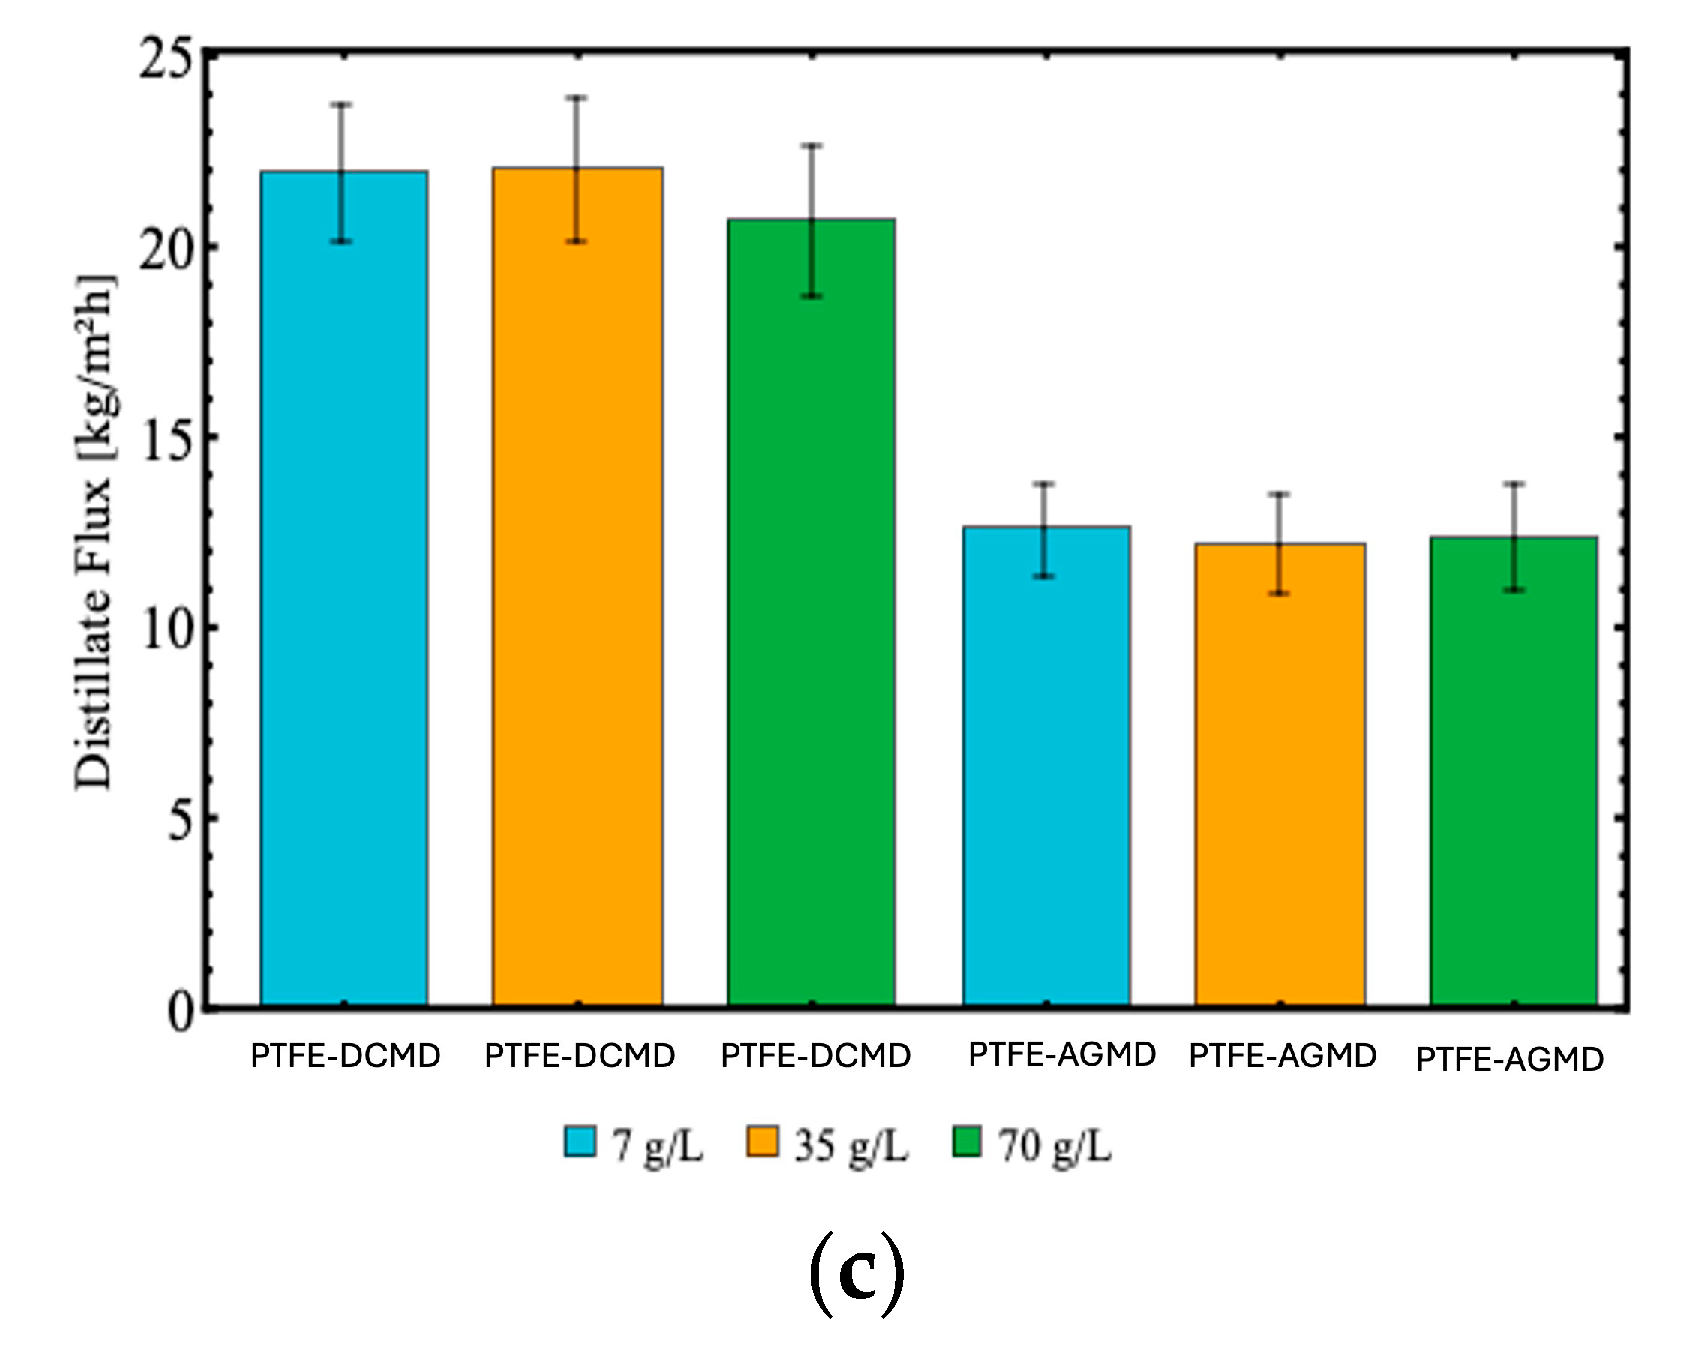
Figure 9.
Required heat transfer rates in the membrane distillation process (DCMD and AGMD) for the different membranes – (a) PE, (b) PVDF, and (c) PTFE, and NaCl concentrations (7, 35, and 70 g/L) with the feed temperature at 70°C and permeate at 32.5°C.
Figure 9.
Required heat transfer rates in the membrane distillation process (DCMD and AGMD) for the different membranes – (a) PE, (b) PVDF, and (c) PTFE, and NaCl concentrations (7, 35, and 70 g/L) with the feed temperature at 70°C and permeate at 32.5°C.
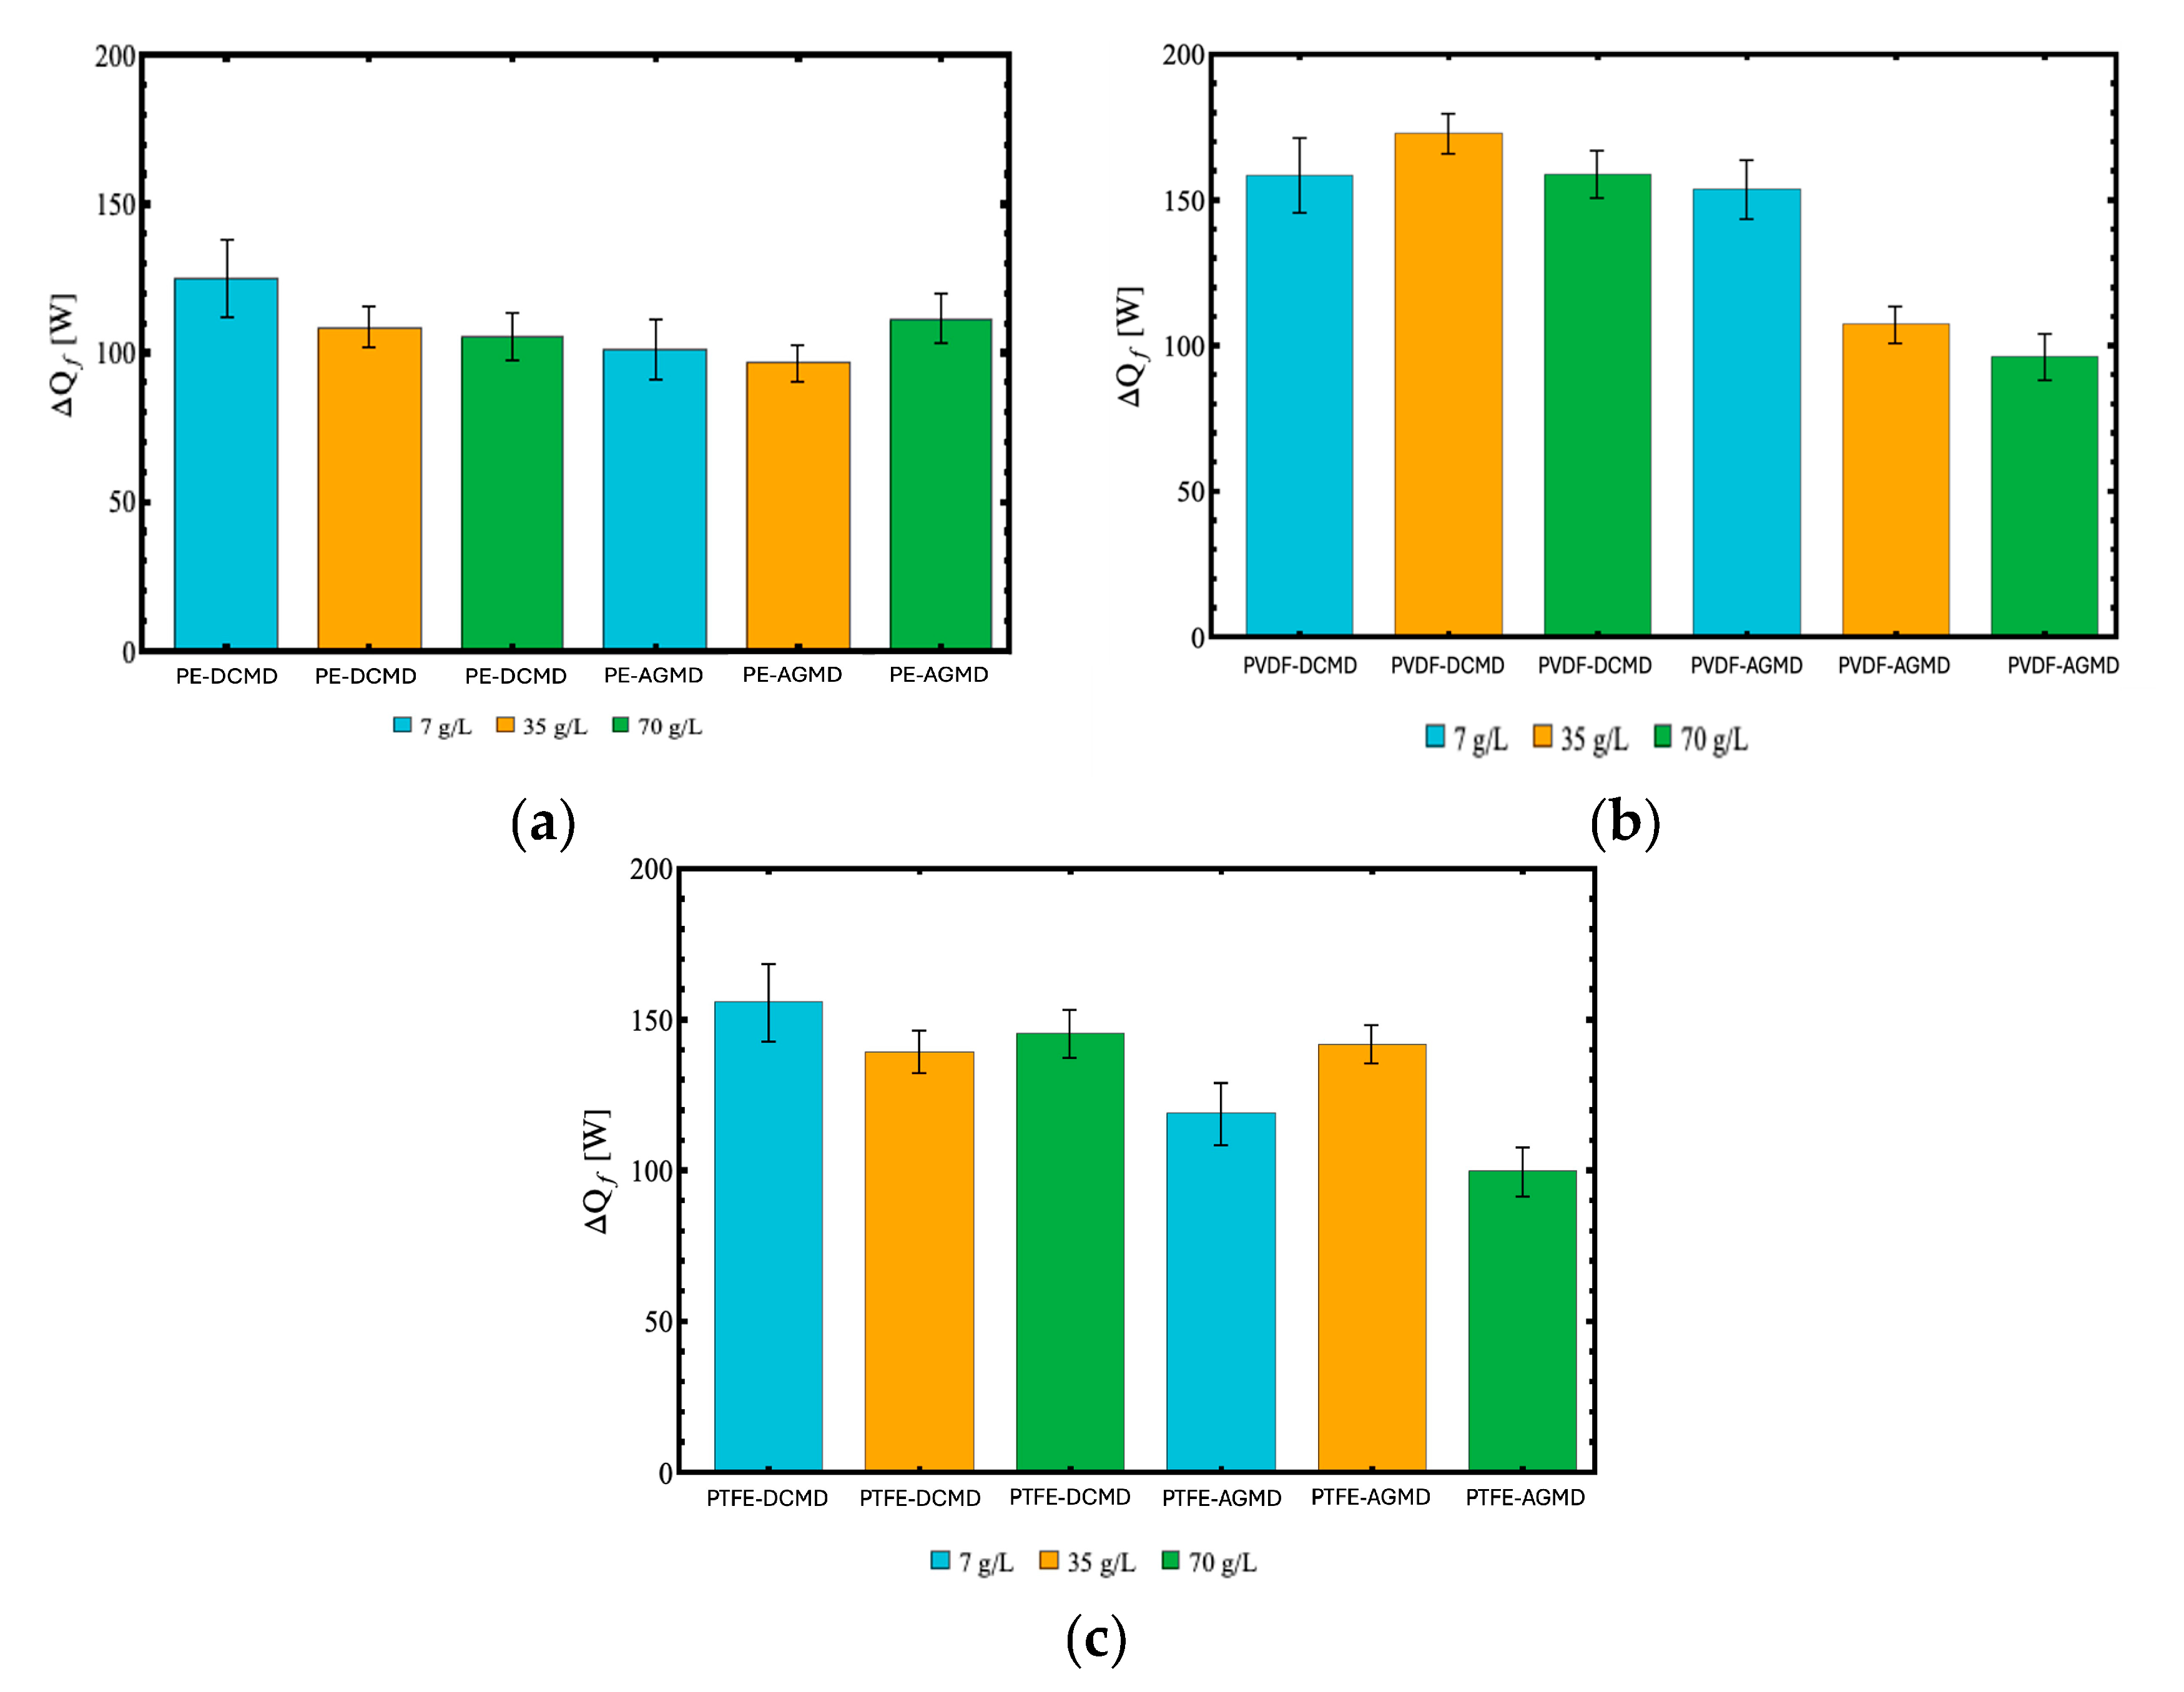
Figure 10.
Comparative performance in the permeate flux (J) and feed side heat input (ΔQf) ration in the AGMD and DCMD processes. All graphs refer to a NaCl concentration of 70 g/L, while the different feed fluid flow rates are: (a) 0.2 L/min, (b) 0.5 L/min and (c) 0.8 L/min.
Figure 10.
Comparative performance in the permeate flux (J) and feed side heat input (ΔQf) ration in the AGMD and DCMD processes. All graphs refer to a NaCl concentration of 70 g/L, while the different feed fluid flow rates are: (a) 0.2 L/min, (b) 0.5 L/min and (c) 0.8 L/min.
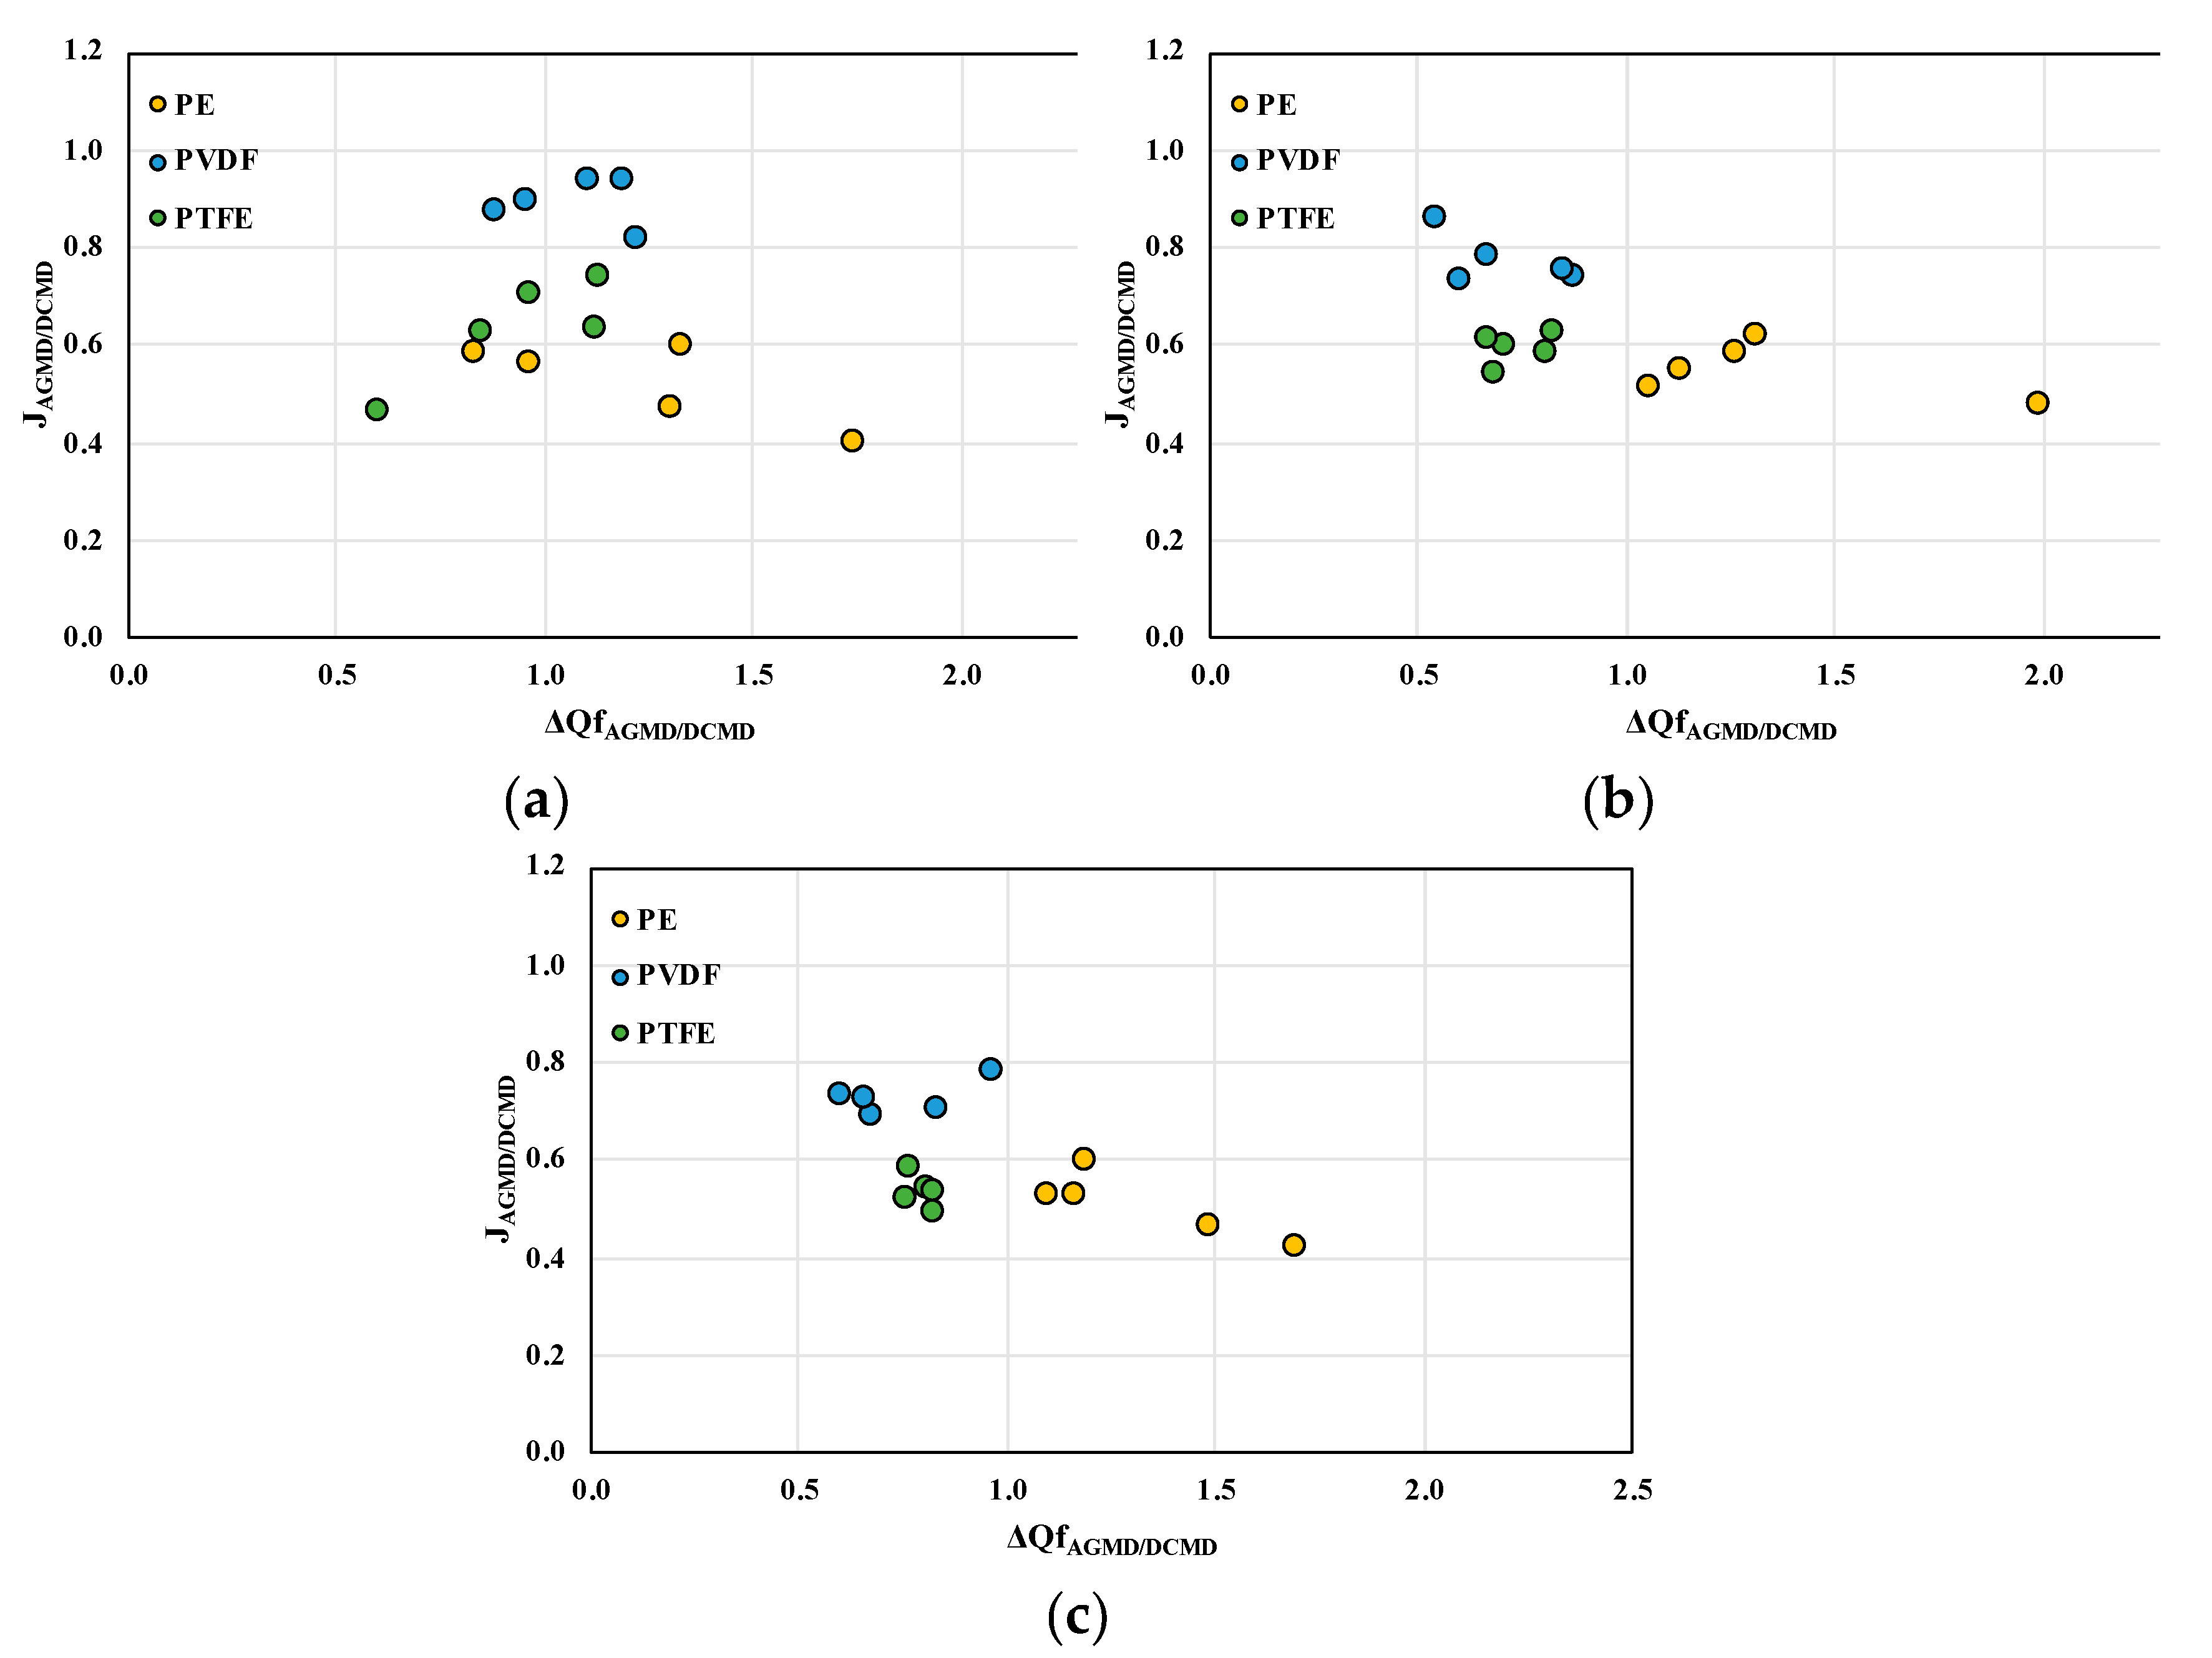
Figure 11.
(a) Temperature Polarization Coefficient (TPC) as a function of feed temperature for different types of membranes (PE, PVDF and PTFE) with permeate temperature fixed at 32.5 °C, permeate flow rate of 0.5 L/min, feed flow rate of 0.8 L/min and NaCl concentration of 70 g/L; (b) Concentration Polarization Coefficient (CPC) under the same operating conditions; (c) Comparison of TPC and CPC values among the three membrane types at feed temperature of 75 °C.
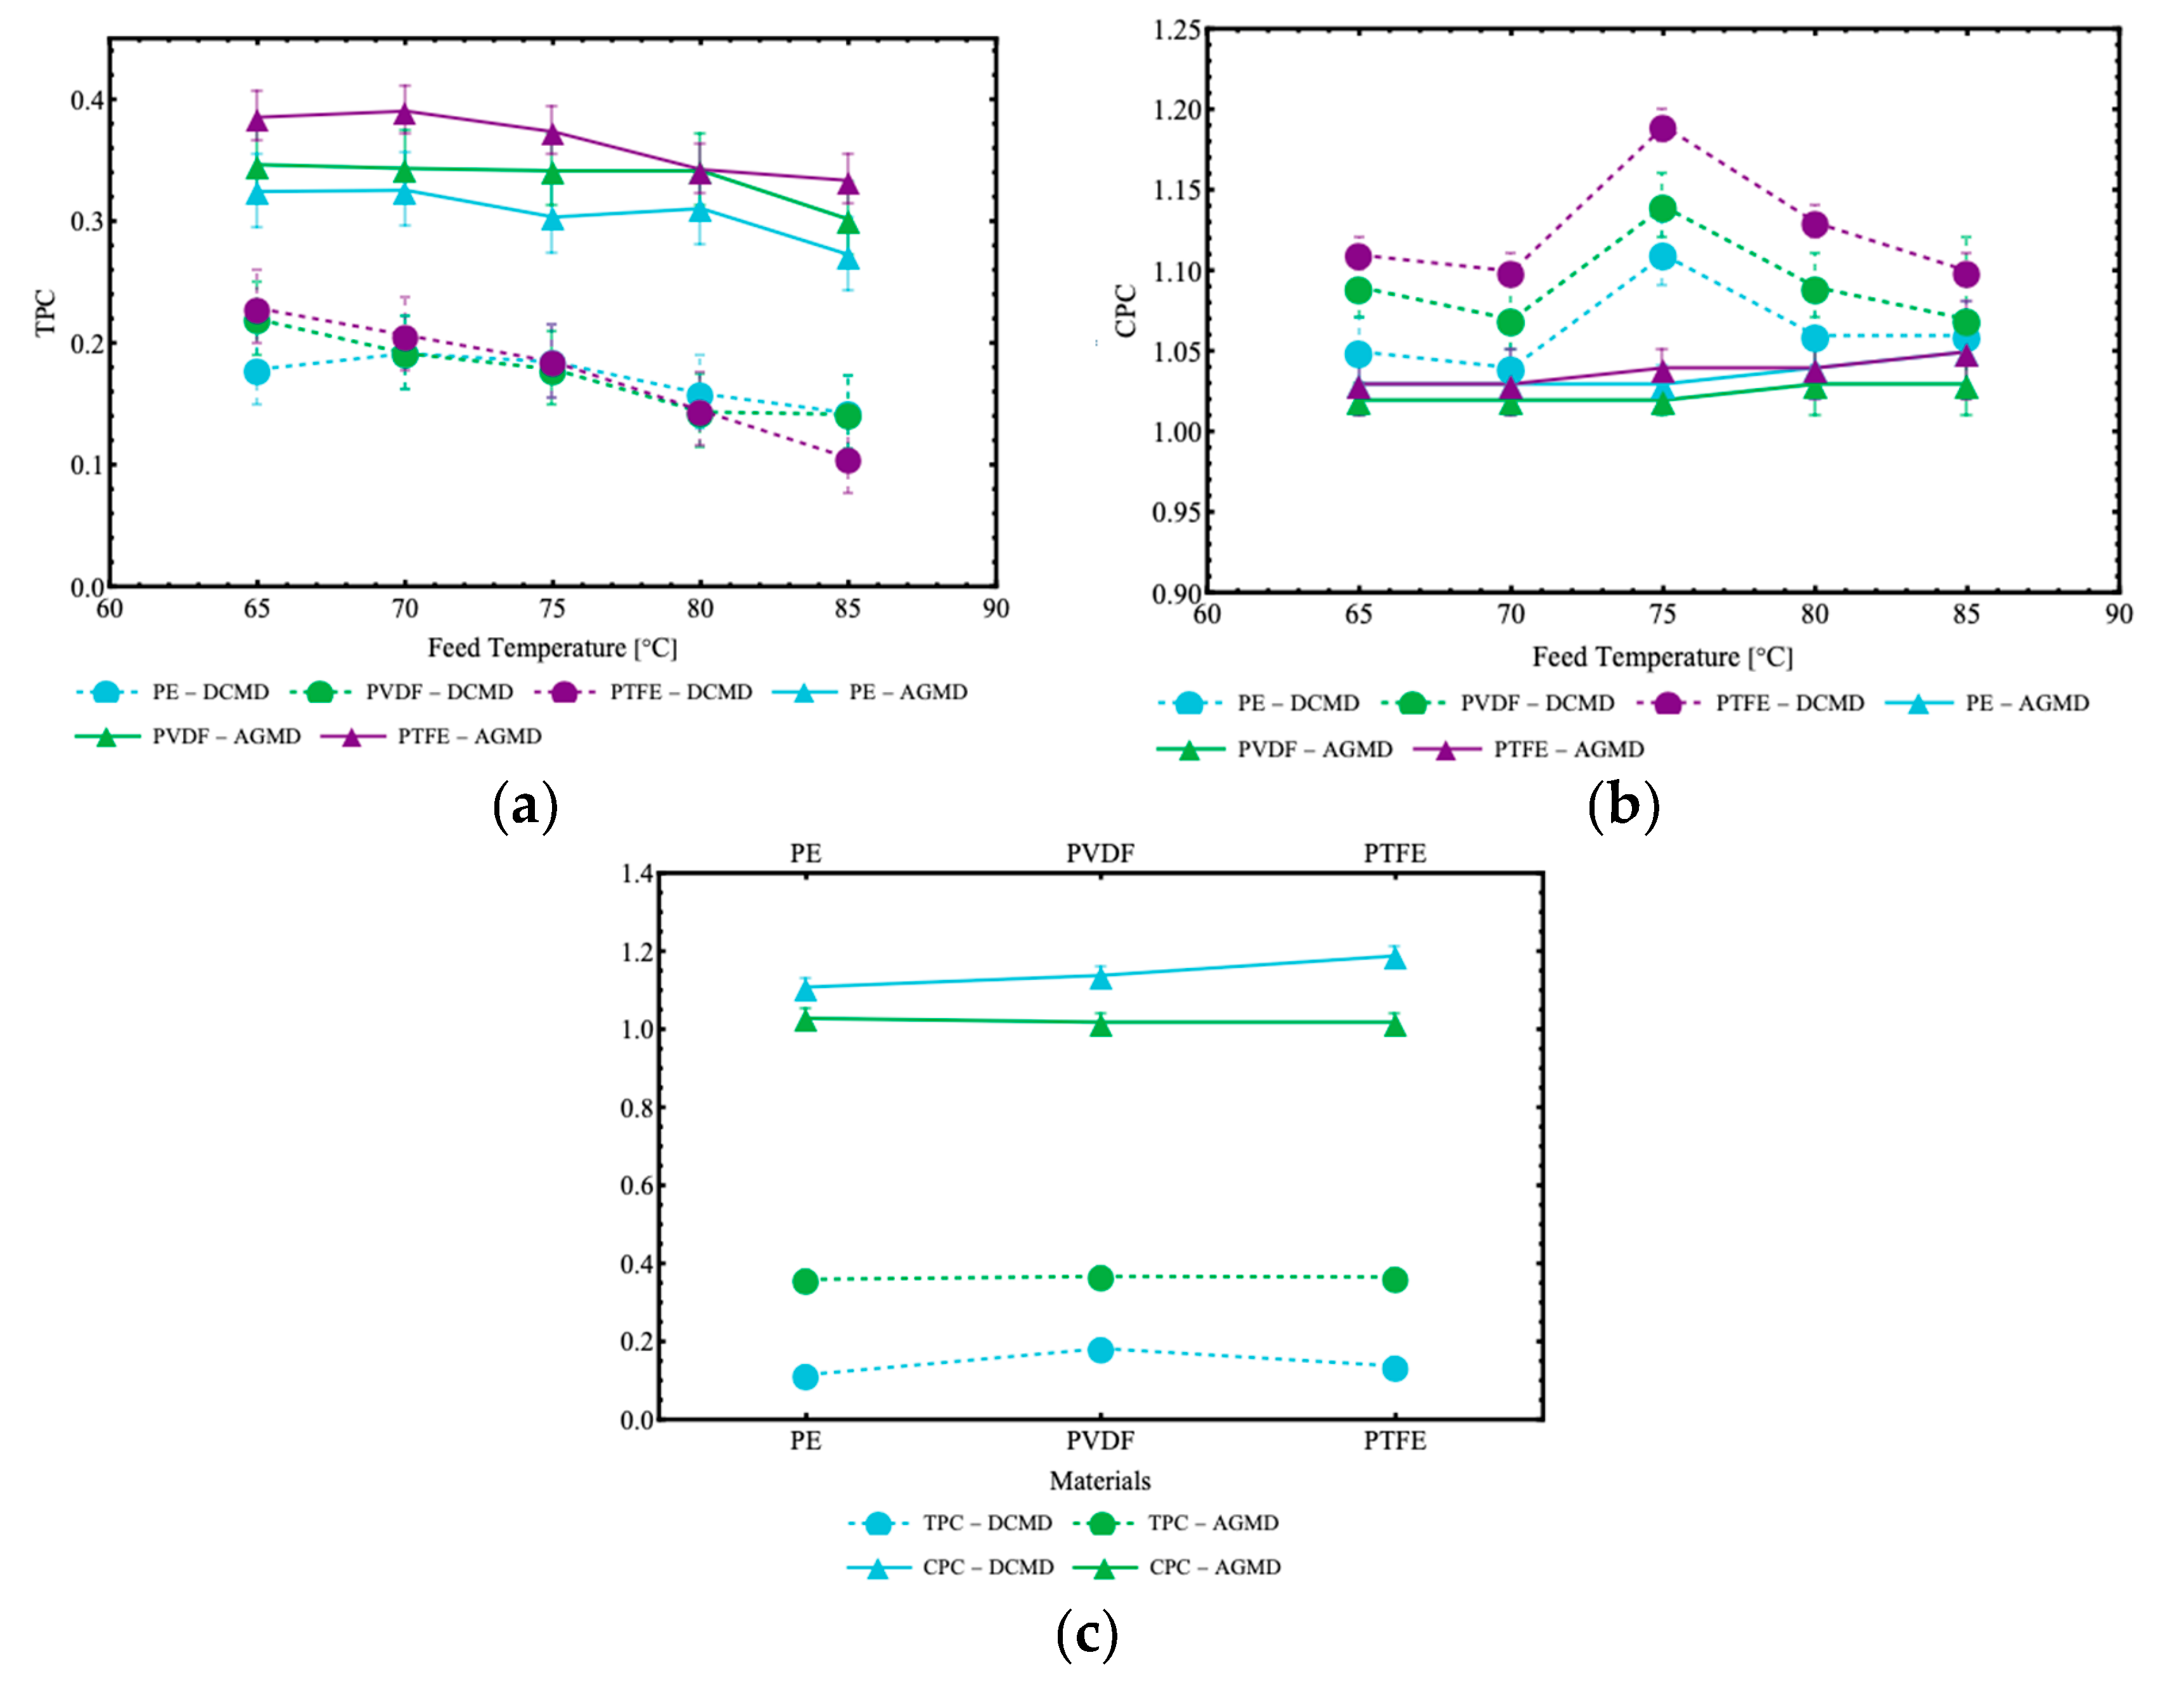
Figure 12.
Comparison of energy efficiency parameters (a) GOR; (b) SEC and (c) TE, in DCMD and AGMD configurations for different types of membranes. CNaCl = 70g/L; Vp = 0.5L/min.
Figure 12.
Comparison of energy efficiency parameters (a) GOR; (b) SEC and (c) TE, in DCMD and AGMD configurations for different types of membranes. CNaCl = 70g/L; Vp = 0.5L/min.
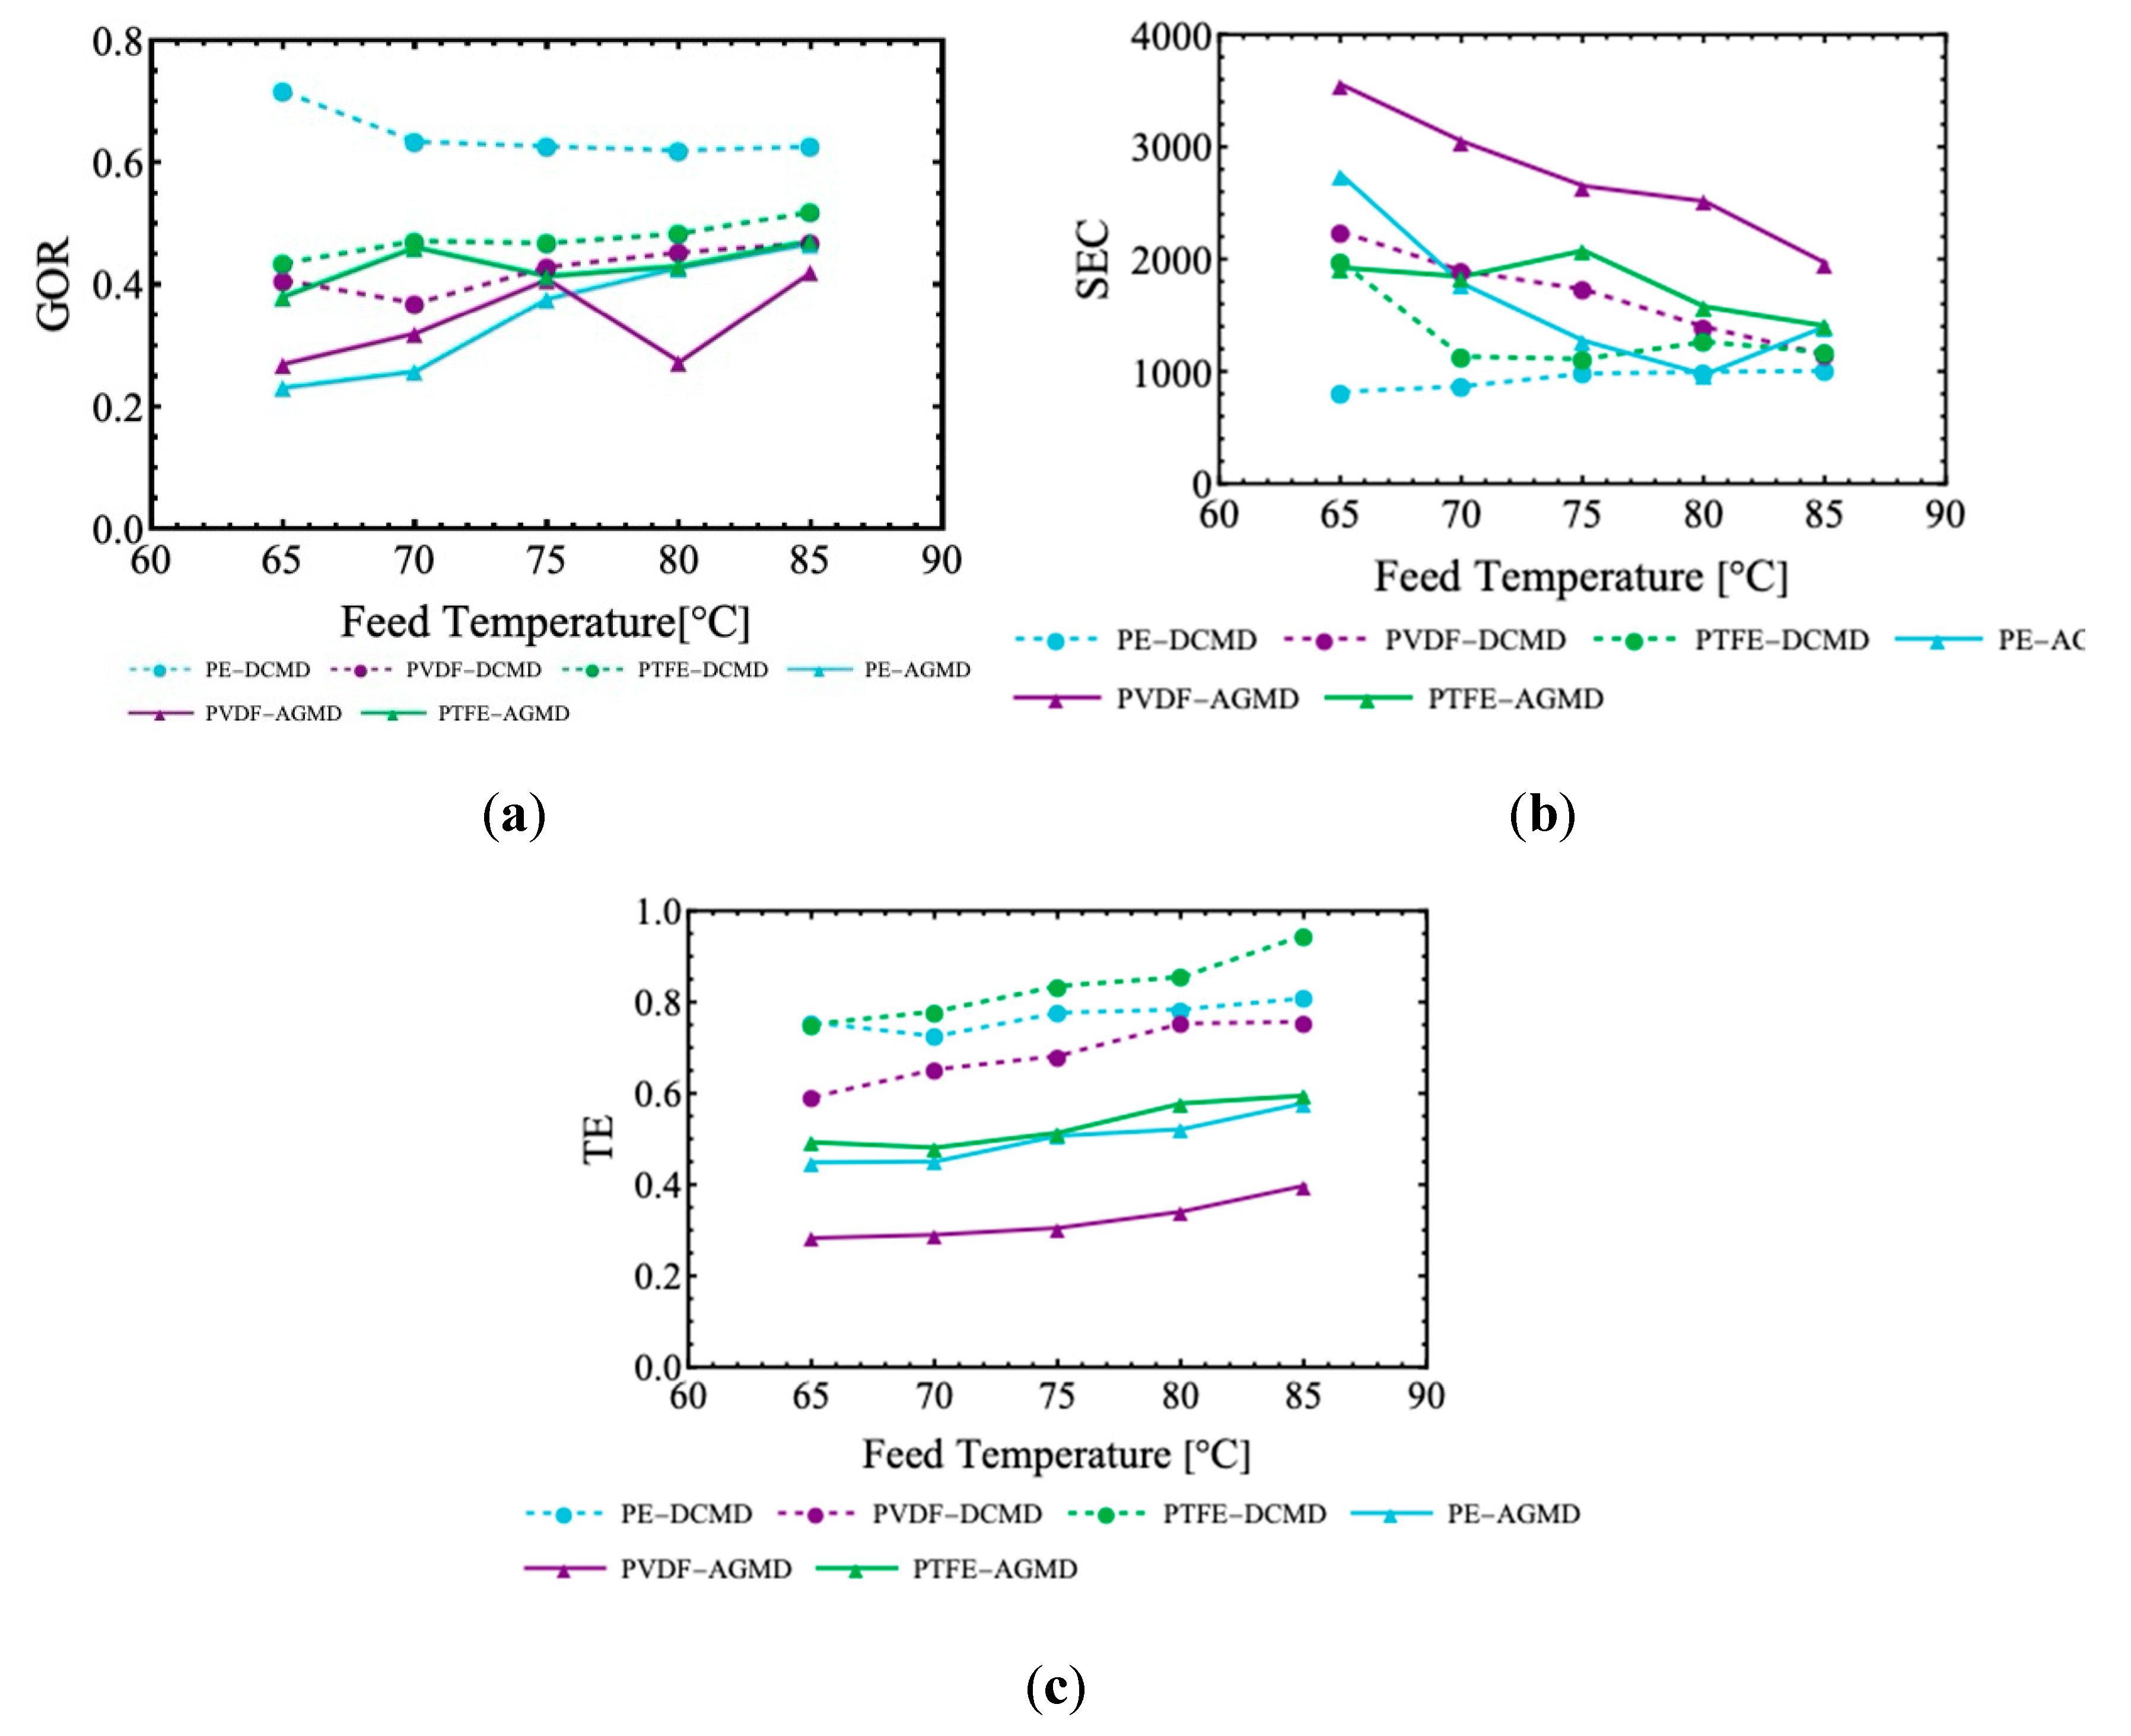
Figure 13.
Comparison between experimental permeate fluxes and those predicted by the mathematical models for the DCMD and AGMD configurations with different membranes (PE, PVDF and PTFE) at NaCl concentrations of 7, 35 and 70 g/L and flow rates of 0.2, 0.5, and 0.8 L/min: a)DCMD-PE; b)AGMD-PE; c)DCMD-PVDF; d)AGMD-PVDF; e)DCMD-PTFE; f)AGMD-PTFE.
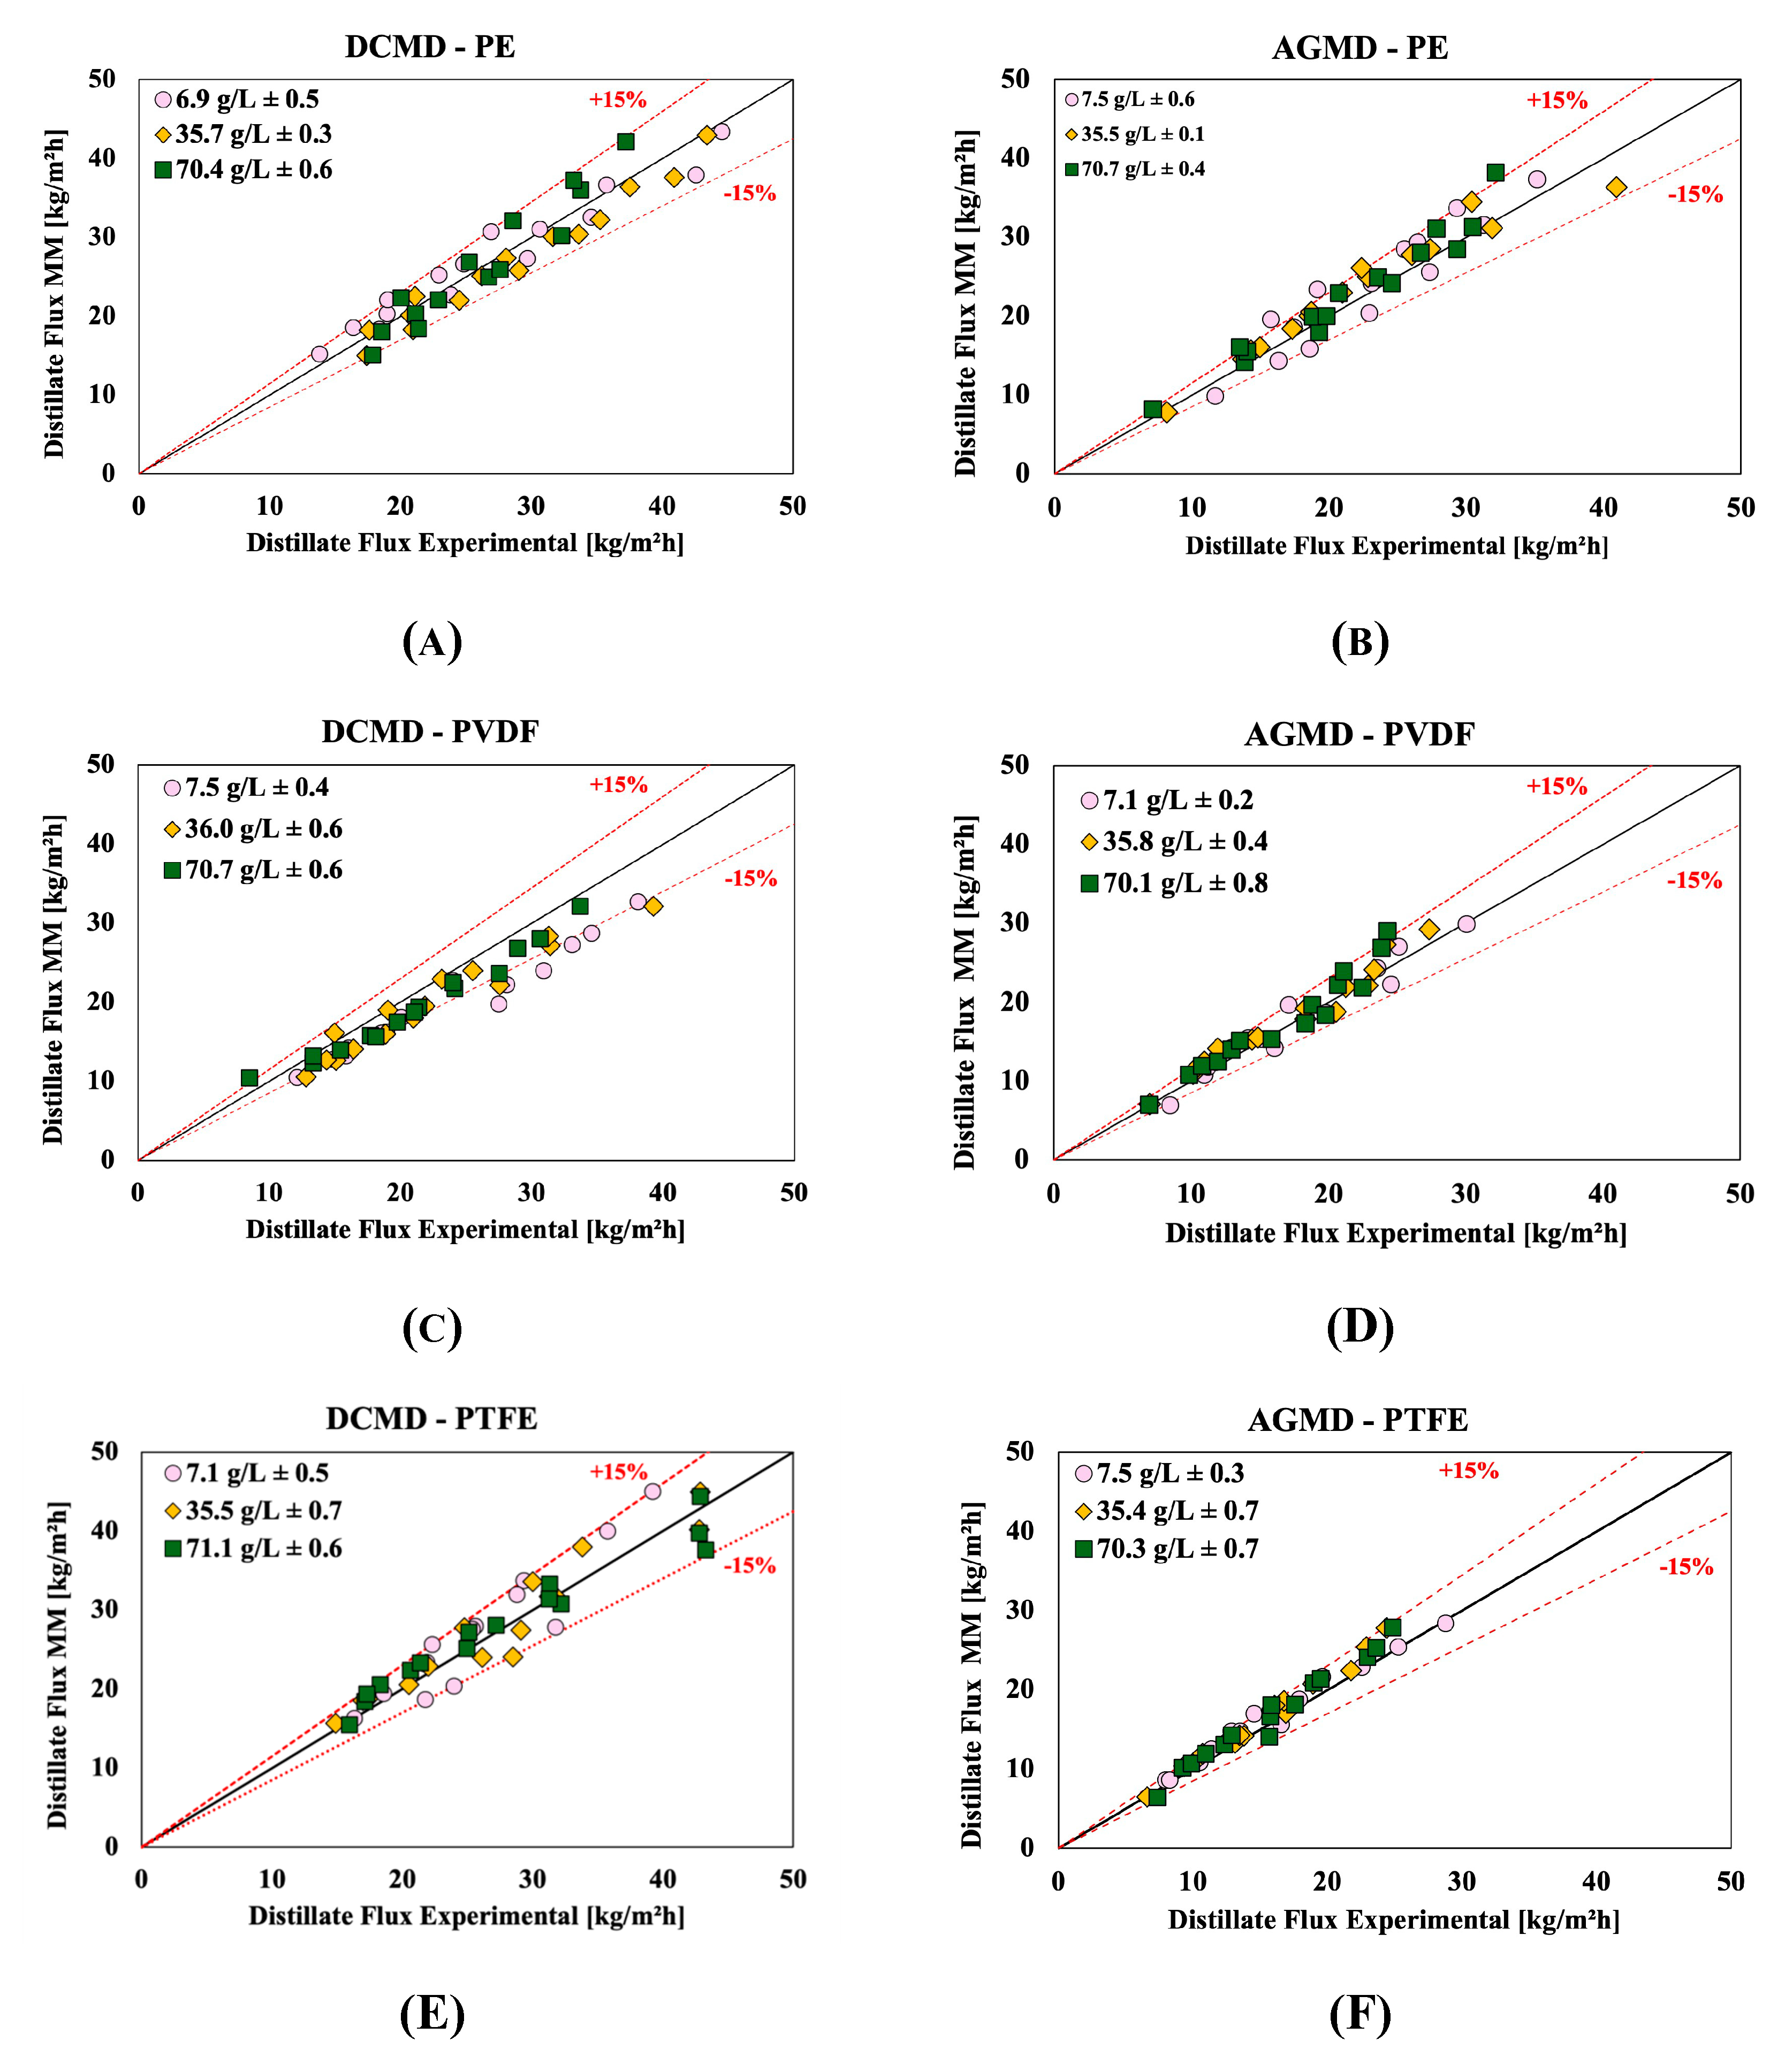

Table 1.
Physical Properties of Hydrophobic Membranes.
| Units | M1 | M2 | M3 | |
|---|---|---|---|---|
| Membrane Material | - | Polyvinylidene fluoride | Polytetrafluoroethylene | Polyethylene |
| Support layer material | - | - | High Density polyethylene (HDPE) | - |
| Membrane Thickness | μm | 125 | 150 | 110 |
| Average Pore Size | μm | 0.22 | 0.22 | 0.32 |
| Porosity | % | 75 | 85 | 85 |
| Water contact angle | 128.2° (±2%) |
143,4 (±2%) |
99.5° (±2%) |
|
| Water Entry Pressure | bar | 8.09 | 3.68 | 2.38 |
Table 2.
Operating Parameters for the Experimental Desalination Setup.
| Component | Unit | Values |
|---|---|---|
| Feed Tank | L | 5 |
| Permeate Tank | L | 5 |
| Feed Temperature | 65 – 85 | |
| Permeate Temperature | 32.5 | |
| Feed flow rate | L/min | 0.2 – 0.8 |
| Permeate flow rate | L/min | 0.5 |
| Feed Concentrate | g/L | 7 – 70 |
Disclaimer/Publisher’s Note: The statements, opinions and data contained in all publications are solely those of the individual author(s) and contributor(s) and not of MDPI and/or the editor(s). MDPI and/or the editor(s) disclaim responsibility for any injury to people or property resulting from any ideas, methods, instructions or products referred to in the content. |
© 2024 by the authors. Licensee MDPI, Basel, Switzerland. This article is an open access article distributed under the terms and conditions of the Creative Commons Attribution (CC BY) license (http://creativecommons.org/licenses/by/4.0/).
Copyright: This open access article is published under a Creative Commons CC BY 4.0 license, which permit the free download, distribution, and reuse, provided that the author and preprint are cited in any reuse.


