Submitted:
22 December 2024
Posted:
23 December 2024
You are already at the latest version
Abstract
Background: Eating disorders have previously been associated with renal impairment. Low muscle mass reduces serum creatinine used for calculation of the estimated glomerular filtration rate (eGFR) leading to overestimation of renal function.
The objectives of our study were:
• To investigate the percentage drop in creatinine (pdCr) during rehydration as a new indicator of renal dysfunction not dependent on muscle mass.
• To investigate a correlation of cardiovascular function and fluid management with renal function.
Methods: In a 5-year retrospective cohort study of all consecutive children admitted because of an eating disorder renal function expressed as eGFR on admission and as pdCr between admission and the lowest creatinine was analysed in relationship to cardiovascular parameters and fluid management.
Results: We included 29 patients. Mean age was 13.4 years. A pdCr after admission was noted in 26/29 (89.7%). The eGFR was 90 in 13/15 (86.6%). In patients with a fluid management plan the pdCr had a median of 18.6% and without of 6.4% (p=0.02). Renal dysfunction was not related to cardiovascular parameters.
Conclusions: The majority of patients with an eating disorder had renal impairment. PdCr was more sensitive in detection of renal impairment compared to eGFR.
Keywords:
Dehydration
; anorexia nervosa
; percentage drop in creatinine
; GFR
; eating disorders
1. Introduction
Impairment of kidney function can be detected by relating the blood levels of creatinine, a substance produced by muscle tissue and passing freely through the kidney into urine, to an age related reference range. An elevation of creatinine above this normal range indicates an inability of the kidneys to let this substance pass into urine indicating impairment of kidney function. People who are taller have on average a greater muscle mass and it is therefore required to adjust the creatinine level for body height using a formula (see method section below) arriving at a glomerular filtration rate (GFR). A retrospective analysis of the estimated glomerular filtration rate (eGFR) results of 111 patients in hospital with a severe eating disorder found impaired renal function in 33% [1]. Another study of hospitalized adolescent patients with severe malnutrition found 72% had impaired kidney function, including 59% with mild impairment as evident from an eGFR of between 89 and 60 mL/min, 12% with moderate impairment (eGFR between 59 and 45 mL/min) and 2% with severe impairment (eGFR between 44 and 30 mL/min) [2]. Risk factors for renal impairment identified in those studies included: low body mass index (BMI), dehydration, rhabdomyolysis, nephrocalcinosis, bradycardia, hypophosphatemia and hypokalemia [3]. According to a further study patients (predominantly adults) with anorexia nervosa (n=2091) had, compared to controls, a significantly higher risk of acute dialysis (adjusted hazard ratio 2.10 [95% confidence interval 1.19-3.68]), nephritis, acute renal failure, and chronic renal failure [4]. This highlights the importance of early detection of renal impairment in patients with eating disorders to prevent severe and chronic renal failure.
These studies used creatinine for calculation of GFR and hence definition of reduction of renal impairment. Creatinine is derived from muscle or dietary intake of muscle protein and will therefore overestimate GFR in patients with eating disorder due to their low muscle mass and low protein intake [5] similarly to patients with neurodisability related muscle wasting [6]. Other markers like cystatin C and radionuclide based determination of GFR, which are not significantly affected by muscle mass or muscle protein intake, were found not to accurately reflect GFR in patients with eating disorders [7,8]. It is therefore pivotal to enable personalized medicine to find a tool which can detect renal impairment in the individual patient which is not reliant on reference ranges obtained in patients without muscle wasting and becomes like single measurement of creatinine inaccurate as dependence on muscle mass is not taken into account. A more accurate tool for detection of dehydration related renal impairment enables a targeting of fluid intake for the individual patient thus fulfilling the goals of personalized or precision medicine.
1.1. Objectives
- To investigate the percentage drop in creatinine during nutritional rehabilitation and rehydration as a new indicator of renal dysfunction not dependent on muscle mass for assessing renal dysfunction in patient with eating disorders.
- To compare results of creatinine based GFR estimation on admission with percentage drop in creatinine as a marker of renal dysfunction.
- ∙ To investigate the cause of renal dysfunction as evident from percentage drop in creatinine by correlation of this drop with Z-score centile of body weight, heart rate on admission, systolic and diastolic blood pressure centile, haematocrit and sodium level on admission.
2. Methods
In this retrospective cohort study we investigated renal function in all children admitted consecutively because of an eating disorder to a paediatric unit during a 5-year period. The classification of the eating disorder followed DSM-5. This project was certified by the Health Research Authority of the United Kingdom that it did not require approval by a local research ethics committee as it was an audit project for assessment of service provision for patients with eating disorders admitted to hospital [9]. The project was registered as audit project with the Clinical Quality and Governance Department of the Luton & Dunstable University Hospital. Patient consent was not required due to anonymous retrospective case record review for audit purposes. Renal function was expressed as eGFR and the novel marker percentage drop in creatinine. Renal function was expressed as eGFR using the modified bedside Schwartz method: estimated glomerular filtration rate (mL/minute/1.73 m2)= 35 x height (cm)/serum creatinine (micromol/litre) from creatinine on admission [10]. Percentage drop in creatinine was calculated from the percentage drop of creatinine from admission to the lowest creatinine on daily monitoring. Daily monitoring was for all patients set for one week by the lead clinician for eating disorders as local protocol to detect any features of refeeding syndrome. It included measurement of sodium, potassium, urea, creatinine, phosphate, magnesium, alanine aminotransferase, haemoglobin, haematocrit, white cell count, platelet count and blood gas analysis. The method used for measurement of creatinine was the enzymatic method on the Roche C702 module on the Cobas 8000 analyser. In patients where there were further creatinine measurements available from follow up after the ward admission these were included in the analysis. This percentage drop in creatinine was correlated with eGFR and physical parameters including Z-score centile for body weight (using a calculator based on Centre for Disease Control, Atlanta, USA data (https://www.msdmanuals.com/en-gb/professional/multimedia/clinical-calculator/cdc-weight-for-age-percentiles), heart rate, systolic and diastolic blood pressure centile and postural drop in blood pressure. We compared percentage drop in creatinine in patients with and without symptoms of cardiovascular instability like fainting and dizziness. If the percentage drop in creatinine was related to dehydration more intensive fluid management should lead to a greater drop in creatinine. We therefore compared the drop in creatinine in patients with and without fluid management plan on admission. In patients with a fluid management plan on admission it was planned to administer 45 ml/kg/day (SD 8.5) of oral or intravenous fluids. We regarded an association of percentage drop of creatinine with active rehydration as confirmation of the percentage drop in creatinine being due to resolution of dehydration induced renal impairment.
The severity of renal impairment was classified following the National Kidney Foundation’s Kidney Disease Outcomes Quality Initiative clinical practice guidelines for chronic kidney disease in children and adolescents (See Table 1) [11].
2.1. Statistical Analysis
Because of the right skewed distribution of data for creatinine change during admission and body weight Z-score centile we used non-parametric data analyses including medians and Mann-Whitney U test for comparison of continuous data and Spearman’s rho for correlation analyses. P-values were reported in their two-tailed version and a p-value of less than 0.05 taken as indicative of a statistically significant low probability of an erroneous rejection of the null hypothesis. The statistical software used was SPSS version 29 (IBM).
3. Results:
We included 29 patients out of which 27 were female and 23 had a diagnosis of anorexia nervosa, 5 unspecified Feeding or Eating Disorder and one avoidant/restrictive food intake disorder. The mean age was 13.4 years (range 4 to 16 years) and the admission Z-score centile for bodyweight for age had a median of 36.7 (range 0.1 to 94.6). BMI on admission had a median of 17.4 (range 12.3 to 26.6) and BMI centiles (UK and WHO data sets underlying the BMI centile charts) had a median of 25 (range <0.01 to 91). Duration of illness where recorded before admission had a median of 6.0 months (range 0.25 months to 60 months) and weight loss, where recorded before admission had a median of 8.2 kg (range 0-30kg). The lowest creatinine, which was used to calculate the percentage drop in creatinine compared to admission and the lowest estimated GFR was identified at a mean of 5.7 days (range 2 to 17) after admission.
A percentage drop in creatinine after admission was noted in 26/29 (89.7%). The eGFR which could be calculated in 23 patients on admission was <90 in 15 (65%) and improved to >90 in 13/15 (86.6%) during hospital treatment. The severity of renal impairment was mild in 14 and moderate in one patient. In the patients where the eGFR did not normalize, it improved in one patient from 63 to 85 during the admission and was normal at 94 on follow up. In the other patient, it improved from 77 to 89 during the admission, and follow up data was unavailable as the patient was subsequently cared for at another hospital.
In patients with a normal eGFR of >90 on admission (n=9), 3 (33%) had no drop in creatinine on subsequent measurements during nutritional rehabilitation, and six had a drop in creatinine of 1.8, 3.1, 7.0, 11,5, 14.2 and 30.0% respectively. All patients with a reduced GFR on admission also had a drop in creatinine after admission. In Figure 1 we plotted eGFR versus percentage drop in creatinine. There was a highly significant negative correlation between percentage drop in creatinine and eGFR (r=- 0.58, p=0.003).
Two of the patients had hypokalemia on admission (6.9%): One of 1.8 and 1.9 mmol/l respectively with the latter also being the only patient with low phosphate of 0.68 mmol/l on admission. In both patients the low potassium was due to vomiting induced metabolic alkalosis and the eGFR on admission was 80 and 88 respectively and normalized on intravenous fluid management. None of the patients had hyponatremia or features of rhabdomyolysis.
3.1. Percentage Drop in Creatinine, Laboratory Parameters Which May Be Altered in Dehydration and Relation to Fluid Management
To investigate whether the percentage drop in creatinine was related to admission haematocrit level or sodium levels, which are parameters with may be elevated in dehydration due to a restriction in water intake we performed correlation analyses. Neither parameter was significantly correlated with percentage drop in creatinine with haematocrit: Correlation coefficient -0.24, p=0.21 and sodium: correlation coefficient -0.26, p=0.16.
In patients with a fluid management plan on admission (n=20) the percentage creatinine drop had a median of 18.6%. Without such a plan (n=8) it was 6.4% (p=0.02) (See Figure 2).
3.2. Percentage Drop in Creatinine and Features of Cardiovascular Compromise on Admission
We compared the percentage drop in creatinine in patients with and without a history of fainting and/or dizzy spells before admission and found no difference (median of 18.6 (range 4 to 39) % with versus 15.6 (range 2 to 41) % without).
We performed a correlation analysis of heart rate, systolic and diastolic blood pressure centiles and systolic or diastolic blood pressure drop on orthostasis with creatinine drop and there was no significant correlation of those cardiovascular parameters with creatinine drop after admission. (all p>0.2). eGFR was also not significantly correlated to heart rate on admission.
There was a significant correlation between systolic (r=0.69, p<0.001) and diastolic (r=0.60, p=0.003) blood pressure centiles and heart rate on admission.
3.3. Nutritional Status and Parameters of Renal Dysfunction on Admission
There was no significant correlation of body weight Z-score percentile on admission and creatinine drop: r=-0.09, p=0.64. eGFR was equally not correlated with body weight Z-score percentile: r=0.26, p=0.22.
4. Discussion:
Our study demonstrated that the percentage drop in creatinine during nutritional rehabilitation is a parameter of renal dysfunction more sensitive than eGFR. An apparently normal eGFR does not rule out significant renal dysfunction in this population of underweight children with an eating disorder because of the reduced muscle mass leading to an overestimation of eGFR (see introduction). The percentage drop was most likely due to rehydration as fluid management was significantly associated with this drop in creatinine. There was no evidence to support alternative explanations like nutritional status and cardiovascular compromise as causes of the renal impairment observed. The findings are therefore consistent with the percentage drop in creatinine reflecting dehydration induced renal impairment on admission. Using the percentage creatinine drop for detection of dehydration induced renal impairment detected more children with significant dehydration. This approach enables therefore more personalized fluid management of patients in the long term. The lack of correlation of percentage drop in creatinine with haematocrit values ruled out an influence of haemo-concentration of the initial blood sample and supports the presence of genuine renal dysfunction in patients with a drop in creatinine.
The lack of a correlation of cardiovascular parameters with the renal dysfunction we detected suggests that dehydration was not a cause of cardiovascular compromise. Bradycardia associated reduced cardiac output appeared to be the cause of a lowering of blood pressures observed. Our findings are is in keeping with a recent retrospective study which found no difference in BMI in patients with abnormally low eGFR and is in contrast to the finding that there was a significant positive correlation of heart rate on admission and eGFR [12].
In a previous retrospective study it was noted that among those with admission eGFR <90, in 20/37 (54%) this improved to 90 ml/minute/1.73 m2 or more prior to discharge [1]. Our result of a greater percentage of 86.6% of patients with normalisation of GFR may indicate that our children, who were likely on average younger had a shorter duration of physical impairment including dehydration leading to a more rapid resolution of renal impairment or our proactive fluid management strategy provided for the majority (69%) enabled a more rapid and complete restoration of renal function.
Short comings of using percentage creatinine drop as assessment of dehydration induced renal impairment include that as opposed to eGFR, which could in our study, even with reduced muscle mass in our population, detect renal impairment in the majority using a single creatinine measurement on admission, the percentage drop in creatinine required repeat measurement days later. The percentage drop in creatinine may in addition still have underestimated the degree of renal impairment as a rehydration induced reduction in creatinine may have been less in patients with significantly increased muscle protein intake provided during nutritional rehabilitation.
The percentage drop in creatinine can guide long term management by identification of otherwise undetected fluid restriction as part of the pathology of the eating disorder of the individual patient. This will help in communication with the patient and highlights the importance of focusing on individually adequate fluid intake which for all children in this study would have been at least 2 liters per day [13]. It is known that adequate water intake reduces via reduction of vasopressin release the release of adrenocorticotropic hormone and therefore cortisol with its psychotropic effects, which include increased anxiety and low mood. Increased water intake can therefore reduce anxiety and low mood [13].
Future research can use the percentage drop in creatinine as outcome measure of interventions on admission to improve fluid intake. To get a better impression of the acute status of hydration one could investigate urine osmolality on admission as a very short term measure of hydration status and relate this to the percentage drop in creatinine. Such an investigation needs to be complemented by analysis of a detailed fluid intake diary in prospective studies. Such a diary should become part of routine long term care of patients with eating disorders.
5. Conclusions
The majority of patients with an eating disorder had renal impairment. PdCr was more sensitive in detection of renal impairment compared to eGFR.
Author Contributions
Conceptualization, MH and ME.; methodology, MH and ME; software, ME.; validation, ME.; formal analysis, MH and ME.; investigation, MH and ME resources, MH and ME.; data curation, MH and ME.; writing—original draft preparation, ME writing—review and editing, MH and ME.; visualization, ME.; supervision, ME.; project administration, ME.; funding acquisition, Not applicable. All authors have read and agreed to the published version of the manuscript.
Funding
This research received no external funding.
Institutional Review Board Statement
This project was certified by the Health Research Authority of the United Kingdom that it did not require approval by a local research ethics committee as it was an audit project for assessment of service provision for patients with eating disorders admitted to hospital. The project was registered as audit project with the Clinical Quality and Governance Department of the Luton & Dunstable University Hospital.
Informed Consent Statement
Patient consent was waived due to anonymous retrospective case record review for audit purposes.
Data Availability Statement
The data that support the findings of this study are available on request from the corresponding author. The data are not publicly available due to privacy or ethical restrictions.
Conflicts of Interest
The authors declare no conflicts of interest.
References
- Downey, A.E., Cheng, J., Adams, S.H., Buckelew, S.M., Kapphahn, C.J., Machen, V.I., Rosen E.L., Moscicki A.B., Golden N.H., Garber A.K. Renal Function in Patients Hospitalized With Anorexia Nervosa Undergoing Refeeding: Findings From the Study of Refeeding to Optimize Inpatient Gains. J Adolesc Health 2022, 71,432-437. [CrossRef]
- Riva, A., Pigni, M., Nacinovich, R. Renal dysfunctions and clinical correlates in adolescents with restrictive anorexia nervosa. Clin Nutr ESPEN 2021, 43, 230-234. [CrossRef]
- Cavoli, G. L., Mulè, G., Rotolo, U. Renal involvement in psychological eating disorders. Nephron Clin Pract 2011,119(4),c338-341. [CrossRef]
- Tseng, M.M., Chien, L.N., Tu, C.Y., Zheng, C.M., Liu, H.Y. Risk of dialysis and renal diseases in patients with anorexia nervosa in Taiwan. Int J Eat Disord 2023, 56(5), 991-1000. [CrossRef]
- Puckett, L. Renal and electrolyte complications in eating disorders: a comprehensive review. J Eat Disord 2023, 11(1),26. [CrossRef]
- Lim, C., Phillips, M., Watson, L., Eisenhut, M. Neurodisability with Severe Restriction of Mobility Is Associated with Reduced Serum Creatinine Values. Int J Pediatr 2019, Jun 16,3598123. [CrossRef]
- Nautiyal, A., Mukherjee, A., Mitra, D., Chatterjee, P., Roy, A. Impact of body mass index on gates method of glomerular fltration rate estimation: a comparative study with single plasma sample method. Indian J Nucl Med 2019,34,19–23.
- Trahan, C., Lapeyraque, A.L., Sznajder, M., Frappier, J.Y., Jamoulle, O., Taddeo, D., Stheneur C. In malnourished adolescent with anorexia nervosa, Cockroft–Gault formula is the most relevant formula to estimate renal function. Clin Nutr 2020., 39(6),1914–1918.
- HRA(2022) Available online:www.hradecisiontools.org.uk/research/docs/DefiningResearchTable_Oct2022.pdf.(accessed on 10.12.2024).
- Schwartz, G.J., Muñoz, A., Schneider, M.F., Mak, R.H., Kaskel, F., Warady, B.A., Furth, S.L. New equations to estimate GFR in children with CKD. J Am Soc Nephrol 2009, 20(3),629-637. [CrossRef]
- Hogg, R.J., Furth, S., Lemley, K.V., Portman, R., Schwartz, G.J., Coresh, J., Balk, E., Lau, J., Levin, A., Kausz, A.T., Eknoyan, G., Levey, A.S. National Kidney Foundation's Kidney Disease Outcomes Quality Initiative. National Kidney Foundation's Kidney Disease Outcomes Quality Initiative clinical practice guidelines for chronic kidney disease in children and adolescents: evaluation, classification, and stratification. Pediatrics 2003,111,1416-1421.
- Gurevich, E., Steiling, S., Landau, D. Incidence of Impaired Kidney Function Among Adolescent Patients Hospitalized With Anorexia Nervosa. JAMA Netw Open 2021, 4(11), e2134908 . [CrossRef]
- Eisenhut, M. Water for prevention and treatment of illness. 2022 1st edition Oct., Publisher: Amazon ISBN-13 979-8358888623.
Figure 1.
Scatter plot of eGFR in mL/min/1.73 m2 versus percentage drop in creatinine (%).
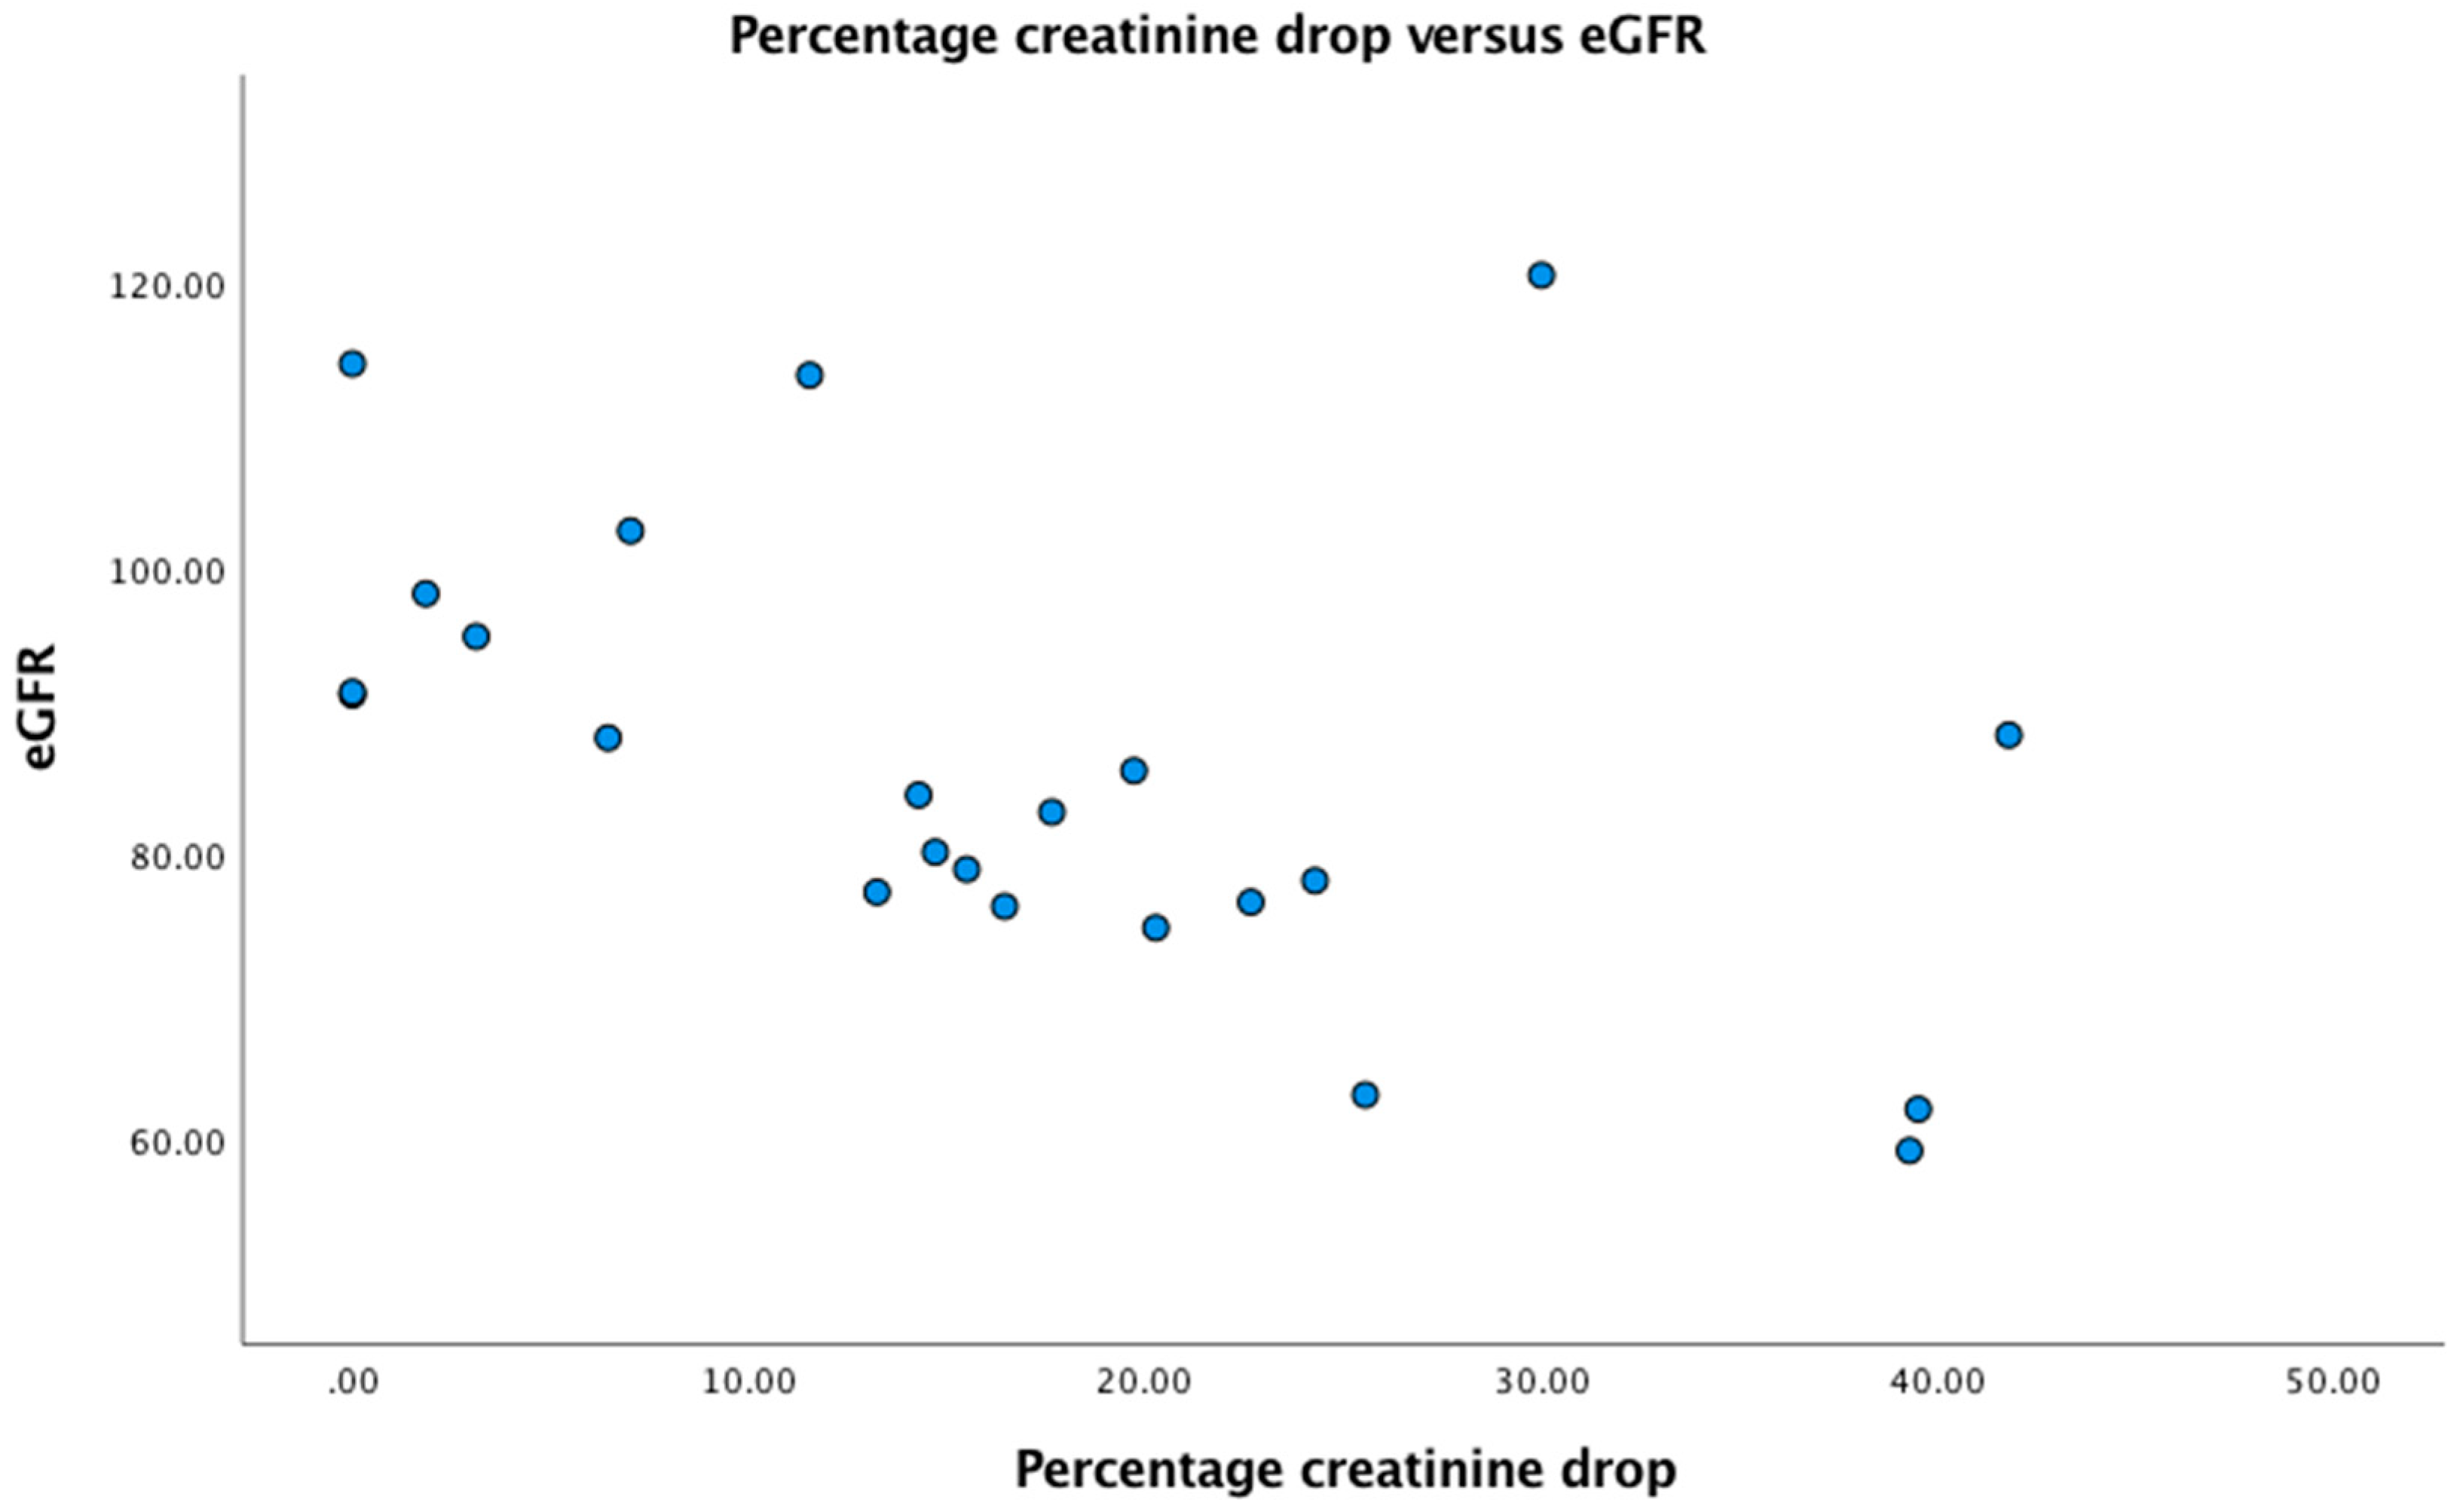
Figure 2.
Percentage drop in creatinine and presence of fluid management plan on admission (bar inside the box =median, box=interquartile range, whiskers=outliers).
Figure 2.
Percentage drop in creatinine and presence of fluid management plan on admission (bar inside the box =median, box=interquartile range, whiskers=outliers).
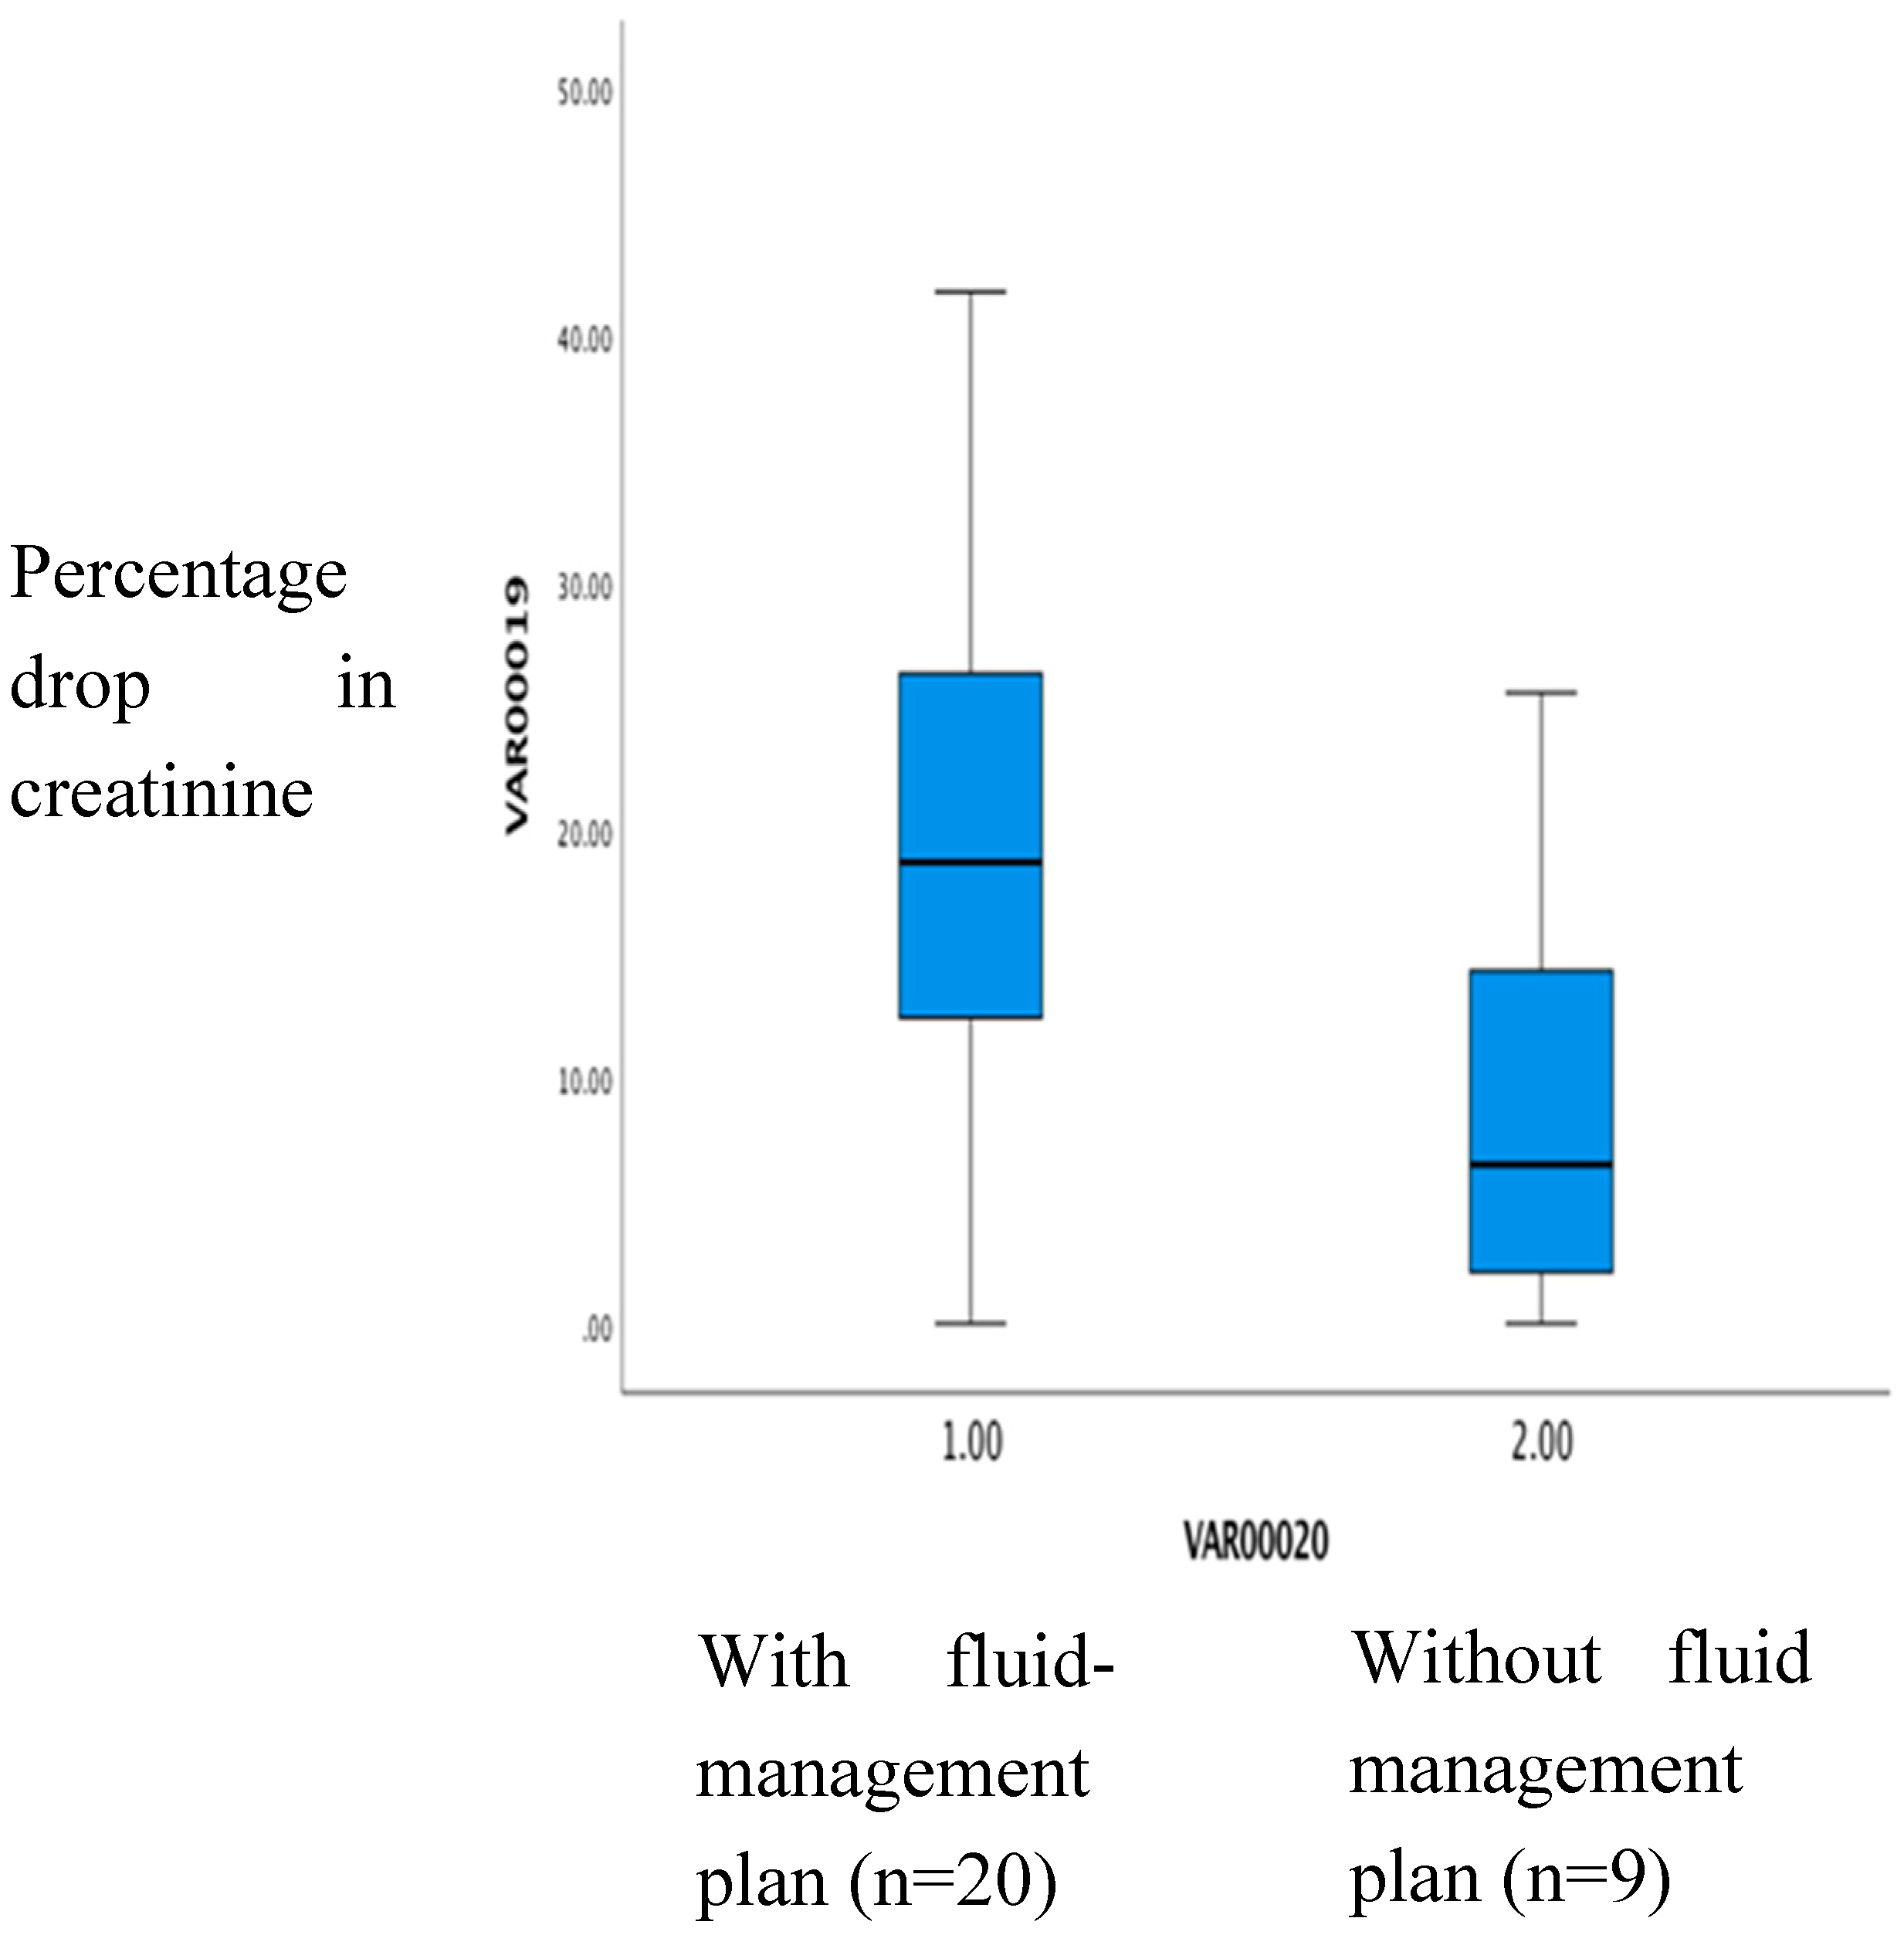

Table 1.
Classification of stages of chronic kidney disease (National Kidney Foundation’s Kidney Disease Outcomes Quality Initiative).
Table 1.
Classification of stages of chronic kidney disease (National Kidney Foundation’s Kidney Disease Outcomes Quality Initiative).
| Stage | GFR (mL/min/1.73 m2) | Description |
|---|---|---|
| 1 | >/= 90 | Kidney damage with normal or increased GFR |
| 2 | 60-89 | Kidney damage with mild reduction of GFR |
| 3 | 30-59 | Moderate reduction of GFR |
| 4 | 15-29 | Severe reduction of GFR |
| 5 | <15 or dialysis | Kidney failure |
Disclaimer/Publisher’s Note: The statements, opinions and data contained in all publications are solely those of the individual author(s) and contributor(s) and not of MDPI and/or the editor(s). MDPI and/or the editor(s) disclaim responsibility for any injury to people or property resulting from any ideas, methods, instructions or products referred to in the content. |
© 2024 by the authors. Licensee MDPI, Basel, Switzerland. This article is an open access article distributed under the terms and conditions of the Creative Commons Attribution (CC BY) license (http://creativecommons.org/licenses/by/4.0/).
Copyright: This open access article is published under a Creative Commons CC BY 4.0 license, which permit the free download, distribution, and reuse, provided that the author and preprint are cited in any reuse.


