Preprint
Article

This version is not peer-reviewed.

Bariatric Surgery as a Molecular Modulator: The Role of FSHR Polymorphisms in Enhancing eNOS Expression and Reproductive Hormone Dynamics in Women with Severe Obesity

A peer-reviewed article of this preprint also exists.

Submitted:

12 December 2024

Posted:

20 December 2024

You are already at the latest version

Abstract

This study examines the effects of bariatric surgery on women with severe obesity (BMI > 40 kg/m²), with a focus on eNOS expression and reproductive hormone modulation across follicle-stimulating hormone receptor (FSHR) polymorphism groups. Among 29 patients, significant increases in eNOS expression after surgery were seen across all polymorphism groups (p < 0.0001), with the Ser/Ser group demonstrating the most heterogeneity. Pre-surgery, the Ser/Ser group had significantly higher FSH levels (7.41 ± 0.60 mIU/mL) than the Asn/Asn group (5.20 ± 0.63 mIU/mL, p < 0.001). After surgery, FSH levels were higher in the Ser/Ser group (9.45 ± 0.87 mIU/mL), with significant differences between Ser/Ser and Asn/Ser groups (mean difference = 0.97, p = 0.019). SHBG levels showed a strong negative connection with eNOS expression after surgery (r = -0.365, p = 0.049), while ovarian reserve markers like AMH and AFC were consistent between polymorphism groups. BMI reduction was consistent across groups, with an average decrease of 15.2 ± 1.8 kg six months after surgery. These findings underscore the dual function of bariatric surgery in improving vascular health and regulating reproductive hormones, particularly in patients with the Ser/Ser genotype. The findings highlight the potential for combining genetic testing with surgical intervention to customize infertility treatment in obese women.

Keywords: 
;  ;  ;  ;  ;  

1. Introduction

Obesity is a complicated metabolic disorder with far-reaching consequences for overall health and reproductive function, particularly in women. In the United States alone, more than 30% of the population is obese, with similar increases reported elsewhere, particularly in developed nations [1,2,3]. Obesity, caused by dietary and lifestyle changes such as excessive sugary beverage consumption and prolonged sedentary activity, is currently the second biggest cause of preventable mortality after smoking [4,5,6]. Obesity, caused by dietary and lifestyle changes such as excessive sugary beverage consumption and prolonged sedentary activity, is currently the second biggest cause of preventable mortality after smoking [7].
Obesity-induced reproductive dysfunction is molecularly linked to changes in endothelial nitric oxide synthase (eNOS) activity. eNOS generates nitric oxide (NO), a crucial regulator of vascular tone and cellular signaling that is required for follicular development, oocyte maturation, ovulation, and embryo implantation [8,9,10]. NO, a highly reactive and short-lived inorganic free radical, operates as a unique biological signalling molecule, effecting a range of physiological and pathological processes [8,9]. However, in the setting of obesity, increasing oxidative stress depletes the essential eNOS cofactor tetrahydrobiopterin (BH4), causing eNOS "uncoupling." This uncoupling causes the generation of superoxide (O2-) rather than NO, resulting in oxidative byproducts such peroxynitrite (ONOO-), which induce cellular damage and limit NO bioavailability [11,12]. Elevated nitrite (NO2) and nitrate (NO3) levels indicate aberrant NO metabolism and decreased vascular function, which interfere with folliculogenesis, oocyte quality, and embryo implantation. These changes are also associated with polycystic ovarian syndrome (PCOS), which contributes to infertility [13,14].
Bariatric surgery is an effective treatment for extreme obesity, improving quality of life and lowering morbidity and death by addressing excess weight [15,16,17]. This surgical procedure also improves reproductive health by lowering testosterone and dehydroepiandrosterone sulfate (DHEA-S) levels while boosting luteinizing hormone (LH) and follicle-stimulating hormone (FSH) levels, thereby improving ovarian function. Furthermore, bariatric surgery has been demonstrated to restore eNOS activity, reduce oxidative stress, and boost NO bioavailability, all of which benefit vascular health and reproductive outcomes.
FSH regulates female reproductive physiology by interacting with its receptor, FSHR, which is mostly expressed in granulosa cells. This connection is necessary for follicular maturation, luteinization, and ovulation, which are all regulated by LH [18]. While FSH was generally assumed to act primarily on gonadal tissues, new research have showed that its receptor is expressed in extragonadal tissues, including bone and adipose [19]. Genetic differences, such as single-nucleotide polymorphisms (SNPs) in gonadotropins and receptors, have a further impact on ovarian response and reproductive outcomes [20,21]. Among these, the FSHR rs6166 (c.2039A>G, p.Asn680Ser) polymorphism has been intensively investigated as a biomarker for ovarian responsiveness to FSH stimulation [22,23]. The Asn/Asn genotype is linked to normal FSH sensitivity, but the Ser/Ser genotype, despite being the wild type, has lower FSH receptor sensitivity. Women with the Ser/Ser genotype have greater serum FSH levels, a larger total dosage of gonadotropins during ovarian stimulation, and fewer retrieved oocytes [24,25]. These findings indicate that the Ser/Ser genotype may play an important role in tailored approaches to ovarian stimulation and fertility management.
In conclusion, the molecular basis of obesity-related reproductive dysfunction emphasizes the importance of eNOS and FSHR. Bariatric surgery is emerging as a viable option for not only weight loss, but also for restoring eNOS activity and improving ovarian function. Understanding the interactions between obesity, biochemical pathways such as NO signaling, and genetic variants such as FSHR polymorphisms opens up new possibilities for improving reproductive health outcomes in affected individuals.

2. Materials and Methods

The study comprised 29 women under 40 with a BMI of 40 kg/m² or above, as per the Helsinki Declaration ethical standards. The ethical permission was obtained by the Medical School of Athens (permission No. 48859, Date: October 30, 2020) and Alexandra General Hospital (Approval No. 4345, Date: April 1, 2023). All participants provided informed consent for this prospective study, which took place from March 2022 to November 2024 at the First Department of Obstetrics and Gynecology at 'Alexandra' General Hospital. Infertility was defined as the inability to achieve clinical pregnancy after a year of regular, unprotected sexual intercourse.
Participants were chosen based on their BMI and infertility diagnosis, and to guarantee homogeneity, those with major medical problems, those taking fertility-affecting medicines, and those beyond the age of 40 were removed. As a result, confounding factors that could influence gene expression or reproductive outcomes were removed. After a sleeve gastrectomy, patients were often hospitalized for 1-2 days before gradually transitioning from liquids to solids. The rigorous inclusion criteria, ethical issues, and extensive follow-up ensure that the study's findings are valid. Figure 1 depicts the study's design and participant flow.
The flowchart in Figure 1 depicts the systematic process used for participant recruiting, screening, and data collection. A preliminary power analysis suggested that a sample size of 32 individuals would be most appropriate for the study's aims. During the recruitment phase, 31 persons were identified as fitting the eligibility criteria; however, one participant chose not to proceed. As a result, 30 individuals were considered for inclusion, however two were disqualified owing to specified criteria. The trial's final cohort consisted of 29 individuals.
The recruitment step included thorough screening methods to verify that all applicants satisfied the stated inclusion and exclusion criteria. Although the initial power analysis suggested a slightly larger sample size, 29 individuals were found adequate for reliable data collection and statistical analysis. The rigorous screening method sought to improve the study's reliability by maintaining high standards for participant selection.
Following recruiting, data were rigorously obtained and evaluated from the remaining 29 participants, allowing the researchers to meet the study's objectives despite a modest shortage in sample size. The flowchart successfully shows how participant exclusions were handled, highlighting the importance of striking a compromise between strict eligibility requirements and maintaining a near-optimal sample size. This transparent approach illustrates the study's dedication to scientific rigor and reliability, ensuring the validity of its findings while accommodating practical constraints experienced during recruiting.

2.1. Hormone Measurements

Blood samples were collected from individuals before and six months after sleeve gastrectomy. Hormonal levels have been measured, including follicle-stimulating hormone (FSH), luteinizing hormone (LH), estradiol (E2), sex hormone-binding globulin (SHBG), anti-Müllerian hormone (AMH), and free testosterone.

2.2. Detection of Oxidative Stress Parameters Gene Expression

Total RNA was extracted from blood samples using the Monarch Total RNA Miniprep Kit (New England Biolabs, Ipswich, MA, USA). Next, 1 μg of RNA was utilized to create complementary DNA (cDNA) using the LunaScript RT SuperMix for cDNA Synthesis (New England Biolabs). To analyze gene expression, 5 μL of generated cDNA was used in RT-PCR tests.
The Roche Life Sciences Light Cycler 480 Instrument II was used to execute RT-PCR reactions with a final concentration of 1× of the Luna Universal qPCR Master Mix (New England Biolabs). The RT-PCR technique consisted of a one-minute denaturation stage at 94 °C, followed by 40 cycles of 15-second denaturation at 95 °C and 30 seconds of annealing/extension at 60°C. The melting curve analysis validated the amplification's specificity. To standardize gene expression levels, we used the housekeeping gene G6PD as an internal reference.
To confirm that the results were reliable and reproducible, each experiment was repeated. Negative controls were used in all studies to identify contamination or background signals. The 2−ΔΔCT method was used to quantify relative mRNA expression of target genes, allowing for precise measurement of gene expression changes.

2.3. Detection of FSHR Polymorphisms

Genomic DNA was obtained from peripheral blood leukocytes using the QIAamp DNA Blood Kit (QIAGEN, Hilden, Germany) according to the manufacturer's instructions. The FSHR gene was amplified using polymerase chain reaction (PCR) and particular oligonucleotide primers. The final volume of each PCR reaction was 25 µL, with 1× PCR buffer, 10 µM primers, two units of Taq DNA polymerase (Luna, New England Biolabs, Ipswich, MA, USA), and 5 µL of DNA template. The thermal cycling conditions comprised of an initial denaturation at 94 °C for 5 minutes, followed by 40 cycles of denaturation at 94 °C for 1 minute, annealing at 60 °C for 1 minute, and extension at 72 °C for 1 minute, culminating in a final elongation step at 72 °C for 10 minutes.
The resultant PCR products were digested using the restriction enzyme BsrI. The digestion procedures (10 µL total volume) included 1× reaction buffer, 5 units of BsrI enzyme, and 8 µL of purified PCR product. The samples were incubated at 37 °C overnight to achieve full digestion. The digested products were then resolved on 2.5% agarose gels, visualized using UV light, and photographed.
Due to the A-to-G nucleotide change, the Asn680Ser genotype created a restriction site for BsrI. This enabled the identification of three genotypes based on banding patterns: a single 520 bp band for 680 Asn/Asn, two bands (520 and 413 bp) for 680 Asn/Ser, and a single 413 bp band for 680 Ser/Ser. This genotyping method resulted in exact identification of FSHR polymorphisms in the research population.

2.4. Statistical Analysis

The data was structured systematically using Microsoft Excel (version 2401, 2016) spreadsheets (Microsoft Corporation, Redmond, Washington, DC, USA), with each row representing a single patient record. Statistical analyses were carried out using the SAS software platform for Windows (version 9.4, SAS Institute Inc., Cary, NC, USA). Descriptive statistics were presented as mean values with standard deviations (SD) for continuous variables and frequencies with percentages for categorical variables.
To assess changes in hormone levels, the difference was computed by subtracting pre-surgical readings from post-surgical values, with positive values indicating an increase and negative values indicating decline. The nonparametric Wilcoxon signed-rank test was used to compare matched pre- and post-surgical data. To compare FSHR polymorphism groups, analysis of variance (ANOVA) was employed for continuous variables and Tukey's post hoc test for pairwise comparisons. The Kruskal-Wallis test was used for variables that did not follow a normal distribution.
The number and proportion of patients with increases or decreases in hormone levels were also recorded. Additionally, Spearman correlation analysis (rs) was used to investigate the relationships between changes in hormone levels, BMI, and gene expression. A positive rs number close to one suggested a high positive correlation, whilst a negative value close to -1 indicated a strong negative association. To guarantee accurate data interpretation, all statistical tests had a significance level of p < 0.05 and were two-sided.

2.5. Sample Size Determination

A thorough power analysis was carried out to calculate the required sample size for this study, ensuring sufficient statistical power to detect significant differences in the major outcomes. To assess the effect size, a thorough evaluation of previous studies and relevant literature was paired with expert advice. The primary factors of interest (eNOS, CART, and leptin gene expression) were expected to have moderate effect sizes. This cautious estimate provided sufficient sensitivity in detecting substantial gene expression changes.
The analysis aimed for 80% statistical power (1 - β = 0.80), which increases the likelihood of discovering actual effects. A significance level (α) of 0.05 was determined, indicating a 5% chance of making a Type I error. Paired t-tests were used to assess mean expression levels of the eNOS, CART, and leptin genes before and six months after bariatric surgery. For data that did not match parametric assumptions, the Wilcoxon signed-rank test was developed as a reliable alternative. Additionally, a moderate correlation of 0.5 between pre- and post-surgery measures was anticipated, which was consistent with previous research.
The G*Power software (version 3.1.9.7) was used to do the power analysis, which took into account these parameters. The results showed that a sample size of at least 29 individuals was necessary to attain the acceptable statistical power. To limit the impact of potential attrition, a target sample size of 32 people was suggested, accounting for an expected 10% loss to follow-up. Practical concerns such as patient recruitment feasibility, clinical workflow, and budgetary constraints were all evaluated to ensure the study's practical execution and reliability in a clinical research context.

3. Results

Table 1 displays mean and SD values for FSH, LH, E2, SHBG, Free T, AMH, AFC (right and left ovary), and BMI based on FSHR polymorphisms (Asn/Asn, Asn/Ser, Ser/Ser). These findings show disparities in hormonal patterns and ovarian reserve markers.
The results in Table 1 indicate significant changes in hormonal and ovarian reserve markers across FSHR polymorphisms. The Ser/Ser group has the highest FSH levels (7.41 ± 0.61 mIU/mL), significantly higher than Asn/Asn (5.20 ± 0.63 mIU/mL) and Asn/Ser (5.68 ± 0.68 mIU/mL), indicating increased FSH activity. While LH and E2 levels exhibit modest fluctuation, SHBG levels are highest in Asn/Ser (38.62 ± 6.83 nmol/L) and lowest in Ser/Ser (31.24 ± 5.31 nmol/L). Free T levels are highest in Ser/Ser (31.13 ± 6.91 ng/dL), possibly indicating less SHBG binding. The Ser/Ser group has higher AMH levels and AFC values (AMH: 2.20 ± 0.27 ng/mL; AFC right: 10.63 ± 2.39, left: 9.50 ± 2.00), indicating improved ovarian reserve. Finally, BMI is lowest in Ser/Ser (39.39 ± 1.51) and greatest in Asn/Asn (42.39 ± 4.07), indicating a potential relationship between FSHR polymorphisms and body composition. These findings highlight the influence of FSHR polymorphisms on hormonal regulation and ovarian function.
Table 2: This table shows the F-statistic and p-values from ANOVA testing for different hormonal and physiological markers, including FSH, LH, E2, SHBG, Free T, AMH, AFC (right and left ovary), and BMI before surgery, for three FSHR polymorphisms (Asn/Asn, Asn/Ser, Ser/Ser). A p-value < 0.05 indicates statistically significant differences between polymorphism groups.
The ANOVA results in the Table 2 show a considerable variance in FSH levels (F-statistic: 26.54, p-value: >0.00), indicating that FSHR polymorphisms have a strong influence on FSH secretion or regulation. Other markers, such as LH (p = 0.46), E2 (p = 0.56), Free T (p = 0.66), and AMH (p = 0.71) show no significant variations, demonstrating that these hormones are constant between polymorphism groups. SHBG approaches significance (F-statistic: 2.78, p = 0.07), indicating a possible trend that might be investigated further with a larger sample size. AFC for both ovaries (right: p = 0.76; left: p = 0.95) and BMI (p = 0.17) indicate no significant differences, indicating that ovarian reserve indicators and BMI are not strongly related with FSHR polymorphism. Overall, the data highlight the particular and significant role that FSHR polymorphisms play in FSH control while demonstrating limited influence on other reproductive and physiological parameters.
Table 3: shows pairwise comparisons of mean differences (mean diff) in FSH levels between FSHR polymorphism groups (Asn/Asn, Asn/Ser, Ser/Ser) prior to surgery, as well as corrected p-values. A p-adj < 0.05 suggests a significant difference between groups.
In Table 3,the pairwise comparisons of FSH levels among the FSHR polymorphism groups reveal substantial differences prior to surgery. The Ser/Ser group has considerably higher FSH levels than the Asn/Asn group (mean difference: 2.21, p-adj = 0.000) and the Asn/Ser group (mean difference: 1.73, p-adj = 0.000). However, no significant difference was seen between the Asn/Asn and Asn/Ser groups (mean difference: 0.48, p-adj = 0.2386). These findings reveal that the Ser/Ser polymorphism is highly related with elevated FSH levels, whereas the Asn/Asn and Asn/Ser groups show comparable levels, indicating that these polymorphisms have a less prominent effect on FSH secretion or regulation.
Boxplot 1 FSH Levels Across FSHR Polymorphism Groups Before Surgery.
Preprints 142692 i001
The Boxplot 1. depicts the distribution of FSH levels in the three FSHR polymorphism groups (Asn/Asn, Asn/Ser, and Ser/Ser) prior to surgery. The Ser/Ser group has the highest median FSH levels and the broadest range when compared to the other two groups. In contrast, the Asn/Asn and Asn/Ser groups exhibit lower FSH levels, with the Asn/Asn group showing the least fluctuation. These visual findings are consistent with the statistical analysis, demonstrating significant variations in FSH levels for the Ser/Ser group, possibly indicating a larger impact of this polymorphism on FSH regulation.
Table 4: The correlation analysis of eNOS expression and other clinical markers before bariatric surgery. The table displays the mean values, standard deviations, Pearson correlation coefficients, and p-values for each parameter.
Table 4 presents a correlation analysis of eNOS and many clinical markers conducted prior to bariatric surgery. The average age was 33.03 years (SD = 4.08), with a Pearson correlation coefficient of 0.111 (p = 0.565). In terms of hormonal parameters, FSH had a mean of 6.03 mIU/mL (SD = 1.09) and a correlation of 0.188 (p = 0.328), whereas LH had a mean of 6.87 mIU/mL (SD = 1.01) and an insignificant correlation of 0 (p = 0.997). Estradiol (E2) levels averaged 30.75 pg/mL (SD = 3.80), with a minor correlation of 0.249 (p = 0.193), and SHBG levels averaged 36.24 nmol/L (SD = 7.58), with a slight negative correlation of -0.076 (p = 0.696).Free testosterone had the highest variability (mean = 28.72 ng/dL, SD = 9.35) and a modest positive correlation of 0.285 (p = 0.133). AMH concentrations averaged 2.14 ng/mL (SD = 0.24), with a correlation value of 0.115 (p = 0.552). For ovarian reserve markers, AFC in the right ovary (mean = 10.31, SD = 2.51) and left ovary (mean = 9.28, SD = 2.59) showed correlations of 0.095 (p = 0.623) and 0.063 (p = 0.746), respectively. Finally, the mean BMI before to surgery was 41.12 (SD = 3.28), with a negative correlation of -0.266 (p = 0.162). Overall, none of these correlations were statistically significant (all p > 0.05), demonstrating that eNOS gene expression does not correlate linearly with these clinical markers prior to bariatric surgery.
The Table 5 shows the findings of pairwise comparisons of eNOS gene expression (Cpt eNOS A-G6PD) between the FSHR polymorphism groups (Asn/Asn, Asn/Ser, and Ser/Ser) using Tukey's HSD test. The columns show the comparison group pairs (group1 and group2), the mean difference in eNOS expression (meandiff), the adjusted p-value (p-adj), the lower and upper boundaries of the 95% confidence interval (lower, higher), and whether the difference is statistically significant (reject).
Table 5 indicates that the pairwise comparisons show no statistically significant variations in eNOS expression between the FSHR polymorphism groups. The mean difference between Asn/Asn and Asn/Ser was 0.37 (p-adj = 0.8864), but the difference between Asn/Asn and Ser/Ser was 0.84 (p-adj = 0.6091). Similarly, the difference in Asn/Ser and Ser/Ser was 0.47 (p-adj = 0.8227). None of the comparisons had p-values < 0.05, indicating that the observed changes in eNOS expression are not statistically significant. The confidence intervals for all comparisons overlap significantly, suggesting the lack of significant variation. These results imply that the eNOS expression levels are comparable among the three polymorphism groups, indicating no detectable impact of FSHR genetic variation on eNOS gene expression in this dataset.
Preprints 142692 i002
Boxplot 2. Comparison of eNOS Expression Across FSHR Polymorphism Groups prior surgery.
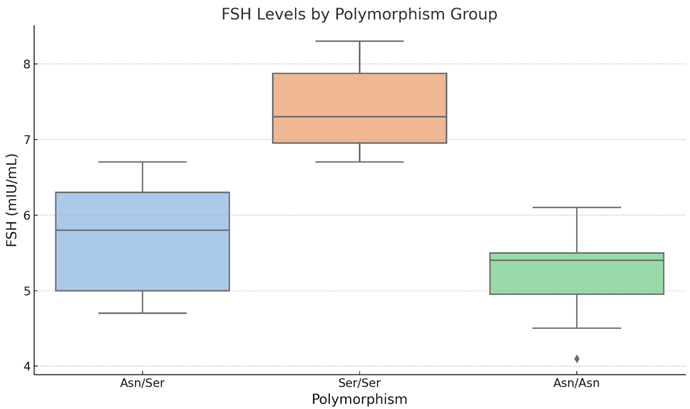
The boxplot 2 shows the distribution of eNOS gene expression (Cpt eNOS A-G6PD) for each FSHR polymorphism group (Asn/Asn, Asn/Ser, and Ser/Ser). The boxes reflect the interquartile range (IQR), the horizontal line within each box denotes the median, and the whiskers reach the most extreme data points within 1.5 times the IQR. Outliers outside of this range are not found in this dataset.
The boxplot 2 compares the amounts of eNOS expression among the three FSHR polymorphism groups. The Asn/Ser group has slightly more variability in eNOS expression, whereas the Asn/Asn group has a smaller range. The Ser/Ser group has a wider range of eNOS expression than Asn/Asn, although the median values for all groups are relatively similar. The overlapping interquartile ranges and lack of clear distinction in median values are consistent with the statistical findings, which demonstrate no significant differences in eNOS expression between the groups (p > 0.05). This shows that the FSHR polymorphism has no substantial impact on eNOS gene expression in this sample.

Post Surgery

Table 6 Post-Surgery Hormonal Parameters, Ovarian Reserve Markers, and BMI Across FSHR Polymorphism Groups.
The post-surgical research revealed significant differences in hormonal parameters, ovarian reserve indicators, and BMI across the three FSHR polymorphism groups. The Ser/Ser group had the highest mean FSH levels (9.45 ± 0.87) compared to the Asn/Asn (8.95 ± 0.79) and Asn/Ser groups (8.47 ± 0.61). LH levels were highest in the Ser/Ser group (9.28 ± 0.72) and lowest in the Asn/Ser group (8.28 ± 0.83).
The Asn/Ser group has the greatest mean E2 levels (50.23 ± 4.79), whereas the Asn/Asn group has the lowest (46.95 ± 4.07). SHBG levels are significantly greater in the Asn/Asn group (69.73 ± 11.59) than in the Ser/Ser group (58.83 ± 9.04), indicating probable differences in androgen metabolism or binding capacity between polymorphism groups. Free testosterone levels are highest in the Ser/Ser group (10.81± 3.25) and lowest in the Asn/Ser group (8.49 ± 1.62).
AMH levels in ovarian reserve markers vary little between groups, with averages ranging from 2.90 to 2.98. AFC values for both right and left ovaries are comparable, with slightly higher values in the Asn/Asn group for the right ovary (7.75 ± 1.75) and the Ser/Ser group for the left ovary (6.80 ± 1.24).
BMI varies slightly between polymorphism groups, with averages ranging from 25.72 ± 1.42 in the Asn/Ser group to 26.38 ± 1.29 in the Asn/Asn group. These findings indicate that, while certain hormones such as FSH, LH, and SHBG show significant fluctuations, other measures such as AMH, AFC, and BMI stay largely steady between polymorphism groups. More research may be required to investigate the clinical consequences of these hormones and metabolic variations
Table 7 presents the ANOVA results that compare hormonal parameters and ovarian reserve indicators among FSHR polymorphism groups (Asn/Asn, Asn/Ser, and Ser/Ser) after surgery. The columns provide the parameter examined, the F-statistic, and the related p-value. A p-value < 0.05 indicates statistically significant differences between polymorphism groups.
Following surgery, in Table 7, the research indicates significant differences in FSH and LH levels among the FSHR polymorphism groups. FSH levels exhibited the highest correlation (F-statistic = 4.27, p = 0.0249), followed by LH levels (F-statistic = 4.01, p = 0.0302), implying that genetic differences in FSHR may influence these hormone levels after surgery. However, no significant differences were found for estradiol (E2), sex hormone-binding globulin (SHBG), or free testosterone (p-values of 0.252, 0.219, and 0.120, respectively). These findings suggest that, whereas FSHR polymorphisms have a measurable effect on FSH and LH regulation, their impact on other hormonal and metabolic parameters after surgery is limited. Further research could look into the therapeutic significance of these variances in terms of ovarian function and recovery after surgery.
Table 8: Relationship investigation of Cpt eNOS and other clinical indicators following bariatric surgery. The table shows the mean values, standard deviations, Pearson correlation coefficients, and p-values for each parameter.
Table 8 shows the relationship between eNOS gene expression and many clinical markers following bariatric surgery. Following surgery, the mean AFC in the left ovary was 6.76 (SD = 1.24), with a Pearson correlation of -0.149 (p = 0.439), and in the right ovary, 7.38 (SD = 1.64), with a correlation of 0.037 (p = 0.849). Following surgery, AMH levels averaged 2.96 ng/mL (SD = 0.15), with a correlation value of 0.102 (p = 0.597). Six months following surgery, the average BMI was 25.98 (SD = 1.38), with a -0.248 correlation (p = 0.194). Estradiol (E2) levels averaged 49.23 pg/mL (SD = 4.54) with a correlation of -0.156 (p = 0.42), but FSH levels after surgery averaged 8.88 mIU/mL (SD = 0.08) with a weak correlation of 0.08 (p = 0.677). Free testosterone levels were 9.42 ng/dL (SD = 2.52), with a weak negative correlation of -0.151 (p = 0.436). LH levels after surgery averaged 8.83 mIU/mL (SD = 1.03), with a correlation of -0.121 (p = 0.532). SHBG had the strongest association (-0.365, p = 0.049), indicating a minor but statistically significant negative correlation with Cpt eNOS. Overall, only SHBG appears to be associated with gene expression after surgery.
Table 9 shows pairwise comparisons of mean differences (meandiff) in FSH levels following surgery among FSHR polymorphism groups (Asn/Asn, Asn/Ser, Ser/Ser), as well as adjusted p-values (p-adj). A p-adj < 0.05 shows a statistically significant difference among groups.
Table 9 shows pairwise comparisons show that FSH levels differ significantly between the Asn/Ser and Ser/Ser groups (mean difference = 0.9731, p-adj = 0.0197). However, tests between Asn/Asn and Asn/Ser (-0.4731, p-adj = 0.3498) and Asn/Asn and Ser/Ser (0.5000, p-adj = 0.3861) revealed no statistically significant differences. These findings indicate that the Ser/Ser polymorphism may be associated with higher FSH levels after surgery than the Asn/Ser group, although differences between the Asn/Asn groups are not significant.
Preprints 142692 i003
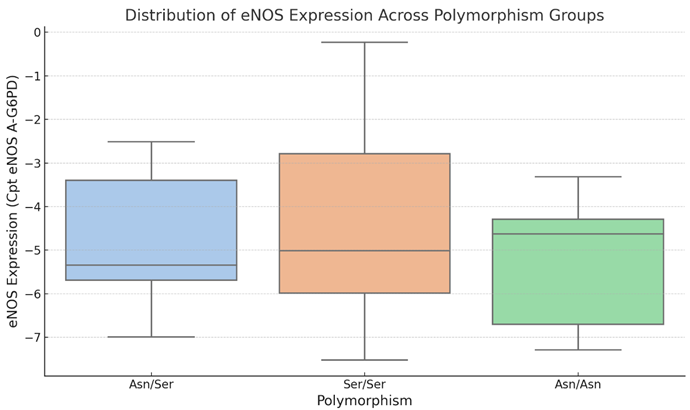
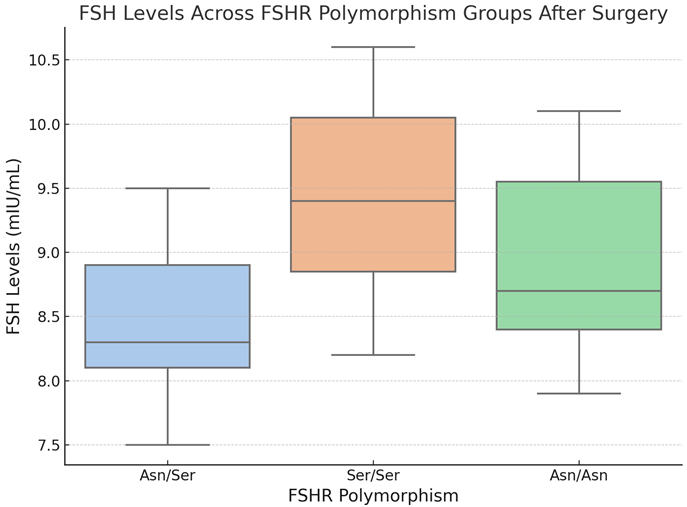
Boxplot 3. FSH Levels Across FSHR Polymorphism Groups After Surgery.
The boxplot 3 depicts the distribution of FSH levels (mIU/mL) following surgery across the FSHR polymorphism groups (Asn/Asn, Asn/Ser, and Ser/Ser). The box represents the interquartile range (IQR), the line within the box denotes the median, and the whiskers extend 1.5 times the IQR. Outliers are represented as isolated points beyond the whiskers.
The visualization, boxplot 3, shows how FSH levels vary between the three polymorphism groups. The Ser/Ser group has the highest median and a wider range of FSH levels than the Asn/Ser and Asn/Asn groups. The Asn/Ser group has the lowest median and narrowest range. This supports the pairwise comparison results that show substantial variations in FSH levels between the Ser/Ser and Asn/Ser groups (p-adj < 0.05). These findings imply that FSH levels after surgery are regulated by the FSHR polymorphism, with the Ser/Ser variant related with greater FSH levels.
Preprints 142692 i004
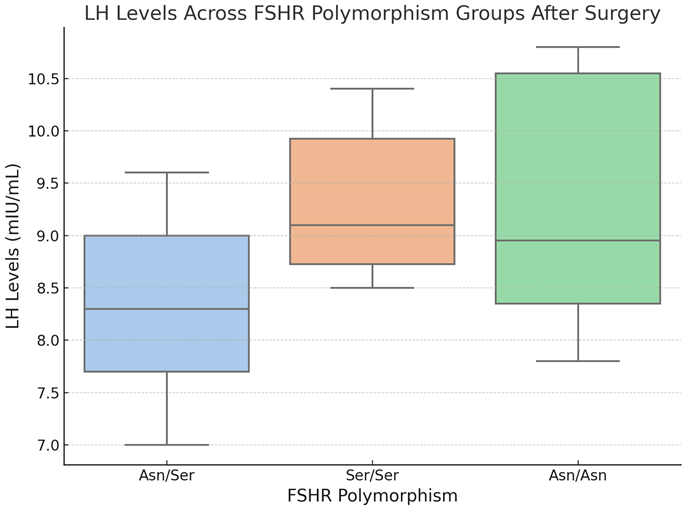
Boxplot 4. LH Levels Across FSHR Polymorphism Groups After Surgery.
The boxplot 4 depicts the distribution of luteinizing hormone (LH) levels (mIU/mL) following surgery among FSHR polymorphism groups (Asn/Asn, Asn/Ser, and Ser/Ser). The central line in each box reflects the median LH level, while the box margins denote the interquartile range (IQR). Whiskers extend to the minimum and maximum values within 1.5 times the IQR; any points outside of this range are considered outliers.
The visualization shows post-surgery patterns in LH levels among the three FSHR polymorphism groups. The Asn/Ser group had the lowest median LH levels, with a very narrow range compared to the other groups. The Ser/Ser group has somewhat higher median LH levels and a comparable range to the Asn/Ser group, whereas the Asn/Asn group has the most variability in LH levels, with a larger interquartile range. Despite these findings, statistical analysis revealed no significant pairwise differences in LH levels across the groups (all p-adj > 0.05). These findings indicate that, while minor differences in LH levels may exist, FSHR polymorphisms may not have a major effect on LH levels after surgery. Further research could determine whether these changes are clinically relevant in specific subgroups.
The Table 10 compares pairwise mean differences (meandiff) in LH levels (mIU/mL) between FSHR polymorphism groups (Asn/Asn, Asn/Ser, and Ser/Ser) following surgery. The table also contains adjusted p-values (p-adj) and 95% confidence interval lower and upper boundaries for each comparison. A p-value of < 0.05 indicates a statistically significant difference.
The pairwise comparisons in Table 10 show patterns in LH levels among the FSHR polymorphism groups, however none are statistically significant. The comparison of Asn/Asn and Asn/Ser revealed a mean difference of -0.9779 (p-adj = 0.07), indicating that the Asn/Ser group may have lower LH levels than the Asn/Asn group. Similarly, the difference between Asn/Ser and Ser/Ser (mean difference = 1.0029, p-adj = 0.0619) approached significant, showing that Ser/Ser had somewhat higher LH levels than Asn/Ser. In contrast, the comparison of Asn/Asn and Ser/Ser indicated minimal variations in LH levels (mean difference = 25, p-adj = 0.9984), indicating no significant difference between these groups. Overall, these results imply that the FSHR polymorphism has only a marginal effect on LH levels following surgery, with no statistically significant changes observed in this cohort. Further studies with larger sample sizes may help clarify these trends.
The Table 11 compares the mean differences (meandiff) in eNOS expression levels between the FSHR polymorphism groups (Asn/Asn, Asn/Ser, and Ser/Ser) following surgery. The table shows adjusted p-values (p-adj), 95% confidence interval lower and upper bounds, and whether the difference is statistically significant (reject). A p-value of <0.05 shows statistical significance.
Pairwise assessments in Table 11 of eNOS expression among FSHR polymorphism groups after surgery indicated no statistically significant differences. The comparison of Asn/Asn and Asn/Ser revealed a mean difference of 0.3898 (p-adj = 0.9255), with the confidence interval ranging from -2.1917 to 2.9713. Similarly, the mean difference between Asn/Asn and Ser/Ser was 1.5950 (p-adj = 0.3658), which was not statistically significant. The difference between Asn/Ser and Ser/Ser was somewhat less (mean difference = 1.2052, p-adj = 0.4869), with no statistical significance found. These findings imply that the FSHR polymorphism has no substantial affect on eNOS expression levels after surgery. Additional research with a bigger cohort could help elucidate these tendencies and investigate potential biological ramifications. ​​
Preprints 142692 i005
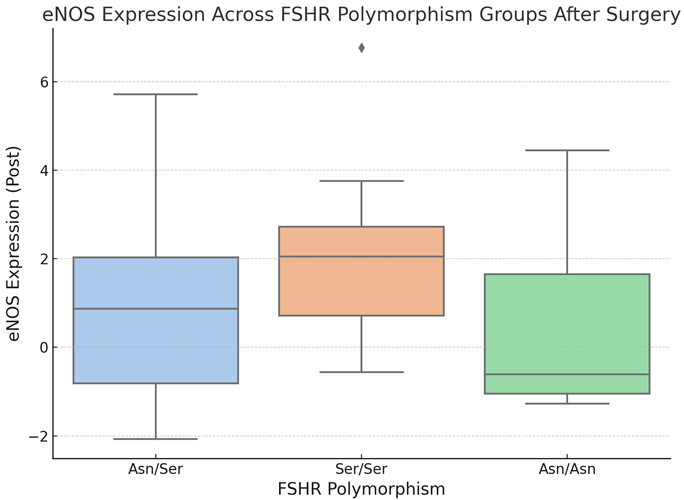
Boxplot 5. eNOS Expression Across FSHR Polymorphism Groups After Surgery.
The boxplot 5 depicts the distribution of endothelial nitric oxide synthase (eNOS) expression levels among FSHR polymorphism groups (Asn/Asn, Asn/Ser, Ser/Ser) following surgery. The central line in each box reflects the median eNOS expression, whereas the box margins denote the interquartile range (IQR). Whiskers extend to the minimum and maximum values within 1.5 times the IQR; any points outside of this range are considered outliers.
The graphic, boxplot 5, depicts differences in eNOS expression levels among the FSHR polymorphism groups following surgery. The Ser/Ser group has the greatest median eNOS expression and the widest range, indicating more variability within this group. The Asn/Ser group has a somewhat lower median and a narrower distribution than the Ser/Ser group. In contrast, the Asn/Asn group has the lowest median eNOS expression and a more concentrated distribution.Despite these variations, statistical analysis indicated no significant pairwise differences in eNOS expression levels across polymorphism groups. These data suggest that, whereas eNOS expression varies by group, FSHR polymorphisms may not have a significant impact on its expression after surgery. More study with bigger cohorts is needed to confirm these findings and determine their clinical importance.
Preprints 142692 i006
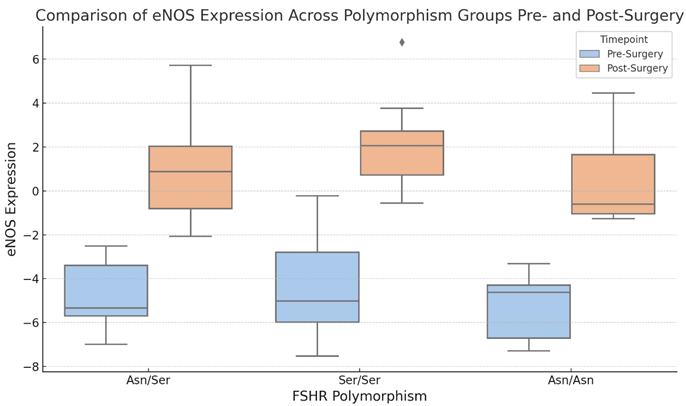
Boxplot 6. Comparison of eNOS Expression Across Polymorphism Groups Pre- and Post-Surgery.
The boxplot 6 compares eNOS expression levels among FSHR polymorphism groups (Asn/Asn, Asn/Ser, Ser/Ser) at two time points: before and after surgery. The central line in each box reflects the median eNOS expression, whereas the box margins denote the interquartile range (IQR). Whiskers extend to the minimum and highest values of 1.5 times the IQR. Pre-surgery data is shown in blue, while post-surgery data is in orange.
The visualization, boxplot 6, shows significant variations in eNOS expression levels among FSHR polymorphism groups from before to after surgery. eNOS expression appeared to rise in all groups following surgery, with the Ser/Ser group exhibiting the greatest range and highest variability. The Asn/Ser group likewise shows a change toward greater eNOS levels after surgery, while the range is less than the other groups. In contrast, the Asn/Asn group exhibits a mild increase in eNOS levels over a slightly larger range. These results show that surgical intervention may modify eNOS expression, with the impact potentially differing depending on the FSHR polymorphism. Further statistical research could provide light on the significance of these changes, as well as their biological implications. ​
The Table 12 shows the paired t-test findings comparing eNOS expression levels before and after surgery for each FSHR polymorphism group (Asn/Asn, Asn/Ser, and Ser/Ser). The t-statistic and p-value columns show the size of change, with p-values < 0.05 indicating statistical significance.
In the Table 12 the paired t-test analysis demonstrates substantial changes in eNOS expression levels from pre- to post-surgery for all FSHR polymorphism groups. The Asn/Ser group showed the most significant difference (t-statistic = -10.39, p < 0.000001), followed by the Ser/Ser group (t-statistic = -9.07, p < 0.00005) and the Asn/Asn group (t-statistic = -7.64, p < 0.0002).
The extremely significant p-values (< 0.05) across all groups show that surgical intervention consistently affects eNOS expression, regardless of the individual polymorphism. The negative t-statistics indicate that eNOS expression levels increased after surgery in all polymorphism groups. These findings highlight the potential importance of surgical intervention in regulating eNOS activity, which has consequences for endothelial function and ovarian physiology.

4. Discussion

The study focuses on the intricate relationship between FSHR polymorphisms, hormonal control, ovarian reserve markers, and eNOS gene expression, highlighting crucial findings both before and after surgery.
FSHR polymorphisms were discovered to have a considerable effect on FSH levels before and after surgery. The Ser/Ser polymorphism consistently showed the greatest FSH levels, both before and after surgery, indicating lower FSH receptor sensitivity. Voros et al. found that the SER/SER genotype of the FSHR polymorphism was associated with significantly higher CART levels compared to the SER/ASN and ASN/ASN genotypes, indicating a possible link between this genetic variation and CART expression in follicular fluid [26]. This is consistent with prior research suggesting that the Ser/Ser genotype requires greater FSH levels for successful ovarian stimulation. The Asn/Asn and Asn/Ser groups had lower and comparable FSH levels, indicating more balanced receptor function. The observed differences in FSH levels highlight the utility of FSHR polymorphisms as a biomarker for ovarian response and therapeutic targeting. According to a meta analysis by Prodromidou et al., the Asn/Asn genotype of the FSHR polymorphism is related with greater estradiol levels during ovarian stimulation but fewer transferable embryos than the ser/ser genotype. These findings highlight the impact of genetic diversity on ovarian response and embryo quality [27].
While LH levels differed between polymorphism groups after surgery, the variations were not statistically significant, indicating that FSHR polymorphisms have a key role in regulating FSH rather than LH. Other hormones, such as estradiol (E2), SHBG, and free testosterone, displayed trends but did not indicate significant variations, with the exception of SHBG, which neared significance prior to surgery. These findings indicate that the polymorphism's impact on hormone control is selective and mostly connected with FSH.
Ovarian reserve markers, such as AMH and AFC, were mostly consistent among FSHR polymorphism groups before and after surgery. This suggests that, whereas FSH and its receptor polymorphisms play an important role in hormonal regulation, their impact on ovarian reserve parameters is limited in this setting. BMI, another important metric, was marginally lower in the Ser/Ser group, indicating a possible but insignificant link between genetic variation and metabolic profile.
The study found significant increases in eNOS expression across all polymorphism groups after surgery, highlighting the influence of surgery on endothelial function. The Ser/Ser group showed the most variability, indicating a potential increased vulnerability to surgery-induced metabolic and circulatory alterations. The significant rise in eNOS expression across all groups points to a similar process by which surgery improves vascular health by reducing oxidative stress and increasing nitric oxide (NO) bioavailability.
Correlation analyses indicated little relationships between eNOS expression and clinical indicators. SHBG was the sole marker that showed a significant negative correlation after surgery, presumably suggesting alterations in androgen metabolism associated to eNOS activity. The lack of robust relationships with other markers indicates that, while eNOS activity is increased, its direct impacts on ovarian reserve and hormonal markers may be secondary or indirect.
The Ser/Ser polymorphism of the follicle-stimulating hormone receptor (FSHR) has been linked to variations in ovarian responsiveness to controlled ovarian hyperstimulation (COH) in women receiving assisted reproductive technologies (ART). According to studies, persons with the Ser/Ser genotype may have a decreased ovarian response to COH, demanding larger doses of exogenous follicle-stimulating hormone (FSH) to achieve optimal follicular growth [28]. This reduced responsiveness could be due to changes in receptor sensitivity or downstream signaling cascades. However, the influence of the Ser/Ser polymorphism on clinical outcomes, such as pregnancy rates, is still unclear, with some studies finding no significant changes between different FSHR genotypes [29].
Individuals with the Ser680Ser polymorphism of the follicle-stimulating hormone receptor (FSHR) may have a reduced BMI due to biological mechanisms that link reproductive and metabolic pathways. The FSHR, a G protein-coupled receptor (GPCR), exerts its actions via the cAMP signaling pathway. The Ser680Ser variation decreases receptor sensitivity, necessitating higher FSH concentrations for activation. This lowered sensitivity may affect not only ovarian function, but also systemic metabolic systems [30]. Emerging data suggests that FSH acts directly on adipose tissue, where FSHR expression has been identified. FSH promotes adipocyte development and fat storage, and differences in receptor sensitivity could affect these processes [31]. Individuals with the Ser680Ser genotype, which is characterized by elevated circulating FSH levels, may have altered fat control, resulting in lower adiposity and BMI. This is additionally corroborated by observed physiological variations, including lower levels of sex hormone-binding globulin (SHBG) and higher levels of free testosterone in this group [32]. Individuals with the Ser680Ser polymorphism may have a slimmer phenotype due to testosterone, which has been shown to improve lean muscle mass and increase basal metabolic rate.
Estradiol, a byproduct of FSH activity, plays a key role in energy homeostasis, fat distribution, and glucose metabolism [33]. Although there was no significant difference in estradiol levels between polymorphism groups in this investigation, minor interactions with the FSHR genotype may still influence metabolic outcomes. Furthermore, epigenetic changes linked with the Ser680Ser polymorphism may influence the expression of critical genes involved in lipid metabolism and mitochondrial function, linking this variant to systemic metabolic impacts [34].
Clinically, the Ser680Ser polymorphism's connection with decreased BMI has important implications for assisted reproductive technologies (ART). Lower BMI is frequently associated with improved ovarian response, increased follicular recruitment, and a decreased risk of problems such as ovarian hyperstimulation syndrome (OHSS) [35].

5. Conclusions

This study emphasizes the transformative potential of bariatric surgery as a simultaneous modulator of vascular and reproductive health in women with extreme obesity. Genetic diversity has a considerable impact on treatment results, as seen by increased eNOS expression (p < 0.0001) and modulated FSH levels, especially in the Ser/Ser group. The Ser/Ser polymorphism, which is associated with higher FSH levels and lower receptor sensitivity, demonstrates the significance of adapting therapeutic methods to individual genetic profiles.
The findings pave the possibility for individualized infertility treatment options that combine bariatric surgery, genetic and hormone analysis. By targeting both metabolic and reproductive dysfunctions, this method provides a promising path for optimizing ovarian stimulation procedures and increasing fertility outcomes in this high-risk group. Future study should concentrate on the long-term impact of these therapies and their implications for assisted reproductive technologies, ensuring a comprehensive and patient-centered approach to infertility treatment.

Author Contributions

We confirm that each author provided a written contribution to the work. C.V. includes data curation, inquiry, methodology, and writing review and editing. D.M. and R.S. are in charge of resource allocation and project administration. Software: K.B. and M.D. A.K. and A.P. performed the formal analysis, while V.T. and A.V. conducted the investigations. R.M. and P.K. provided resources, while D.A. and D.M. conducted the analysis. P.A. is in charge of project management; C.V. and D.L. are in charge of software; and G.D. and D.L. are in charge of supervision and validation. All authors have read and approved the published version of the manuscript.

Funding

This study received no external support.

Institutional Review Board Statement

The research project was ethically authorized by the scientific boards of the Medical School of Athens (48859, October 30, 2020) and Alexandra General Hospital (4345, March 1, 2023), in accordance with Declaration of Helsinki criteria.

Informed Consent Statement

All participants in the study supplied informed consent.

Data Availability Statement

Not applicable.

Acknowledgments

We extend our thanks to all of the women who participated in this study for trusting in us and allowing us to complete the project in this manner.

Conflicts of Interest

The contributors have not declared any conflicts of interest.

References

  1. Leeners B, Geary N, Tobler PN, Asarian L. Ovarian hormones and obesity. Human Reproduction Update [Internet]. 2017 May 1 [cited 2024 Oct 23];23(3):300–21. Available from: https://academic.oup.com/humupd/article/23/3/300/3058798. [CrossRef]
  2. Pearce EN. Thyroid hormone and obesity. Current Opinion in Endocrinology, Diabetes & Obesity [Internet]. 2012 Oct [cited 2024 Oct 23];19(5):408–13. Available from: https://journals.lww.com/01266029-201210000-00014.
  3. Zhang Y, Guo X, Guo L, Chang H, Shu J, Leung PCK. Outcomes comparison of IVF/ICSI among different trigger methods for final oocyte maturation: A systematic review and meta-analysis. The FASEB Journal [Internet]. 2021 Jul [cited 2023 Jul 6];35(7). Available from: https://onlinelibrary.wiley.com/doi/10.1096/fj.202100406R.
  4. Sturm R, An R, Maroba J, Patel D. The effects of obesity, smoking, and excessive alcohol intake on healthcare expenditure in a comprehensive medical scheme. S Afr Med J [Internet]. 2013 Sep 30 [cited 2024 Oct 23];103(11):840. Available from: http://www.samj.org.za/index.php/samj/article/view/7260.
  5. Ludwig DS, Peterson KE, Gortmaker SL. Relation between consumption of sugar-sweetened drinks and childhood obesity: a prospective, observational analysis. The Lancet [Internet]. 2001 Feb [cited 2024 Oct 23];357(9255):505–8. Available from: https://linkinghub.elsevier.com/retrieve/pii/S0140673600040411.
  6. Robinson TN. TELEVISION VIEWING AND CHILDHOOD OBESITY. Pediatric Clinics of North America [Internet]. 2001 Aug [cited 2024 Oct 23];48(4):1017–25. Available from: https://linkinghub.elsevier.com/retrieve/pii/S0031395505703540.
  7. Moran LJ, Dodd J, Nisenblat V, Norman RJ. Obesity and Reproductive Dysfunction in Women. Endocrinology and Metabolism Clinics of North America [Internet]. 2011 Dec [cited 2023 Jul 9];40(4):895–906. Available from: https://linkinghub.elsevier.com/retrieve/pii/S0889852911000715. [CrossRef]
  8. Tran N, Garcia T, Aniqa M, Ali S, Ally A, Nauli SM. Endothelial Nitric Oxide Synthase (eNOS) and the Cardiovascular System: in Physiology and in Disease States. Am J Biomed Sci Res. 2022;15(2):153–77.
  9. Man AWC, Zhou Y, Xia N, Li H. Endothelial Nitric Oxide Synthase in the Perivascular Adipose Tissue. Biomedicines. 2022 Jul 21;10(7):1754.
  10. Luo Y, Zhu Y, Basang W, Wang X, Li C, Zhou X. Roles of Nitric Oxide in the Regulation of Reproduction: A Review. Front Endocrinol [Internet]. 2021 Nov 19 [cited 2024 Sep 23];12:752410. Available from: https://www.frontiersin.org/articles/10.3389/fendo.2021.752410/full.
  11. Le Lay S, Simard G, Martinez MC, Andriantsitohaina R. Oxidative Stress and Metabolic Pathologies: From an Adipocentric Point of View. Oxidative Medicine and Cellular Longevity [Internet]. 2014 [cited 2024 Nov 1];2014:1–18. Available from: http://www.hindawi.com/journals/omcl/2014/908539/.
  12. Jomova K, Raptova R, Alomar SY, Alwasel SH, Nepovimova E, Kuca K, et al. Reactive oxygen species, toxicity, oxidative stress, and antioxidants: chronic diseases and aging. Arch Toxicol [Internet]. 2023 Oct [cited 2024 Nov 1];97(10):2499–574. Available from: https://link.springer.com/10.1007/s00204-023-03562-9.
  13. Barbosa PO, Tanus-Santos JE, Cavalli RDC, Bengtsson T, Montenegro MF, Sandrim VC. The Nitrate-Nitrite-Nitric Oxide Pathway: Potential Role in Mitigating Oxidative Stress in Hypertensive Disorders of Pregnancy. Nutrients [Internet]. 2024 May 14 [cited 2024 Nov 1];16(10):1475. Available from: https://www.mdpi.com/2072-6643/16/10/1475.
  14. Kicińska AM, Maksym RB, Zabielska-Kaczorowska MA, Stachowska A, Babińska A. Immunological and Metabolic Causes of Infertility in Polycystic Ovary Syndrome. Biomedicines [Internet]. 2023 May 28 [cited 2024 Nov 1];11(6):1567. Available from: https://www.mdpi.com/2227-9059/11/6/1567.
  15. Mechanick JI, Kushner RF, Sugerman HJ, Gonzalez-Campoy JM, Collazo-Clavell ML, Spitz AF, et al. AMERICAN ASSOCIATION OF CLINICAL ENDOCRINOLOGISTS, THE OBESITY SOCIETY, AND AMERICAN SOCIETY FOR METABOLIC & BARIATRIC SURGERY MEDICAL GUIDELINES FOR CLINICAL PRACTICE FOR THE PERIOPERATIVE NUTRITIONAL, METABOLIC, AND NONSURGICAL SUPPORT OF THE BARIATRIC SURGERY PATIENT. Obesity [Internet]. 2009 Apr [cited 2024 Mar 2];17(S1). Available from: https://onlinelibrary.wiley.com/doi/10.1038/oby.2009.28.
  16. Mechanick JI, Youdim A, Jones DB, Timothy Garvey W, Hurley DL, Molly McMahon M, et al. Clinical Practice Guidelines for the Perioperative Nutritional, Metabolic, and Nonsurgical Support of the Bariatric Surgery Patient—2013 Update: Cosponsored by American Association of Clinical Endocrinologists, The Obesity Society, and American Society for Metabolic & Bariatric Surgery. Surgery for Obesity and Related Diseases [Internet]. 2013 Mar [cited 2024 Mar 3];9(2):159–91. Available from: https://linkinghub.elsevier.com/retrieve/pii/S1550728913000221. [CrossRef]
  17. Salminen P, Helmiö M, Ovaska J, Juuti A, Leivonen M, Peromaa-Haavisto P, et al. Effect of Laparoscopic Sleeve Gastrectomy vs Laparoscopic Roux-en-Y Gastric Bypass on Weight Loss at 5 Years Among Patients With Morbid Obesity: The SLEEVEPASS Randomized Clinical Trial. JAMA [Internet]. 2018 Jan 16 [cited 2024 Mar 3];319(3):241. Available from: http://jama.jamanetwork.com/article.aspx?doi=10.1001/jama.2017.20313.
  18. Simoni M, Gromoll J, Nieschlag E. The Follicle-Stimulating Hormone Receptor: Biochemistry, Molecular Biology, Physiology, and Pathophysiology*. Endocrine Reviews [Internet]. 1997 Dec 1 [cited 2024 Jan 18];18(6):739–73. Available from: https://academic.oup.com/edrv/article/18/6/739/2530776.
  19. Ulloa-Aguirre A, Reiter E, Crépieux P. FSH Receptor Signaling: Complexity of Interactions and Signal Diversity. Endocrinology [Internet]. 2018 Aug 1 [cited 2024 Mar 3];159(8):3020–35. Available from: https://academic.oup.com/endo/article/159/8/3020/5047767.
  20. Sun L, Peng Y, Sharrow AC, Iqbal J, Zhang Z, Papachristou DJ, et al. FSH Directly Regulates Bone Mass. Cell [Internet]. 2006 Apr [cited 2024 Mar 3];125(2):247–60. Available from: https://linkinghub.elsevier.com/retrieve/pii/S0092867406003722.
  21. Conforti A, Vaiarelli A, Cimadomo D, Bagnulo F, Peluso S, Carbone L, et al. Pharmacogenetics of FSH Action in the Female. Front Endocrinol [Internet]. 2019 Jun 26 [cited 2024 Mar 3];10:398. Available from: https://www.frontiersin.org/article/10.3389/fendo.2019.00398/full.
  22. Lledo B, Ortiz JA, Llacer J, Bernabeu R. Pharmacogenetics of ovarian response. Pharmacogenomics [Internet]. 2014 Apr [cited 2024 Mar 3];15(6):885–93. Available from: https://www.futuremedicine.com/doi/10.2217/pgs.14.49.
  23. Mayorga MP, Gromoll J, Behre HM, Gassner C, Nieschlag E, Simoni M. Ovarian Response to Follicle-Stimulating Hormone (FSH) Stimulation Depends on the FSH Receptor Genotype*. The Journal of Clinical Endocrinology & Metabolism [Internet]. 2000 Sep 1 [cited 2024 Jan 18];85(9):3365–9. Available from: https://academic.oup.com/jcem/article/85/9/3365/2660666.
  24. Alviggi C, Conforti A, Caprio F, Gizzo S, Noventa M, Strina I, et al. In Estimated Good Prognosis Patients Could Unexpected “Hyporesponse” to Controlled Ovarian Stimulation be Related to Genetic Polymorphisms of FSH Receptor? Reprod Sci [Internet]. 2016 Aug [cited 2024 Mar 3];23(8):1103–8. Available from: https://link.springer.com/10.1177/1933719116630419.
  25. Jun JK, Yoon JS, Ku SY, Choi YM, Hwang KR, Park SY, et al. Follicle-stimulating hormone receptor gene polymorphism and ovarian responses to controlled ovarian hyperstimulation for IVF-ET. J Hum Genet [Internet]. 2006 Aug [cited 2024 Mar 3];51(8):665–70. Available from: https://www.nature.com/articles/jhg2006101.
  26. Voros C, Mavrogianni D, Stavros S, Papamentzelopoulou M, Dimitroulia E, Doumplis D, et al. CART (Cocaine- and Amphetamine-Regulated Transcript): A New Identified Intrafollicular Mediator in Ovulation Induction Protocols. Biomedicines [Internet]. 2024 Nov 13 [cited 2024 Dec 11];12(11):2598. Available from: https://www.mdpi.com/2227-9059/12/11/2598.
  27. Prodromidou A, Dimitroulia E, Mavrogianni D, Kathopoulis N, Pappa KI, Loutradis D. The Effect of the Allelics of Ser680Asn Polymorphisms of Follicle-Stimulating Hormone Receptor Gene in IVF/ICSI Cycles: a Systematic Review and Meta-analysis. Reprod Sci [Internet]. 2023 Feb [cited 2024 Oct 7];30(2):428–41. Available from: https://link.springer.com/10.1007/s43032-022-00996-x. [CrossRef]
  28. Huang X, Li L, Hong L, Zhou W, Shi H, Zhang H, et al. The Ser680Asn polymorphism in the follicle-stimulating hormone receptor gene is associated with the ovarian response in controlled ovarian hyperstimulation. Clinical Endocrinology [Internet]. 2015 Apr [cited 2024 Dec 3];82(4):577–83. Available from: https://onlinelibrary.wiley.com/doi/10.1111/cen.12573.
  29. Tang H, Yan Y, Wang T, Zhang T, Shi W, Fan R, et al. Effect of follicle-stimulating hormone receptor Asn680Ser polymorphism on the outcomes of controlled ovarian hyperstimulation: an updated meta-analysis of 16 cohort studies. J Assist Reprod Genet [Internet]. 2015 Dec [cited 2024 Dec 2];32(12):1801–10. Available from: http://link.springer.com/10.1007/s10815-015-0600-5.
  30. Sayers NS, Anujan P, Yu HN, Palmer SS, Nautiyal J, Franks S, et al. Follicle-Stimulating Hormone Induces Lipid Droplets via Gαi/o and β-Arrestin in an Endometrial Cancer Cell Line. Front Endocrinol [Internet]. 2022 Feb 3 [cited 2024 Dec 2];12:798866. Available from: https://www.frontiersin.org/articles/10.3389/fendo.2021.798866/full.
  31. Liu P, Ji Y, Yuen T, Rendina-Ruedy E, DeMambro VE, Dhawan S, et al. Blocking FSH induces thermogenic adipose tissue and reduces body fat. Nature [Internet]. 2017 Jun [cited 2024 Mar 3];546(7656):107–12. Available from: https://www.nature.com/articles/nature22342. [CrossRef]
  32. Haffner SM, Katz MS, Stern MP, Dunn JF. Relationship of sex hormone binding globulin to overall adiposity and body fat distribution in a biethnic population. Int J Obes. 1989;13(1):1–9.
  33. Mahboobifard F, Pourgholami MH, Jorjani M, Dargahi L, Amiri M, Sadeghi S, et al. Estrogen as a key regulator of energy homeostasis and metabolic health. Biomedicine & Pharmacotherapy [Internet]. 2022 Dec [cited 2024 Dec 2];156:113808. Available from: https://linkinghub.elsevier.com/retrieve/pii/S0753332222011970.
  34. Sudo S. Genetic and functional analyses of polymorphisms in the human FSH receptor gene. Molecular Human Reproduction [Internet]. 2002 Oct 1 [cited 2024 Jan 18];8(10):893–9. Available from: https://academic.oup.com/molehr/article-lookup/doi/10.1093/molehr/8.10.893.
  35. Maheshwari A, Stofberg L, Bhattacharya S. Effect of overweight and obesity on assisted reproductive technology—a systematic review. Human Reproduction Update [Internet]. 2007 Sep 1 [cited 2024 Dec 2];13(5):433–44. Available from: http://academic.oup.com/humupd/article/13/5/433/658893/Effect-of-overweight-and-obesity-on-assisted.
Figure 1. Flow chart for patient exclusion and inclusion in the research.
Preprints 142692 g001
Table 1. Effect of FSHR Polymorphisms on Hormonal and Ovarian Reserve Parameters prior surgery.
Variable Asn/Asn Asn/Ser Ser/Ser
FSH (mIU/mL)_mean 5.2 5.68 7.41
FSH (mIU/mL)_std 0.63 0.68 0.60
LH (mIU/mL)_mean 6.62 7.13 6.68
LH (mIU/mL)_std 0.82 0.79 1.45
E2 (pg/mL)_mean 31.87 30.63 29.8
E2 (pg/mL)_std 4.79 3.53 3.26
SHBG (nmol/l)_mean 37.38 38.61 31.23
SHBG (nmol/l)_std 8.99 6.83 5.31
Free Testo (ng/dL)_mean 28.8 27.18 31.12
Free Testo (ng/dL)_std 8.92 11.10 6.90
AMH (ng/mL)_mean 2.1 2.13 2.19
AMH (ng/mL)_std 0.26 0.23 0.26
AFC - Right Ovary_mean 9.75 10.46 10.62
AFC - Right Ovary_std 2.05 2.93 2.38
AFC - Left Ovary_mean 9.12 9.23 9.5
AFC - Left Ovary_std 3.18 2.71 2.0
BMI (before surgery)_mean 42.38 41.40 39.38
BMI (before surgery)_std 4.07 3.31 1.51
Table 2. Statistical analysis of hormonal and physiological markers across FSHR polymorphisms before surgery.
Variable F-statistic p-value
FSH (mIU/mL) 26.54 >0.00
LH (mIU/mL) 0.78 0.46
E2 (pg/mL) 0.58 0.56
SHBG (nmol/l) 2.78 0.07
Free Testo (ng/dL) 0.42 0.66
AMH (ng/mL) 0.34 0.71
AFC Right Ovary 0.27 0.76
AFC Left Ovary 0.42 0.95
BMI (Before Surgey) 1.86 0.17
Table 3. Pairwise Comparisons of FSH Levels Among FSHR Polymorphisms Before Surgery.
group1 group2 Mean diff p-adj
Asn/Asn Asn/Ser 0.4846 0.2386
Asn/Asn Ser/Ser 2.2125 0.0
Asn/Ser Ser/Ser 1.7279 0.0
Table 4. Correlation of eNOS expression with clinical parameters before bariatric surgery.
Variable Mean Standard Deviation Pearson Correlation P-value
Age 33.034 4.075 0.111 0.565
FSH (mIU/mL) 6.028 1.091 0.188 0.328
LH (mIU/mL) 6.869 1.014 0 0.997
E2 (pg/mL) 30.752 3.795 0.249 0.193
SHBG (nmol/l) 36.241 7.579 -0,076 0.696
Free Testosterone (ng/dL) 28.717 9.354 0.285 0.133
AMH (ng/mL) 2.141 0.244 0.115 0.552
AFC - RightOvary 10.31 2.509 0.095 0.623
AFC - LeftOvary 9.276 2.59 0.063 0.746
BMI (beforesurgery) 41.117 3.281 -0.266 0.162
Table 5. Pairwise Comparisons of eNOS Expression Among FSHR Polymorphism Groups before surgery.
group1 group2 meandiff p-adj lower upper
Asn/Asn Asn/Ser 0.3705 0.8864 -1.5927 2.3337
Asn/Asn Ser/Ser 0.8425 0.6091 -1.342 3.027
Asn/Ser Ser/Ser 472 0.8227 -1.4912 2.4352
Table 6. summarizes the mean and standard deviation (std) of post-surgery hormonal parameters, ovarian reserve markers, and BMI across the three FSHR polymorphism groups: Asn/Asn, Asn/Ser, and Ser/Ser. The parameters include FSH, LH, E2, SHBG, Free Testo, AMH, AFC for both ovaries, and BMI.
Variable. Asn/Asn Asn/Ser Ser/Ser
FSH (mIU/mL)_mean 8.95 8.47 9.45
FSH (mIU/mL)_std 0.79 0.61 0.87
LH (mIU/mL)_mean 9.26 8.28 9.28
LH (mIU/mL)_std 1.23 0.83 0.72
E2 (pg/mL)_mean 46.95 50.23 49.875
E2 (pg/mL)_std 4.07 4.79 4.24
SHBG (nmol/l)_mean 69.725 64.081 58.825
SHBG (nmol/l)_std 11.59 13.90 9.04
Free Testo (ng/dL)_mean 9.53 8.49 10.81
Free Testo (ng/dL)_std 2.55 1.62 3.25
AMH (ng/mL)_mean 2.9 2.98 2.96
AMH (ng/mL)_std 0.16 0.16 0.11
AFC - Right Ovary_mean 7.75 7.07 7.5
AFC_Right_Ovary_std 1.75 1.65 1.6
AFC_Left_Ovary_mean 7.0 6.5 6.8
AFC_Left_Ovary_std 1.41 1.19 1.24
BMI_mean 26.38 25.72 26.0
BMI_std 1.29 1.42 1.45
Table 7. Effect of FSHR Polymorphisms on Hormonal Parameters and Ovarian Reserve Markers Post-Surgery.
Variable F-statistic p-value
FSH (mIU/mL) 4.26 0.024
LH (mIU/mL) 4.01 0.030
E2 (pg/mL) 1.45 0.252
SHBG (nmol/l) 1.61 0.218
Free Testo (ng/dL) 2.30 0.120
AMH (ng/mL) 0.76 0.477
AFC - Right Ovary 0.43 0.654
AFC - Left Ovary 0.37 0.693
BMI (After 6 Months) 0.55 0.578
Table 8. Analysis of Correlation of CPT eNOS and Clinical Parameters Post Bariatric Surgery.
Variable Mean Standard Deviation PearsonCorrelation P-value
AFC - Left Ovary - Post Surgery 6.759 1.244 -0.149 0.439
AFC - Right Ovary - Post Surgery 7.379 1.635 0.037 0.849
AMH (ng/mL) - Post Surgery 2.955 0.153 0.102 0.597
BMI (After 6 Months) 25.9 1.377 -0.248 0.194
E2 (pg/mL) - Post Surgery 49.2 4.538 -0.156 0.42
FSH (mIU/mL) - Post Surgery 8.87 0.08 0,08 0.677
Free Testosterone (ng/dL) - Post Surgery 9.421 2.524 -0.151 0.436
LH (mIU/mL) - Post Surgery 8.831 1.032 -0.121 0.532
SHBG (nmol/l) - Post Surgery 64.188 12.408 -0.365 0.049
Table 9. Pairwise Comparisons of FSH Levels Among FSHR Polymorphism Groups After Surgery.
group1 group2 meandiff p-adj lower upper
Asn/Asn Asn/Ser -0.4731 0.3498 -1.3059 0.3597
Asn/Asn Ser/Ser 0.5 0.3861 -0.4267 1.4267
Asn/Ser Ser/Ser 0.9731 0.0197 0.1403 1.8059
Table 10. LH Levels Across FSHR Polymorphism Groups After Surgery.
group1 group2 meandiff p-adj lower upper
Asn/Asn Asn/Ser -0.9779 0.07 -2.0232 0.0674
Asn/Asn Ser/Ser 25 0.9984 -1.1381 1.1881
Asn/Ser Ser/Ser 1.0029 0.0619 -0.0424 2.0482
Table 11. caption.
Table 11. caption.
group1 group2 meandiff p-adj lower upper
Asn/Asn Asn/Ser 0.389 0.925 -2.191 2.971
Asn/Asn Ser/Ser 1.595 0.365 -1.277 4.467
Asn/Ser Ser/Ser 1.205 0.486 -1.376 3.786
Table 12. Caption.
Table 12. Caption.
Polymorphism t-statistic p-value
Asn/Ser -10.38 <0.00
Ser/Ser -9.06 <0.00
Asn/Asn -7.64 <0.00
Disclaimer/Publisher’s Note: The statements, opinions and data contained in all publications are solely those of the individual author(s) and contributor(s) and not of MDPI and/or the editor(s). MDPI and/or the editor(s) disclaim responsibility for any injury to people or property resulting from any ideas, methods, instructions or products referred to in the content.
Copyright: This open access article is published under a Creative Commons CC BY 4.0 license, which permit the free download, distribution, and reuse, provided that the author and preprint are cited in any reuse.
Prerpints.org logo

Preprints.org is a free preprint server supported by MDPI in Basel, Switzerland.

Subscribe

Disclaimer

Terms of Use

Privacy Policy

Privacy Settings

© 2025 MDPI (Basel, Switzerland) unless otherwise stated