Submitted:
20 December 2024
Posted:
23 December 2024
You are already at the latest version
Abstract
This study explores a sustainable method for recycling television plastic shell waste (TPSW) by using it as a partial replacement for sand in cement mortar production. By evaluating water-cement ratios (0.4, 0.5, 0.6) and TPSW levels (0%, 5%, 10%, 15%), the research assesses key properties such as slump, compressive strength, and durability. Results show that TPSW absorbs less water than natural sand, increasing the number of pores and slightly reducing strength. However, a 5% substitution led to minimal performance loss after 91 days, while improving sulfate resistance and resistivity. Overall, incorporating 5% TPSW reduces environmental impact and carbon emissions, offering a sustainable solution for cement production.
Keywords:
1. Introduction
2. Experimental Design
2.1. Experimental Materials
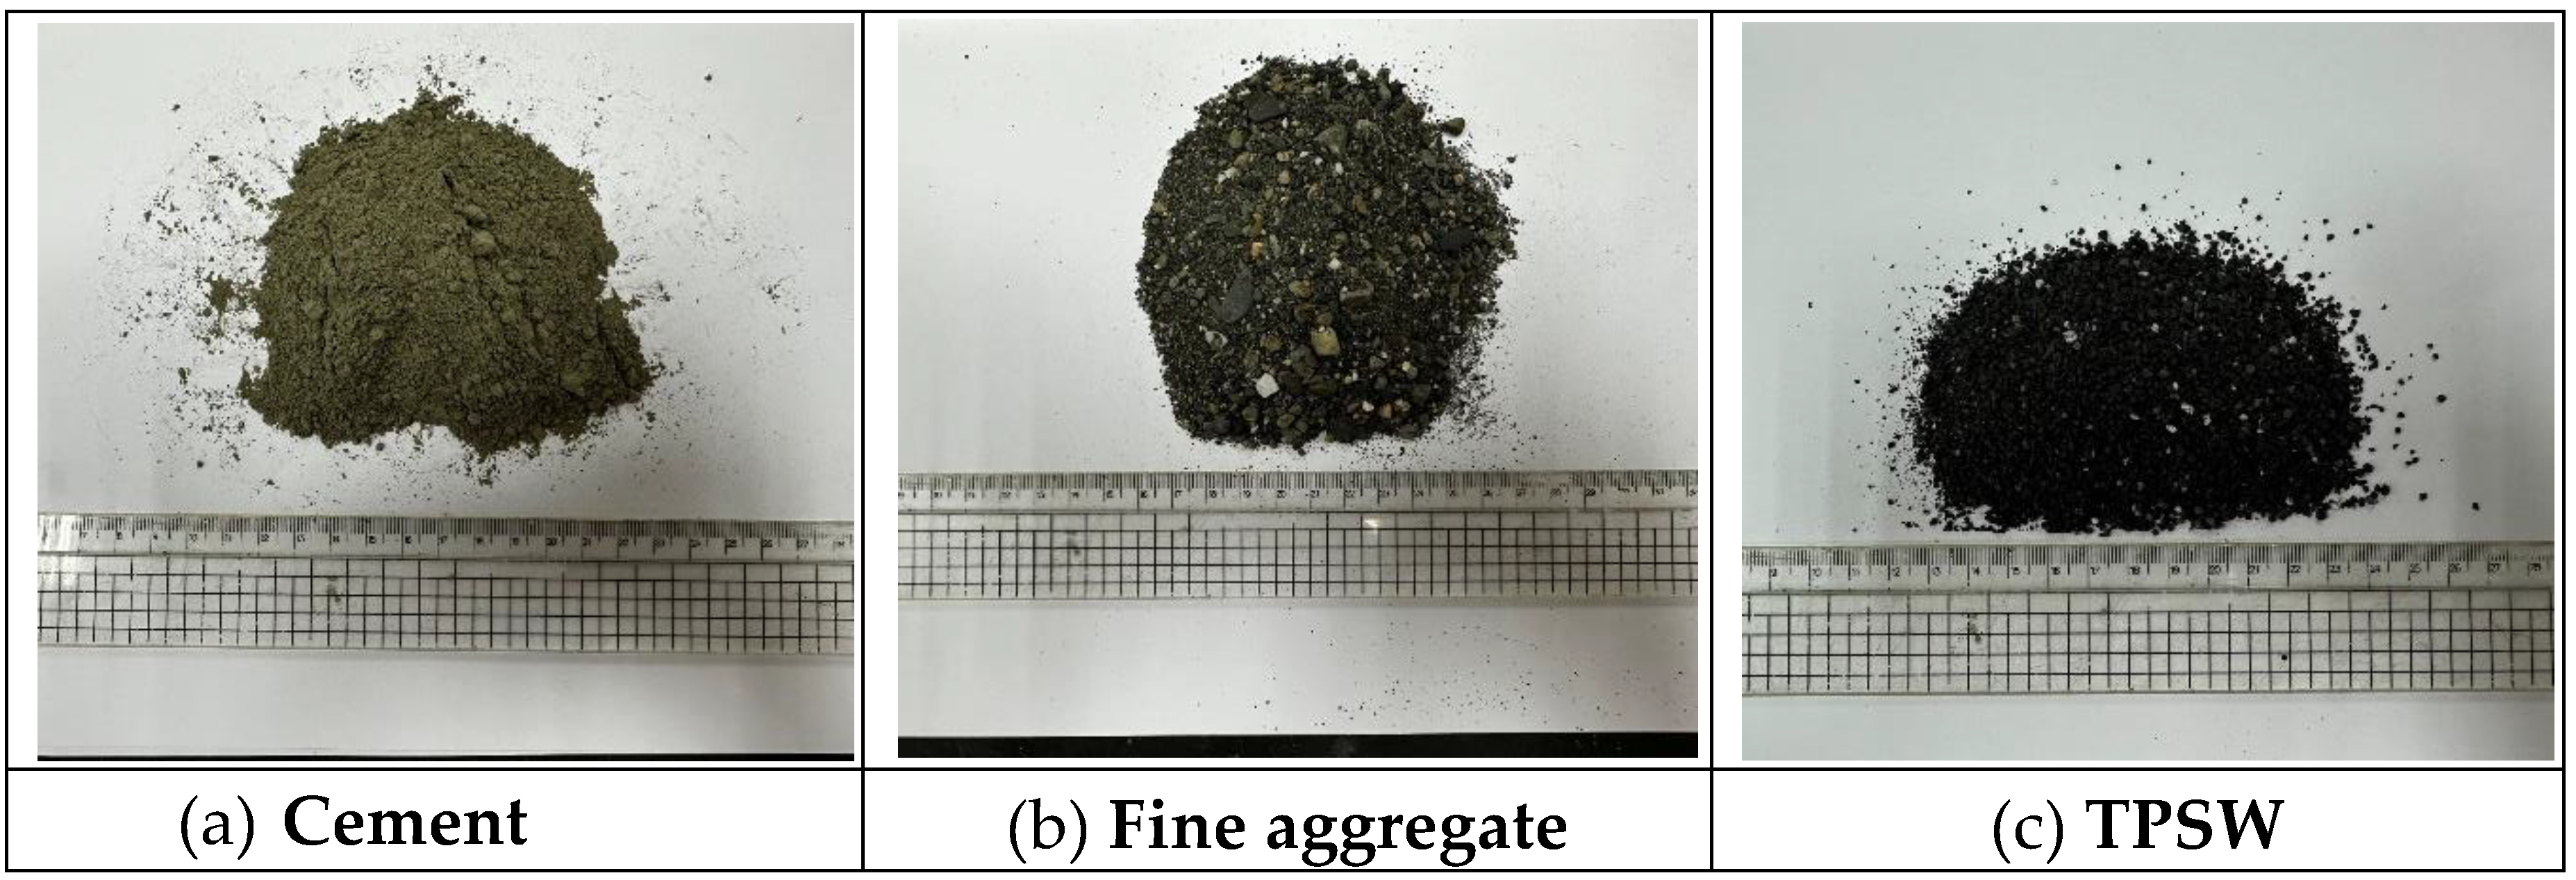
- Fine aggregate: River sand from the Laolong River. The saturated surface dry specific gravity was tested according to CNS 487 specifications. The saturated surface dry specific gravity was 2.65, and the water absorption was 1.9%. Its appearance is shown in Figure 1(b), and its physical properties are shown in Table 3.
- TPSW: The TV shell was made of HIPS and was provided by the manufacturer. The TPSW originally appeared in the form of black flakes. After being crushed by a crusher, the TPSW appeared in the form of a black powder. Its appearance is shown in Figure 1(c), and its physical properties are shown in Table 3.
2.2. Test Variables and Items
3. Results and Analysis
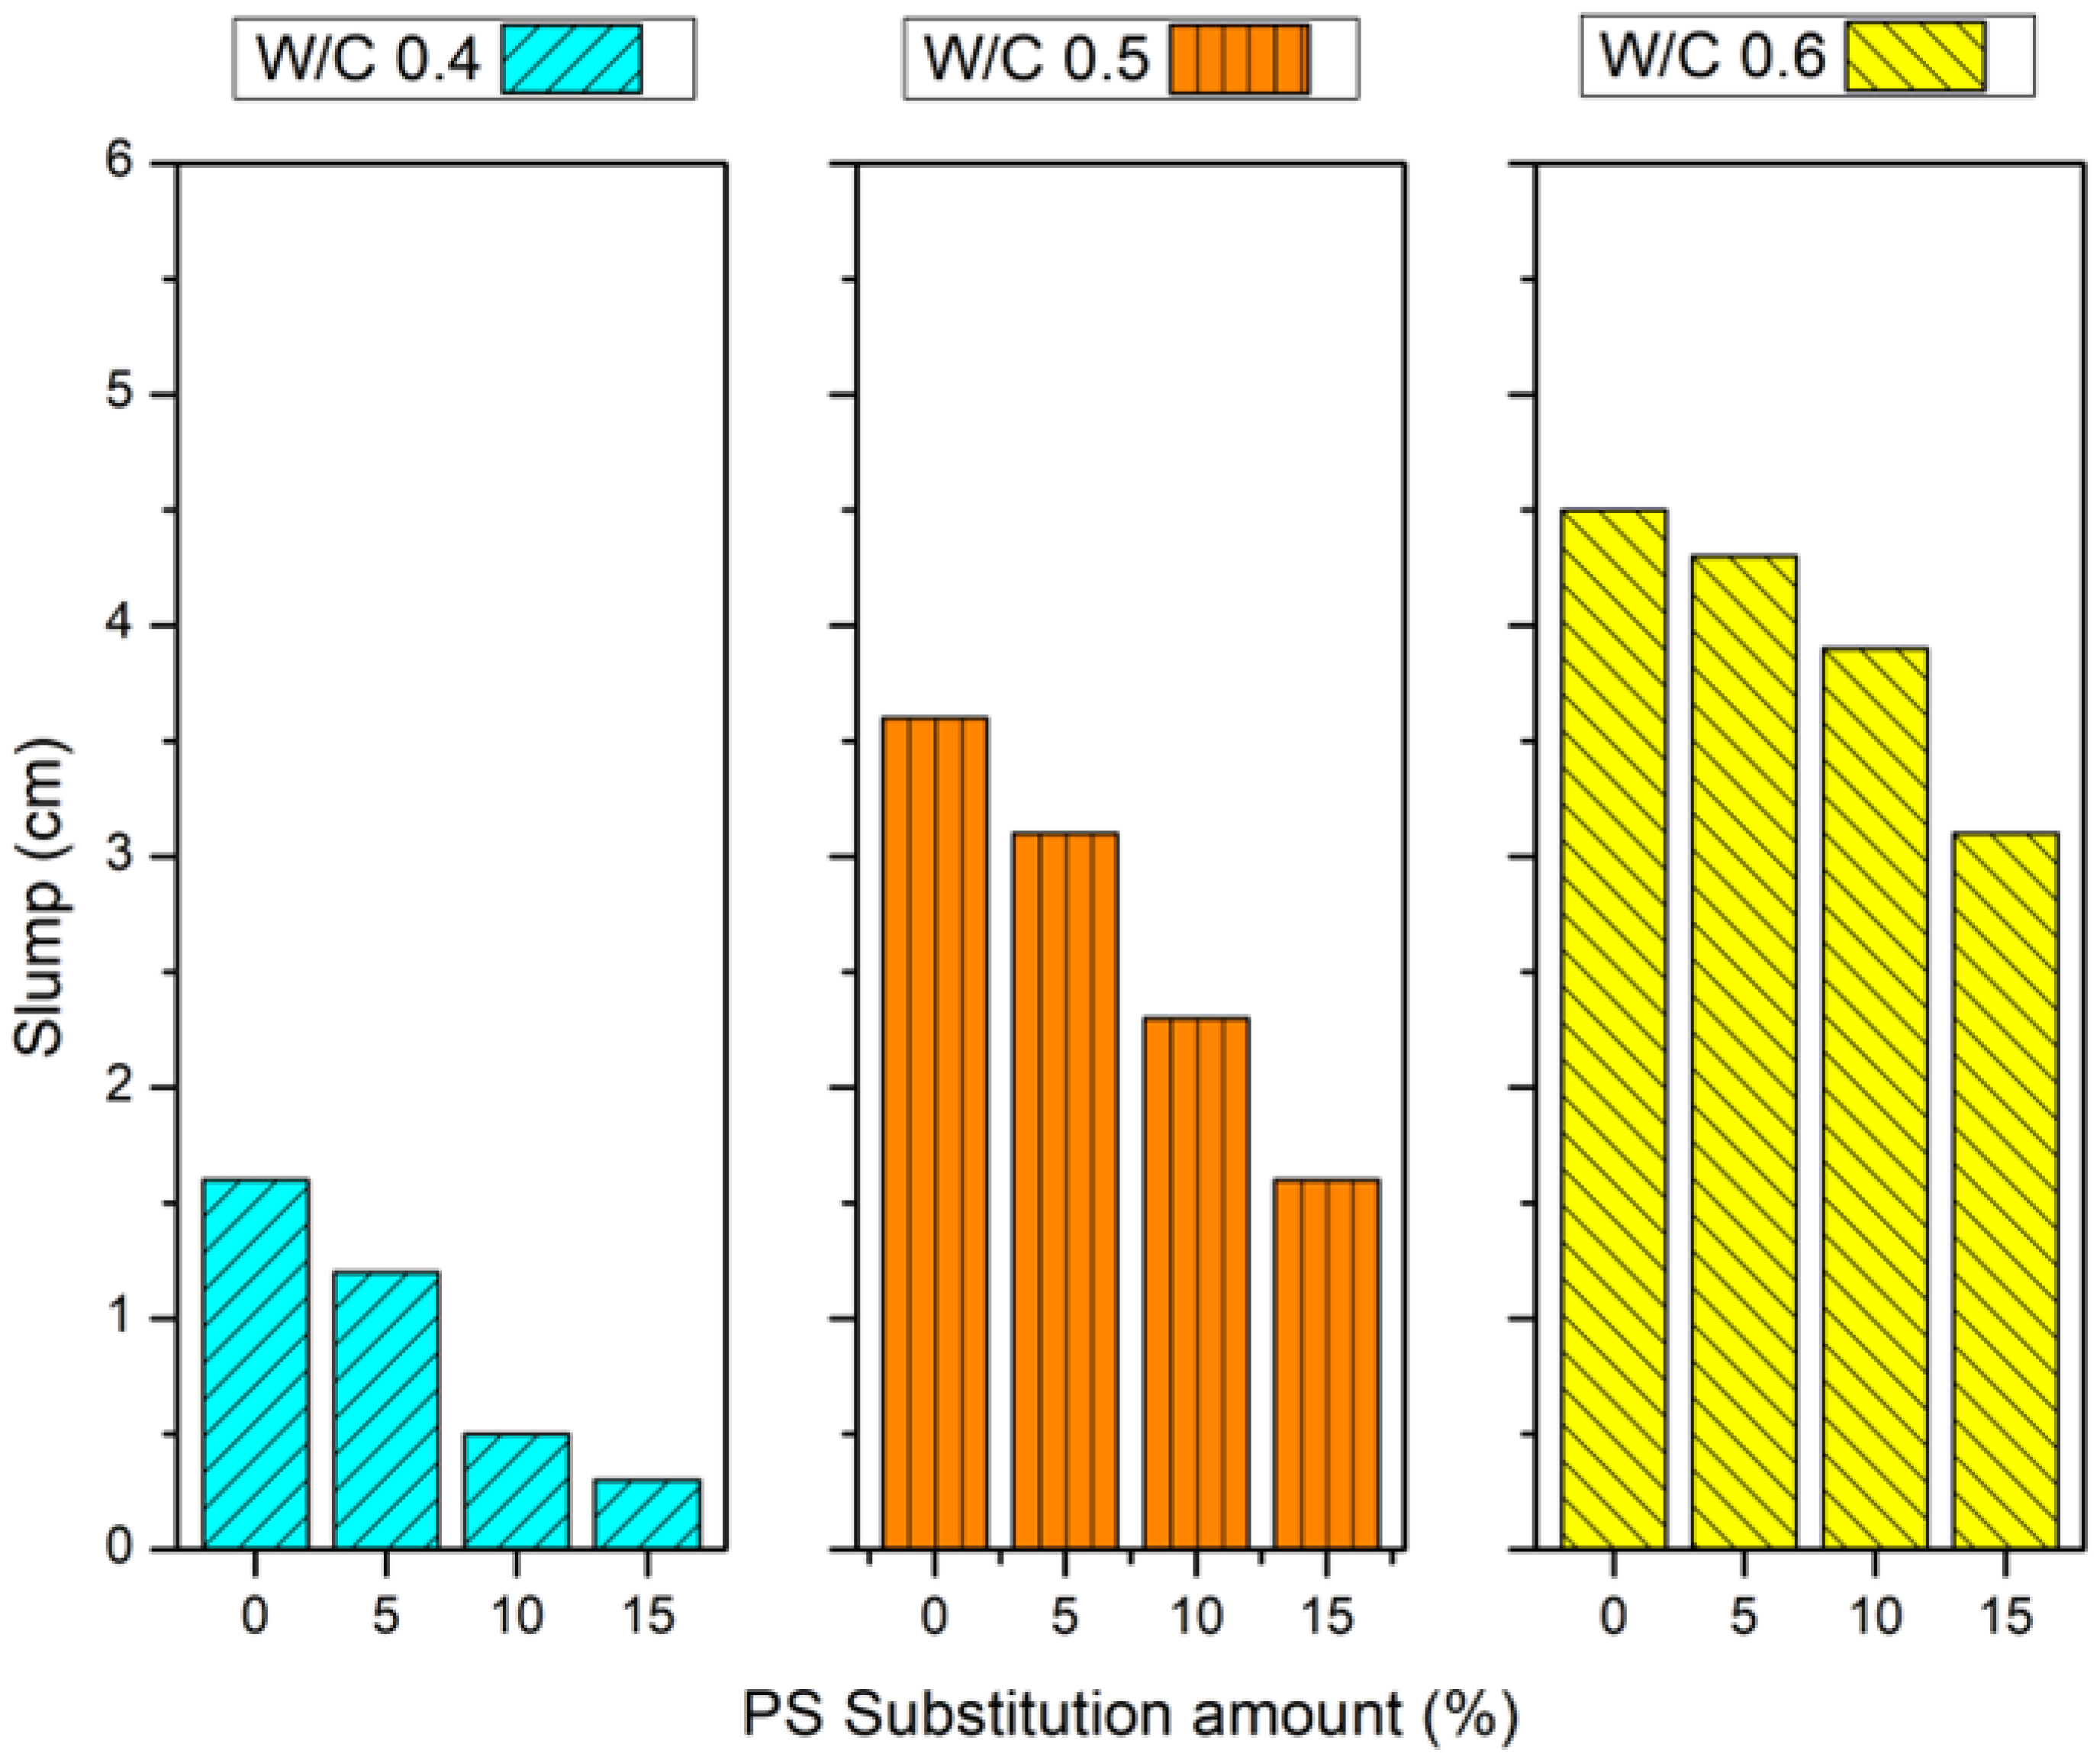
3.1. Slump
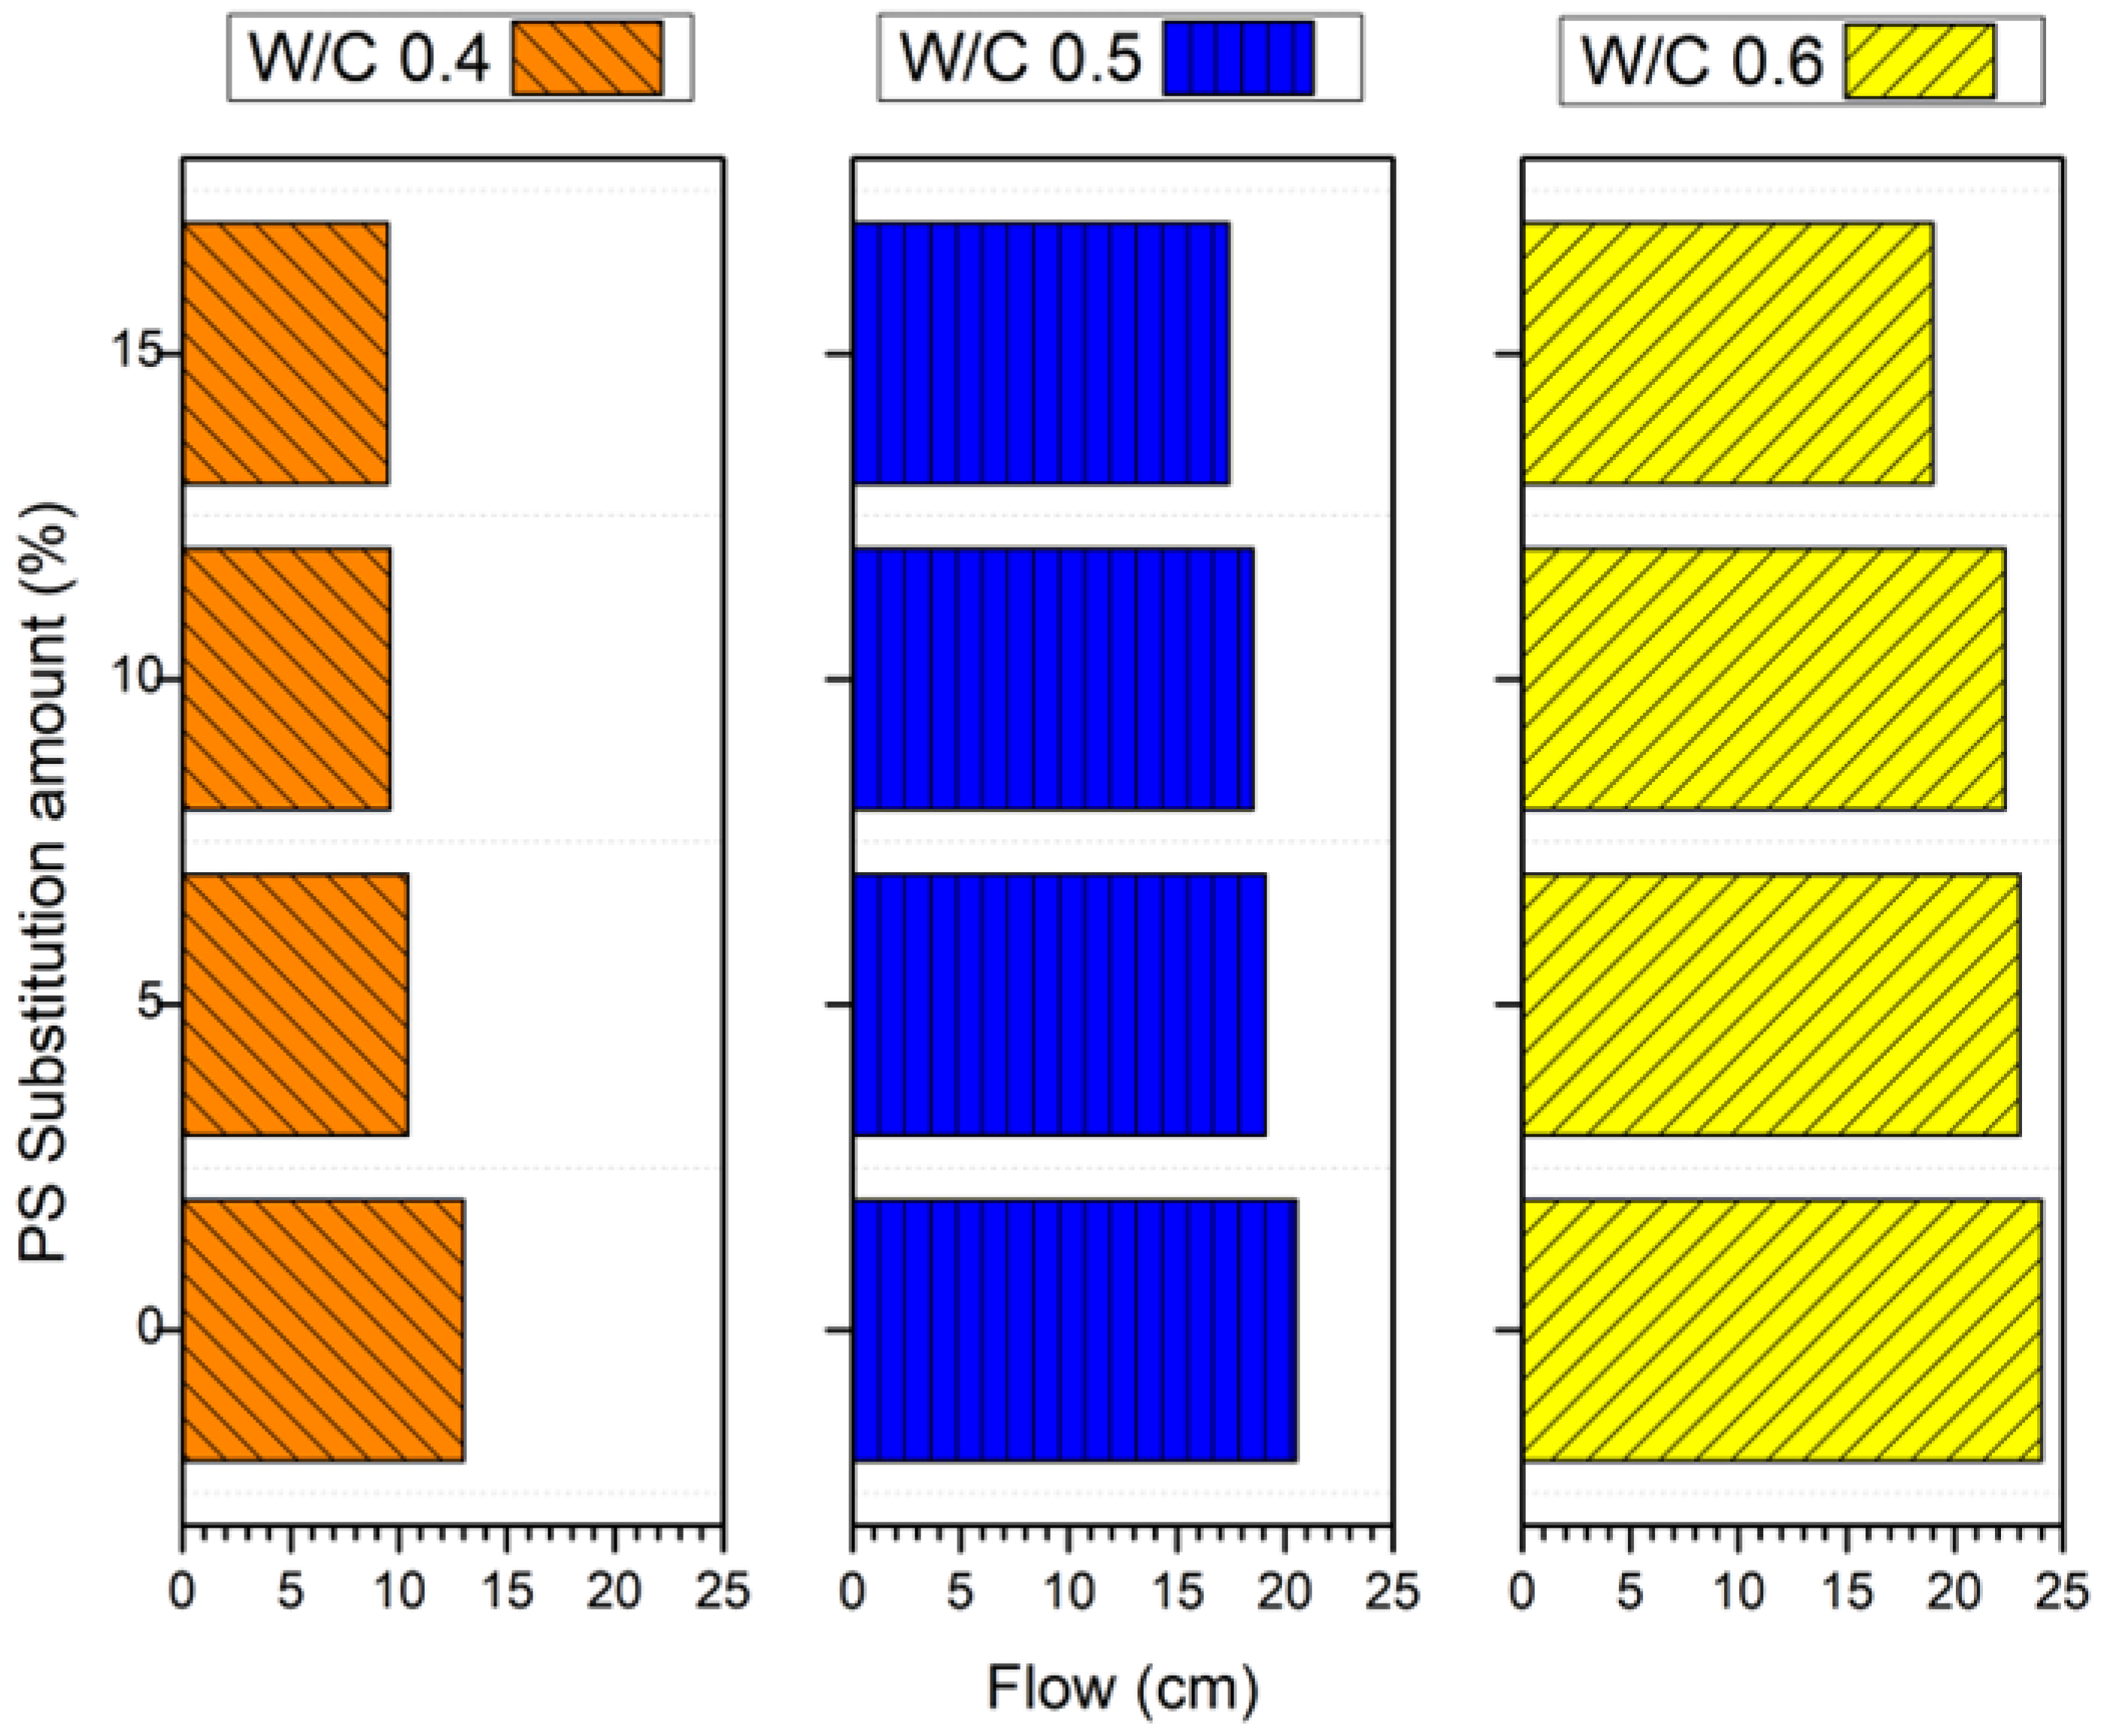
3.2. Slump Flow
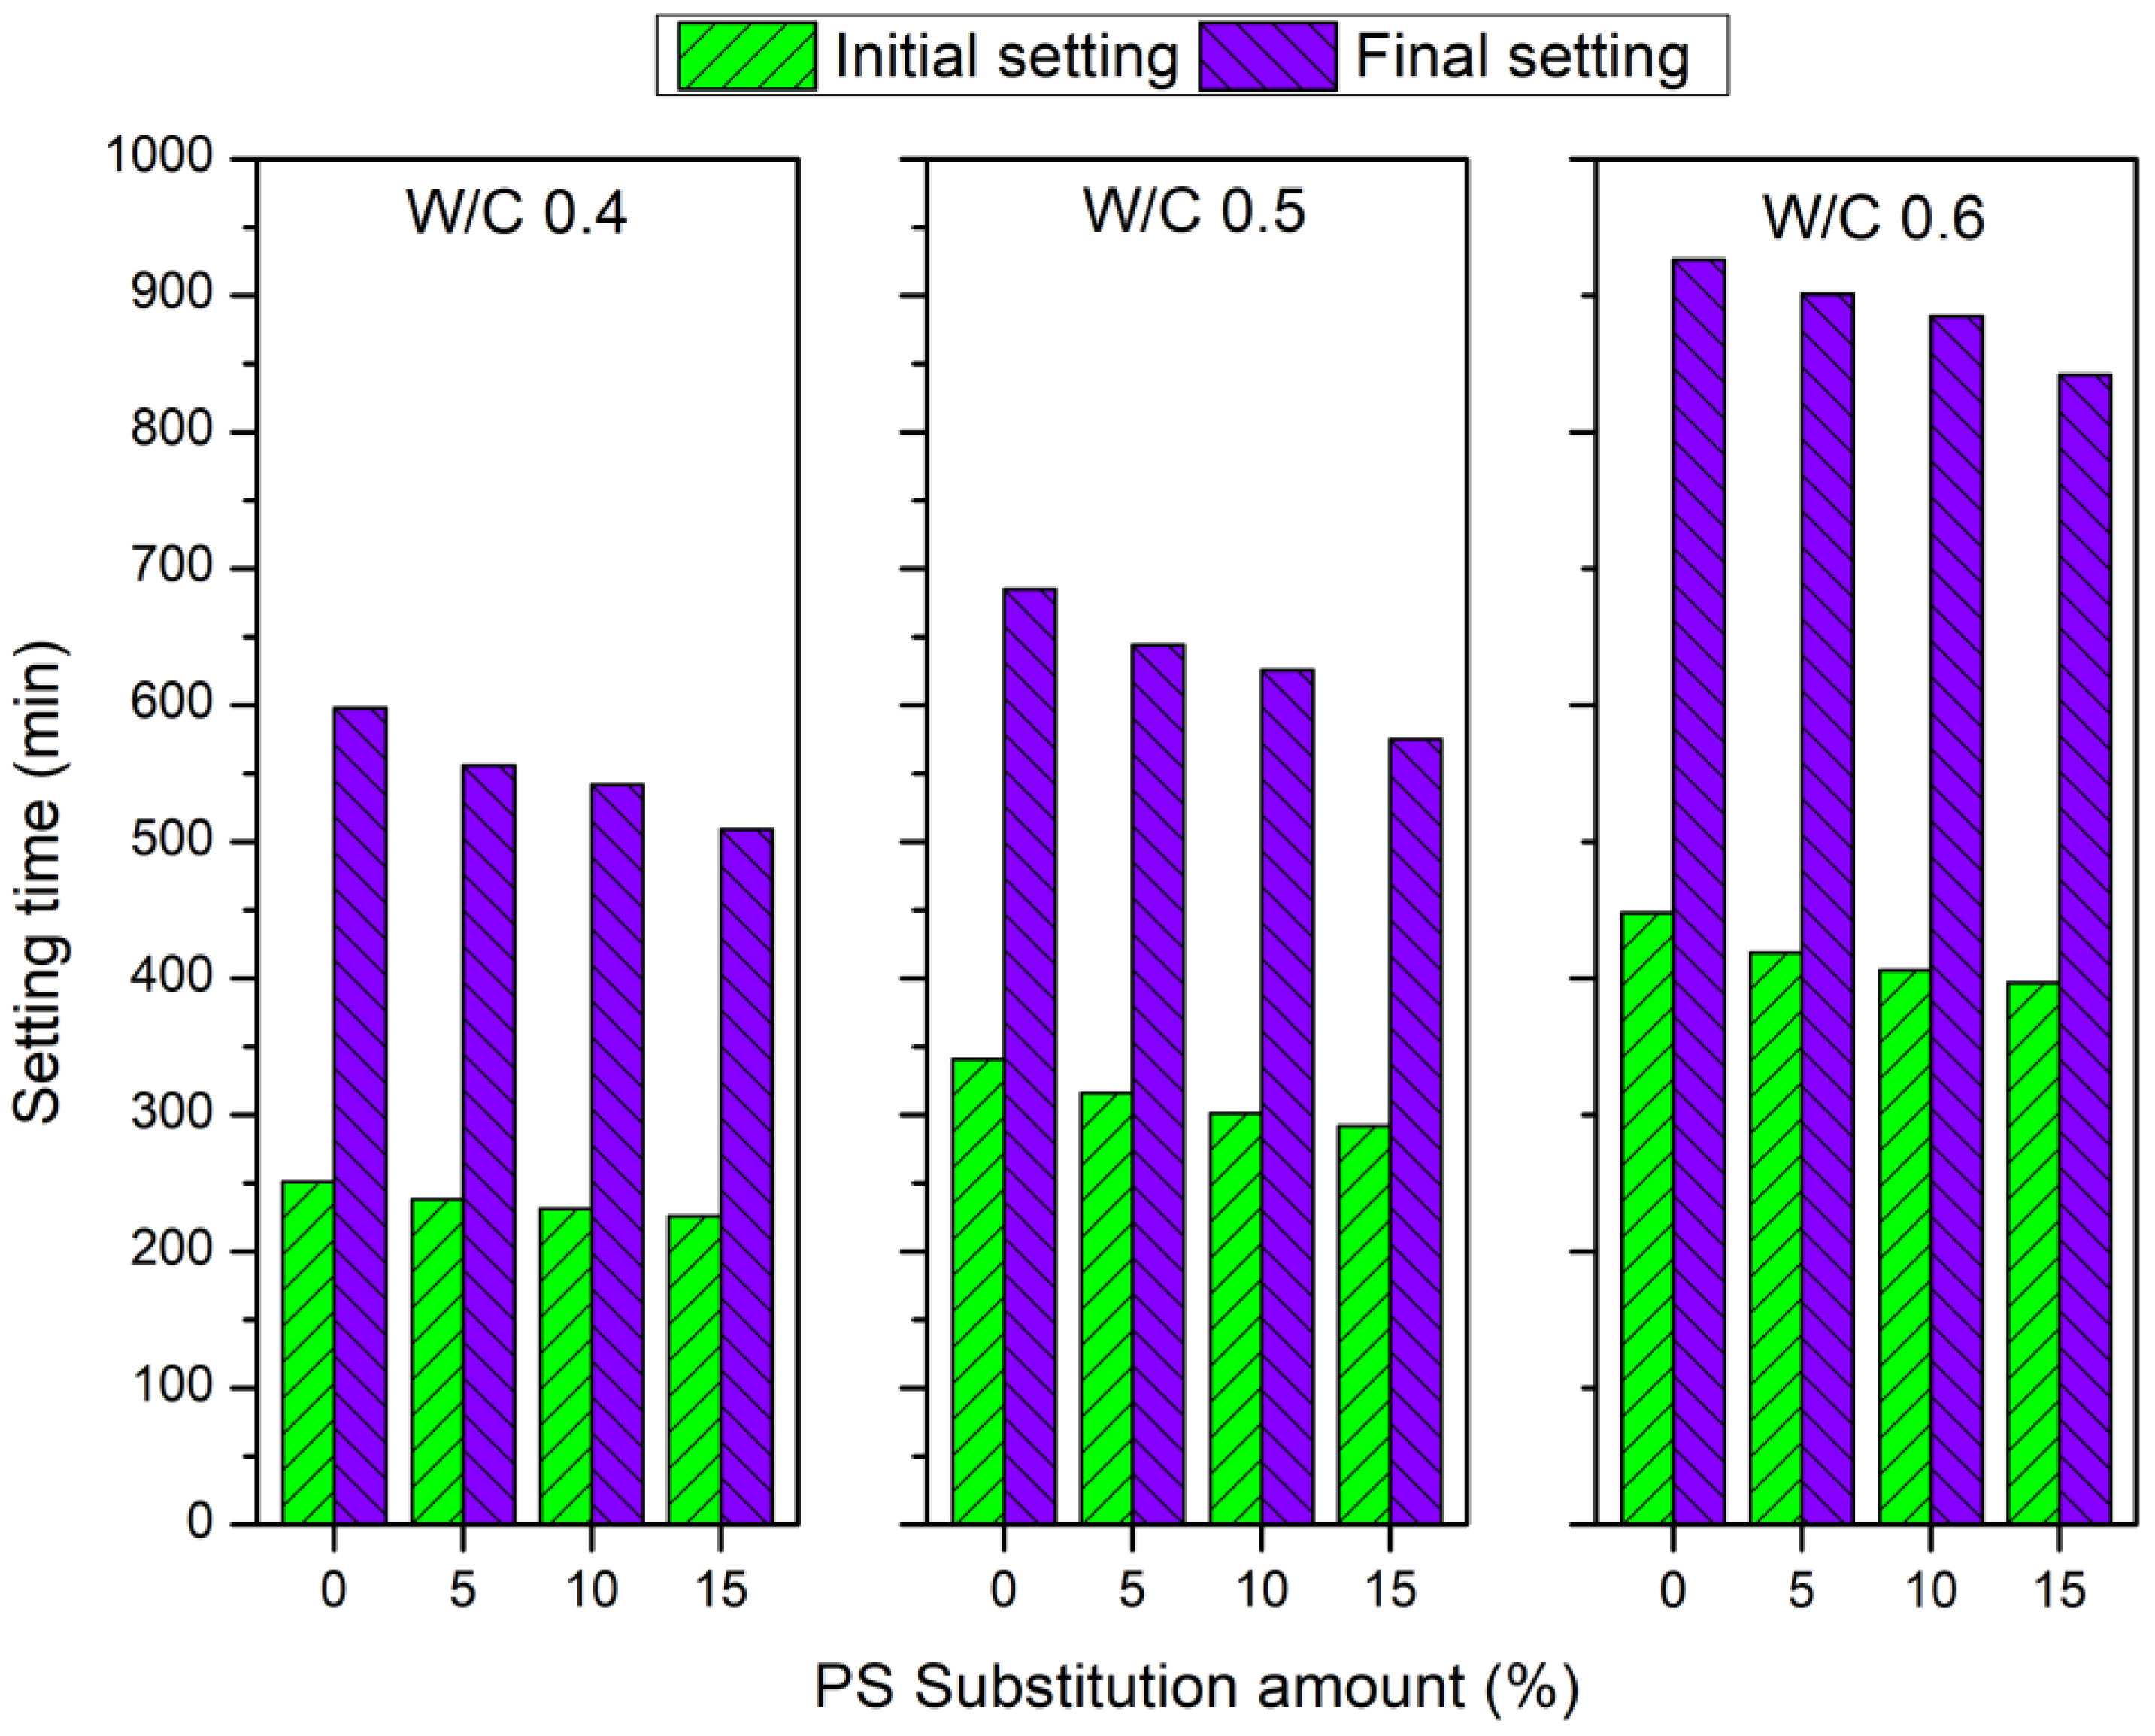
3.3. Setting Time
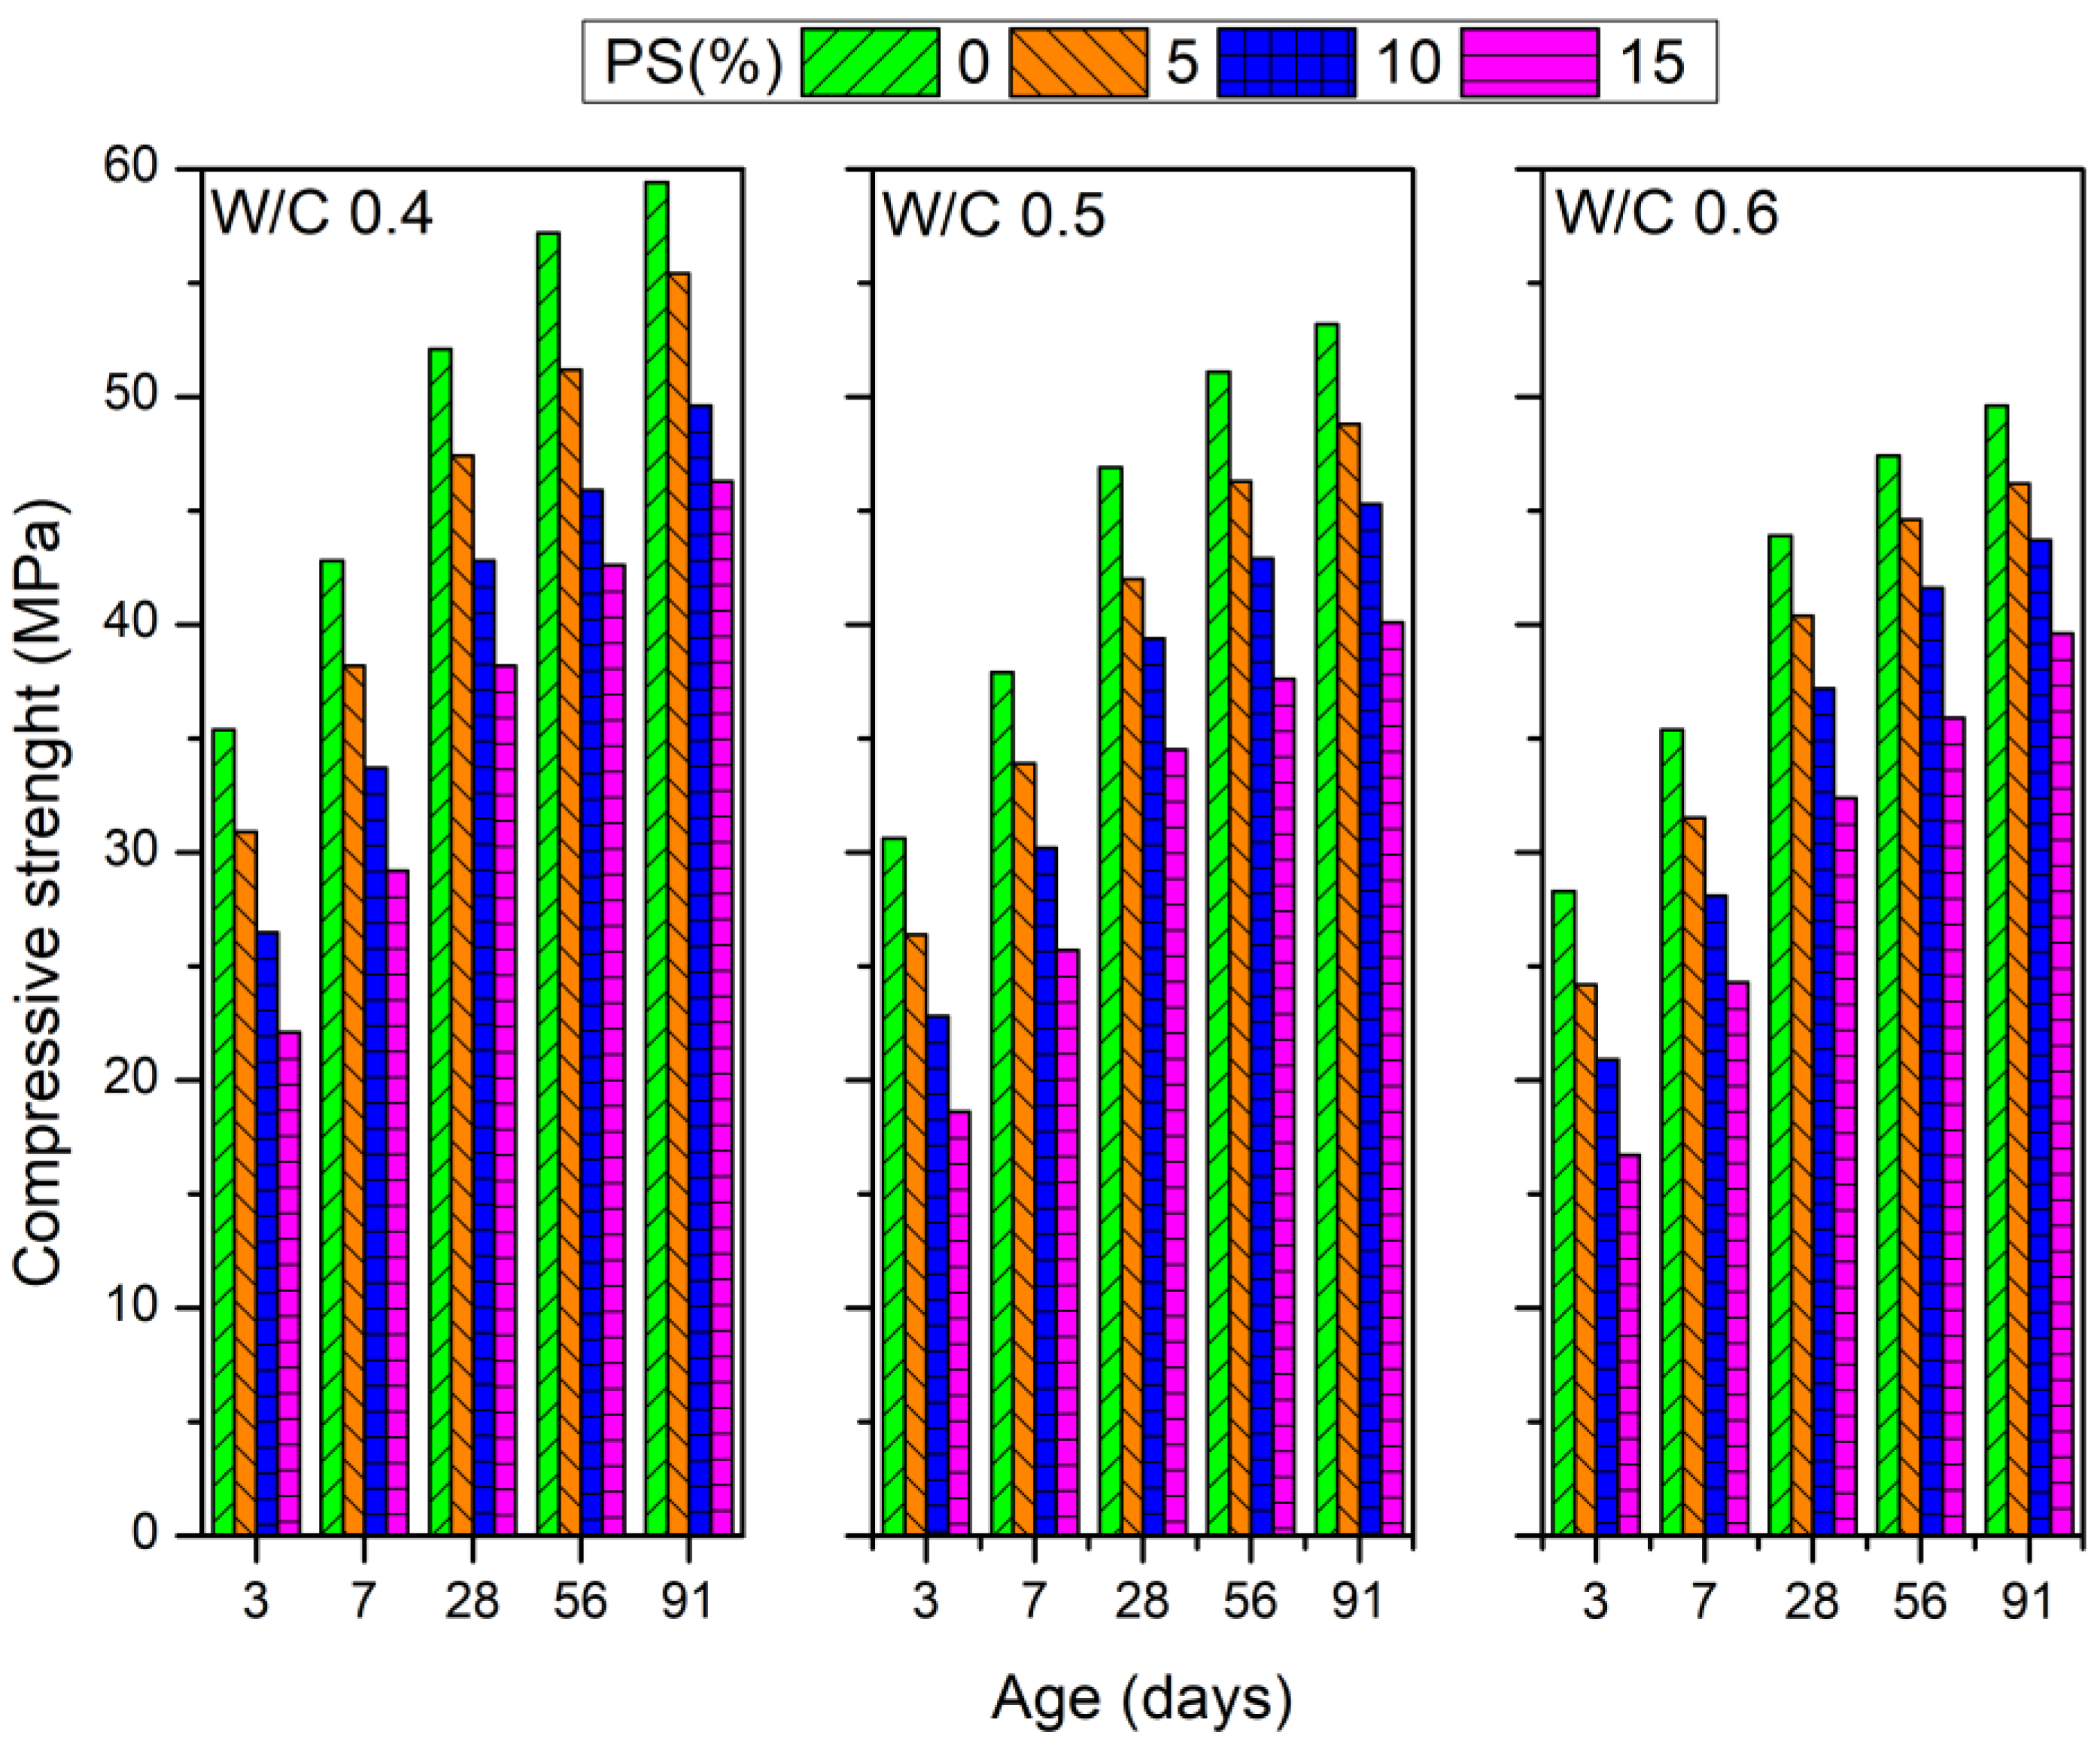
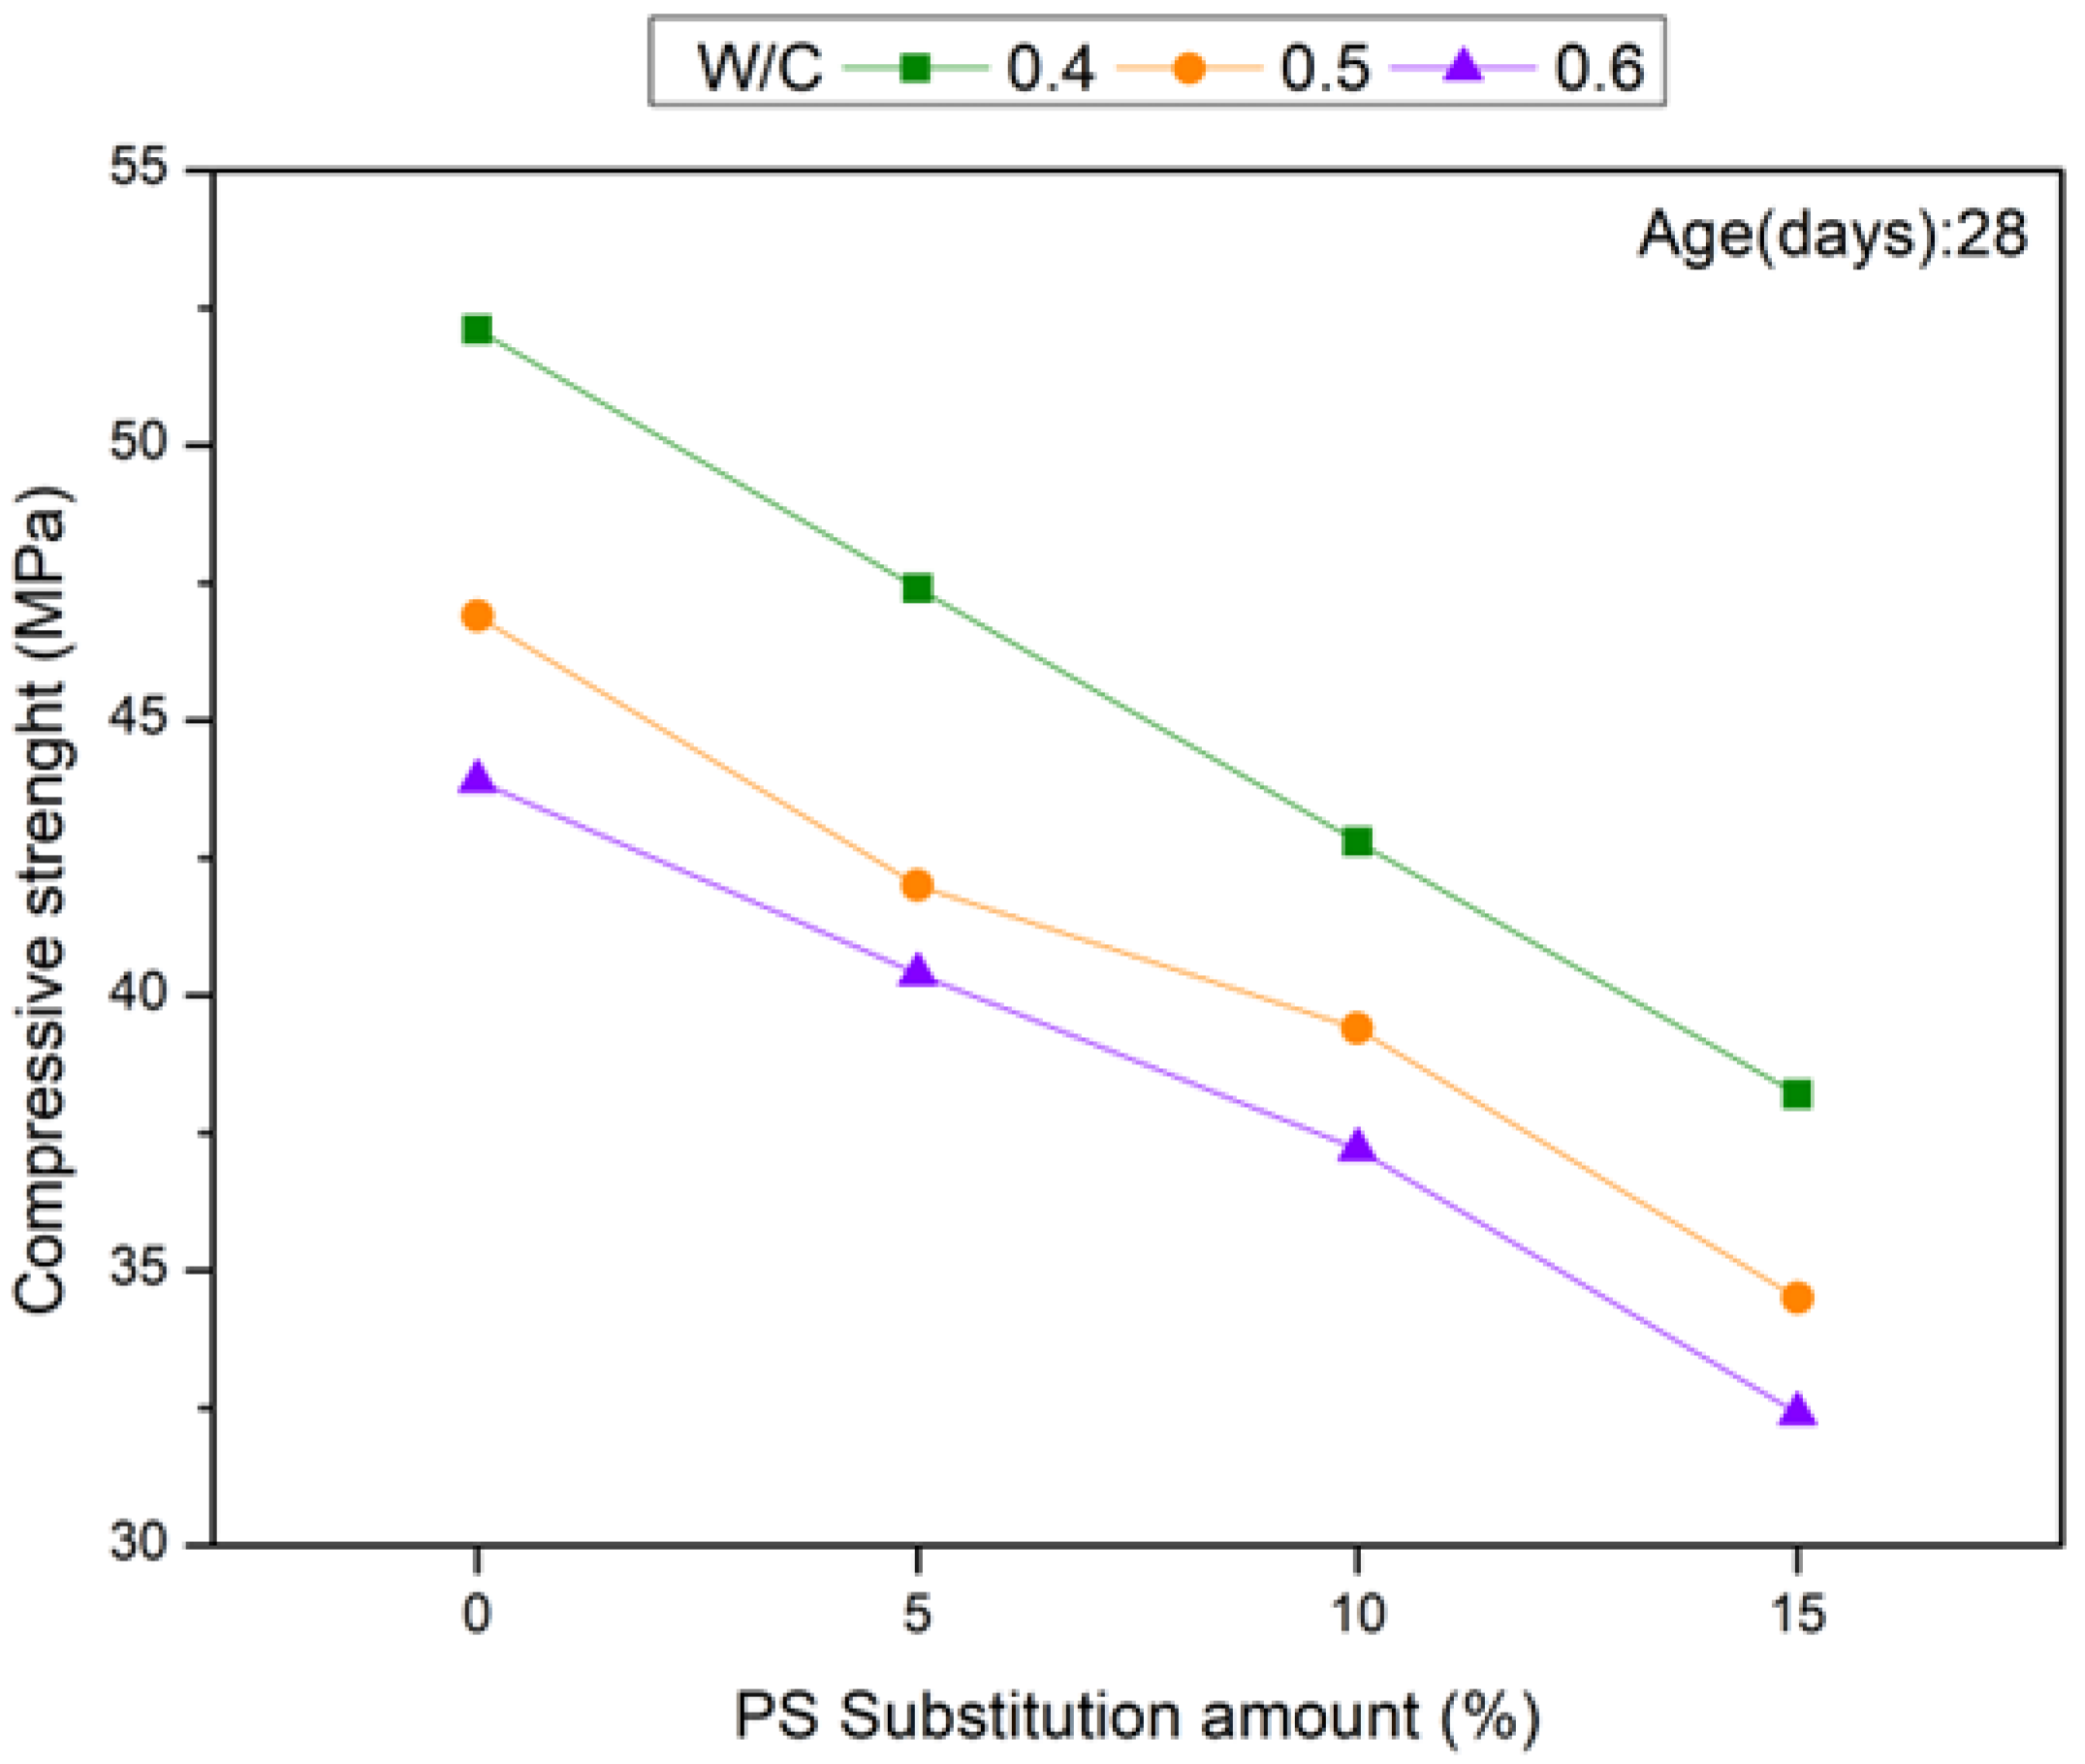
3.4. Compressive Strength
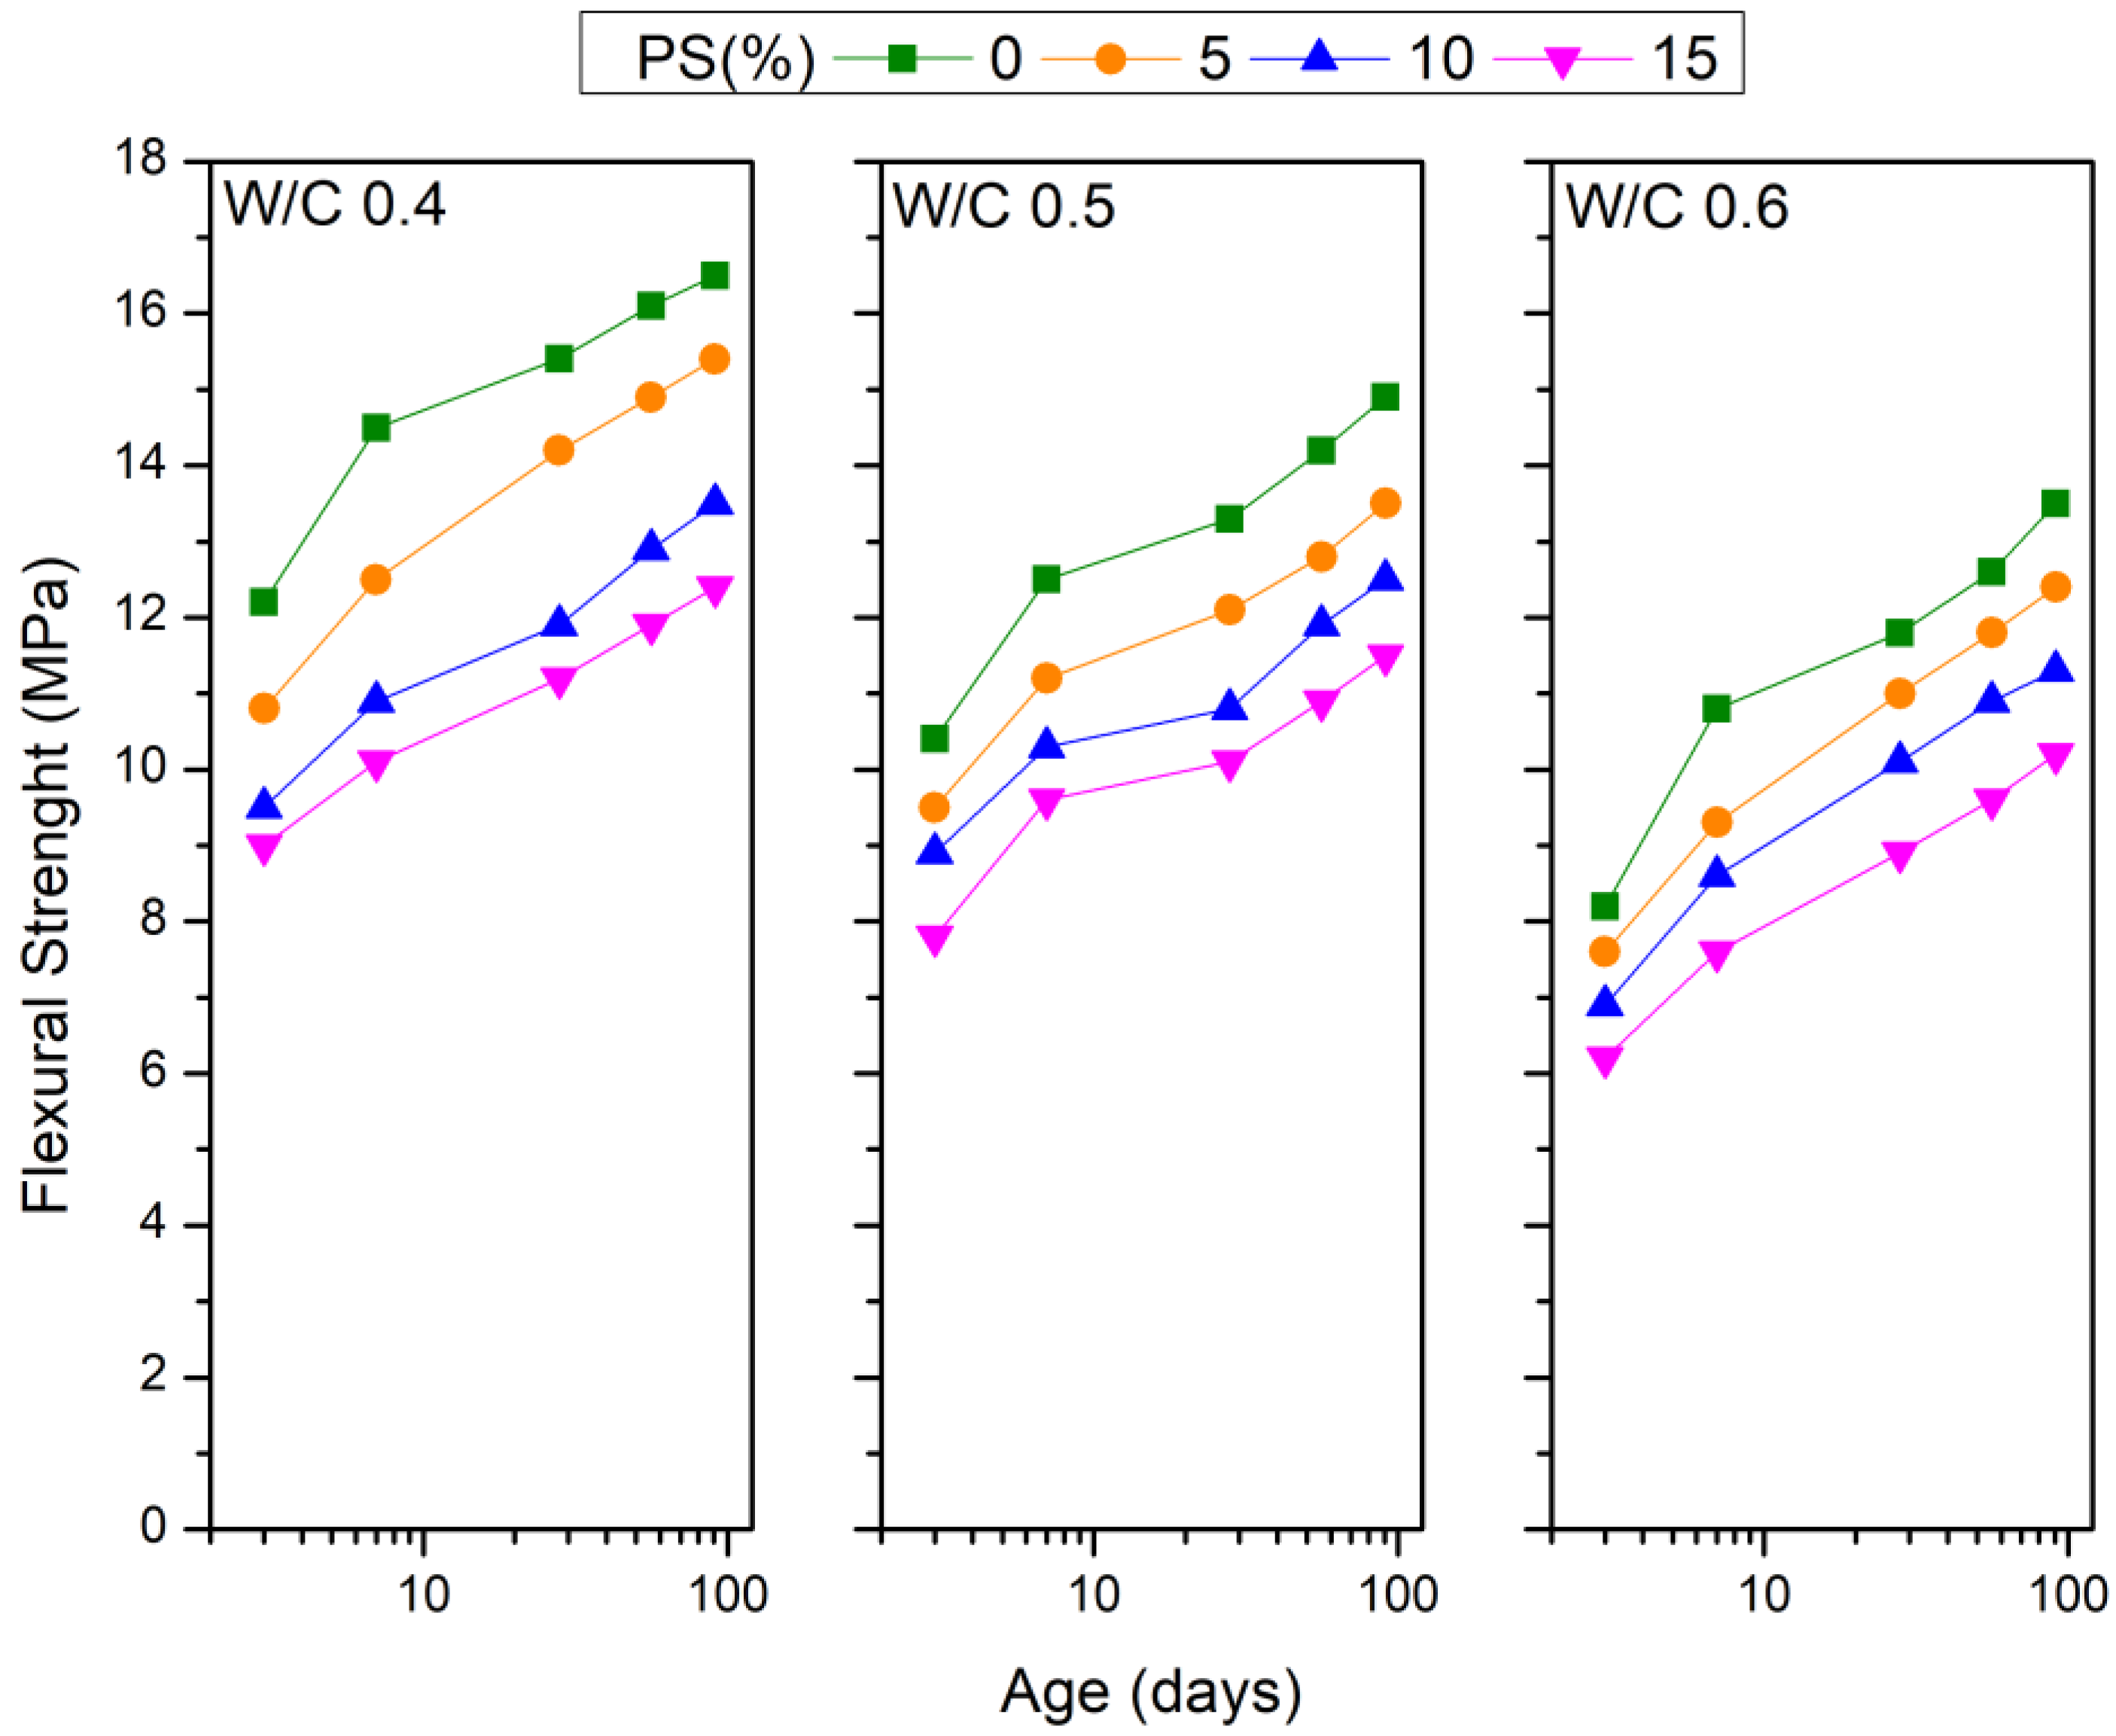
3.5. Flexural Strength
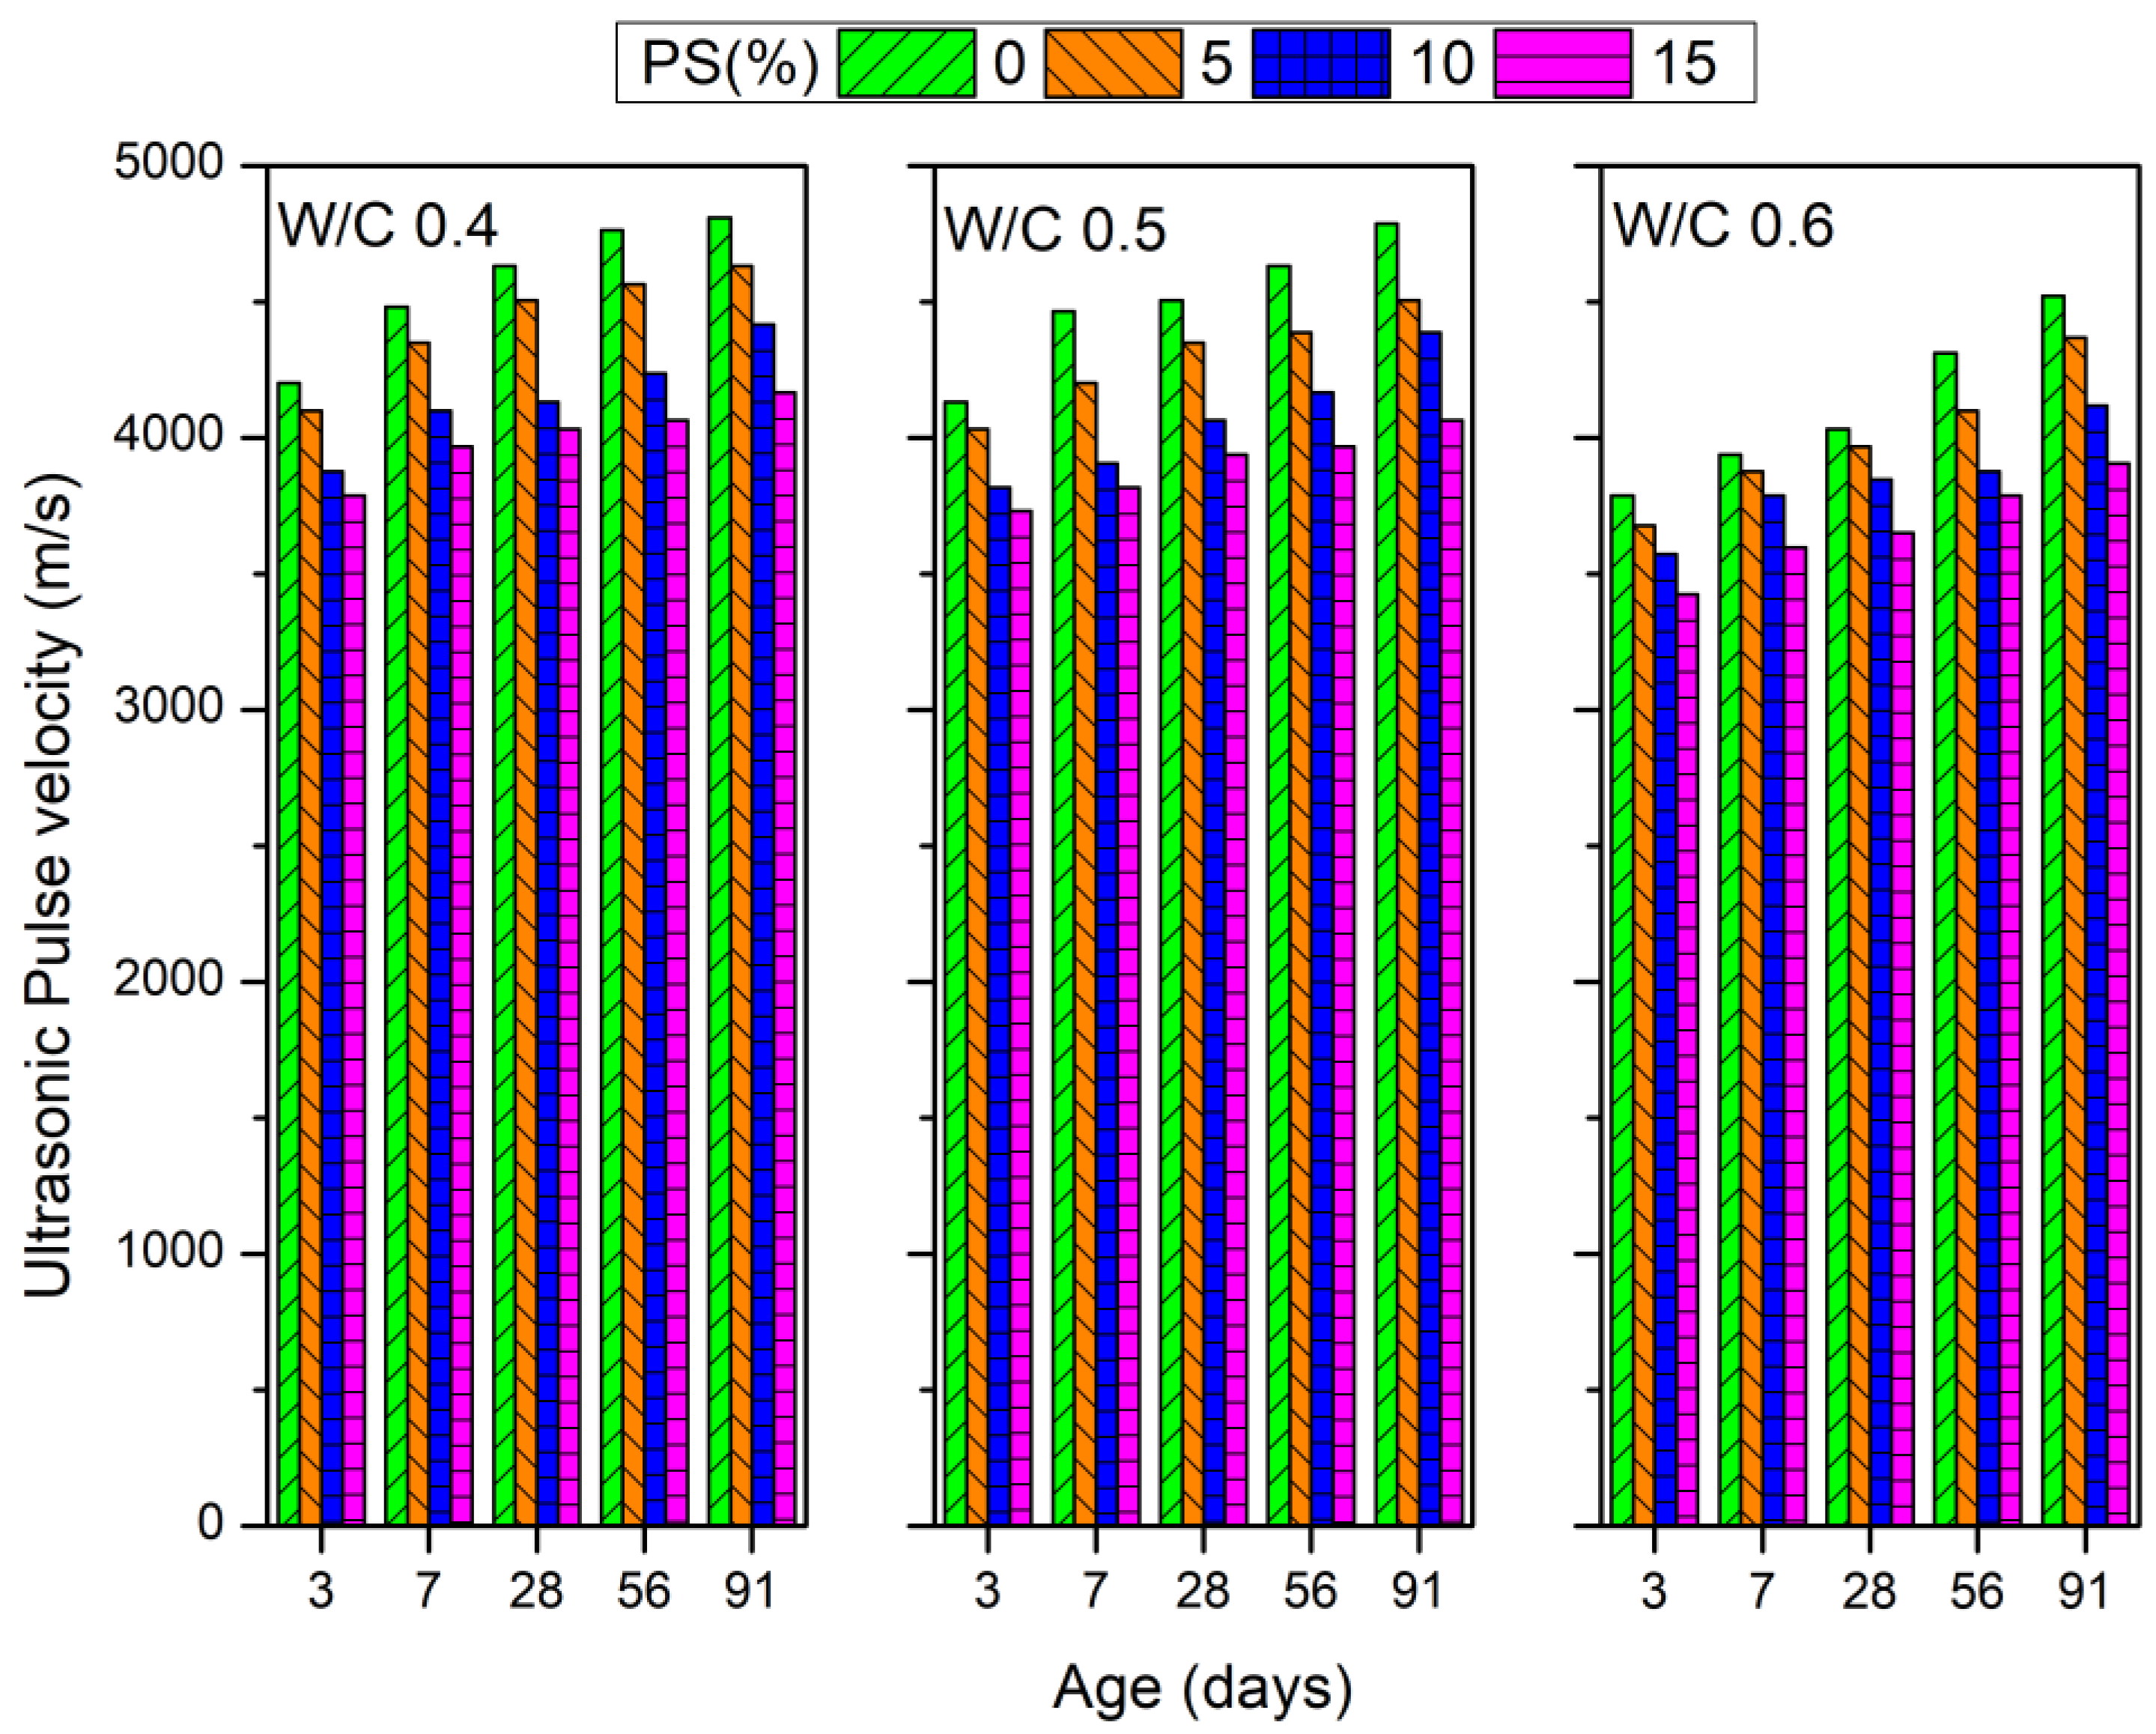
3.6. Ultrasonic Pulse Velocity
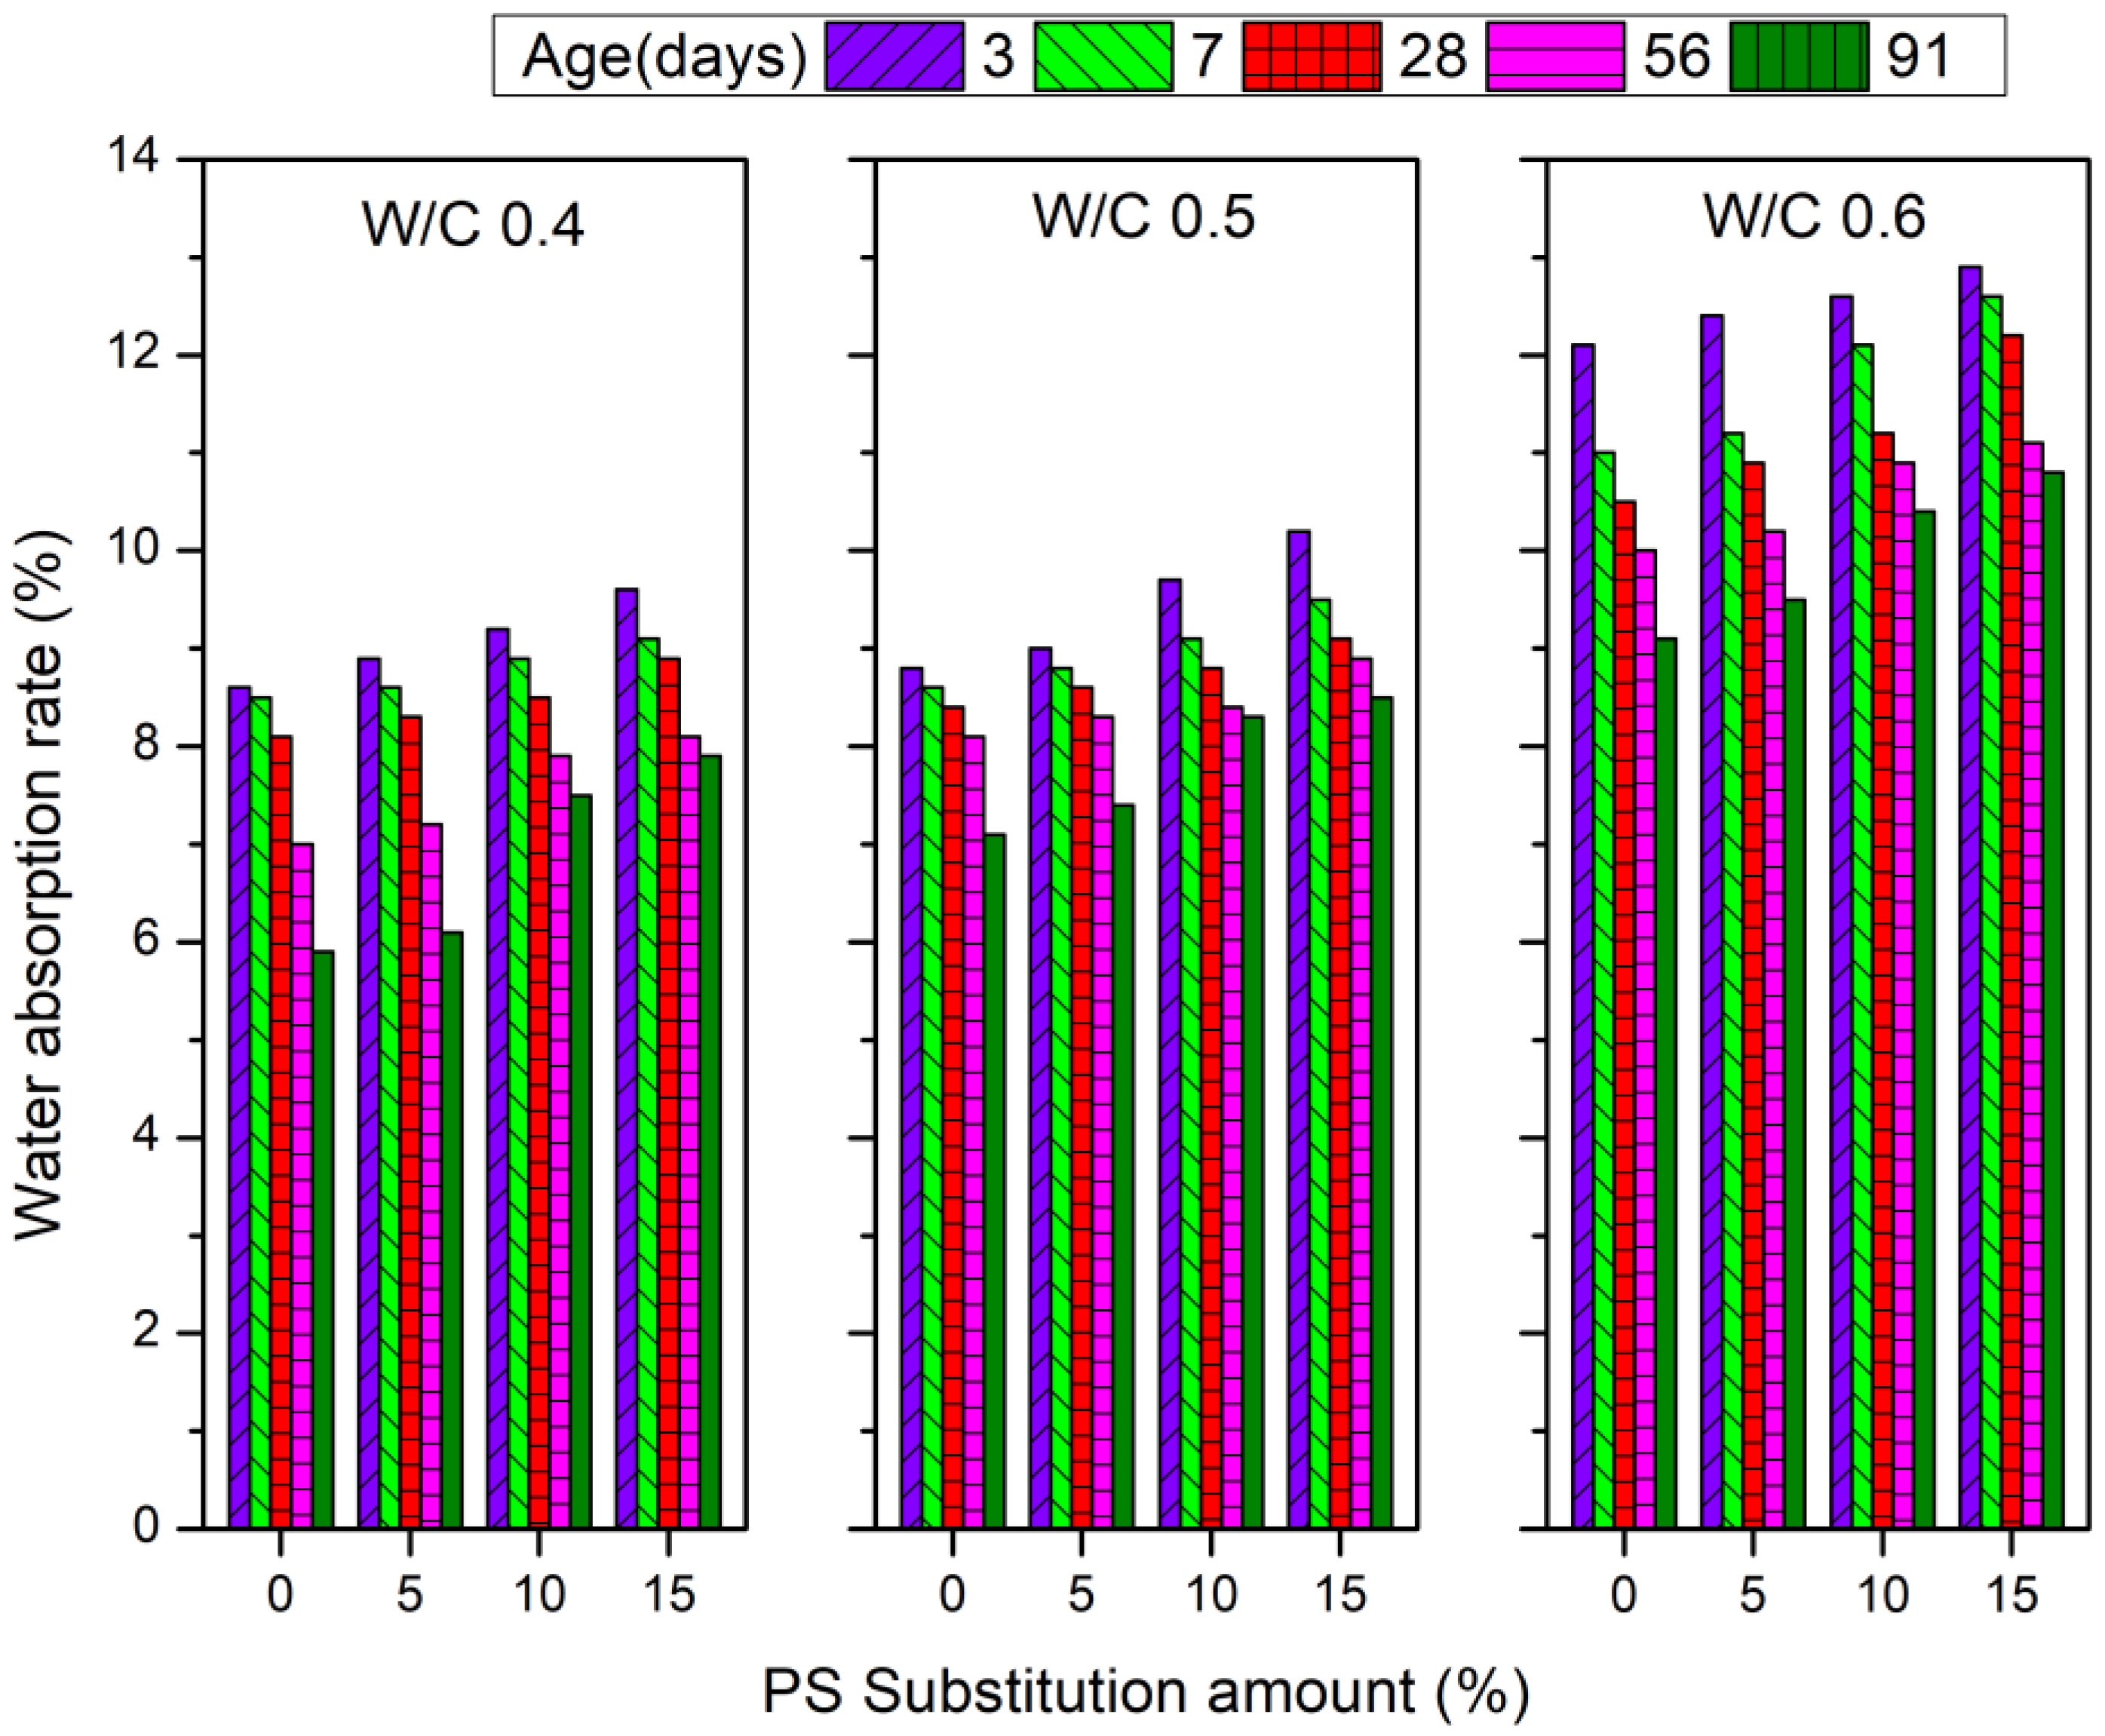
3.7. Water Absorption Rate
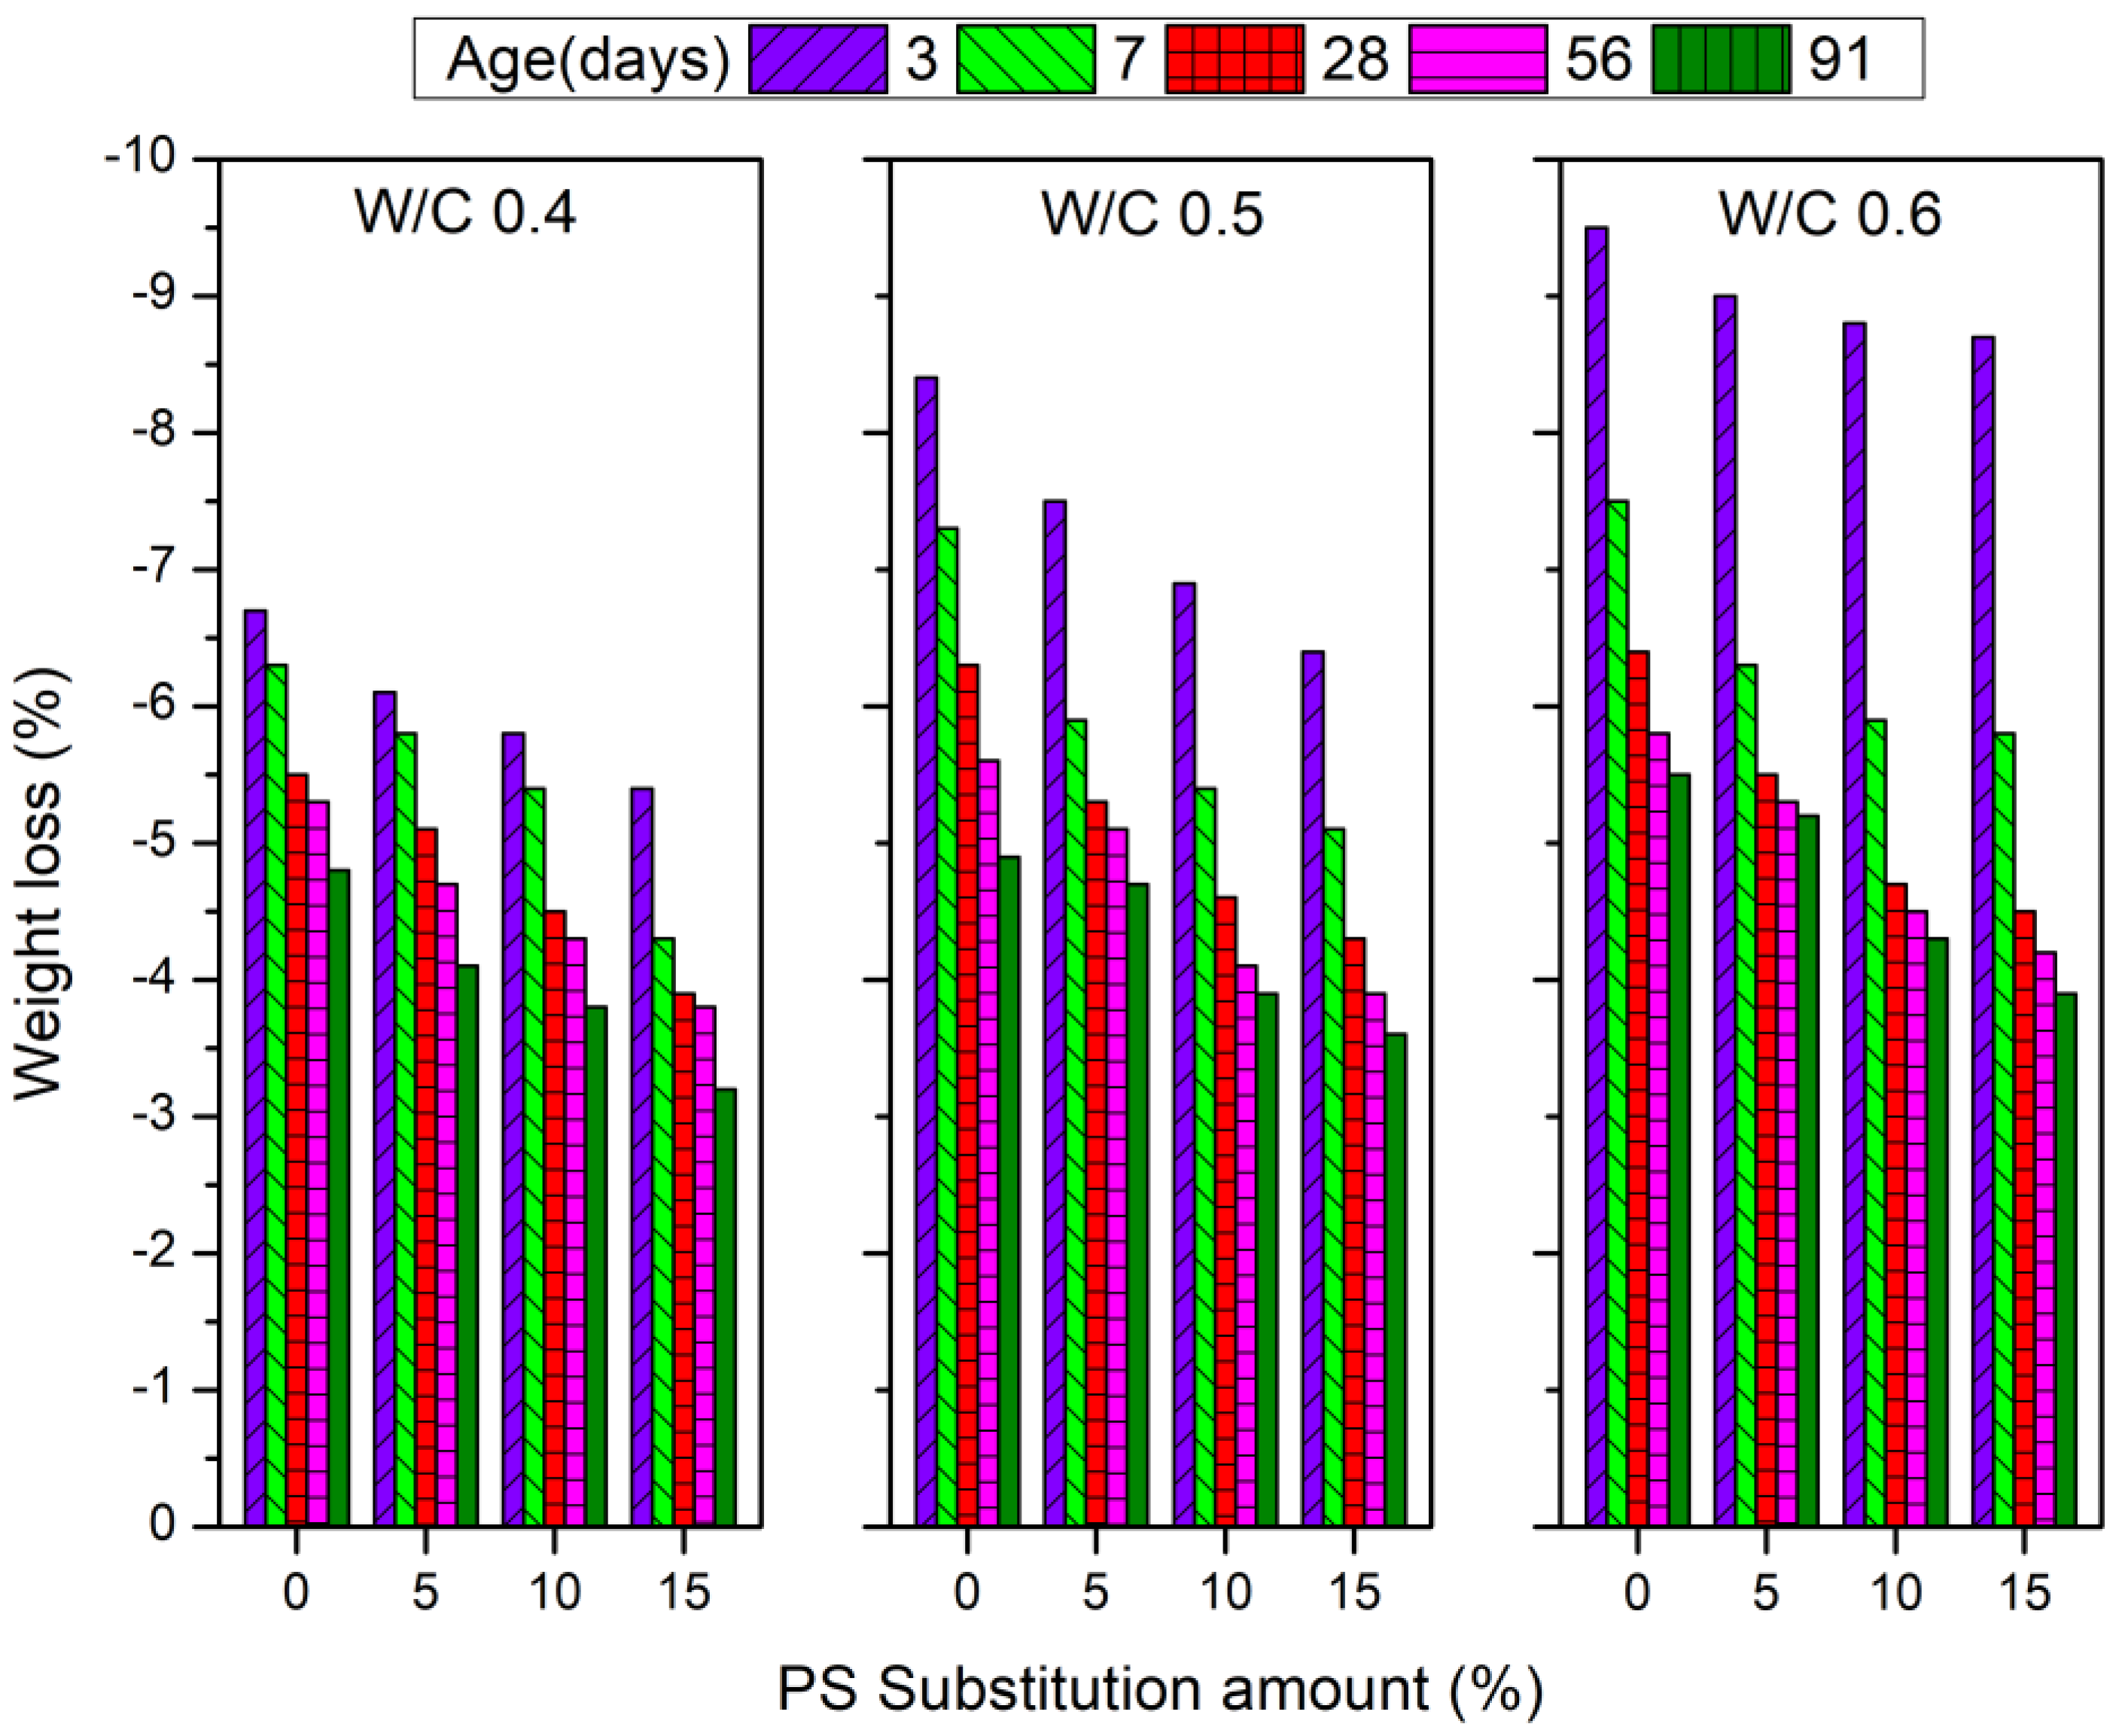
3.8. Resistance to Sulfate Attack
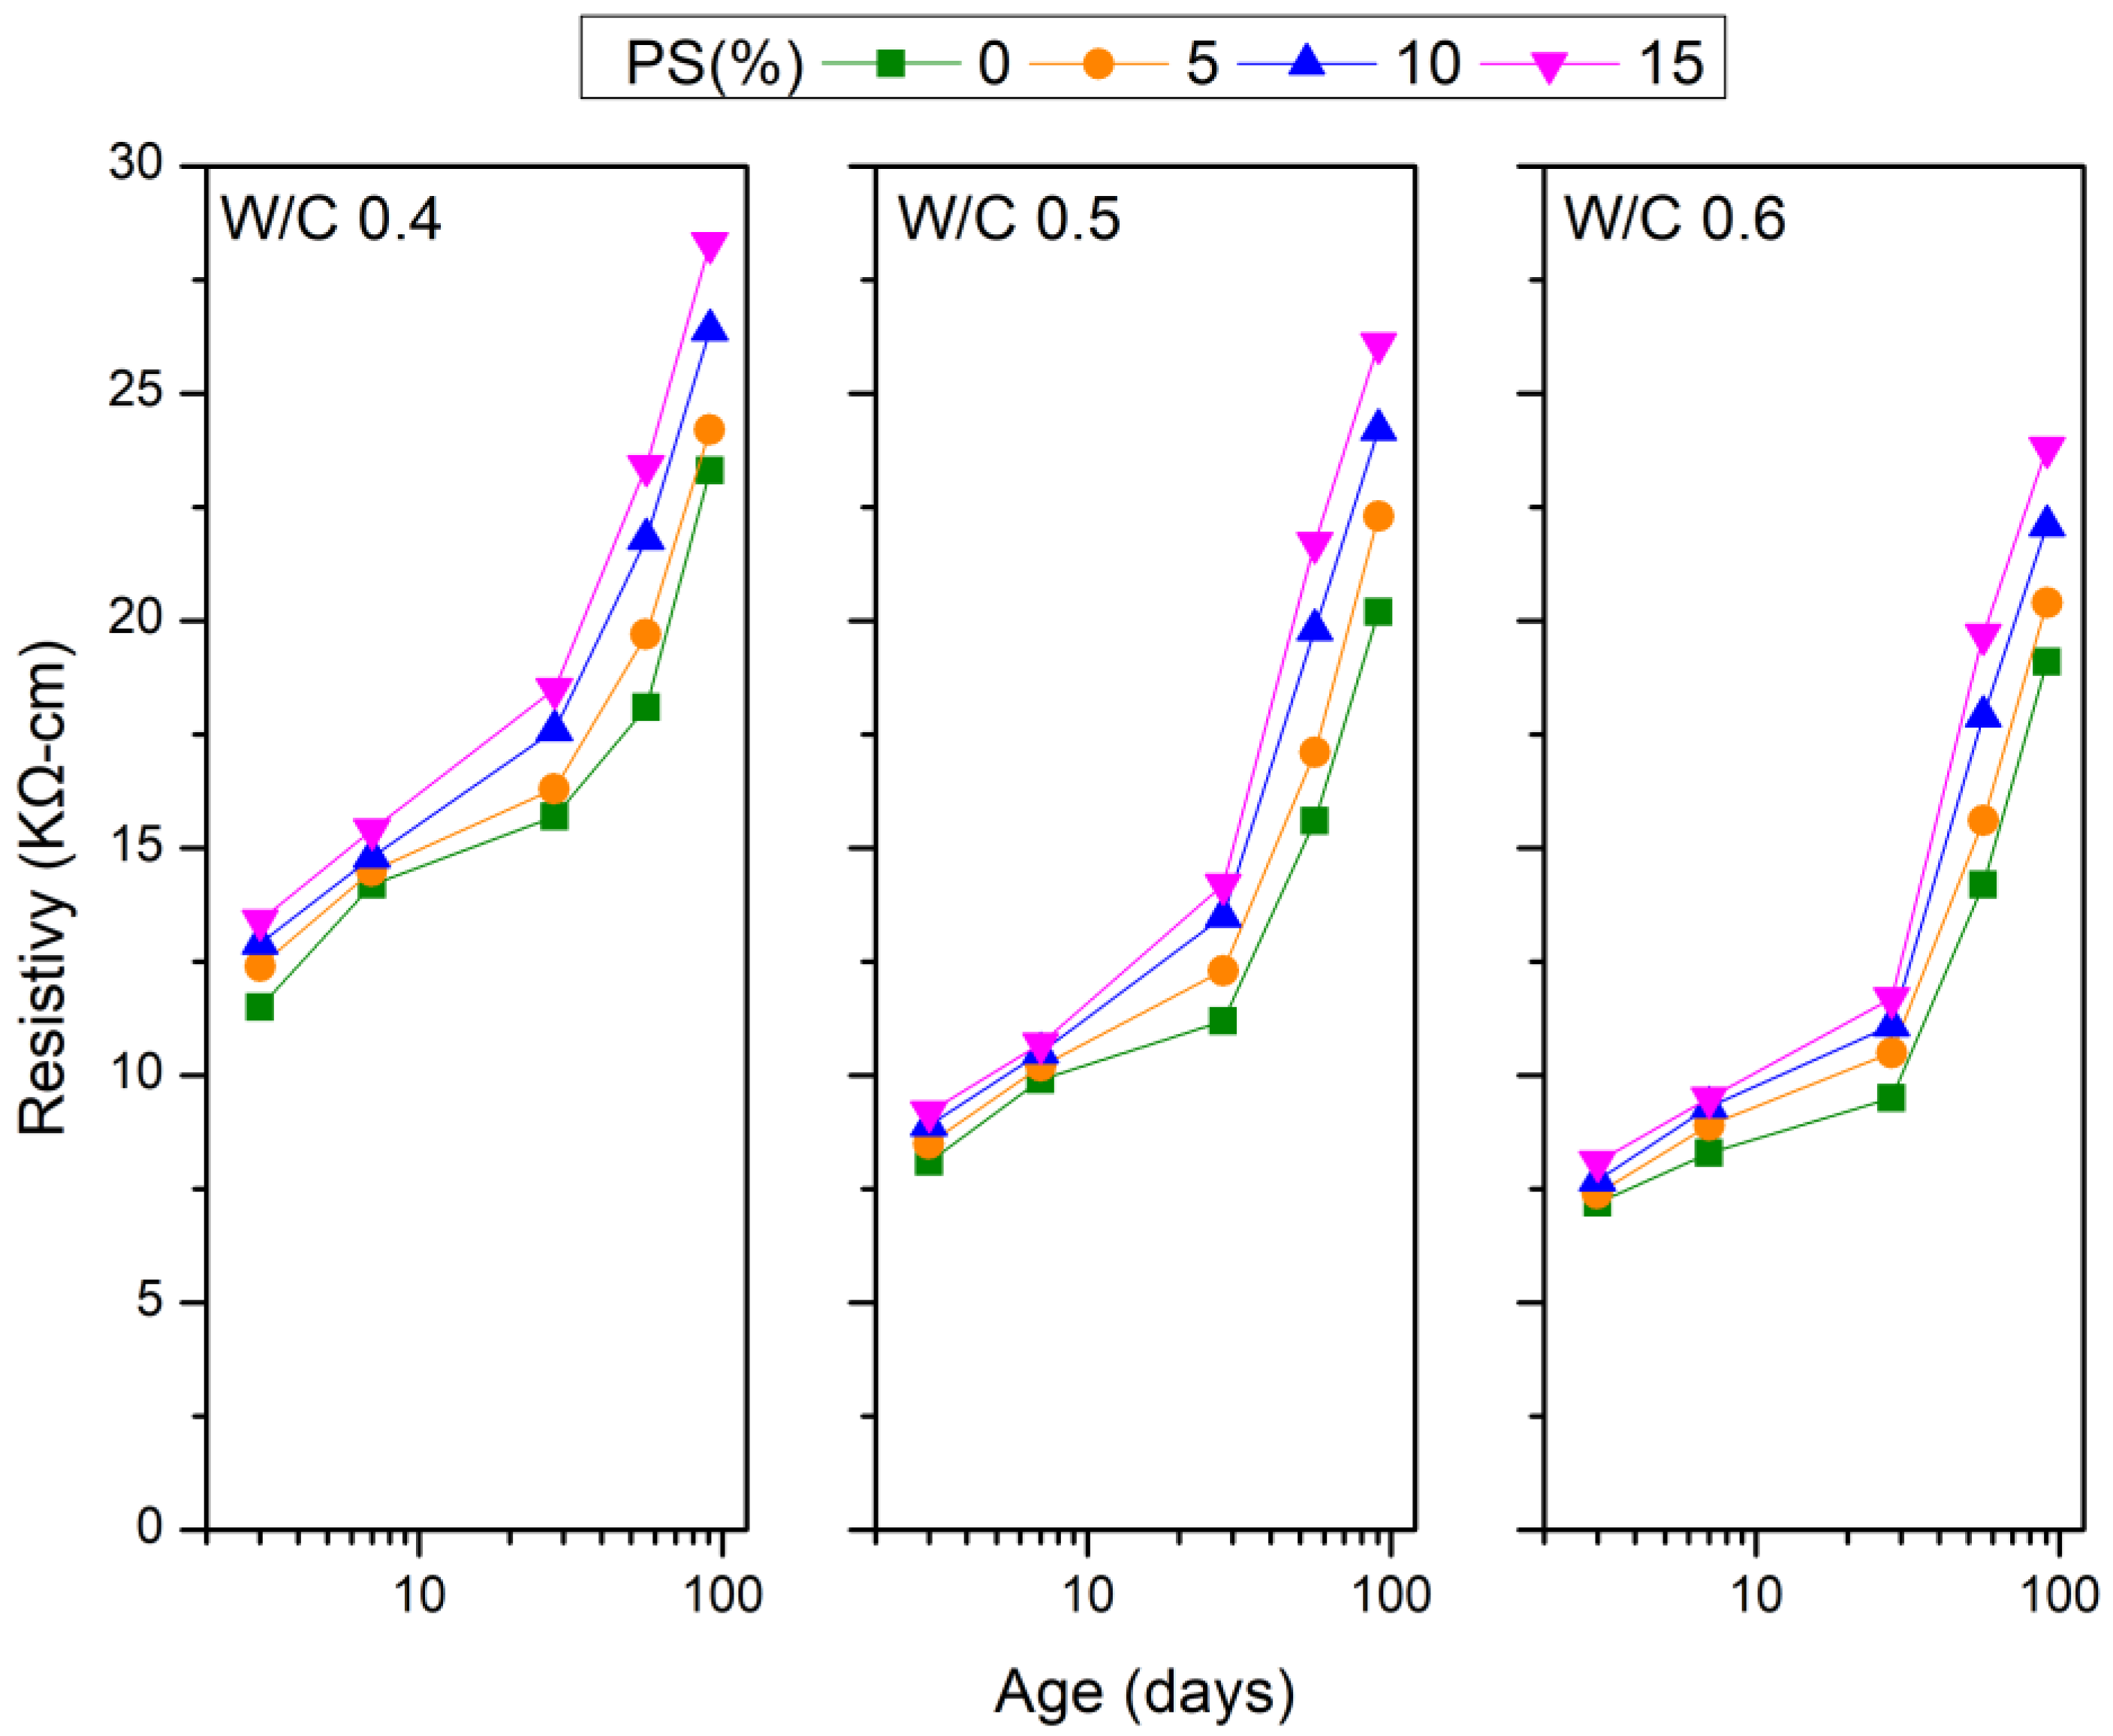
3.9. Surface Resistivity
4. Conclusions
- The slump and slump flow of the cement mortar made by replacing sand with TPSW decreased as the amount of TPSW added increased. Since the TPSW is less smooth than natural sand, the slump and slump flow are reduced. When the W/C increases, the slump and slump flow increase due to the increase in water content. When the setting time is prolonged, the W/C ratio has a greater impact than the substitution amount.
- The compressive strength decreases as the amount of TPSW substitution increases because waste PS is less water-absorbent than natural sand during mixing, resulting in more water molecules. The cementing ability is degraded, and pores are formed. A W/C of 0.5 and a TPSW substitution amount of 5% can effectively achieve the economic benefits of waste recycling.
- As the amount of TPSW added increases, the flexural strength decreases. When the W/C is 0.5 and at the age of 91 days, the strength is reduced by 9.4% when the substitution amount is 5%. When the substitution amount exceeds 10%, the strength is reduced by more than 10%, showing that a W/C of 0.5 and a TPSW substitution amount of 5% are most effective at removing waste for waste recycling.
- Since the ultrasonic pulse velocity depends on the internal density of the specimen, when the W/C is 0.4 and the TPSW substitution amount is 5% at the age of 56 days, the ultrasonic pulse velocity is greater than 4500 m/s, indicating that the specimen quality is good. As the substitution amount and W/C increase, pores are formed inside, so the ultrasonic pulse velocity decreases. The velocity increases with age.
- As the W/C and the waste PS substitution amount increase, the number of pores in the specimen increases, and the number of internal pores will increase; at later ages, the water absorption distinctly decreases. Water absorption has a relative relationship with ultrasound and strength. The higher the ultrasonic pulse velocity is, the denser the specimen, the lower the water absorption, and the greater the strength.
- The weight loss results of the cement mortar show that the W/C ratio has a greater impact than the substitution amount. The weight loss increases with the W/C. As the substitution amount increased and as the sulfate resistance of the TPSW became greater than that of the natural sand, the weight loss tended to decrease. Weight loss is greater at an early age. The hydration is relatively complete at late ages, so the weight loss of the specimen tends to decrease.
- The resistivity decreases as the W/C increases. Since the TPSW has a higher resistivity than natural sand, the resistivity increases with substitution amount and age.
References
- Wang, Pao-Kuan, Jih-Yang Lin, Chun-Pei Yang, Ting-Min Cheng.(2007).”The Island Habitat: Environmental Survey Report of Taiwan”, Rhythms Monthly, Tzu Chi Culture & Communication Foundation.
- Fu-Lin Wen. (2022), Study on Engineering Properties of Cement Mortar with Adding and Cement Replacement by PE and GGBFS, Master’s Thesis, National Kaohsiung University of Science and Technology, Master of Engineering Program in Civil Engineering and Disaster Mitigation.
- Rasmussen, S. C. (2021). From parkesine to celluloid: The birth of organic plastics. Angewandte Chemie, 133(15), 8090-8094. [CrossRef]
- Revathi, S. , Suresh, D., & Anwar, S. T. (2023). Behavior of concrete with PET bottles as fibers & silica fume as partial replacement of cement. Materials Today: Proceedings.
- Jassim, A. K. (2017). Recycling of polyethylene waste to produce plastic cement. Procedia manufacturing, 8, 635-642. [CrossRef]
- Jhe-Wei Lin, (2022), Study on Engineering Properties of Cement Mortar with Adding Abandoned PE, Master’s Thesis, National Kaohsiung University of Science and Technology, Master of Engineering Program in Civil Engineering and Disaster Mitigation.
- El-Seidy, E. , Chougan, M., Sambucci, M., Al-Kheetan, M. J., Valente, M., & Ghaffar, S. H. (2023). Lightweight alkali-activated materials and ordinary Portland cement composites using recycled polyvinyl chloride and waste glass aggregates to fully replace natural sand. Construction and Building Materials, 368, 130399. [CrossRef]
- Małek, M., Jackowski, M., Łasica, W., & Kadela, M. (2020). Characteristics of recycled polypropylene fibers as an addition to concrete fabrication based on Portland cement. Materials, 13(8), 1827. [CrossRef]
- Gregorova, V., Ledererova, M., & Stefunkova, Z. (2017). Investigation of influence of recycled plastics from cable, ethylene vinyl acetate and polystyrene waste on lightweight concrete properties. Procedia engineering, 195, 127-133. [CrossRef]
- Olofinnade, Oluwarotimi, Sarath Chandra, and Paromita Chakraborty. “Recycling of high impact polystyrene and low-density polyethylene plastic wastes in lightweight based concrete for sustainable construction.” Materials Today: Proceedings 38 (2021): 2151-2156. [CrossRef]
- Akinyemi, Banjo A., et al. “Efficacy of expanded polystyrene as fine aggregate in cement mortars modified with latex paint as an alternative to polymer admixture.” Journal of the Mechanical Behavior of Materials 29.1 (2020): 163-168. [CrossRef]
- Al-Mansour, A. , Chen, S., Xu, C., Peng, Y., Wang, J., Ruan, S., & Zeng, Q. (2022). Sustainable cement mortar with recycled plastics enabled by the matrix-aggregate compatibility improvement. Construction and Building Materials, 318, 125994. [CrossRef]
- Ohemeng, Eric A., and Stephen O. Ekolu. “Strength prediction model for cement mortar made with waste LDPE plastic as fine aggregate.” Journal of Sustainable Cement-Based Materials 8.4 (2019): 228-243. [CrossRef]
- Hung, C.-C.; Chang, J.-N.; Wang, H.-Y.; Wen, F.-L. , Effect of adding waste polyethylene and GGBFS on the engineering properties of cement mortar, Applied Sciences 2022, 12(24), 12665. [CrossRef]
- Lin, K.-T.; Hung, C.-C.; Wang, H.-Y.; Wen, F.-L. Polyethylene (PE) Waste Minimization Study of Cement Mortar with Adding PE Content under Different W/B Ratios. Buildings 2022, 12, 2117. [Google Scholar] [CrossRef]
- Khaoula Doughmi, Khadija Baba, Abderrahman Nounah, Mechanical properties of eco-friendly cement based composite mortars plastic fiber reinforced partially replaced by natural pozzolan and marble waste, 2023, Morocco.
- Ferrándiz-Mas, Verónica, and E. García-Alcocel. “Durability of expanded polystyrene mortars.” Construction and building materials 46 (2013): 175-182. [CrossRef]
- Ferrándiz-Mas, Verónica, et al. “Design of bespoke lightweight cement mortars containing waste expanded polystyrene by experimental statistical methods.” Materials & Design 89 (2016): 901-912. [CrossRef]
- Koksal, Fuat, Emrah Mutluay, and Osman Gencel. “Characteristics of isolation mortars produced with expanded vermiculite and waste expanded polystyrene.” Construction and Building Materials 236 (2020): 117789. [CrossRef]
- Petrella, Andrea, Rosa Di Mundo, and Michele Notarnicola. “Recycled expanded polystyrene as lightweight aggregate for environmentally sustainable cement conglomerates.” Materials 13.4 (2020): 988. [CrossRef]
- Maaroufi, M. , Belarbi, R., Abahri, K., & Benmahiddine, F. (2021). Full characterization of hygrothermal, mechanical and morphological properties of a recycled expanded polystyrene-based mortar. Construction and Building Materials, 301, 124310. [CrossRef]
- Qin, Y. , Dong, L., Lu, H., Zhan, L., & Xu, Z. (2022). Debromination process of Br-containing PS of E-wastes and reuse with virgin PS. Journal of Hazardous Materials, 431, 128526. [CrossRef]
- Jheng Hung Chen. (2012), Study on engineering properties of Ready-Mixed Soil Material with applied of recycled materials, Master’s Thesis, National Kaohsiung University of Applied Sciences, Master of Engineering Program in Civil Engineering and Disaster Mitigation.
- Jhou-Wei Jhou, (2013), investigating the properties of lightweight concrete containing high contents of recycled green building materials, Master’s Thesis, National Kaohsiung University of Applied Sciences, Master of Engineering Program in Civil Engineering and Disaster Mitigation. [CrossRef]
- Chang, Shu-Chuan,(2016), A Study of Engineering Properties and Prediction Models Development for Cement Mortar added with Recycled Materials and Piezoelectric Powders, Master’s Thesis, National Kaohsiung University of Applied Sciences, Master of Engineering Program in Civil Engineering and Disaster Mitigation.
- Herchang Ay, Her-Yung Wang, Chung-Fah Huan, &Lin, Xin-Hui. (2011).” The application of energy-saving and carbon-reducing materials in public engineering projects”, Energy-saving and carbon reduction training and promotion, Kaohsiung.
- Lou, B., Shen, H., Liu, B., Liu, J., & Zhang, S. (2023). Recycling secondary aluminum dross to make building materials: A review. Construction and Building Materials, 409, 133989. [CrossRef]
- John, N. J., Khan, I., & Patel, A. (2023). Evaluation of the crushing characteristics of industrial waste aggregates as construction materials. Construction and Building Materials, 403, 133111. [CrossRef]
- Deng, J., Guo, J., Zhou, X., Zhou, P., Fu, X., Zhang, W., & Lin, K. (2014). Hazardous substances in indoor dust emitted from waste TV recycling facility. Environmental science and pollution research, 21, 7656-7667. [CrossRef]
- Xiao, S. , Dong, H., Geng, Y., & Brander, M. (2018). An overview of China’s recyclable waste recycling and recommendations for integrated solutions. Resources, Conservation and Recycling, 134, 112-120. [CrossRef]
- Matsuto, T., Jung, C. H., & Tanaka, N. (2004). Material and heavy metal balance in a recycling facility for home electrical appliances. Waste management, 24(5), 425-436. [CrossRef]
- M. Bederina, L. M. Bederina, L. Marmoret, K. Mezreb, M. Khenfer, A. Bali, M. Quéneudec, Effect of the addition of wood shavings on thermal conductivity of sand concretes: Experimental study and modeling, Constr. Build. Mater. 21 (2007) 662-668. [CrossRef]
- Ru Wang, T. Zhang, P. Wang, Waste printed circuit boards nonmetallic powder as admixture in cement mortar, Mater. Struct. 45 (2012) 1439-1445. [CrossRef]
- M.K. Nematchoua, R. M.K. Nematchoua, R. Tchinda, J.A. Orosa, W.A. Andreasi, Effect of wall construction materials over indoor air quality in humid and hot climate, J. Build. Eng. 3 (2015) 16–23. [CrossRef]
- H.S. Jang, S.Y. H.S. Jang, S.Y. So, The properties of cement-based mortar using different particle size of grinding waste insulator powder, J. Build. Eng. 3 (2015) 48-57. [CrossRef]
- J. de Brito, J. Ferreira, J. Pacheco, D. Soares, M. Guerreiro, Structural, material, mechanical and durability properties and behavior of recycled aggregates concrete, J. Build. Eng. 6 In Progress (2016) 1–16. [CrossRef]
- Wang, Ru, and Christian Meyer. “Performance of cement mortar made with recycled high impact polystyrene.” Cement and Concrete Composites 34.9 (2012): 975-981. [CrossRef]
- Senthil Kumar, K. , and K. Baskar. “Development of ecofriendly concrete incorporating recycled high-impact polystyrene from hazardous electronic waste.” Journal of Hazardous, Toxic, and Radioactive Waste 19.3 (2015): 04014042. [CrossRef]
- Aocharoen, Yanika, and Piya Chotickai. “Compressive mechanical properties of cement mortar containing recycled high-density polyethylene aggregates: Stress–strain relationship.” Case Studies in Construction Materials 15 (2021): e00752. [CrossRef]

| (Unit;kg). | |||||
| Year | 2013 | 2014 | 2015 | 2016 | 2017 |
| Waste TV | 1,181,004 | 1,118,701 | 1,099,031 | 1,021,742 | 26,219,398 |
| Year | 2018 | 2019 | 2020 | 2021 | 2022 |
| Waste TV | 24,411,871 | 22,601,103 | 28,280,353 | 29,026,482 | 30,560,227 |
| Physical properties | |
| Specific gravity | 3.15 |
| Fineness(cm2/g) | 3450 |
| Chemical contents (%) | |
| SiO2 | 19.6 |
| Al2O3 | 4.4 |
| Fe2O3 | 3.1 |
| CaO | 62.5 |
| MgO | 4.9 |
| SO3 | 2.2 |
| TiO2 | 0.5 |
| P2O5 | 0.11 |
| f-CaO | 0.7 |
| Physical properties | Sand | TPSW |
| Specific gravity | 2.65 | 1.17 |
| Fineness modulus | 3.09 | 3.04 |
| Water absorption rate (%) | 1.9 | 0.1 |
| (Unit:g/cm3) | |||||
| W/C | RM(%) | TPSW | Sand | Cement | Water |
| 0.4 | 0 | 0 | 1567 | 570 | 228 |
| 5 | 78 | 1488 | |||
| 10 | 157 | 1410 | |||
| 15 | 235 | 1332 | |||
| 0.5 | 0 | 0 | 1482 | 539 | 270 |
| 5 | 74 | 1408 | |||
| 10 | 148 | 1334 | |||
| 15 | 222 | 1260 | |||
| 0.6 | 0 | 0 | 1407 | 511 | 307 |
| 5 | 70 | 1336 | |||
| 10 | 141 | 1266 | |||
| 15 | 211 | 1196 |
| No. | Item | Specification | Purpose |
|---|---|---|---|
| 1 | Slump | ASTM C109 | Determine the consistency of the freshly mixed cement mortar, determine the workability |
| 2 | Slump flow | ASTMC 1437 | Determine the standard fluidity value in cement mortar |
| 3 | Setting Time | ASTM C403 | Understand the properties of cement and reference for concrete construction |
| 4 | Compressive Strength | ASTM C109 | As a reference for the mechanical strength of the specimen. |
| 5 | Flexural Strength | ASTM C348 | Determine the bonding strength of cement mortar |
| 6 | Ultrasonic Pulse Velocity | ASTM C597 | Understand the internal conditions of the specimen |
| 7 | Water absorption rate | ASTM C1585 | Understand the internal porosity of the specimen |
| 8 | Resistant to Sulfate Attack | ASTM C10125 | Work out the weight loss of cement mortar |
| 9 | Resistivity | ASTM C1202 | Understand the internal density of the specimen |
| Unit: MPa | ||||||
| W/C | RM(%) | Age(days) | ||||
| TPSW | 3 | 7 | 28 | 56 | 91 | |
| 0.4 | 0 | 35.4 | 42.8 | 52.1 | 57.2 | 59.4 |
| 5 | 30.9 | 38.2 | 47.4 | 51.2 | 55.4 | |
| 10 | 26.5 | 33.7 | 42.8 | 45.9 | 49.6 | |
| 15 | 22.1 | 29.2 | 38.2 | 42.6 | 46.3 | |
| Unit: MPa | ||||||
| W/C | RM(%) | Age(days) | ||||
| TPSW | 3 | 7 | 28 | 56 | 91 | |
| 0.5 | 0 | 30.6 | 37.9 | 46.9 | 51.1 | 53.2 |
| 5 | 26.4 | 33.9 | 42.0 | 46.3 | 48.8 | |
| 10 | 22.8 | 30.2 | 39.4 | 39.4 | 45.3 | |
| 15 | 18.6 | 25.7 | 34.5 | 34.5 | 40.1 | |
| Unit: MPa | ||||||
| W/C | RM(%) | Age(days) | ||||
| TPSW | 3 | 7 | 28 | 56 | 91 | |
| 0.6 | 0 | 28.3 | 35.4 | 43.9 | 47.4 | 49.6 |
| 5 | 24.2 | 31.5 | 40.4 | 44.6 | 46.2 | |
| 10 | 20.9 | 28.1 | 37.2 | 41.6 | 43.7 | |
| 15 | 16.7 | 24.3 | 32.4 | 35.9 | 39.3 | |
Disclaimer/Publisher’s Note: The statements, opinions and data contained in all publications are solely those of the individual author(s) and contributor(s) and not of MDPI and/or the editor(s). MDPI and/or the editor(s) disclaim responsibility for any injury to people or property resulting from any ideas, methods, instructions or products referred to in the content. |
© 2024 by the authors. Licensee MDPI, Basel, Switzerland. This article is an open access article distributed under the terms and conditions of the Creative Commons Attribution (CC BY) license (http://creativecommons.org/licenses/by/4.0/).


