
Submitted:
20 December 2024
Posted:
20 December 2024
You are already at the latest version
Abstract
Application of gait analysis on patients with Hip Osteoarthritis (HOA), before and after Total Hip Arthroplasty (THA) surgery can provide accurate diagnostics, reliable treatment decision-making, and proper rehabilitation efforts. Acquired kinematic trajectories provide discriminating features that can be used to determine gait patterns of healthy subjects, and the effects of surgical operation. However, there is still a lack of consensus on the best discriminating kinematics to achieve that. Our investigation aims to utilize Deep Learning (DL) methodologies and improve classification results for the kinematic parameters of healthy, HOA, and 6-months after THA gait cycles. Kinematic angles from the lower limb are used directly as 1-dimensional inputs to DL model. Based on the human gait cycle’s features, a hybrid Long Short-Term Memory – Convolutional Neural Network (HLSTM-CNN) is designed for the classification of healthy/HOA/THA gaits. It was found, from the results, that the sagittal angles of hip and knee, and front angles of FPA and knee, provide the most discriminating results with accuracy above 94% between healthy and HOA gaits. Interestingly, when using the sagittal angles of hip and knee to analyze the THA gaits, common subjects have the same results on the misclassifications. This crucial information provides a glimpse in the determination for success or failure of THA.
Keywords:
Gait
; Kinematic Parameters
; Hip Osteoarthritis
; Total Hip Arthroplasty
; Long Short-Term Memory
; Convolutional Neural Networks
1. Introduction
Hip Osteoarthritis (HOA) is a chronic hip disease that progressively degenerates the cartilage holding the joint together and eventually leads to its dysfunction [1]. The subsequent pain, experienced commonly, causes lateral trunk bending that overloads other parts of the musculoskeletal system for compensation, thus treatment is generally required [2]. Total Hip Arthroplasty (THA) is commonly considered as an important option that alleviates pain and restores functionality in most subjects. However, the literature reveals that post-THA improvements do not completely reduce pain nor return the quality of life, as those of healthy individuals [3]. This is due to muscle weaknesses responsible for gait adaptations after THA[4] affecting even the non-operated limb.
Accepted standard in assessing hip functionality, before and after THA, is through Harris Hip Score (HHS), which is a validated clinical tool in a form of subjective questionnaire. It focus on pain, function, and range of motion [5]. In addition, an objective measure is through radiograph images that depicts hip structure anomalies but still its static nature does not capture motion features [6].
A more suitable alternative measurement is based on gait, which is defined as a manner of walking. Gait is meticulously studied in several areas such as security, sports, and biomedical applications [7]. The gait features are known to have discriminating abilities. Its non-invasive utilization provides understanding into the wellbeing of athletes as well as biometric authentication for remote and mobile devices [8,9]. Prominently, the use of gait analysis, in clinical settings, is extensively investigated, focusing on gait abnormalities due to pathological diseases such as multiple sclerosis, Parkinson’s Disease [10], and other neuro-muscular diseases.
Analysis of gait is the systematic examination of human walking, through the observation of an expert with the help of data acquisition (DAQ) devices to measure kinematics, kinetics, and spatio-temporal parameters (STP) [2]. Kinematic parameters describe motion without reference to the force, while kinetics is the study of force, moments, and acceleration without orientation.
In the context of HOA research, vision-based clinical gait analysis (CGA) systems are the most popular. They are focused on relevant kinematic angles detection that can classify HOA gaits and predict severity. Constantinou et al. [11] devised a case study to characterize hip joint kinematics during gait for mild-to-moderate HOA. It was found that the sagittal and transverse hip angles are significantly different from healthy subjects, and the net hip joint loading are altered in HOA, suggesting a progression of the disease. Consequently, Leigh et al. [12] investigated the lower limb’s gait kinematics of HOA subjects and found out that the sagittal and transverse angles of the pelvis, as well as the front angle of the hip are discriminative for HOA subjects.
Similarly, extensive studies were conducted on gait-related differences before and after THA. Dindorf et al. [13] utilized the overall gait waveform cycle to detect relevant kinematic parameters to describe asymmetrical gaits in patients after THA. Frontal and sagittal angles of the knee, and the sagittal angle of the hip are found to be the most discriminating kinematic parameters with reported accuracy of 91%. Subsequently, Longworth et al. [14] hypothesized that inter-joint coordination information can be used to characterize healthy, HOA, and after THA gaits, through cyclogram analysis. Knee and ankle angles were found to have discriminating patterns for the different classes. Additionally, Fujii et al. [15] developed a model to predict pelvic sagittal angle five years after THA utilizing gait information 1-year after surgery with 91% accuracy.
These discriminating kinematic parameters for HOA and after THA are critical in the selection for classification model inputs among several hundreds of kinematic trajectories produced by CGA. Gait modifications could already be subtly manifested before the onset of functional infirmities, thus discriminating information for HOA are important. The results have potential implications on proper treatment and rehabilitation efforts after THA surgery from different severity levels.
There are several methods to make accurate classification and prediction utilizing gait patterns. Recently, the development of deep learning (DL), a subset of machine learning (ML) methods, has seen increasing advances in the field of computer science. Specifically, convolutional neural network (CNN) and long short-term memory (LSTM) have exhibited outstanding information extraction and modelling capabilities in different gait-related applications. The former is known for its excellent feature extraction capabilities, and the latter has strength in detecting time-step dependencies from long sequential data.
Quite recently, a CNN model was employed to extract STP in a single gait cycle [16]. A publicly available eGAIT dataset, based on inertial measurements, was used as input. Two DL models were considered, namely a multi-classification and ensemble models. Decent results were achieved but the authors emphasized the need for larger dataset to improve DL performance. Additionally, a related study was conducted to predict different STP for knee osteoarthritis and total knee arthroplasty subjects through a CNN model [17] with inertial measurements as inputs. The architecture is not particularly deep with only 2 convolutional layers involved. Conversely, an LSTM networks were designed to classify alterations or abnormalities of gait using wearable sensors [18,19]. Results were achieved with accuracy above 80% in both LSTM studies. It should be noted that hybrid LSTM-CNN (HLSTM-CNN) architectures has not been considered in the analysis of gait but has shown promising results from other areas such as text classification [20], heart beat classification [21], and power flow prediction [22].
The rest of the paper is organized as follows: work related to ML-based based HOA-gait classification is given in Section 2, a brief description of the DL model is provided in Section 3, the proposed methodology and dataset description is presented in Section 4, results and discussions are presented in Section 5. Finally, conclusions of the research and future direction are summarized in Section 6.
2. Related Works
Very few scientific studies have been published in the field of HOA gait classification using ML techniques. Laroche et al. [23] extensively investigated ML applications utilizing HOA gait information. Support Vector Machine (SVM) with linear kernel was applied on kinematic trajectories to differentiate gaits between healthy and HOA patients. The overall reported accuracy is at 88%, with the sagittal hip angle providing the highest discriminating result at 85%, while the rest of the considered kinematic trajectories, from the knees and feet, were registered below 80%. Like other shallow networks, considerable work is done with feature extraction that includes manual handcrafting. This is considered to be the traditional ML model’s major disadvantage.
A decade after the publication of the first research in this field, Pantonial et al. [24] designed a DL architecture through transfer learning method on kinematic trajectories for the classification of HOA and healthy gaits. Transfer learning is a DL methodology that utilizes pre-trained network from a different domain and re-used for faster training but maintaining performance. In presented investigation, state-of-the-art image-based CNN were used and re-purposed for the gait classification problem. A novel tiling method is also employed to exploit both the operated and non-operated limb in one image. The result showed a 97% G-Mean score using the sagittal hip angle while the rest of the considered kinematic parameters are upward 90% in accuracy. An additional step is required to transform the gait cycle into an image via continuous wavelet transform’s scalogram. Thus, the method requires more computational resources.
Teufl et al. [25] used IMU sensors to acquire gait kinematics and STP for an SVM model with Gaussian RBF Kernel to discriminate impaired and non-impaired gaits after THA. Healthy and after THA subjects were used for the classification and conspicuously without HOA gait information. It was found by their study that kinematic parameters are more significant for the classification problem with 97% validation accuracy as compared to STP with 87%.
Overall, there is a clear research gap in the investigation of healthy, HOA, and after THA gaits in one protocol, as a multi-classification problem. Table 1 summarizes the related research on HOA based on DL gait analysis.
Generally, the contribution of this paper is as follows:
- HLSTM-CNN model is presented and tested for the multi-classification of healthy, HOA, and after THA gaits.
- Investigation on the most relevant kinematic parameters that can best discriminate the multi-class problem.
- Performance evaluation and comparison of the proposed HLSTM-CNN model with methodologies published in the literature.
- Examination of the multi-classification model and its applicability in determining the success and failure of THA operation.
3. Deep Learning Structure Design
This section provides a description on the proposed HLSTM-CNN architecture for the classification of a gait cycle as healthy, HOA, or after THA. Given that a hybrid topology is proposed, CNN and LSTM architectures will be discussed separately. Then, these two distinct models are combined, and the overall proposed HLSTM-CNN architecture is discussed.
3.1. Convolution Neural Network (CNN)
CNN model is known for its strength in local feature extraction of a dataset. These models are inspired by biological constructions of the visual cortex which is an arrangement of simple cells [26]. Cells are activated based on the subregion of the visual field, which is a concept used by neurons in a convolutional layer. In turn, these neurons are not fully connected and each of these are only connected within a subregion, in contrast to traditional neural networks. The subregions are also designed to overlap, and spatially correlated outcomes can be produced by the neurons of the CNN. The method is presented in Figure 1 with a filter slide through the image. Convolution function is employed on a subregion of the image. The result reflects the local region that was affected by the filter. This method is the main component of the CNN which is exemplified in a layer.
Typically, a CNN model consists of the following layers: (1) Convolution Layer, (2) Max Pooling Layer, (3) Flattening Layer, and the (4) Fully Connected Layer. The max pooling layer is utilized in the reduction of the feature map through connection reduction between adjacent layers. Afterwards, a flattening layer is used to create a 1-D vector, used on the fully connected layer, which consists of biases and weights. This whole architecture is described in Figure 2.
3.2. Long Short-Term Memory (LSTM)
LSTM is a special type of recurrent neural network (RNN) that resolves the issue of vanishing gradient that affects RNN topologies in general [27]. These types of networks learn long-term temporal dependent data that is mostly used in the classification of sequential information. Popular applications include language modelling, sentiment analysis, and speech recognition. Figure 3 shows the LSTM architecture with forget and memory cells added on top of the traditional RNNs. These added cells allow the network to learn long-term sequential data relationships. The memory and forget cells determine the information to be retained and discarded, respectively.
To compute the output of the forget cell , a sigmoid function is used on the input at the current time step and the previous value of the hidden state :
Where and represents the forget cell’s weight and bias, respectively, represents the concatenation of the previous hidden state and the current input, and as the sigmoid activation function. Afterwards, outputs of the forget cell, as well as the input cell and the memory cell are used to update the previous cell state to a new cell state . This can be done by computing the following:
Where and represents the input cell’s weight and bias, respectively, and the and represents the memory cell’s weight and bias, respectively. The final step is then to compute the value of the current hidden state as described below:
The purpose of the final step is to act as the network’s memory, with information containing previous data to be used for prediction.
3.3. Hybrid LSTM-CNN Model
To fully capitalize the strengths of both LSTM and CNN architectures, a new hybrid model is proposed. Figure 4 shows the overall design of the HLSTM-CNN model. It consists of 2 bi-directional LSTM (bi-LSTM) and 6 convolutional layers, together with rectified linear unit (ReLU), batch normalization, and dropout layers specifically placed between weighted layers to avoid overfitting. Traditional activation functions utilize either sigmoid function or the hyperbolic tangent function, but to conserve computation time, ReLU functions are used as given by Equation (7):
To lessen the effects of generalization errors whilst maintaining accuracy, dropout and batch normalization layers are utilized. Dropout is a strategy wherein an ensemble of possible sub-networks, from the original network, are randomly selected and applied on the hidden layer, with a zero-multiplication effect for each training iteration. On the other hand, batch normalization improves stability and speeds up network training [28]. Essentially, the features are shifted to have zero mean with standard deviation dominating the results.
Following the results of He et al. [29] on the Resnet models, skip connections are introduced to avoid vanishing and exploding gradients of very deep layers. This idea has shown improved performance on images but has not been further exploited on 1-D inputs.
4. Methodology
The proposed methodology can be divided into four distinct tasks: (1) dataset and kinematic parameter selection, (2) data pre-processing, (3) development of HLSTM-CNN model, and (4) evaluation of design. This is aptly summarized in Figure 5.
4.1. Dataset Description and Kinematic Parameter Selection
Several papers have emphasized the necessity of a large and publicly available dataset to improve valuable metrics in gait research [1,7,24]. The motivation is for seamless performance comparison among developed algorithms; thus, benchmarking can easily be conducted and an agreement on significant parameters can be accelerated. With this in mind, a recently published gait analysis dataset [30] of 80 healthy and 106 subjects before and 6-months after THA is utilized in this research. HOA identification is based on American College of Rheumatology Criteria and verified with radiological assessment.
3-D gait trajectories are captured via reflective markers and a vision-based system, with 8 optoelectronic cameras, and floor-based sensors, with 2 force plates, utilized for the synchronized measurements. Thus, both kinematic and kinematic parameters are captured in the protocol. Ten trials are performed by each participant on a 6-meter walkway. For brevity, demographic information of the volunteers is summarized in Table 2.
In this study, trajectories from the reflective markers on the lower limbs are considered as shown Figure 6a. Different planar views, as shown in Figure 6b, of the kinematic trajectories computed are used, namely sagittal (x-axis), frontal/coronal (y-axis), and transverse (z-axis).
Explicitly, the relevant joint angles are the ankle, hip, knee, pelvis, and the foot progression angle (FPA). By definition, the FPA is the angle of the foot with respect to the walking direction. Following results from gait analysis on HOA [23,24,25] and after THA operation [13,15,31], the following kinematic angles are used in this study to provide sufficient discrimination related to gait dysfunctionalities:
- Pelvis: Transverse and Front Angles
- Hip: Sagittal and Front Angles
- Knee: Sagittal and Front Angles
- Ankle: Sagittal and Front Angles
- FPA: Sagittal and Front Angles
4.2. Data Pre-Processing and Representation
Pre-processing is implemented to improve feature extraction and remove unnecessary information. Upon closer scrutiny of the raw data, redundant and non-numeric information are found across all kinematic angles. Thus, these are automatically removed from the dataset. Then, outliers are removed using a standard deviation method by taking the mean and standard deviation for each event of the gait sequence as described below:
Where is the length of the gait cycle, and is the size of the dataset for healthy, HOA, and 6-months after THA, respectively. Measured gaits with a value greater than in any of the events are automatically removed from the dataset. The resulting aggregated datasets are shown in Figure 7 with black, red, and blue strands as HOA, healthy, and 6-months after THA gaits, respectively.
Through visual observations, HOA-afflicted gaits have larger variance compared to healthy gaits, with THA showing some variations as well. Subsequently, data augmentation strategies are considered to improve generalization by increasing the size of the dataset. Essentially, artificial data are generated to be included in the training process. Popular data augmentation strategies from the literature include translation, shifting, rotation, and noise addition. Closer inspection reveal that Gaussian noise addition is the only strategy applicable for gait sequences which can be explained by the Equation (10), given below:
Where as the Gaussian Noise added for every event of the gait cycle. An example is shown in Figure 8 where is added on a randomly selected kinematic gait cycle from the dataset. In contrast to the method chosen by a recent study [24] that transforms gait into images, the proposed method utilizes the 1-D gait sequence as input to the DL model. As a consequence, the DL model is designed from scratch and the training procedure is treated carefully given that there is no pre-trained network that can be used as a baseline.
4.3. Deep Learning Design
Focus of our research is the classification of kinematic gait parameters among healthy, HOA, and 6-months after THA using DL methods. Novel, hybrid LSTM-CNN, stacking two bi-LSTM and 6 convolutional layers, is developed and tested.
The bi-LSTM network is a two LSTM model with the first taking input in the forward direction, and the second is for the backward direction. Effectively, available information is increased for training and can improve contextualization of the algorithm. By design, 62% and 12% memory windows are utilized to track sequence dependencies based on the period for stance phase and double limb support respectively. This ensures that the learning is achieved within the selected length.
The first two convolution layers, in parallel with the skipped connection, have 38 and 12 filter sizes. This is based on the period of the swing phase and double limb support respectively. Succeeding convolution layers have filter sizes of five to further improve feature extraction. The rest of the model parameters are summarized in Table 3.
Hyperparameter selection is crucial in training reliability of the design model. Given that the model is designed grounds up, a relatively small initial learning rate is selected, and this is steadily increased. Mini-batch size is set to an arbitrarily small value of 20 for improved generalization and convergence. The maximum epoch is set relatively large for extensive training. The list of relevant hyperparameters is shown in Table 4.
The experimental research in this study was conducted on a DELL G15 5520 laptop with the following specifications:
- Memory: 16GB DDR3 RAM
- GPU: NVIDIA GeForce RTX 3050 Ti
- CPU: 12 Gen Intel Core i7-12700H, 2300MHz,14 Cores, 20 Logical Processors
Software for the model, training, and evaluation was developed in Matlab® 2023b with Statistics and Machine Learning, and Deep Learning Toolboxes.
Dataset was divided into training (70%), validation (20%), and test (10%) subsets. Artificial data was added into the training dataset to improve performance. Training subset is used for model training, and after each end of the epoch, the validation subset is used to examine training accuracy. Test subset is only used at the end of training to verify performance of the final model.
4.4. Model Evaluation
Evaluation of a DL model is an important step in assessing the performance and accuracy. Proposed HLSTM-CNN model was tested using the metric scores from the resulting confusion matrix. The final test accuracy is calculated for each kinematic parameter which is the overall correct classification of the subjects. Obtained information should be treated carefully as the classification of THA gaits can provide knowledge about the success of the surgical operation and post-surgery physical therapy rehabilitation. Thus, metric scores are computed for each class and misclassification is analyzed.
Three other metric scores are frequently used in the bio-medical field namely sensitivity, specificity, and . Sensitivity determines the correct prediction of a class, while specificity determines the ability to correctly identify negative results. is then the measure to balance results of the different classes. These metric scores are given by:
Where and refer to right classification, while and to the misclassification of subjects.
5. Results and Discussions
5.1. Performance Metric Results on Selected Kinematic Parameters for Healthy and HOA Gaits
This subsection presents experimental results. Proposed HLSTM-CNN model is evaluated on the selected kinematic parameters’ test dataset, specifically to distinguish between Healthy and HOA gaits as described in Table 5. The test dataset is randomly chosen and has never been used during the training procedure. The sagittal angles of the knee and the hip provide the best performance results with G-Mean scores of 97.6% and 97.8%, respectively. Notably, healthy gaits of these kinematic parameters are not misclassified as HOA gaits which is reflected on its sensitivity result of 100%. The next two best performing kinematic parameters are the font angles of the knee and FPA with G-Mean scores of 96.5% and 94.9%, respectively. This result well aligned with those published in the literature.
On the other hand, the worst performing kinematic parameters are the sagittal angles of ankle and FPA, and the transverse angle of the pelvis with G-Mean scores below 90%. Particularly, the sagittal angle of the FPA is the only kinematic parameter that registers below 80% accuracy and G-Mean score. Put in context, its accuracy of 75% is already comparable with traditional ML algorithms such as SVM.
5.2. Comparative Analysis
With regards to research on HOA classification through ML techniques, two other related studies’ reports were compared to the results of the proposed architecture: (1) SVM classifier by Laroche et al. [23], and (2) image-based CNN classifier via transfer learning method by Pantonial et al. [24]. Figure 9 shows the results of the common kinematic parameters from these studies, and it is notable that the proposed HLSTM-CNN is in agreement that the hip sagittal angle as the most discriminating parameter for HOA classification. Both the image-based CNN and the HLSTM-CNN models recorded an outstanding 97% accuracy on this kinematic parameter while the SVM model only recorded 85% accuracy. The results of the SVM model for the other kinematic parameters are decent for ML standards which are slightly below 75%.
With the proposed architecture, for knee sagittal and FPA front angles there is a considerable uptick in accuracy with improvements of 3.8% and 5.2%, respectively as compared to the image-based CNN model. Even with the use of raw gaits, as inputs to a model, there is no reduction in the performance and has even improved results. Thus, computationally expensive scalogram image transformation is avoided without noticeable disadvantages.
The ranking of importance for the kinematic parameters are similar as with the previous studies, with the sagittal angle of the FPA as the least discriminatory and less helpful in the gait classification problem. The accuracy of HLSTM-CNN stands at 75.8% which is a relatively low result but the sagittal angle of the FPA has not been considered in the literature for HOA classification.
Additionally, DL methods, both image-based CNN and HLSTM-CNN, are exceptionally superior to the SVM giving results with at least 12% accuracy improvement on the hip and knee sagittal angles. Besides this advantage, manual handcrafting of data for feature extraction is eliminated in the process, thus automation for classification is a possibility with less intervention from users.
On the other hand, Teufl et al. [25] differentiated gaits between healthy and patients 2 weeks after THA operation utilizing IMU sensors. This is an important distinction from this study’s dataset of using gaits 6-months after THA. It is shown that the resulting kinematic accuracy is 97%. Thus, there is a discriminating feature between healthy and THA subjects. Misclassification could provide information into the effects of the surgery itself that can lead to better rehabilitation.
5.3. Results on Best Performing Kinematic Parameters on the Multiclassification Problem
This subsection presents the results when the proposed HLSTM-CNN model is evaluated on the top four performing kinematic parameters based on their classification G-Mean score, namely:
- Hip Sagittal Angle
- Knee Sagittal Angle
- Knee Front Angle
- FPA Front Angle
Figure 10 and Figure 11 show the resulting confusion matrices of the sagittal angles of hip and knee, respectively. Both of these kinematic parameters registered more than 97% G-Mean score on the HOA classification problem with no misclassification of healthy gaits as HOA, and the opposite is kept at a low value as well. Moreover, the bulk of the misclassification is on the THA gait being misclassified as either healthy or HOA (third row). In addition, both healthy and HOA gaits are misclassified as THA gaits with high incidence as well. Based on these results, it is evident that there is a clear distinction between the features of healthy and HOA gaits for these kinematic parameters. Common features may be present on the THA gait that is seen on either healthy or HOA gaits.
Similar observations can be realized on the confusion matrices of the front angles of FPA and knee as shown in Figure 12 and Figure 13, respectively. Misclassification between healthy and HOA gaits are kept to minimum values with the bulk of the misclassification is on THA gait prediction (third row and column). In particular, the front angle of the FPA has significant misclassification of healthy and HOA gaits as THA, thus pulling its performance down.
Further investigation is needed into these THA misclassifications as it can provide information into the success or failure of the THA operation. Explicitly, if a THA gait is misclassified as healthy, then the surgery is a success while if it is predicted as HOA, then the surgery is a failure.
5.4. Analysis on Misclassification of THA Gaits
Building upon the results of the previous subsection, the top two most discriminating kinematic parameters, namely the sagittal angles of hip and knee are further investigated particularly subjects with THA gaits. The subject’s gait prediction is classified between the three classes as shown in Table 6. For clarity, the subjects have identification numbers, which are tabulated in the table. The subject’s identification number that is not common in both test datasets of the hip and knee sagittal angles, are removed for simplicity. Moreover, there are multiple gait data that are available for each subject, but only a single data is retained that scores above 50% in the softmax layer. Remarkably, there is no cross-prediction between healthy and HOA for the THA gaits. Explicitly, if a gait of the hip sagittal angle is misclassified as healthy, it can either be a healthy or THA on the knee sagittal angle prediction, and vice versa. This is also true for HOA gait misclassification.
To better understand the relationship between the misclassification of the knee and hip sagittal angles, a close inspection on the conditional probabilities is crucial. Both healthy and HOA misclassifications are utilized, and Venn diagrams of the subjects are plotted to show the relationship between the two best performing kinematic parameters.
First, healthy classifications are analyzed, and results are shown in Figure 14. Interestingly, there are common subjects that were predicted as healthy between the two best performing kinematic parameters. This would increase our confidence in the success of the THA operations in these subjects. Evidently, the hip sagittal angle provides a reliable prediction on the healthy class with , while the knee sagittal angle resulted into a conditional probability of . Simply, when a patient’s hip sagittal angle is predicted as healthy, there is a better chance that it has returned to a healthy state.
Next, HOA predictions are analyzed, and the results are plotted in Figure 15. Similar to healthy predictions, there is also a significant number of common subjects that are predicted as HOA. When two best performing kinematic parameters are giving the same HOA results, this should be analysed by medical diagnostic experts. This could mean a failure in the THA operation. Also, the hip sagittal angle provides a slightly better prediction on the HOA class with , while the knee sagittal angle resulted into a conditional probability of .
6. Conclusions
The determination of the best discriminating kinematic parameters for HOA and THA classification is a crucial step in the accurate diagnosis of the disease. DL is a promising methodology used in solving different classification problems, proved to be a reliable approach. In this research, a hybrid of LSTM and CNN is proposed to classify gaits as healthy, gaits with HOA, and gaits after 6-months from THA. LSTM model exploits temporal dependencies of the gait’s sequential data, while CNN model is employed to detect local gait features. Specifically, two bi-directional LSTM and 6 CNN are stacked to form the network with a skipping structure to improve fitting. To evaluate the design and benchmarked with the literature, discrimination between healthy and HOA gaits are tested. It is shown that the sagittal angles of the hip and knee are the top two most discriminating kinematic parameters with G-Mean scores of 97.84% and 97.55, respectively. This is followed by the front angles of the knee and FPA with G-Mean scores of 96.5% and 94.91% respectively. Overall, performance of the selected kinematic parameters is above 80% except for the sagittal angle of the FPA which has a G-Mean score of 78.2%. Proposed model performs significantly better compared to SVM-based models [23] with more than 10% higher margin, having similar results with image-based CNN models [24].
A different perspective is used in the analysis of THA gaits with in-depth investigation conducted on the misclassification results. This approach can provide a glimpse into the success or failure of THA surgery. It was noted that the highest proportion of errors are coming from the misclassification of THA. For the top four most discriminating parameters, healthy and HOA resulted in 10-25% and 10-30% misclassifications, respectively. Misclassified gaits of subjects after THA are further investigated using the best two kinematics, namely sagittal angles of the hip and the knee. The subjects are tabulated according to healthy and HOA misclassification, and it was found that there is no cross-misclassification between the top kinematic parameters. This means that there are no common features between healthy and HOA on these parameters, but there are some common features with the THA gait. Indeed, there is a class of THA gait that requires a rehabilitation effort to closely align with healthy features. Additionally, more than 50% of the misclassification results are common to both hip and knee sagittal angles thus boosting confidence into the success or failure determination of THA operation. These findings are promising, and our novel DL methodology could be used in medical diagnostic systems.
7. Future Works and Recommendations
Based on the results of this investigation, it is recommended to monitor the other joint angles on the upper limbs such as the wrist, elbow, and trunk. Information from these angles can potentially improve performance of the gait classification model. Kinematics on the pelvis and FPA must be further analyzed on THA gaits as these can potentially boost confidence in the success of THA operation and provide specific rehabilitation efforts. Since demographic information is available in the dataset, such as age and gender, it would be interesting to know if there are discriminating features between demographics. Lastly, extensive investigation on the DL methodologies must be pursued to improve kinematic outcomes to identify HOA and THA gaits through information fusion with guidance from medical experts.
Funding
This research receives no external funding.
Data Availability Statement
The gait analysis dataset of healthy and subjects before and 6-months after THA was published by Bertaux et al. [30] and publicly available in the following sites: 1. Healthy Subjects: https://doi.org/10.6084/m9.figshare.15022827. 2. HOA Subjects: https://doi.org/10.6084/m9.figshare.13656233. 3. Demographics: https://doi.org/10.6084/m9.figshare.13655975.
References
- P. Ornetti, J.-F. Maillefert, D. Laroche, C. Morisset, M. Dougados, and L. Gossec, “Gait analysis as a quantifiable outcome measure in hip or knee osteoarthritis: a systematic review,” Joint Bone Spine, vol. 77, no. 5, pp. 421-425, 2010. [CrossRef]
- M. W. Whittle, Gait analysis: an introduction. Butterworth-Heinemann, 2014.
- M. L. Beaulieu, M. Lamontagne, and P. E. Beaulé, “Lower limb biomechanics during gait do not return to normal following total hip arthroplasty,” Gait & posture, vol. 32, no. 2, pp. 269-273, 2010. [CrossRef]
- K. C. Foucher, D. E. Hurwitz, and M. A. Wimmer, “Preoperative gait adaptations persist one year after surgery in clinically well-functioning total hip replacement patients,” Journal of biomechanics, vol. 40, no. 15, pp. 3432-3437, 2007. [CrossRef]
- S. Y. Lee et al., “Correlation between Harris hip score and gait analysis through artificial intelligence pose estimation in patients after total hip arthroplasty,” Asian Journal of Surgery, vol. 46, no. 12, pp. 5438-5443, 2023. [CrossRef]
- J. Bedson and P. R. Croft, “The discordance between clinical and radiographic knee osteoarthritis: a systematic search and summary of the literature,” BMC musculoskeletal disorders, vol. 9, pp. 1-11, 2008. [CrossRef]
- A. Sepas-Moghaddam and A. Etemad, “Deep gait recognition: A survey,” IEEE transactions on pattern analysis and machine intelligence, vol. 45, no. 1, pp. 264-284, 2022.
- D. Gouwanda and S. Senanayake, “Emerging trends of body-mounted sensors in sports and human gait analysis,” in 4th Kuala Lumpur International Conference on Biomedical Engineering 2008: BIOMED 2008 25–28 June 2008 Kuala Lumpur, Malaysia, 2008: Springer, pp. 715-718.
- M. D. Marsico and A. Mecca, “A survey on gait recognition via wearable sensors,” ACM Computing Surveys (CSUR), vol. 52, no. 4, pp. 1-39, 2019.
- J. Camps et al., “Deep learning for freezing of gait detection in Parkinson’s disease patients in their homes using a waist-worn inertial measurement unit,” Knowledge-Based Systems, vol. 139, pp. 119-131, 2018. [CrossRef]
- M. Constantinou, A. Loureiro, C. Carty, P. Mills, and R. Barrett, “Hip joint mechanics during walking in individuals with mild-to-moderate hip osteoarthritis,” Gait & posture, vol. 53, pp. 162-167, 2017. [CrossRef]
- R. J. Leigh, S. T. Osis, and R. Ferber, “Kinematic gait patterns and their relationship to pain in mild-to-moderate hip osteoarthritis,” Clinical biomechanics, vol. 34, pp. 12-17, 2016. [CrossRef]
- C. Dindorf, W. Teufl, B. Taetz, S. Becker, G. Bleser, and M. Fröhlich, “Feature extraction and gait classification in hip replacement patients on the basis of kinematic waveform data,” Biomedical Human Kinetics, vol. 13, no. 1, pp. 177-186, 2021. [CrossRef]
- J. A. Longworth, S. Chlosta, and K. C. Foucher, “Inter-joint coordination of kinematics and kinetics before and after total hip arthroplasty compared to asymptomatic subjects,” Journal of biomechanics, vol. 72, pp. 180-186, 2018. [CrossRef]
- J. Fujii, S. Aoyama, T. Tezuka, N. Kobayashi, E. Kawakami, and Y. Inaba, “Prediction of change in pelvic tilt after total hip arthroplasty using machine learning,” The Journal of Arthroplasty, vol. 38, no. 10, pp. 2009-2016. e3, 2023. [CrossRef]
- J. Hannink, T. Kautz, C. F. Pasluosta, K.-G. Gaßmann, J. Klucken, and B. M. Eskofier, “Sensor-based gait parameter extraction with deep convolutional neural networks,” IEEE journal of biomedical and health informatics, vol. 21, no. 1, pp. 85-93, 2016. [CrossRef]
- M. Sharifi Renani, C. A. Myers, R. Zandie, M. H. Mahoor, B. S. Davidson, and C. W. Clary, “Deep learning in gait parameter prediction for OA and TKA patients wearing IMU sensors,” Sensors, vol. 20, no. 19, p. 5553, 2020. [CrossRef]
- A. Turner and S. Hayes, “The classification of minor gait alterations using wearable sensors and deep learning,” IEEE Transactions on Biomedical Engineering, vol. 66, no. 11, pp. 3136-3145, 2019. [CrossRef]
- S. Potluri, S. Ravuri, C. Diedrich, and L. Schega, “Deep learning based gait abnormality detection using wearable sensor system,” in 2019 41st Annual International Conference of the IEEE Engineering in Medicine and Biology Society (EMBC), 2019: IEEE, pp. 3613-3619.
- J. Zhang, Y. Li, J. Tian, and T. Li, “LSTM-CNN hybrid model for text classification,” in 2018 IEEE 3rd Advanced Information Technology, Electronic and Automation Control Conference (IAEAC), 2018: IEEE, pp. 1675-1680.
- F. Liu et al., “An attention-based hybrid LSTM-CNN model for arrhythmias classification,” in 2019 International Joint Conference on Neural Networks (IJCNN), 2019: IEEE, pp. 1-8.
- F. Aksan, Y. Li, V. Suresh, and P. Janik, “CNN-LSTM vs. LSTM-CNN to predict power flow direction: a case study of the high-voltage subnet of northeast Germany,” Sensors, vol. 23, no. 2, p. 901, 2023. [CrossRef]
- D. Laroche et al., “A classification study of kinematic gait trajectories in hip osteoarthritis,” Computers in Biology and Medicine, vol. 55, pp. 42-48, 2014. [CrossRef]
- R. Pantonial and M. Simic, “Transfer Learning Method for the Classification of Hip Osteoarthritis using Kinematic Gait Parameters,” in 28th International Conference on Knowledge-Based and Intelligent Information and Engineering Systems (KES2024), Seville, Spain, 2024: Procedia Computer Science.
- W. Teufl et al., “Towards an inertial sensor-based wearable feedback system for patients after total hip arthroplasty: Validity and applicability for gait classification with gait kinematics-based features,” Sensors, vol. 19, no. 22, p. 5006, 2019. [CrossRef]
- A. Krizhevsky, I. Sutskever, and G. E. Hinton, “ImageNet classification with deep convolutional neural networks,” Communications of the ACM, vol. 60, no. 6, pp. 84-90, 2017.
- S. Hochreiter and J. Schmidhuber, “Long short-term memory,” Neural computation, vol. 9, no. 8, pp. 1735-1780, 1997.
- S. Ioffe, “Batch normalization: Accelerating deep network training by reducing internal covariate shift,” arXiv 2015. arXiv:1502.03167, 2015.
- K. He, X. Zhang, S. Ren, and J. Sun, “Deep residual learning for image recognition,” in Proceedings of the IEEE conference on computer vision and pattern recognition, 2016, pp. 770-778.
- A. Bertaux et al., “Gait analysis dataset of healthy volunteers and patients before and 6 months after total hip arthroplasty,” Scientific Data, vol. 9, no. 1, p. 399, 2022. [CrossRef]
- C. Dindorf, W. Teufl, B. Taetz, G. Bleser, and M. Fröhlich, “Interpretability of input representations for gait classification in patients after total hip arthroplasty,” Sensors, vol. 20, no. 16, p. 4385, 2020. [CrossRef]
Figure 1.
Image Convolution Process.
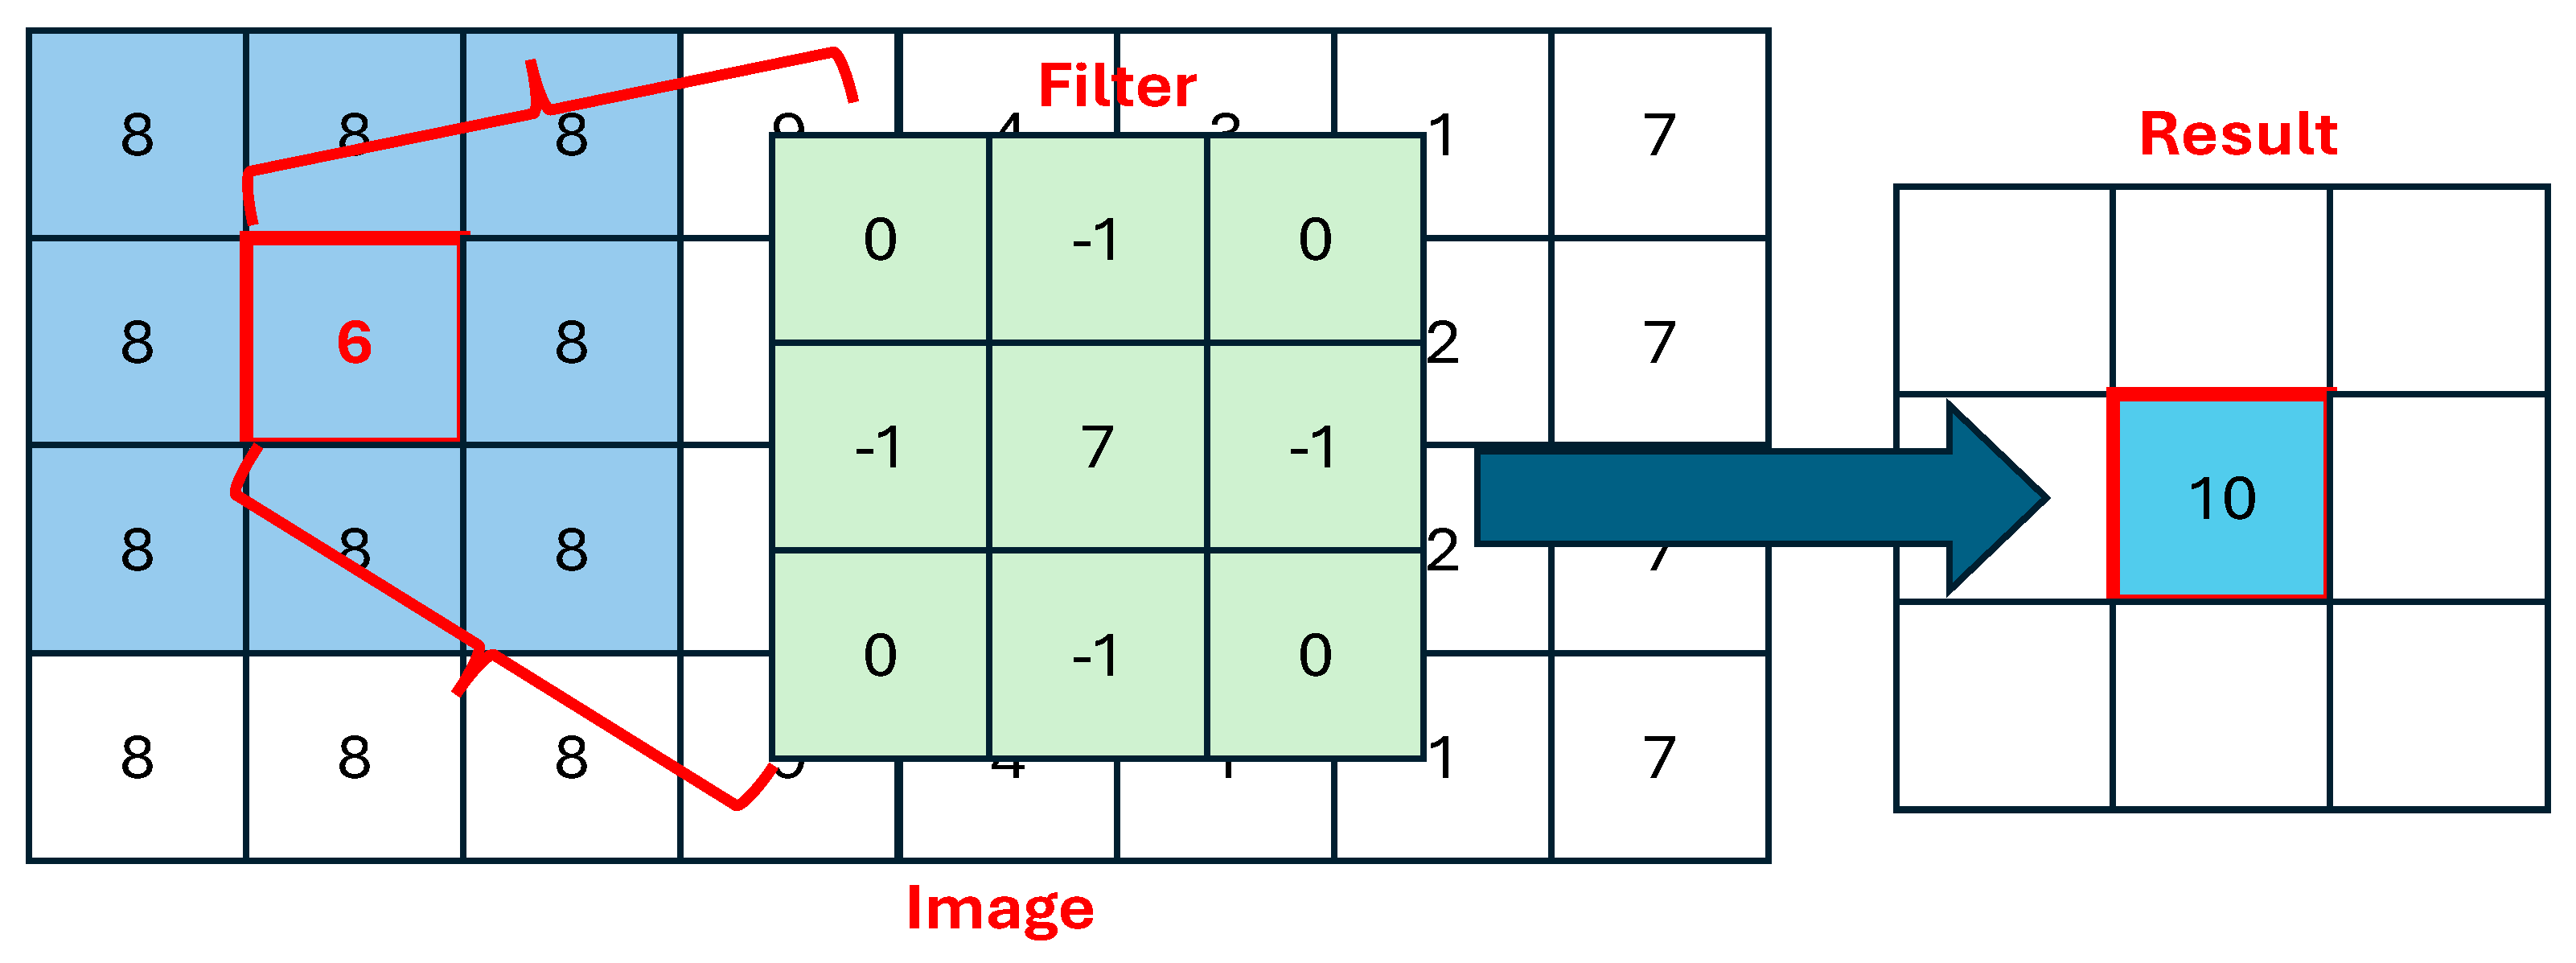
Figure 2.
Typical CNN Model.
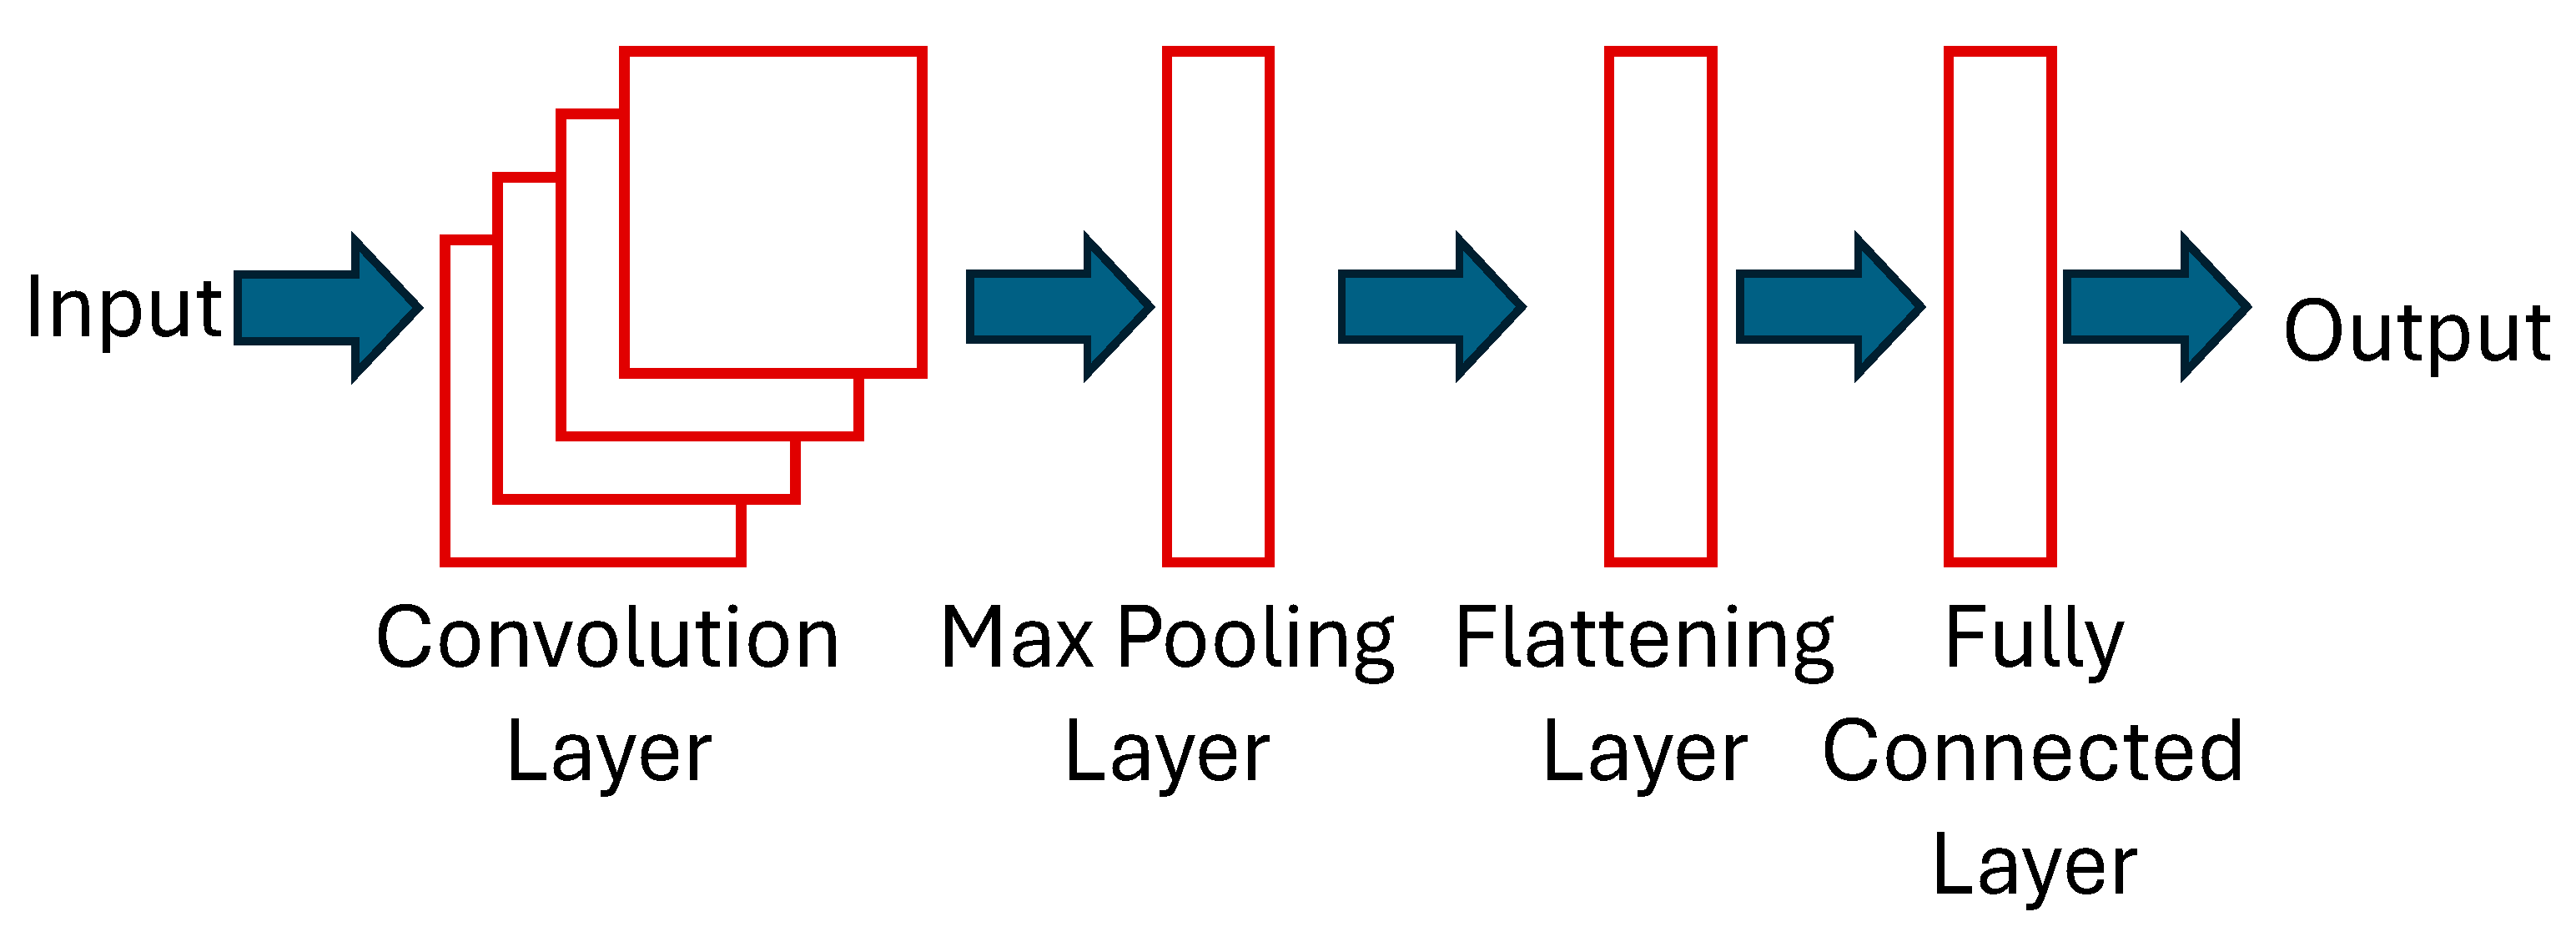
Figure 3.
LSTM Architecture.
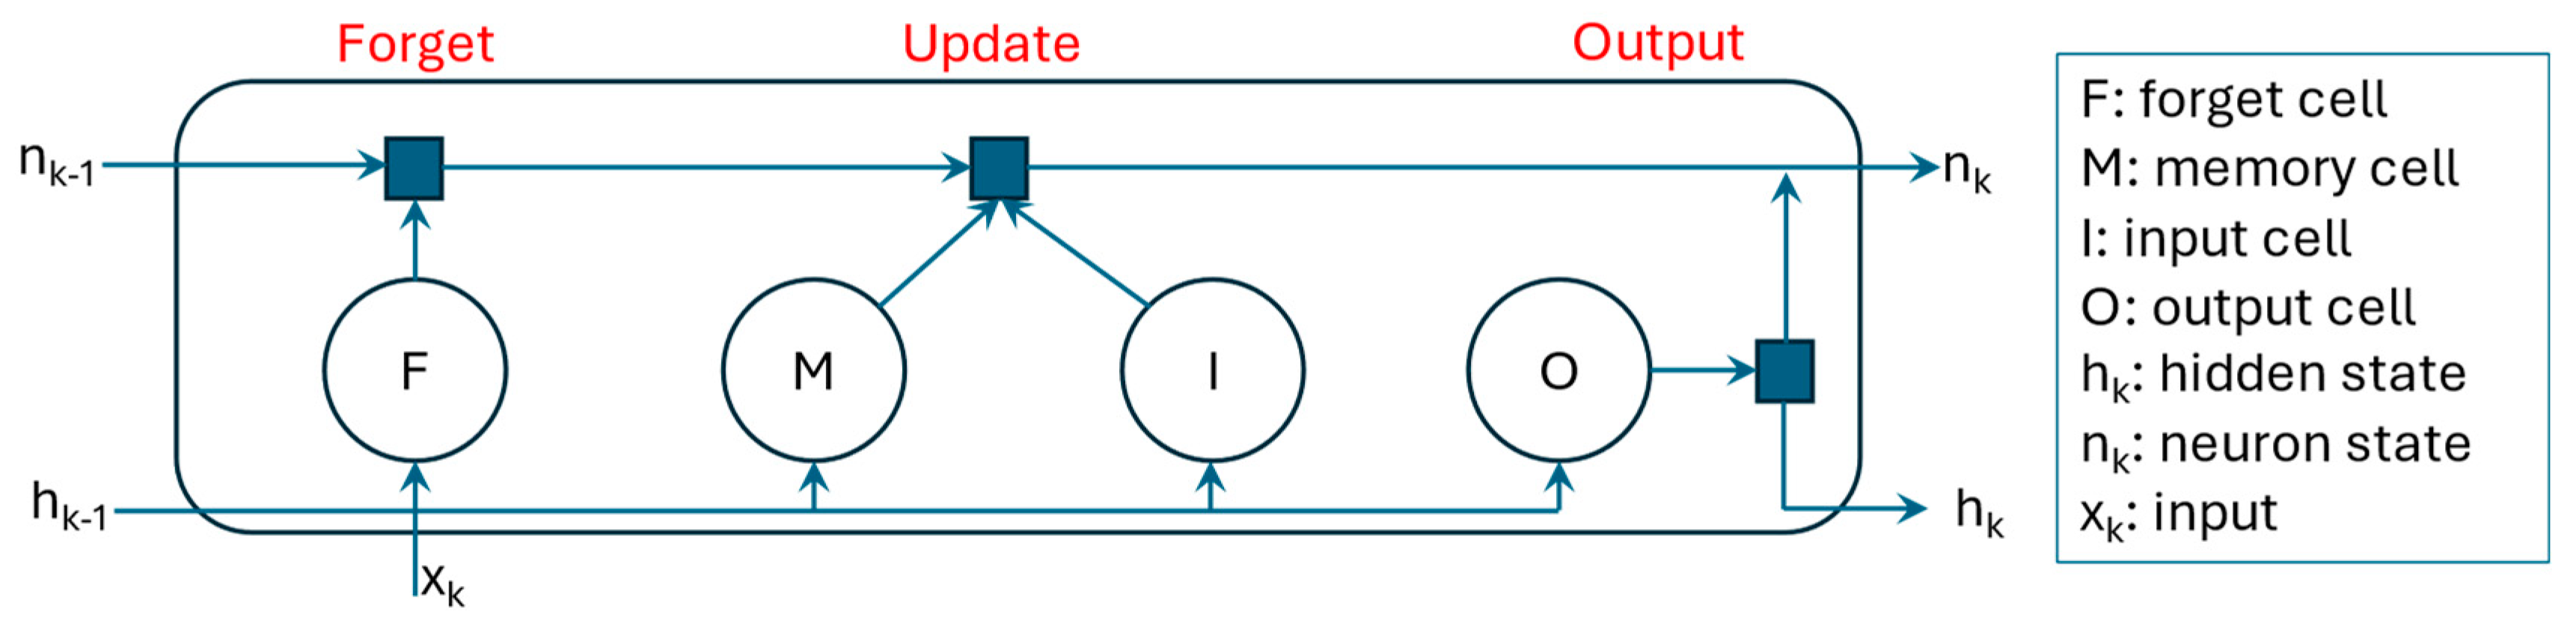
Figure 4.
Proposed HLSTM-CNN model.
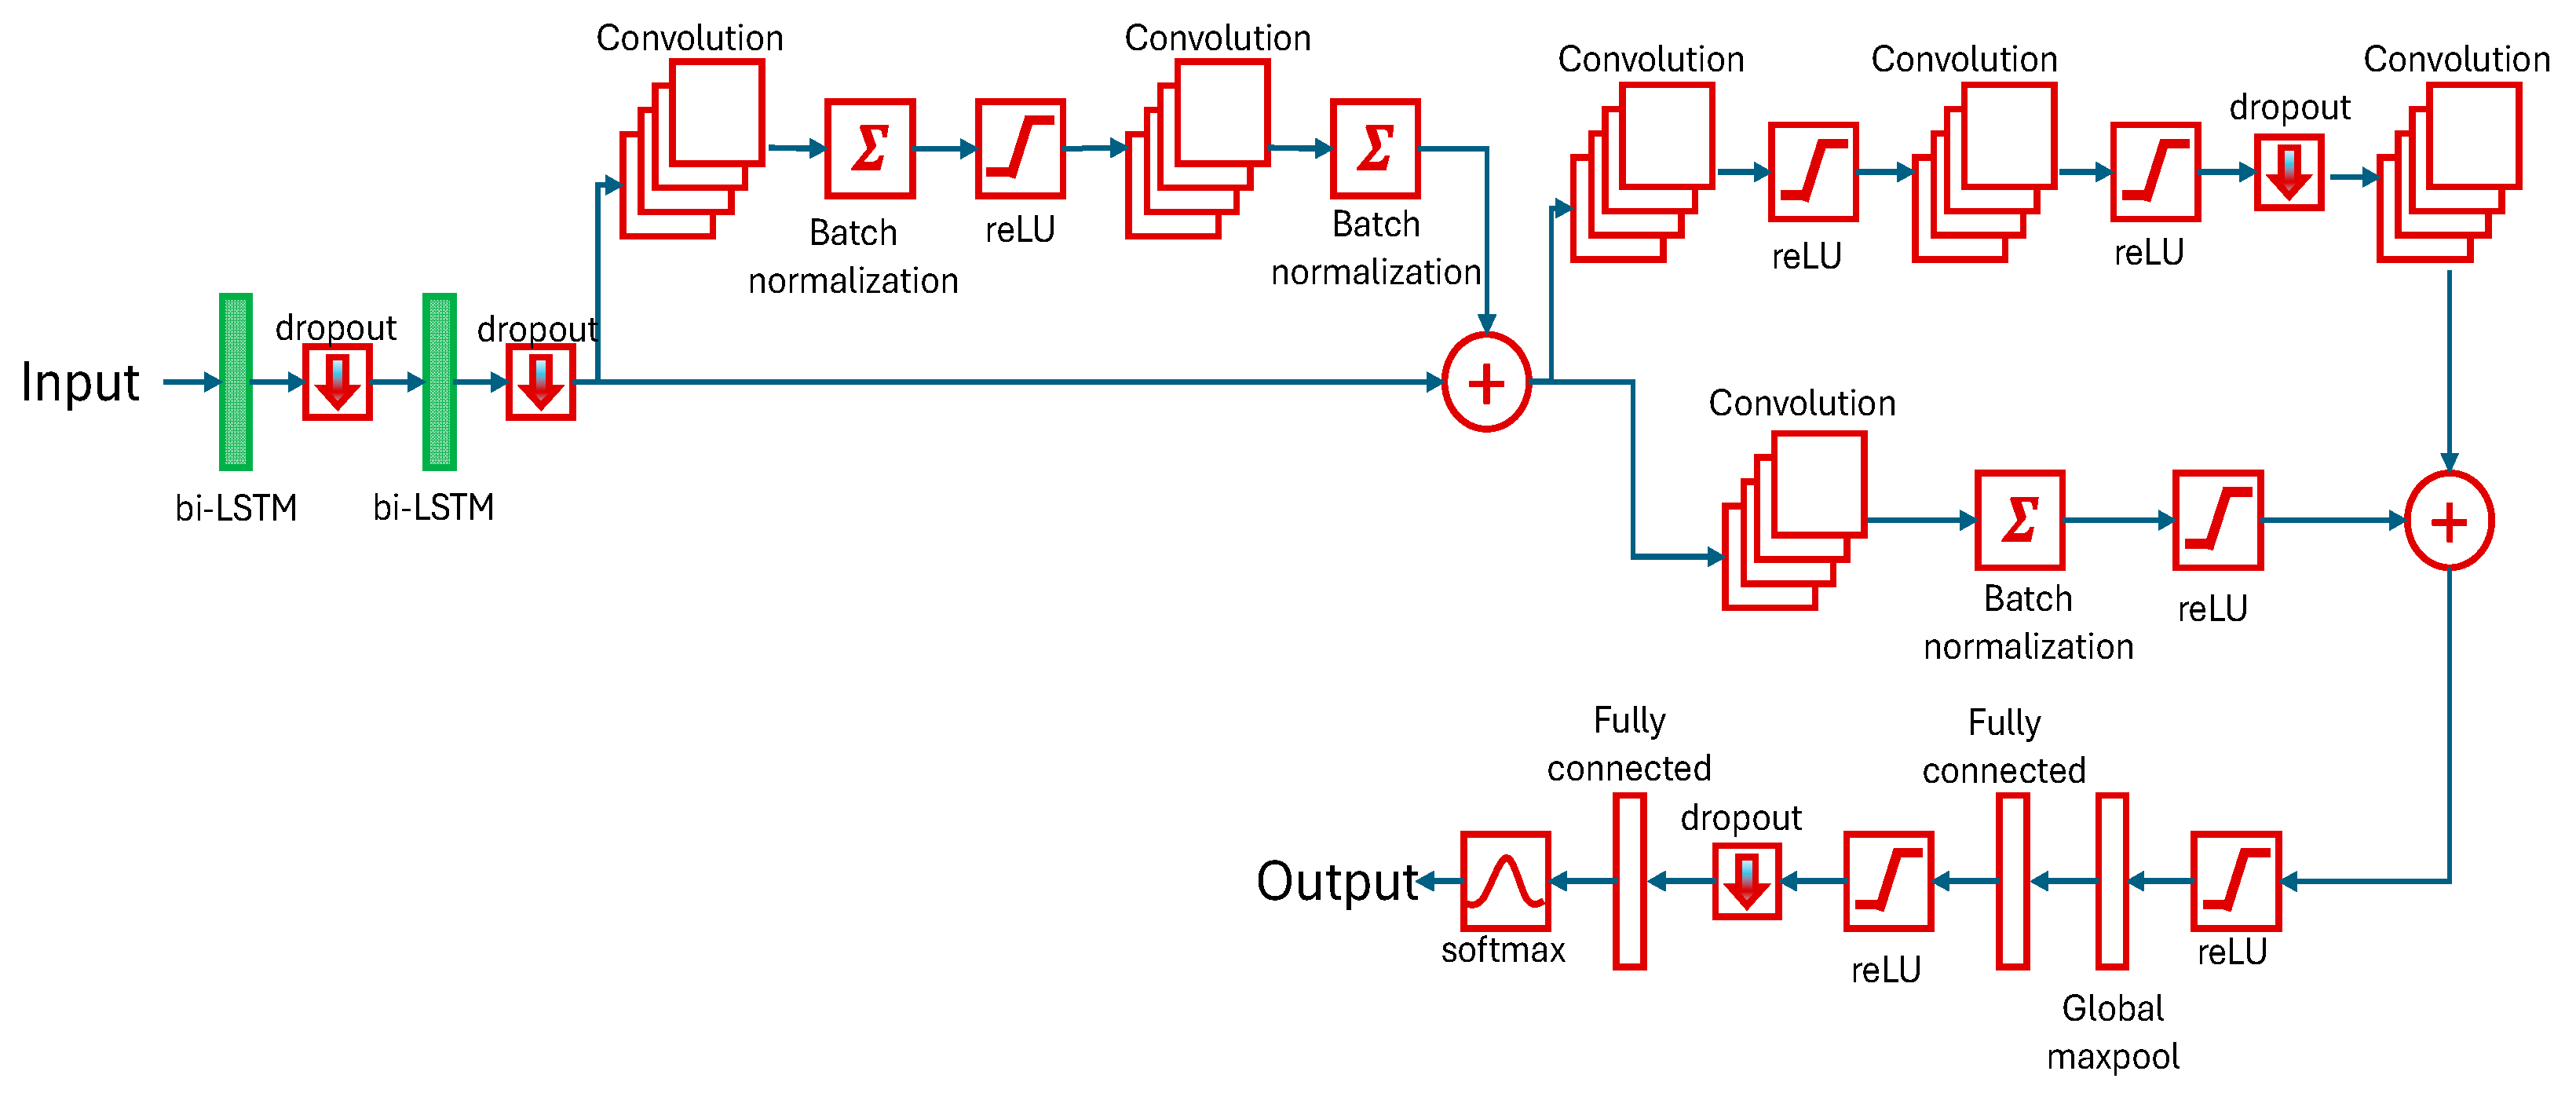
Figure 5.
Proposed Approach.
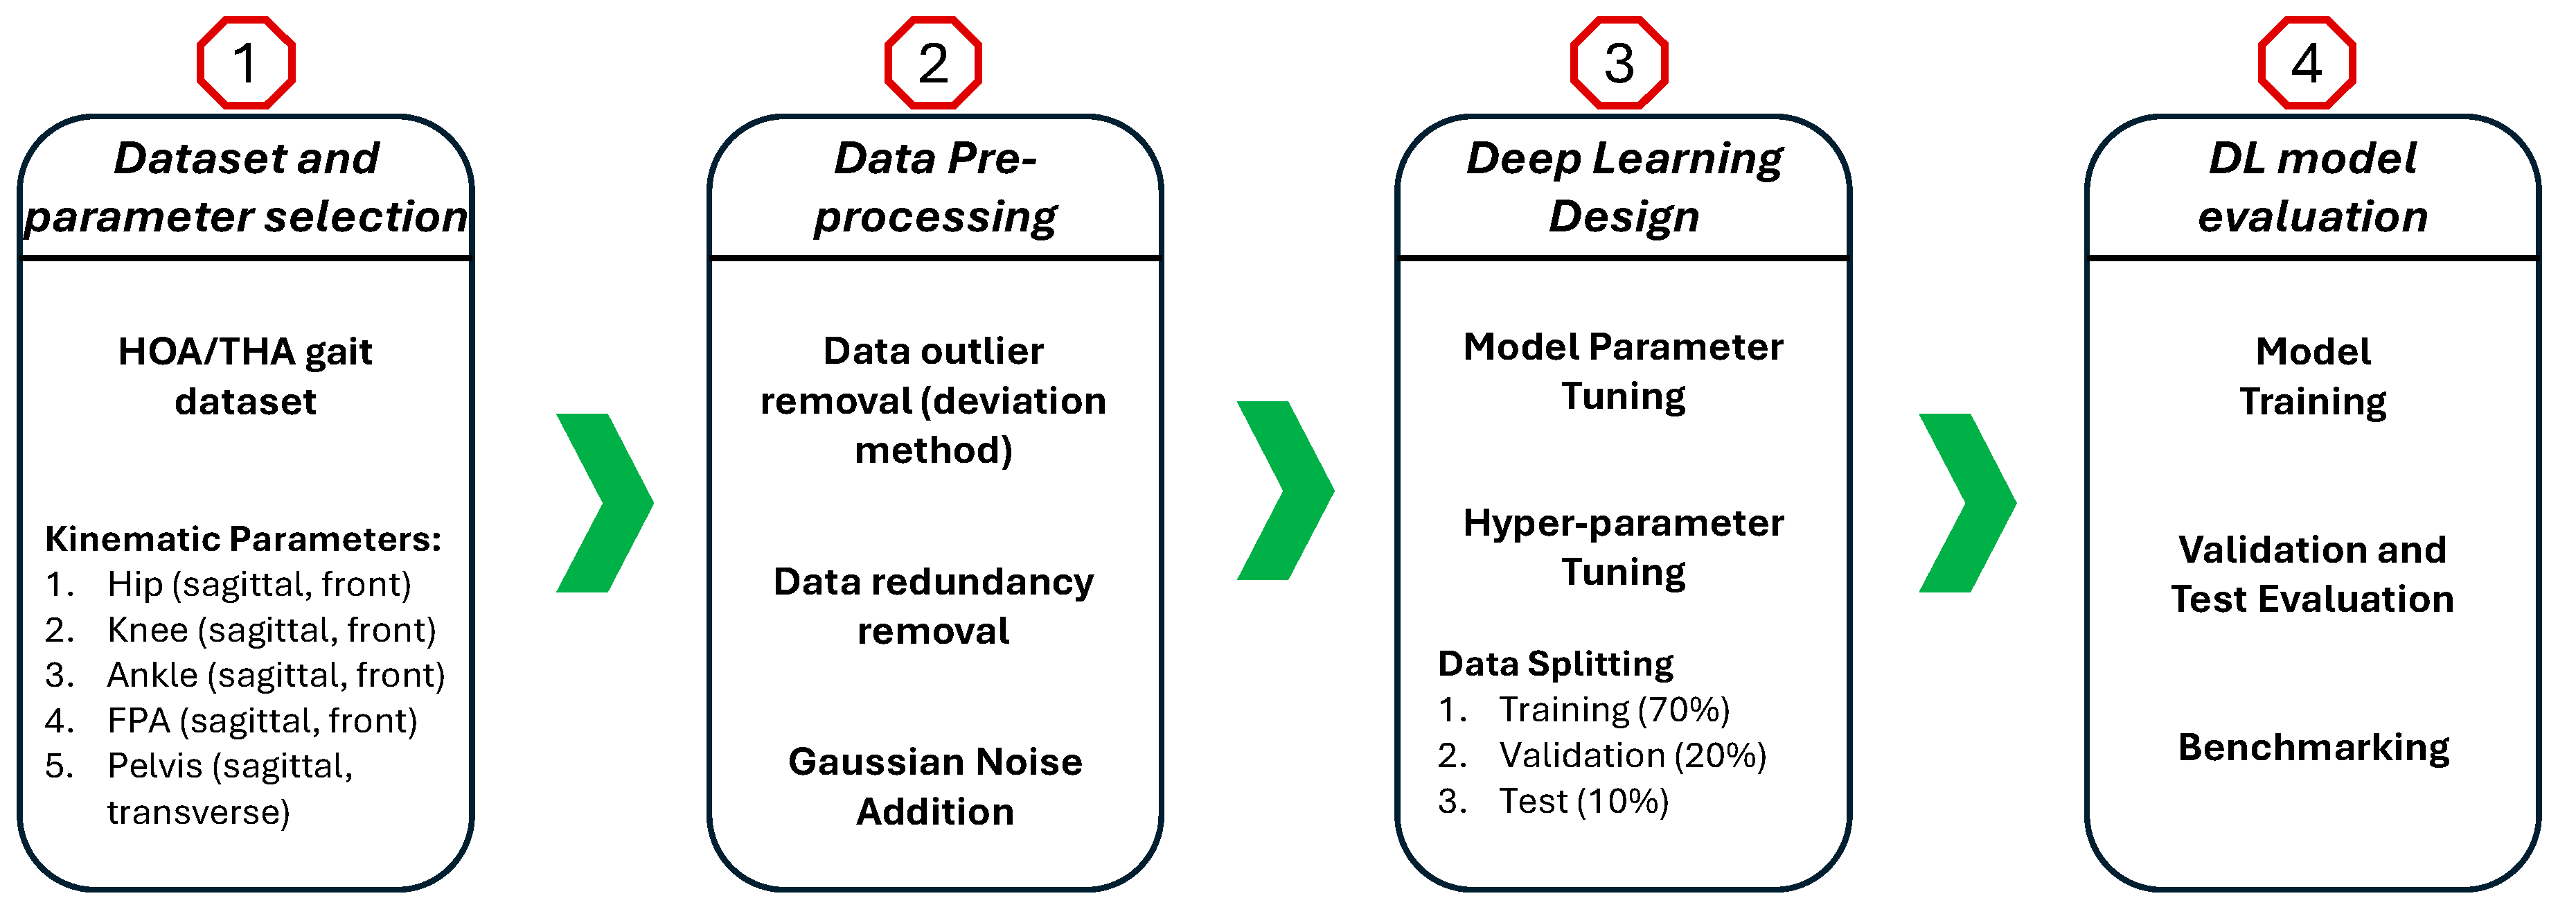
Figure 6.
Data description: (a) lower limb's markers, (b) body plane and angles.
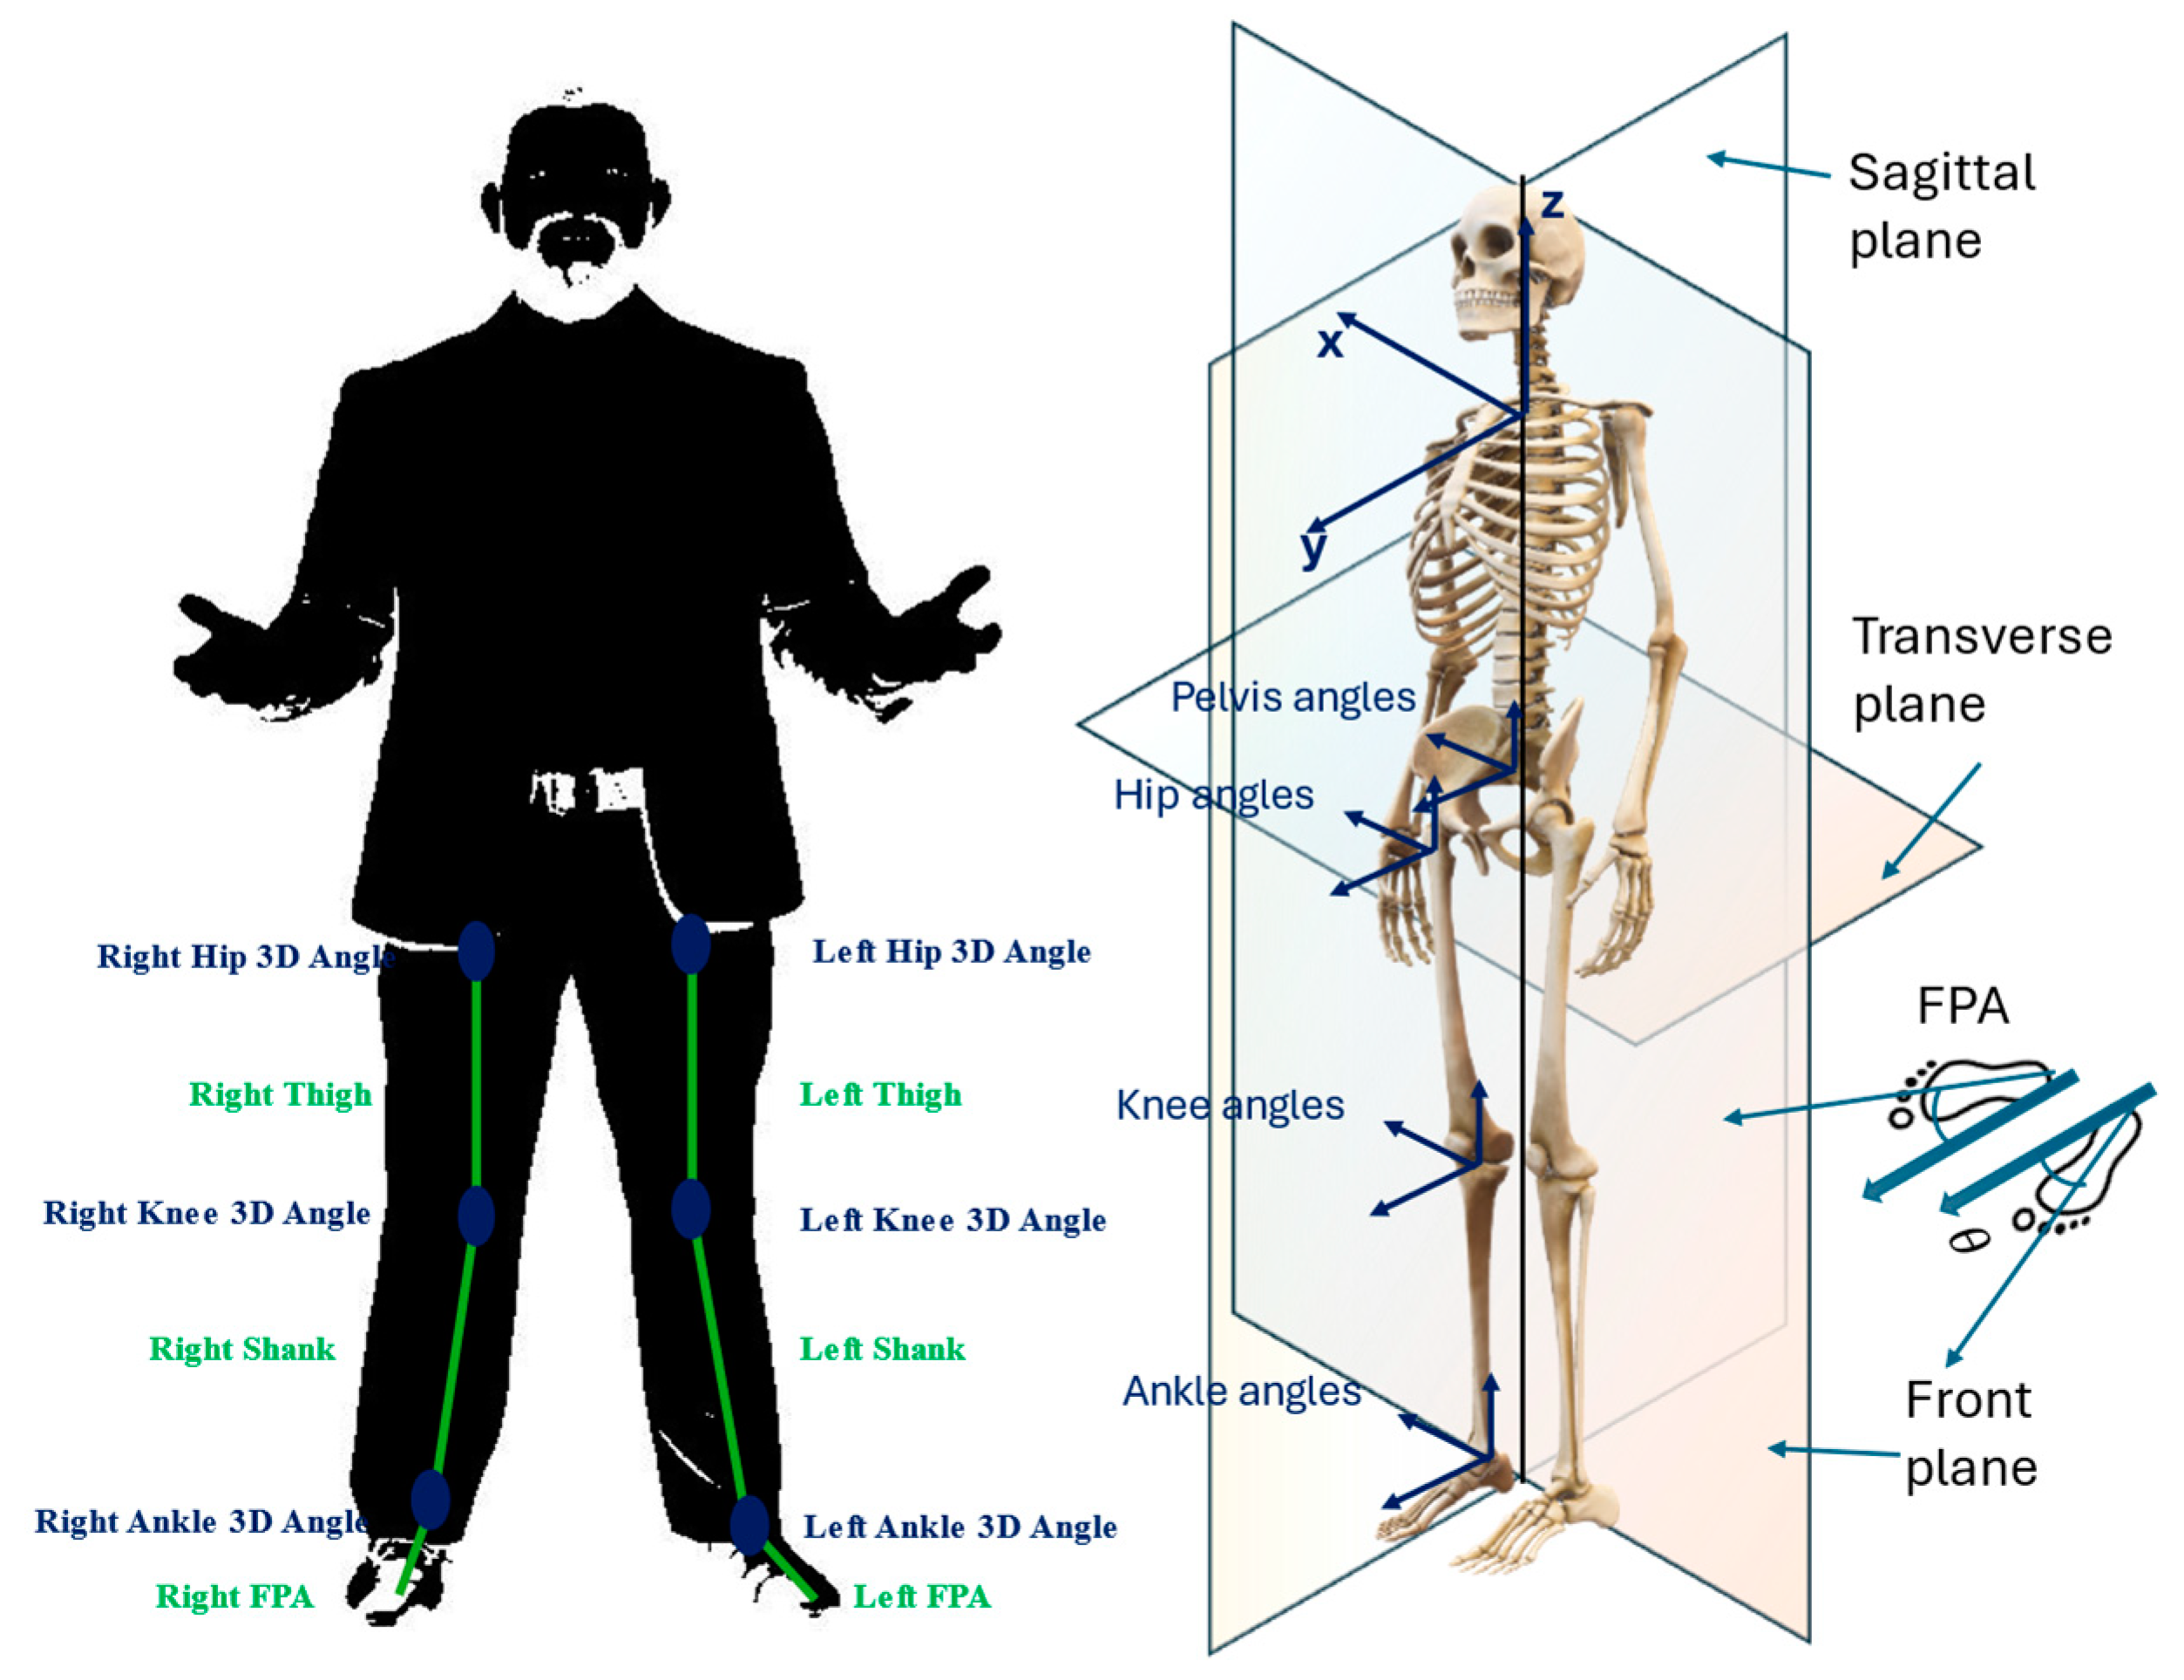
Figure 7.
Aggregated joint angles of the affected limb.
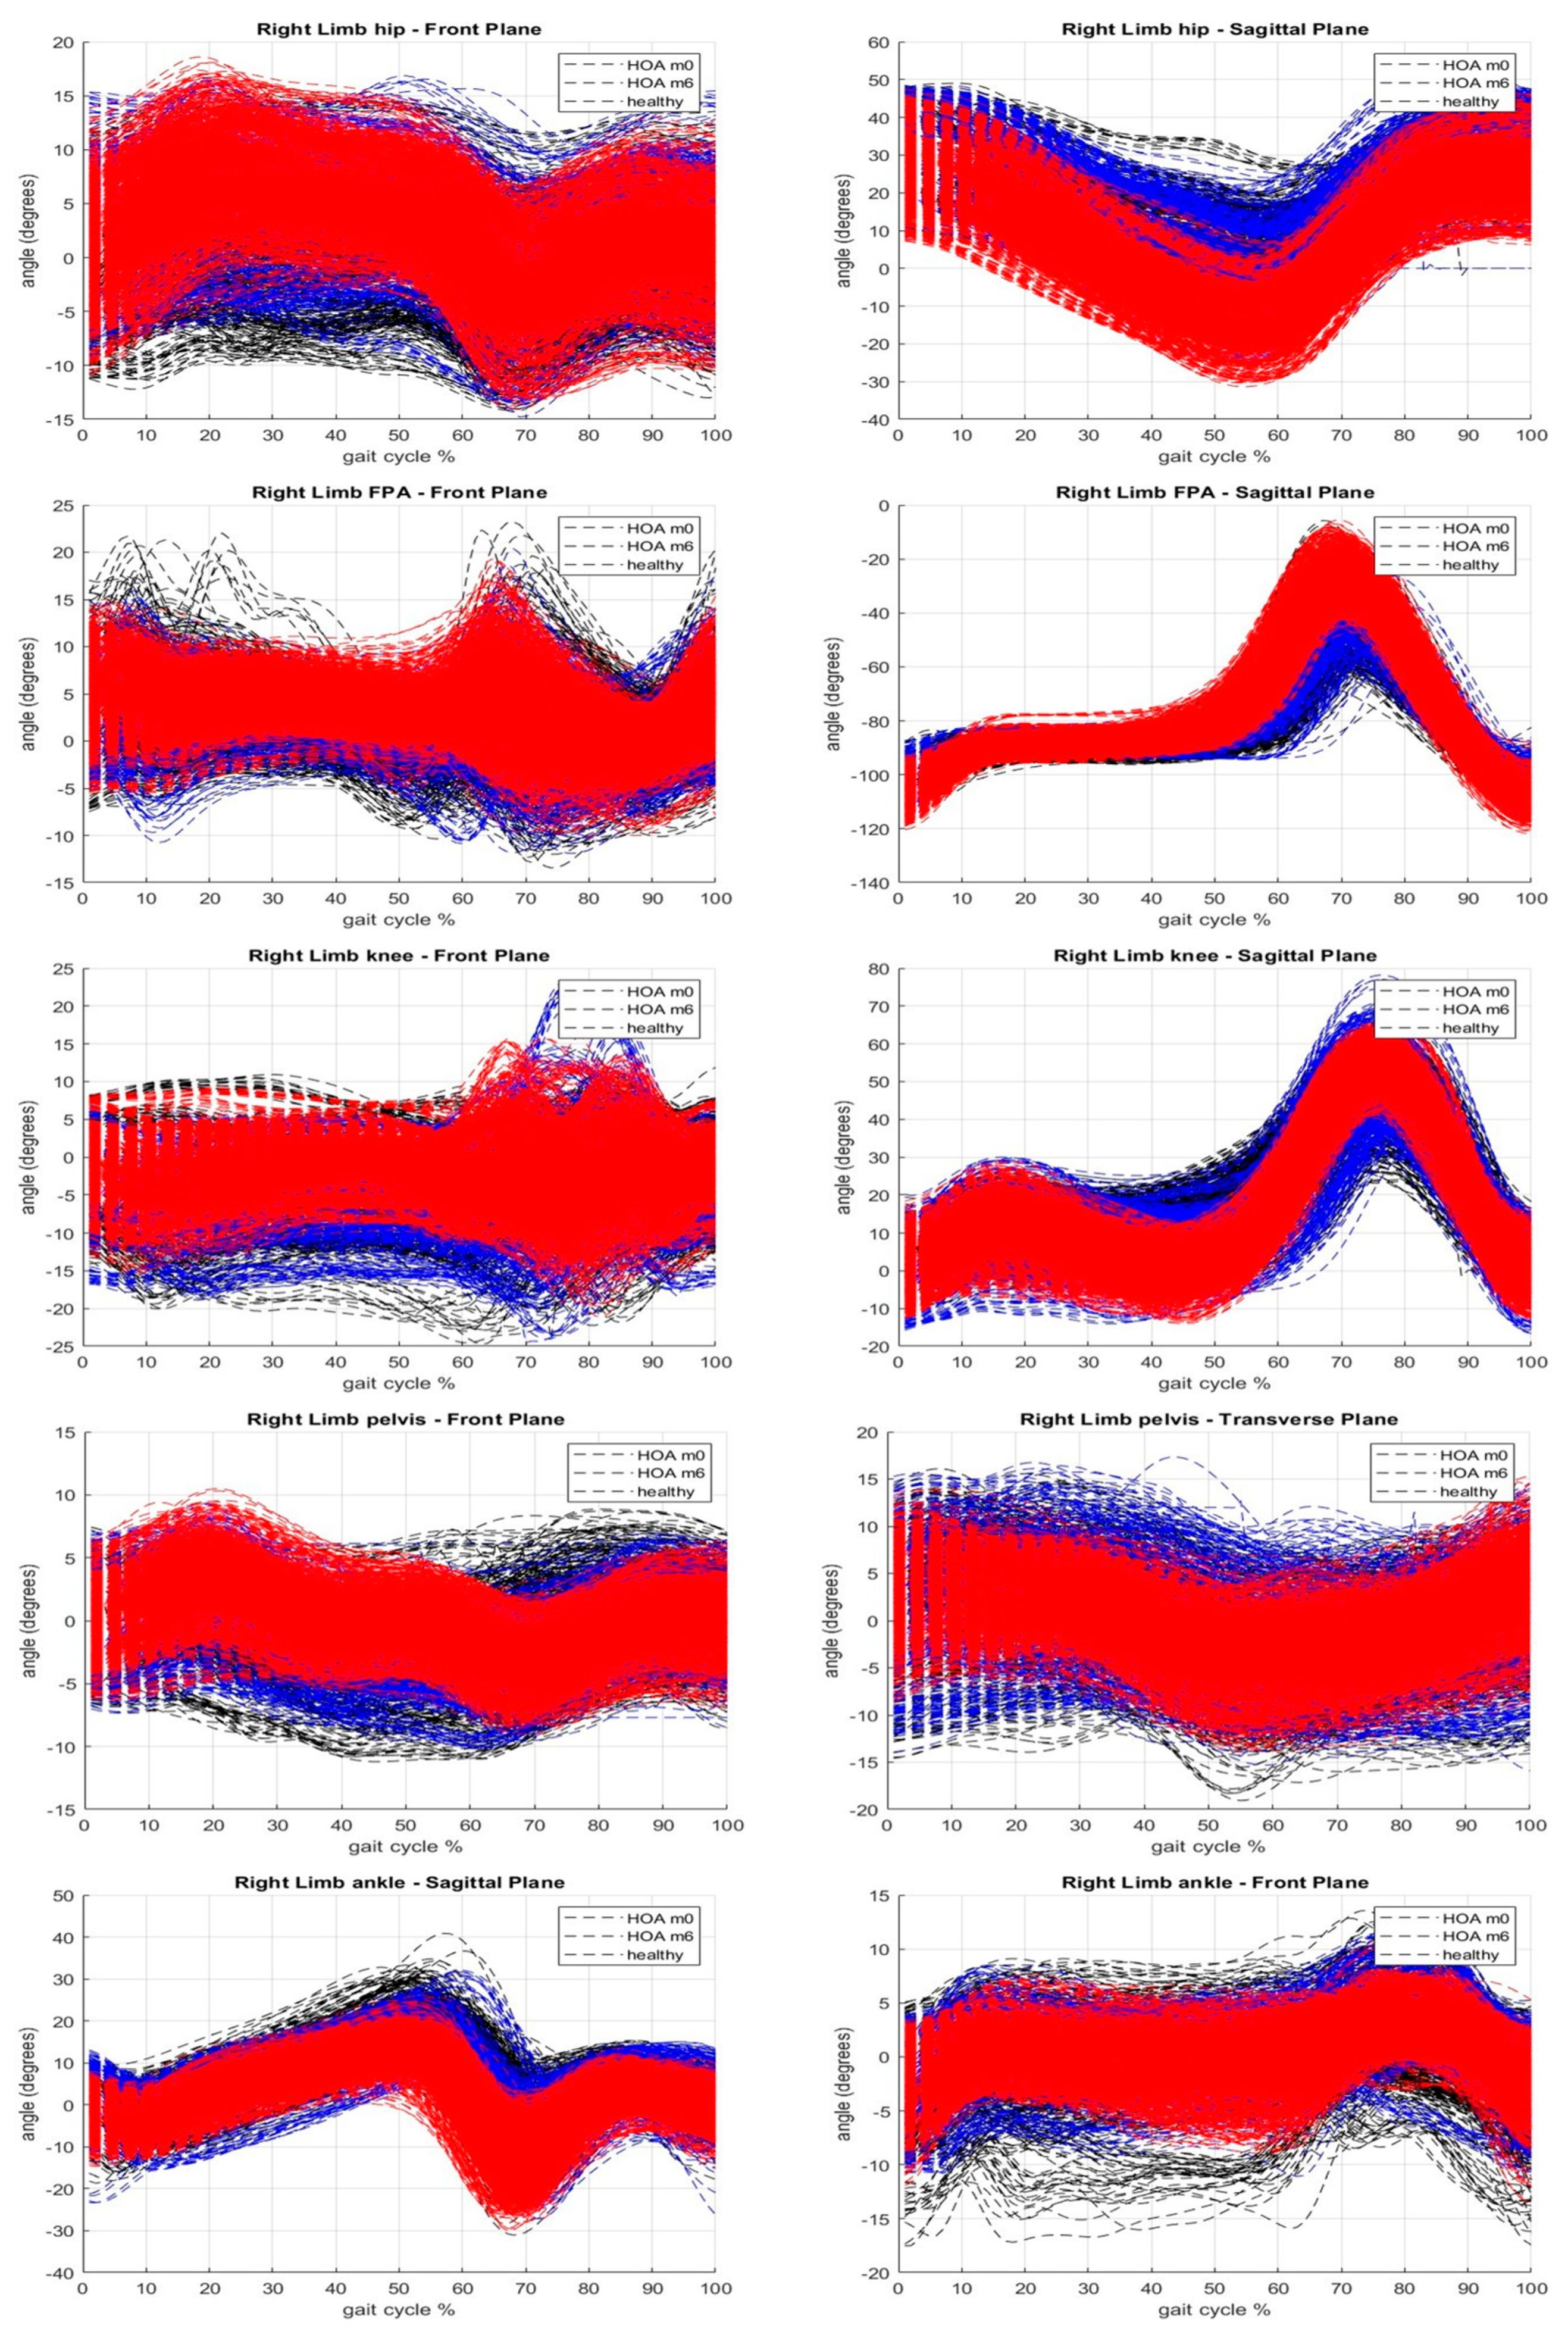
Figure 8.
Gaussian Noise Addition.
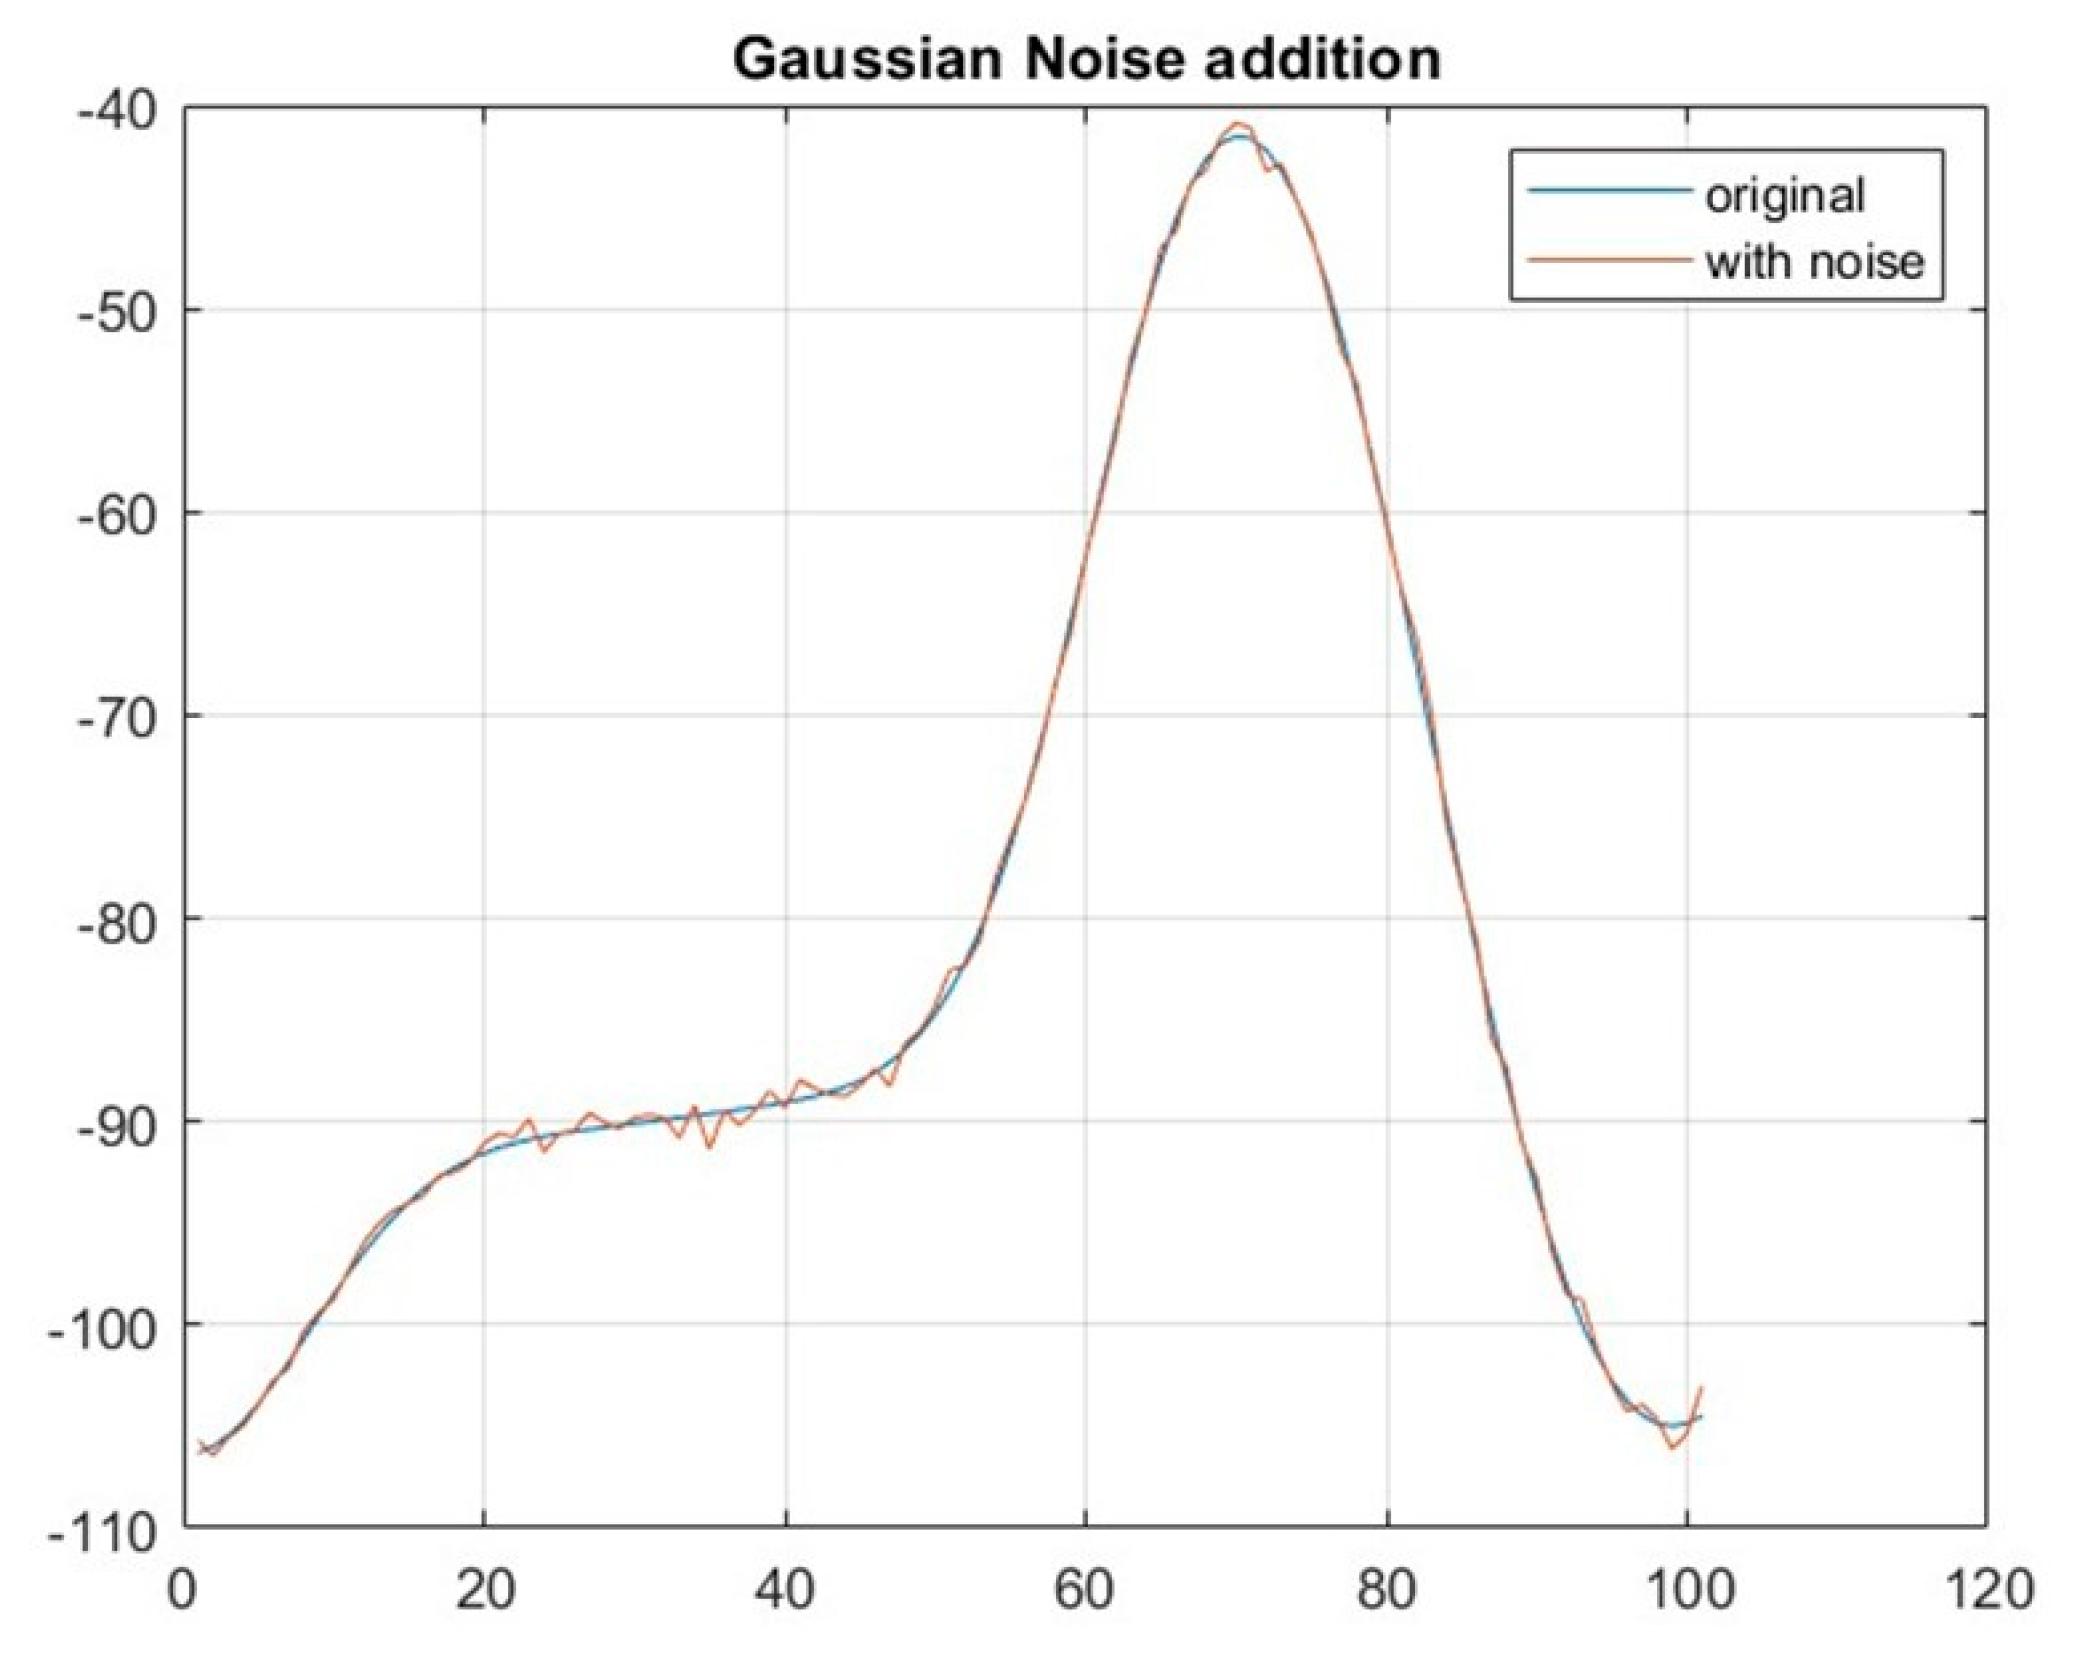
Figure 9.
Comparison from literature.
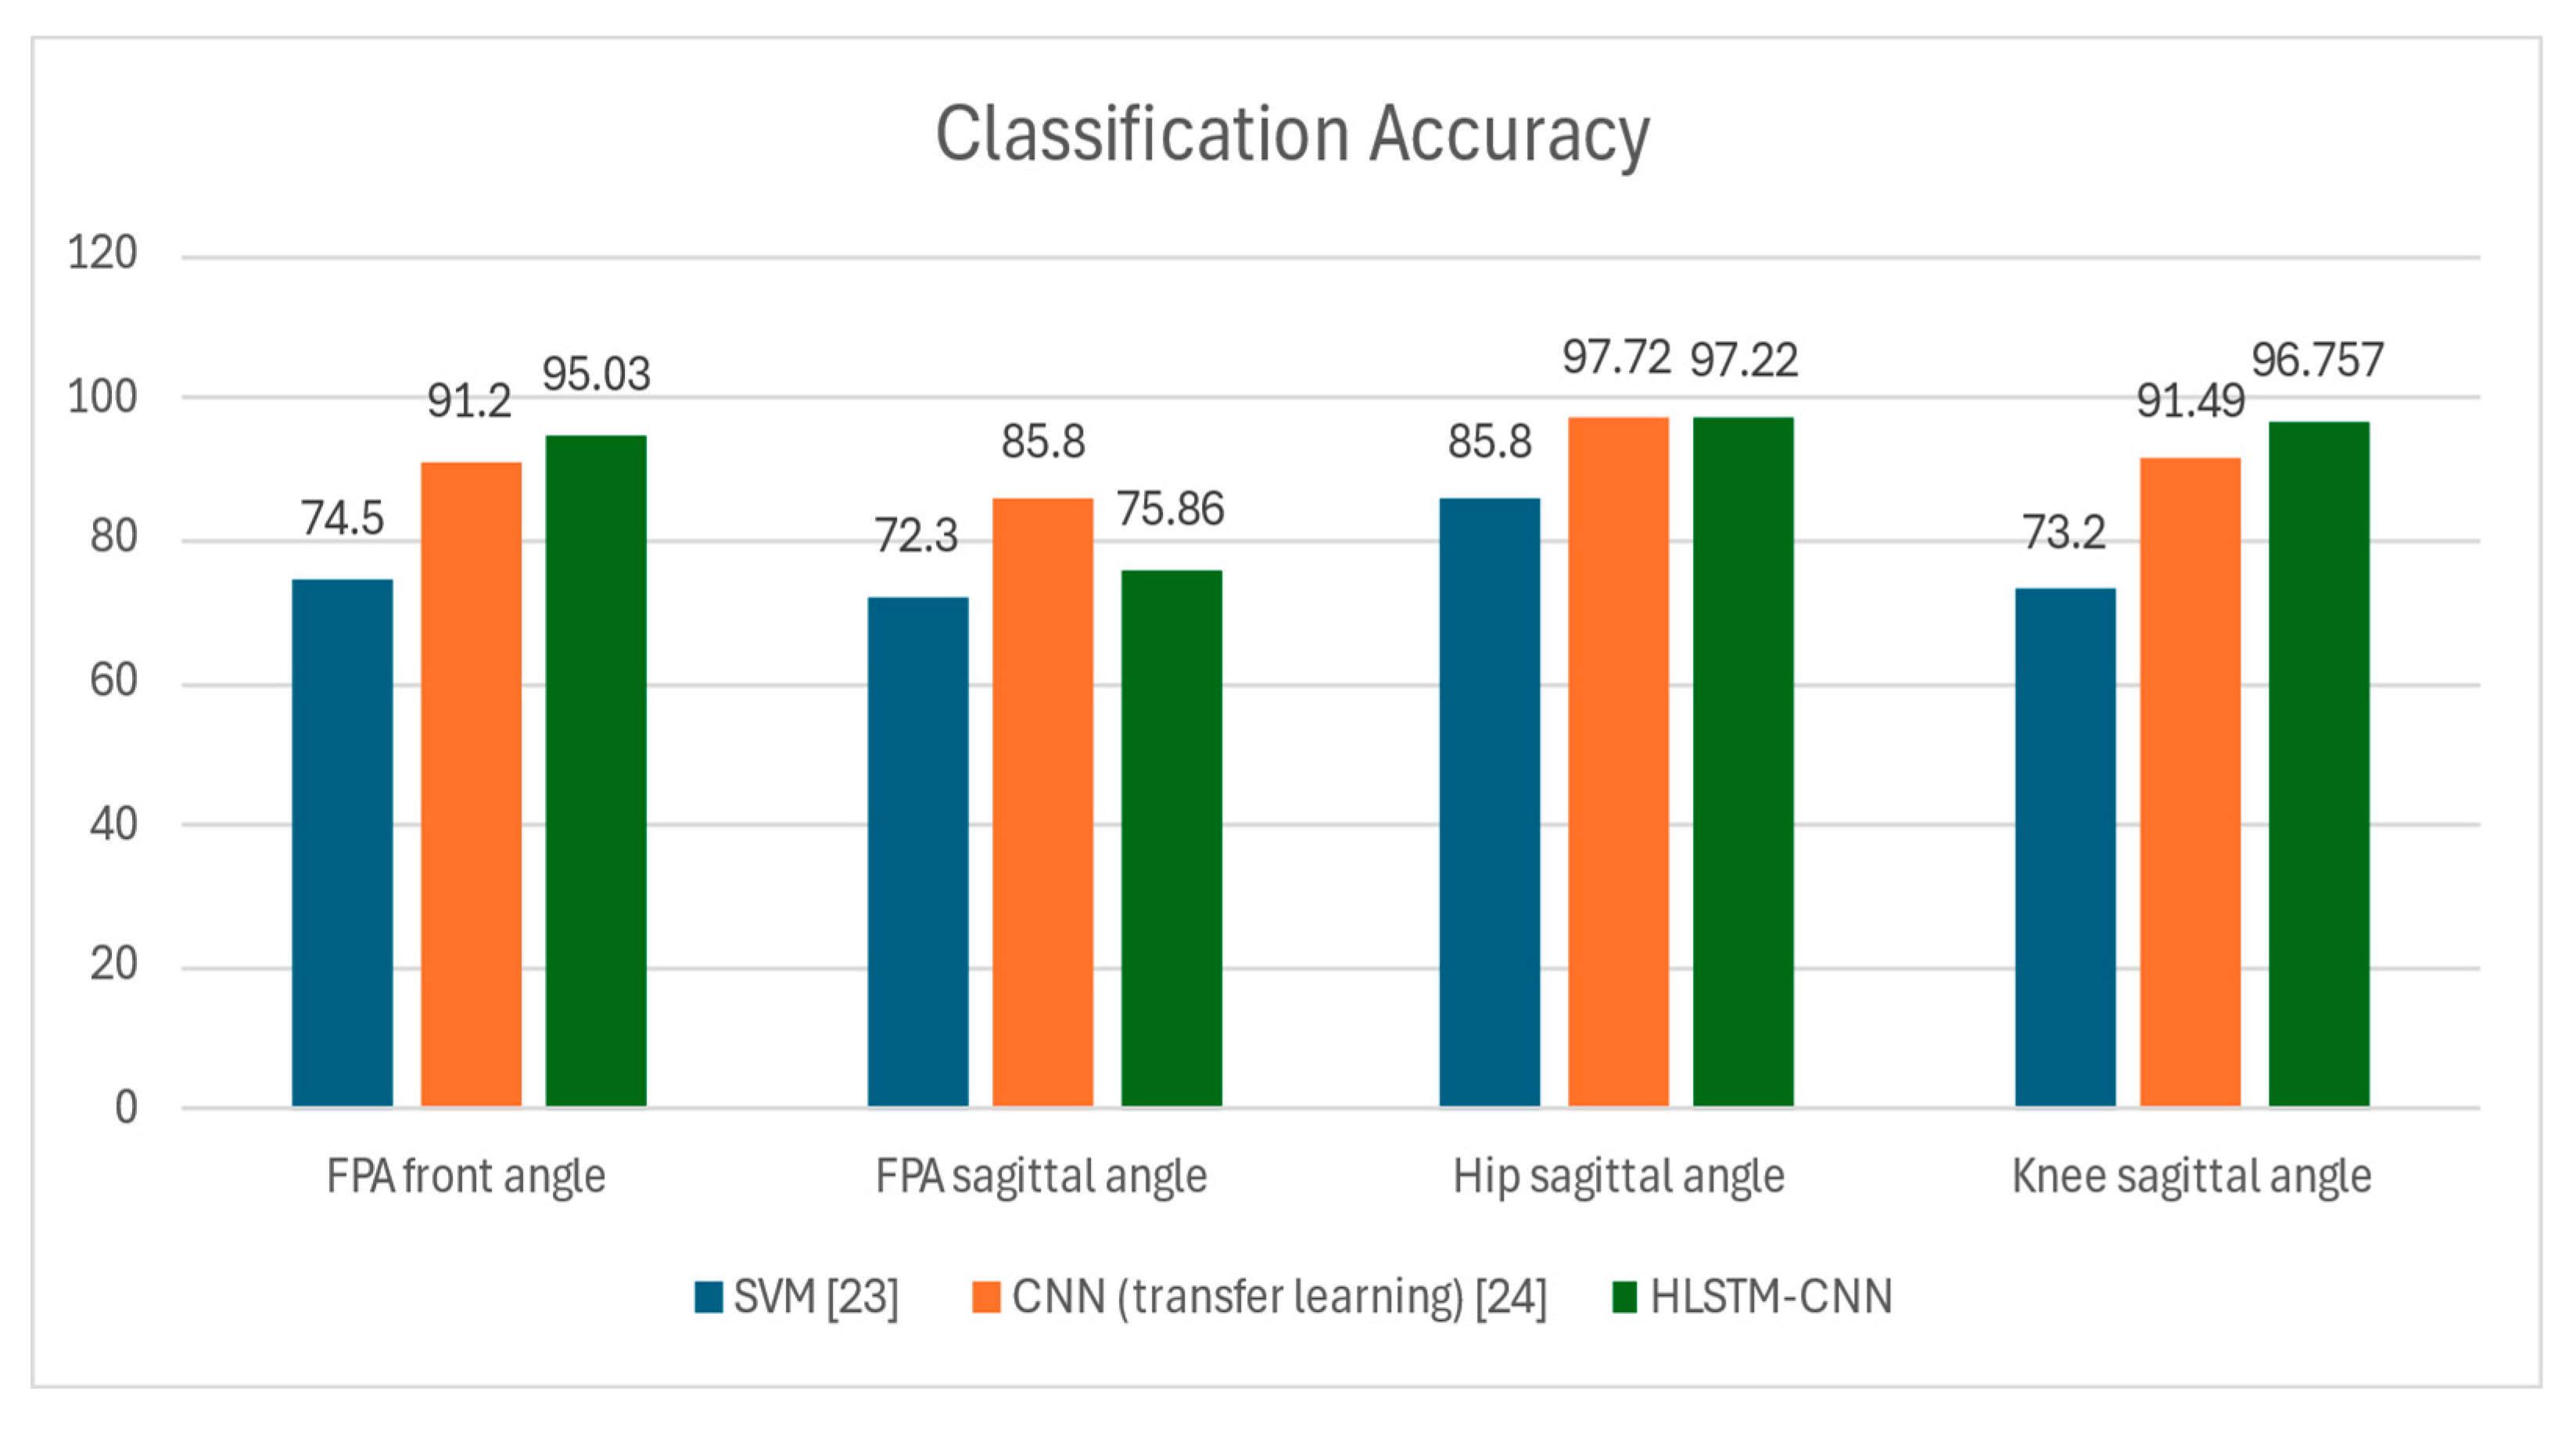
Figure 10.
Confusion Matrix of the hip sagittal angle.
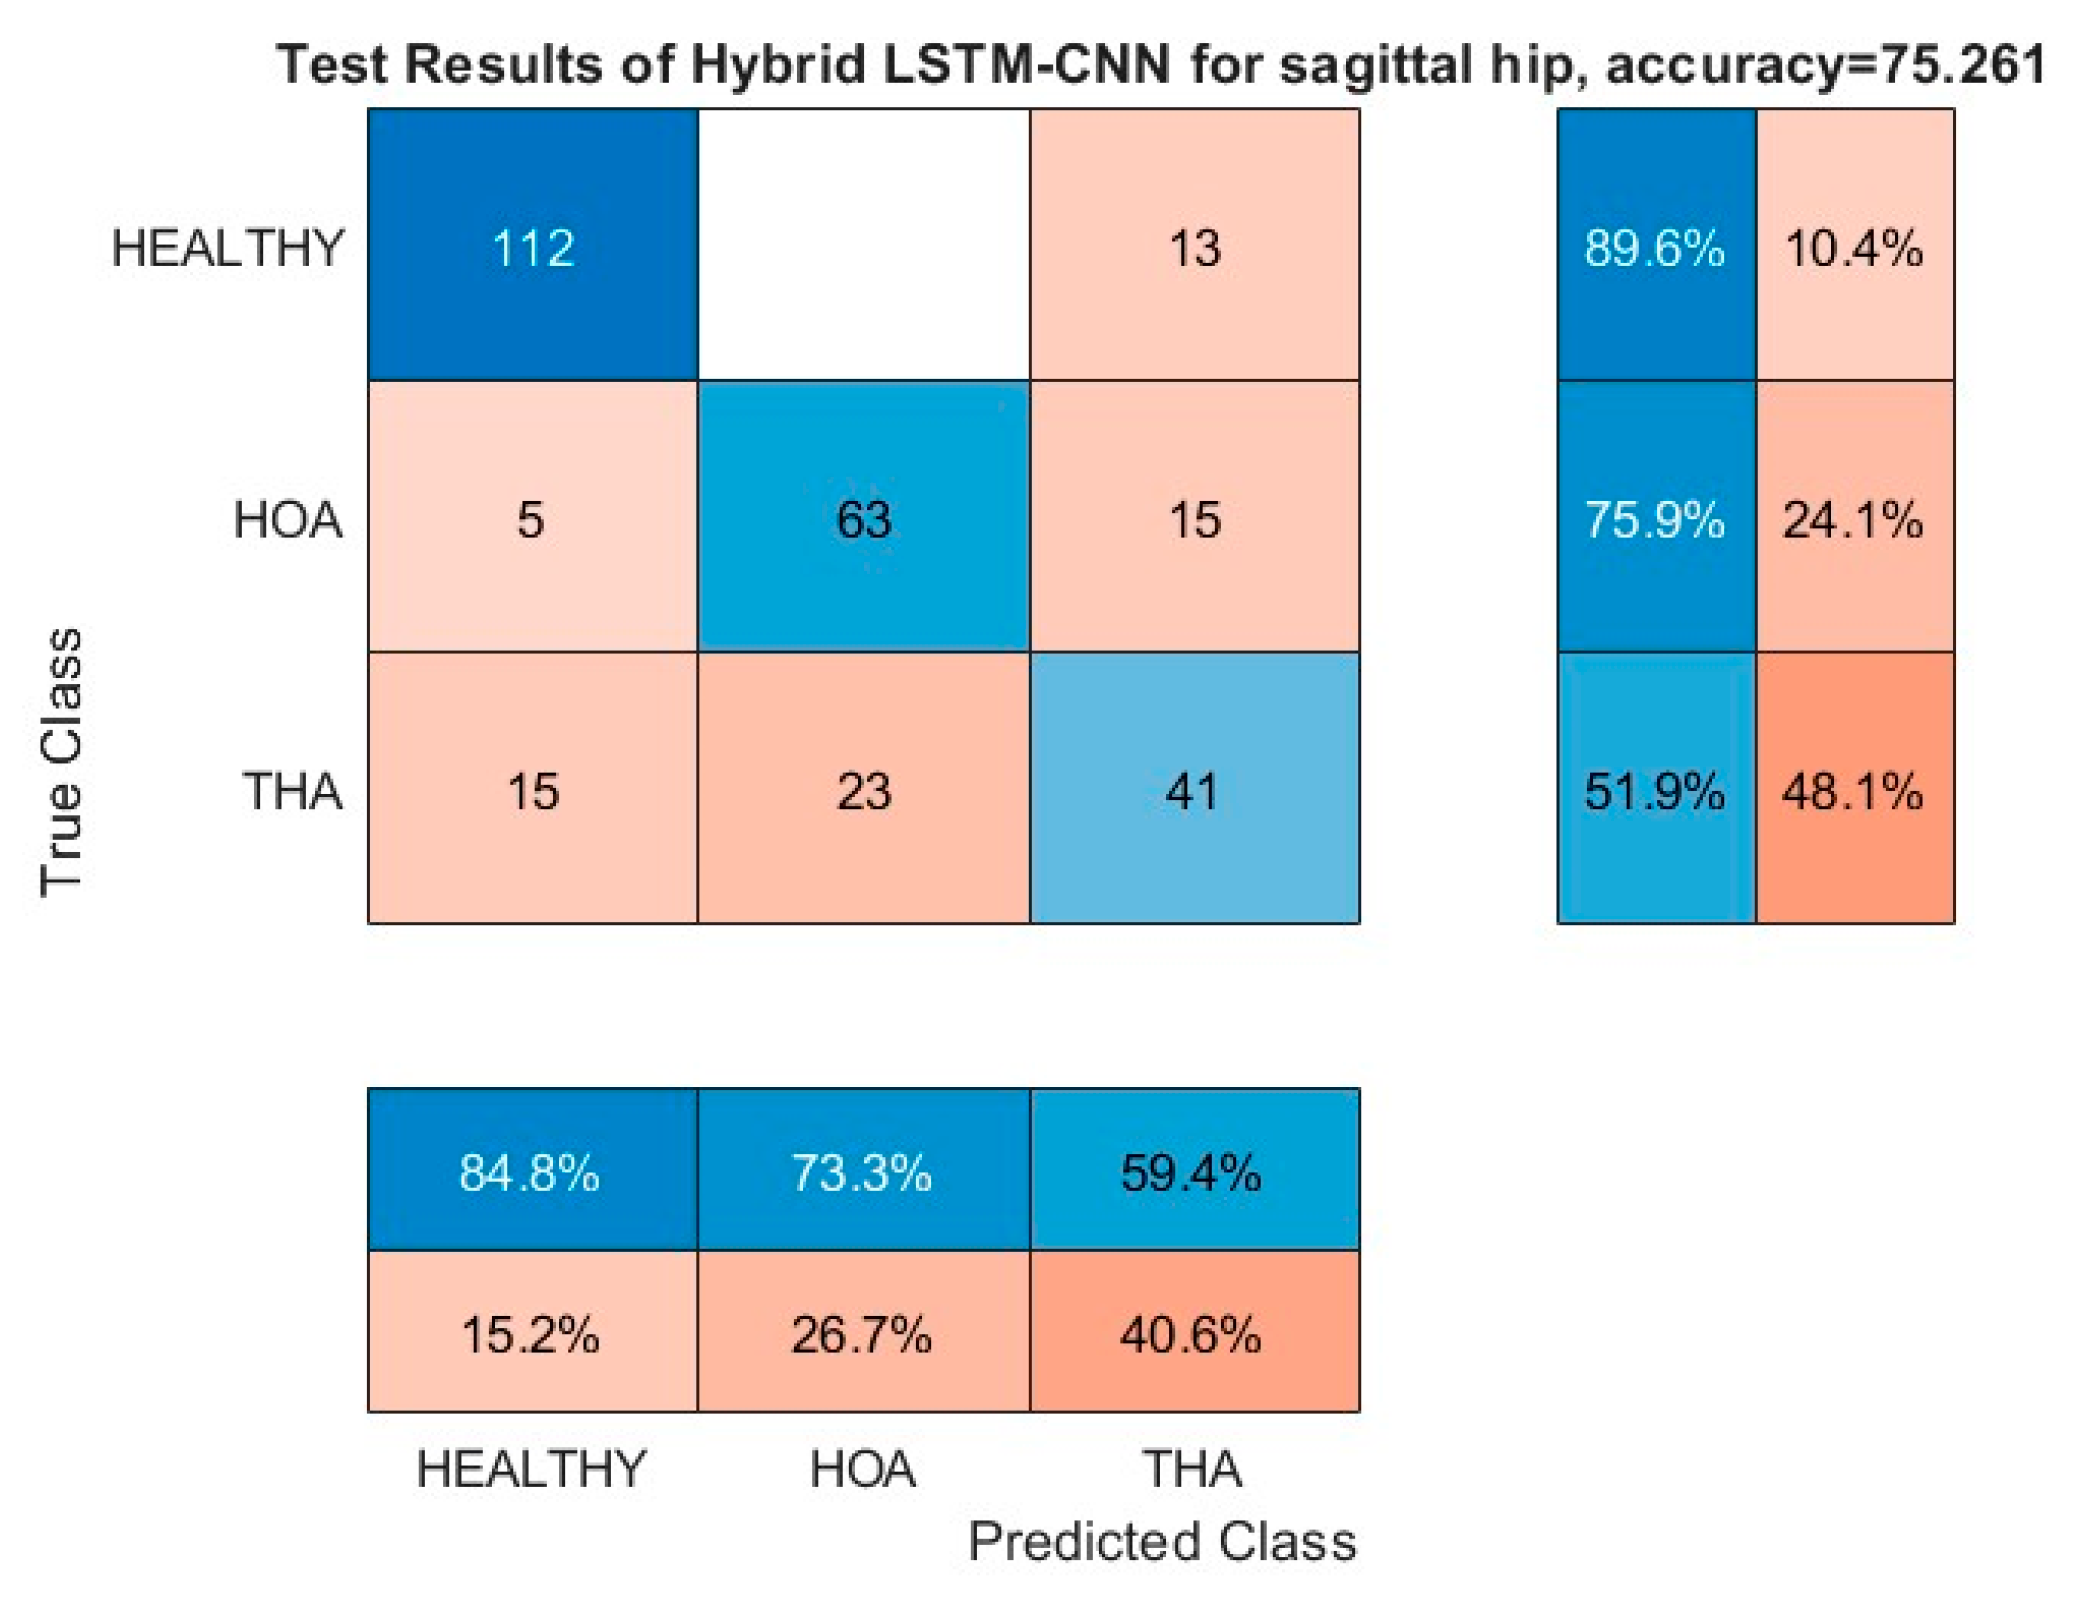
Figure 11.
Confusion Matrix of the knee sagittal angle.
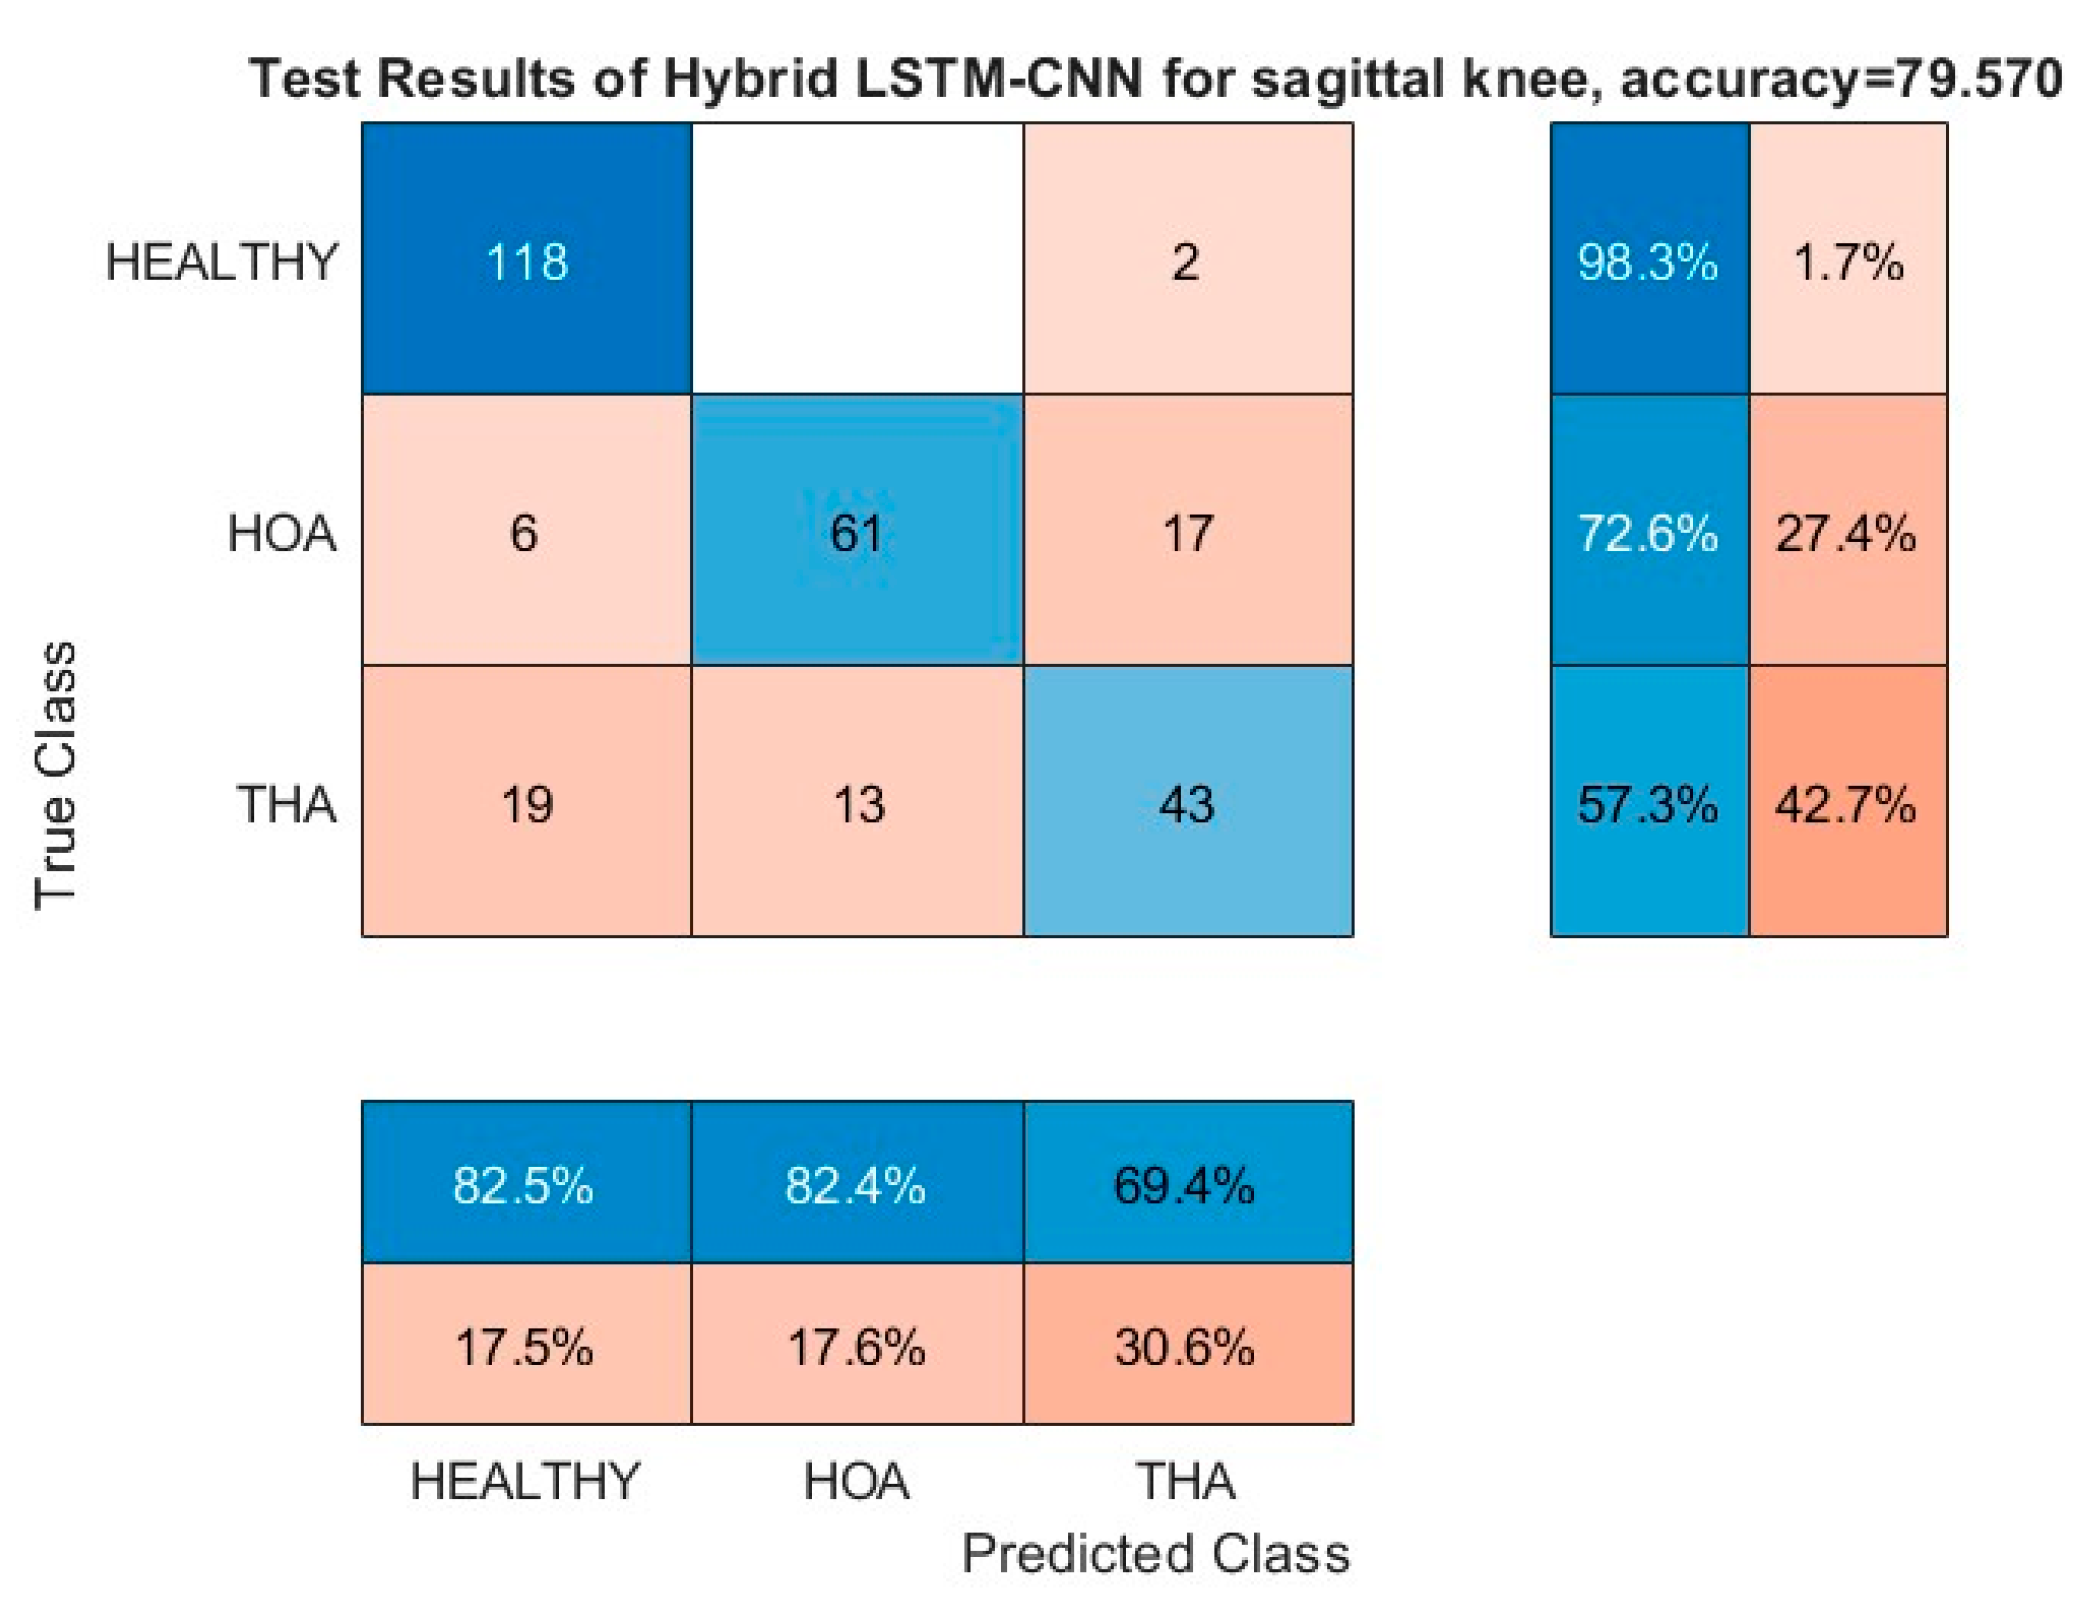
Figure 12.
Confusion Matrix of the knee front angle.
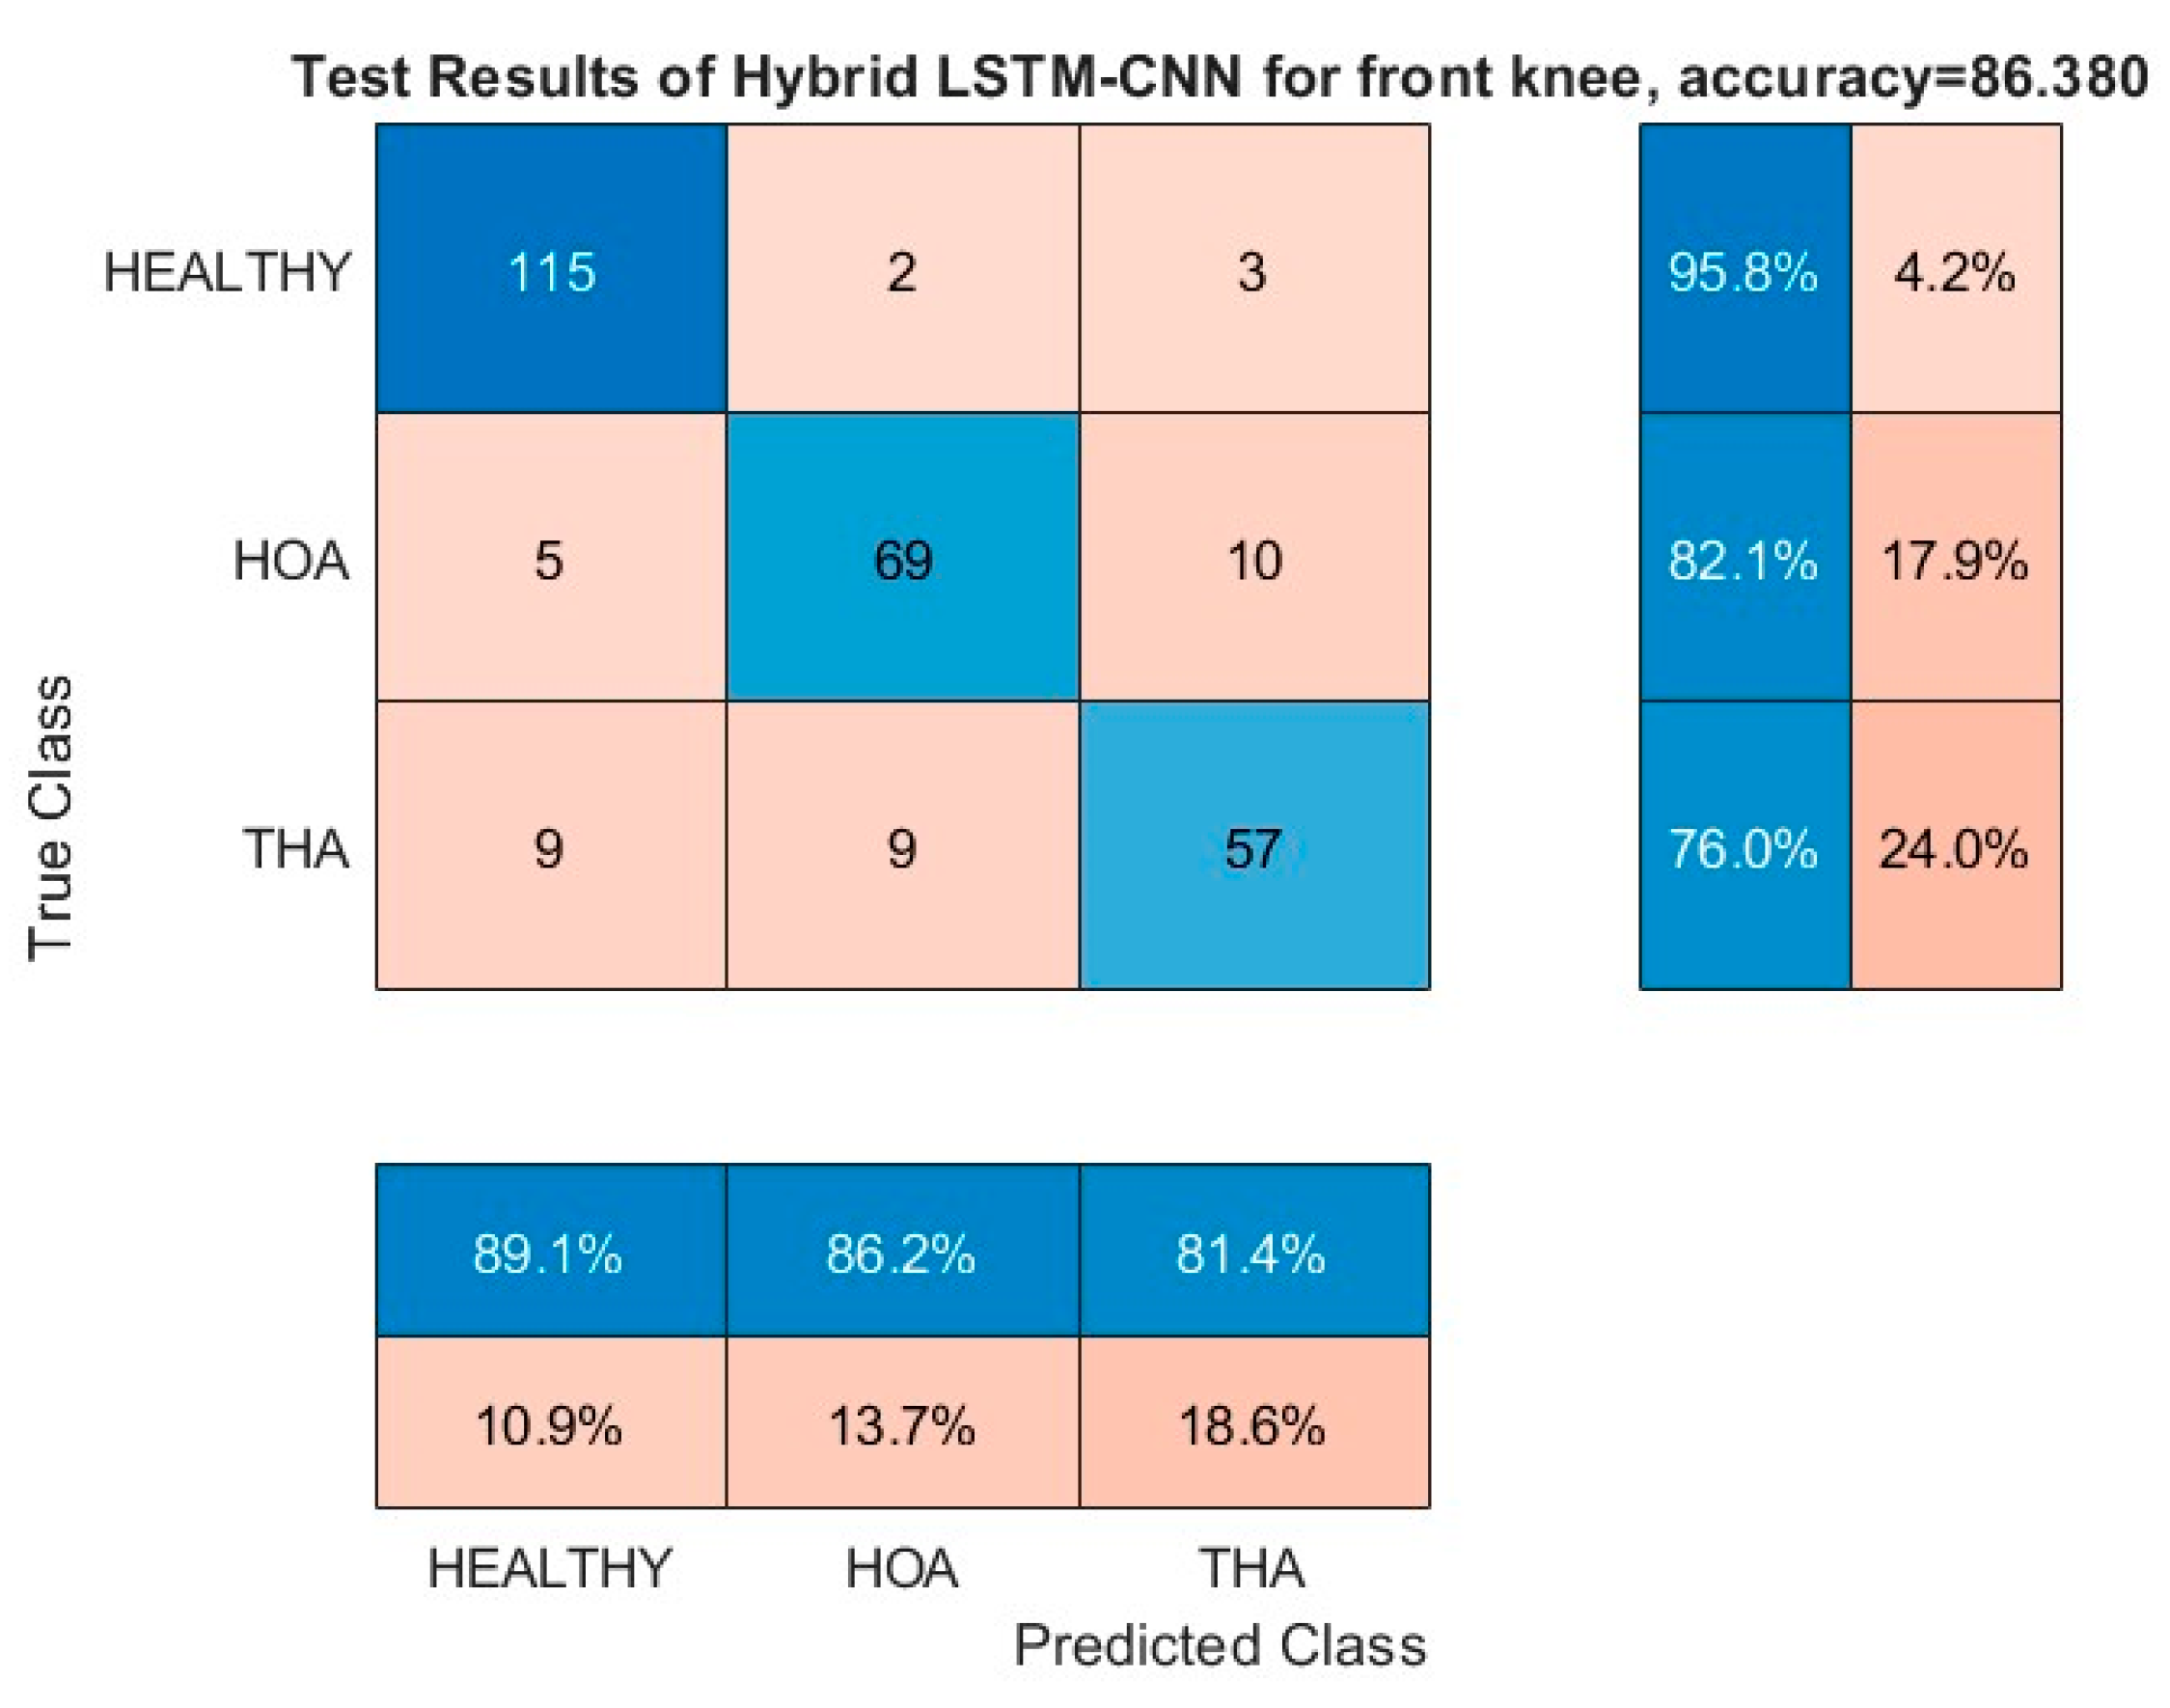
Figure 13.
Confusion Matrix of the FPA front angle.
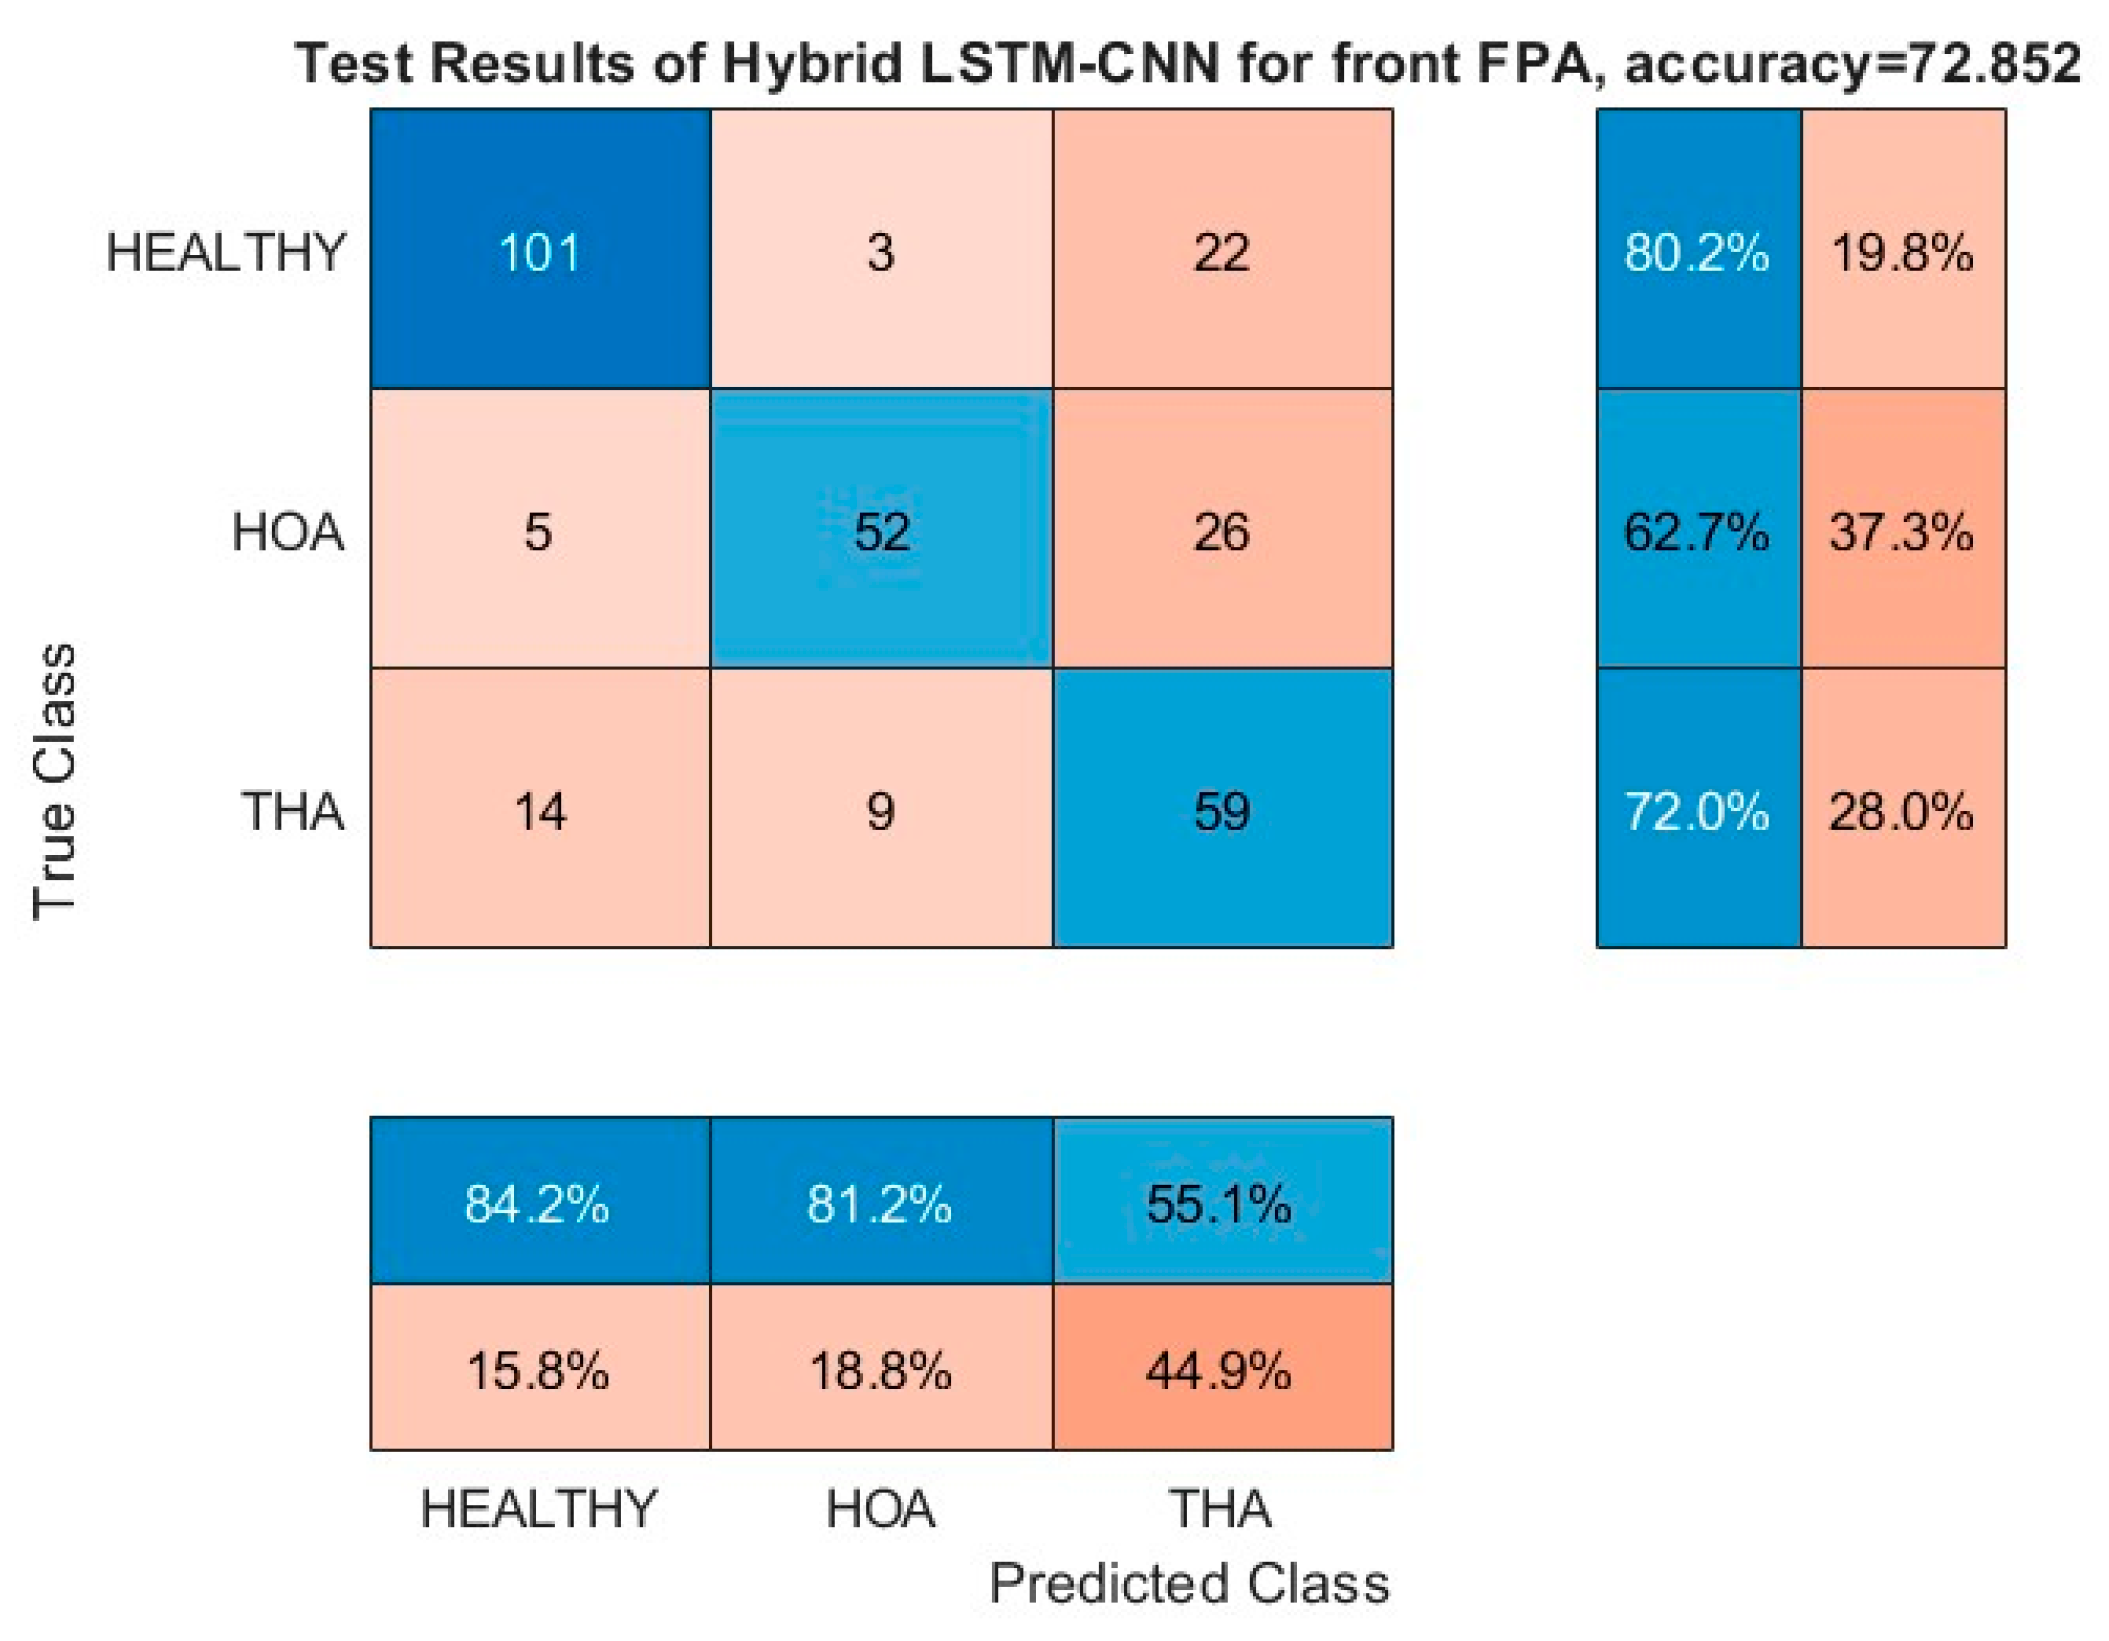
Figure 14.
Healthy prediction of subjects after THA.
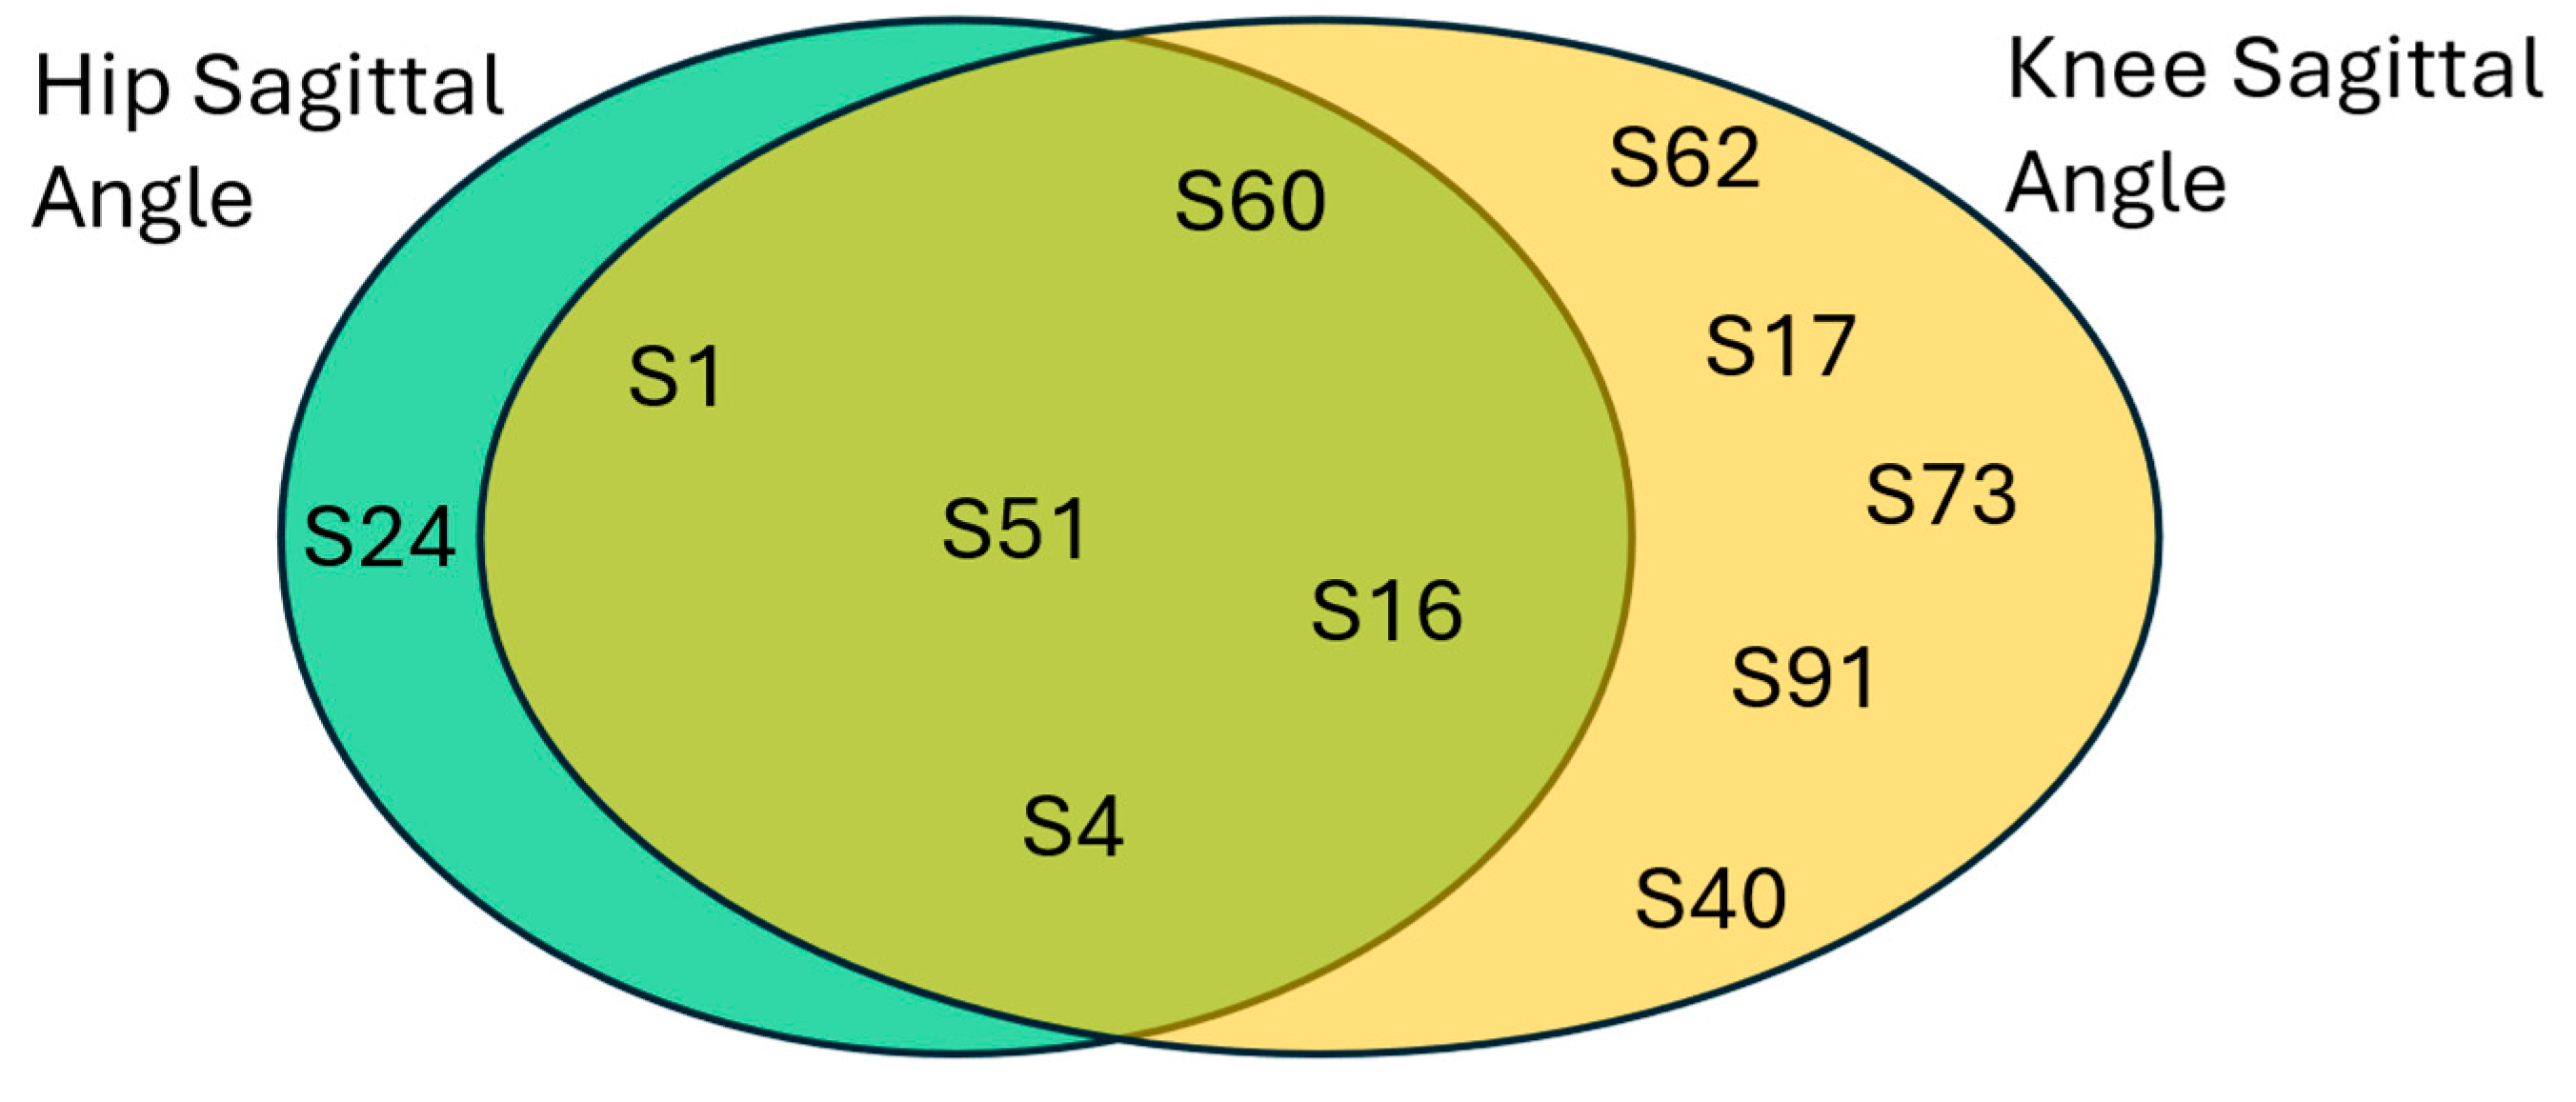
Figure 15.
HOA prediction of subjects after THA.
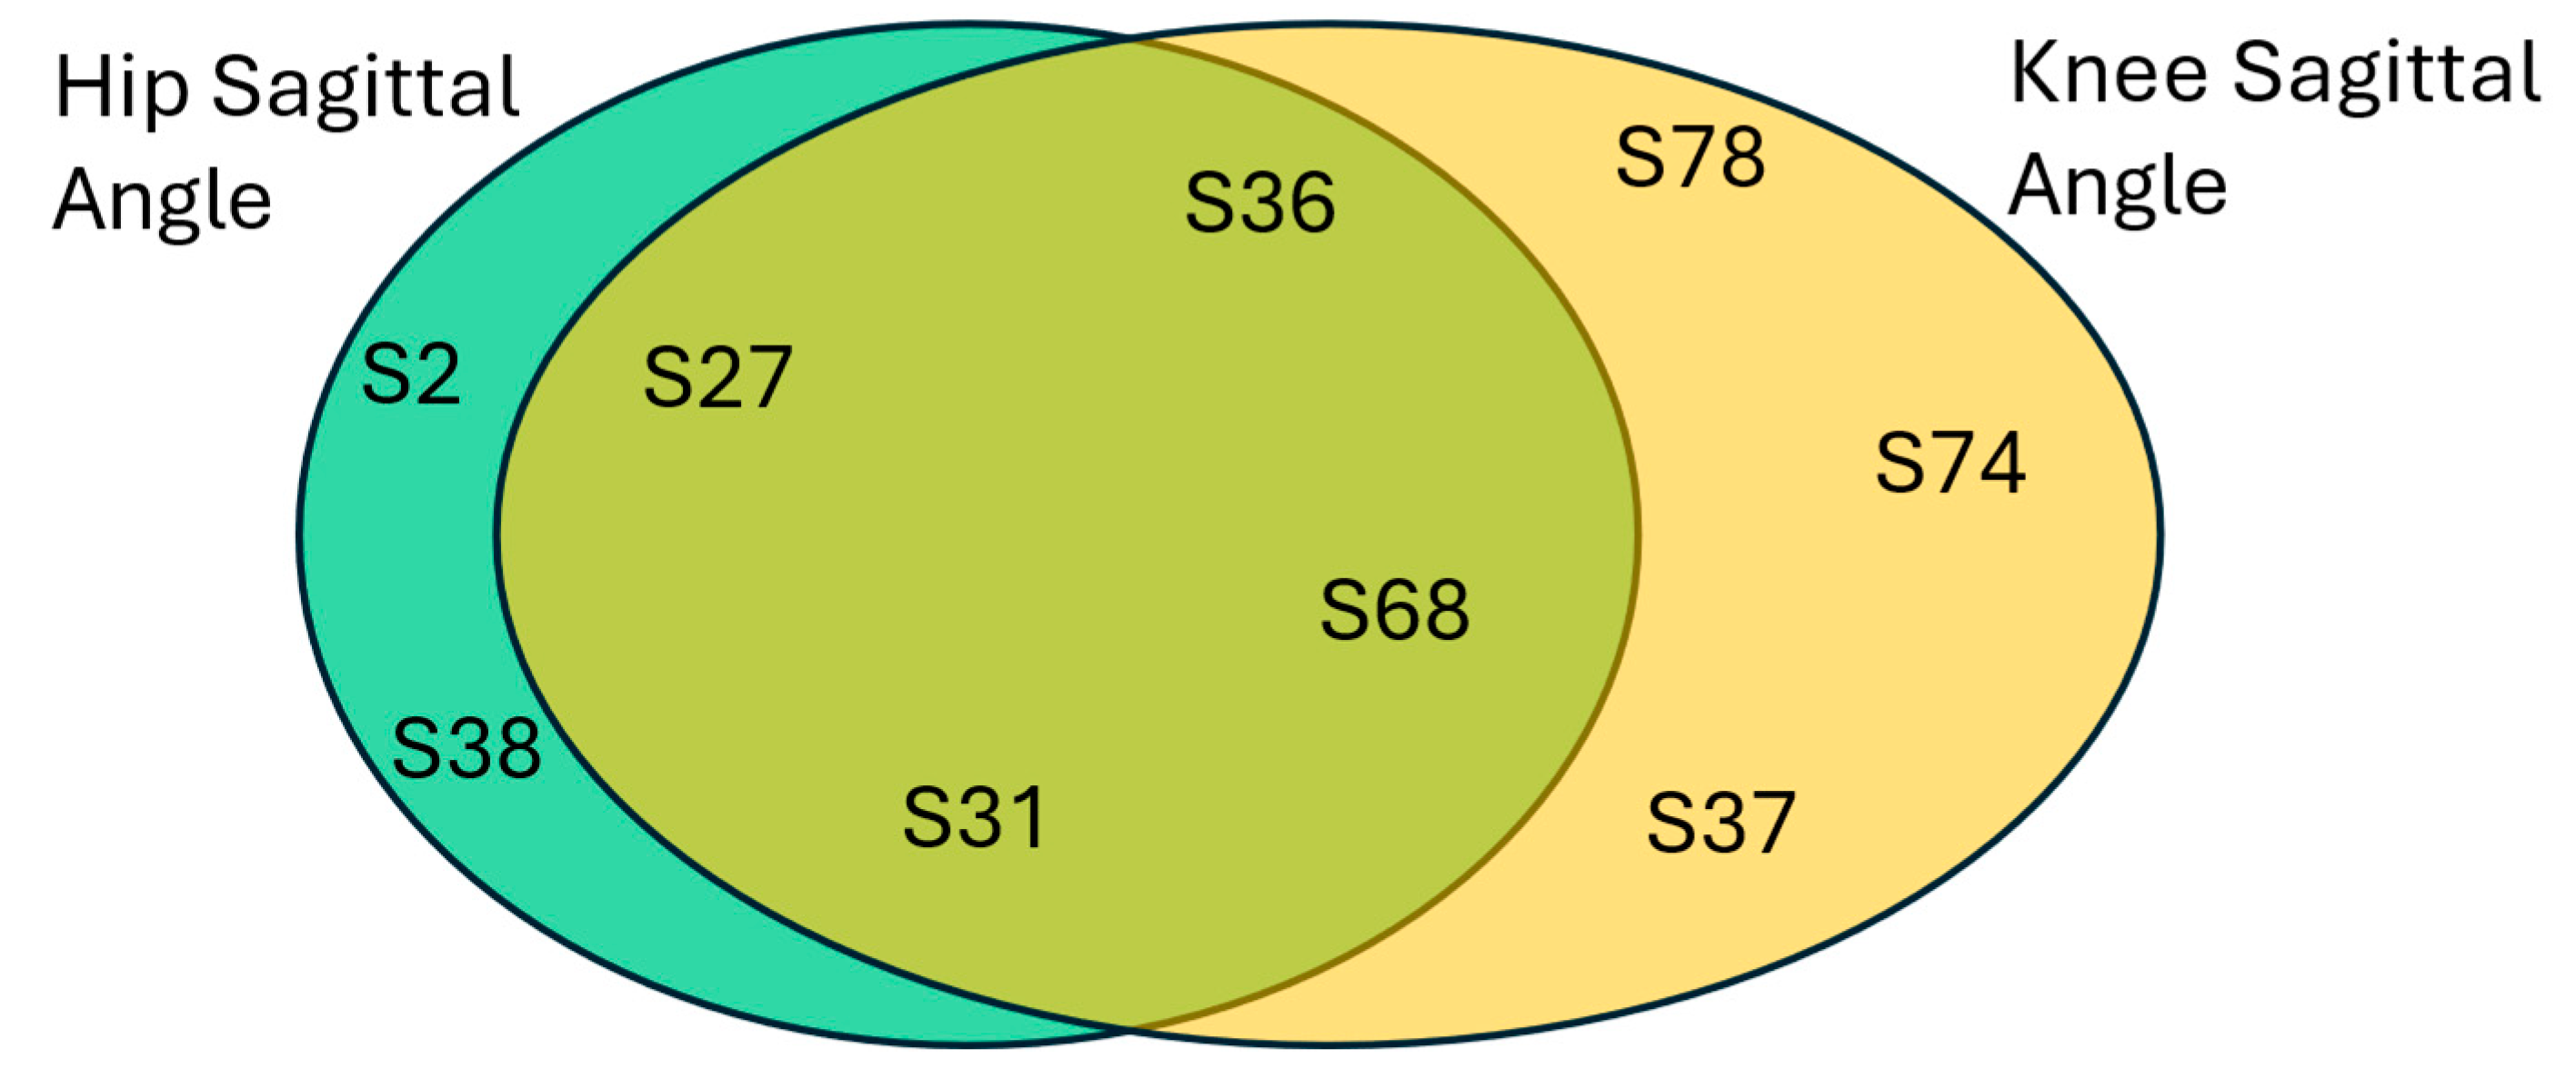

Table 1.
Related Works.
| Reference | Sensor | Gait | Model |
|---|---|---|---|
| Laroche et al. | Vision | healthy, HOA | SVM with Linear Kernel |
| Pantonial et al. | Vision | healthy, HOA | image-base CNN |
| Teufl et al. | IMU | healthy, THA | SVM with Gaussian RBF Kernel |
Table 2.
Dataset demographics summary.
| Demographic information | HOA Patients | Cotrol Subjects |
|---|---|---|
| Gender | 51 male and 55 female | 35 male and 45 female |
| Age | 66.9 ± 9.4 years | 58.7 ± 15.5 years |
| Height | 1.64 ± 0.08 m | 1.66 ± 0.08 m |
| Weight | 77.8 ± 17.1 kg | 69.3 ± 13.4 kg |
Table 3.
Summary of model parameters.
| Layer Type | Parameter | Value |
|---|---|---|
| CNN | Number of Filters | 24 |
| CNN | Padding | Same |
| dropout | Probability | 0.2 |
| Fully Connected Layer (1) | Output size | 256 |
Table 4.
Summary of Hyperparameters.
| Hyperparameter | value |
|---|---|
| Initial Learning Rate | 0.001 |
| Maximum Epoch | 20 |
| Mini-batch size | 20 |
| Validation Frequency | 10 |
| Solver | Stochastic Gradient Descent with Momentum |
Table 5.
Performance Metrics Summary.
| kinematic parameter | Accuracy | Sensitivity | Specificity | G-Mean | |
|---|---|---|---|---|---|
| front ankle | 92.30769 | 93.15068 | 91.80328 | 92.47453 | |
| front knee | 96.335 | 97.18 | 95.833 | 96.506 | |
| front FPA | 95.03 | 94.545 | 95.28 | 94.913 | |
| front hip | 92.8934 | 93.15068 | 92.74194 | 92.94609 | |
| front pelvis | 93.75 | 96 | 92.4812 | 94.22418 | |
| sagittal ankle | 87.95812 | 85.33333 | 89.65517 | 87.46756 | |
| sagittal knee | 96.757 | 100 | 95.161 | 97.55 | |
| sagittal FPA | 75.86207 | 82.97872 | 73.71795 | 78.21139 | |
| sagittal hip | 97.22 | 100 | 95.727 | 97.84 | |
| transverse pelvis | 84.72906 | 83.11688 | 85.71429 | 84.40559 |
Table 6.
Subjects' common THA gaits prediction.
| Hip sagittal angle | Knee sagittal angle | ||||
|---|---|---|---|---|---|
| HEALTHY | HOA | THA | HEALTHY | HOA | THA |
| 1 | 36 | 71 | 1 | 36 | 2 |
| 51 | 2 | 23 | 73 | 78 | 71 |
| 4 | 27 | 42 | 91 | 74 | 23 |
| 24 | 31 | 73 | 51 | 27 | 42 |
| 16 | 38 | 91 | 4 | 31 | 34 |
| 60 | 68 | 78 | 62 | 37 | 82 |
| 74 | 17 | 68 | 72 | ||
| 34 | 16 | 58 | |||
| 82 | 40 | 75 | |||
| 62 | 60 | 48 | |||
| 17 | 56 | ||||
| 58 | 67 | ||||
| 75 | 10 | ||||
| 48 | 24 | ||||
| 56 | 38 | ||||
| 67 | 29 | ||||
| 10 | 6 | ||||
| 40 | |||||
| 37 | |||||
| 29 | |||||
| 6 | |||||
Disclaimer/Publisher’s Note: The statements, opinions and data contained in all publications are solely those of the individual author(s) and contributor(s) and not of MDPI and/or the editor(s). MDPI and/or the editor(s) disclaim responsibility for any injury to people or property resulting from any ideas, methods, instructions or products referred to in the content. |
© 2024 by the authors. Licensee MDPI, Basel, Switzerland. This article is an open access article distributed under the terms and conditions of the Creative Commons Attribution (CC BY) license (http://creativecommons.org/licenses/by/4.0/).
Copyright: This open access article is published under a Creative Commons CC BY 4.0 license, which permit the free download, distribution, and reuse, provided that the author and preprint are cited in any reuse.


