Submitted:
18 December 2024
Posted:
19 December 2024
You are already at the latest version
Abstract
As global climate change intensifies, assessing product carbon footprints has become essential for measuring greenhouse gas emissions throughout a product’s lifecycle, a key factor in achieving sustainable development and emission reduction goals. Traditional lifecycle assessment methods encounter challenges such as subjective product boundary determination and lengthy lifecycle inventory construction. Recent advancements in large language models offer new opportunities for rapid, knowledge-based content generation, yet these models often lack domain-specific training, face data security concerns, and have complex deployment requirements. This study introduces the PCF-RWKV model, which utilizes the RWKV architecture with multiple stacked residual blocks and three task-specialized Low-Rank Adaptations (LoRAs). Trained on a carbon footprint assessment-specific dataset using low-rank adaptive techniques, the model minimizes data interference and memory waste, enabling efficient deployment on consumer-grade single GPUs without relying on cloud storage.By integrating Multi-Agents technology, PCF-RWKV automates the construction of LCI for production processes, aligns production processes with emission factors to calculate carbon footprints, thereby enhancing the efficiency and security of enterprise carbon footprint evaluations and addressing the limitations of traditional methods.
Keywords:
Product Carbon Footprint
; Lifecycle Assessment
; Large Language Model
; RWKV Architecture
; Low-Rank Adaptation
; Multi-Agents
1. Introduction
As global climate change and its adverse impacts become increasingly severe, achieving sustainable development and reducing greenhouse gas emissions have become urgent global tasks. China has proposed the "3060" targets, aiming to peak carbon emissions by 2030 and achieve carbon neutrality by 2060, integrating these goals into the national strategy [1].
In the context of addressing climate change and promoting sustainable development, the Product Carbon Footprint (PCF) serves as a critical quantitative assessment tool [2,3]. It systematically measures greenhouse gas emissions throughout a product’s lifecycle—from raw material acquisition, production, and use to final disposal—providing essential data support for policymakers and enterprise managers to formulate emission reduction strategies.
Life Cycle Assessment (LCA), as a traditional method for evaluating product carbon footprints, plays a significant role in environmental impact assessment but faces numerous challenges during implementation. Firstly, defining the product boundary is a crucial step that relies on expert knowledge and experience [4], which not only increases the uncertainty of the assessment but also introduces subjectivity into the boundary determination. Secondly, constructing a Life Cycle Inventory (LCI) is a time-consuming process [5,6,7], often requiring weeks or even longer to collect and analyze input and output data throughout the product lifecycle, posing a significant disadvantage for enterprises needing to quickly understand carbon emissions to adjust production plans and product designs.
In recent years, the emergence of Large Language Models (LLMs) has opened new possibilities for rapid content generation based on expert knowledge [8]. These models, trained on vast amounts of textual data, can generate coherent and contextually relevant responses and have been widely applied across various fields, demonstrating significant potential in product carbon footprint assessment.
However, current general-purpose models based on the Transformer architecture still encounter several issues [9]. Transformer models deployed on the cloud can leverage cloud computing capabilities to handle complex analytical tasks, but enterprises face risks of confidential data leakage during data upload, making the local deployment of private models an ideal choice. Nevertheless, compared to cloud-based solutions, local hardware configurations are relatively limited. The high memory and computational demands of Transformer models pose challenges in terms of high equipment requirements, low operational efficiency, and poor operational stability, significantly complicating model deployment and dissemination. Additionally, these large models lack domain-specific knowledge and customized training for carbon footprint accounting, rendering them unable to provide comprehensive and accurate responses to related issues in this field.
To address the aforementioned issues, this paper designs and trains a novel dual-carbon large model based on the RWKV architecture—PCF-RWKV. The PCF-RWKV model utilizes low-rank adaptive techniques and is trained on a carbon footprint assessment-specific dataset, comprising 7 billion parameters. It can be efficiently deployed and operated on a consumer-grade single GPU locally, ensuring enterprise data security by eliminating the need for cloud uploads. By integrating Multi-Agent technology, PCF-RWKV can automatically generate models of product production processes, raw material energy use, and waste emissions, constructing a "cradle-to-gate" lifecycle model. It uses semantic-based matching to assign appropriate emission factors for raw materials and energy for each production process, ultimately calculating the carbon footprint. This provides an efficient, secure, and professional solution for enterprise PCF assessment. Specifically, the main contributions of this paper include:
- The PCF-RWKV carbon footprint assessment model was designed based on the RWKV framework. The model incorporates multiple stacked residual blocks within the RWKV architecture and three task-specialized LoRAs, enabling efficient operation on low-power edge devices while ensuring data processing security and model performance stability. Compared to traditional Transformer models, the PCF-RWKV based on the RWKV architecture reduces time complexity from to and space complexity from to , achieving constant memory usage and significantly enhancing the ability to process long sequence data.
- Low-rank adaptive techniques were applied to train the model on a product carbon footprint assessment knowledge dataset. Through refined parameter allocation and multi-head LoRA task-specialized training, the model reduces data interference during training and significantly decreases memory waste caused by redundant base model deployments.
- A multi-agent collaborative framework for carbon footprint assessment was developed based on the AutoGen framework. This framework facilitates dynamic knowledge base updates and automated carbon footprint assessment processing through agent collaboration, significantly enhancing the model’s practicality and adaptability.
- The effectiveness of the proposed method was experimentally verified. The experimental results indicate that, compared to traditional methods, PCF-RWKV offers significant advantages in assessment efficiency and resource consumption. Current shortcomings in accuracy and stability of PCF-RWKV were also analyzed, and directions for future improvements were suggested.
The structure of this paper is as follows: The first section introduces the background of product carbon footprint assessment and the main contributions of this study. The second section reviews the current major methods and related research in the field of PCF assessment. The third section details the architectural design and training methods of the PCF-RWKV model and explains the design and collaboration process of the multi-agent collaborative framework. The fourth section evaluates the model’s performance through experiments. The fifth section provides an in-depth discussion of the experimental results and points out future research directions. Finally, the sixth section concludes the paper.
2. Background and Related Work
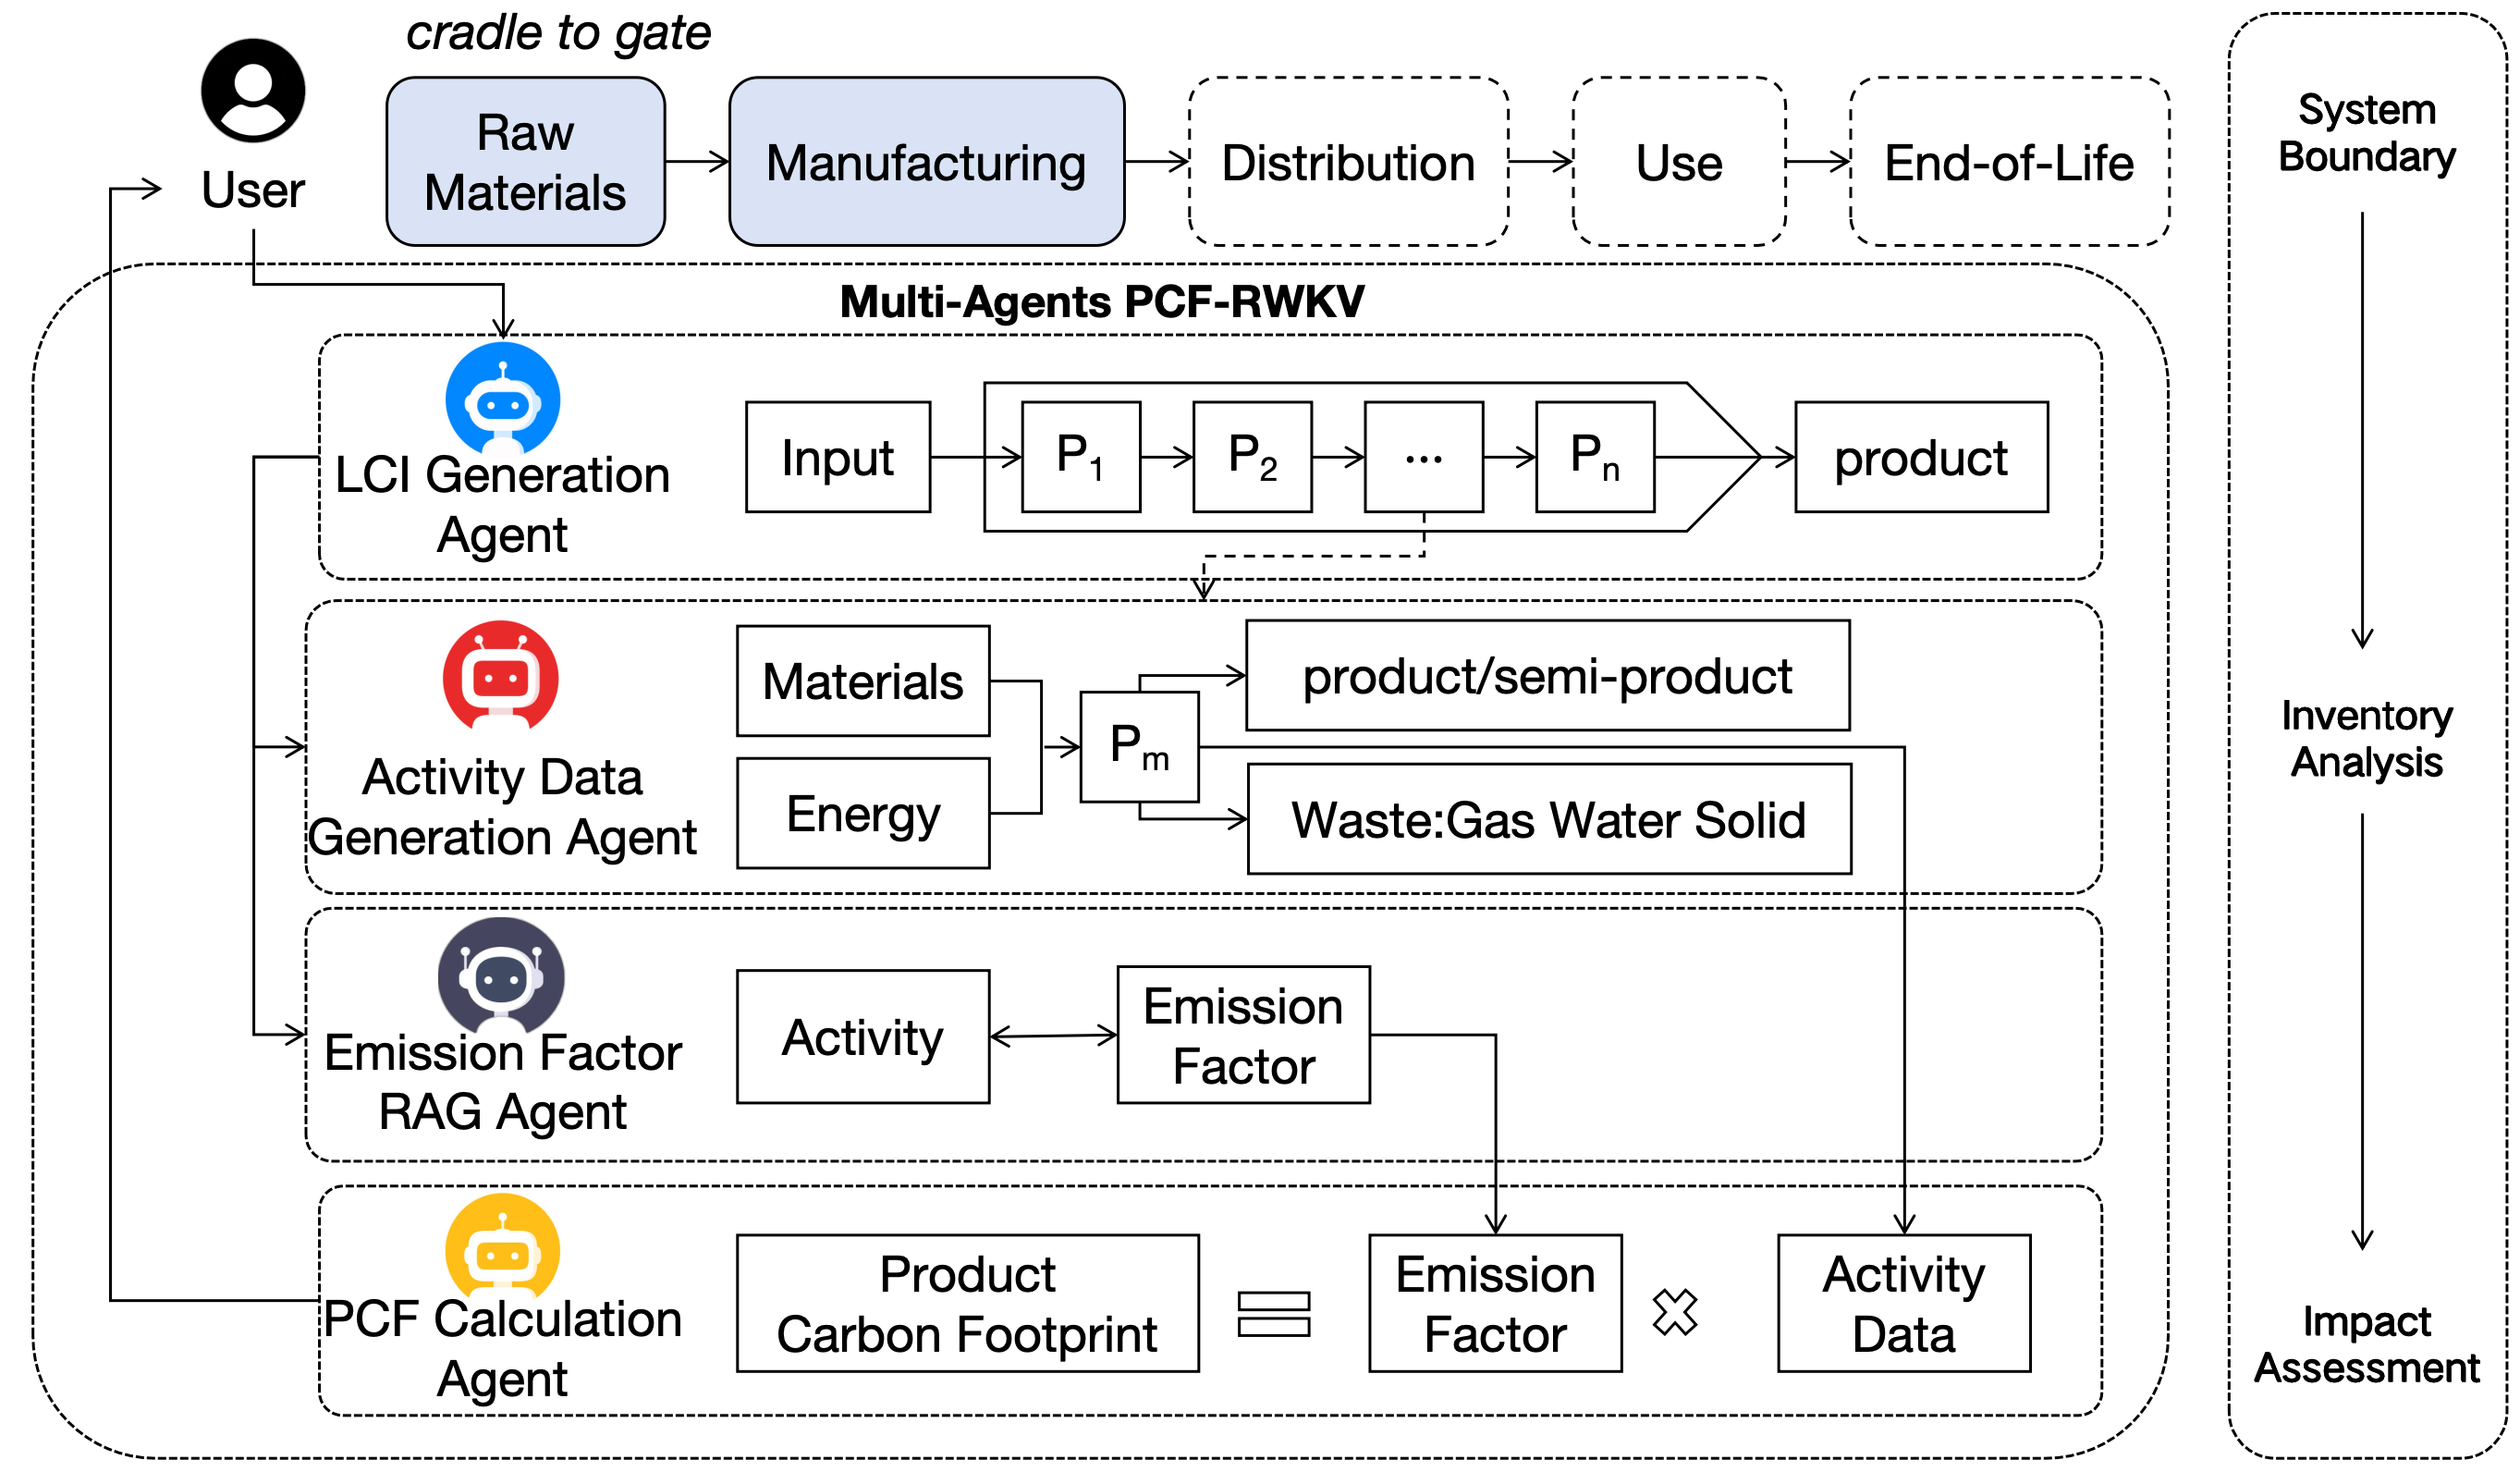
The calculation of Product Carbon Footprint (PCF) typically follows the Life Cycle Assessment (LCA) process, which generally includes five stages: raw material extraction, manufacturing, distribution, use, and end-of-life disposal. This comprehensive calculation is often referred to as "cradle-to-grave." In this study, the PCF calculation scope is limited to "cradle-to-gate," primarily focusing on the production and manufacturing process, as these are the lifecycle stages with the highest concentration of raw material and energy consumption.
Estimating a product’s carbon footprint usually involves three main steps: defining the system boundary, conducting a life cycle inventory analysis, and assessing environmental impacts.
Life Cycle Assessment (LCA) experts determine the system boundary based on the definition of the product carbon footprint and build a Life Cycle Inventory (LCI) using their professional knowledge and experience. Specifically, experts need to analyze each stage of the product lifecycle and identify the inputs and outputs required to construct the product lifecycle model. Subsequently, they assess the environmental impacts of all inputs and outputs throughout the product lifecycle, focusing on greenhouse gas emissions. Inputs typically include raw materials and energy, as well as emissions from the production processes of raw materials, consumables, and auxiliary energy (such as electricity). Outputs generally include waste gases, wastewater, and waste materials, such as greenhouse gas emissions from fossil fuel use. Finally, these emissions are converted into carbon dioxide equivalents (CO2-eq) and summed to calculate the product’s carbon footprint.
This process can be time-consuming, involving the decomposition of each lifecycle stage of the product based on industry production experience or relevant literature to determine the inputs and outputs for each process. The input-output inventory values are then determined based on actual production conditions, and the results are calculated. Despite the existence of some lifecycle modeling tools and databases that can help improve calculation efficiency, completing a product carbon footprint assessment still requires several days or even months.
In today’s world, as global climate change becomes increasingly severe, reducing carbon emissions and achieving sustainable development have become global imperatives. Therefore, developing efficient and accurate carbon footprint assessment tools and techniques is crucial for promoting global emission reduction efforts. In this context, improving the efficiency of product carbon footprint assessments through technological means has become a hot topic among scholars in the field.
González-González et al. (2022) proposed an innovative explainable machine learning solution [10] to automatically estimate industrial carbon footprints by classifying bank transaction records. This study addresses the labor-intensive and costly nature of existing greenhouse gas quantification protocols by shifting to data-driven automated methods. Researchers used natural language processing techniques to estimate CO2 emissions associated with transactions by analyzing bank transaction descriptions. This method achieved evaluation metrics such as accuracy, precision, and recall within the 90% range, and provided decision paths through locally interpretable models, enhancing trust for operators and end users. This work not only improves the automation and accuracy of carbon footprint estimation but also enhances user trust in the results through explainability, providing a powerful tool for quantifying and managing industrial carbon footprints.
Zeng et al. (2023) introduced an innovative online accounting method [11] tailored for carbon emissions from coal mines belonging to coal industry groups. This method, based on a B/S architecture, aims to replace traditional top-down carbon emission accounting processes with a bottom-up approach, enabling online acquisition, calculation, and publication of carbon emission data. This method not only improves the efficiency and accuracy of carbon emission accounting for coal mines under coal industry groups but also supports online sharing and comparison of accounting results, aiding in more precise carbon emission monitoring and improvement measures for these groups.
Deng et al. (2023) presented an innovative framework called AutoPCF [12], which utilizes large language models (LLMs) to automate the accounting of product carbon footprints (PCF). The authors tested and compared five LLMs in their ability to simulate the product lifecycle from cradle-to-gate and generate input-output inventory data. By estimating the carbon footprint of three case products, results showed that the AutoPCF framework could significantly reduce modeling time from days to minutes, achieving automatic modeling and estimation of PCFs.
Wang and Luo (2023) proposed a carbon emission accounting and monitoring system based on artificial intelligence algorithms [13]. This system aims to optimize carbon emission accounting methods through algorithm analysis and experimental design and includes a performance analysis monitoring system. The study primarily applied three different combined models to enhance the accounting methods, demonstrating significant performance of the particle swarm optimization algorithm in terms of stability and accuracy, reaching 90% and 89%, respectively. By enabling real-time monitoring and prediction of carbon emissions at the enterprise, industry, and regional levels, this system assists in formulating more effective carbon reduction strategies. Additionally, the study provides fundamental insights into carbon emission accounting and evaluation quantification methods, describing and designing a carbon emission monitoring system that includes data collection, processing, analysis, and visualization functions, supporting the development of a low-carbon economy and sustainable development.
Huang and Mao (2024) proposed an innovative data-driven approach [14], utilizing artificial intelligence (AI) algorithms to manage carbon footprints in global supply chains. They emphasized the importance of understanding and reducing carbon emissions at various stages of the supply chain in sustainable practices and constructed a comprehensive framework centered on AI to analyze, optimize, and monitor carbon footprints within the supply chain. This framework employs machine learning and optimization techniques to process and analyze large datasets related to carbon emissions, identify critical areas for emission reduction, and develop strategies to minimize environmental impact while maintaining operational efficiency.
The contributions of González-González et al. [10] and Zeng et al. [11] lie in their innovative approaches to automating and streamlining the carbon footprint assessment process. González-González et al.’s work stands out for its use of explainable machine learning, which not only improves the efficiency of carbon footprint estimation but also enhances trust in the results through transparency. Zeng et al.’s online accounting method represents a significant shift from traditional carbon emission accounting processes, offering a more dynamic and interactive approach to carbon emission management in the coal industry.
Deng et al.’s AutoPCF framework [12] and Wang and Luo’s carbon emission accounting and monitoring system [13] both demonstrate the potential of AI in reducing the time and complexity associated with carbon footprint assessments. Deng et al.’s comparison of LLMs for PCF accounting highlights the speed and efficiency gains possible with advanced language models, while Wang and Luo’s system emphasizes the importance of real-time monitoring and prediction in carbon emission management.
Huang and Mao’s data-driven approach [14] further extends the application of AI to global supply chains, underscoring the need for a comprehensive understanding of carbon emissions across different stages of production and distribution. Their framework’s use of machine learning and optimization techniques to analyze large datasets is a testament to the growing role of AI in managing environmental impact.
Building on these studies, this paper designs and trains the novel dual-carbon large model PCF-RWKV based on the RWKV architecture. The PCF-RWKV model, trained with low-rank adaptive techniques on a dual-carbon dataset, comprises 7 billion parameters and can be efficiently deployed on consumer-grade single GPU locally, ensuring enterprise data security. By integrating Multi-Agent technology, PCF-RWKV automatically generates models for product production processes, raw material energy use, and waste emissions, constructs lifecycle models, and ultimately calculates the carbon footprint, enhancing the accuracy and stability of product carbon footprint evaluations using large language models.
This paper’s work represents a significant advancement in the field by combining the strengths of previous studies. Like González-González et al., we prioritize explainability and trust in our model’s outputs. We adopt the efficiency and speed improvements showcased by Deng et al. and Wang and Luo, and we echo Huang and Mao’s comprehensive approach to managing carbon footprints across supply chains. Our PCF-RWKV model not only streamlines the process of carbon footprint assessment but also ensures data security and enhances the scalability of carbon footprint evaluations, making it a robust tool for enterprises in their pursuit of sustainable development and carbon reduction strategies.
3. Materials and Methods
3.1. Architecture of the PCF-RWKV Model
To prevent the model from crashing due to excessive memory usage during the deployment of large Transformer models on edge devices, the PCF-RWKV model adopts the RWKV architecture as its foundational structure. As illustrated in Figure 1, the PCF-RWKV model consists of multiple stacked residual blocks within the RWKV architecture and three task-specialized LoRA (Low-Rank Adaptation) heads. Each residual block comprises a time-mixing sub-block and a channel-mixing sub-block, which are embedded with recurrent structures to leverage historical information. This model architecture combines the advantages of RNNs and Transformers while avoiding their respective major drawbacks. The three task-specialized LoRA heads [15] are designed to handle the LCI generation task, multi-agent task orchestration, and product carbon footprint calculation task, respectively. This specialized approach reduces data interference during training and significantly minimizes memory waste caused by redundant base model deployments during model deployment.
The model employs a unique attention-like mechanism, incorporating a time-dependent softmax operation to enhance numerical stability and mitigate the vanishing gradient problem. This ensures that gradients propagate along the most relevant paths. Additionally, the built-in layer normalization within the model structure aids in stabilizing gradients, effectively addressing both vanishing and exploding gradient issues. These design elements not only accelerate the training speed of deep neural networks but also facilitate multi-layer stacking, allowing the model to capture complex relationships at different levels of abstraction, thereby surpassing the performance of traditional RNN models.
The RWKV model introduces a linear attention mechanism, replacing the dot-product-based attention computation in traditional Transformer models. This design not only improves data processing efficiency but also enhances the model’s ability to capture key information by focusing on the channel features of the data, maintaining low computational complexity without sacrificing model performance.Compared to traditional Transformer models, the PCF-RWKV based on the RWKV architecture reduces time complexity from to and space complexity from to [16].
In handling sequential data, RWKV incorporates a time-mixing block to achieve global interaction, akin to the self-attention mechanism in Transformer models. The core parameters of the time-mixing block include R, W, K, and V, which are used in a novel weighting and mixing approach to capture long-range dependencies in sequential data. The functions of these four core parameters are as follows:
- R (Receptance): This parameter facilitates memory of past information and implements a forgetting mechanism through the Sigmoid activation function. R helps the model decide which past information to retain or forget at the current timestep.
- W (Weight): This parameter assigns weights to different positions in the sequence based on their relative positions. W is a trainable parameter within the model.
- K (Key) and V (Value): In the RWKV model, K and V are analogous to the K and V in the attention mechanism, representing the key and value information at different positions in the sequence.
These four core elements interact multiplicatively at each timestep, as illustrated in Figure 2.
Unlike traditional Transformer models that directly use the current token’s embedding as input, the RWKV model employs a weighted combination of the current token and the previous token’s embeddings as input. This computation method dynamically integrates information from consecutive tokens in the sequence by assigning different weights to token embeddings at different timesteps, providing the model with richer contextual information and enhancing its ability to capture sequence dependencies. In RWKV, while the computation methods for R, K, and V differ from the traditional attention mechanism, their basic functions remain similar—capturing the relationships between tokens at different positions in the sequence. In this architecture, all vectors involved in linear projections (R, K, V in time mixing and R’, K’ in channel mixing) are generated through linear interpolation between the inputs at the current and previous timesteps. The computation is as follows:
The RWKV model’s implementation of the attention mechanism significantly differs from traditional Transformer methods by abandoning the reliance on absolute position biases and instead adopting a relative position encoding mechanism. This change eliminates the need to learn an independent bias parameter for each position in the sequence during model training. Instead, RWKV uses a shared parameter vector for position encoding, significantly reducing model complexity and improving parameter learning efficiency. The WKV operator’s calculation is similar to the method used in the Attention-Free Transformer (AFT) [17]. However, unlike in AFT where W is a pairwise matrix, our model treats W as a channel-level vector modified by relative positions. This recursive behavior is defined by the time-dependent update of the WKV vector, formalized as follows:
The attention mechanism in the RWKV model can be expressed in a recursive form, as illustrated in Figure 3. This not only allows the model to inherit the linear time complexity of Linear Transformers but also retains the simplicity of AFT. This recursive expression enhances the model’s computational efficiency while ensuring it maintains strong expressive power when handling complex sequence data. Through this method, the RWKV model improves its sensitivity and ability to capture key information in sequence data while maintaining computational efficiency.
The RWKV architecture integrates the strengths of both Transformers and RNNs, overcoming the limitations inherent in each. Unlike traditional RNNs, the RWKV architecture not only retains the performance benefits of Transformer models but also achieves more stable gradient propagation. Compared to the traditional Transformer models, the RWKV architecture reduces time complexity from to and space complexity from to , achieving constant memory usage [16]. These optimizations make the PCF-RWKV model more performant in handling long-sequence problems like data analysis.
3.2. Construction and Data Augmentation of the PCF-RWKV Training Dataset
Despite large language models achieving excellent results in various benchmarks, they lack the in-depth knowledge and data support specific to carbon footprint assessment, preventing their direct application in this field. Therefore, customizing model training with domain-specific data is crucial to enhance performance and accuracy in carbon footprint evaluation.
The dataset for model training is formatted in JSON, comprising question inputs and answer outputs, as shown in Figure 4.
Currently, high-quality PCF datasets for carbon footprint evaluation are relatively scarce. Synthetic data [18,19] is a common method for dataset construction when data is insufficient. Large language models can generate consistent training data results based on their text comprehension capabilities across various file types. To address this issue, a strategy combining large language model capabilities with human-in-the-loop feedback supervision was employed for data synthesis and augmentation.
The process of training data synthesis and enhancement through large models and human feedback is clearly illustrated in Figure 5. Initially, publicly accessible academic literature, industry standards, production data, and carbon footprint evaluation cases in the dual-carbon field were extensively collected to form the initial seed datasets. These seed datasets were input into large language models, and through carefully crafted prompts, JSON datasets meeting the required training format and content were generated. Throughout this process, manual sampling inspections were conducted to ensure the quality and compliance of the generated data. Based on the inspection results, seed data and prompts were iteratively optimized to improve the quality and coverage of data synthesis.
In this process, the C-STAR assessment mechanism was implemented to focus on multi-dimensional data quality evaluation. C-STAR is a comprehensive evaluation framework designed to ensure the integrity and utility of the synthesized data. It includes the following dimensions:
- Coverage Assessment: Ensuring that the dataset encompasses all necessary knowledge areas and application scenarios.
- Standardization Assessment:Verifying the consistency and uniformity of data format and content.
- Timeliness Assessment:Checking the update frequency and real-time nature of the data to ensure its current relevance.
- Accuracy Assessment:Ensuring the correctness and reliability of the data, minimizing errors and misleading information.
- Redundancy Assessment:Identifying and eliminating duplicate data to enhance the efficiency and compactness of the dataset.
Through a human feedback loop, data synthesis prompts and seed files are continuously optimized, improving the dataset’s quality. This strategy successfully constructed a PCF dataset rich in model Q&A training data, providing abundant resources for model training.
3.3. Low-Rank Adaptation Training of the PCF-RWKV Model
Various techniques exist for training large language models. This study employs the Low-Rank Adaptation (LoRA) algorithm to train the large model in the dual-carbon domain. The core of the LoRA algorithm lies in optimizing the pre-trained model weights [20]. By freezing the weights of the pre-trained model and introducing trainable low-rank matrices to adjust model parameters, LoRA significantly reduces the number of trainable parameters required for downstream tasks. Specifically, this method decomposes the original weight matrix into the product of two lower-rank matrices, where one matrix’s rank is much lower than the other, using only the low-rank matrices for computation. This strategy not only reduces the number of model parameters that need to be trained, improving training efficiency, but also maintains model performance while avoiding increased inference latency.
As shown in Figure 6, The rank decomposition matrix is a critical component in the LoRA framework, consisting of two linear projections designed to reduce and subsequently restore the dimensionality of the input. This mechanism involves adding the output from these projections to the output derived from the model’s pre-trained weights. The resulting updated layer, formed by integrating these parallel transformations, effectively captures and learns the necessary updates to the underlying layer’s weights. This approach enables efficient adaptation of the model while maintaining computational efficiency.
The matrix product matches the dimensionality of a full fine-tuning update, yet by decomposing the update into two smaller matrices, LoRA ensures a low-rank structure that significantly reduces the number of parameters requiring optimization. Rather than fine-tuning all parameters in the pre-trained model layers, LoRA focuses exclusively on optimizing the rank decomposition matrix. This approach approximates the effects of full fine-tuning. Matrix A is initialized with small random values, while B is initialized to zero, preserving the integrity of the model’s original pre-trained weights at the onset of fine-tuning.
Empirical evidence suggests that setting the LoRA rank r to the rank of the pre-trained weight matrices can approximate the expressiveness of full fine-tuning. Increasing r enhances the approximation accuracy of the full fine-tuning update. However, in practice, remarkably low values of r suffice, enabling substantial reductions in computational and memory demands with minimal performance degradation. For instance, LoRA can fine-tune models like GPT-3 using merely 0.01% of the total parameters while maintaining performance levels comparable to full fine-tuning.
The scaling factor plays a crucial role in integrating the low-rank update into the model’s pre-trained weights. After deriving the low-rank update, it is scaled by before being added to the pre-trained weights, as specified by the adaptation rule. The default setting for is one, ensuring equal weighting between the pre-trained weights and the low-rank update during the forward pass. However, can be adjusted to balance the influence of the pre-trained model and the task-specific adaptation. Recent empirical studies suggest that larger values of are beneficial for models with a higher rank r, as they enhance the adaptation capability of LoRA.
The training environment was deployed on a cloud server equipped with an NVIDIA A100 GPU with 40GB of VRAM. Training parameters utilized the BFloat16 (bf16) data type, balancing computational precision with model performance and memory usage efficiency. The context length was set to 512 to ensure the model could adequately capture sequence information. Given the dataset size, 100 iterative steps per epoch were scheduled, starting from epoch 0 and planned up to epoch 500, with model states saved every 5 epochs for subsequent evaluation and analysis. The Adam optimizer was used, configured with hyperparameters: Epsilon set to , Beta 1 at 0.9, and Beta 2 at 0.999, ensuring stability and efficiency in the optimization process. To alleviate initial training instability, a learning rate warm-up strategy was implemented, gradually increasing the learning rate over the first 1000 iterations. The initial learning rate was set at 0.001, gradually decreasing to for finer parameter adjustments.
Based on the meticulously synthesized dual-carbon dataset, the RWKV architecture’s dual-carbon base model was successfully trained, featuring 7 billion parameters capable of smooth operation on consumer-grade single-GPU setups, demonstrating good overall performance on the test set, with detailed test results to be presented in Section 4 of the paper.
3.4. PCF-RWKV Multi-Agent Architecture Design
While the PCF-RWKV base model provides analytical understanding of carbon accounting-related information, integrating the PCF-RWKV large model into the product carbon footprint evaluation workflow necessitates combining it with multi-agent technology [21].
The PCF-RWKV employs the Autogen framework [22] to construct a collaborative agent network, breaking down various aspects of product carbon footprint accounting and assigning tasks to different agents. Through cooperation among agents, efficient product carbon footprint assessment support is achieved, as depicted in Figure 7.
The system comprises the following key agents:
- LCI Generation Agent:The LCI Generation Agent is responsible for creating the Life Cycle Inventory (LCI). This agent utilizes specialized knowledge extracted from the PCF training dataset to transform abstract knowledge into a life cycle inventory specific to the user’s input product. It analyzes the material and energy flows across all stages of the product’s lifecycle, constructing a detailed and accurate LCI to provide a data model for carbon footprint quantification.
- Activity Data Generation Agent:The Activity Data Generation Agent bases its operations on the LCI to generate activity data related to the product lifecycle. This data includes information on material and energy consumption, as well as waste generated during production. By analyzing the activities of the product or semi-product at different stages, the agent produces detailed data for each activity, laying the groundwork for subsequent carbon footprint calculations.
- Emission Factor RAG Agent:The Emission Factor RAG Agent employs search-enhanced generation techniques to dynamically retrieve and generate applicable emission factors, drawing from an LCA document corpus and the latest research. It does not rely on a fixed database but instead dynamically generates optimized emission factors to ensure the accuracy of carbon footprint calculations.
- PCF Calculation Agent:The PCF Calculation Agent combines activity data and emission factors to calculate the product’s carbon footprint. Using the formula "Product Carbon Footprint = Emission Factor × Activity Data," this agent performs calculations and utilizes large language models (LLMs) to generate carbon footprint calculation programs tailored to the task’s characteristics. It precisely quantifies carbon emissions at each stage of the product lifecycle, delivering reliable carbon footprint calculation results.
In the LCA product carbon footprint analysis system, the agents collaborate meticulously to achieve efficient and precise carbon footprint evaluations. Initially, the task orchestration agent receives user input, utilizing natural language processing techniques to refine task requirements. It then instructs the LCA knowledge base agent to retrieve relevant literature and research findings, providing theoretical support for subsequent steps. The LCI generation agent, using user information and expert knowledge, analyzes the material and energy flows throughout the product lifecycle to construct a comprehensive life cycle inventory (LCI). Based on this, the activity data generation agent further analyzes each stage’s activities, producing detailed data on material and energy consumption. The emission factor RAG agent, employing search-enhanced generation techniques, dynamically retrieves and generates applicable emission factors to ensure data accuracy. Finally, the PCF calculation agent combines activity data and emission factors, utilizing large language models to generate carbon footprint calculation programs. It precisely quantifies carbon emissions and feeds the results back to the task orchestration agent. This entire process, driven by the automated collaboration of agents, enhances evaluation efficiency and accuracy, providing a scientific basis for sustainable production and consumption.
4. Results
Evaluating a model requires a comprehensive consideration of multiple aspects of its capabilities. The core objective is to test and compare the model’s accuracy and execution efficiency within the context of product carbon footprint assessment. Accuracy and execution efficiency each contribute 50 points, for a total score of 100 points, which is used to measure the model’s suitability for the product carbon footprint evaluation scenario.
Regarding model accuracy, the evaluation is conducted through test questions by comparing the model’s scores. The evaluation questions cover the entire lifecycle of a product, from manufacturing to final disposal and recycling, ensuring the comprehensiveness of the assessment results. Due to the scarcity of carbon footprint-related test data, a large model-based generation method similar to the training dataset was employed to construct the test dataset. This method generated and screened 100 test questions centered around product carbon footprint evaluation as a benchmark. The questions are all true/false, comprising 50 correct and 50 incorrect statements. The original data sources for this test set include product carbon footprint evaluation cases from different industries and production processes, as well as common knowledge related to carbon footprints. These sources provide a basis for assessing the model’s capabilities in the context of product carbon footprint evaluation.
For this evaluation, three metrics were selected to measure the model’s prediction accuracy: precision, recall, and F1 score. Ultimately, the model’s score in the accuracy test phase is determined by multiplying the F1 score by 50. These metrics are calculated based on the confusion matrix, which records the relationship between the model’s predicted results and the actual results. In the confusion matrix [23], true positives (TP) refer to the number of samples correctly predicted as positive by the model; true negatives (TN) refer to the number of samples correctly predicted as negative; false positives (FP) refer to the number of samples incorrectly predicted as positive; and false negatives (FN) refer to the number of samples incorrectly predicted as negative. The specific calculation methods are as follows:
Accuracy: This metric reflects the proportion of correct predictions made by the model across all prediction cases. It is calculated by dividing the sum of true positives (cases correctly predicted as positive by the model) and true negatives (cases correctly predicted as negative by the model) by the total number of cases. A high accuracy indicates that the model is highly reliable in its predictions. The formula is as follows:
Recall: This metric is calculated by dividing the number of true positives by the sum of true positives and false negatives (cases that actually occurred but were not predicted by the model). The formula is:
F1 Score: The F1 score is the harmonic mean of precision and recall, balancing the two to provide a comprehensive performance metric. It offers a more balanced measure of performance, particularly when there is a significant discrepancy between precision and recall, thus avoiding the limitations of a single metric. The formula is:
Where precision is calculated as:
In terms of model execution efficiency, this evaluation focuses on two core performance metrics: processing time and resource consumption. Processing time, defined as the average time required for the model to process a single sample or a batch of samples, is a key indicator of the model’s response speed. Resource consumption involves the model’s demand for computational resources during operation, including CPU and GPU utilization as well as memory usage. A model with lower resource consumption is easier to deploy across a variety of computing environments, ranging from high-end servers to low-end consumer-grade devices, significantly enhancing the model’s applicability and accessibility.
The scoring for processing time and resource consumption employs fuzzy mathematics. Within predefined ranges, resource consumption is categorized into five levels: very low, low, medium, high, and very high, corresponding to scores of 5, 10, 15, 20, and 25 points, respectively. Similarly, processing time is categorized into very short, short, medium, long, and very long, also corresponding to scores of 5, 10, 15, 20, and 25 points, respectively.
In this evaluation, the performance of the following models was compared: baseline RWKV-7B, baseline PCF-RWKV-7B, open-source Qwen1.5-7b-chat, RWKV with agents, PCF-RWKV with agents, GPT-4, and GLM6B [24]. The specific evaluation results are presented in Table 1. During the assessment process, scores for various metrics on the test set were recorded. This recording was done using a combination of automated scripts and manual blind reviews. Scripts were used to log the models’ processing time and resource consumption during runtime, with multiple runs conducted to obtain average values. This approach ensures the fairness and objectivity of the scoring process.
Based on the evaluation results presented in the Table 1 and Figure 8, we conducted a detailed analysis of the performance of all models and found that their overall scores were generally low, indicating significant room for improvement. The RWKV-7B base model achieved an accuracy of 0.52, but its recall and F1 score were only 0.12, demonstrating a clear deficiency in identifying positive samples. In comparison, the PCF-RWKV base model showed improvements in recall and F1 score, reaching 0.34 and 0.35, respectively, though its accuracy slightly decreased to 0.48, suggesting that further optimization is needed for negative sample recognition. Additionally, the qwen1.5-14B base model achieved the highest accuracy of 0.56 but had relatively low recall and F1 scores of 0.18 and 0.17, respectively. This result indicates that the model may be biased towards predicting negative samples, achieving high accuracy at the expense of limited capability in identifying positive samples. The GLM-6B base model performed the worst, with an accuracy of 0.49 and recall and F1 scores both at 0.08, highlighting its severe limitations in recognizing positive samples. By contrast, the GPT-4 base model exhibited the most balanced performance, achieving an accuracy of 0.51 and exceptionally high recall and F1 scores of 0.86 and 0.85, respectively. However, its resource demands were substantial, with long processing times and very high memory usage, which may limit its applicability in resource-constrained environments.
When incorporating agents, all models demonstrated significant performance improvements. The RWKV-7B agent model achieved an accuracy of 0.51, with recall and F1 scores improving to 0.28 and 0.28, respectively, resulting in a total score of 48.86. This highlights the positive impact of the agent in enhancing the model’s ability to identify positive samples. However, the magnitude of improvement remains limited, indicating potential areas for further optimization. The PCF-RWKV agent model exhibited even greater improvements, with recall and F1 scores increasing to 0.52 and 0.53, respectively, and achieving the highest total score of 61.53 among all models. These results confirm that the agent significantly enhances model performance, particularly in recognizing positive samples. Nonetheless, the model’s accuracy, at 0.48, remains relatively low, indicating that further efforts are needed to achieve a better balance between precision and recall.
Although the incorporation of agents may increase computational resource demands, the RWKV-7B and PCF-RWKV models were able to operate smoothly on single consumer-grade GPUs, demonstrating a favorable trade-off between efficiency and performance. In contrast, the qwen1.5-14B and GLM-6B base models exhibited relatively low efficiency due to their long or very long processing times. While GPT-4 displayed exceptional performance, its extremely high memory usage limits its suitability for resource-constrained environments.
Overall, all models exhibited substantial room for improvement, particularly in balancing accuracy, recall, and F1 scores. The RWKV-7B and PCF-RWKV models demonstrated significant performance enhancements with the integration of agents, with the PCF-RWKV agent model achieving the best recall and F1 scores. However, the relatively low overall scores of the base models highlight the necessity of optimizing training strategies and expanding datasets. Future research should focus on improving dataset quality, optimizing model architectures, and enhancing execution efficiency to further improve the overall performance and practical applicability of these models.
5. Discussion
Accurately and efficiently estimating the carbon footprint of products is essential for reducing carbon emissions and mitigating climate change. Such efforts are integral to global strategies addressing environmental degradation and global warming. Leveraging large language models (LLMs) for this task offers significant potential due to their advanced capabilities in processing complex data and generating reliable predictions. Deng et al. (2023) proposed an innovative framework, AutoPCF [12], which automates the accounting of product carbon footprints (PCF) using LLMs. This framework was tested across five LLMs to simulate the product lifecycle from cradle-to-gate and generate input-output inventory data. By analyzing the carbon footprints of three case products, the study demonstrated that AutoPCF significantly reduces modeling time from days to minutes, enabling rapid and automated PCF estimation.
To compare with Deng’s AutoPCF [12], I conducted the same tests on PCF-RWKV, focusing on its lifecycle inventory (LCI) analysis capabilities and the accuracy of product carbon footprint estimation.
To evaluate the performance of inventory analysis based on large language models (LLMs) compared to expert processes, we adopted the ROUGE method and defined three metrics: precision, recall, and F1-score. Precision is defined as the proportion of correctly retrieved instances among all retrieved instances (where an "instance" refers to an item in the inventory, such as coke, pig iron, oxygen, etc.). Recall is the ratio of correctly retrieved instances to the total number of correct instances. The F1-score, as the harmonic mean of precision and recall, measures the overall performance of the model.
For comparison with the previous work AutoPCF, we selected the same three products as our main test cases: hot-rolled round steel, textile dyeing and printing, and lithium iron phosphate battery production processes and activity inventory generation. By reviewing other literature on the carbon footprint estimation of these three products (hot-rolled round steel [25], dyed fabrics [26,27], lithium iron phosphate battery [28,29,30,31,32,33]), and based on expert models, we determined the estimated median and uncertainty range to evaluate the error and uncertainty of AutoPCF results.
In this study, we compared the performance of three models—PCF-RWKV, GPT-4, and GLM-6B—in production process modeling and activity inventory generation (with GPT-4 and GLM-6B experimental data sourced from the AutoPCF paper [12]). The results are shown in Figure 9. Here are the detailed comparison results:
In the production process modeling task, PCF-RWKV achieved an average F1-score of 0.60, higher than GPT-4’s 0.53 and GLM-6B’s 0.37, indicating a better balance between accuracy and recall. Specifically, the PCF-RWKV model achieved a precision of 58%, surpassing GPT-4’s 56%, with a recall of 75%, slightly above GPT-4’s 72%. This suggests that the PCF-RWKV model is more precise in generating product production processes. In contrast, GLM-6B’s precision and recall were 49% and 30%, respectively, significantly lower than the other two models, indicating suboptimal performance in the production process modeling task.
In the activity inventory generation task, the PCF-RWKV model achieved a precision of over 61%, a recall of over 35%, and an F1-score of over 0.41, particularly in dyeing and printing inventory modeling, where the F1-score reached 0.55, slightly higher than GPT-4’s 0.50. This result further confirms the superior performance of the PCF-RWKV model in activity inventory generation tasks. In contrast, GLM-6B performed relatively poorly across all three metrics, especially in the hot-rolled round steel activity inventory modeling, with an F1-score of only 0.1, far below both GPT-4 and PCF-RWKV models.
The PCF-RWKV model, due to its RNN structure advantage, demonstrates higher resource utilization efficiency and faster processing speed when handling long-sequence data. This characteristic is particularly important on large-scale datasets as it can significantly reduce model training and inference time. While GPT-4 has shown improvements in performance, it may not match the PCF-RWKV model in resource utilization and processing speed. GLM-6B performs better than GPT-4 in resource utilization and processing speed but still falls short of PCF-RWKV.
In product carbon footprint (PCF) accounting, the initial step is to decompose the product lifecycle’s production processes to obtain each process’s inputs, energy usage, and outputs. The greenhouse gas (GHG) emissions for each process can be calculated using the following formula:
Where represents the GHG emissions of process s; and are the activity data and the corresponding GHG emission factor of activity f, such as raw material inputs or energy consumption [34].
The climate change framework assessment covers the seven greenhouse gases addressed by the UNFCCC/Kyoto Protocol, including carbon dioxide (), methane (), nitrous oxide (), hydrofluorocarbons (HFCs), perfluorocarbons (PFCs), sulfur hexafluoride (), and nitrogen trifluoride (). For standardized measurement, PCF is expressed in carbon dioxide equivalents () based on their global warming potentials (GWPs).
The estimation effectiveness of the AutoPCF model is measured against the expert-based results by error (Equation 6) and adjusted coefficient of variation (adjusted CV, Equation 7):
Where is the sample standard deviation, is the sample mean, is the i-th observation, is the sample mean, n is the number of samples, is the first quartile, is the third quartile, and .
Using the production processes and activity inventories generated by the three models, model-generated activity data (inputs and outputs for each process) were used to estimate the carbon footprints of the three products. Each model’s estimation process was repeated 20 times to evaluate the stability of the predictions, and their medians and ranges were compared with expert-based model results. The experimental results are shown in Figure 10, with GPT4 and GLM6B test data referenced from the paper AutoPCF [12].
The experimental results show that the GLM-6B model’s average error is 57%, which is relatively low among the three models. The GPT-4 model’s average error is 117%; this higher error might relate to GPT-4’s generalization capabilities in specific tasks. Although GPT-4 is a powerful language model, its performance on the specific task of product carbon footprint estimation may not meet expectations due to the quality of training data and model generalization limitations. The GLM-6B model shows better stability, but the carbon footprint data it generates is biased low, also differing from expert predictions. The PCF-RWKV model’s average error is 73%, slightly higher than the GLM-6B model.
Although the PCF-RWKV model’s average error is slightly higher than the GLM-6B model, its efficiency and stability in handling long-sequence data, along with its linearly growing computational and memory demands, theoretically give it potential advantages over the GLM-6B and GPT4 models. These characteristics of the RWKV model make it better suited to adapt and scale in practical applications, especially under resource constraints, which is a critical consideration for scalability and cost-effectiveness in real-world applications. Therefore, we can reasonably expect the PCF-RWKV model to perform slightly better than the aforementioned two models in practical applications, particularly when dealing with large-scale and complex product carbon footprint estimation tasks. Despite not having the lowest error, the PCF-RWKV model’s overall performance and potential application advantages make it a promising model for further study and application.
6. Conclusions
This paper introduces a novel large-scale model for product carbon footprint assessment, PCF-RWKV, based on the innovative RWKV architecture. The model aims to address challenges faced by traditional lifecycle assessment methods, such as the subjectivity in defining product boundaries and the time-consuming nature of constructing lifecycle inventories. The PCF-RWKV model integrates multiple stacked residual blocks and task-specific LoRA heads, and is trained using low-rank adaptive techniques on a product carbon footprint assessment knowledge dataset. With 7 billion parameters, the model can be efficiently deployed on consumer-grade single GPUs, ensuring enterprise data security. By incorporating multi-agent technology, PCF-RWKV can automatically generate models of product production processes, raw material energy usage, and waste emissions, construct lifecycle models, and calculate carbon footprints, providing enterprises with an efficient and secure carbon footprint assessment solution.
The highlights of the PCF-RWKV model lie in its innovative architecture and training methodology, which offer significant advantages in assessment efficiency and resource consumption. Compared to existing technologies, PCF-RWKV demonstrates higher resource utilization efficiency and faster processing speed when handling long sequence data, which is particularly important for large-scale datasets as it significantly reduces model training and inference time. Additionally, the PCF-RWKV model exhibits better balance in product carbon footprint assessment tasks than existing models, especially in terms of recall and F1 scores, indicating its precision in generating product production processes.
Despite the significant advantages of the PCF-RWKV model in evaluation efficiency and resource consumption, this study also has certain limitations. Firstly, the scale and diversity of the training dataset might limit the model’s accuracy in specific scenarios. Secondly, the impact of the multi-agent architecture on the model’s operational speed requires further research and optimization to ensure responsiveness and efficiency in practical applications.
Future research directions could expand into the following areas: first, increasing the scale and coverage of the dataset to enhance the model’s generalization capability and accuracy. Second, exploring the model’s applicability across different industries and product types and developing corresponding adjustment strategies to meet the specific needs of various fields. Additionally, further optimization of agent technology is needed to improve the model’s operational efficiency. Finally, considering the model’s interpretability and transparency, future work could focus on enhancing the model’s explanatory capabilities to help enterprises better understand and trust the assessment results. Through these efforts, the PCF-RWKV model is expected to play a greater role in the field of product carbon footprint assessment, providing robust technical support for enterprises to achieve sustainable development goals.
Author Contributions
Conceptualization, Z.L.; Methodology, Z.L.; Software, Z.L. and P.H.T.; Validation, P.H.T. and X.L.W.; Formal analysis, Z.L., P.H.T. and X.L.W.; Investigation, Z.L.,X.L.W.; Writing—original draft, Z.L. and P.H.T.; Writing—review & editing, P.M. and X.P.L.; Supervision, P.M. and X.P.L.; Funding acquisition, P.M. and X.P.L. All authors have read and agreed to the published version of the manuscript.
Funding
Funded by the National Key Research and Development Program of China through grant number 2022YFC3901701, project title "Environmental Load Calculation Method for the Full Lifecycle of Mobile Phones and Tablets."
Institutional Review Board Statement
Not applicable.
Informed Consent Statement
Not applicable.
Data Availability Statement
The data presented in this study are available in the article.
Acknowledgments
The authors extend their appreciation to the National Key Research and Development Program of China for funding and supporting this work through project number 2022YFC3901701, titled "Environmental Load Calculation Method for the Full Lifecycle of Mobile Phones and Tablets." The authors would also like to thank the project team members for their invaluable contributions and collaboration throughout the study.
Conflicts of Interest
The authors declare no conflict of interest.
Abbreviations
The following abbreviations are used in this manuscript:
| LoRA | Low-Rank Adaptation |
| LLM | Large Language Model |
| LCA | Life Cycle Assessment |
| LCI | Life Cycle Inventory |
| PCF | Product Carbon Footprint |
References
- Can, W.; Ruoshui, S.; Jiutian, Z. Supportive technologies and roadmap for China’s carbon neutrality. China Economist 2021, 16, 32–70. [Google Scholar]
- Rüdele, K.; Wolf, M. Identification and Reduction of Product Carbon Footprints: Case Studies from the Austrian Automotive Supplier Industry. Sustainability 2023, 15. [Google Scholar] [CrossRef]
- Trebbin, A.; Geburt, K. Carbon and Environmental Labelling of Food Products: Insights into the Data on Display. Sustainability 2024, 16. [Google Scholar] [CrossRef]
- Haun, P.; Müller, P.; Traverso, M. Improving automated life cycle assessment with life cycle inventory model constructs. Journal of Cleaner Production 2022, 370, 133452. [Google Scholar] [CrossRef]
- Islam, S.; Ponnambalam, S.; Lam, H.L. Review on life cycle inventory: methods, examples and applications. Journal of cleaner production 2016, 136, 266–278. [Google Scholar] [CrossRef]
- Weyand, A.; Bausch, P.; Engel, B.; Metternich, J.; Weigold, M. Analysis of Uncertainty Factors in Part-Specific Greenhouse Gas Accounting. Sustainability 2023, 15. [Google Scholar] [CrossRef]
- Yang, Y.; Yue, X.; Luo, Y.; Jin, L.; Jia, B. Building Information Modeling–Life Cycle Assessment: A Novel Technology for Rapid Calculation and Analysis System for Life Cycle Carbon Emissions of Bridges. Sustainability 2024, 16. [Google Scholar] [CrossRef]
- Raiaan, M.A.K.; Mukta, M.S.H.; Fatema, K.; Fahad, N.M.; Sakib, S.; Mim, M.M.J.; Ahmad, J.; Ali, M.E.; Azam, S. A review on large Language Models: Architectures, applications, taxonomies, open issues and challenges. IEEE Access 2024. [Google Scholar] [CrossRef]
- Al-Dokhny, A.; Alismaiel, O.; Youssif, S.; Nasr, N.; Drwish, A.; Samir, A. Can Multimodal Large Language Models Enhance Performance Benefits Among Higher Education Students? An Investigation Based on the Task–Technology Fit Theory and the Artificial Intelligence Device Use Acceptance Model. Sustainability 2024, 16. [Google Scholar] [CrossRef]
- Gonzàlez-Gonzàlez, J.; Garcìa-Méndez, S.; De Arriba-Pérez, F.; Gonzàlez-Castaño, F.J.; Barba-Seara, o. Explainable Automatic Industrial Carbon Footprint Estimation From Bank Transaction Classification Using Natural Language Processing. IEEE Access 2022, 10, 126326–126338. [Google Scholar] [CrossRef]
- Zeng, Q.; Wan, Y.; Ma, J.; Song, H.; Lin, K. Online Accounting Method for Carbon Emission of Coal Mines owned by the Coal Industry Group. Journal of Computing and Electronic Information Management 2023, 11, 84–92. [Google Scholar] [CrossRef]
- Deng, Z.; Liu, J.; Luo, B.; Yuan, C.; Yang, Q.; Xiao, L.; Zhou, W.; Liu, Z. AutoPCF: Efficient Product Carbon Footprint Accounting with Large Language Models. arXiv preprint arXiv:2308.04241 2023. arXiv:2308.04241 2023.
- Wang, Y.; Luo, D. Design of Carbon Emission Accounting and Monitoring System Based on Artificial Intelligence Algorithm. 2023 International Conference on Evolutionary Algorithms and Soft Computing Techniques (EASCT). IEEE, 2023, pp. 1–5.
- Huang, R.; Mao, S. Carbon Footprint Management in Global Supply Chains: A Data-Driven Approach Utilizing Artificial Intelligence Algorithms. IEEE Access 2024, 12, 89957–89967. [Google Scholar] [CrossRef]
- Agiza, A.; Neseem, M.; Reda, S. MTLoRA: Low-Rank Adaptation Approach for Efficient Multi-Task Learning. Proceedings of the IEEE/CVF Conference on Computer Vision and Pattern Recognition, 2024, pp. 16196–16205.
- Peng, B.; Alcaide, E.; Anthony, Q.; Albalak, A.; Arcadinho, S.; Biderman, S.; Cao, H.; Cheng, X.; Chung, M.; Grella, M.; others. Rwkv: Reinventing rnns for the transformer era. arXiv preprint arXiv:2305.13048 2023. arXiv:2305.13048 2023.
- Zhai, S.; Talbott, W.; Srivastava, N.; Huang, C.; Goh, H.; Zhang, R.; Susskind, J. An attention free transformer. arXiv preprint arXiv:2105.14103, arXiv:2105.14103 2021.
- Rashid, K.M.; Louis, J. Times-series data augmentation and deep learning for construction equipment activity recognition. Advanced Engineering Informatics 2019, 42, 100944. [Google Scholar] [CrossRef]
- Bolón-Canedo, V.; Sánchez-Maroño, N.; Alonso-Betanzos, A. A review of feature selection methods on synthetic data. Knowledge and information systems 2013, 34, 483–519. [Google Scholar] [CrossRef]
- Hu, E.J.; Shen, Y.; Wallis, P.; Allen-Zhu, Z.; Li, Y.; Wang, S.; Wang, L.; Chen, W. Lora: Low-rank adaptation of large language models. arXiv preprint arXiv:2106.09685 2021.
- Talebirad, Y.; Nadiri, A. Multi-agent collaboration: Harnessing the power of intelligent llm agents. arXiv preprint arXiv:2306.03314 2023.
- Wu, Q.; Bansal, G.; Zhang, J.; Wu, Y.; Zhang, S.; Zhu, E.; Li, B.; Jiang, L.; Zhang, X.; Wang, C. Autogen: Enabling next-gen llm applications via multi-agent conversation framework. arXiv preprint arXiv:2308.08155.
- Townsend, J.T. Theoretical analysis of an alphabetic confusion matrix. Perception & Psychophysics 1971, 9, 40–50. [Google Scholar]
- GLM, T.; Zeng, A.; Xu, B.; Wang, B.; Zhang, C.; Yin, D.; Rojas, D.; Feng, G.; Zhao, H.; Lai, H.; Yu, H.; Wang, H.; Sun, J.; Zhang, J.; Cheng, J.; Gui, J.; Tang, J.; Zhang, J.; Li, J.; Zhao, L.; Wu, L.; Zhong, L.; Liu, M.; Huang, M.; Zhang, P.; Zheng, Q.; Lu, R.; Duan, S.; Zhang, S.; Cao, S.; Yang, S.; Tam, W.L.; Zhao, W.; Liu, X.; Xia, X.; Zhang, X.; Gu, X.; Lv, X.; Liu, X.; Liu, X.; Yang, X.; Song, X.; Zhang, X.; An, Y.; Xu, Y.; Niu, Y.; Yang, Y.; Li, Y.; Bai, Y.; Dong, Y.; Qi, Z.; Wang, Z.; Yang, Z.; Du, Z.; Hou, Z.; Wang, Z. ChatGLM: A Family of Large Language Models from GLM-130B to GLM-4 All Tools, 2024.
- Khalid, Y.; Wu, M.; Silaen, A.; Martinez, F.; Okosun, T.; Worl, B.; Low, J.; Zhou, C.; Johnson, K.; White, D. Oxygen enrichment combustion to reduce fossil energy consumption and emissions in hot rolling steel production. Journal of Cleaner Production 2021, 320, 128714. [Google Scholar] [CrossRef]
- Thomas, B.; Fishwick, M.; Joyce, J.; van Santen, A. A Carbon Footprint for UK Clothing and Opportunities for Savings—Final Report. 2012.
- Beton, A.; Dias, D.; Farrant, L.; Gibon, T.; Le Guern, Y.; Desaxce, M.; Perwueltz, A.; Boufateh, I.; Wolf, O.; Kougoulis, J.; others. Environmental improvement potential of textiles (IMPRO Textiles). European Commission 2014, 20. [Google Scholar]
- Tao, Y.; Sun, T.; Wang, Z. Uncovering various paths for environmentally recycling lithium iron phosphate batteries through life cycle assessment. Journal of Cleaner Production 2023, 393, 136263. [Google Scholar] [CrossRef]
- Amarakoon, S.; Smith, J.; Segal, B. Application of life-cycle assessment to nanoscale technology: Lithium-ion batteries for electric vehicles. Technical report, 2013.
- Majeau-Bettez, G.; Hawkins, T.R.; Strømman, A.H. Life cycle environmental assessment of lithium-ion and nickel metal hydride batteries for plug-in hybrid and battery electric vehicles. Environmental science & technology 2011, 45, 4548–4554. [Google Scholar]
- Zackrisson, M.; Avellán, L.; Orlenius, J. Life cycle assessment of lithium-ion batteries for plug-in hybrid electric vehicles–Critical issues. Journal of cleaner production 2010, 18, 1519–1529. [Google Scholar] [CrossRef]
- Lai, X.; Gu, H.; Chen, Q.; Tang, X.; Zhou, Y.; Gao, F.; Han, X.; Guo, Y.; Bhagat, R.; Zheng, Y. Investigating greenhouse gas emissions and environmental impacts from the production of lithium-ion batteries in China. Journal of Cleaner Production 2022, 372, 133756. [Google Scholar] [CrossRef]
- Lu, Q.; Wu, P.F.; Shen, W.X.; Wang, X.C.; Zhang, B.; Wang, C. Life cycle assessment of electric vehicle power battery. Materials Science Forum. Trans Tech Publ, 2016, Vol. 847, pp. 403–410.
- Shi, X.; Meier, H. Carbon emission assessment to support planning and operation of low-carbon production systems. Procedia CIRP 2012, 3, 329–334. [Google Scholar] [CrossRef]
Figure 1.
PCF-RWKV Architecture Diagram.
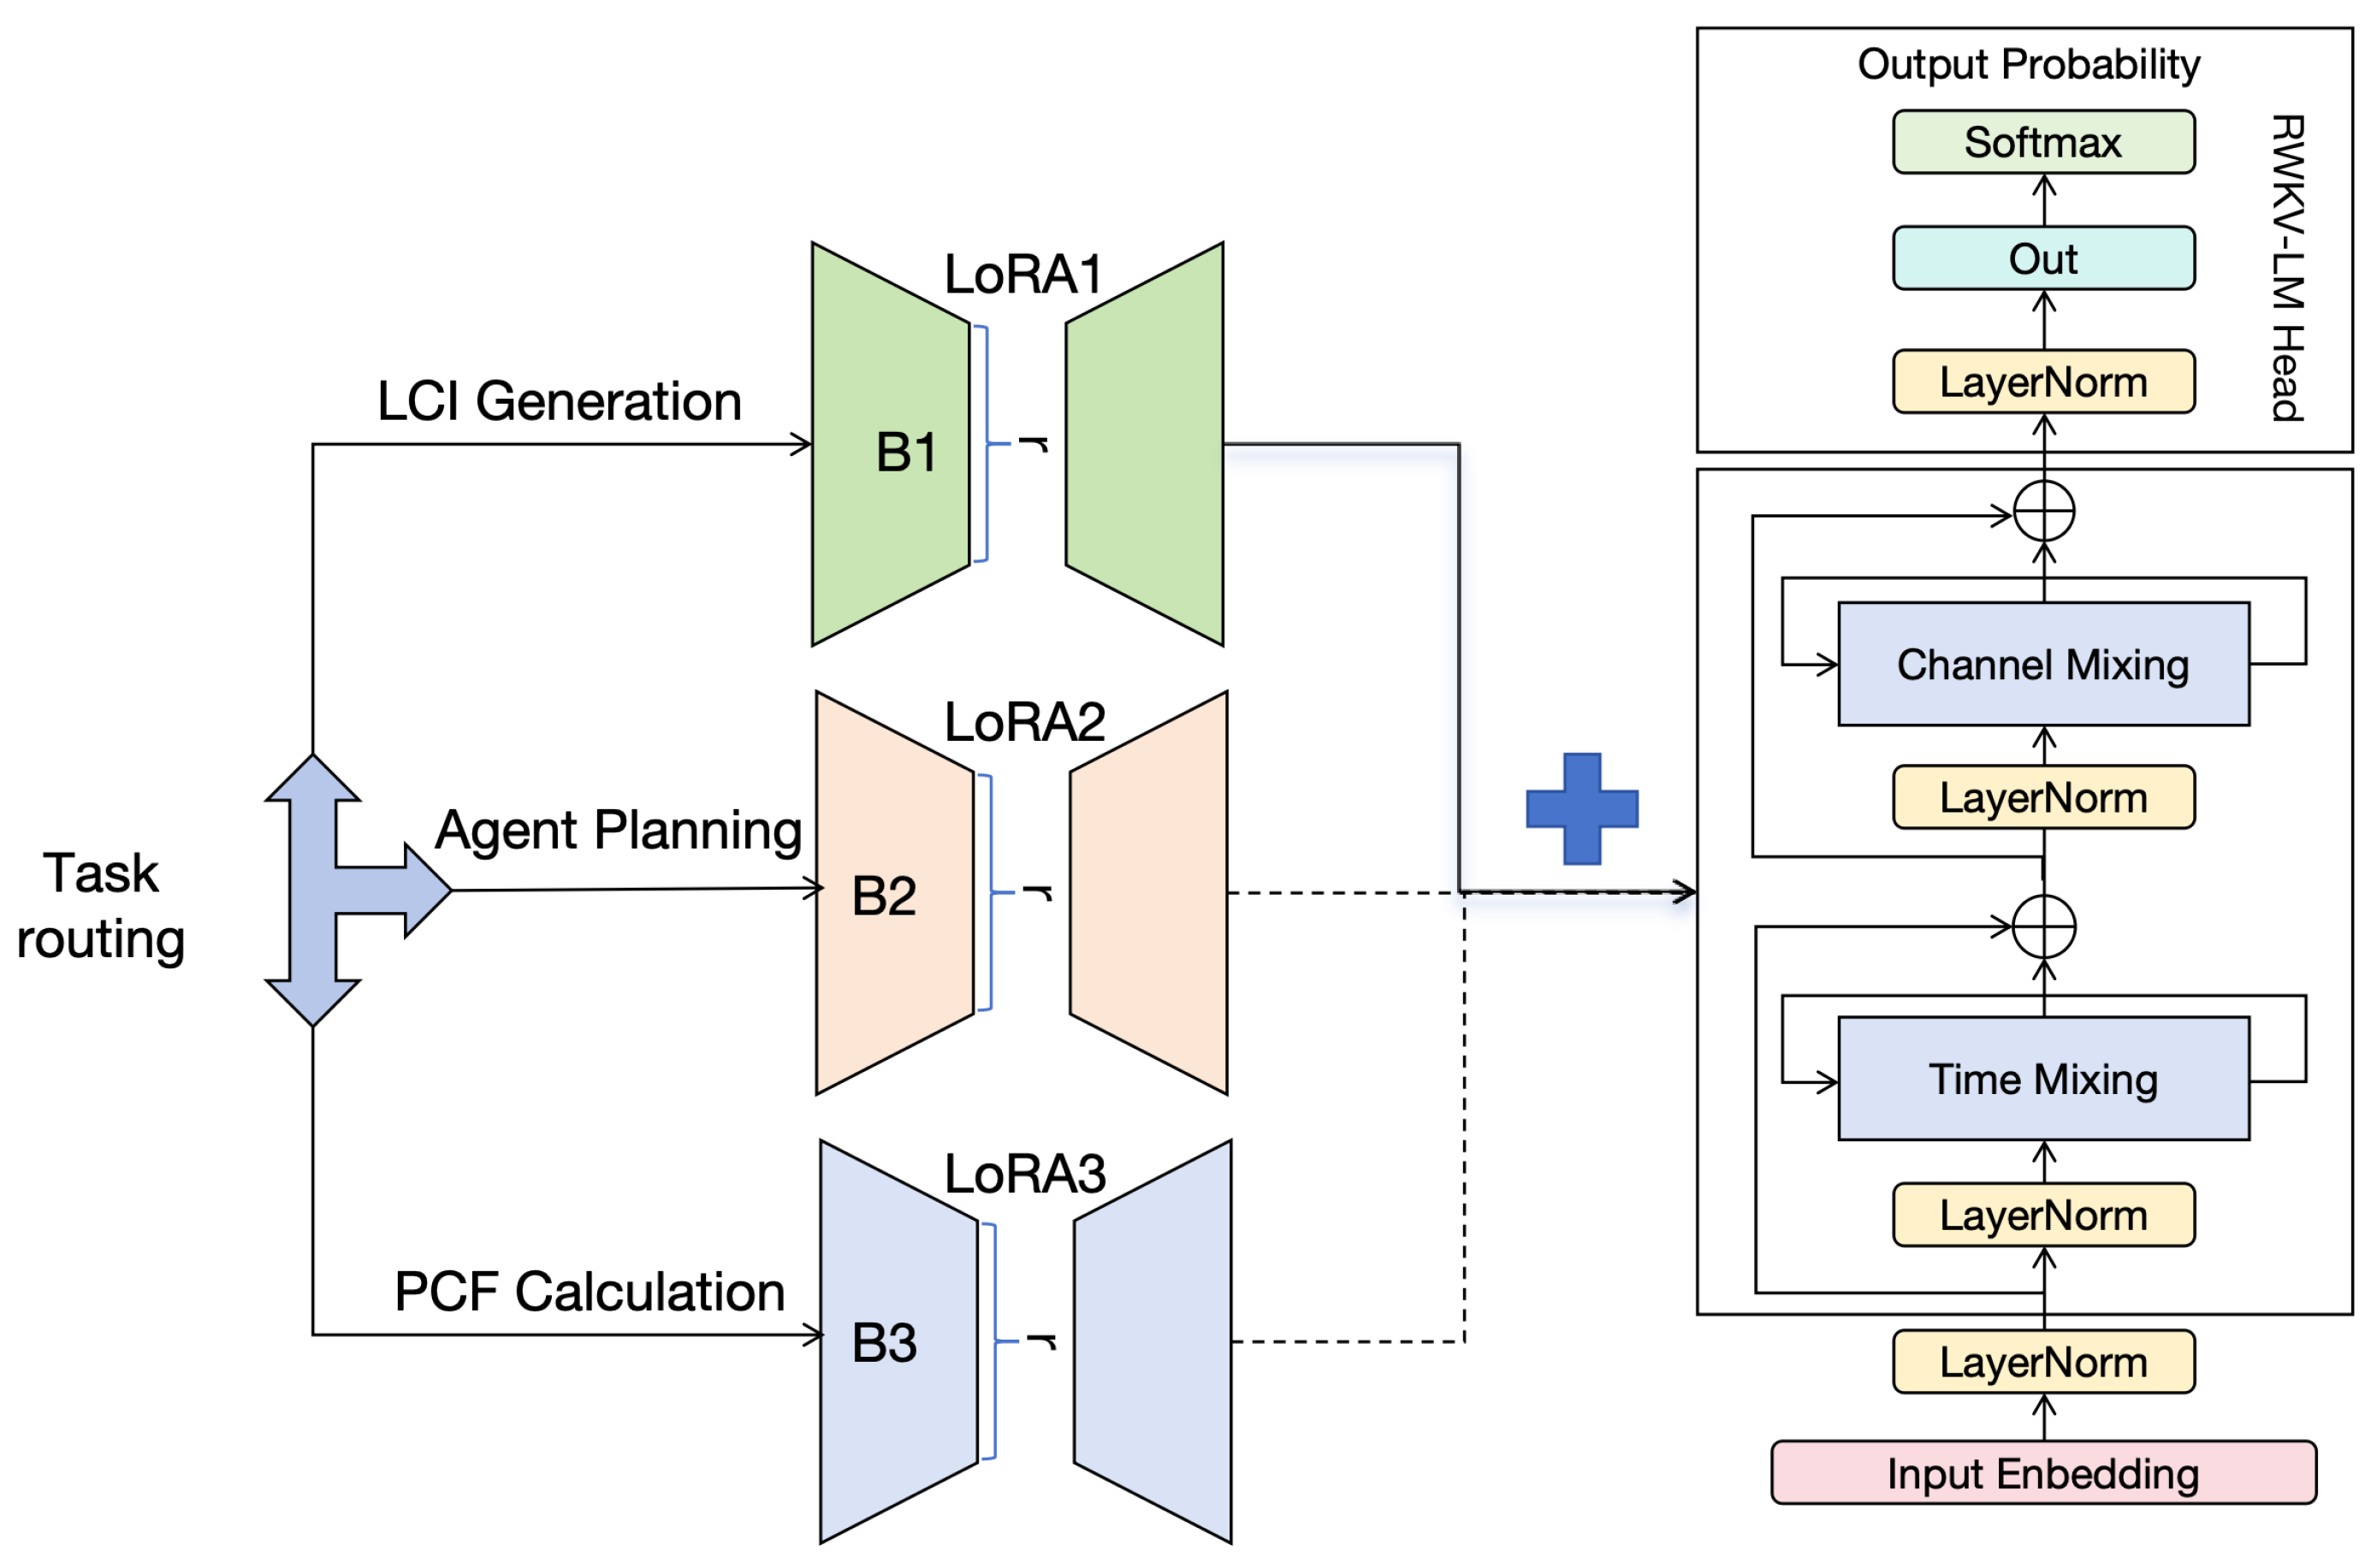
Figure 2.
Time Mixing Module and Channel Mixing Module.
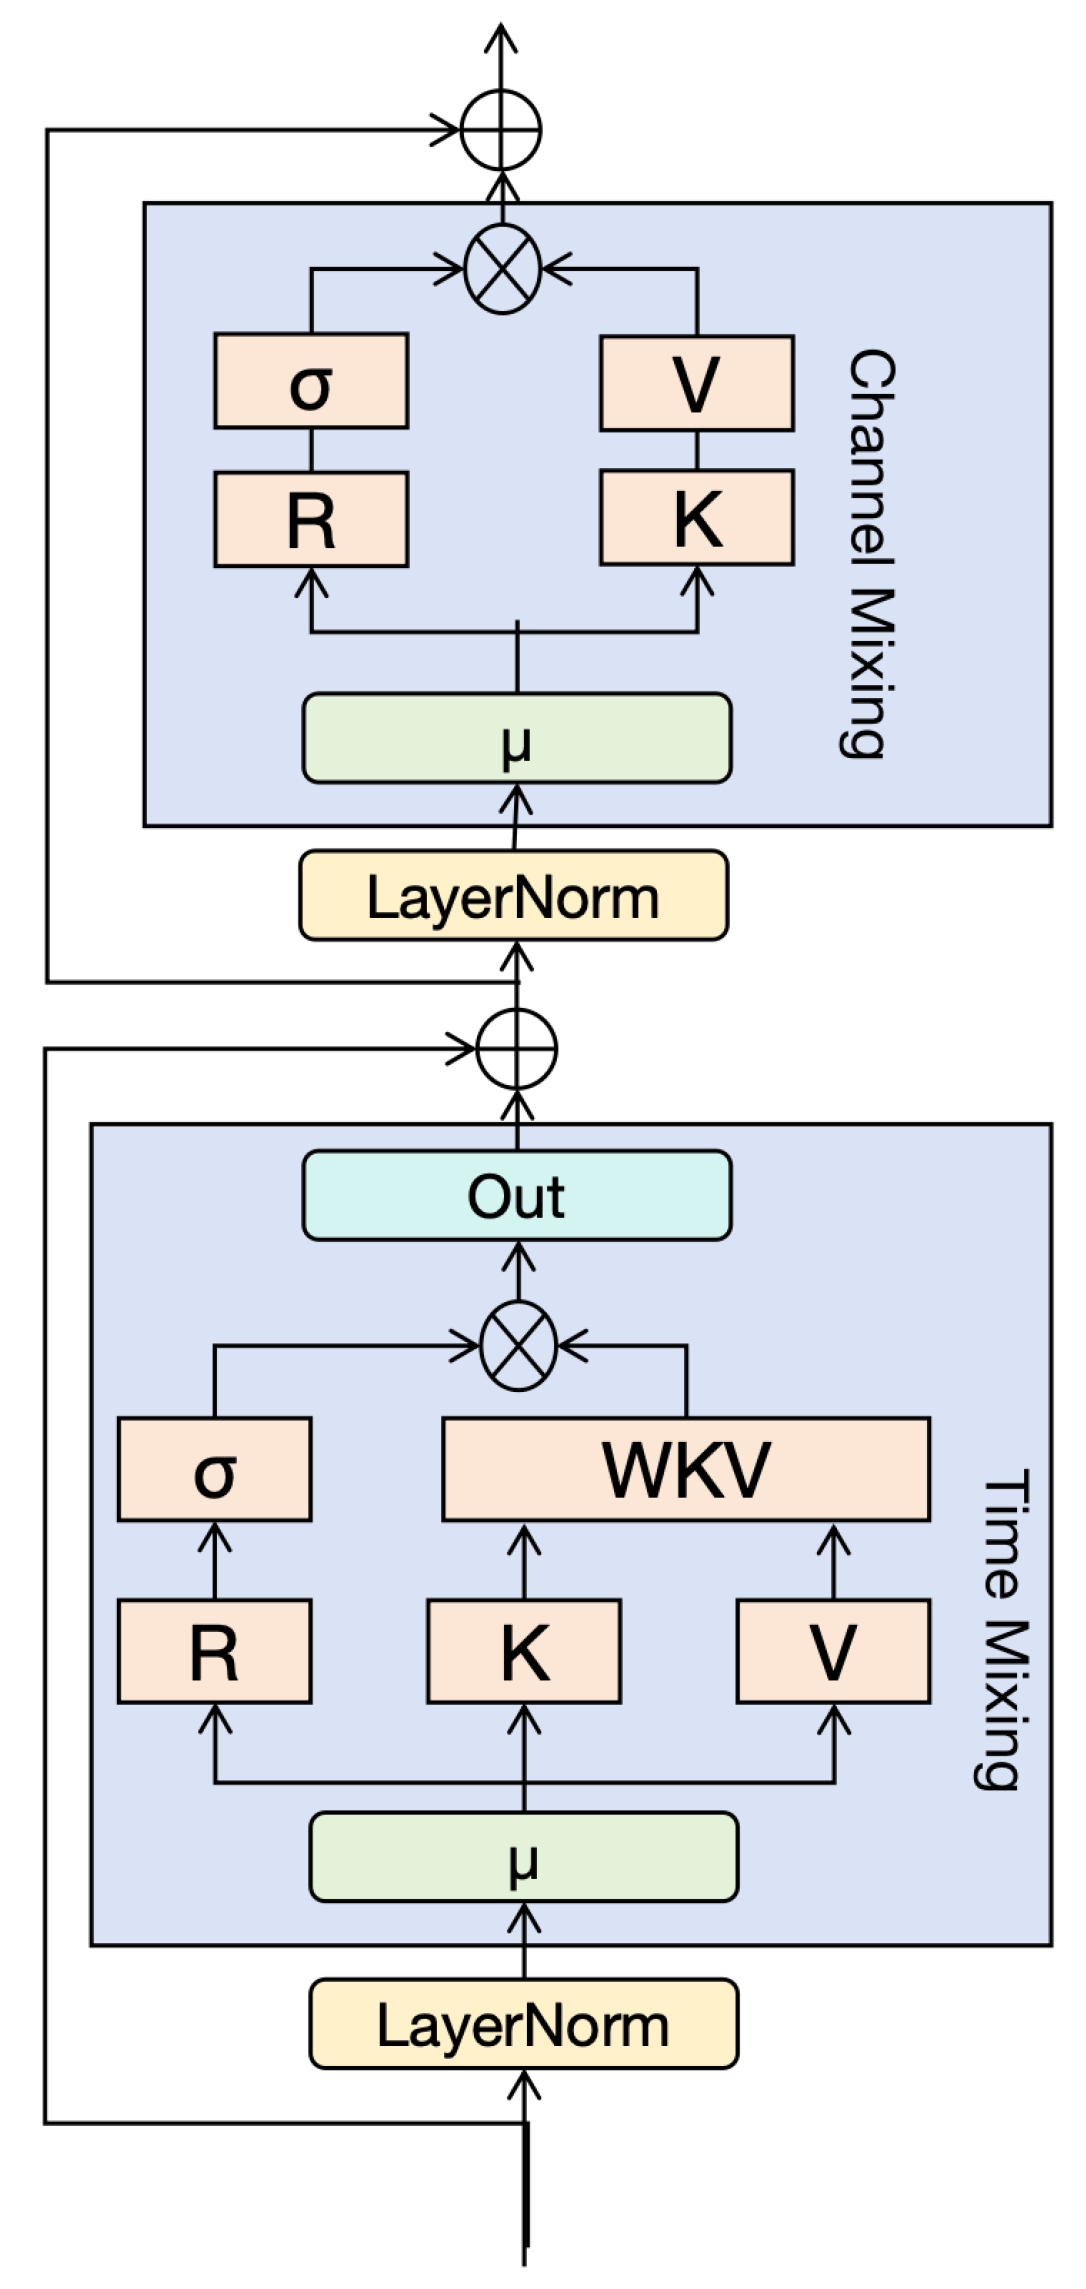
Figure 3.
RWKV model time mixing module recursive process.
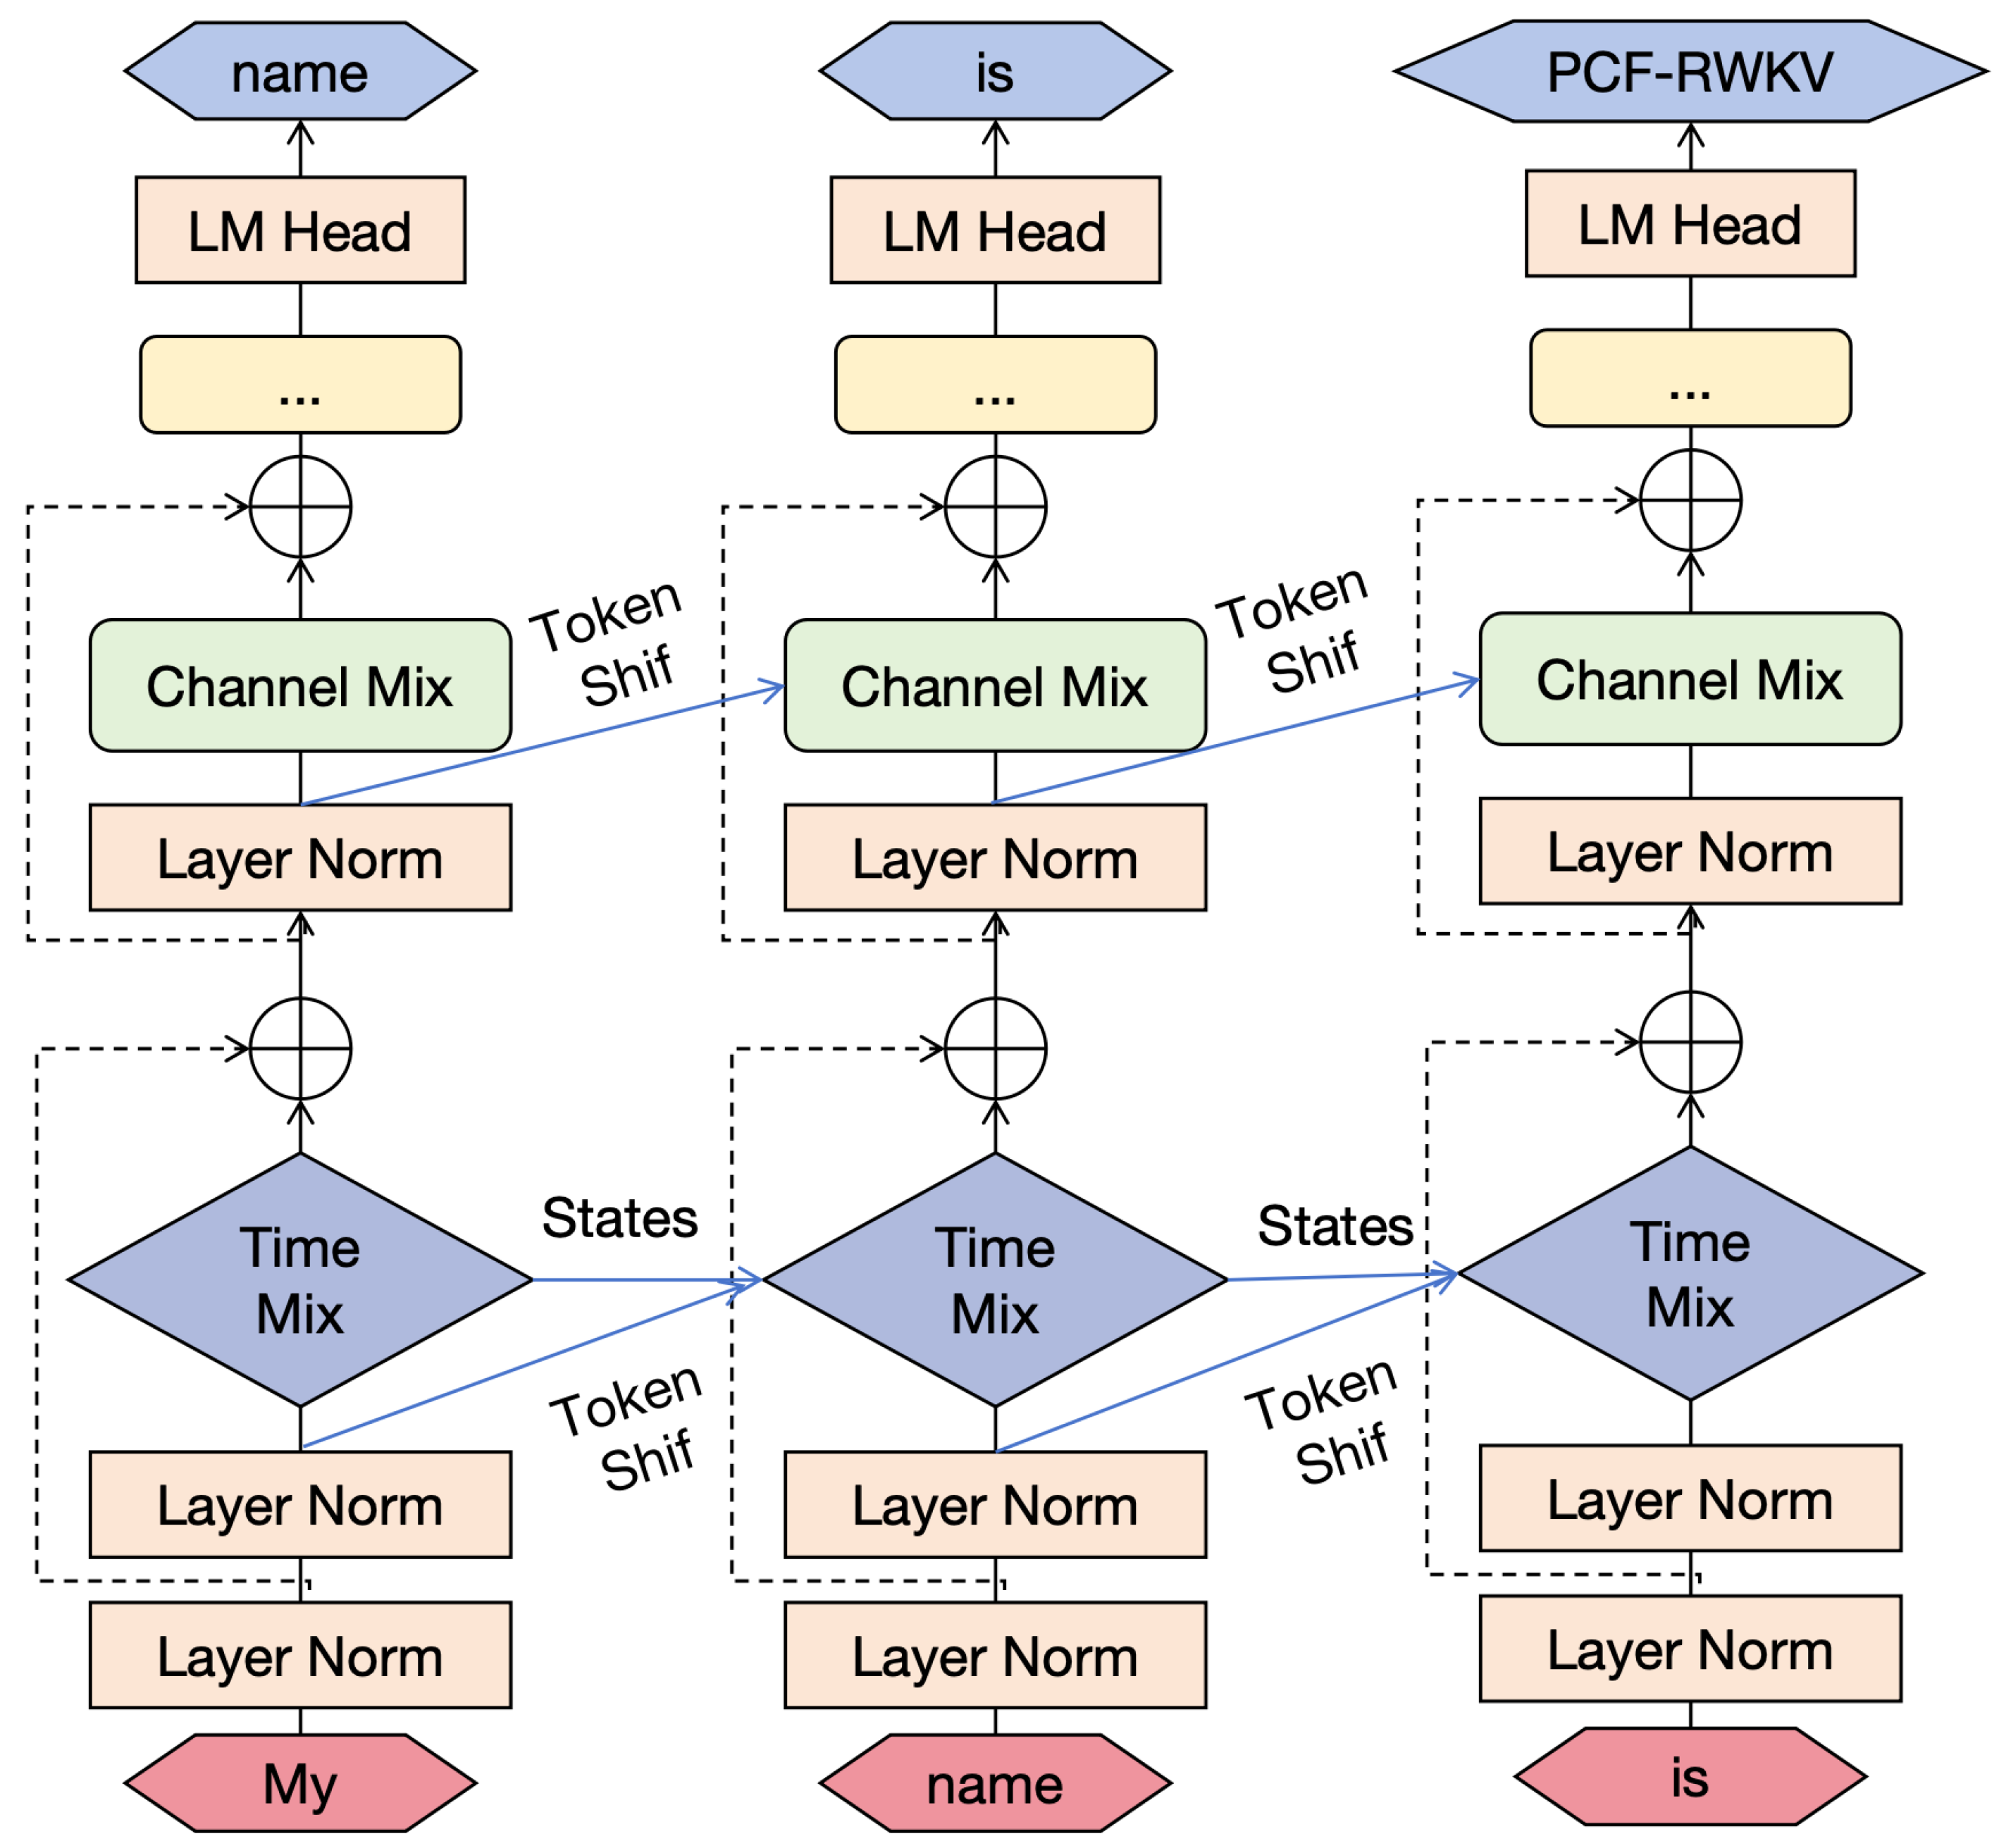
Figure 4.
PCF-RWKV training dataset example.
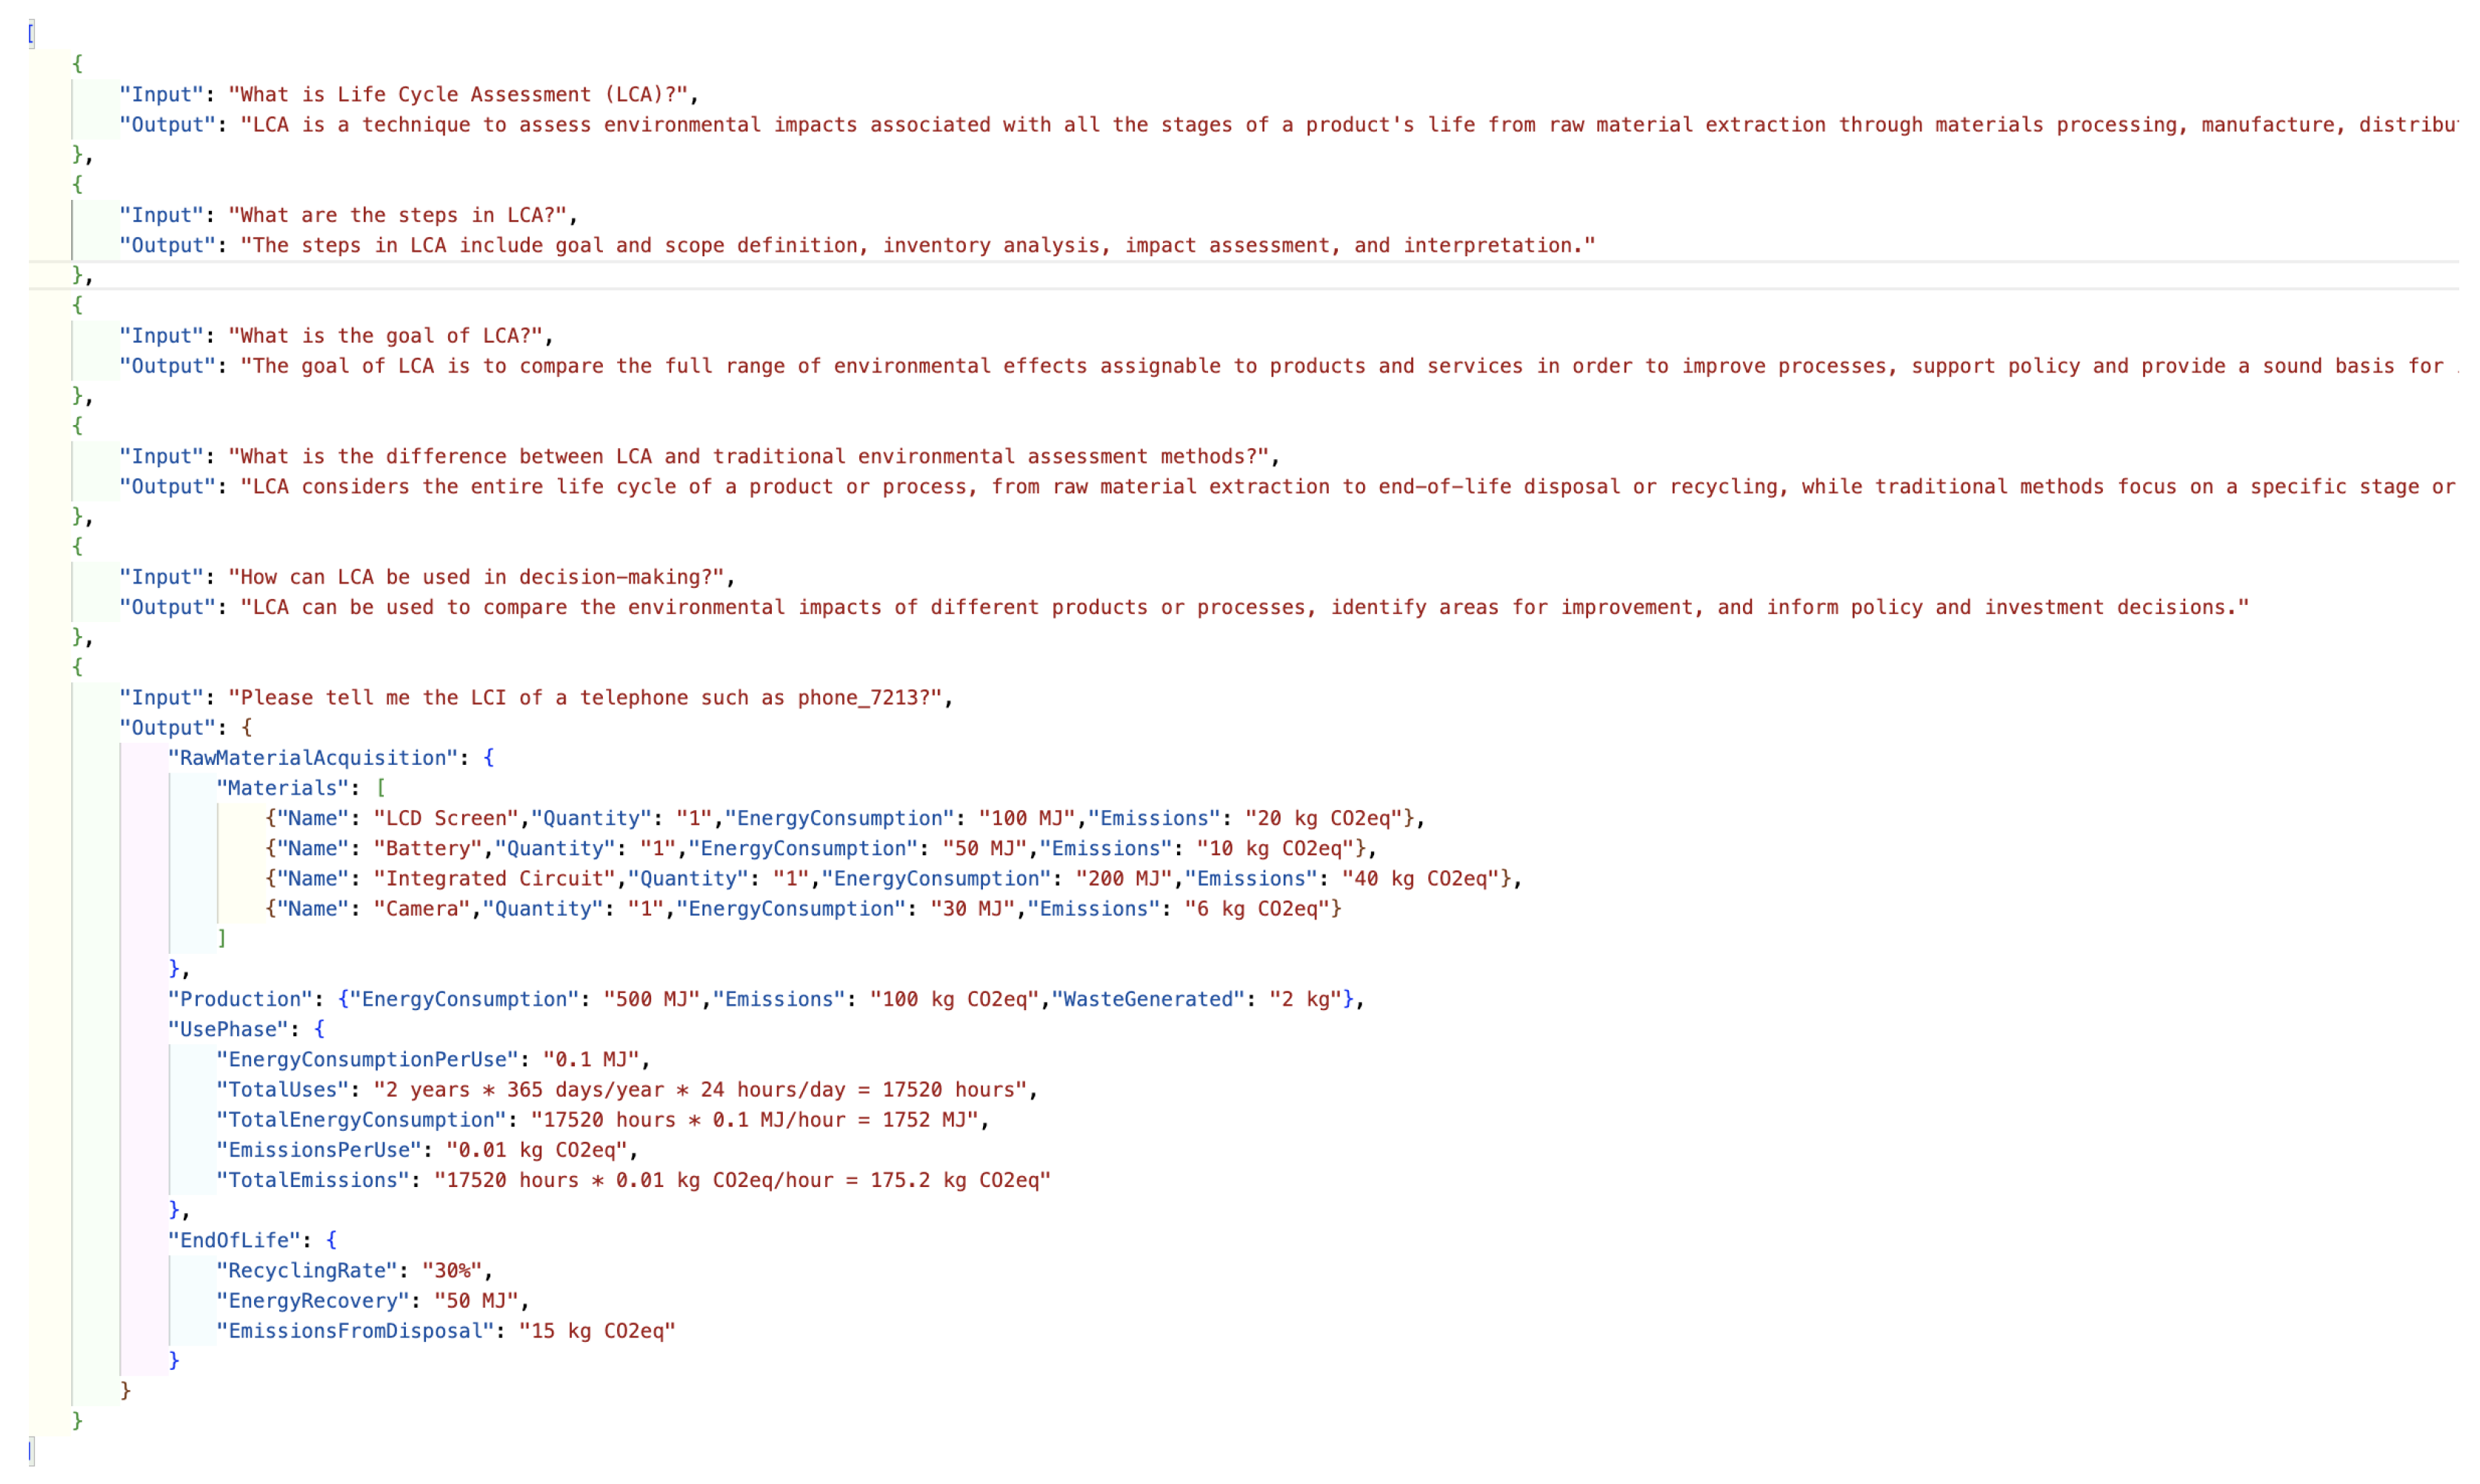
Figure 5.
Data Synthesis and Enhancement Strategy Based on Large Models and Human Feedback.
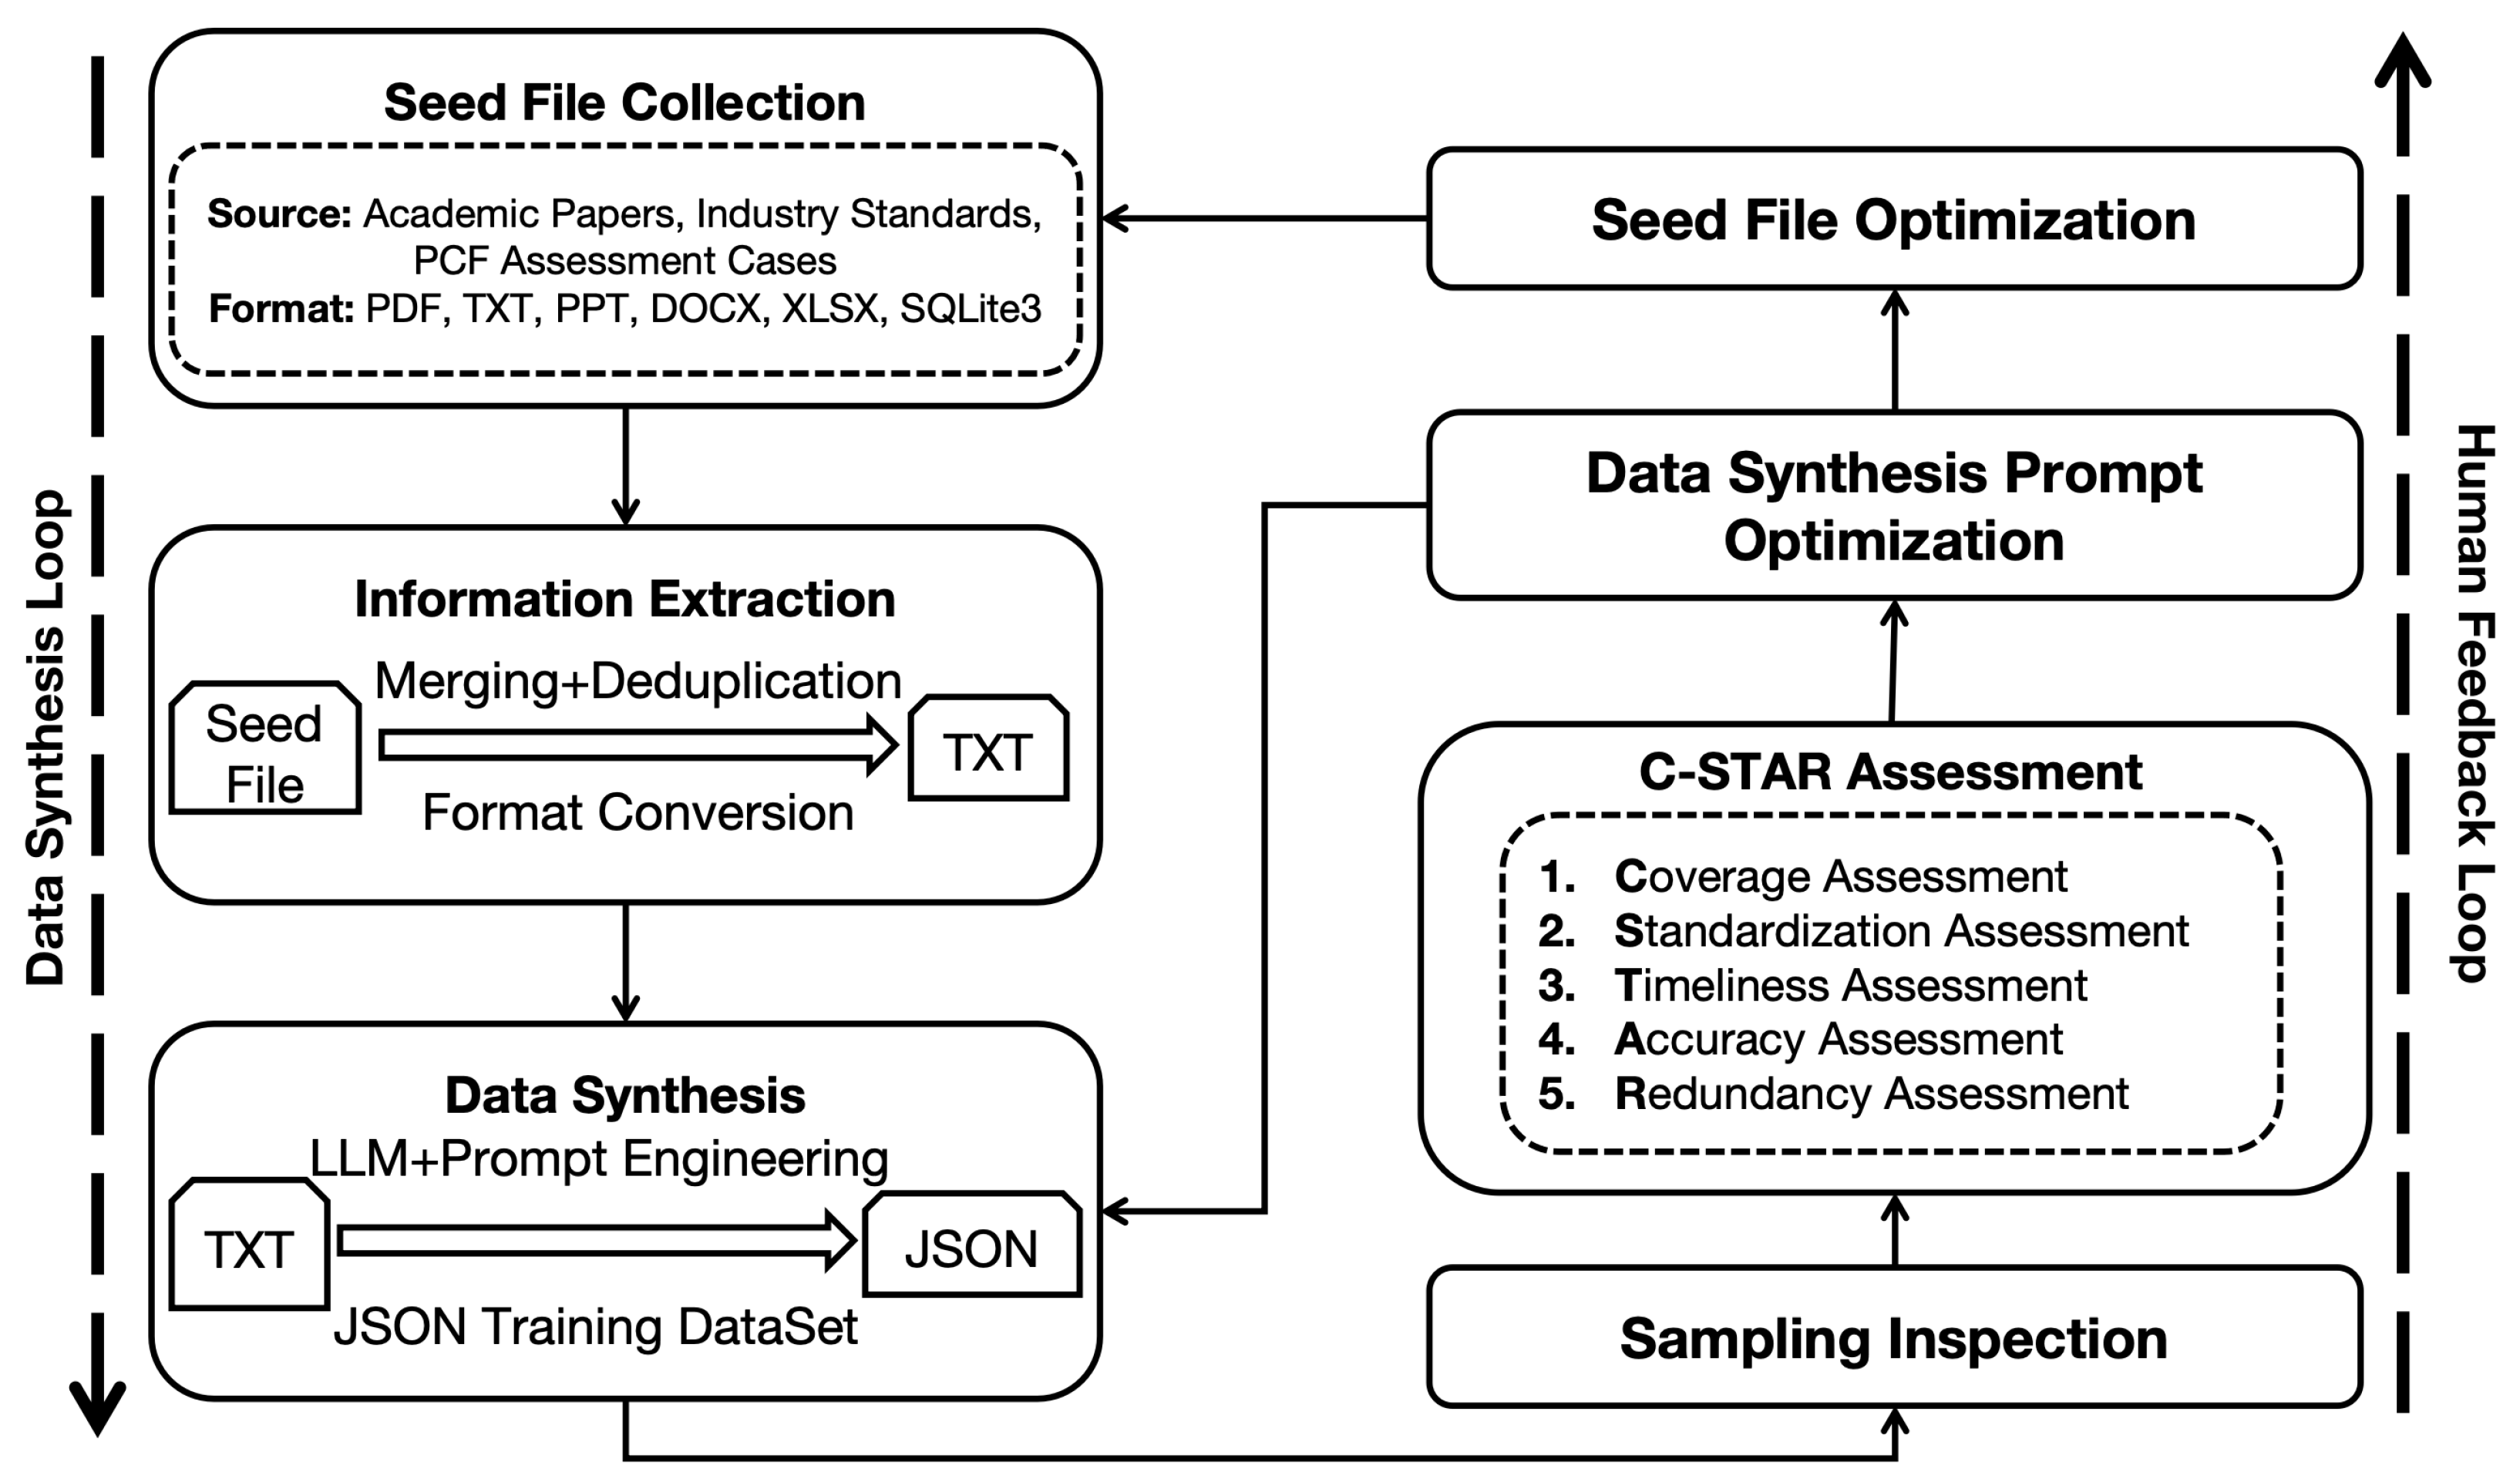
Figure 6.
Low-Rank Adaptation Schematic Diagram.
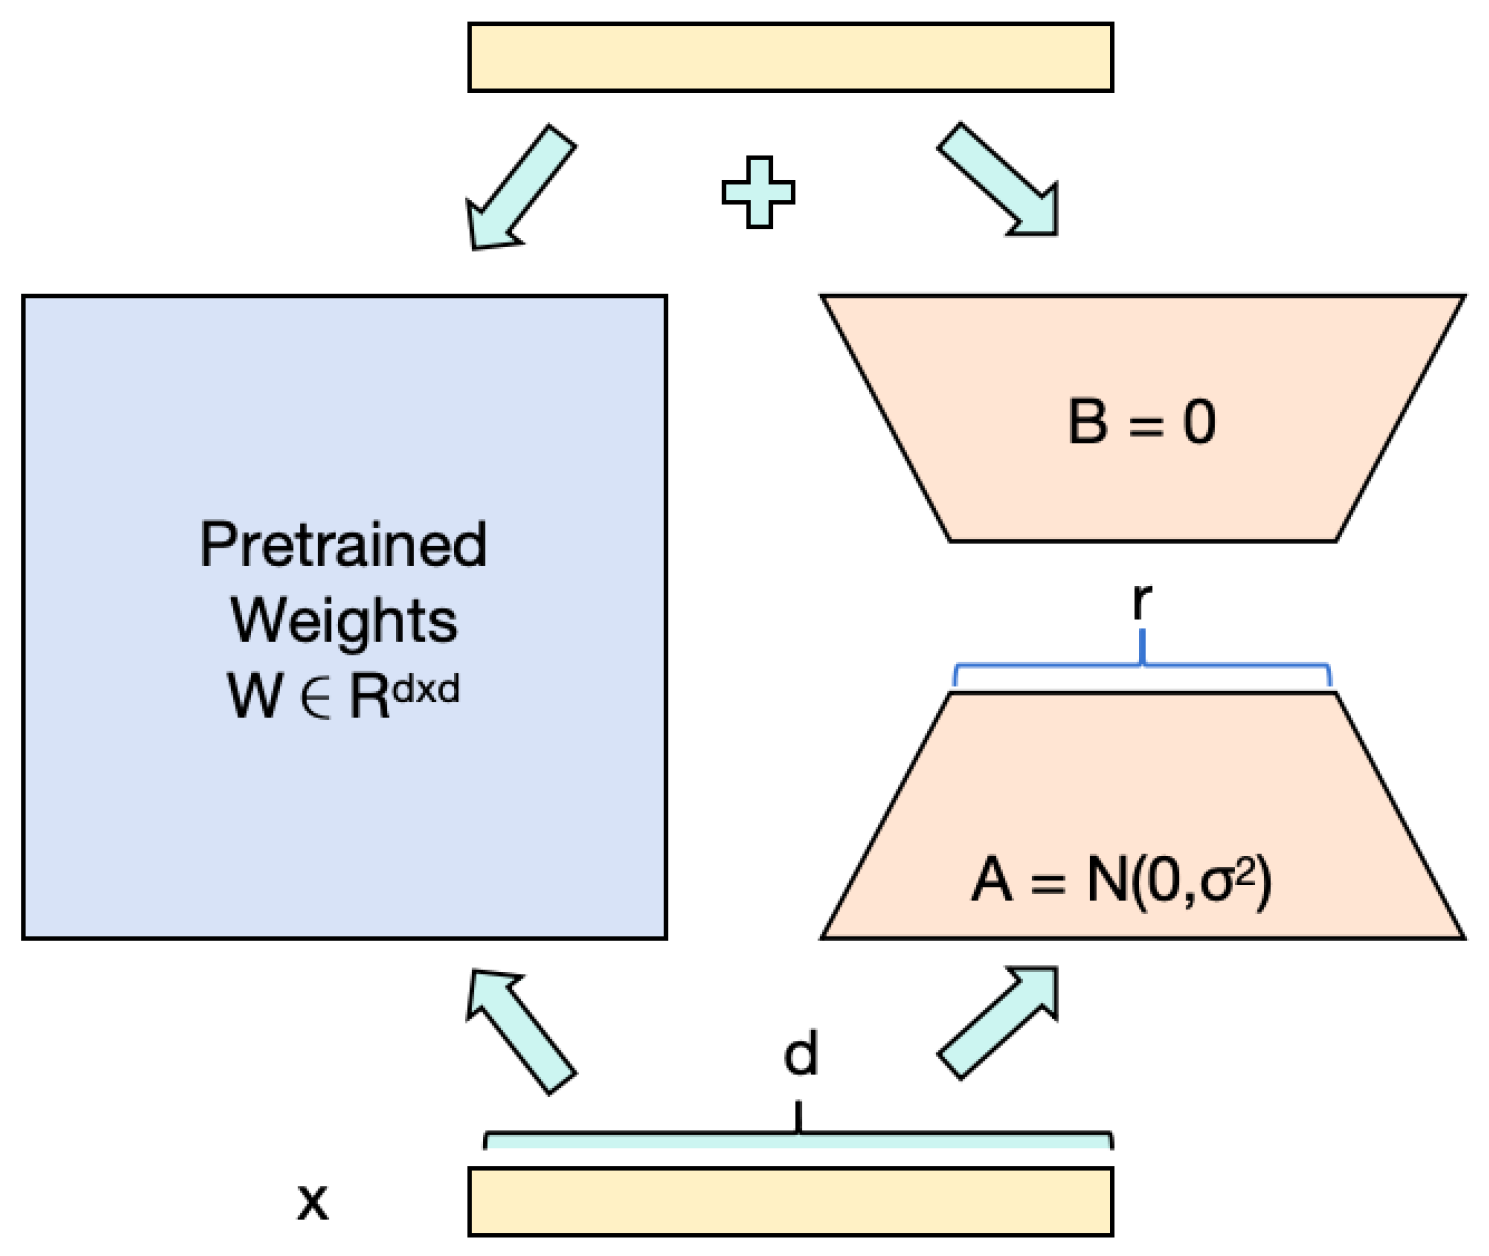
Figure 7.
PCF-RWKV Multi-Agent Architecture Diagram.
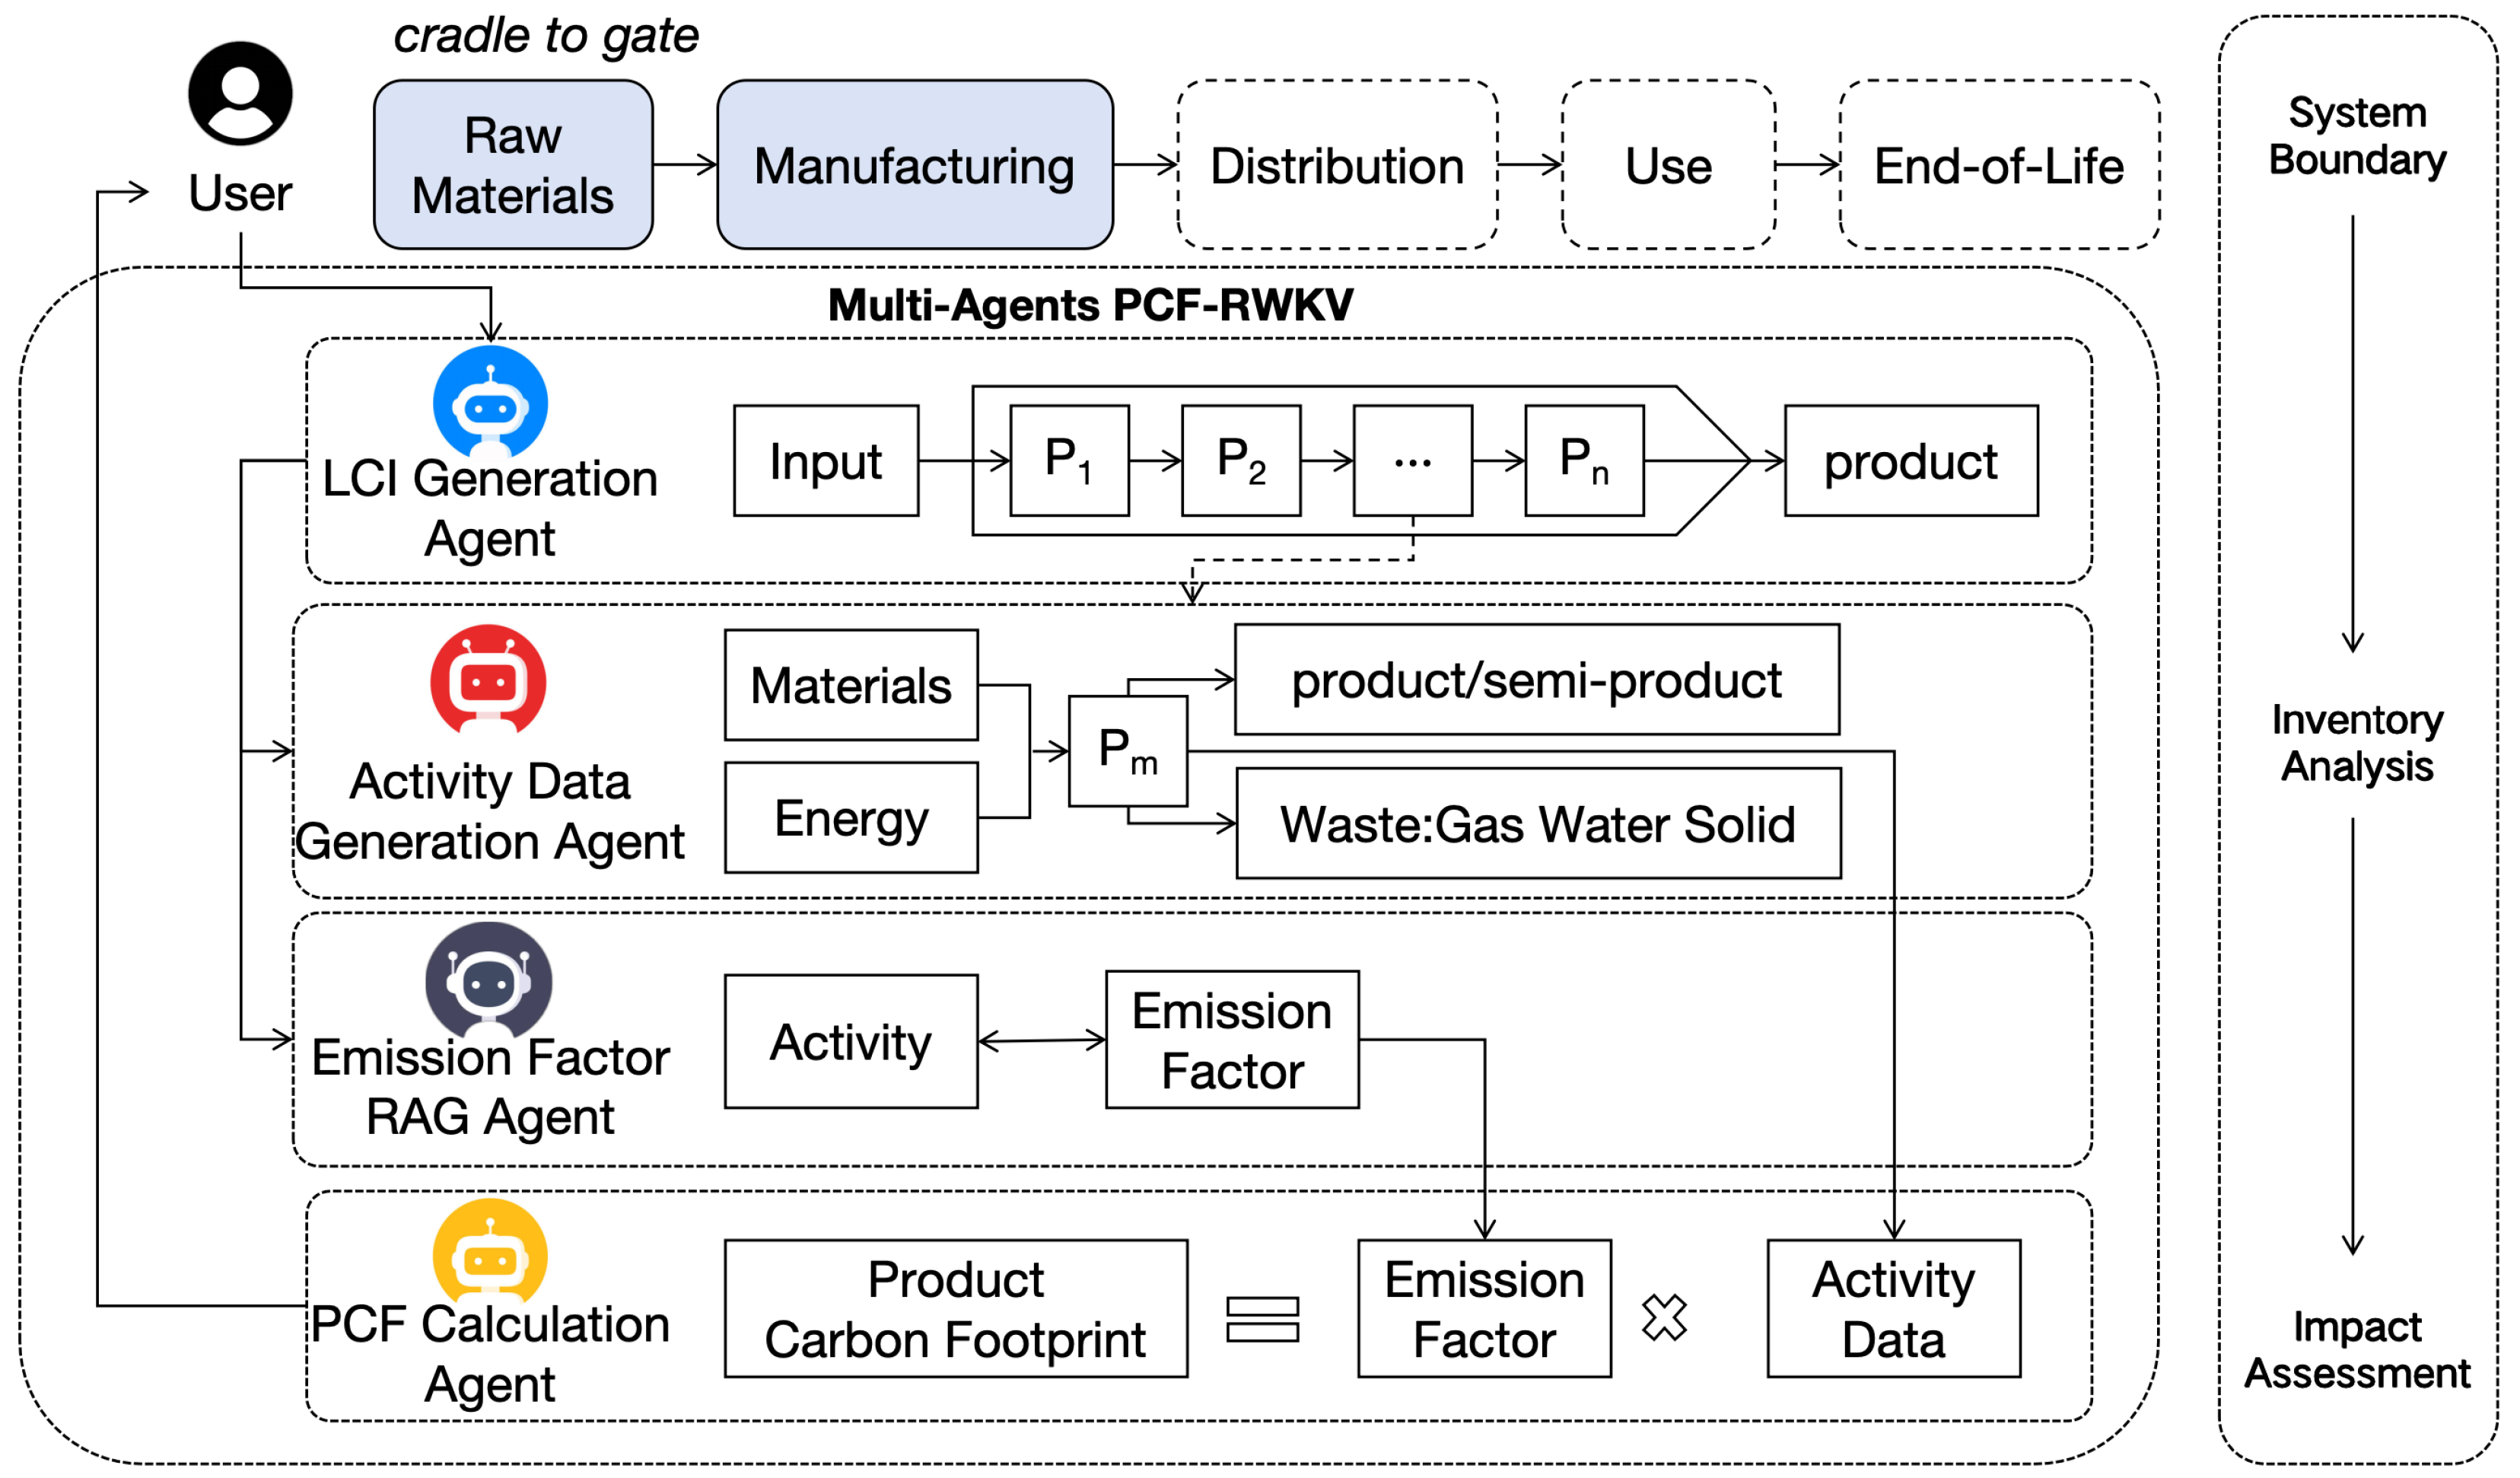
Figure 8.
Model comprehensive evaluation results.
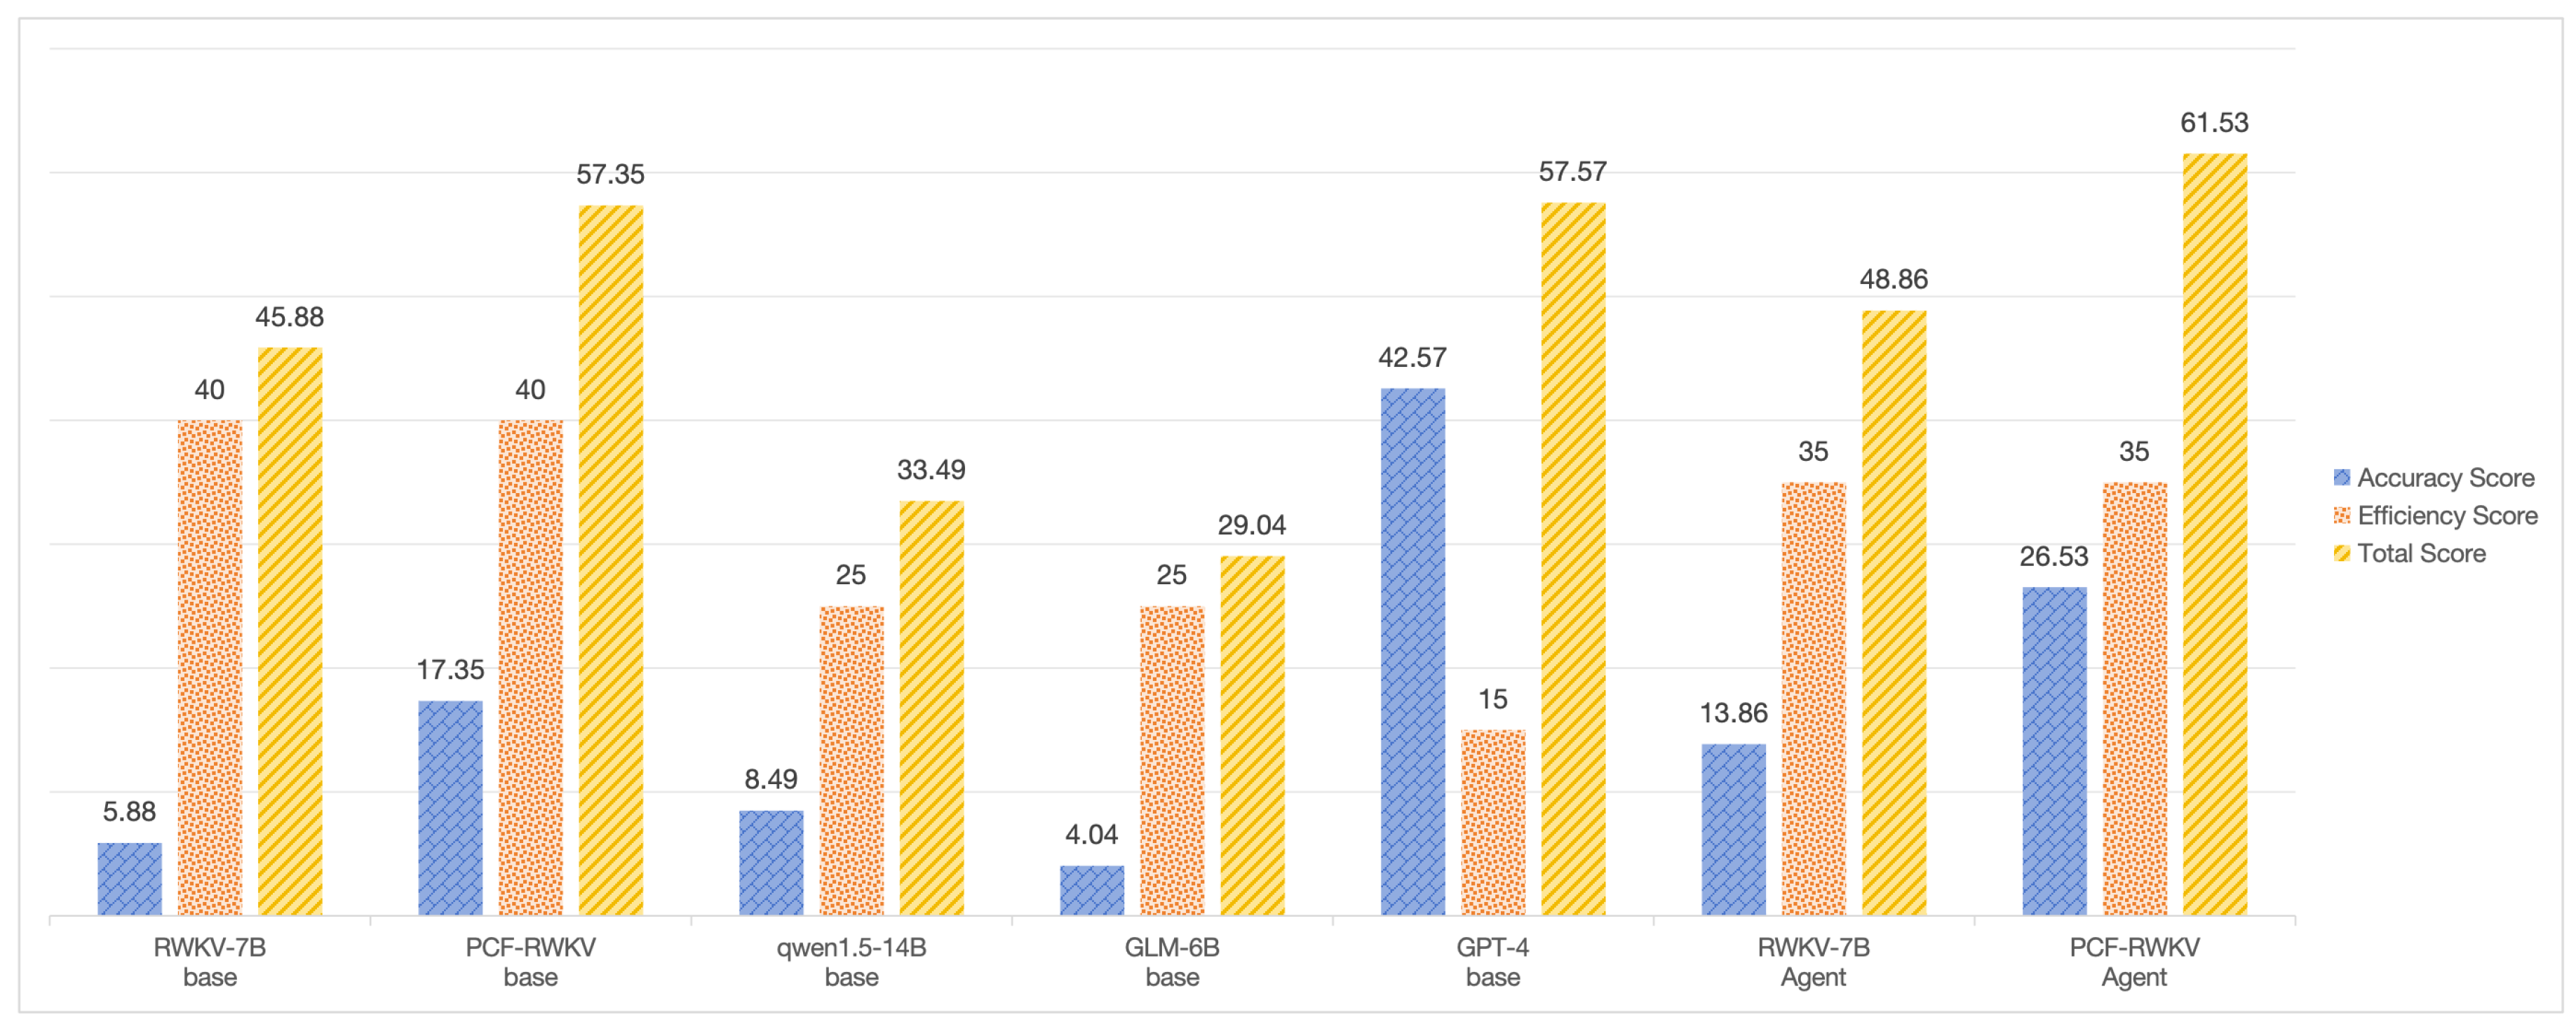
Figure 9.
Performance Comparison of Various Models in Life Cycle Inventory Analysis. Performance is evaluated by three metrics: Precision (P), Recall (R), and F1-score (F1), ranging from 0 to 1, with 1 being the best and 0 the worst compared to the expert-based process.
Figure 9.
Performance Comparison of Various Models in Life Cycle Inventory Analysis. Performance is evaluated by three metrics: Precision (P), Recall (R), and F1-score (F1), ranging from 0 to 1, with 1 being the best and 0 the worst compared to the expert-based process.
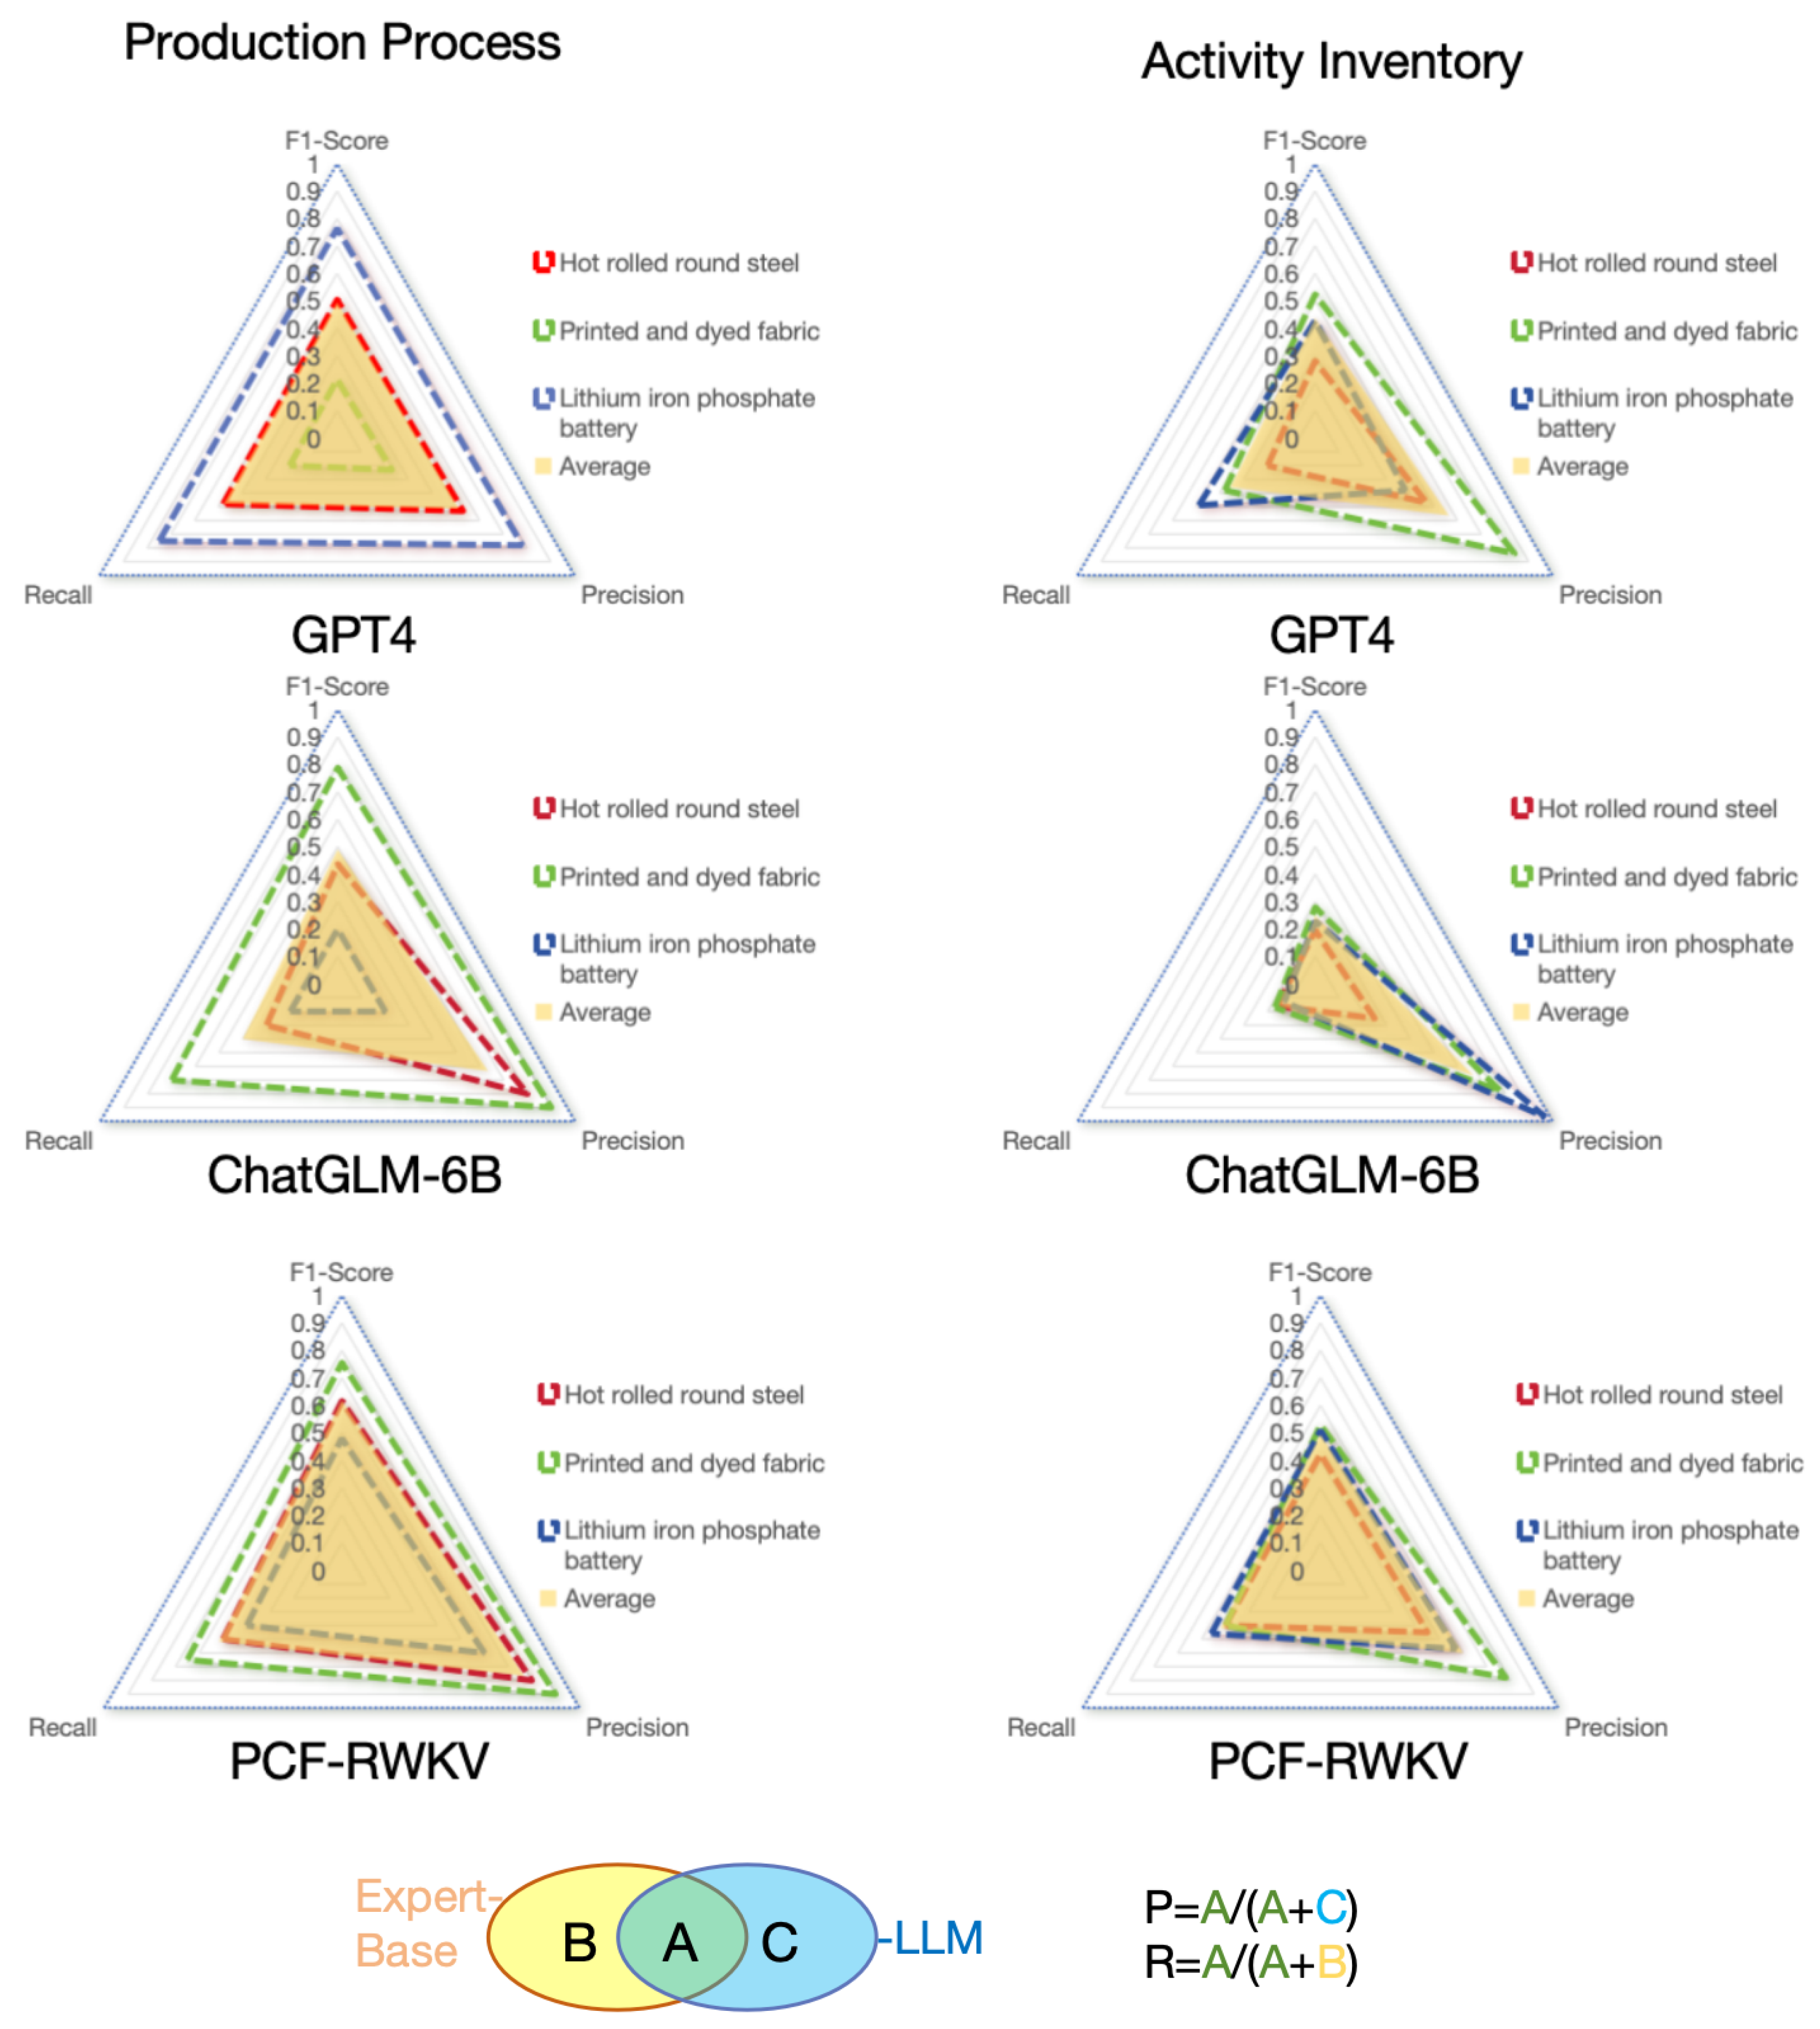
Figure 10.
Carbon footprint estimation of the three selected products (hot rolled round steel, printed and dyed fabric, and lithium iron phosphate battery).
Figure 10.
Carbon footprint estimation of the three selected products (hot rolled round steel, printed and dyed fabric, and lithium iron phosphate battery).
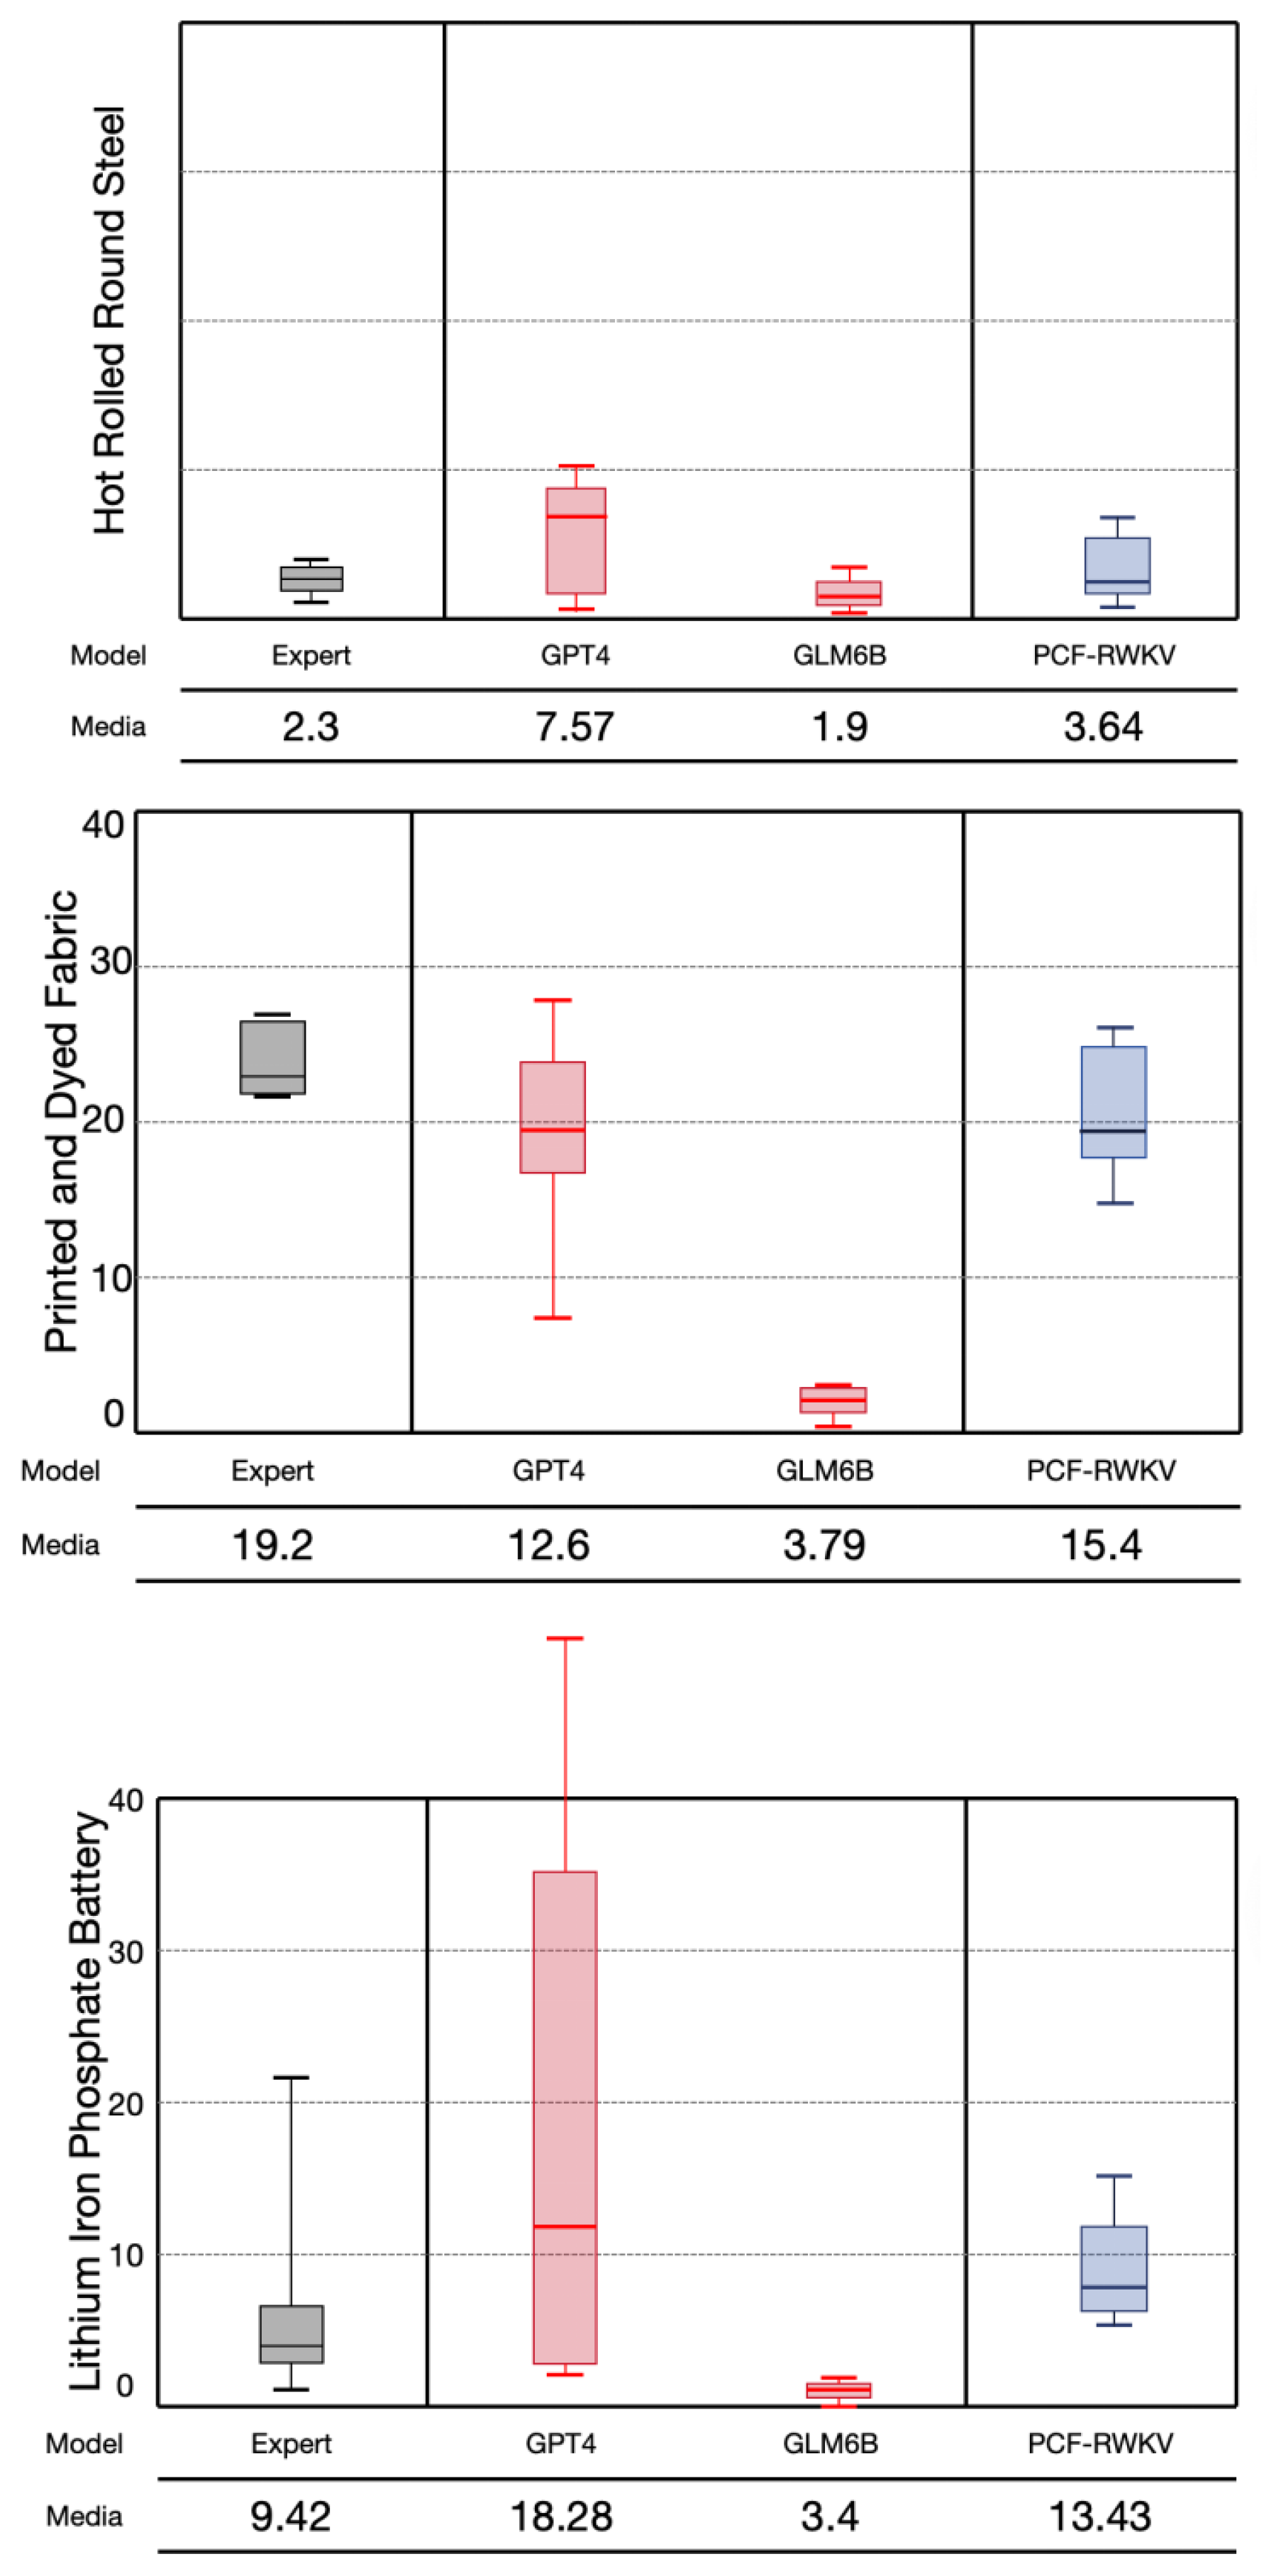

Table 1.
Model comprehensive evaluation results.
| Model | TP | TN | FP | FN | Accuracy | Recall | F1-Score | Accuracy Score | Process Time | Memory Usage (GPU) | Efficiency Score | Total Score |
|---|---|---|---|---|---|---|---|---|---|---|---|---|
| RWKV | 6 | 4 | 46 | 44 | 0.52 | 0.12 | 0.12 | 5.88 | short | low | 40 | 45.88 |
| 7B-base | ||||||||||||
| PCF-RWKV | 17 | 19 | 31 | 33 | 0.48 | 0.34 | 0.35 | 17.35 | short | low | 40 | 57.35 |
| 7B-base | ||||||||||||
| qwen1.5 | 9 | 3 | 47 | 41 | 0.56 | 0.18 | 0.17 | 8.49 | long | medium | 25 | 33.49 |
| 14B-base | ||||||||||||
| GLM | 4 | 5 | 45 | 46 | 0.49 | 0.08 | 0.08 | 4.04 | very long | low | 25 | 29.04 |
| 6B-base | ||||||||||||
| GPT-4 | 43 | 42 | 8 | 7 | 0.51 | 0.86 | 0.85 | 42.57 | long | very high | 15 | 57.57 |
| base | ||||||||||||
| RWKV | 14 | 13 | 37 | 36 | 0.51 | 0.28 | 0.28 | 13.86 | medium | low | 35 | 48.86 |
| 7B-Agent | ||||||||||||
| PCF-RWKV | 26 | 28 | 22 | 24 | 0.48 | 0.52 | 0.53 | 26.53 | medium | low | 35 | 61.53 |
| 7B-Agent |
Disclaimer/Publisher’s Note: The statements, opinions and data contained in all publications are solely those of the individual author(s) and contributor(s) and not of MDPI and/or the editor(s). MDPI and/or the editor(s) disclaim responsibility for any injury to people or property resulting from any ideas, methods, instructions or products referred to in the content. |
© 2024 by the authors. Licensee MDPI, Basel, Switzerland. This article is an open access article distributed under the terms and conditions of the Creative Commons Attribution (CC BY) license (http://creativecommons.org/licenses/by/4.0/).
Copyright: This open access article is published under a Creative Commons CC BY 4.0 license, which permit the free download, distribution, and reuse, provided that the author and preprint are cited in any reuse.


