
Submitted:
18 December 2024
Posted:
19 December 2024
You are already at the latest version
Abstract
Nowadays, the development of eco-friendly paint formulations is part of the transition process to more sustainable materials, which involves many industrial fields such as offshore and shipbuilding where the deterioration of steel in seawater is a key factor. This article aims to produce suitable innovative coatings and test their protective action on DH 36 steel plates. Commercially available SiO2 and TiO2 were covalently modified with amino groups allowing two organic-inorganic hybrid materials for the immobilization of iron sites. The obtained powders were characterized by thermogravimetric analysis, N2 physisorption, X-ray diffraction, and X-ray photoelectron spectroscopy. Fe-based solids were used as filler for the design of ecological paint formulations which, in turn, were applied on the surface of metal prototype plates. The surface properties of the resulting coatings were examined by determination of thickness, water wettability, roughness, and cross-cut adhesion tests (before and after degradation test in seawater according to ASTM D 870-97 standard). Preliminary tests of the microbiological activity of the iron amino functionalized materials were carried out monitoring, as proof of concept, the growth of some bacterial strains through measurements of optical density.
Keywords:
iron amino-functionalized oxide
; steel for shipbuilding
; coating
; adhesion test
; roughness
1. Introduction
The development of more sustainable solutions to environmental concerns is a common goal that encompasses materials science technologies. Among them, paint and coating systems focus on the use of always less toxic components while preserving high physical-chemical and mechanical properties [1,2,3]. This need is particularly felt in shipbuilding, since the steel used for hull construction is subject to corrosion in seawater and biofouling while ensuring the requirements also to operate at extremely low temperatures [4].
A suitable strategy to enhance the functional features of organic coatings entails the addition of nanomaterials such as SiO2, TiO2, ZnO, Al2O3, CaCO3, and CeO2. The incorporation of targeted nanopowders into a polymeric matrix may influence the coating performance and optimize mechanical, chemical, and optical properties[5]. Some studies reported the functional performance of nanoparticles of SiO2, Zn, and Fe2O3 as anti-corrosive agents as well as mechanical properties modifiers for epoxy [6] and silane-based sol-gel [7] coatings. The peculiar properties of nanoparticles have been utilized in the coating industry to improve the physical, mechanical, and chemical properties of organic coatings [8,9,10,11].
A great emphasis is placed on the utilization of easily available starting materials such as commercial silica gel whose high specific surface area combined with its high thermal and chemical stability allows a wide range of surface modifications. Another example of commercial nanopowder for the preparation of functional paints and coatings is titanium dioxide which emerged in the field of photocatalysis for environmental applications [12].
The demand for effective solutions to address marine biofouling challenges has driven the advancement of antifouling and anticorrosion coatings, often incorporating nanocomposite materials with biocidal agents or utilizing the fouling release mechanism [13,14,15,16]. More broadly, the development of nanocomposite materials with antimicrobial and antifouling characteristics is a widely studied area, with applications across diverse research domains, including the creation of biomedical devices, water purification systems, food packaging, and marine equipment.
It is well known the biocide action of some metal and metal oxide nanoparticles (NPs) in particular silver (Ag) NPs, copper (CuO), and zinc oxide (ZnO) [17,18]. The studies on these materials are still increasing due to their broad-spectrum antimicrobial properties. In general, they can act by the adhesion on the bacterial surface followed by the destabilization of the cell wall inducing modifications of membrane permeability or causing toxicity and oxidative stress by generation of reactive oxygen species (ROS). Recently, EuChems (www.euchems.eu) highlighted the issue of element scarcity arising from limited supplies, their locations in conflict areas, or the inability to fully recycle them. Despite their effective biocide activity, these elements are classified as a serious threat in the next 100 years (Ag and Zn) and with limited availability and future risk to supply (Cu). Concerning the cited metals, iron (Fe) belongs to those elements with a plentiful supply. Moreover, iron-based materials have shown antimicrobial features [17,19] probably acting in the form of iron cations, generating ROS and finally, leading to damage to the cell membrane. Thanks to its physical-chemical properties, its biocompatibility, and its plentiful supply, iron-based materials can result in a good candidate given the sustainability of the material design. Materials, containing quaternary ammonium salts [20] and ─NH2 moieties, have also shown their antibacterial activity against a variety of microorganisms (as for Staphylococcus aureus, Escherichia coli, Candida albicans) [21,22,23]. Recently, some of us have described the excellent antibacterial properties of aminopropyl waste cellulose-derived materials [24,25]. In these studies cellulose and lignocellulose supports were functionalized with (3-aminopropyl)triethoxysilane (APTES) in sustainable reaction conditions. The antibacterial activity against Gram-positives and Gram-negatives was, then, evaluated both in batch [24] and in continuous flow [25] showing a high bacteria removal (93-100%).
Considering these premises, in this work, we prepared two hybrid materials based on commercial SiO2 and TiO2 which were modified with amino groups through the grafting of APTES on the surface of the nanopowders. The obtained samples (named SiO2-NH2 and TiO2-NH2) were used as solid supports for the immobilization of iron species stabilized through the interaction with -NH2 sites. The final materials (named SiO2-NH2-Fe and TiO2-NH2-Fe) were, then, characterized and employed for the preparation of paint formulations which were applied on the surface of metal prototypes.
The surface properties of the resulting coatings, deposited on DH 36 steel plates, were evaluated through the determination of thickness, water wettability, roughness, and cross-cut adhesion tests. The antimicrobial activity of the iron-amino-functionalized materials was also tested, as proof of concept, on the growth of some bacterial strains.
2. Materials and Methods
2.1. Materials and Paint Formulation Synthetic Procedures
Plates of DH36 high strength structural steel, conforming to the ASTM standard or to the equivalent grade ABS DH36, were selected as the substrate for depositing and testing the coatings.
The chemical composition limits, according to ASTM A131/A131M—19 Designation [26], are shown in Table 1.
Silica or titania were functionalized with aminopropyl groups adopting a grafting method. In a typical procedure, a mixture of 1.00 g of calcined silica or titania in 15.0 mL of absolute ethanol and 1.00 mL of 3-aminopropyl triethoxysilane (APTES) was refluxed overnight. The materials were filtered in vacuo, washed with ethanol, and dried overnight at 120 °C. Iron (5% w/w) was supported by a wet impregnation procedure. In a typical procedure, iron nitrate nonahydrate (Fe(NO3)3·9H2O, 543 mg) was dissolved in 10 ml of water and added to aminopropyl silica or titania (1.5 g). The mixture was stirred overnight at room temperature, then it was filtered and washed with water.
The preparation of paint forPlates of DH36 high-strength structural steel, conforming to ASTM standards or the equivalent grade ABS DH36, were selected as the substrate for depositing and testing the coatings.mulation was carried out by mixing the Fe-based powder into a commercially available two-component polyamine cured pure epoxy coating (Safeguard Universal ES, Jotun “tie-coat”). Component A (6 g, Safeguard Universal ES Comp. A), component B (1.2 g, Safeguard Universal ES Comp. B), the diluent (0.36 g, Thinner n° 17) and SiO2-NH2-Fe or TiO2-NH2-Fe solid (75.6 mg) were mechanically mixed into a PP vessel by using a flat brush until a homogeneous paint was obtained. The so-obtained SiO2- or TiO2-based formulations were deposited on the surface of a metal plate (stainless steel DH36 150x75 mm, thickness 5 mm) with a flat brush. The day before the application of Fe-based formulation, a pristine metal specimen, bearing a primer coating, was treated with a tie coat paint as the basic surface (Jotun, Sandefjord, Norway) and dried overnight at room temperature.
Table 2 lists the four types of materials used in this study, with the code, description, and details.
Figure 1 (a-d) shows the four coatings of this study after the deposition on the stainless steel DH36 plate (geometry of 150x75 mm, thickness 5 mm). Each coated stainless-steel plate was marked with a pencil that marked the various points to create an internal grid (14cm x 6cm). Thickness measurements were taken on these grid points to create a mapping extended to the entire sample (see Figure 1e and see the maps in Figure 6 that will be discussed in Section 3).
2.2. Chemical Characterization
The textural properties of the materials were examined with a Micromeritics ASAP2020 Plus 1.03 (Micromeritics, Ottawa, Canada). The specific surface areas of the samples were evaluated through the analysis of the N2 adsorption isotherm at 77 K by using the BET method in the standard pressure range of 0.05–0.3 p/p0. The total pore volume, Vp, was calculated from the amount of nitrogen adsorbed at a relative pressure of 0.998, whereas mesopore size distribution values and mesopore volumes were estimated by applying the BJH model in the range of p/p0 of 0.1–0.98.
The thermogravimetric analysis of the samples was carried out in air using the TGA 1 Star System of Mettler Toledo (Mettler Toledo, Schwerzenbach, Switzerland). About 10 mg of sample was heated from room temperature to 100 °C, left at this temperature for 30 min, and then heated to 1000 °C at a rate of 10 °C/min in 40 mL/min of air.
The X-ray photoelectron spectroscopy (XPS) analyses were performed with a VG Microtech ESCA 3000 Multilab, equipped with a dual Mg/Al anode. Unmonochromatic Al Ka radiation (1486.6 eV) was used as the excitation source. The sample powders were mounted on a double-sided adhesive tape. The pressure in the analysis chamber was in the range of 10–8 Torr during data collection. The constant charging of the samples was removed by referencing all the energies to the C 1 s binding energy set at 285.1 eV. Analyses of the peaks were performed with the CasaXPS software.
2.3. Physical-Mechanical Characterization
The four coatings were physically and mechanically characterized by thickness evaluation, wettability tests, and cross-section tests (adhesion strength evaluation before, at t= 0 days, and after, t=30 days, a period of immersion in seawater).
To measure the thickness of metal specimens deposited with coatings, a digital thickness gauge SA-MA Tools SA8850 (SAMA Italia, Viareggio, Italy) was utilized. A grid was created on the metal specimen to acquire, at the intersection points, the different thickness values for the entirety of the specimen. Thickness measurements were taken at each grid point by positioning the probe perpendicular to the specimen. The average of all the measurements was subsequently calculated (Figure 2e).
The measurements of surface roughness were carried out using the portable and compact Surftest SJ-210 Series 178 roughness tester (Mitutoyo S.r.l., Milan, Italy), according to Equation:
where Ra denotes the arithmetic mean of the absolute values of the deviations of the evaluation profile (Yi) from the mean line. The data presented are the average values from nine measurements for each type of sample.
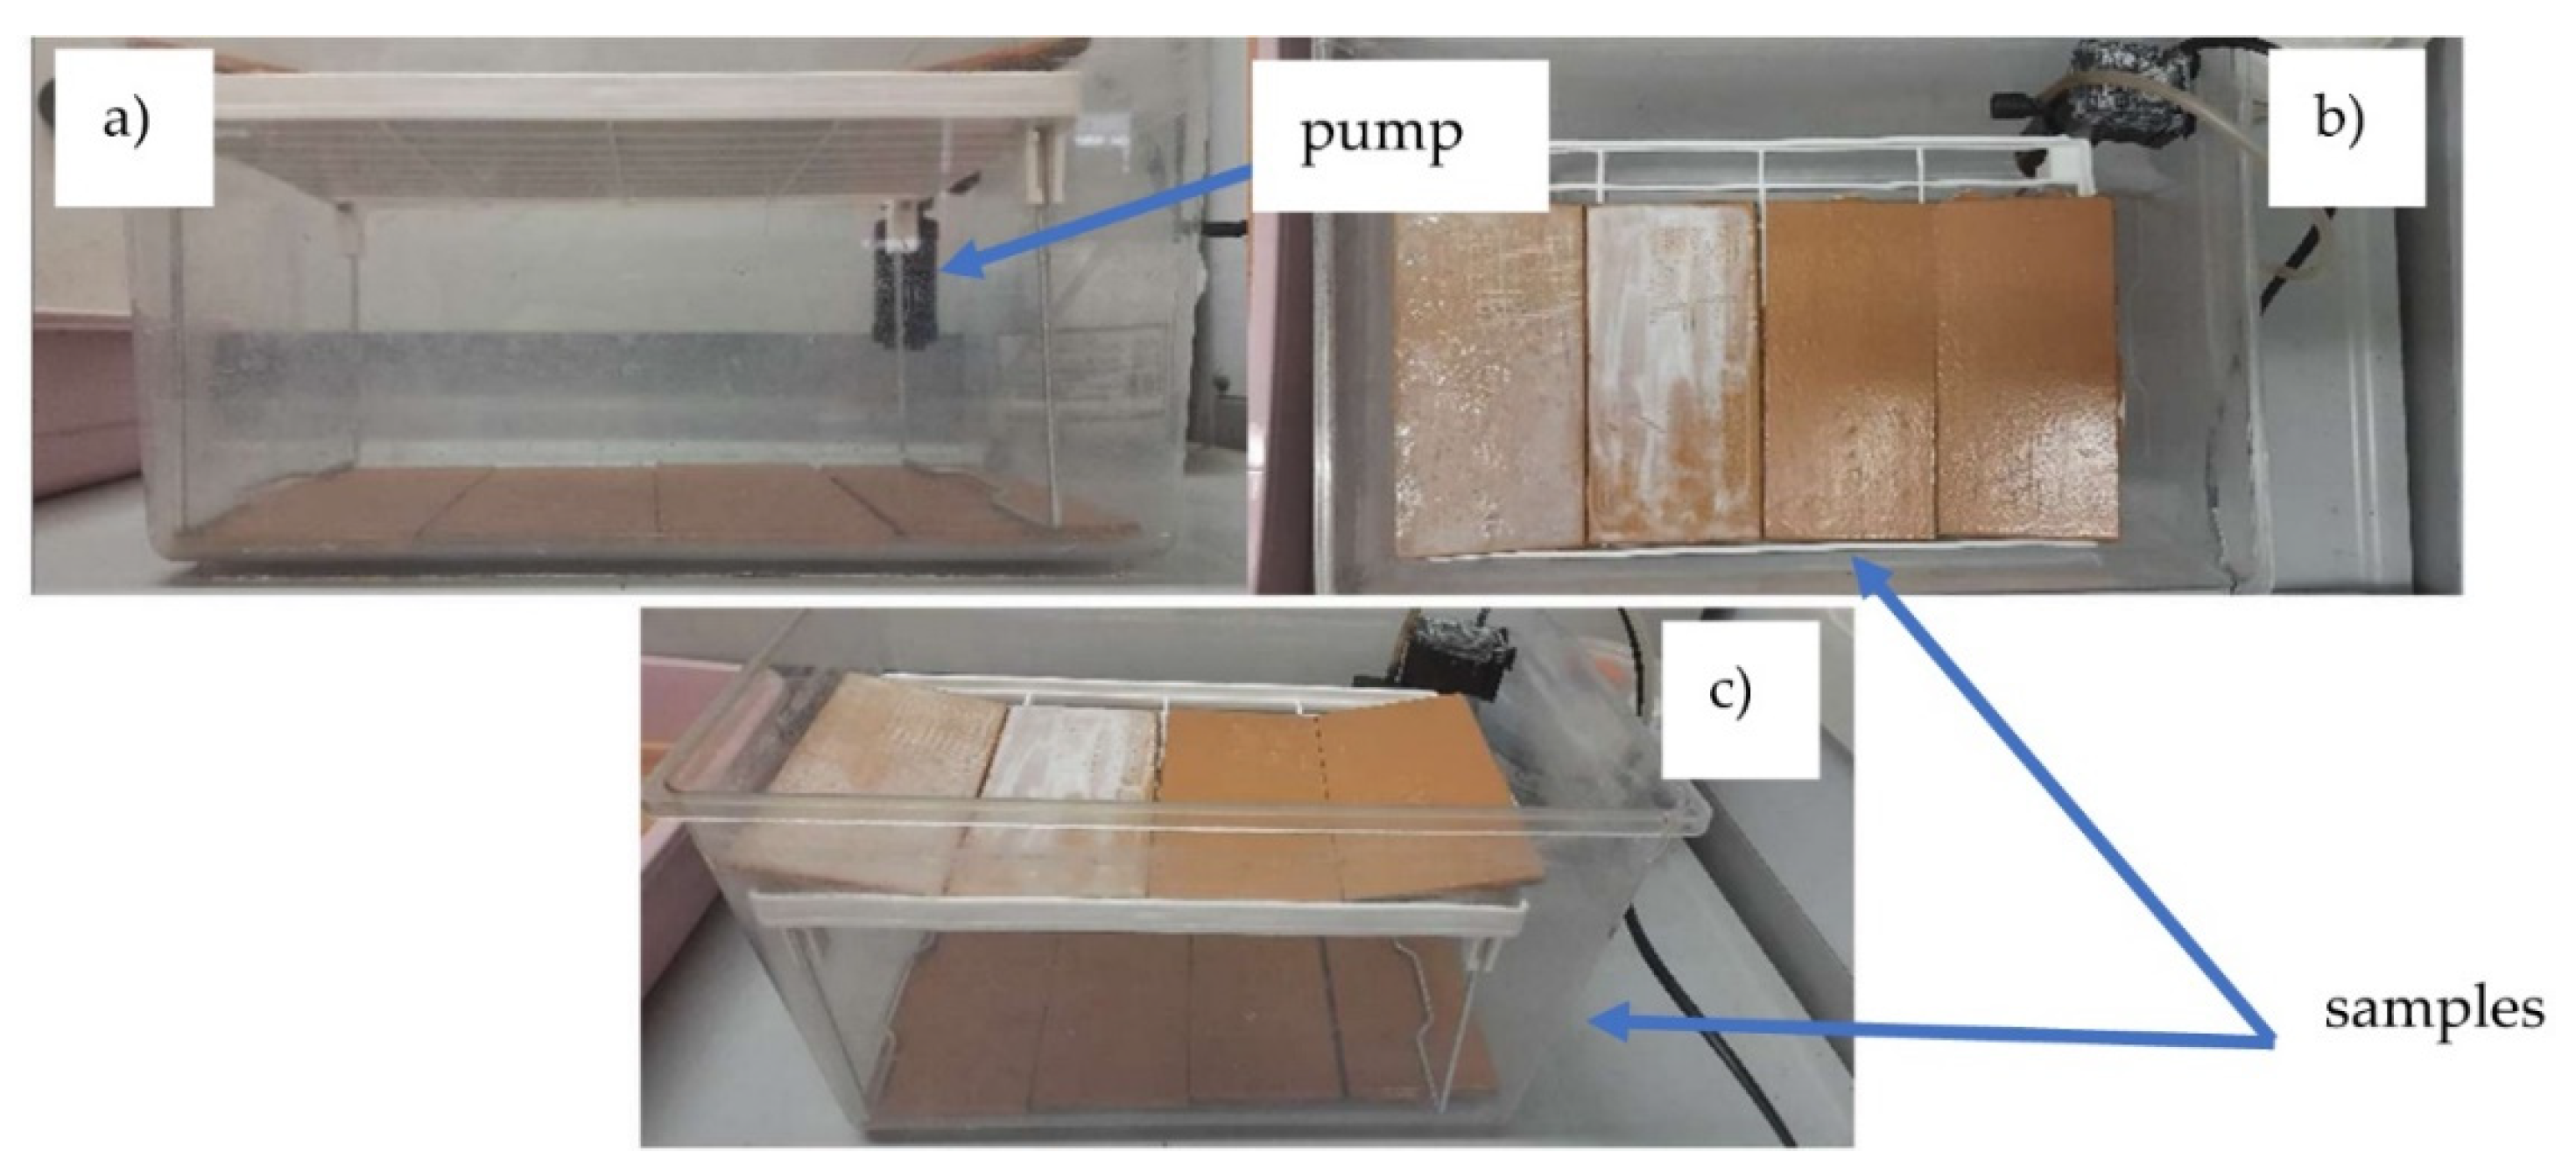
Figure 2.
Different views of the set-up for the measurement of the resistance to seawater of the coatings deposited on stainless steel plate samples and fully immersed in seawater: low side (a), top (b), high side (c).
Figure 2.
Different views of the set-up for the measurement of the resistance to seawater of the coatings deposited on stainless steel plate samples and fully immersed in seawater: low side (a), top (b), high side (c).
The Wenzel contact angle (θw) and of Young (θy, not dependent on the roughness) were assessed using the θ/2 method (prototype instrument—Engineering Department, Messina University) by measuring the contact angle of a 1 μL drop of deionized water placed on the horizontal surface of the sample, in accordance with ASTM D7334 [27] and Equation:
where (d) is the diameter (in mm) and (h) is the height (in mm) of the drop. The data presented are the average values obtained from ten measurements for each sample [28].
The adhesion resistance of antifouling coatings was evaluated in seawater in accordance with ASTM D870-97 standards. The samples were placed in aquarium tanks, completely submerged in seawater. To replicate the movement of seawater, a submerged aquarium pump with a filter was utilized to ensure constant water recirculation over the surfaces. The water temperature was maintained at 24°C, while the ambient temperature was kept at 23°C. The seawater was refreshed every two weeks (Figure 2).
The samples were subsequently examined for potential bubble formation, softening, and loss of adhesion using the crosshatch test (Cross Hatch Adhesion Tester by Sama Tools—SADT502-5) before and after immersion in seawater after 1 month.
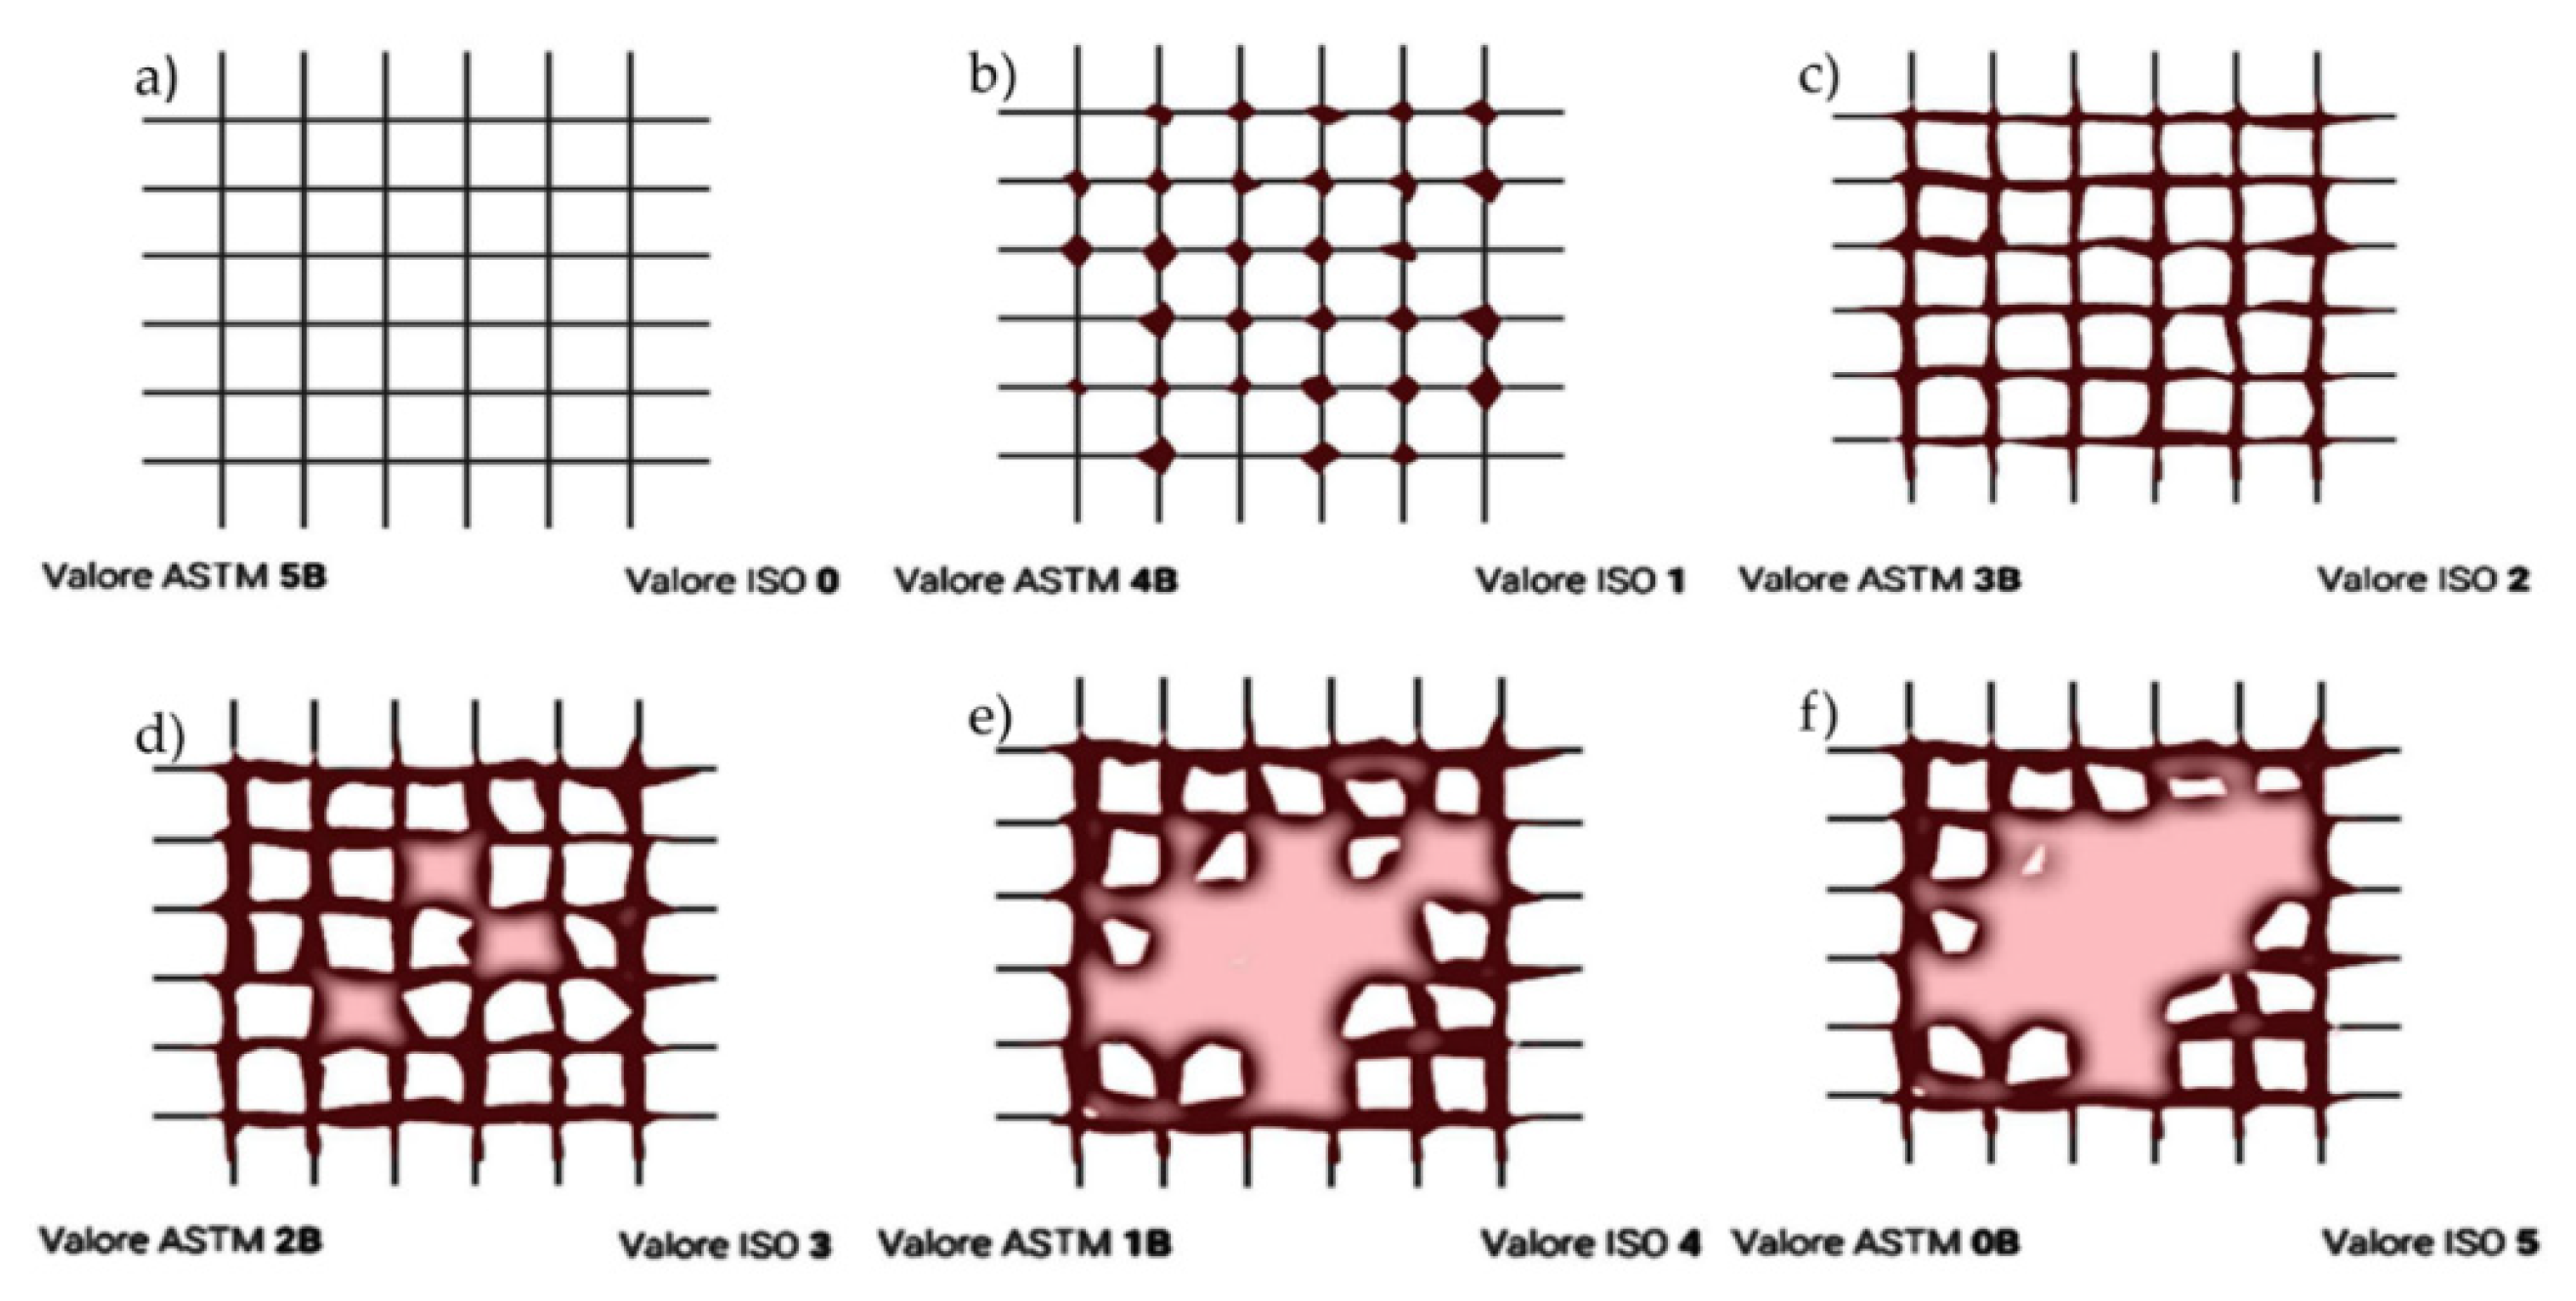
This method employs a suitable cutting tool with a blade space of 2 mm (for coatings between 60-120 microns) to score the coating down to the substrate. Specifically, on a 15x15 cm substrate, two cuts are made that intersect at 90 degrees, creating a grid pattern with four intersections on the substrate. The cross-hatched area is then examined for any adhesion issues. The relevant standards for this test are D 3359-09e2 and ISO 2409:2007.
Figure 3.
ASTM/ISO standards: 5B/0 (a), 4B/1 (b), 3B/2 (c), 2B/3 (d), 1B/4 (e), 0B/5 (f) detachment types.
Figure 3.
ASTM/ISO standards: 5B/0 (a), 4B/1 (b), 3B/2 (c), 2B/3 (d), 1B/4 (e), 0B/5 (f) detachment types.
2.4. Microtox Assay
Microtox® toxicity test was carried out on SiO2-NH2-Fe and TiO2-NH2-Fe materials. The Microtox® toxicity tests have been conducted using the luminescent bacterium Vibrio fisheri according to the standard procedures of the EN12457 protocol with the following modifications. Values of bioluminescence inhibition (indirect index of toxicity values) were reported as the effective concentrations (100 mg L-1) of toxicants resulting in a 50% decrease in bioluminescence (EC50). EC50 with 95% confidence intervals was calculated, after 15 and 30 minutes of exposition, following the procedures outlined in the Microtox® System Operating Manual (Microtox, Columbus, Ohio, 2003). Each biocidal sample has been compared with a reference un-toxicity matrix.
2.5. Bacteria, Culture Conditions, and Microbiological Tests
Microbial strains: three bacterial strains Pseudoalteromonas sp., Alteromonas sp., and Pseudomonas sp. were used in this study. Both strains were isolated from the marine environment and maintained in the culture collection of the Institute of Biological Resources and Marine Biotechnology (IRBIM)-CNR of Messina (Italy).
Microbial preparation: starter cultures were carried out by inoculating microbial cells into 10 mL of Marine Broth (MB; Difco, Milan) mineral medium. Cultures were grown in a rotary shaker (New Brunswick C24KC, Edison NJ, USA; 150 rpm) at 20± 1 °C for 5 days. Mid-exponential-phase grown cells were harvested by centrifugation at 10.000× g for 10 min, washed twice with sterile MB, and inoculated into different 100 mL sterile Erlenmeyer flasks each containing 50 mL of Marine Broth.
Evaluation of the biocidal activity of the new functionalized coatings: mid-exponential-phase grown cells were harvested a second time as previously described and inoculated at a final concentration of 0.1 of optical density (OD600nm) in a sterile medium added with 100 mg L-1 of SiO2-NH2-Fe and TiO2-NH2-Fe materials. The cultures were incubated at 20 ± 1 °C, for 9 days, with shaking (150 ×g, New Brunswick C24KC, Edison NJ, USA). All experiments were carried out in triplicate. At the beginning of experimentation and regular intervals (3 days), the growth (biomass variations) of the cultures in the study was routinely assessed indirectly by measuring the turbidity (OD600nm) using a UV–visible spectrophotometer (Shimadzu UV-160, Markham, ON, Canada).
3. Results and Discussion
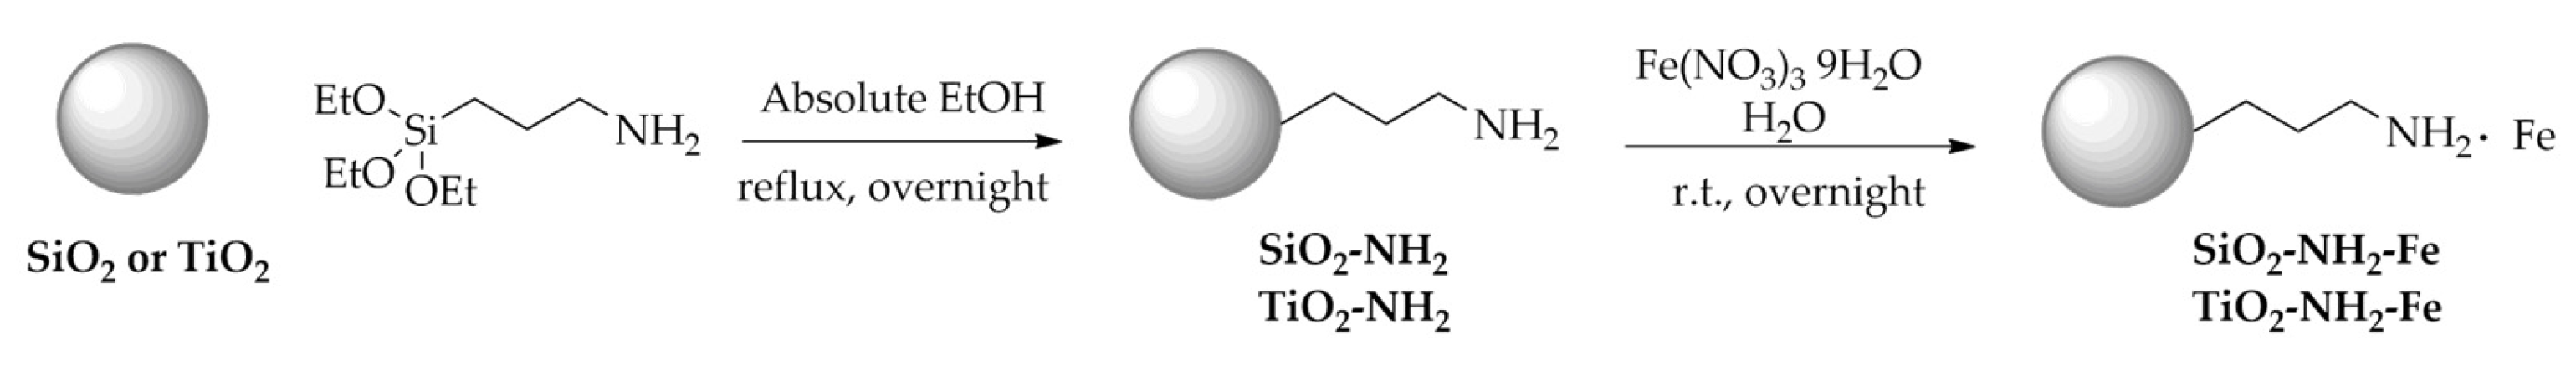
The synthesis of Fe-based powders, as reported in Scheme 1, was carried out through the covalent grafting of (3-aminopropyl)triethoxysilane (APTES) on the surface of commercial SiO2 or TiO2 in ethanol. The obtained hybrid materials SiO2-NH2 and TiO2-NH2 were used as supports for the immobilization of iron sites which was performed by a wet impregnation procedure using Fe(NO3)3·9H2O as metal precursor. The final solids were labeled as SiO2-NH2-Fe and TiO2-NH2-Fe.
Scheme 1.
Synthesis of SiO2-NH2-Fe and TiO2-NH2-Fe.
Thermogravimetric analysis (TGA) of SiO2-NH2-Fe and TiO2-NH2-Fe showed, in both cases, good thermal stability at 180 °C.
Figure 4.
(a) TGA profiles of SiO2-NH2-Fe and TiO2-NH2-Fe.
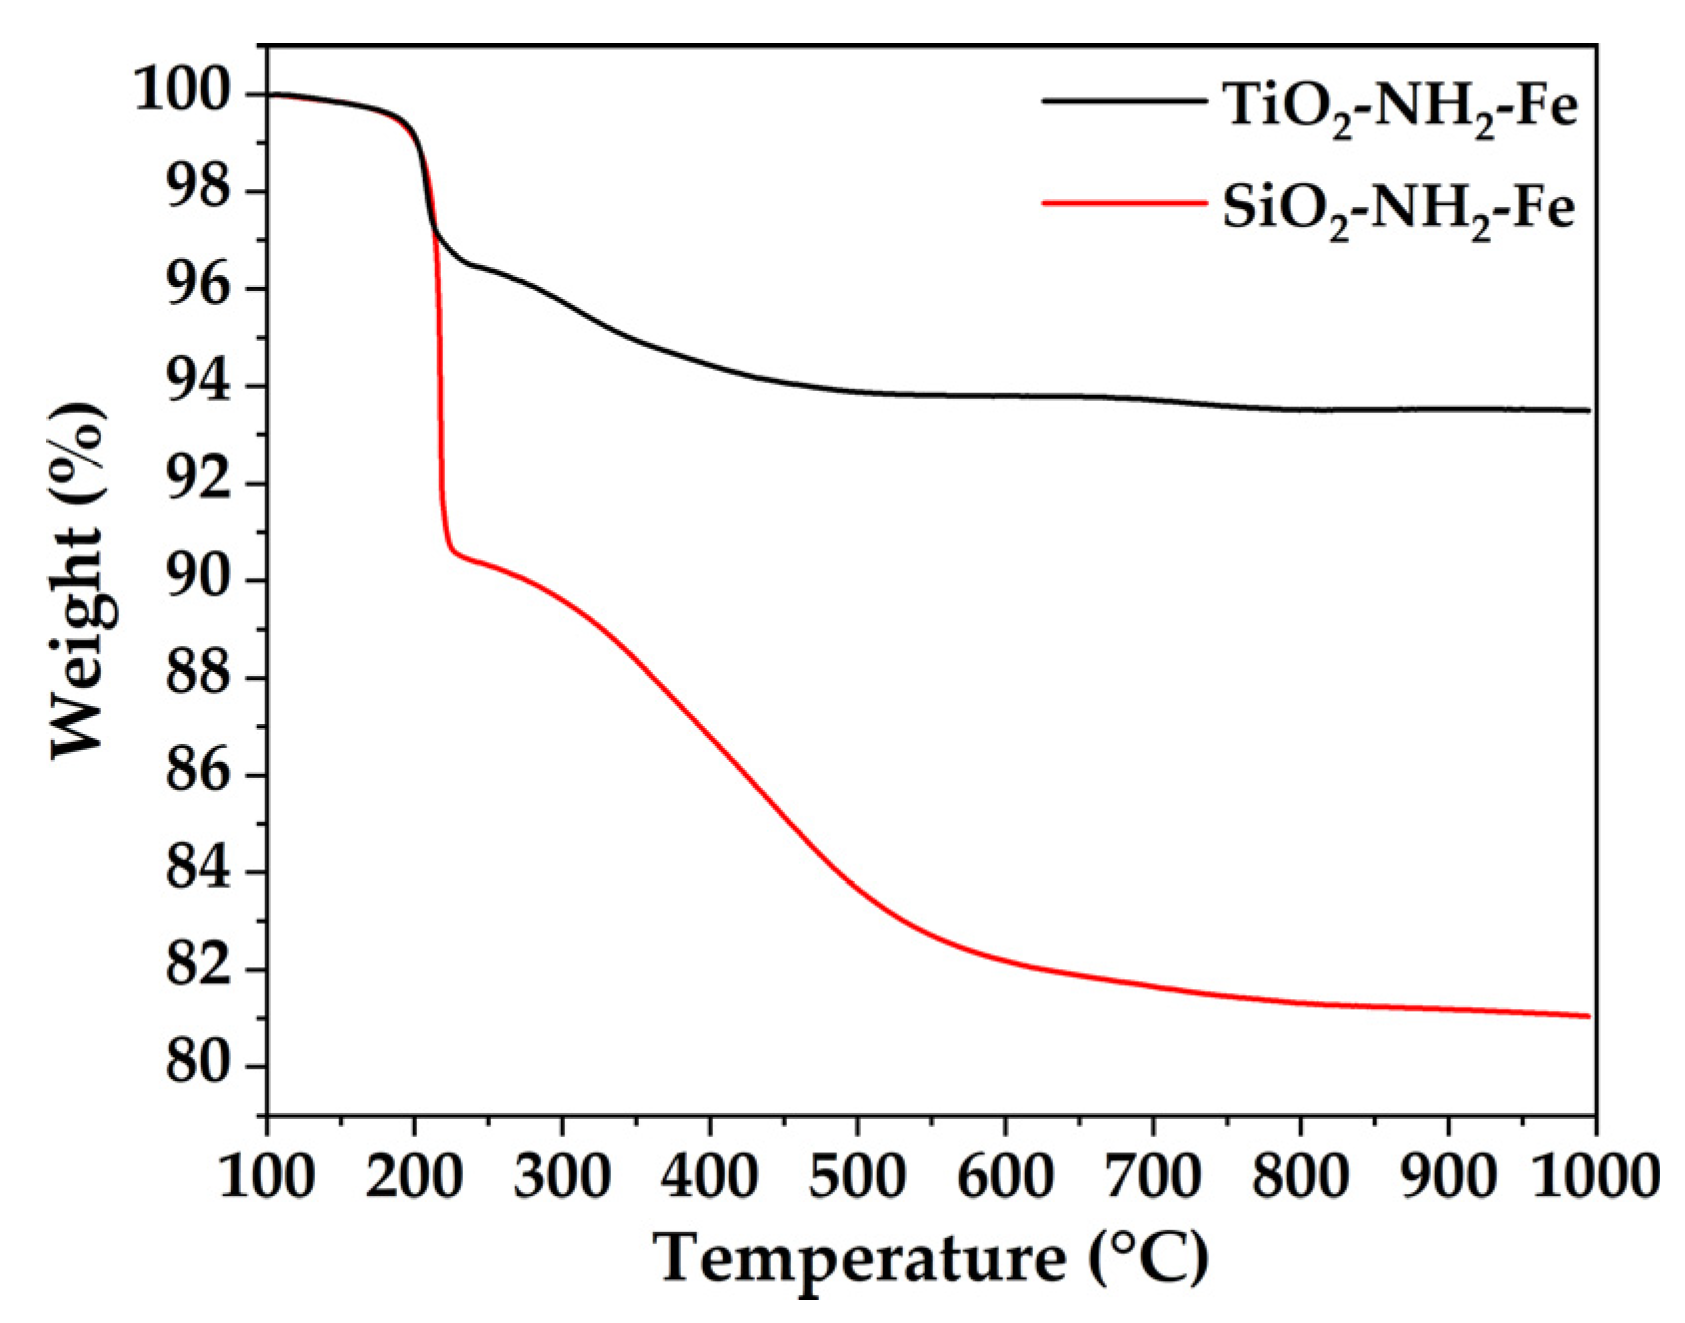
The higher organic loading of SiO2-NH2-Fe can be ascribed to the specific surface area of pristine SiO2 (SSABET 545 m2/g) when compared to bare TiO2 (SSABET 56 m2/g). The specific surface area value of silica implies a good -OH availability that is pivotal for the condensation of APTES functional groups. N2 physisorption measurements were carried out on SiO2-NH2 (SSABET 208 m2/g), SiO2-NH2-Fe (SSABET 190 m2/g), TiO2-NH2 (SSABET 59 m2/g and TiO2-NH2-Fe (SSABET 48 m2/g).
Figure 5.
N2 adsorption-desorption isotherms of SiO2-NH2-Fe, SiO2-NH2-Fe, TiO2-NH2 and TiO2-NH2-Fe.

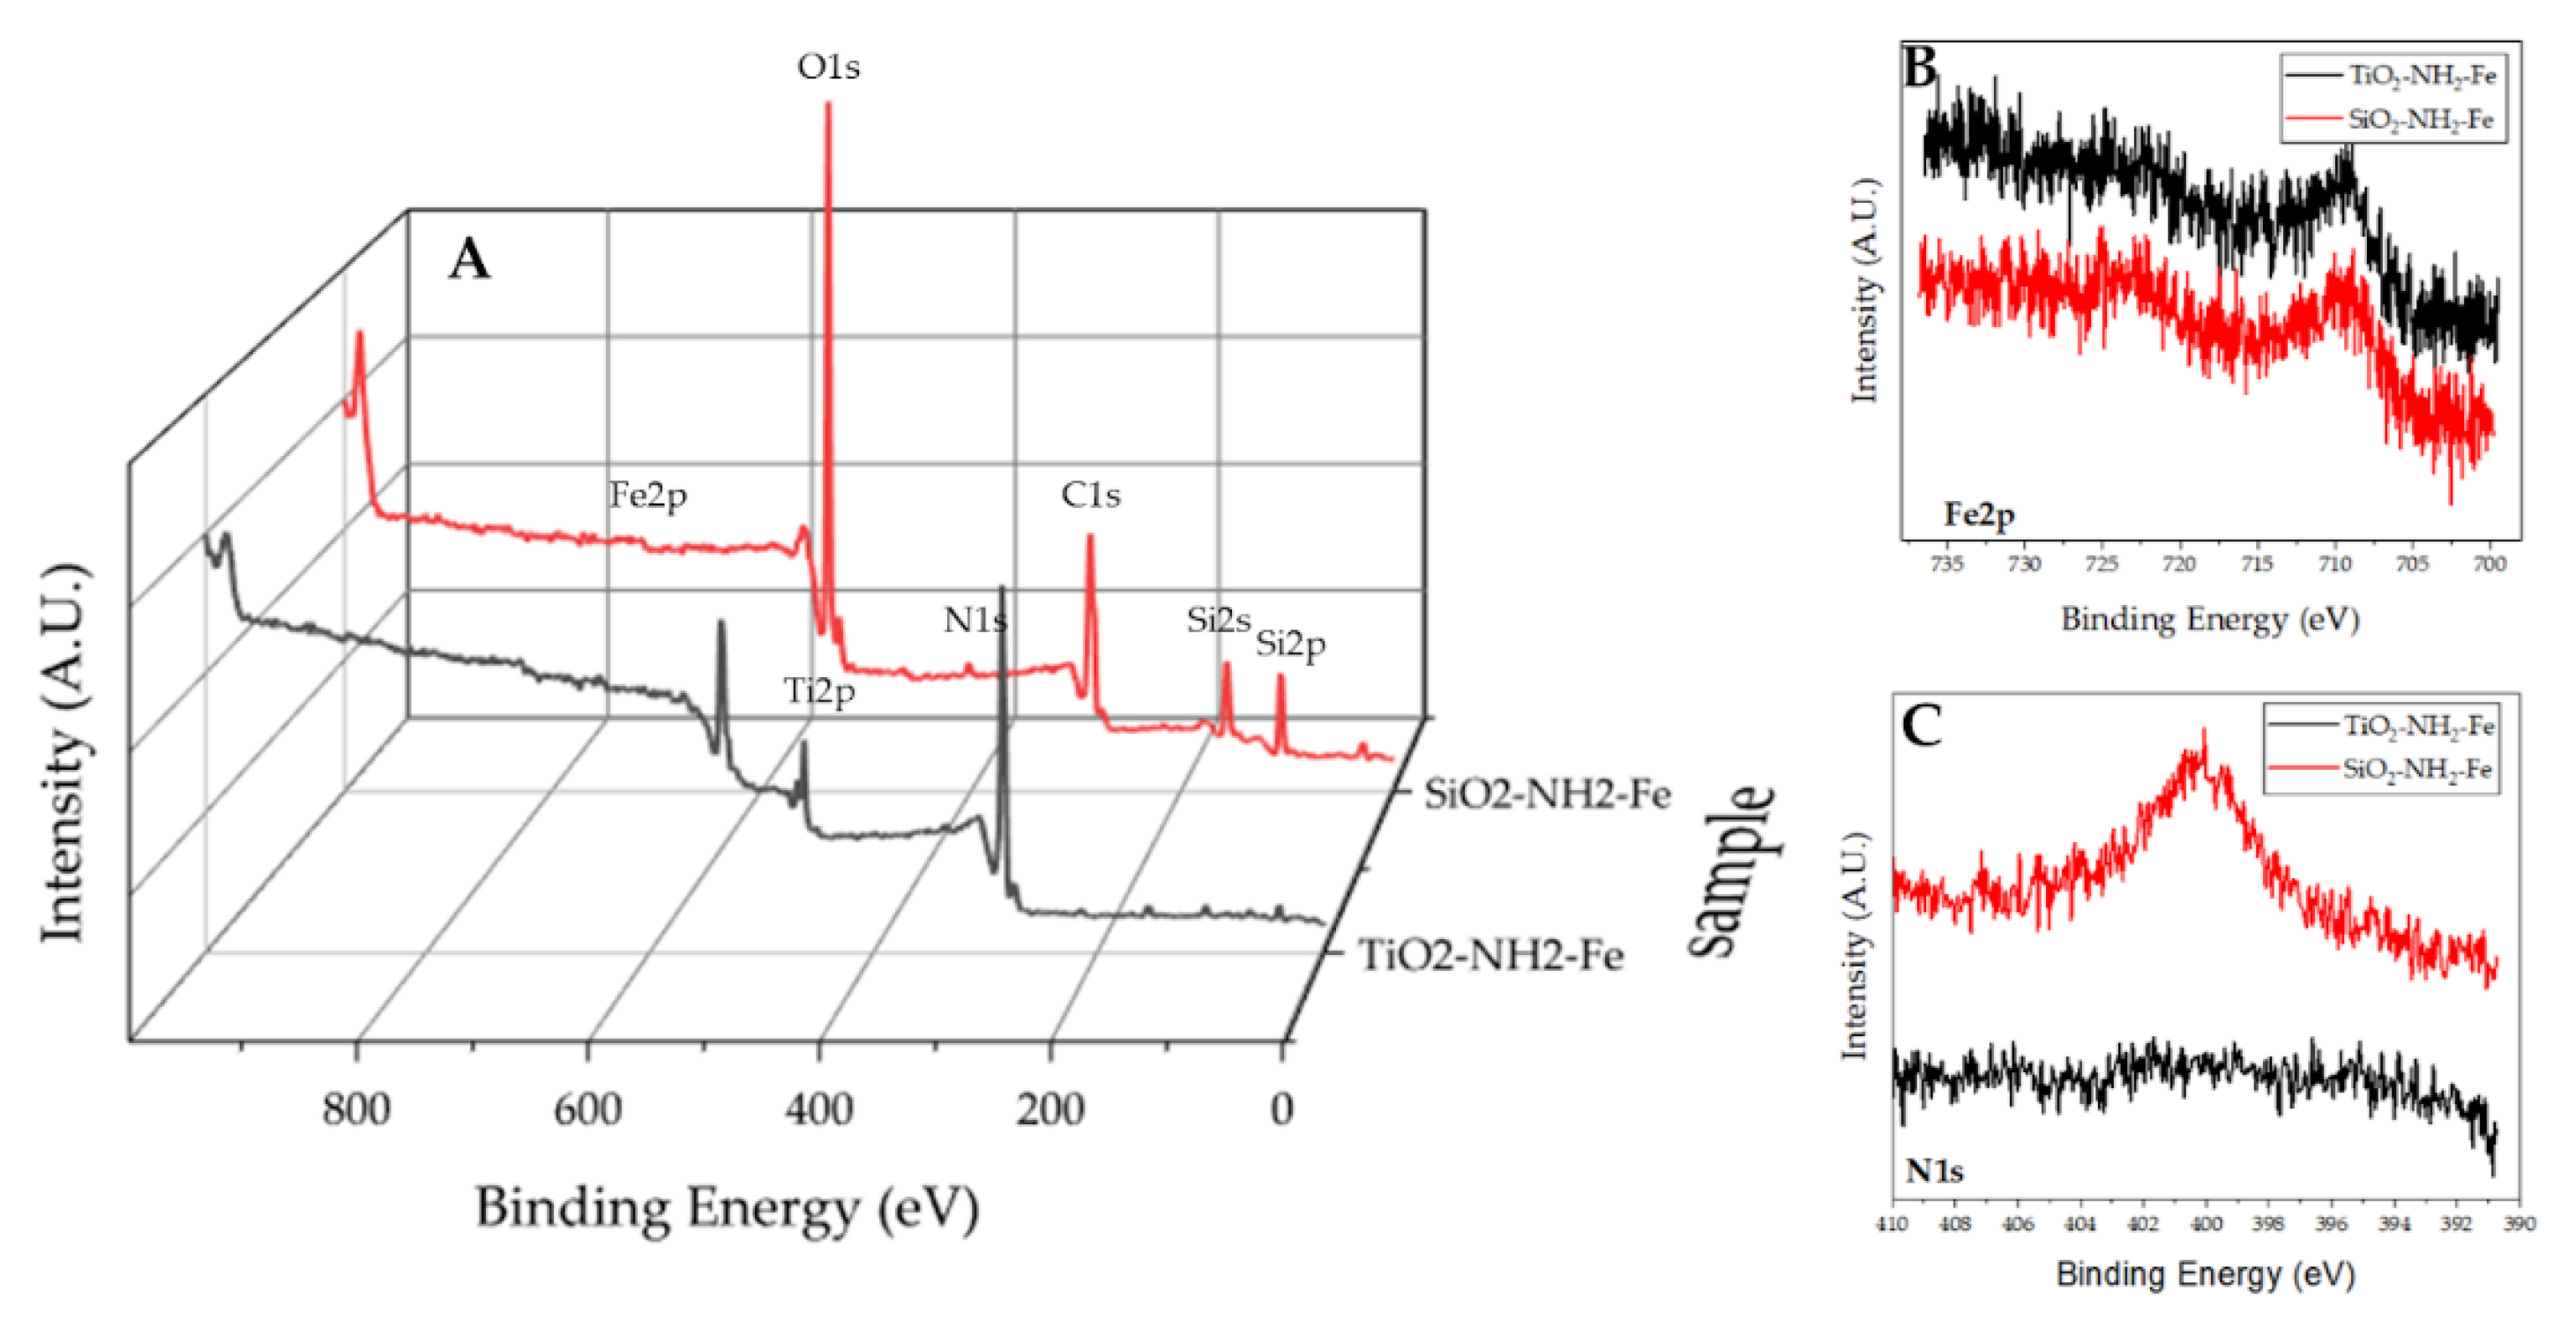
XPS analysis has been done to analyze the surface of the synthesized additives. The survey spectra (see Figure 6 A) show for both materials the peaks due to the bare supports. In addition, for SiO2-NH2-Fe it is possible to appreciate the N1s peak due to the presence of the propylNH2 functionalization. The presence of Fe is not evidenced in the survey spectra. In order to better analyze the materials, the single regions (Fe2p and N1s) were recorded and the results are shown in Figure 6 B and C respectively. The presence of iron is confirmed by the presence of the characteristic Fe2p doublet in both materials. The low intensity of the peaks and the natural complexity of the Fe2p emission [29] make it difficult to evaluate the oxidation state of iron, anyway, the position and the shape of the profile are consistent with the iron in the +3 oxidation state. The analysis of the N1s region, showing the presence of a peak at 399.8 eV typical of the amino group [25], confirms that the surface of SiO2-NH2-Fe has been functionalized. On the contrary, the absence of a visible N1s-related peak in the TiO2-NH2-Fe scan indicates that in this sample the functionalization was less effective.
Figure 6.
XPS spectra of SiO2-NH2-Fe and TiO2-NH2-Fe. A survey spectra; B Fe2p region and C N1s region.
Figure 6.
XPS spectra of SiO2-NH2-Fe and TiO2-NH2-Fe. A survey spectra; B Fe2p region and C N1s region.
Regarding the ecotoxicological assays, Microtox tests show that SiO2-NH2-Fe and TiO2-NH2-Fe samples do not cause significant bioluminescence decay in Vibrio fischeri (Table 3). In the EN12457 protocol, the Microtox® bioluminescent assay assessed in water typically shows an underestimated sensitivity to highly hydrophobic chemicals. This is primarily because these compounds have extremely low solubility in water and almost irreversible adsorption to a matrix like sediments.

Table 3.
Measurement of Microtox® toxicity on SiO2-NH2-Fe and TiO2-NH2-Fe materials.
| Sample | Concentration (mg L-1) | Matrix | EC50 mg L-1 (15′) |
EC50 mg L-1 (30′) |
|---|---|---|---|---|
| SiO2-NH2-Fe | 100 | Powder | >100 | >100 |
| TiO2-NH2-Fe | 100 | Powder | >100 | >100 |
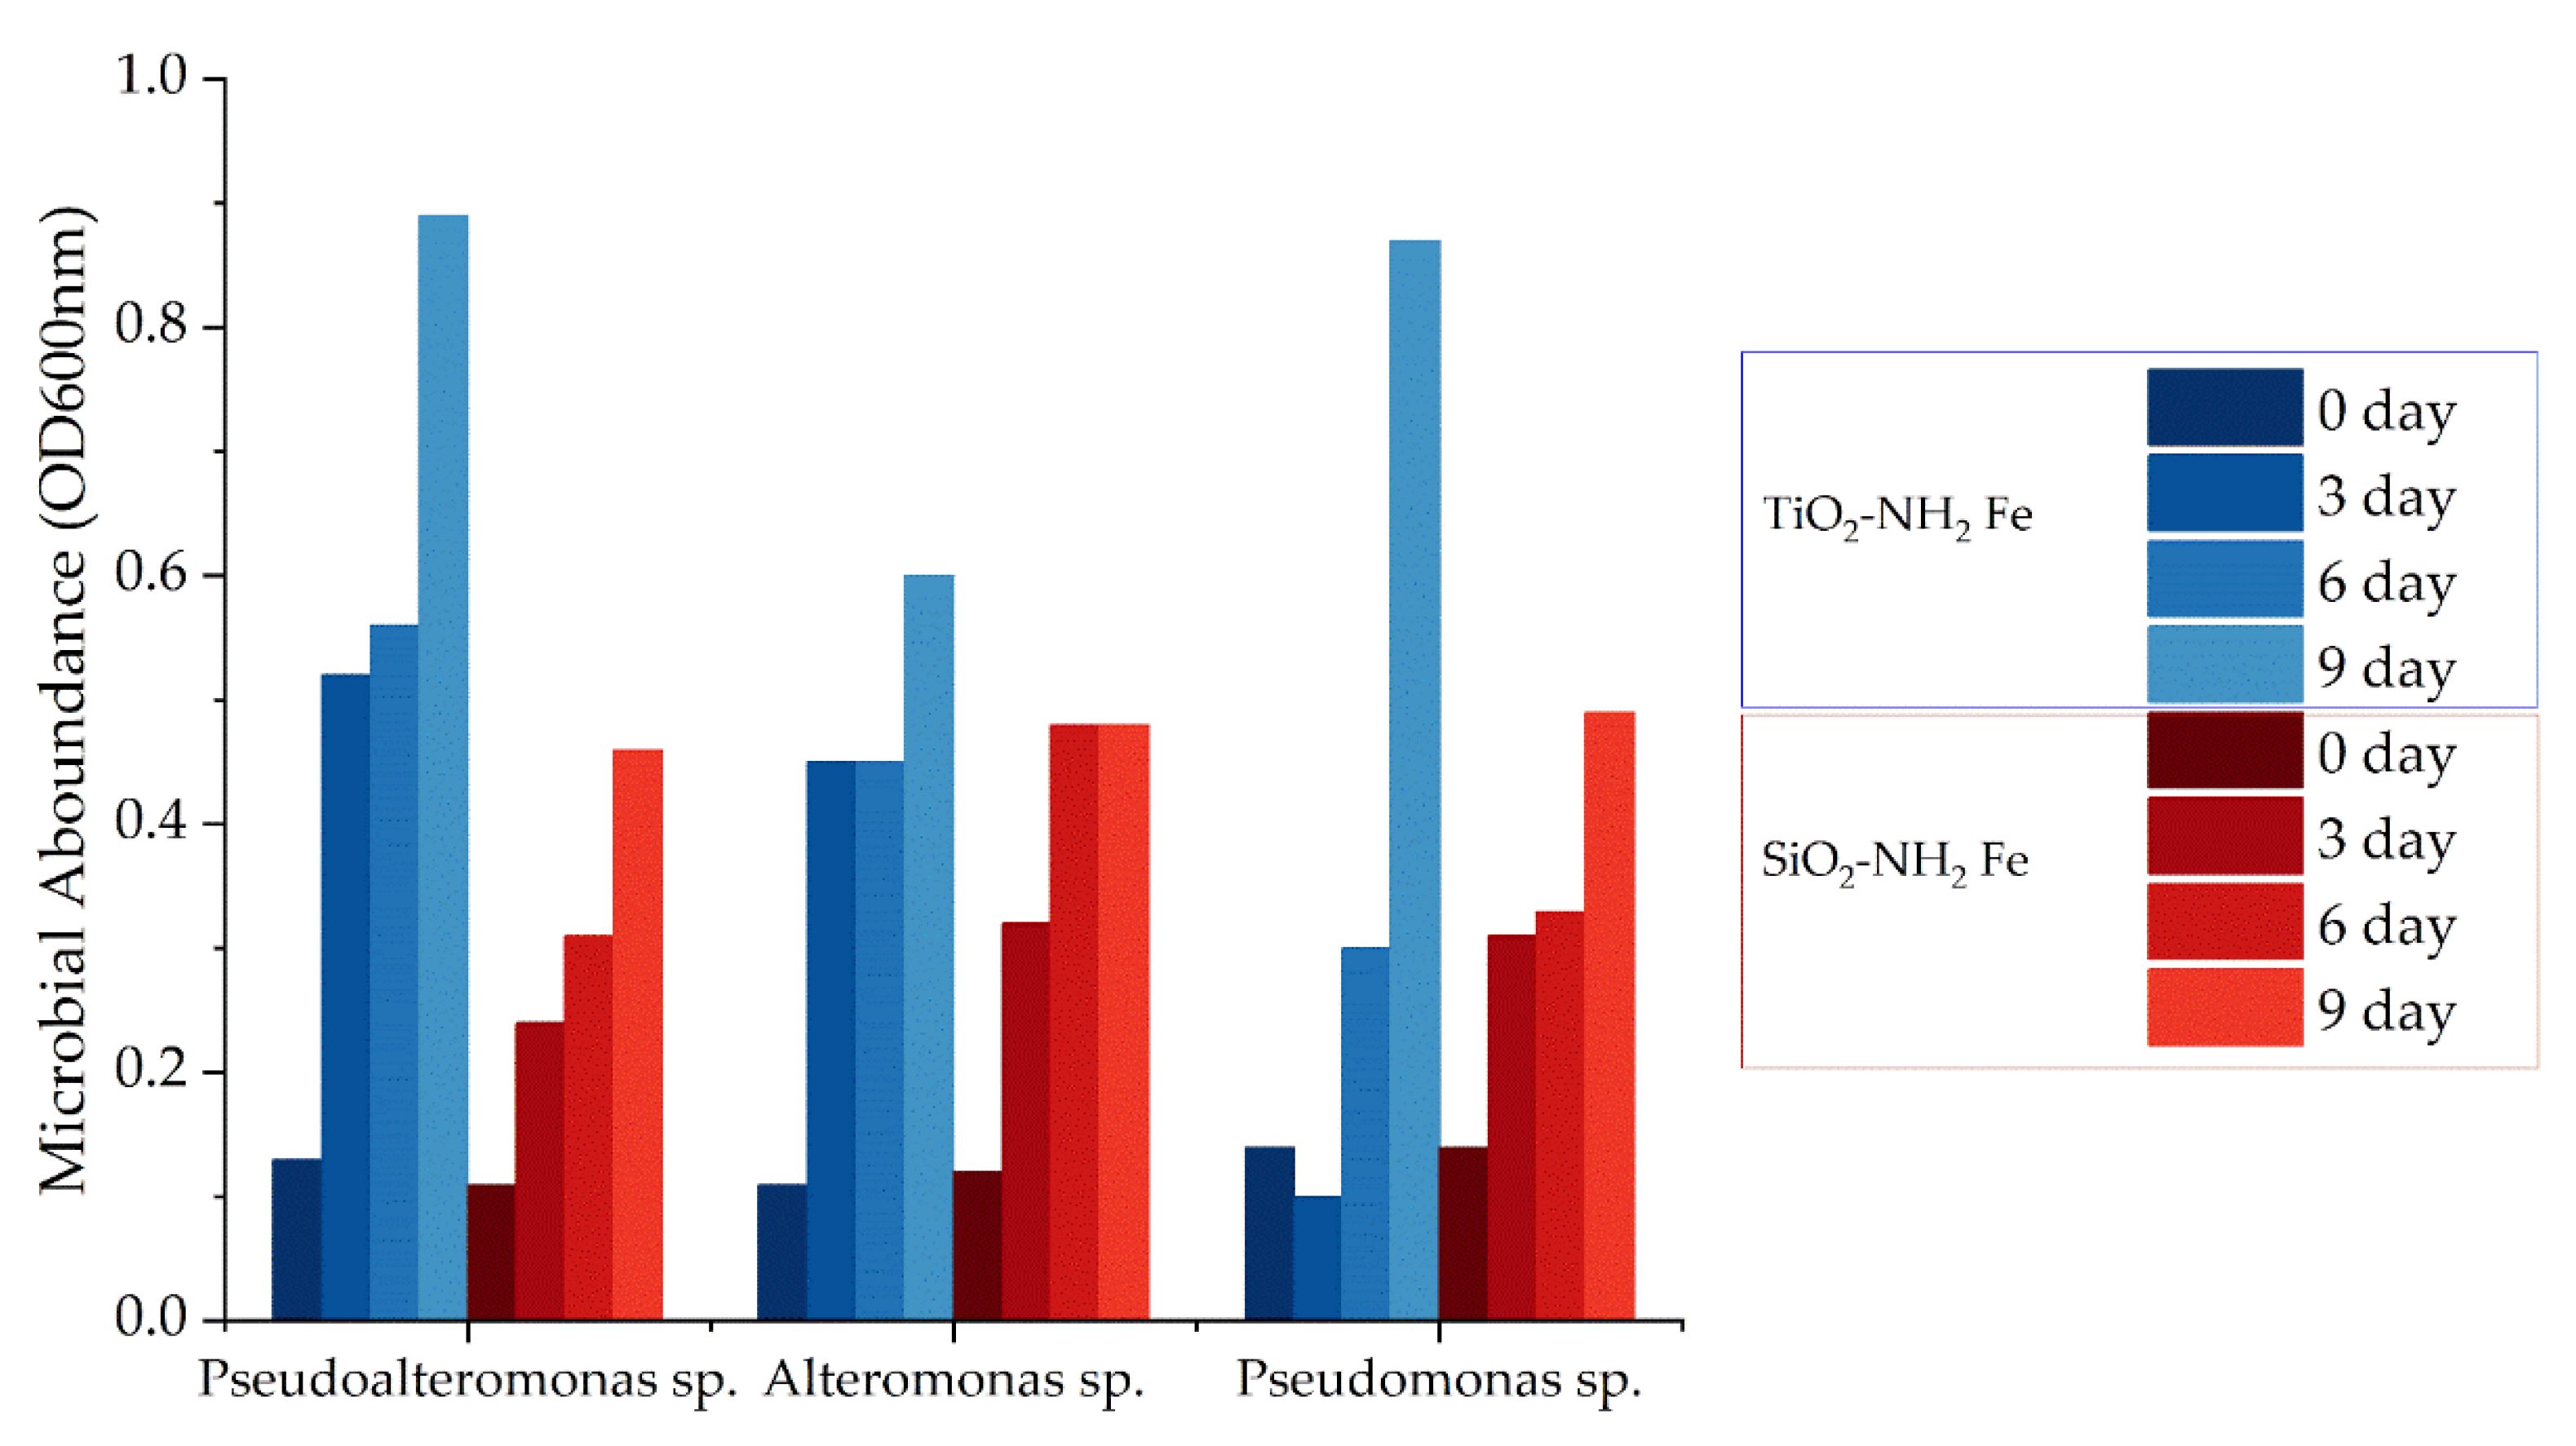
The growth curves of the bacterial strains were monitored by measuring the optical density (OD) at 600 nm in the presence of two matrices: SiO2-NH2-Fe and TiO2-NH2-Fe. Measurements were taken over 9 days, with assessments every 3 days.
Strains grown with SiO2-NH2-Fe showed similar growth patterns initially, with the Alteromonas sp. strain peaking at day 6 before stabilizing. Pseudoalteromonas sp. also followed this trend by day 9, while Pseudomonas sp. exhibited the highest growth at the end. In contrast, the TiO2-NH2-Fe environment yielded higher growth for both Pseudoalteromonas and Pseudomonas strains. Pseudoalteromonas sp. reached values of 0.5 to 0.6 at days 3 and 6, then increased to about 0.9 by day 9. Pseudomonas sp. showed fluctuating growth initially but also increased to approximately 0.9 at day 9. The Alteromonas strain grew from 0.1 at day 0 to 0.6 at day 9.
In summary, bacterial strains demonstrated better growth in the TiO2-NH2-Fe suspension compared to SiO2-NH2-Fe.
Figure 7.
Growth of bacterial strains, measured as optical density (OD600nm), in the presence of SiO2-NH2-Fe and TiO2-NH2-Fe.
Figure 7.
Growth of bacterial strains, measured as optical density (OD600nm), in the presence of SiO2-NH2-Fe and TiO2-NH2-Fe.
Functional additives were mechanically dispersed in a commercial tie-coat to be applied on the surface of metal prototype plates by using a flat brush, according to the description of section 4 materials and methods.
The average thickness value is listed in Table 4. The value of the commercial tie-coat and topcoat was 498 microns and 515 microns, respectively. As expected, the thickness value improved after the addition of the two topcoats (653 microns (Si-Top) and 674 microns (Ti-Top)).
Table 4.
Thickness, roughness, wettability, and adhesion power of all coatings.
| sample code |
Thickness [μm] |
Wenzel/ Roughness/Young contact angle |
Crosscut Test ASTM D 3359-09e2/ ISO2409:2007 |
|||
|---|---|---|---|---|---|---|
| θw [°] | Ra [μm] | θy [°/μm] | (t=0 days) | (t=30 days) | ||
| C-Tie | 498±96 | 93.47 ± 1.62 | 1.20 ± 0.04 | 92.89 ± 1.62 | 5B/0 | 4B/1 |
| C-Top | 515±52 | 73.04 ± 0.73 | 5.78 ± 1.47 | 87.11 ± 0.73 | 5B/0 | 2B/3 |
| Si-Top | 653±73 | 91.65 ± 1.58 | 1.21 ± 0.06 | 91.36 ± 1.58 | 5B/0 | 4B/1 |
| Ti-Top | 674±64 | 96.37 ± 1.75 | 1.30 ± 0.05 | 94.90 ± 1.75 | 4B/1 | 3B/2 |
Figure 8 shows the thickness distribution map calculated on the 6 cm x 14 cm surface of the metal plate shown in Figure 8.
Generally, all the maps reveal a thickness distribution that is not always homogeneous. There is a greater inhomogeneity in the Si-Top compared to the other topcoats. This is due to the manual deposition of the coatings.
Table 4 summarizes the roughness Ra values of the coatings. Figure 9 shows that the C-Top coating is much rougher (Ra=5.78 μm) than the other substrates.
From the graph below and the values detailed in Table 4 it can be seen how the contact angle θw (°) and θy (°/μm) of the coatings, except for C-Top that is hydrophilic (θw= 73°, θy=87°), have hydrophobic characteristics, that is, they have a contact angle greater than 90°.
In particular, Ti-Top exhibits the highest contact angle value, resulting in the more hydrophobic coatings among the four investigated (Figure 10).
The cross-cut test (refer to Figure 11) showed that three coatings—C-Tie, C-Top, and Si-Top—exhibited the highest adhesion rating of 5B/0, according to the evaluation scale presented in Figure 3, before undergoing the seawater resistance test. In contrast, the Ti-Top coating had a lower adhesion rating of 4B/1.
The high adhesion value (5B/0) of the C-Tie, C-Top, and Si-Top coating agrees with the finding of other Authors that studied similar epoxy-based coatings containing ZnO-APTES, and they proved that the adhesin power was the highest [30,31].
After 30 days of testing in seawater, the adhesive capacity of all coatings decreases. The commercial top-coat demonstrates the lowest resistance among all the coatings analyzed because it drops from the value of 5B/0 to the value of 2B/3 (see Figure 3).
The most resistant coating, Si-Top, decreases from a value of 5B/0 to 4B/1. In comparison, the Ti-Top coating, which is less resistant, drops further from a value of 4B/1 to 3B/2. Therefore, the Si-Top antifouling coating is the best option regarding adhesive capacity and is also less hydrophobic than the Ti-Top coating.
The enhanced performance of Si-Top, along with its increased hydrophilicity, can be attributed to the higher concentration of amino groups in the SiO2-based nanopowder with respect to the titania supported one. The increased loading of functional groups is associated with the large surface area of the SiO2 support, which, in turn, results in a higher density of -OH groups, further enhancing the hydrophilic properties.
3. Conclusions
This article focused on novel coatings able to protect DH 36 steel plates in offshore and shipbuilding industries. SiO2 and TiO2 were modified with amino groups to create hybrid materials for immobilizing iron sites. These were incorporated into paint formulations, which were applied to steel prototype plates. The coatings’ properties, including thickness, water wettability, roughness, and adhesion, were tested, along with their performance in seawater degradation. Preliminary microbiological tests revealed that SiO2-NH2-Fe powders exhibited better antibacterial performance compared to TiO2-NH2-Fe powders, making SiO2-NH2-Fe a more suitable candidate for antifouling applications.
The higher adhesion and lower surface roughness exhibited by the SiO2-based material compared to the TiO2-based material, together with its hydrophobicity (Q>90°), further support its potential to improve the durability and performance of coatings in marine environments suggesting that the latter, in agreement with microbiological data, may offer greater protection against bacterial growth.
In this study, we investigated the application of a primer coating followed by a tie coat containing TiO2-NH2-Fe or SiO2-NH2-Fe powders on DH 36 steel plates. This approach eliminates the need for an additional topcoat, presenting a notable strategic advantage for simplifying the coating process while maintaining effective steel surface protection.
Author Contributions
Conceptualization, M.L.T., C.C, V.L.P., C.S., A.V., S.C., L.F.L.; methodology, M.L.T., C.C, V.L.P., C.S., A.V. S.C., L.F.L.; validation, M.L.T., C.C, V.L.P., C.S., A.V. S.C., L.F.L.; formal analysis, M.L.T., C.C, V.L.P., C.S., A.V. S.C., L.F.L.; investigation, M.L.T., C.C, V.L.P., C.S., A.V. S.C., L.F.L; resources, A.V., L.F.L.; data curation, M.L.T., C.C, V.L.P., C.S., A.V., S.C., L.F.L; writing—original draft preparation, M.L.T., C.C, V.L.P., C.S., A.V., S.C., L.F.L.; writing—review and editing, M.L.T., C.C, V.L.P., C.S., A.V., S.C., L.F.L.; visualization, A.V. L.F.L.; supervision, A.V. L.F.L.; A.V. funding acquisition, A.V., L.F.L. All authors have read and agreed to the published version of the manuscript.
Funding
“Thalassa” project (TecHnology And materials for safe low consumption and low lifecycle cost veSSels And crafts) grant number ARS01_00293 PON2014-2020
Institutional Review Board Statement
Not applicable.
Data Availability Statement
The data presented in this study are available on request from the corresponding authors.
Acknowledgments
F. Giordano (ISMN-CNR, Italy) and N. Gallì (ISMN-CNR, Italy) are acknowledged for technical support in laboratory and for carrying out XRD and BET analyses, respectively. G. Napoli (ISMN-CNR) is acknowledged for the financial management of funding. The authors thank NAVTEC (Consorzio di Ricerca per l’Innovazione tecnologica, Sicilia, Trasporti navali, commerciali e da diporto s.c.a.r.l) for research funding, grant number ARS01_00293 PON2014-2020 of research project “Thalassa” (TecHnology And materials for safe low consumption and low lifecycle cost veSSels And crafts).
Conflicts of Interest
The authors declare no conflicts of interest.
References
- Akhter, P.; Arshad, A.; Hussain, M. A review on environmental impacts of paints and strategies for producing eco-friendly-paints. International Journal of Environmental Science and Technology 2024. [Google Scholar] [CrossRef]
- Fanicchia, F.; Karlsdottir, S.N. Research and Development on Coatings and Paints for Geothermal Environments: A Review. Advanced Materials Technologies 2023, 8, 2202031. [Google Scholar] [CrossRef]
- Faccini, M.; Bautista, L.; Soldi, L.; Escobar, A.M.; Altavilla, M.; Calvet, M.; Domènech, A.; Domínguez, E. Environmentally Friendly Anticorrosive Polymeric Coatings. Applied Sciences 2021, 11. [Google Scholar] [CrossRef]
- Zhao, W.; Feng, G.; Zhang, M.; Ren, H.; Sinsabvarodom, C. Effect of low temperature on fatigue crack propagation rates of DH36 steel and its butt weld. Ocean Engineering 2020, 196, 106803. [Google Scholar] [CrossRef]
- Dashtizadeh, A.; Abdouss, M.; Mahdavi, H.; Khorassani, M. Acrylic coatings exhibiting improved hardness, solvent resistance and glossiness by using silica nano-composites. Applied Surface Science 2011, 257, 2118–2125. [Google Scholar] [CrossRef]
- Shi, X.; Nguyen, T.A.; Suo, Z.; Liu, Y.; Avci, R. Effect of nanoparticles on the anticorrosion and mechanical properties of epoxy coating. Surface and Coatings Technology 2009, 204, 237–245. [Google Scholar] [CrossRef]
- Phanasgaonkar, A.; Raja, V.S. Influence of curing temperature, silica nanoparticles- and cerium on surface morphology and corrosion behaviour of hybrid silane coatings on mild steel. Surface and Coatings Technology 2009, 203, 2260–2271. [Google Scholar] [CrossRef]
- Jalili, M.M.; Moradian, S.; Dastmalchian, H.; Karbasi, A. Investigating the variations in properties of 2-pack polyurethane clear coat through separate incorporation of hydrophilic and hydrophobic nano-silica. Progress in Organic Coatings 2007, 59, 81–87. [Google Scholar] [CrossRef]
- Amerio, E.; Fabbri, P.; Malucelli, G.; Messori, M.; Sangermano, M.; Taurino, R. Scratch resistance of nano-silica reinforced acrylic coatings. Progress in Organic Coatings 2008, 62, 129–133. [Google Scholar] [CrossRef]
- Sangermano, M.; Malucelli, G.; Amerio, E.; Priola, A.; Billi, E.; Rizza, G. Photopolymerization of epoxy coatings containing silica nanoparticles. Progress in Organic Coatings 2005, 54, 134–138. [Google Scholar] [CrossRef]
- Barna, E.; Bommer, B.; Kürsteiner, J.; Vital, A.; Trzebiatowski, O.v.; Koch, W.; Schmid, B.; Graule, T. Innovative, scratch proof nanocomposites for clear coatings. Composites Part A: Applied Science and Manufacturing 2005, 36, 473–480. [Google Scholar] [CrossRef]
- Chen, M.C.; Koh, P.W.; Ponnusamy, V.K.; Lee, S.L. Titanium dioxide and other nanomaterials based antimicrobial additives in functional paints and coatings: Review. Progress in Organic Coatings 2022, 163, 106660. [Google Scholar] [CrossRef]
- Scolaro, C.; Liotta, L.F.; Calabrese, C.; Marcì, G.; Visco, A. Adhesive and Rheological Features of Ecofriendly Coatings with Antifouling Properties. Polymers 2023, 15. [Google Scholar] [CrossRef]
- Sfameni, S.; Rando, G.; Marchetta, A.; Scolaro, C.; Cappello, S.; Urzì, C.; Visco, A.; Plutino, M.R. Development of Eco-Friendly Hydrophobic and Fouling-Release Coatings for Blue-Growth Environmental Applications: Synthesis, Mechanical Characterization and Biological Activity. Gels 2022, 8. [Google Scholar] [CrossRef]
- Crisafi, F.; Pagliaro, M.; La Spada, G.; La Cono, V.; Marturano, L.; Scolaro, C.; Smedile, F.; Visco, A.; Ciriminna, R. Antibacterial Properties of AquaSun Sol–Gel Coating. Advanced Engineering Materials 2023, 25, 2300626. [Google Scholar] [CrossRef]
- Scurria, A.; Scolaro, C.; Sfameni, S.; Di Carlo, G.; Pagliaro, M.; Visco, A.; Ciriminna, R. Towards AquaSun practical utilization: Strong adhesion and lack of ecotoxicity of solar-driven antifouling sol-gel coating. Progress in Organic Coatings 2022, 165, 106771. [Google Scholar] [CrossRef]
- Calabrese, C.; La Parola, V.; Testa, M.L.; Liotta, L.F. Antifouling and antimicrobial activity of Ag, Cu and Fe nanoparticles supported on silica and titania. Inorganica Chimica Acta 2022, 529, 120636. [Google Scholar] [CrossRef]
- Izzi, M.; Sportelli, M.C.; Torsi, L.; Picca, R.A.; Cioffi, N. Synthesis and Antimicrobial Applications of ZnO Nanostructures: A Review. ACS Applied Nano Materials 2023, 6, 10881–10902. [Google Scholar] [CrossRef]
- Chekini, M.; Krivoshapkina, E.; Shkodenko, L.; Koshel, E.; Shestovskaya, M.; Dukhinova, M.; Kheiri, S.; Khuu, N.; Kumacheva, E. Nanocolloidal Hydrogel with Sensing and Antibacterial Activities Governed by Iron Ion Sequestration. Chemistry of Materials 2020, 32, 10066–10075. [Google Scholar] [CrossRef]
- Kwaśniewska, D.; Chen, Y.-L.; Wieczorek, D. Biological Activity of Quaternary Ammonium Salts and Their Derivatives. Pathogens 2020, 9. [Google Scholar] [CrossRef]
- Nemeş, N.S.; Ardean, C.; Davidescu, C.M.; Negrea, A.; Ciopec, M.; Duţeanu, N.; Negrea, P.; Paul, C.; Duda-Seiman, D.; Muntean, D. Antimicrobial Activity of Cellulose Based Materials. Polymers 2022, 14. [Google Scholar] [CrossRef] [PubMed]
- Shao, W.; Wu, J.; Liu, H.; Ye, S.; Jiang, L.; Liu, X. Novel bioactive surface functionalization of bacterial cellulose membrane. Carbohydrate Polymers 2017, 178, 270–276. [Google Scholar] [CrossRef] [PubMed]
- Koshani, R.; Eiyegbenin, J.E.; Wang, Y.; van de Ven, T.G.M. Synthesis and characterization of hairy aminated nanocrystalline cellulose. Journal of Colloid and Interface Science 2022, 607, 134–144. [Google Scholar] [CrossRef]
- Tummino, M.L.; Laurenti, E.; Bracco, P.; Cecone, C.; Parola, V.L.; Vineis, C.; Testa, M.L. Antibacterial properties of functionalized cellulose extracted from deproteinized soybean hulls. Cellulose 2023, 30, 7805–7824. [Google Scholar] [CrossRef]
- Testa, M.L.; Pandoli, O.G.; Cecone, C.; Laurenti, E.; La Parola, V.; Vineis, C.; Tummino, M.L. Sustainable Grafting of (Ligno)Cellulose-Based Powders with Antibacterial Functionalities: Effect of Biomass Type and Synthesis Conditions. Advanced Sustainable Systems 2024, n/a, 2400710. [Google Scholar] [CrossRef]
- ASTM. Standard Specification for Structural Steel for Ships. 2019. [CrossRef]
- ASTM, I. Standard practice for surface wettability of coatings, substrates and pigments by advancing contact angle measurement. 2022. [Google Scholar] [CrossRef]
- Marmur, A. A guide to the equilibrium contact angles maze. 2009, 6, 3. [Google Scholar]
- Hughes, A.E.; Easton, C.D.; Gengenbach, T.R.; Biesinger, M.C.; Laleh, M. Interpretation of complex x-ray photoelectron peak shapes. I. Case study of Fe 2p3/2 spectra. Journal of Vacuum Science & Technology A 2024, 42, 053205. [Google Scholar] [CrossRef]
- Saravanan, P.; Duraibabu, D.; Jayamoorthy, K.; Suresh, S.; Kumar, S.A. Twin Applications of Tetra-Functional Epoxy Monomers for Anticorrosion and Antifouling Studies. Silicon 2018, 10, 555–565. [Google Scholar] [CrossRef]
- Pistone, A.; Scolaro, C.; Visco, A. Mechanical Properties of Protective Coatings against Marine Fouling: A Review. Polymers 2021, 13. [Google Scholar] [CrossRef]
Figure 1.
Materials of this study: C-Top(a), C-Tie (b), Si-Top(c), and Ti-Top(d) after their deposition on the stainless steel DH36 with the internal measuring grid for the detection of thickness maps (6cmx14cm) (e).
Figure 1.
Materials of this study: C-Top(a), C-Tie (b), Si-Top(c), and Ti-Top(d) after their deposition on the stainless steel DH36 with the internal measuring grid for the detection of thickness maps (6cmx14cm) (e).
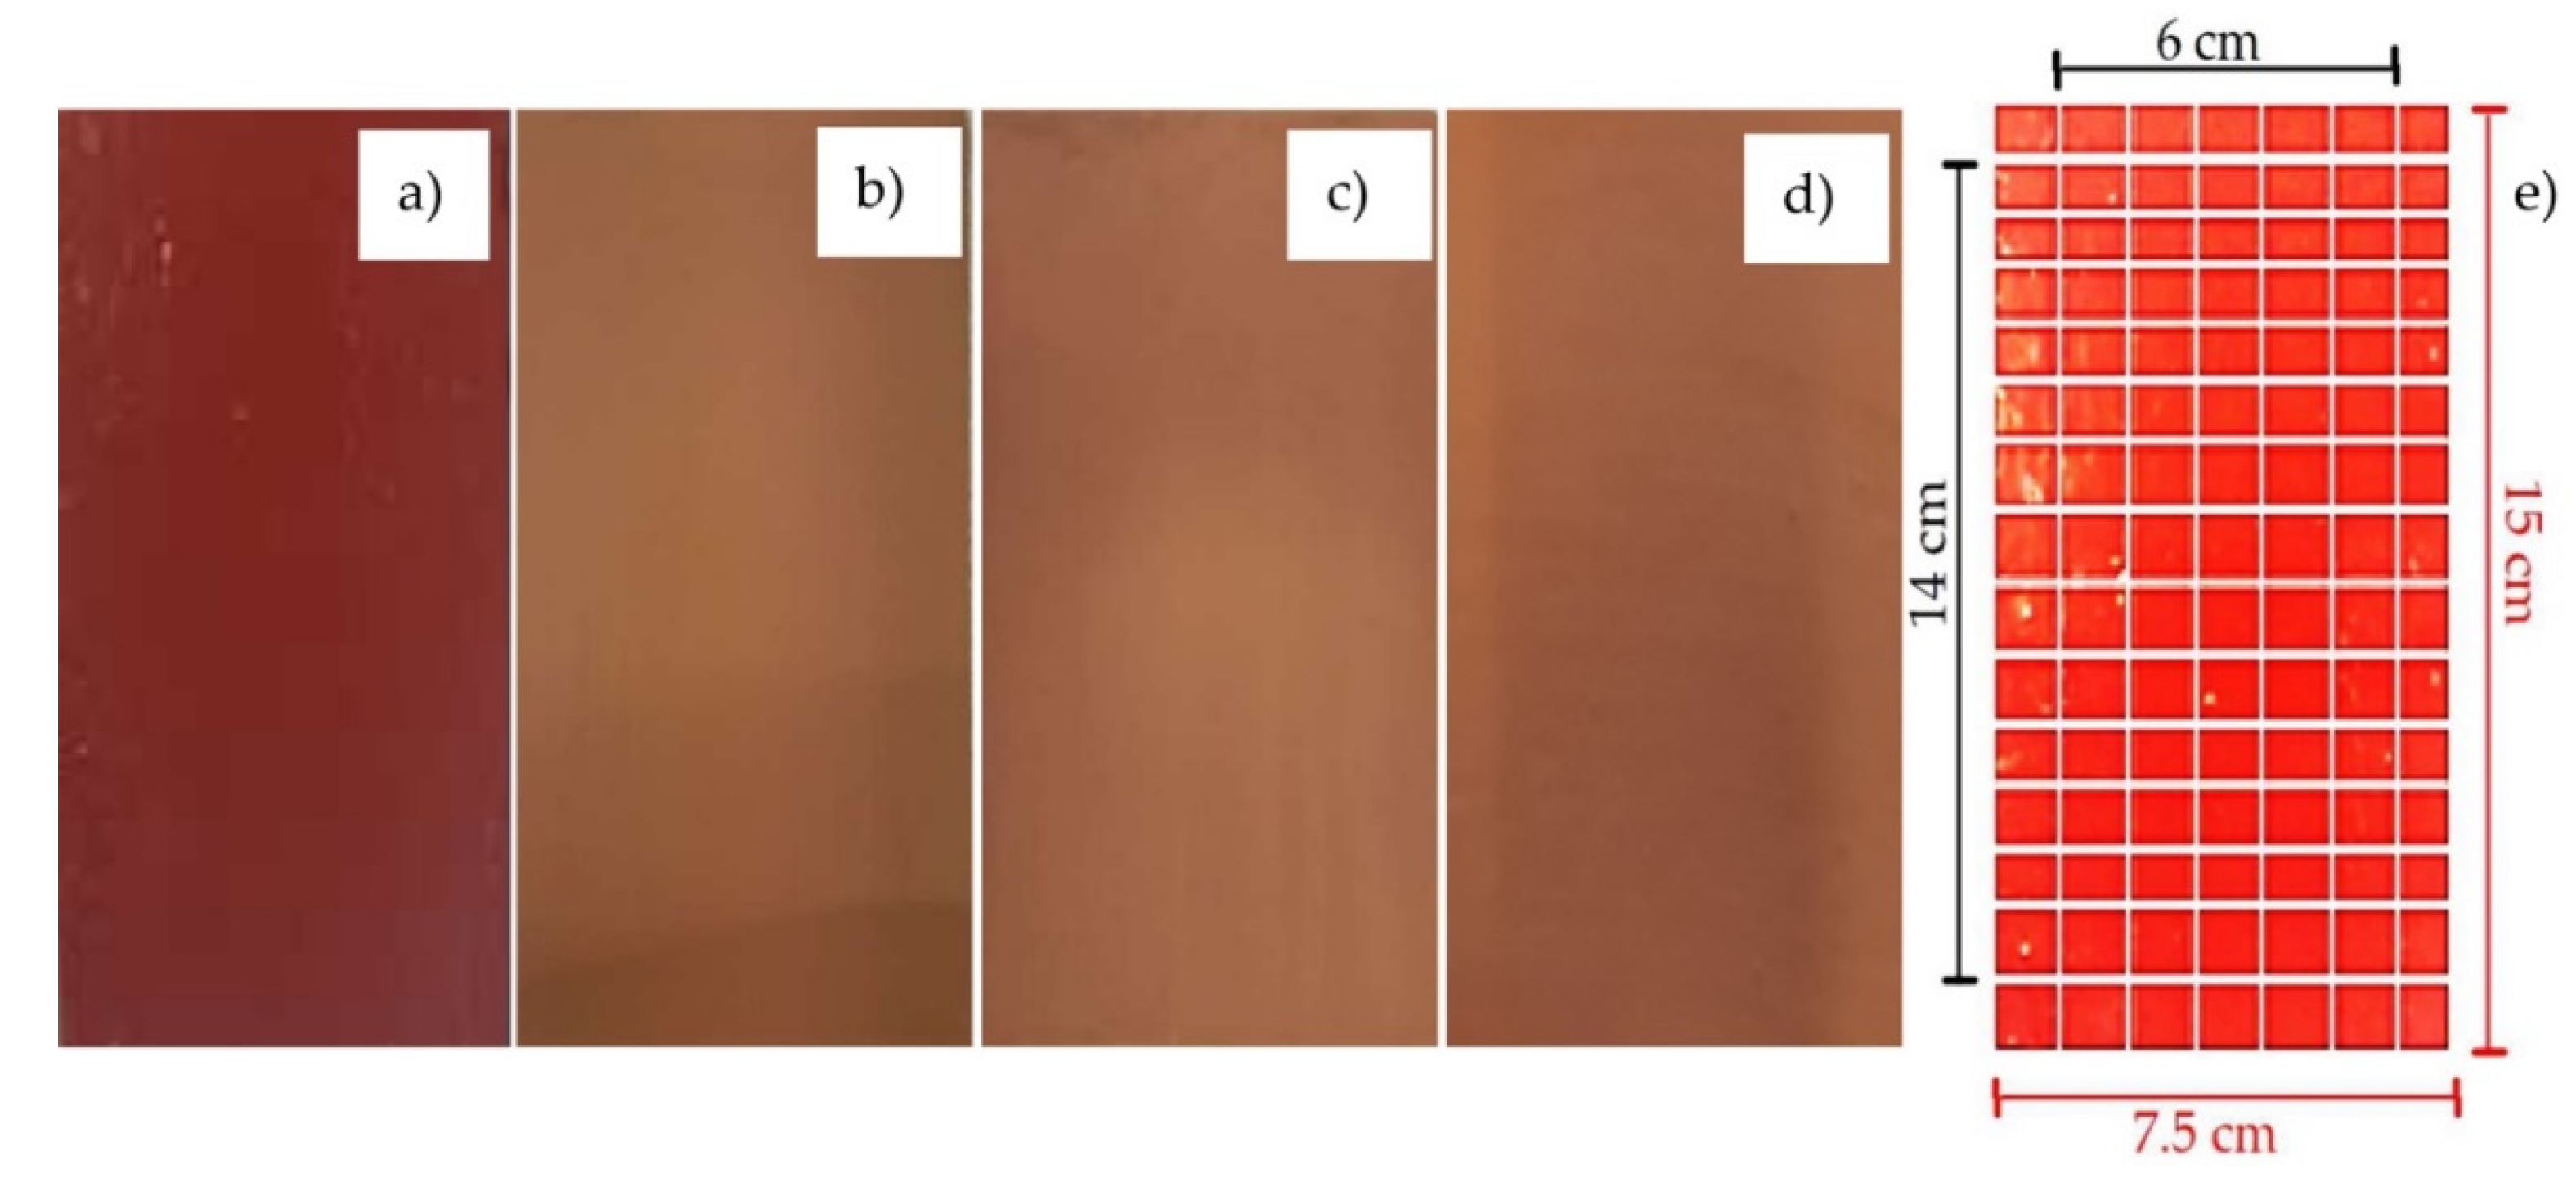
Figure 8.
Thickness maps of C-Tie-498 μm (a), C-Top 515 μm (b); Si-Top 653 μm (c) and Ti-Top 674 μm (d).
Figure 8.
Thickness maps of C-Tie-498 μm (a), C-Top 515 μm (b); Si-Top 653 μm (c) and Ti-Top 674 μm (d).
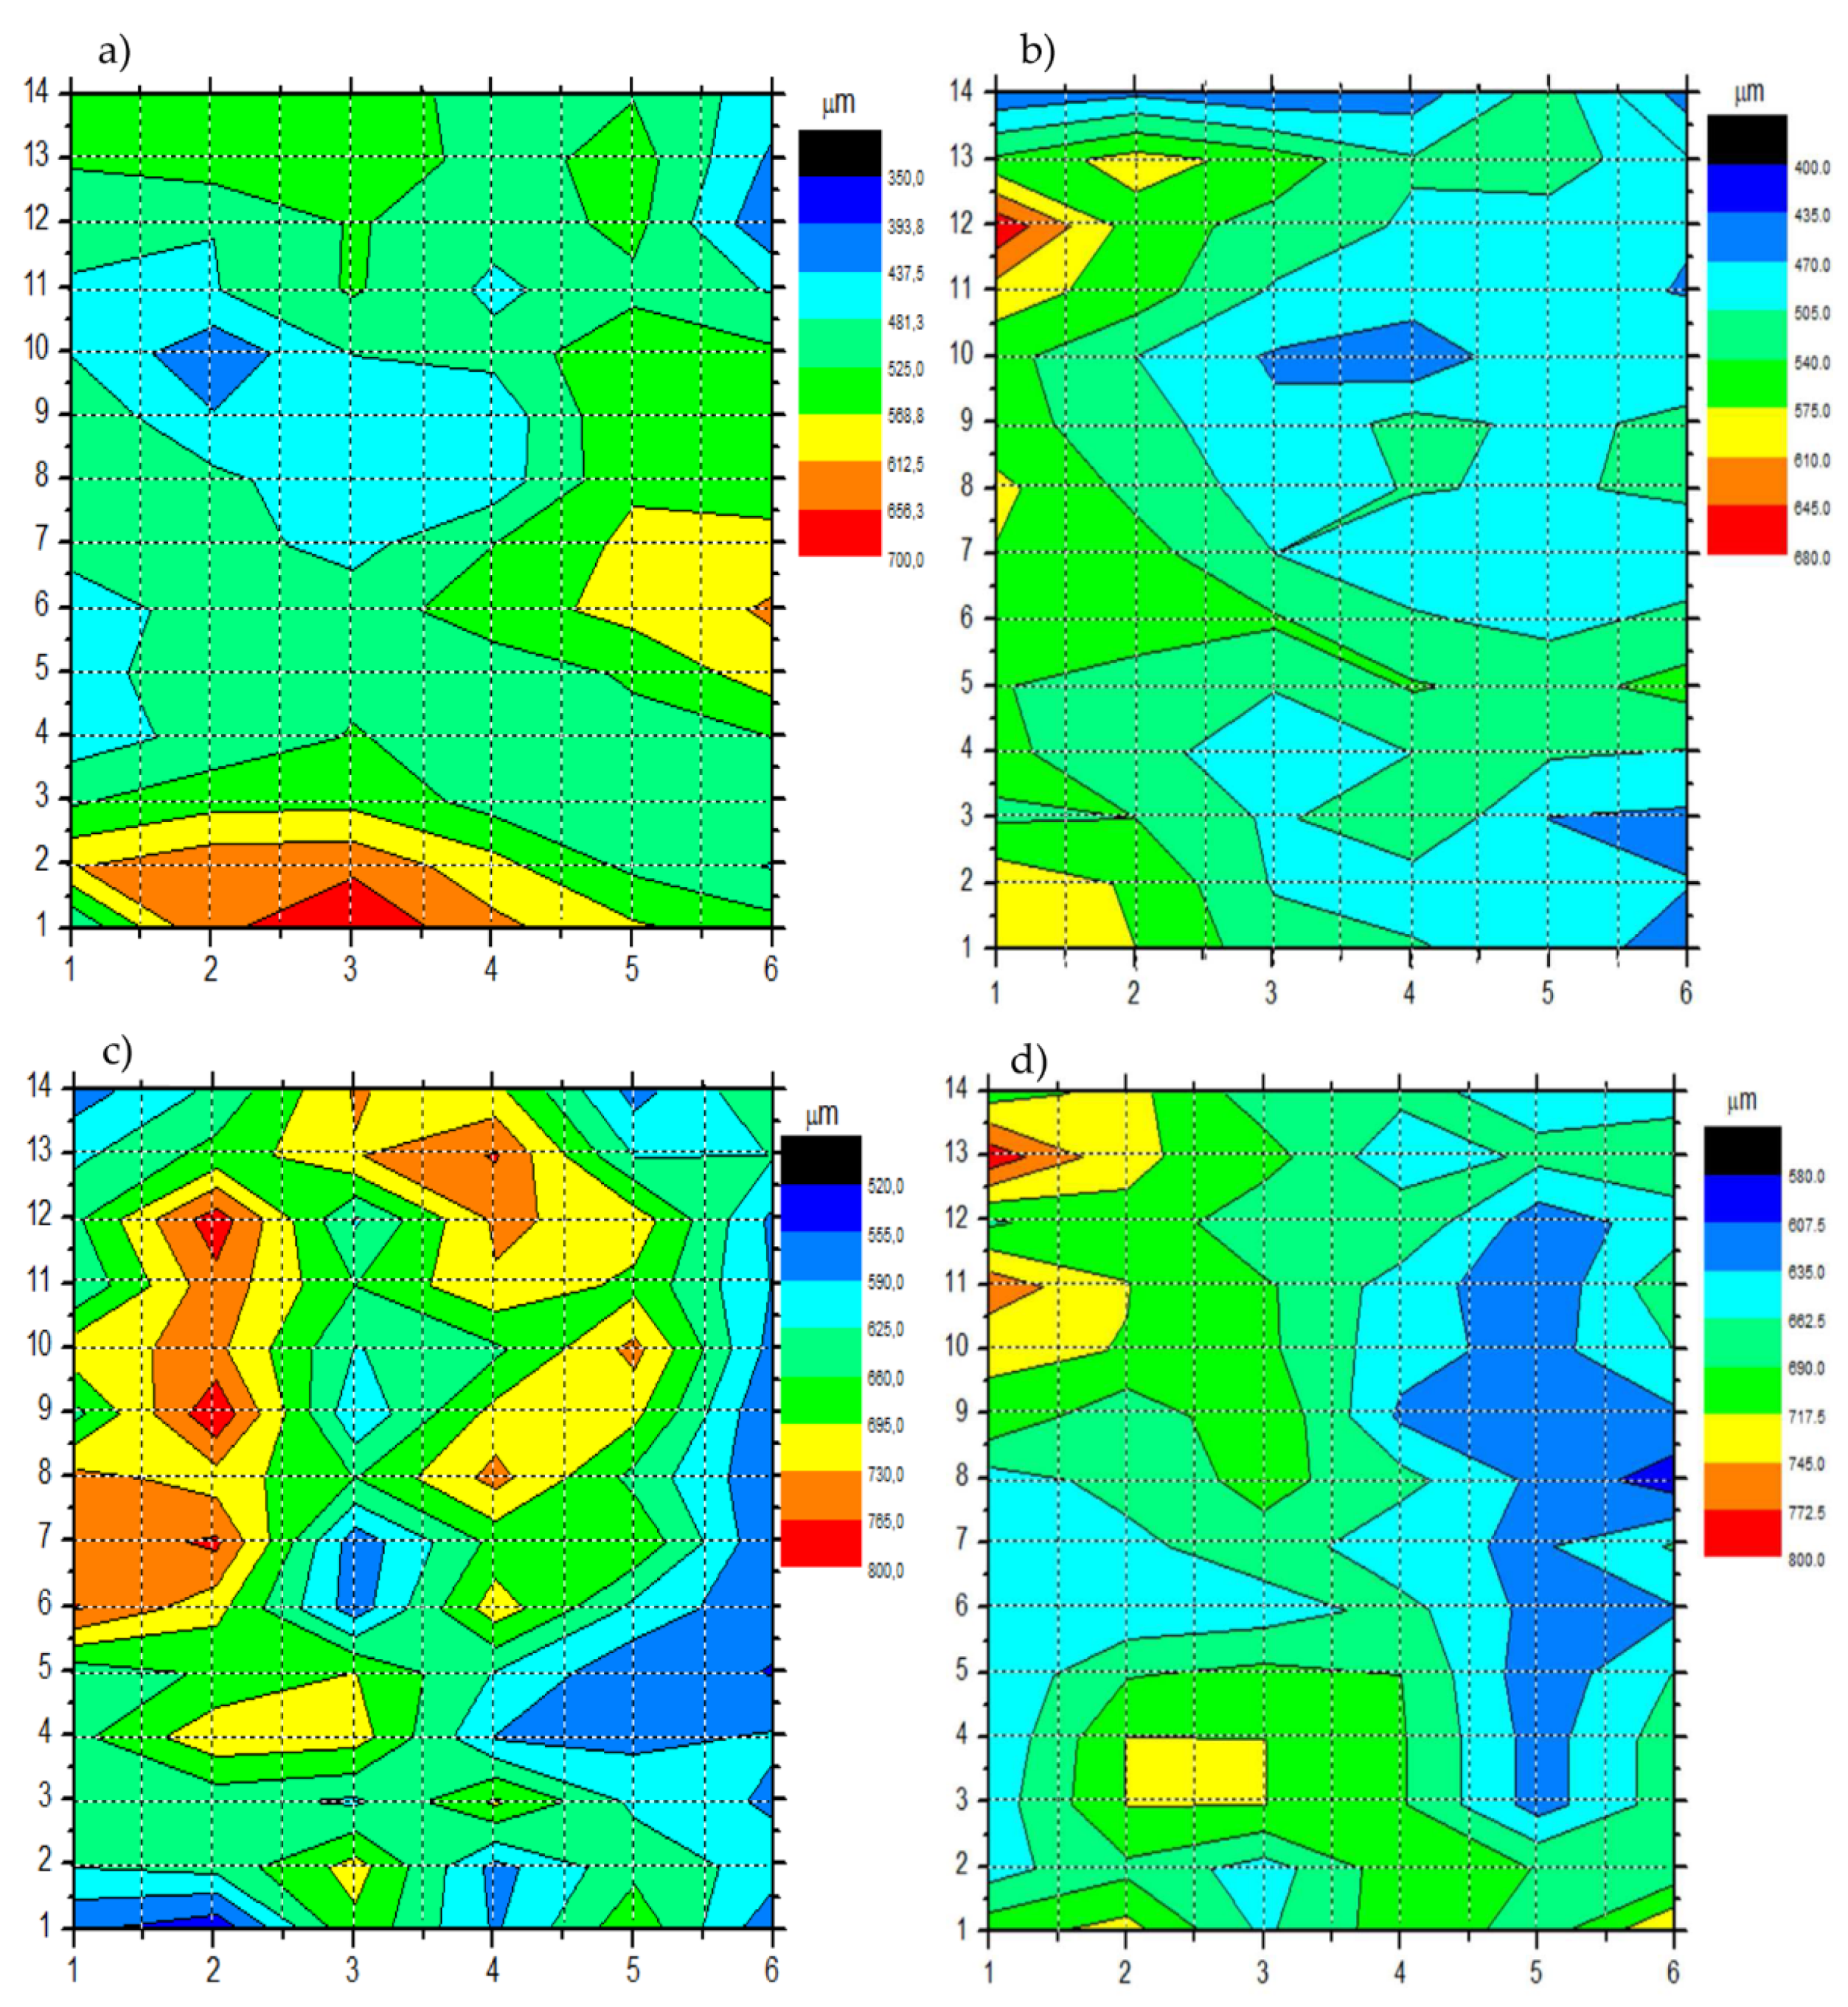
Figure 9.
Typical roughness profiles of the substrates of the coatings deposited on metal.
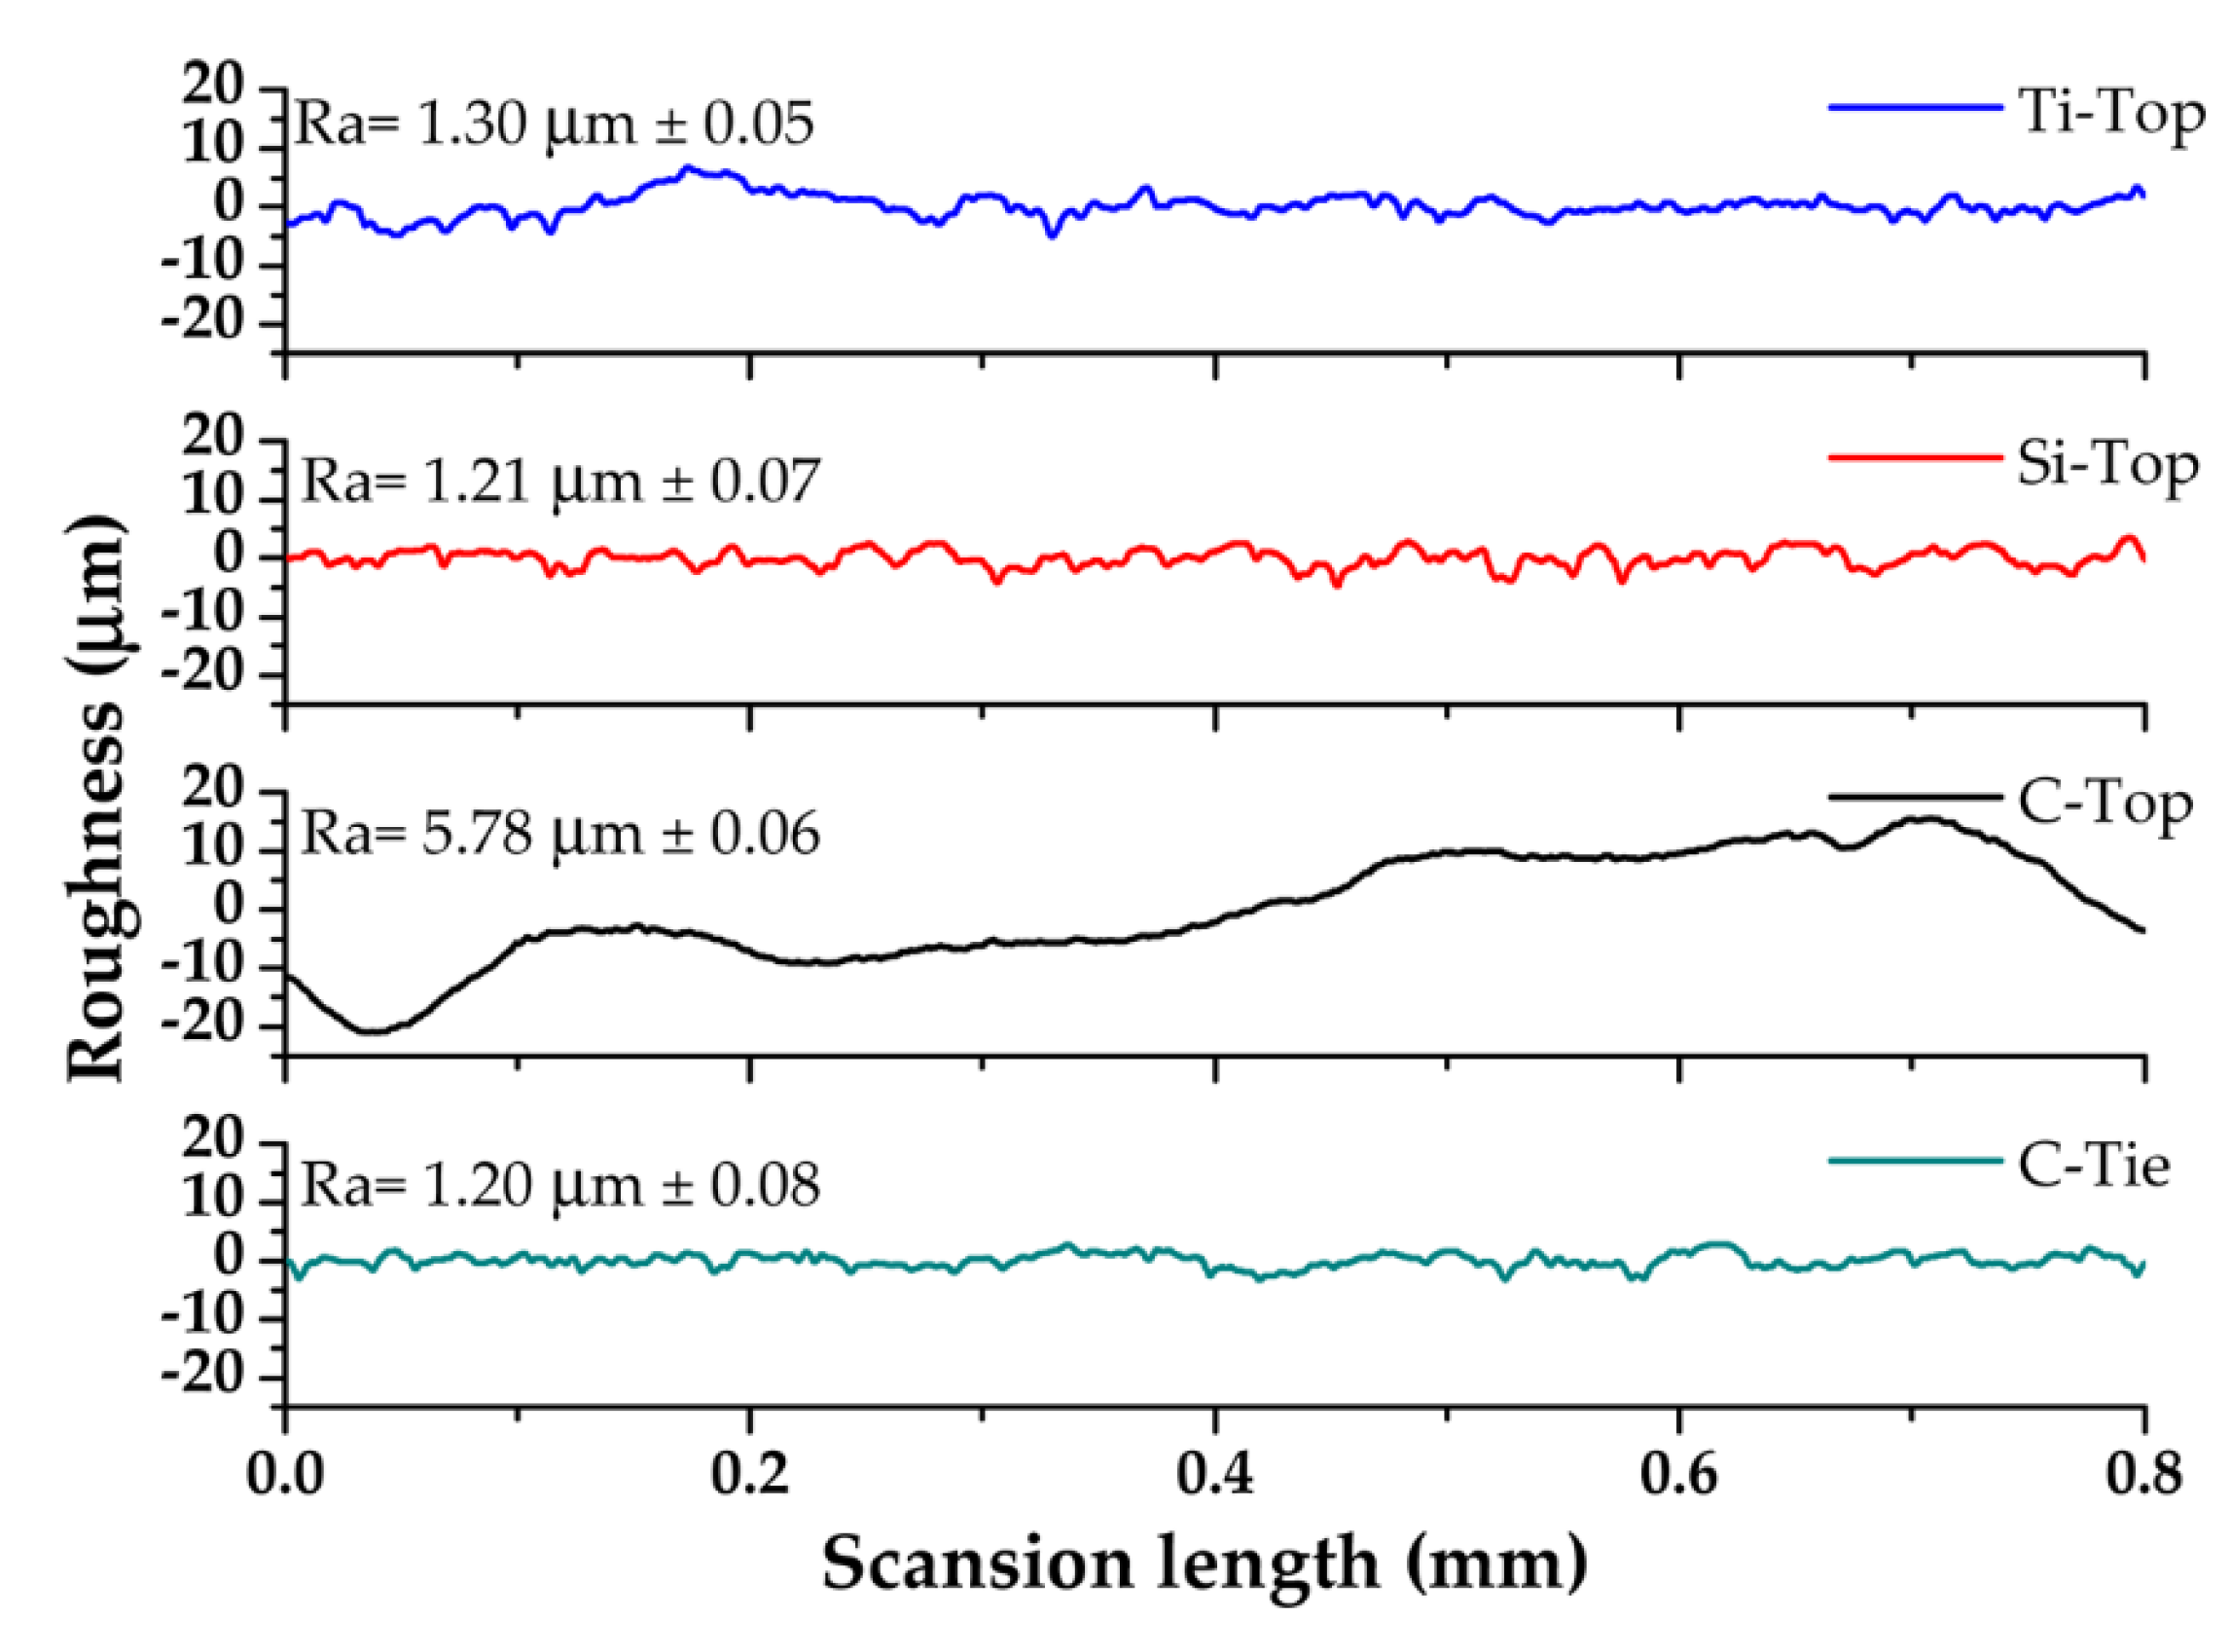
Figure 10.
Contact angle θw (a) and θy (b) of different sample coatings.
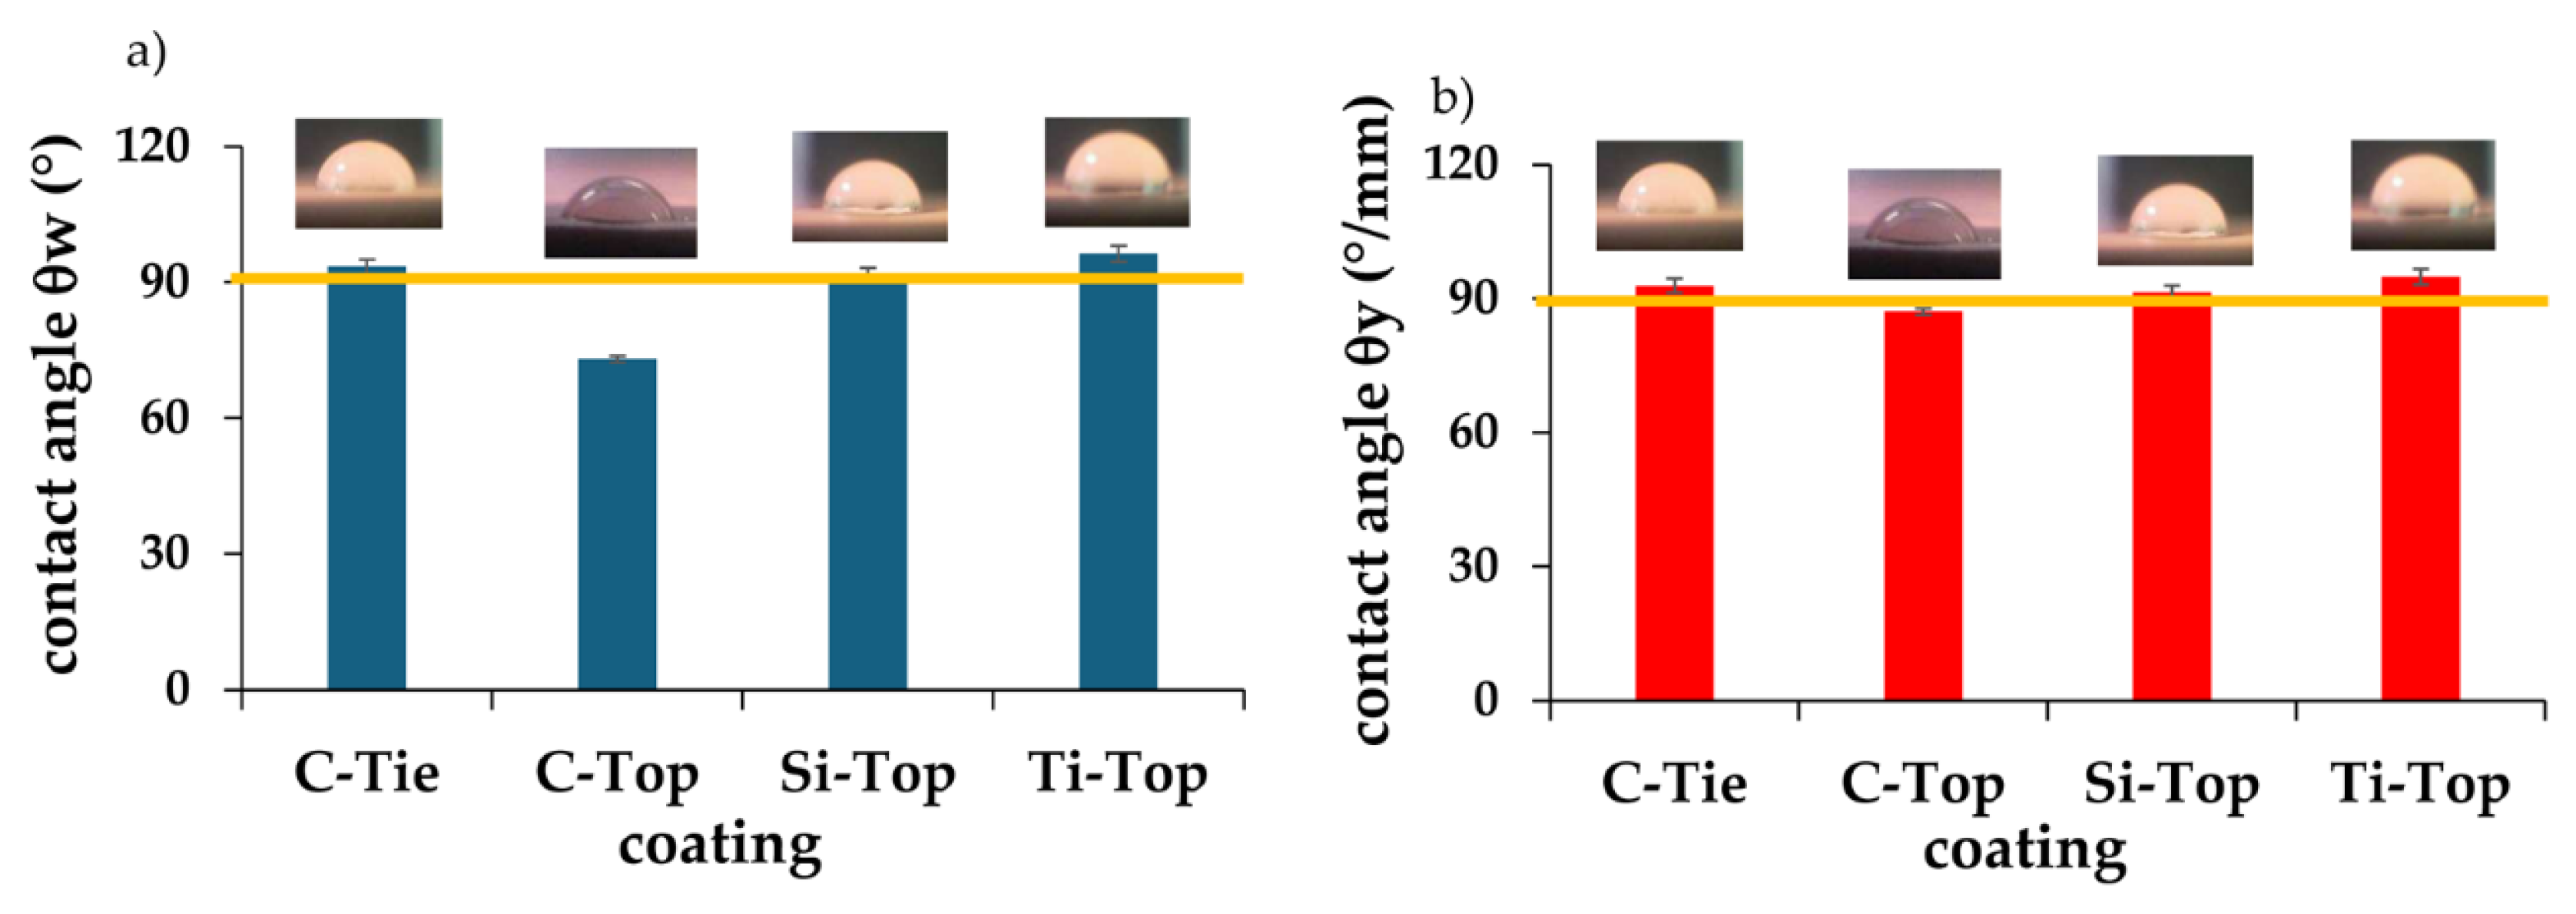
Figure 11.
Cross-cut test result of the coatings (a) C-Tie; (b) C-Top; (c) Si-Top; (d) Ti-Top and after 1 month of immersion in seawater: (e) C-Tie; (f) C-Top; (g) Si-Top; (h) Ti-Top.
Figure 11.
Cross-cut test result of the coatings (a) C-Tie; (b) C-Top; (c) Si-Top; (d) Ti-Top and after 1 month of immersion in seawater: (e) C-Tie; (f) C-Top; (g) Si-Top; (h) Ti-Top.
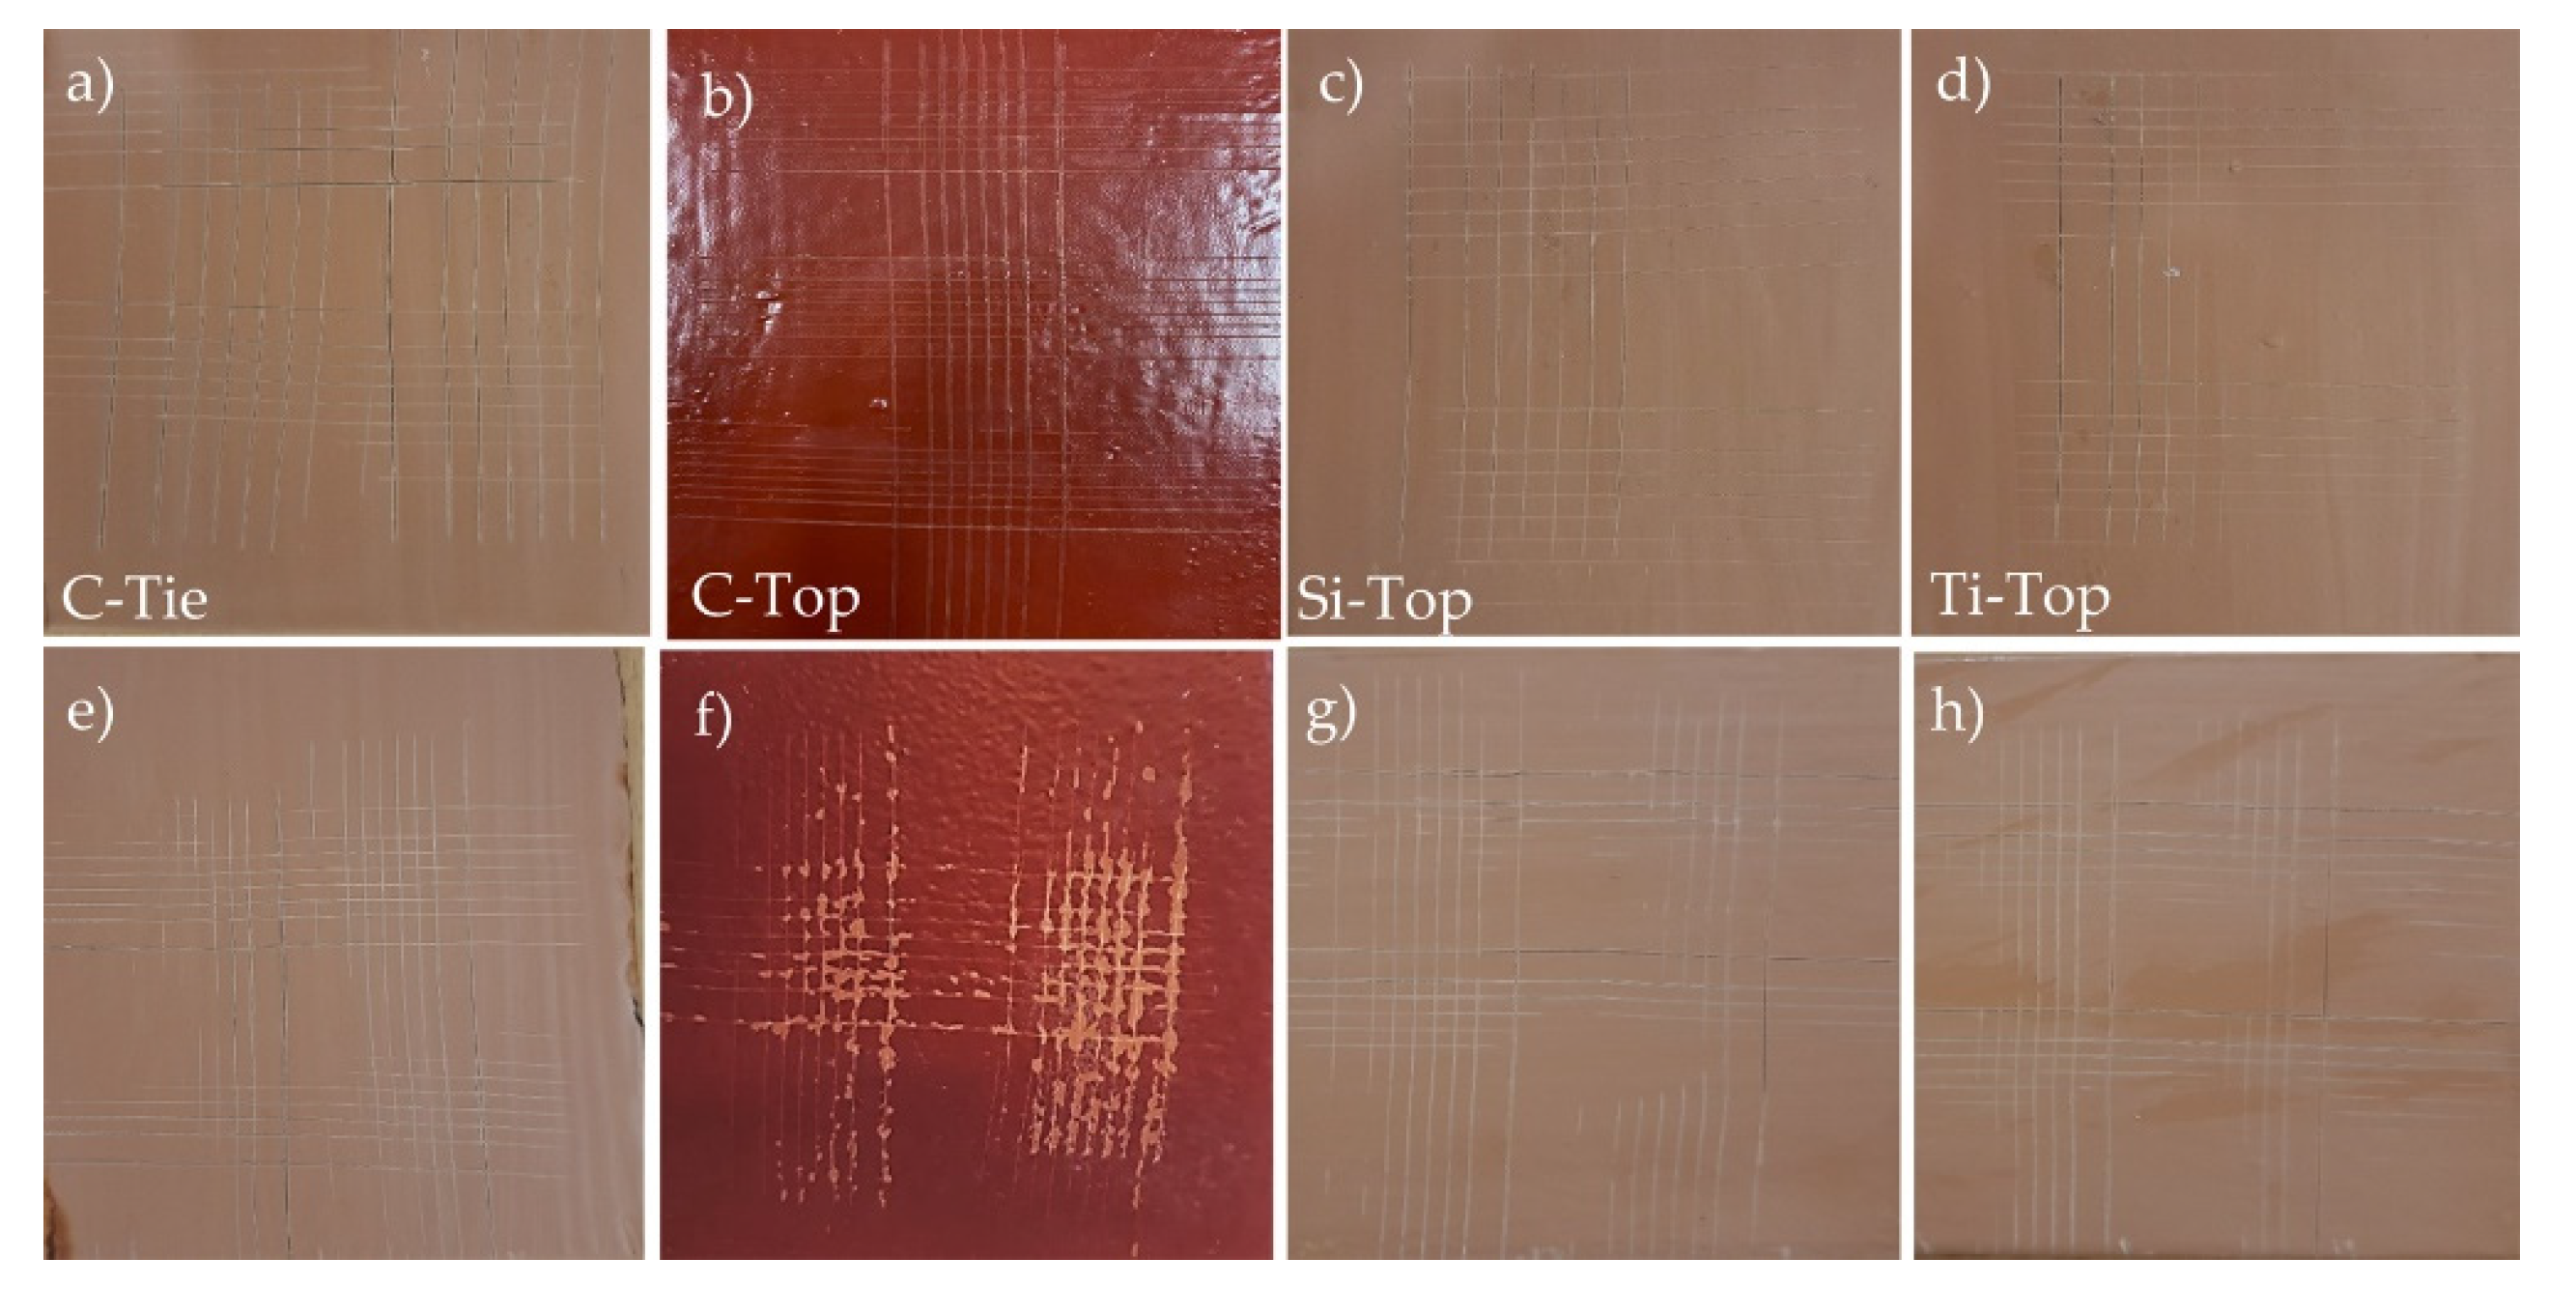
Table 1.
Composition limits for ASTM DH36 high strength structural steel (weigth %).
| C | Mn | Si | P | S | Al | Cb (Nb) | Ti | Cu | Cr | Ni | Mo | Ca | Fe |
| 0.18 | 0.19-0.16 | 0.1-0.5 | 0.035 | 0.035 | 0.015 | 0.02-0.05 | 0.02 | 0.35 | 0.20 | 0.40 | 0.08 | 0.05 | Bal. |
Table 2.
Codes and materials of this study.
| Code | Typology of material | Description | Details |
| C-Top | Sea Quantum Ultra S | Commercial topcoat | Cutting-edge, single-component antifouling with silyl acrylate chemical reaction |
| C-Tie | Safeguard Universal ES, Jotun “tie-coat” | Commercial tie coat | Two-component epoxy-vinyl with polyamide hardener (5:1) |
| Si-Top | Si-Tie +SiO2-NH2-Fe | Commercial Topcoat + our SiO2-based additive | |
| Ti-Top | Ti-Tie + TiO2-NH2-Fe | Commercial Topcoat + our TiO2-based additive |
Disclaimer/Publisher’s Note: The statements, opinions and data contained in all publications are solely those of the individual author(s) and contributor(s) and not of MDPI and/or the editor(s). MDPI and/or the editor(s) disclaim responsibility for any injury to people or property resulting from any ideas, methods, instructions or products referred to in the content. |
© 2024 by the authors. Licensee MDPI, Basel, Switzerland. This article is an open access article distributed under the terms and conditions of the Creative Commons Attribution (CC BY) license (http://creativecommons.org/licenses/by/4.0/).
Copyright: This open access article is published under a Creative Commons CC BY 4.0 license, which permit the free download, distribution, and reuse, provided that the author and preprint are cited in any reuse.


