
Submitted:
18 December 2024
Posted:
18 December 2024
You are already at the latest version
Abstract
The current conventional food system is led by large-scale agribusinesses, characterized by indus-trialized production and increasing distance between food production and consumption. In re-sponse, alternative food initiatives (AFIs) have typically emerged as grassroots initiatives that may not be uniformly distributed or accessible. Food deserts, areas with limited access to healthy and affordable food, are often discussed without considering food quality. Addressing this, this article aims to assess food deserts for healthy, local, and sustainable products in 11 European cities, com-paring conditions before and after implementing food innovative actions focused on shortening food chains during three years of study. The methodology involves locating alternative production and consumption spaces (APS and ACS) and drawing a walking distance around them, identifying densely populated areas outside these radii as food deserts. Results show that implementing AFIs has reduced food deserts in 9 out of 11 cities (average from 10.1% at T0 to 7.4% at Tf), opening new market opportunities for local producers and increasing consumer access to local and sustainable produce. This approach can potentially transform food deserts into food oases, enhancing food security and sustainability.
Keywords:
food deserts
; food oasis
; alternative food initiatives
; food security
; food accessibility
; short food supply chains
; sustainability
; market opportunities
; local producers
1. Introduction
Globally, over 50% of the population lives in urban areas. By 2045, the world's urban population will increase by 1.5 times to 6 billion. This trend is expected to continue, with the urban population more than doubling its current size by 2050. At that point, nearly 7 of 10 people will live in cities [1]. Worldwide, urban expansion faces two persistent threats: the reduction of farmland and the disconnection between urban population and food production regions [2].
The current global food system faces significant challenges characterized by inefficiencies, inequities, and unsustainability. Predominantly centralized and industrialized, this system often results in extended supply chains that disconnect consumers from the origins of their food, exploit natural resources, and perpetuate food insecurity. These issues contribute to significant adverse health, social, economic, and environmental impacts, particularly pronounced in cities [3,4].
Socially, the industrialization and globalization of agribusiness have exacerbated inequalities in food availability and worsened socio-economic conditions for farmers, leading to negative consequences for the welfare of the rural population. Nowadays, 111.1 million people face food insecurity, with slightly rising figures in Europe [3]. Moderate or severe food insecurity affected 33.3% of adults in rural areas in 2022, compared to 28.8% in peri-urban areas and 26.0% in urban areas [3]. In addition, the current food system is associated with increasing gender inequality and the rise in malnutrition-related health diseases, affecting sharply in cases of crisis situation as experienced during the past COVID-19 pandemic [5].
In response to these challenges, there is an urgent need to transform the food system into a more sustainable model that addresses economic, social, and environmental dimensions [6]. One promising approach to tackling food deserts is through Alternative Food Networks (AFNs) and Alternative Food Initiatives (AFIs). These initiatives aim to shorten food supply chains and localize food production and consumption. AFIs encompass various practices such as farmers' markets, community-supported agriculture (CSA), urban farms, and cooperative food enterprises, which differ from conventional food systems. These initiatives can be driven by consumers, producers, or both, and may range from business-oriented to socially-focused practices [7]. In academic literature, AFIs are categorized based on factors like their duration, geographic scope, producer and consumer commitment, the number of intermediaries, and their organizational and economic models [8]. AFIs promote local, fair, and high-quality food by fostering direct relationships between producers and consumers, and re-integrating food production, distribution, and consumption into local contexts through short food supply chains (SFSCs). SFSCs emphasize not only geographic proximity but also social and relational connections, rebuilding the relationship between producers and consumers and fostering new forms of social association and market governance [9].
For a long time, there was no standard definition of SFSC in the EU, commonly referring to those involving a minimum number of intermediaries (or even direct sales from the producer). In 2013, the EU recognized the importance of short supply chains in rural areas and defined them in Regulation (EU) No 1305/2013 of the European Parliament and of the Council of 17 December 2013 on support for rural development by the European Agricultural Fund for Rural Development (EAFRD), which entered into force with the reformed Common Agricultural Policy for 2014-2020. This regulation describes a short supply chain that includes a limited number of cooperating economic actors, provides local economic development, and is characterized by close geographical and social links between producers, processors and consumers. This definition is further clarified by Commission Delegated Regulation (EU) No 807/2014, which stipulates that support for establishing short supply chains covers only those involving no more than one intermediary between the farmer and the consumer.
Public institutions and governance structures have begun to recognize the potential of AFIs in addressing these food system challenges. Various policy frameworks, funding programs, and infrastructural support initiatives have been implemented to develop and scale up AFIs. The European Union, for example, has supported short food supply chains through regulations that encourage local economic development and strengthen geographical and social links between producers, processors, and consumers [10]. International bodies like the United Nations and FAO’s City Region Food System (CRFS) project, along with other organizations like IPES-Food or MUFPP, have also advocated for food localization as a strategy for achieving sustainability and resilience in urban food systems [4,11,12,13,14].
Another similar concept is “food reconnection”, an oft-quoted concept in AFIs research. This concept is particularly relevant in areas known as ‘urban food deserts’, where connections between cities and their nearby farmlands have been replaced by industrial-scale production for export and mass consumption [2]. This process has also been called “desertification” [15].
Food deserts are areas where people have limited access to healthy and affordable food [16,17,18]. This concept often evokes images of residents traveling great distances to reach the nearest fresh food market [19]. Typically, food deserts are associated with low-income households and neighborhoods, with much of the literature focusing on the physical aspects, income levels, and socio-economic structures that define these areas [20]. However, only some studies have addressed the food quality available in these regions. The "quality turn" in food studies is an emerging field that links food deserts with the value-added strategies of Alternative Food Systems. This shift emphasizes an ecologically embedded approach to rural development, moving away from the modernization paradigm [19,21]. On the other hand, food swamps are areas with sufficient retail access to food but an overabundance of unhealthy food options [22]. The relationship between food swamps and food deserts is a relatively new study area, highlighting the importance of quality-focused AFIs in addressing these issues.
Emphasizing food quality has the potential to transform food deserts into food oases. The literature suggests that AFIs, prioritizing quality, can play a crucial role in reducing food deserts and swamps. The discussion around food swamps underscores the importance of the healthiness of available food, bringing the question of quality turn to the forefront. This quality turn, introduced by AFS discussions, might convert food deserts into thriving food oases [23,24] or eliminate them [25]. As a practical example, Jeremy L. Sage (2017) [26] suggests that placing farmers' markets in disadvantaged areas, rather than near existing conventional markets, could address inequalities in food access and improve the overall food quality available to residents.
This paradigm shift towards the creation of SFSC and the implementation of alternative production and consumption spaces facilitates the creation of new market opportunities for local producers. By focusing on more direct and sustainable methods of bringing farm products to consumers, these initiatives reduce the environmental impact and strengthen local economies. Local producers benefit from greater visibility and a closer connection to their customers, leading to increased product demand and the potential for more stable and fair pricing. This approach supports a more resilient food system that values quality, sustainability, and community well-being [27].
Gori (2023) [7] reviews various articles that study the impact of AFIs in urban areas, particularly those addressing citizens’ access to healthy and local food, and explores the quality turn of food deserts into food oases. Additionally, Gori (2023) highlights that AFIs features may vary depending on socio-economic, cultural, and geographical factors. There is, therefore, a need to explore and compare the effect of AFIs on turning food deserts into food oases across different countries and socio-economic contexts.
For this reason, this study aims to compare the situation of food deserts from AFIs across the Living Labs (LLs) of 11 European cities before and after the implementation of innovative actions focused on SFSCs in the context of FUSILLI Project (Fostering the Urban food System Transformation through Innovative Living Labs Implementation). Specifically, the objective of this study is to evaluate food deserts concerning the accessibility of healthy, local, affordable, and sustainable food products. By doing so, the study offers a novel approach to comparing the status of “food deserts” in different European countries and contexts.
At the end of the study, results showed that food deserts were reduced in 9 out of 11 cities, and on average, the food desert area in the 11 participating cities decreased from 10.1% of the LL border area to 7.4% after the implementation of AFIs.
2. Materials and Methods
The selection of AFIs is based on the quality concerns of alternative food systems in 11 European cities involved in the FUSILLI Project. The methodology then focuses on identifying the LL borders in the 11 European cities and locating their APS and ACS within those borders, first at the beginning of the project (T0) and then after 3 years of implementing innovative actions to foster urban food system transformation (Tf).
2.1. Literature Review for Establishing Accessibility Parameters
A comprehensive literature search was conducted using the ScienceDirect database, focusing on the keywords "food deserts," AND "walking distance," AND "accessibility." The search was filtered to include only reviews and research articles. Additionally, research areas not directly related to the topic were excluded. This search initially yielded 69 results. No restrictions were imposed on the year of article publication, as the limited number of relevant results did not warrant the need for a time-based constraint.
To refine the selection, titles were first reviewed, excluding irrelevant studies. Then, 46 abstracts were carefully read, and 11 articles were selected for complete analysis.
The literature reveals that different studies use varying methods to define and measure food deserts [28,29]. Some research focuses on the geospatial distribution of food retail establishments relative to socio-economic population groups, analyzing the number or percentage of households located within a certain distance from food markets [20]. Other studies emphasize the physical distance to food retail units, examining the lengths, distances, and domains used to calculate food deserts [30,31,32].
The methodology used in this article is based on the concept of walking distances. We used the universal standards to define the accessibility measurement to food, creating a 5-minute walking distance (400m) and a 10-minute walking distance (800m) to food retail units. In the literature, the accessibility standard of walking to public spaces and services such as public transit [33], urban green space [34], and schools [35] is defined as 400m and 800 m. Accessibility to food is no exception; the 5-minute walking distance is commonly used as a standard for disadvantaged groups, such as the elderly, children, and individuals with disabilities [36,37]. In contrast, the 10-minute walking distance represents the walkable distance for adults [15,28,38,39,40,41,42,43,44,45]. This approach allows for a consistent and comparable analysis of accessibility in the context of food deserts.
2.2. Mapping the Geography of Alternative Food Systems
Urbanization is not just limited to city landscapes but is a global process that extends into various territories [46]. Modern urbanization involves ongoing social and metabolic flows that blur the lines between urban and rural spaces, making traditional categories insufficient to explain the spatial developments of the 21st century. These planetary urbanization processes are driven by diverse resources (labor, materials, fuel, water, food) and produce various byproducts (waste, pollution, carbon) [46].
This approach considers the entire spectrum of urbanization, where concentrated urbanization refers to the clustering of population, services, infrastructure, and investments; differentiated urbanization describes the continuous transformation of socio-spatial organizations; and extended urbanization explains the spread of urban fabric beyond traditional boundaries.
Since food is one of the metabolic inputs within urbanisation processes, we use this conceptualisation to define categories of urban fabric in association with the flow of food procurement, consumption and production spaces. The food-related spaces are categorized under six main headings: alternative production spaces, alternative procurement and processing spaces, conventional consumption spaces, alternative consumption spaces, alternative waste management spaces, and alternative governance spaces. Specifically, this study aims to explore the APS and ACS, defined as locations where local, healthy, and sustainable food is produced, procured, purchased, sold, distributed and/or consumed. Table 1 classifies the main APS and ACS identified among the 11 cities.
The study of the cities at T0 and Tf involved four main steps, being: 1) identification of the LL borders; 2) AFIs (APS and ACS) identification and location; 3) analysis of the accessible areas to AFIs; and 4) evaluation of the food deserts within LL borders.
2.3. Identification of Living Lab Boundaries
The involved cities are San Sebastian (Spain), Nilüfer-Bursa (Turkey), Kolding (Denmark), Turin (İtaly), Kharkiv (Ukraine), Differdange (Luxembourg), Tampere (Finland), Rijeka (Croatia), Castelo Branco (Portugal), Athens (Greece) and Rome (Italy). They represent a comprehensive geographical, climate, socio-economic and cultural coverage of most of the situations and conditions in Europe.
The LL boundaries represent the areas where innovative actions are implemented and experimented. They are crucial as they represent the concentrated area of AFIs and their service range in terms of spatial accessibility.
These borders were decided by cities based on the locations where innovation actions were being implemented. Then, they were mapped using Google Maps and subsequently reviewed and approved by the respective cities. Once confirmed, the finalized LL borders were meticulously drawn in ArcGIS 10.8 using open-street base maps. In some cities, such as Rijeka, Rome, and Nilüfer, these boundaries align with the administrative borders of districts or the cities themselves. However, in other cities, the LL boundaries differ from the administrative boundaries. For example, in Turin, the LL experimentation area is confined to a specific neighborhood, whereas in Castelo Branco, the LL extends beyond the city limits to encompass the entire region.
2.4. AFIs (APS and ACS) Identification and Location
The identification of AFIs that were already being implemented in each LL at the start of the project was conducted through a workshop with the project managers to gather data together with further research on web-based sources, news and social media from cities and other alternative local and international networks in 13 languages (including English and local languages) and scan of all the presentations and documents that cities and other partners in FUSILLI Project Share Point had provided. Then all the locations gathered were then inserted into Google Earth in KMZ format and converted to shapefile format to combine with the CORINE land use database in the ArcGIS platform. So, the data gathered and the points digitized and spatialized in shapefile format upon CORINE Database to correctly define their locations could be brought together in ArcGIS.
After three years of implementing innovative actions, the coordinates for the new APS and ACS in the 11 cities were added to Google Earth, applying the same model by combining with the CORINE database in ArcGIS.
2.5. Analysis of the Accessible Areas to AFIs at T0 and Tf
After the identification and location of AFIs, two radii of 400m and 800m were drawn around each AFI, representing the accessible areas. The total accessible area is the aggregated buffer areas of 400m and 800m radius distance. At Tf, the same dynamic was applied by drawing 400m and 800m radii around each new AFI to calculate the areas of accessibility after implementing innovative actions. For each city, the surface of accessible areas at 400 and 800m, and the total accessible areas were calculated at T0 and Tf (Table 2).
2.5.1. Total Accessible Area vs. LL boundaries
To enable a meaningful comparison between the 11 cities, which have significantly different LL area sizes, a correlation in percentage terms was conducted between the total accessible area and the LL area. This was accomplished using formula 1:
% Total accessible area vs LL area = Total accessible area*100/Total LL area (1)
This approach allows for the normalization of the accessible area data, ensuring that the comparison between cities of varying LL sizes is accurate and relevant.
2.5.2. Total Accessible Area vs Population
The same pattern was followed to correlate with each city's population. Then, a percentage-based correlation was conducted between the total accessible area and the population within the LL. By evaluating the availability of resources in proportion to the population, this method provides a clearer insight into how accessibility impacts communities of different sizes. This correlation was calculated using formula 2:
% Total accessible area vs LL population = Total accessible area*100/LL population (2)
2.6. Evaluation of the Food Deserts within LL Borders at T0 y Tf
The spatial analyses of food deserts are performed in ArcGIS 10.8 using a buffer tool with 400m and 800m distances from each AFI in cities. Populated areas outside these radii or accessible areas are classified as food deserts, while areas without concentrated populations located outside the accessible areas are not considered food deserts. At Tf, the area of food deserts was again calculated in the 11 cities after implementing innovative actions.
2.6.1. Food Deserts Area vs. LL Boundaries
To compare the 11 cities with varying LL area sizes, a percentage correlation was conducted between the food desert area and the total LL area. This correlation was determined using formula 3:
% Food deserts area vs LL area = Food deserts area*100/Total LL area (3)
This method standardizes the data by relating the food desert area to the overall LL area in each city, enabling a fair comparison. This approach provides a clearer understanding of the prevalence of food deserts in cities of different geographical sizes.
2.6.2. Food Deserts Area vs Population
The same method was applied to correlate the food desert area with the population in each city. A percentage-based correlation was then performed between the food desert area and the population within the LL. By assessing resource availability relative to population size, this method explains how food deserts affect communities with varying population densities. This correlation was determined using formula 4:
% Total accessible area vs LL population = Total accessible area*100/LL population (4)
3. Results
The results include: (1) the identification of the LL borders, (2) percentage of accessible areas; (3) the food desert areas. These results are compared at the beginning (T0) and end of implementing innovative actions after 3 years (Tf) to assess the impact of AFIs on reducing food deserts in the 11 European cities. This results are shown in Table 2, Figure 1, Figure 2 and Figure 3.
3.1. Living Lab Demographic Context: Size and Population
Each city independently determined the boundaries of their LLs and the number and characteristics of the AFIs they would implement as part of their Urban Food Plan. Different patterns of LLs can be found:
- Most of the LLs (San Sebastian, Kharkiv, Tampere, Rijeka, Athens, and Rome) are considered within the boundaries of the city or municipality, excluding the metropolitan area. A similar pattern is observed in all these cities: a high population concentrated within a relatively small area, although there are some differences among them. San Sebastian and Rijeka LLs are the most comparable in size and population, both coastal cities in southern Europe. However, while Kharkiv and Tampere are both large in terms of surface area, Kharkiv's population is four times that of Tampere. Rome LL stands out as the only case with such a large area and a significantly higher population.
- Castelo Branco and Kolding LLs present a contrasting case. They encompass the city and its metropolitan area, following a pattern of large surface areas but lower population density, characterized by a city center surrounded by rural areas. Castelo Branco LL is considered the entire region of Beira Baixa in Portugal, with a population density of 0.03 inhabitants/m². Kolding LL is not as large as Castelo Branco but has nearly double the population. Another key difference is their geographical location in Europe, one in the north and the other in the south.
- The Mirafiori LL in Turin is unique within the cities analysed in the present study as it represents a single neighborhood in Turin's peri-urban, more industrial zone. Consequently, its surface area is much smaller than that of the other LL but with a higher population density, surpassing that of Differdange, at 4.23 inhabitants/m².
- The Differdange LL could be considered similar to Castelo Branco and Kolding LLs since it includes other towns in the commune in addition to the city of Differdange. However, it is much smaller in terms of surface area and population, making it more comparable to the Turin LL in these aspects.
- Nilüfer is one of the 17 districts in the province of Bursa, Turkey. It is a residential city experiencing rapid growth in both size and population. Regarding surface area, Nilüfer LL is similar to Kharkiv or Tampere, but in terms of population, it has half the population of Kharkiv or double that of Tampere.
3.2. Analysis of the Accessible Areas to AFIs at T0 and Tf
Figure 1 represents the accessible areas at 400m from each AFI location in the 11 cities at T0 in light pink. In dark pink, the accessible areas at 800 m are depicted. Total accessible areas are the sum of light pink and dark pink areas. Blue circles represent food deserts from AFIs at T0. The total accessible areas for each LL are quantified in Table 2.
Figure 2 represents in light purple the accessible areas at 400m from each AFI location in the 11 cities at Tf. In green, the accessible areas at 800 m are depicted. Total accessible areas are the sum of light purple and green areas. Blue circles represent food deserts from AFIs at Tf. Total accessible areas are quantified in Table 2.
Rome and Kharkiv are the LLs with the largest accessible areas due to the high number of AFIs, while Differdange and Castelo Branco are the ones with the smallest accessible areas. (Table 2)
3.2.1. Accessible Area vs. LL Area
On average, across the 11 LLs, the percentage of the total accessible area relative to the area of the LLs has increased from 32.4% at T0 to 39.5% at Tf (Table 3).
At T0, if we correlate the total accessible area with the LL border area, Turin and Athens LLs have better access to local, healthy, and sustainable food, while Kolding and Castelo Branco have poorer accessibility (Table 3).
After the implementation of innovative actions (Tf), the biggest improvement was seen in San Sebastian and Athens LL, which increased their accessibility to local, healthy, and sustainable food at a higher rate than the other cities, while Rome LL remained with the same accessible area compared to T0 (Table 3).
3.2.2. Accessible Area vs Population
On average across the 11 LLs, the percentage of the total accessible area relative to the LLs population has increased from 152,3m2/inhab. at T0 to 182,5m2/inhab. at Tf (Table 3).
If we correlate the total accessible area in each city with the LL population instead of the LL area, Turin continues to be the LL with the highest accessible area per inhabitant, followed by larger LLs with lower population, such as Kolding or Tampere. Smaller LLs with high populations, such as Rijeka, San Sebastian, and Athens, have lower accessible areas per inhabitant at T0 (Table 3).
The situation at Tf is quite similar, but San Sebastian improved the accessible area per inhabitant, while Rome remained the same (Table 3).
3.3. Evaluation of the Food Deserts Within LL Borders at T0 y Tf
Figure 3 represents the food desert areas in each LL in blue circles, comparing T0 and Tf.
Almost all cities (9 out of 11) reduced their food desert areas after the implementation of AFIs. Despite these improvements, at both T0 and Tf, Rome and Tampere exhibit the largest food desert areas among the LL, whereas Turin and Differdange show the smallest (Table 2).
3.3.1. Food Deserts Area vs. LL Area
As shown in Table 4, when comparing food deserts within each LL border by calculating the percentage of food desert areas relative to the total LL border area, it was found that, on average, the food desert area in the 11 cities constituted 10.1% of the LL border area at T0. Following the implementation of APS and ACS, this percentage decreased to 7.4%. So, the implementation of these types of actions has a positive impact on reducing food deserts in the cities of study.
At T0, Castelo Branco and Turin have the lowest percentage of food deserts relative to the LL area, while Tampere and Athens are the LL with a higher percentage. At Tf, San Sebastian and Athens reduce their food deserts more significantly than the rest of the cities and improve their ranking relative to T0.
All LLs reduced their percentage of food deserts except for Rome and Rijeka, which have maintained their percentage. Despite implementing many actions focused on increasing awareness of local, healthy, and sustainable production and consumption, the locations of these actions remained the same. A similar situation occurred in other cities such as Kolding, Tampere, Differdange, and Castelo Branco, where the number of APS and ACS did not significantly increase, although the intensity of actions in these spaces did. This modest effect can be attributed to the concentration of actions within existing facilities and zones rather than expanding into new areas.
Conversely, in San Sebastian, Nilüfer, Rijeka, and Athens, the percentage of food deserts was substantially reduced due to an increase in the number of APS and ACS created during the implementation of the innovative actions. In Kharkiv, the security situation, due to the ongoing war, limited the implementation of actions.
3.3.2. Food Deserts Area vs Population
As shown in Table 4, the correlation between food desert areas and population across each LL revealed that the average food desert area per inhabitant in the 11 cities was 133.1 m² per inhabitant at T0. After implementing APS and ACS within the study, this figure decreased to 117.2 m² per inhabitant at Tf.
Generally, the food desert area per inhabitant tends to be larger in sparsely populated, large LLs and smaller in densely populated, small LLs. At T0, Castelo Branco, Tampere, and Kolding had the highest food desert areas per inhabitant, while Turin, Athens, and Kharkiv had the lowest.
By Tf, nearly all cities reduced their food desert area per inhabitant, except Rijeka and Rome, due to the reasons discussed in section 3.3.1. Besides this, the situation remained largely similar to the T0, except that San Sebastian achieved a more significant reduction in food desert area per inhabitant than other cities.
4. Discussion
The LL explored during the present study showed very different patterns, which has increased the difficulty of comparing cities around Europe. No studies have been found comparing the different city LLs in terms of size and population. This comparison aims to show the disparity in characteristics and peculiarities of each LL.
In this study, a general trend was observed where larger LLs exhibit higher levels of food accessibility due to the greater availability of AFIs. In contrast, smaller LLs typically have more limited accessible areas. When examining the correlation between the total accessible area and the LL's geographical extent, smaller LLs with more concentrated urban populations and higher densities of AFIs show greater access to local, healthy, and sustainable food sources. Considering this, evidence suggests that reducing the distance between food production and consumption through local food systems can enhance small-scale producers' market opportunities [9]. For instance, a study by Born and Purcell (2006) [47] explores how local food systems can strengthen local economies by creating direct connections between producers and consumers, fostering economic resilience and sustainability. On the other hand, Gugerell (2021) [9] confirmed that spatial or geographical proximity is not the most crucial variable in creating trust and attractiveness to AFN (in this case, CSA), but other aspects, such as social-cognitive and institutional proximity, should be considered to increase market opportunities for urban farmers. On average, across the 11 Living Labs (LLs), the proportion of the area accessible to local, healthy, and sustainable food increased from 32.4% at the initial time (T0) to 39.5% after the implementation of innovative actions (Tf). Initially, cities such as Turin and Athens demonstrated better accessibility to food sources, while Kolding and Castelo Branco faced significant challenges. After implementing interventions to improve local food systems, San Sebastian and Athens showed the most significant improvements, markedly increasing accessibility to these food sources. Conversely, Rome did not experience any measurable improvement in its accessible area between T0 and Tf. This outcome aligns with existing research that emphasizes the role of local food systems in enhancing food accessibility. A study by Cummins et al. (2014) [48] supports the notion that urban interventions designed to reduce the distance to food access points can improve food security in some areas. This study explores the impact of opening a new grocery store in an underserved urban area, finding that while such interventions can improve food access and awareness, they may not always lead to significant changes in dietary habits or health outcomes, thus showing that the effectiveness of such interventions may vary by context. This supports the idea that urban interventions can improve food security in some areas but may have different effects. Furthermore, the positive impact seen in San Sebastian and Athens aligns with research by Walker et al. 2010 [49], which shows that cities have developed public/private partnerships, agreements between government, private sector organizations and local producers to build and maintain infrastructure and necessary community facilities increasing access to local food within neighborhoods that other food retailers have overlooked. In contrast, in the case of Rome, the lack of improvement in addressing food deserts could be attributed to entrenched structural barriers, such as policy limitations or urban design that obstruct the development of alternative food networks. This is consistent with the findings of Morgan and Sonnino (2010) [50], who observed similar challenges in cities like London and New York. Another plausible explanation could be that Rome, already well-developed in terms of AFIs, has reached a saturation point, where the impact of further developments begins to diminish [51].
According to Varner 2006 [52] and Malagon-Zaldua 2018 [53], the economic dimension of food markets is also determined by the size of the town where the market is located, the distance from it to other food stores, the level of crossover with other local marketing spaces and the level of income of nearby residents. Factors such as the consumers' educational level or the market's longevity also seem to have a significant influence. Interestingly, when correlating total accessible areas with population, the data reveal that larger LLs with lower population densities tend to provide better accessibility per inhabitant. Conversely, smaller LLs with higher population densities—such as Athens—display the lowest accessible area per inhabitant, reflecting the challenges in densely populated areas. USDA report (2010) [54,55] uses population density data to assess food access across the United States. This report highlights that areas with higher population density, particularly in urban environments, often have poorer access to affordable and nutritious food due to logistical and spatial constraints. Studies such as Bloem and Pee (2017) [56] suggest that the larger a city is, the easier it will grow economically and reduce poverty. However, these agglomeration economies have now been acknowledged to be in constant tension between the benefits of grouping together and facing congestion issues. Then, it highlights the potential strength of strategically investing in medium-sized cities as they are more likely to generate equitable growth, including for their surrounding hinterlands, thus strengthening local food systems and creating better enabling environments for improved urban nutrition through better sanitation infrastructures and increasing access to nutritious foods. According to our study, the improvement in San Sebastian suggests that well-planned urban interventions can substantially impact even in more densely populated areas. San Sebastian's success shows that even in smaller, high-population LLs, targeted actions can improve food accessibility.
In terms of food deserts, almost all LLs studied (9 out of 11) experienced a reduction in food desert areas following the implementation of AFIs, suggesting that these initiatives positively impact the mitigation of food deserts in urban environments. This finding suggests that while targeted action can effectively reduce food deserts, the results can vary significantly depending on the city's pre-existing infrastructure and demographic characteristics.
Safta (2024) [57], in his article "A Desert Mirage: The Myth of Detroit's Food Desert," discusses how alternative food networks contribute to a more nuanced understanding of food accessibility in Detroit. He argues that when both AFIs and the traditional food system are considered, not all parts of the city can be classified as food deserts. For this reason, after the implementation of APS and ACS, the percentage of food desert areas dropped to 7.4%. This suggests that such interventions positively impact reducing food deserts in the studied cities. All LLs managed to reduce their food deserts, except for Rome and Rijeka, where the percentages remained unchanged. Despite numerous actions promoting local, healthy, and sustainable production and consumption, these interventions were concentrated in pre-existing locations, limiting their overall impact on food desert reduction. This pattern was also observed in other cities, including Kolding, Tampere, Differdange, and Castelo Branco, where the number of APS and ACS did not significantly increase, despite a rise in the intensity of activities within existing spaces. This limited impact could be due to focusing on existing facilities and locations rather than expanding into new areas.
This trend of positive food desert reduction through localized interventions is consistent with findings in the broader literature. Several studies, like Larsen and Gilliland (2009) [58] and Karakaya (2023) [59,60], highlight how the introduction of community food programs and local markets can shape and reduce food deserts, significantly when these actions expand beyond existing locations. However, as research by Cummins et al. (2014) [48] noted, urban interventions may have limited effects when restricted to pre-existing areas without expanding to new, underserved regions. The mixed outcomes in Rome and Rijeka also mirror other urban studies [61], where concentrated but localized actions may fail to address broader accessibility issues without a city-wide expansion of services and infrastructure.
The correlation between food desert areas and population across the LLs revealed a general decrease in food desert areas per inhabitant following the introduction of APS and ACS, further supporting the positive role of AFIs in reducing food deserts [57]. Typically, food desert areas per inhabitant tend to be larger in sparsely populated, large LLs and smaller in densely populated, smaller LLs [54,55]. This finding is in alignment with D’Acosta (2015) [62], stating that some of the factors to still find some areas that suffer food insecurity in a study in Ohio are poverty, lack of car access and low population density.
In summary, while the accessible area generally increases with the size of the LL due to the greater presence of AFIs, this positive relationship is moderated when accounting for population density. Cities with smaller, densely populated LLs tend to have a higher percentage of accessible areas relative to their total area, as the concentration of AFIs is more likely. In contrast, larger, sparsely populated regions often have more food deserts per inhabitant, highlighting the complex dynamics between population density, LL size, and food accessibility.
In addition to the considerations previously discussed, several methodological limitations of this study warrant further explanation. The 11 cities span a wide range of geographic, climatic, socio-economic, and cultural contexts, reflecting the diversity of conditions across Europe. However, this broad diversity introduces significant variation among the cities, complicating comparative analysis and making certain conclusions less robust due to the heterogeneity of the sample.
Another limitation is that not all AFIs in the cities analyzed may have been accounted for. Some initiatives may need to be formally registered in the food sector or have more visibility online or on social media. Furthermore, while APS and ACS were grouped together under the term AFIs, their spatial distribution across the 11 cities may differ. ACS, such as farmers' markets, consumer cooperatives, and organic markets, tend to be concentrated in densely built urban areas. In contrast, APS, such as community gardens or allotment gardens, may also be found in urban zones, but organic farms and ecovillages are typically located in peripheral or peri-urban areas. This suggests that the proportion of ACS and APS may vary depending on the characteristics of each LL, particularly regarding the consideration of peri-urban and regional areas.
The study's approach also considered only walkable distances as the criterion for access to AFIs, whereas other studies have included additional means of transportation, such as buses or bikes [28,29,63,64,65,66]. Moreover, emerging forms of provisioning, such as online sales or delivery services that bring local, healthy food to workplaces or sports centers, have yet to be considered. Therefore, measuring distance alone is not the only limitation to accessing healthy food. While this study focused on physical food outlets, recent research has shown that digital food environments are expanding through cell phones, social media, and food delivery platforms, which can increase food access by extending the coverage of available outlets [67,68]. Future research should include the digital food environment when identifying food deserts and food swamps [28]. Online access to food has been found to be as practical as store access regarding health outcomes, and a clear urban-rural divide persists in both store and online grocery access [63]. Some studies have observed that while urban centers may resist e-shopping, vulnerable areas on the periphery of cities and rural regions could benefit from mobile grocery stores, which gained prominence during the COVID-19 pandemic [69].
From a social perspective, Gugerell (2021) [9] argues that reducing spatial distances to urban farmers' markets may not be the most critical factor in fostering trust and attractiveness toward AFIs. Instead, social-cognitive and institutional proximity are more crucial. In this context, consumer preferences and willingness to pay for healthier, locally sourced products are key factors that influence the success of AFIs, the opportunities for local farmers, and the reduction of food deserts. This raises the question of which comes first: consumer demand or producer supply? Increasing consumer education may hold the key to boosting demand for healthy food.
Moreover, the availability of healthy and local food is only one concern; the excessive exposure to unhealthy, processed foods is also problematic. As Bridle-Fitzpatrick (2015) [70] points out, "food swamps," characterized by an overabundance of unhealthy food options, may be an even more significant concern than food deserts in some areas. Recent research in the Netherlands suggests that obesity prevalence is more closely related to the accessibility of unhealthy food options than fresh food availability [71]. This highlights another limitation of the current study, as unhealthy options were not considered competing alternatives for consumption. Further research should explore this dynamic in greater detail.
On the economic front, Kato and McKinney (2015) [23] found in a semi-experimental study in a low-income food desert neighborhood in New Orleans that economic constraints have a greater influence on where residents purchase food than spatial or temporal limitations. Additionally, their study identified localized social barriers, such as fragmented social networks, as structural challenges to engaging residents in alternative markets. These findings underscore the importance of adopting a multi-dimensional and dynamic approach to understanding food access, considering economic, social, and spatial factors.
5. Conclusion
The implementation of AFIs has shown positive impacts on increasing accessible areas and reducing food deserts across the LLs. AFIs, such as the establishment of APS and ACS, have effectively expanded food access, particularly in cities where these spaces were strategically implemented. The analysis shows that as accessible areas within LLs increased, the total food desert areas decreased, demonstrating the crucial role AFIs play in enhancing local food accessibility.
However, the success of these AFIs depends heavily on their geographic expansion. The accessibility of local, healthy and sustainable food generally increases with the size of LL regions, but this relationship is moderated by population density. Food desert areas, when correlated with the size of LLs, tend to be larger in sparsely populated, large LLs and smaller in densely populated, smaller LLs. Despite the variation in size and population density, the reduction of food desert areas was observed across most LLs, except for a few cases like Rome and Rijeka. This points to the potential challenges faced by highly dense or spatially constrained regions, where existing infrastructure and urban design limit the ability to reduce food desert areas entirely.
The reduction of food desert areas, driven by the expansion of accessible areas, opens up new opportunities for local food producers. Food deserts can be transformed into food oases by introducing healthy, locally produced foods, providing a chance for local producers to tap into underserved markets. By supplying local, sustainable, and nutritious food options, producers can contribute to both the economic growth of local food systems and the overall food security of the population.
In densely populated LLs, while AFIs have shown effectiveness, future interventions should focus on optimizing space utilization and improving distribution networks. Further research is needed to identify the most effective ways of scaling up these interventions in cities with limited space but high population demand. LLs with larger land areas and more dispersed populations should consider holistic approaches integrating food systems planning with transportation and infrastructure development. Policymakers and urban planners should encourage local food producers to enter food desert areas. Local producers can contribute to food security while growing their businesses by creating market opportunities in these underserved regions. Creating more efficient food supply chains, increasing local food production, and improving transport access to alternative food sources can reduce the extent of food deserts in such regions. The findings also suggest that factors, such as socio-economic context, municipal support, and governance strategies, play crucial roles in shaping food deserts. As these aspects were not fully explored in this study, they present important areas for future research, which could yield insights that further enhance food accessibility and inform more effective urban planning and policy interventions.
Author Contributions
Conceptualization, L.F.-C. and J.P.-G.; methodology and investigation, L.F.-C., E.K.A., S.P.Ö., F.G.S. and J.P.-G.; data curation, L.F.-C., E.K.A., S.P.Ö. and J.P.-G.; writing—original draft preparation, L.F.-C.; writing—review and editing, L.F.-C., E.K.A. and J.P.-G.; supervision, E.K.A., L.M.N.-G. and J.P.-G. All authors have read and agreed to the published version of the manuscript.
Funding
This research was funded by the FUSILLI Project, grant number 101000717.
Acknowledgments
We would like to express our sincere gratitude to the FUSILLI cities for their unwavering support throughout this research. Their dedication to providing accurate and rigorously researched information has been invaluable to the success of this study.
Conflicts of Interest
The authors declare no conflicts of interest.
References
- World Bank 2023. Available online: https://www.worldbank.org/en/topic/urbandevelopment/overview#:~:text=Globally%2C%20over%2050%25%20of%20the,housing%20their%20expanding%20populations%20need (accessed on 14 July 2024).
- Paül, V.; Haslam McKenzie, F. Peri-urban farmland conservation and development of alternative food networks: Insights from a case-study area in metropolitan Barcelona (Catalonia, Spain). Land Use Policy 2013, 30(1), 94–105. [Google Scholar] [CrossRef]
- FAO. 2023. The State of Food and Agriculture 2023 – Revealing the true cost of food to transform agrifood systems. Rome. [CrossRef]
- IPES-Food, 2023. Available online: https://ipes-food.org/wp-content/uploads/2024/03/PlatetoPlanetEN.pdf (accessed on 26 June 2024).
- Montanyà, O., & Amat, O. The resilience factors of the agrifood supply chain: An integrative review of the literature in the context of the COVID-19 pandemic. Intangible Capital 2023, 19(3), 379-392. [CrossRef]
- United Nations. Zero Hunger: Why It Matters; United Nations: New York, NY, USA, 2016; Available online: https://www.un.org/sustainabledevelopment/wp-content/uploads/2018/09/Goal-2.pdf (accessed on 26 June 2024).
- Gori, F.; Castellini, A. Alternative Food Networks and Short Food Supply Chains: A Systematic Literature Review Based on a Case Study Approach. Sustainability 2023, 15, 8140. [Google Scholar] [CrossRef]
- Poças Ribeiro, A.; Harmsen, R.; Feola, G.; Rosales Carréon, J.; Worrell, E. Organising alternative food networks (AFNs): Challenges and facilitating conditions of different AFN types in three EU countries. Sociol. Rural. 2021, 61, 491–517. [Google Scholar] [CrossRef]
- Gugerell, C.; Sato, T.; Hvitsand, C.; Toriyama, D.; Suzuki, N.; Penker, M. Know the Farmer That Feeds You: A Cross-Country Analysis of Spatial-Relational Proximities and the Attractiveness of Community Supported Agriculture. Agriculture 2021, 11, 1006. [Google Scholar] [CrossRef]
- Zhong T., Crush J., Si Z., Scott S. The Nanjing model: Comprehensive food system governance, localization and urban food security in China. Global Food Security 2023, 38 100709. [CrossRef]
- MUFPP (Milan Urban Food Policy Pact), 2015. Milan Urban Food Policy Pact. Available at: https://www.milanurbanfoodpolicypact.org/wp-content/uploads/2020/12/Milan-Urban-Food-Policy-Pact-EN.pdf. (accessed on 26 June 2024).
- UN-Habitat, 2017. New urban agenda: quito declaration on sustainable cities and human settlements for all. Available at: https://habitat3.org/wp-content/uploads/NUA-English.pdf. (accessed on 26 June 2024).
- Blay-Palmer, A.; Santini, M.; Dubbeling, M.; Renting, H.; Taguchi, M.; Giordano, T. Validating the city region food system approach: enacting inclusive, transformational city region food systems. Sustainability 2018, 10(5), 1680. [Google Scholar] [CrossRef]
- Sonnino, R.; Coulson, H. Unpacking the new urban food agenda: the changing dynamics of global governance in the urban age. Urban Stud 2020, 58(5), 1032–1049. [Google Scholar] [CrossRef]
- Campbell, C.; Calderon, M.M.; Vieira, J. The Consequences of living in a small-town food desert: mixed methods evidence from a Quasi-Experiment. Soc. Curr 2020, 7 (6), 563–581. [CrossRef]
- Beaulac, J.; Kristjansson, E.; & Cummins, S. A Systematic Review of Food Deserts, 1966-2007. (A105, Ed.) Preventing Chronic Disease. Public Health Research, Practice and Policy 2009, 6(3).
- Chen, K.; Clark, J. Interactive three-dimensional geovisualization of space time access to food. Applied Geography 2013, (43), 81–86. [Google Scholar] [CrossRef]
- Smets, V.; Cant, J.; Vandevijvere, S. The Changing Landscape of Food Deserts and Swamps over More than a Decade in Flanders, Belgium. Sustainability 2022, 19(21), 13854. [Google Scholar] [CrossRef] [PubMed]
- Karakaya Ayalp, E.; Fernández Casal, L.; Öztürk, S.P.; Pinedo Gil, J.; Geçer Sarhın, F. Food deserts of alternative consumption spaces in Europan cities. Proceedings of 11th AESOP Sustainable Food Planning Conference, Ghent and Brussels, Belgium, 19-22 June 2024. [Google Scholar]
- FAO, Milan Urban Food Policy Pact and RUAF. Milan Urban Food Policy Pact Monitoring Framework. July 2018 Version. Available at: https://www.fao.org/3/CB4040EN/CB4040EN.pdf (accessed on 26th June 2024).
- Goodman, D. Rural Europe Redux? Reflections on Alternative Agro-Food Networks and Paradigm Change. Sociol. Rural 2004, 44, 14–15. [Google Scholar] [CrossRef]
- Chen, T.; Gregg, E. Food Deserts and Food Swamps: a primer. National Collaborating Centre for Environmental Health. Vancouver: National Collaborating Centre for Environmental Health. 2017. Available at: https://ncceh.ca/sites/default/files/Food_Deserts_Food_Swamps_Primer_Oct_2017.pdf.
- Kato, Y.; McKinney, L. Bringing food desert residents to an alternative food market: a semi-experimental study of impediments to food access. Agriculture and Human Values 2015, (32), 215–227. [Google Scholar] [CrossRef]
- Sitaker, M.; Kolodinsky, J.; Wang, W.; Chase, L.; Van Soelen Kim, J.; Smith, D.; Greco, L. Evaluation of Farm Fresh Food Boxes: A Hybrid Alternative Food Network Market Innovation. Sustainability 2020, 12(24), 10406. [Google Scholar] [CrossRef]
- Goodman, D.; DuPuis, M.; Goodman, M. Alternative Food Networks: Knowledge, Practice and Politics. Routledge 2012, London and New York, 1–X. [Google Scholar] [CrossRef]
- Sage, J.L.; McCracken, V.A.; Kneafsey, M.; Cox, R.; Holloway, L.; Dowler, E.; Venn, L. Mitigating food deserts: Do farmers’ markets break from the status quo? Regional Science Policy & Practice, 2017. [Google Scholar] [CrossRef]
- Kneafsey, M.; Dowler, E.; Lambie-Mumford, H.; Inman, A.; Collier, R. Consumers and food security: Uncertain or empowered? Journal of Rural Studies, 2013. [Google Scholar] [CrossRef]
- Ares, G.; Turra, S.; Bonilla, L.; Costa, M.; Verdier, S.; Brunet, G.; Alcaire, F.; Curutchet, M.R.; Vidal, L. WEIRD and non-consensual food deserts and swamps: A scoping review of operational definitions. Health & Place, 2024. [Google Scholar] [CrossRef]
- Safayet, M.; Casellas Connors, J.P.; Watson, M. Measuring access to food banks and food pantries: A scoping review of spatial analysis approaches. Health Place 2024, 88, 103251. [Google Scholar] [CrossRef]
- Kelly, B., Flood, V. M.; Yeatman, H. Measuring local food environments: An overview of available methods and measures. Health and Place 2011, 17(6), 1284-1293.
- Ver Ploeg, M.; Dutko, P.; Breneman, V. Measuring Food Access and Food Deserts for Policy Purposes. Applied Economic Perspectives and Policy. 2015; 37. [Google Scholar] [CrossRef]
- Misiaszek, C.; Buzagony, S.; Freishtat, H. Baltimore City’s Food Environment: 2018 Report. Johns Hopkins Cent. Livable Future 2018, Baltimore, 1–X. [Google Scholar]
- Salih, S. H.; Lee, J. B. Measuring transit accessibility: A dispersion factor to recognise the spatial distribution of accessible opportunities. Journal of Transport Geography 2022, 98, 103238. [Google Scholar] [CrossRef]
- Cracu, G.-M.; Schvab, A.; Prefac, Z. , Popescu, M.; Sîrodoev, I. A GIS-based assessment of pedestrian accessibility to urban parks in the city of Constanța, Romania. Applied Geography 2024, 165, 103229. [Google Scholar] [CrossRef]
- Forte Rauli, A. Proximity-centered accessibility from the perspective students from Portugal and Brazil. Master in Spatial Planning and Urban Project, The University of Porto, Department of Engineering, Porto. 2023. [Google Scholar]
- Grauel, K.; Chambers, K.J. Food Deserts and Migrant Farmworkers: Assessing Food Access in Oregon's Willamette Valley. J. Ethnobiol. 2014, 34, 228–250. [Google Scholar] [CrossRef]
- Francis, L.; Perrin, N.; Curriero, F.C.; Black, M.M.; Allen, J.K. Food Desert Status of Family Child Care Homes: Relationship to Young Children's Food Quality. Int. J. Environ. Res. Public Health 2022, 19. [Google Scholar] [CrossRef]
- Cerceo, E.; Sharma, E.; Boguslavsky, A.; Rachoin, J.S. Impact of food environments on obesity rates: a state-level analysis. Journal of Obesity, 2023. [Google Scholar] [CrossRef]
- Fortin-Miller, S.A.; Grantham, C.E.; Campbell, J.E.; Salvatore, A.L.; Hoffman, L.A.; Sisson, S.B. The effect of the food environment on fresh produce served in family child care homes. Nutr. Health (Bicester) 2021, 27(4), 381–386. [Google Scholar] [CrossRef] [PubMed]
- Testa, A.M. Access to healthy food retailers among formerly incarcerated individuals. Publ. Health Nutr, 2019. [Google Scholar] [CrossRef]
- Santorelli, M.L.; Okeke, J.O. Evaluating community measures of healthy food access. J. Community Health 2017, 42(5), 991–997. [Google Scholar] [CrossRef] [PubMed]
- Sohi, I.; Bell, BA; Liu, J.; Battersby, S.E.; Liese, A.G. Differences in food environment perceptions and spatial sttributes of food shopping between residents of low and high food access areas. J. Nutr. Educ. Behav 2014, 46(4), 241–249. [Google Scholar] [CrossRef] [PubMed]
- Liese, A.D.; Hibbert, J.D.; Ma, X.; Bell, B.A.; Battersby, S.E. Where are the food deserts? An evaluation of policy-relevant measures of community food access in South Carolina. Journal of Hunger and Environmental Nutrition 2014, 9, 16–32. [Google Scholar] [CrossRef]
- Ma, X. , Battersby, S.E.; Bell, BA; Hibbert, J.D. Variation in low food access areas due to data source inaccuracies. Appl. Geogr. 2013, 45, 131–137. [Google Scholar] [CrossRef]
- Karakaya Ayalp, E.; Öztürk, S.P.; Geçer Sargın, F. Deliverable 3.4 Peri Urban and Rural Links- Specific Policies and Actions Report. FUSILLI Project. 2023. Available at: https://fusilli-project.eu/outcomes/eu-project-reports/?cn-reloaded=1 (accessed on 19 August 2024).
- Brenner, N.; Katsikis, N. Operational landscapes of Capitalocene. AD/ Architectural Design, 2020; 90. [Google Scholar] [CrossRef]
- Born, B.; Purcell, M. Avoiding the local trap: Scale and food systems in planning research. Journal of Planning Education and Research. 2006, 26, 195–207. [Google Scholar] [CrossRef]
- Cummins, S.; Flint, E.; Matthews, S. A. New neighborhood grocery store increased awareness of food access but did not alter dietary habits or obesity. Health Affairs. 2014, 33(2), 283–291. [Google Scholar] [CrossRef] [PubMed]
- Walker, R. E.; Keane, C. R.; Burke, J. G. Disparities and access to healthy food in the United States: A review of food deserts literature. Health & Place. 2010. [Google Scholar] [CrossRef]
- Morgan, K.; Sonnino, R. The urban foodscape: world cities and the new food equation. Cambridge J. Reg., Econ. Soc. 2010; 3, 209–224. [Google Scholar] [CrossRef]
- Prosperi, P.; Moragues-Faus, A.; Sonnino, R. and Devereux, C. Measuring progress towards sustainable food cities: Sustainability and food security indicators Report of the ESRC financed Project “Enhancing the Impact of Sustainable Urban Food Strategies”. 2015. Access: http://sustainablefoodcities.org/getstarted/developingindicators.
- Varner, T.; Otto, D. Factors affecting sales at farmers’ markets: An Iowa study. Rev. Agric. Econ. 2008, 30, 176–189. [Google Scholar] [CrossRef]
- Malagon-Zaldua, E.; Begiristain-Zubillaga, M.; Oñederra-Aramendi, A. Measuring the Economic Impact of Farmers’ Markets on Local Economies in the Basque Country. Agriculture 2018, 8, 10. [Google Scholar] [CrossRef]
- Dutko, P.; Ver Ploeg, M.; Farrigan, T. Characteristics and Influential Factors of Food Deserts. United States Department of Agriculture, Economic Research Report No. 140, 2012. [Google Scholar]
- Ver Ploeg, M. , Breneman, V., Dutko, P., Williams, R., Snyder, S., Dicken, C., & Kaufman, P. Access to Affordable and Nutritious Food: Updated Estimates of Distance to Supermarkets Using 2010 Data. USDA Economic Research Service Report, 2012. [Google Scholar]
- Bloem, S.; de Pee, S. Developing approaches to achieve adequate nutrition among urban populations requires an understanding of urban development. Global Food Security, 2017. [Google Scholar] [CrossRef]
- Safta, D. A Desert Mirage, Myth of Detroit’s Food Desert. Undergraduate Journal of Public Health 2024, 8. [Google Scholar] [CrossRef]
- Larsen, K.; Gilliland, J. A farmers' market in a food desert: Evaluating impacts on the price and availability of healthy food. Health & Place. 2009, 15, 1158–1162. [Google Scholar] [CrossRef]
- Karakaya Ayalp, E.; Güntan, B.; Yarış, A.; Aksu, B.; Tonguç, E.; Şahintürk, C.; Cesur, H.C.; Vural, A. Spatial tools for urban food planning. Proceedings of 47th World Urbanism Day Colloquium, Ankara, Turkey, 8-10 November 2023. [Google Scholar]
- Karakaya Ayalp, E.; Tatari, M.F.; Doğan, O. Karşıyaka Urban Food Strategy. Karşıyaka Municipality. 2023. Available at https://www.karsiyaka.bel.tr/tr/kentsel-gida-stratejisi (accessed 18 September 2024).
- Sadler, R. C.; Gilliland, J. A.; Arku, G. A food retail-based intervention on food security and consumption. International Journal of Environmental Research and Public Health. 2013, 10(8), 3325–3346. [Google Scholar] [CrossRef]
- D’Acosta, J. Finding food deserts: a study of food access measures in the phoenix-mesa urban area. A Thesis Presented to the Faculty of the USC Graduate School University of Southern California. California. August 2015.
- Janatabadi, F.; Newing, A.; Ermagun, A. Social and spatial inequalities of contemporary food deserts: A compound of store and online access to food in the United Kingdom. Applied Geography 2024, Volume 163, 103184. [Google Scholar] [CrossRef]
- Jin, H.; Lu, Y. SAR-Gi*: Taking a spatial approach to understand food deserts and food swamps. Applied Geography, 2021; 134, 102529. [Google Scholar] [CrossRef]
- Jiao, J; Azimian, A. Measuring accessibility to grocery stores using radiation model and survival analysis. Journal of Transport Geography 2021, Volume 94, 103107. [CrossRef]
- Li, C.; Ghiasi, A.; Li, X.; Chi, G. Sociodemographics and access to organic and local food: A case study of New Orleans, Louisiana. Cities 2018, 79, 141–150. [Google Scholar] [CrossRef] [PubMed]
- Granheim, S.I.; Løvhaug, A.L.; Terragni, L.; Torheim, L.E.; Thurston, M. Mapping the digital food environment: a systematic scoping review. Obes. Rev, 2022; 23. [Google Scholar] [CrossRef]
- WHO European Office for the Prevention and Control of Noncommunicable Diseases. Slide to order: a food systems approach to meals delivery apps: WHO European Office for the Prevention and Control of Noncommunicable diseases. Copenhagen: WHO Regional Office for Europe; 2021. Licence: CC BY-NC-SA 3.0 IGO. Available at: https://www.who.int/europe/publications/i/item/WHO-EURO-2021-4360-44123-62247.
- Mateos-Mínguez, ; Arranz-López, A.; Soria-Laraa, J.A. Analysing the spatial impacts of retail accessibility for e-shoppers’ groups. Transportation Research Procedia 2022, 60 544–551 XXV International Conference Living and Walking in Cities - New scenarios for safe mobility in urban areas (LWC 2021), 9-10 September 2021, Brescia, Italy.
- Bridle-Fitzpatrick, S. Food deserts or food swamps? A mixed-methods study of local food environments in a Mexican city. Soc. Sci. Med. 2015, 142, 202–213. [CrossRef]
- Aretz, B.; Costa, R.; Doblhammer, G.; Janssen, F. The association of unhealthy and healthy food store accessibility with obesity prevalence among adults in the Netherlands: A spatial analysis. SSM - Population Health, 2023; 21, 101332. [Google Scholar] [CrossRef]
Figure 1.
Accessible areas and food deserts representation at T0 in the 11 LLs.
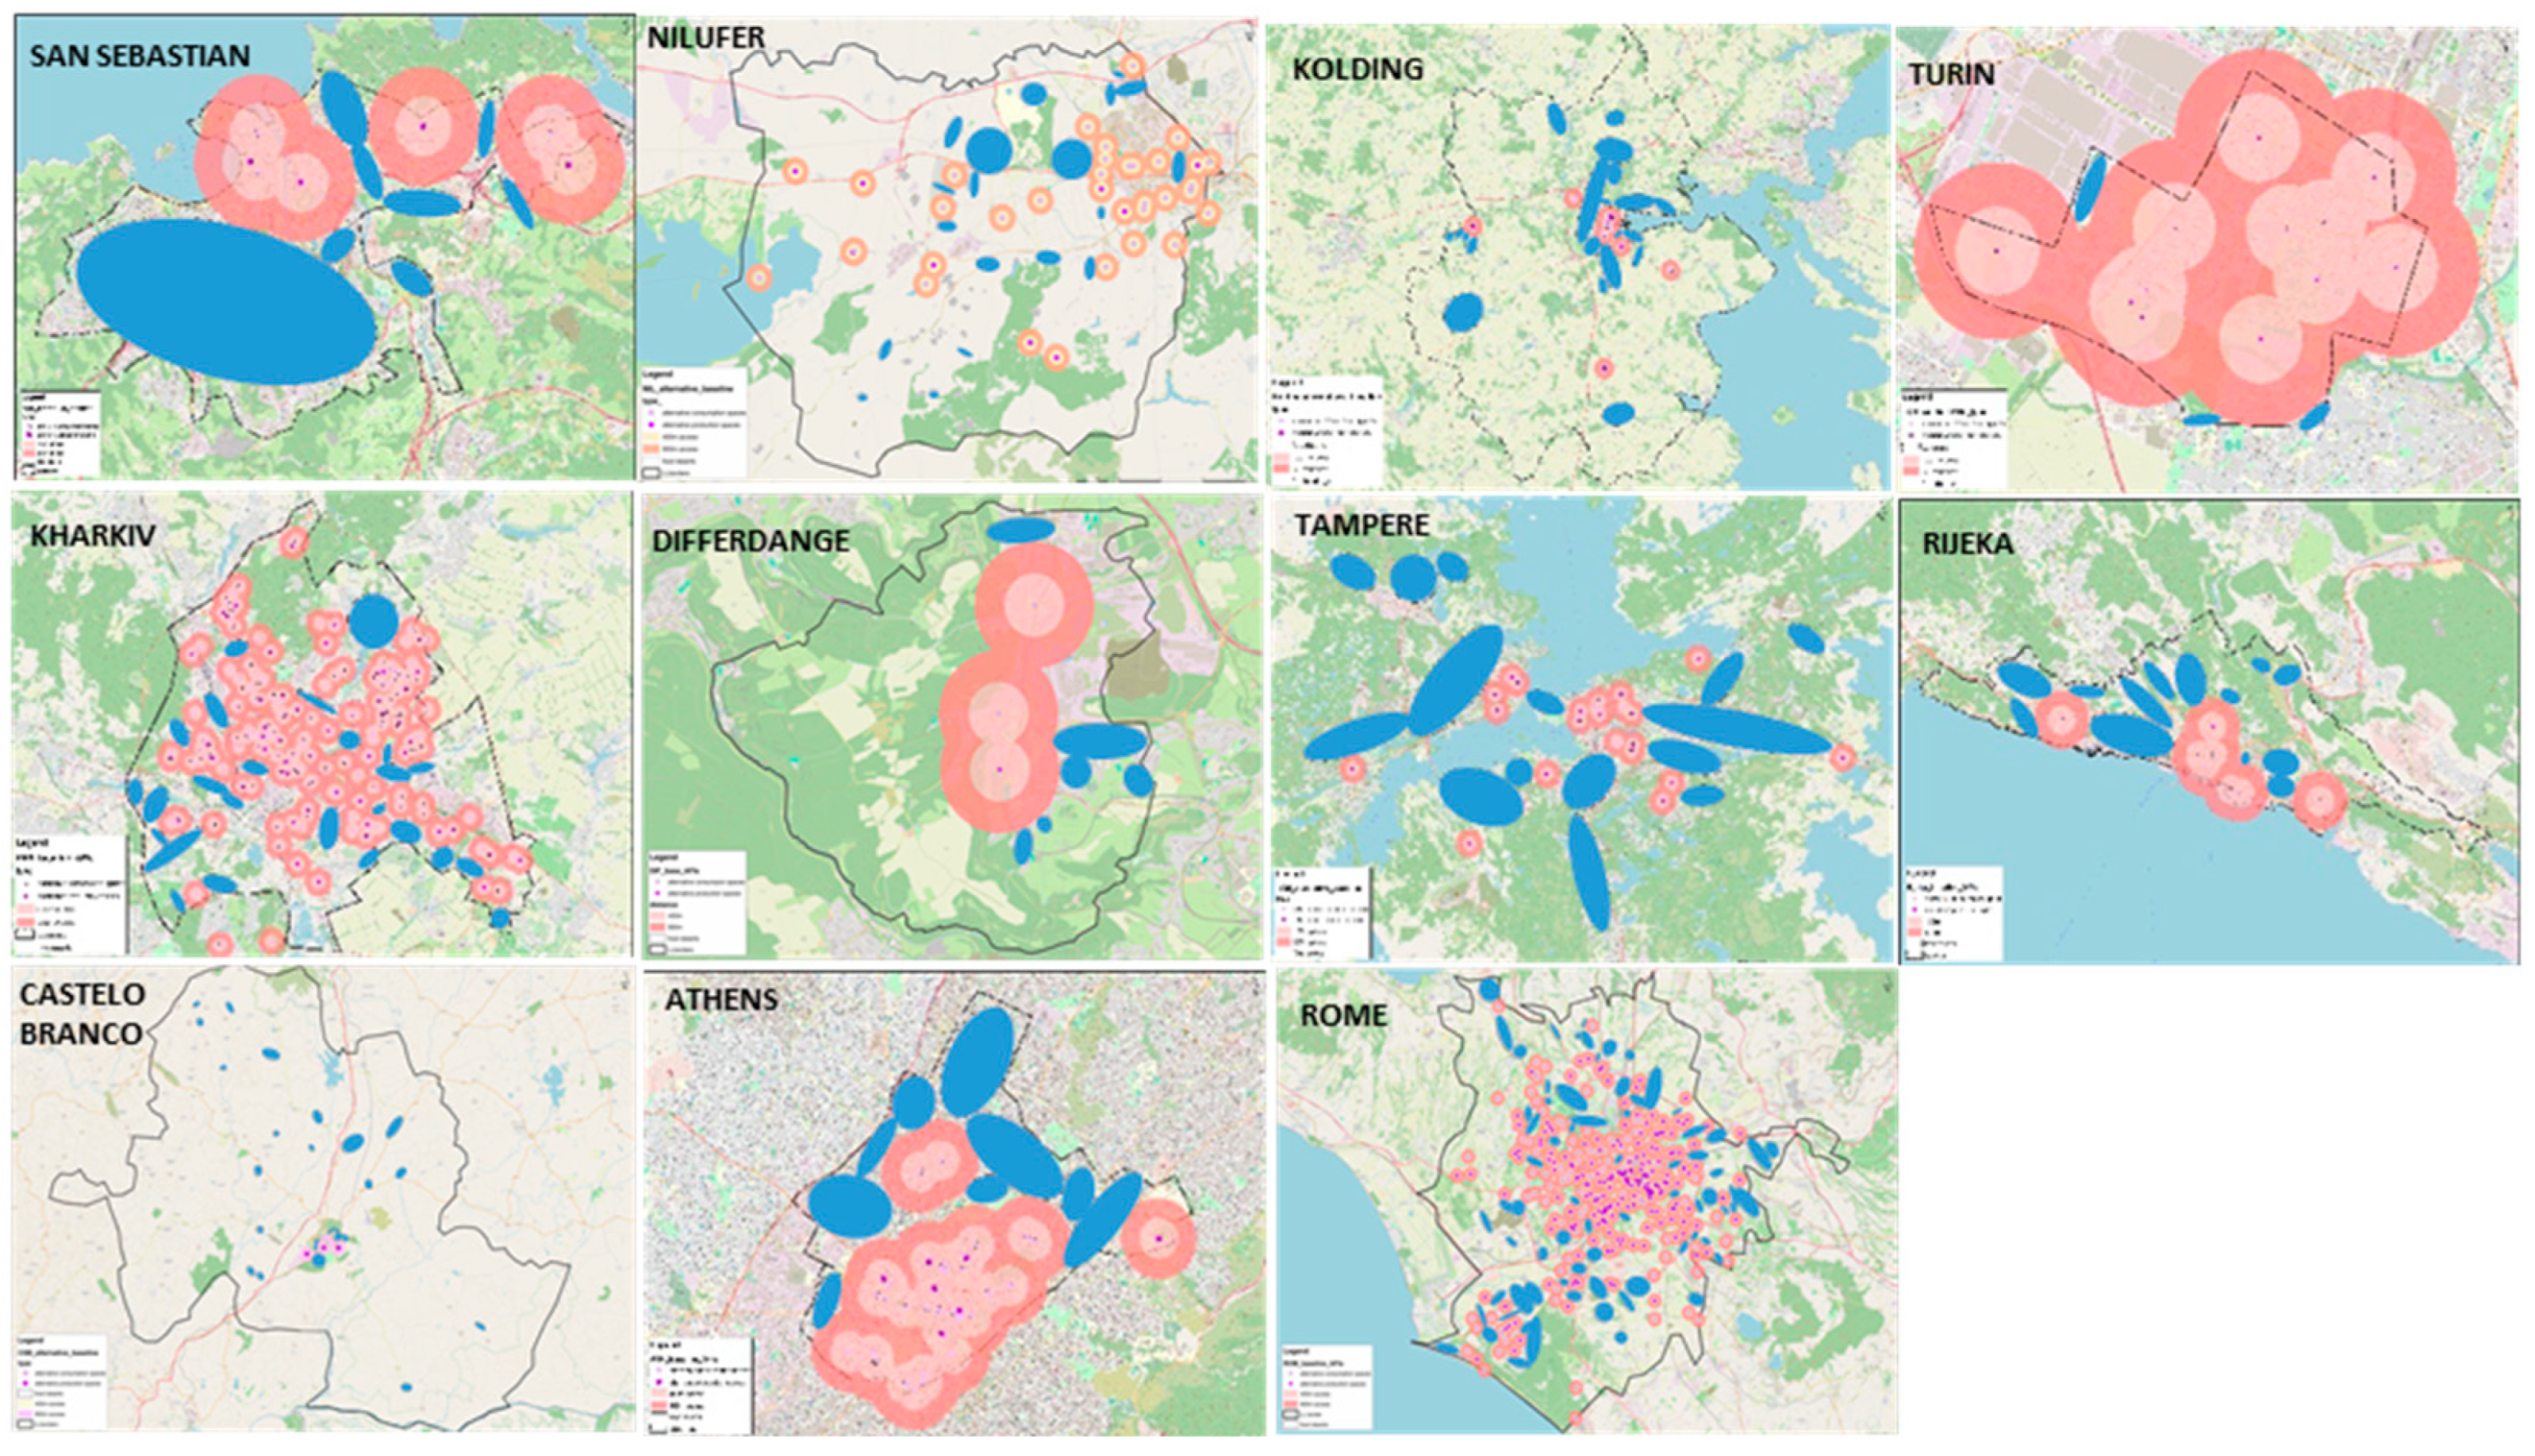
Figure 2.
Food deserts representation at Tf in the 11 LLs.
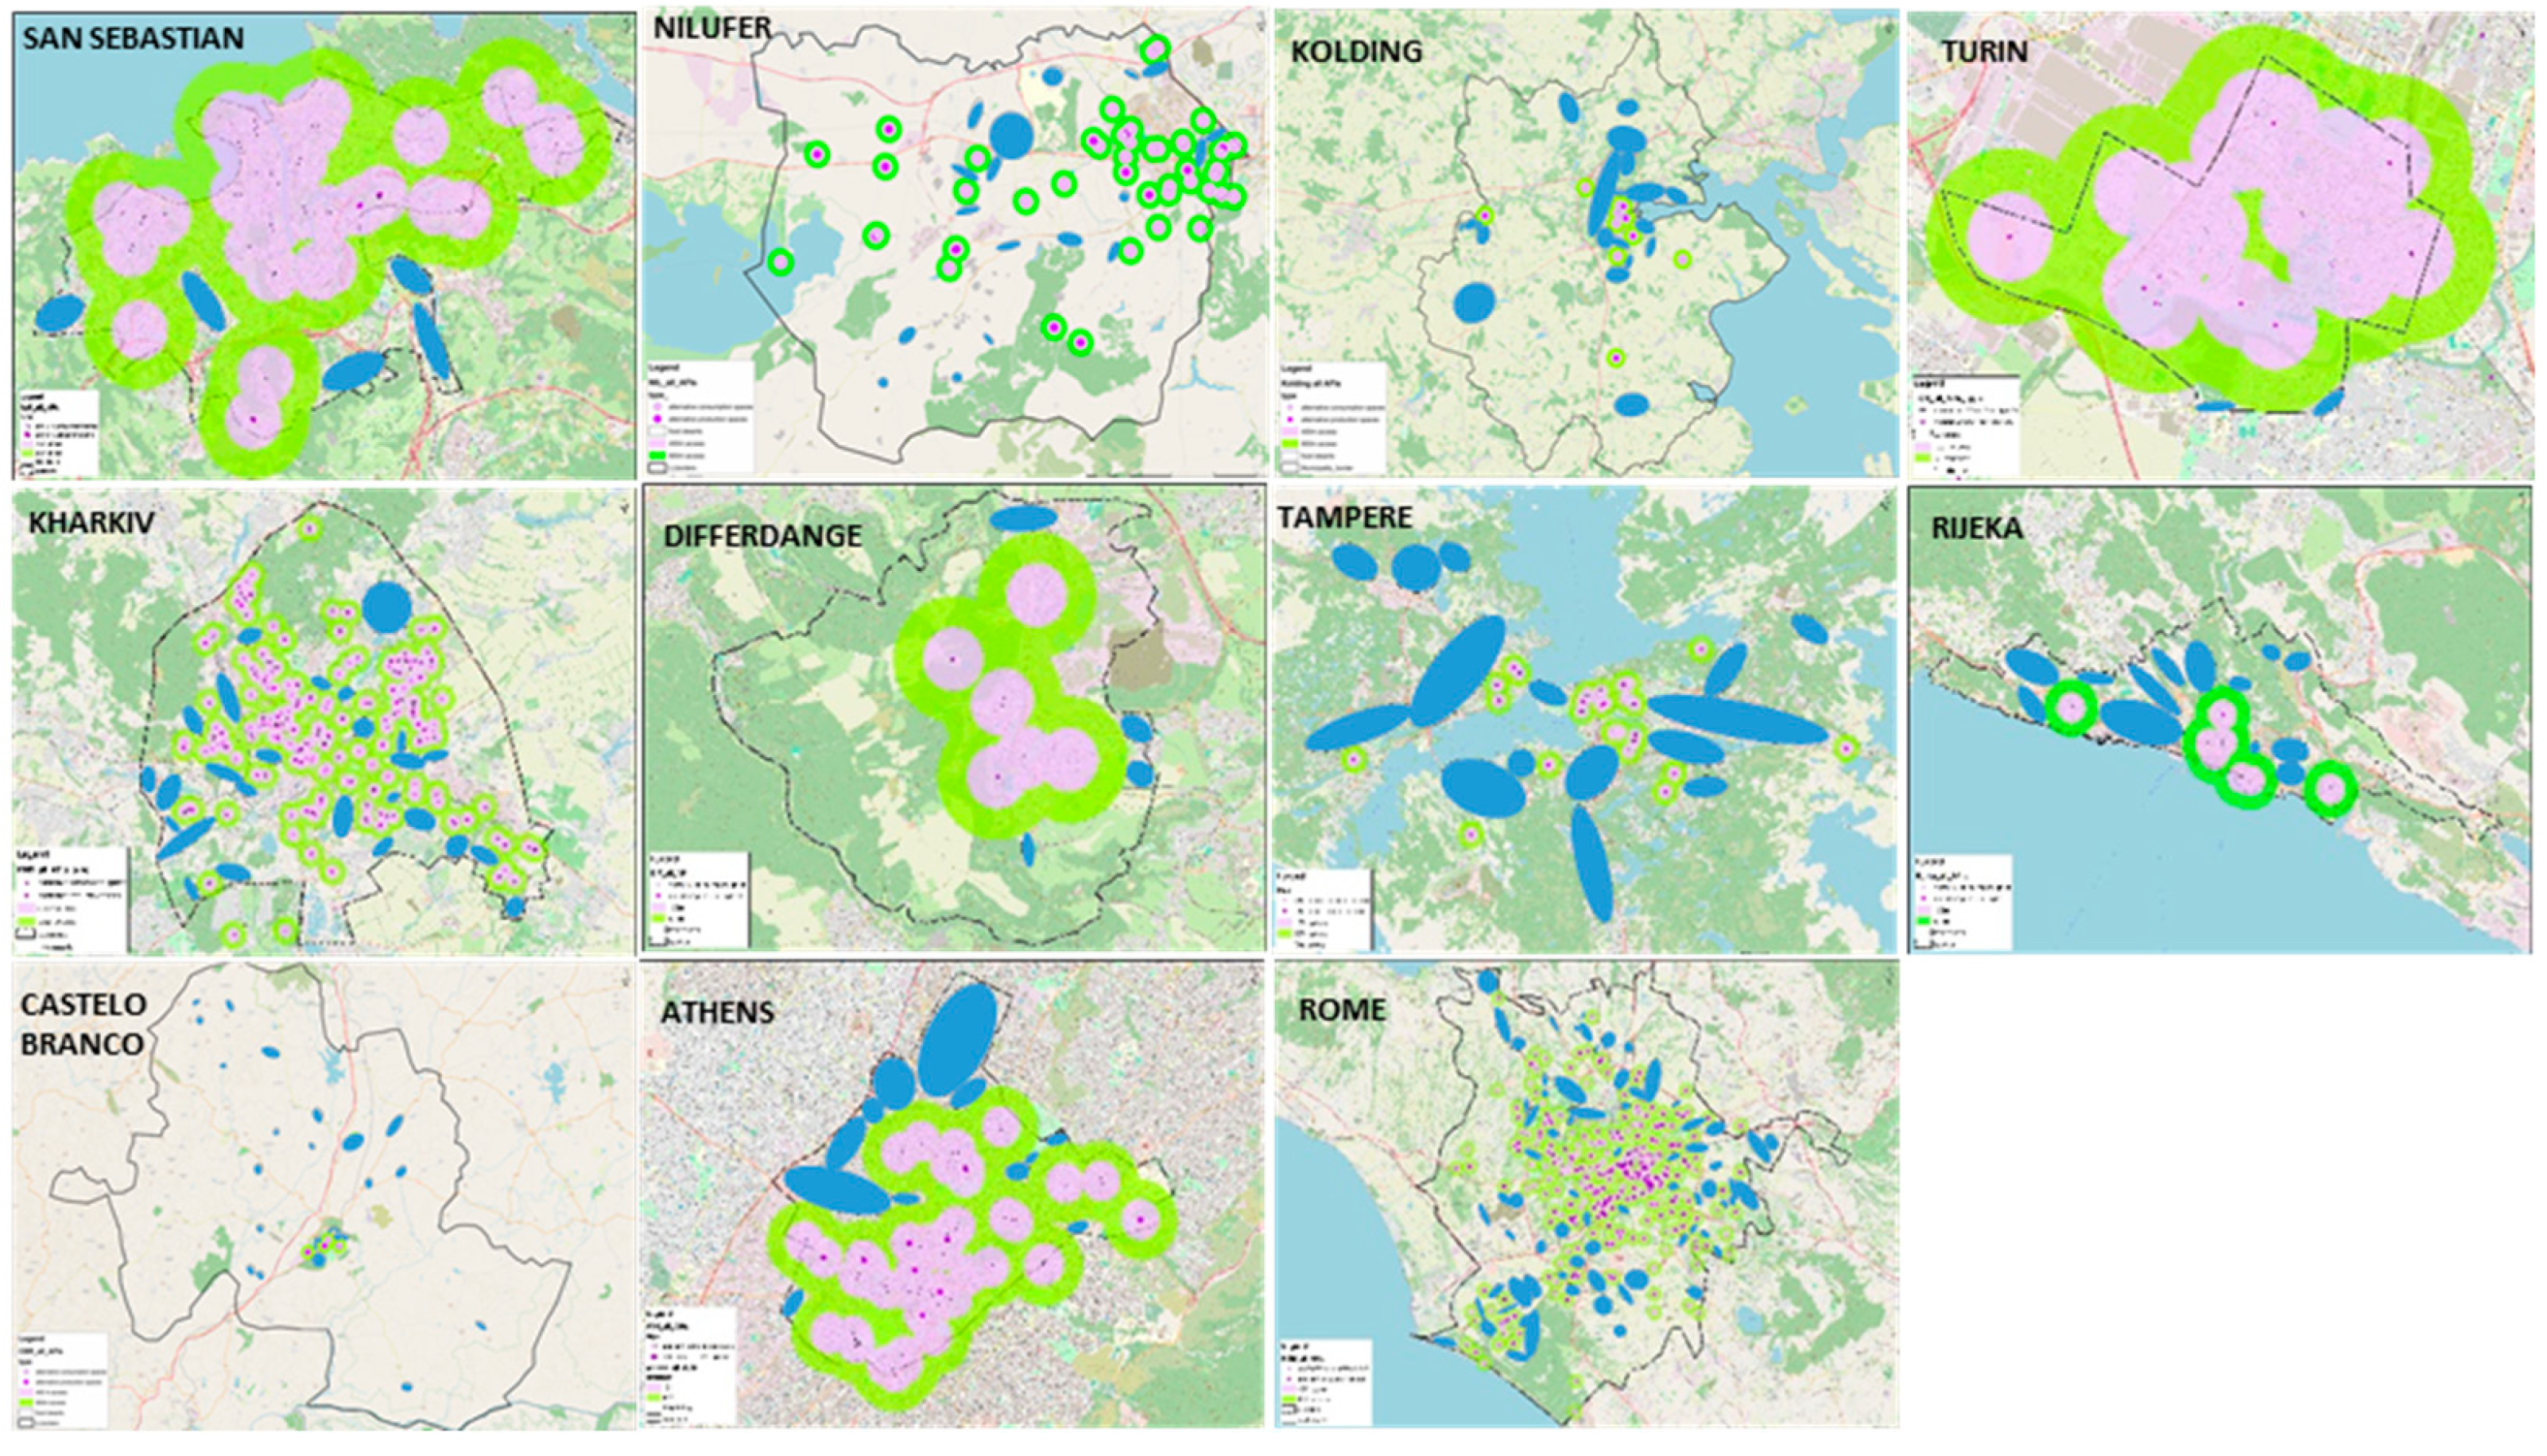
Figure 3.
Comparison of food deserts representation at T0 and Tf in the 11 LL cities.
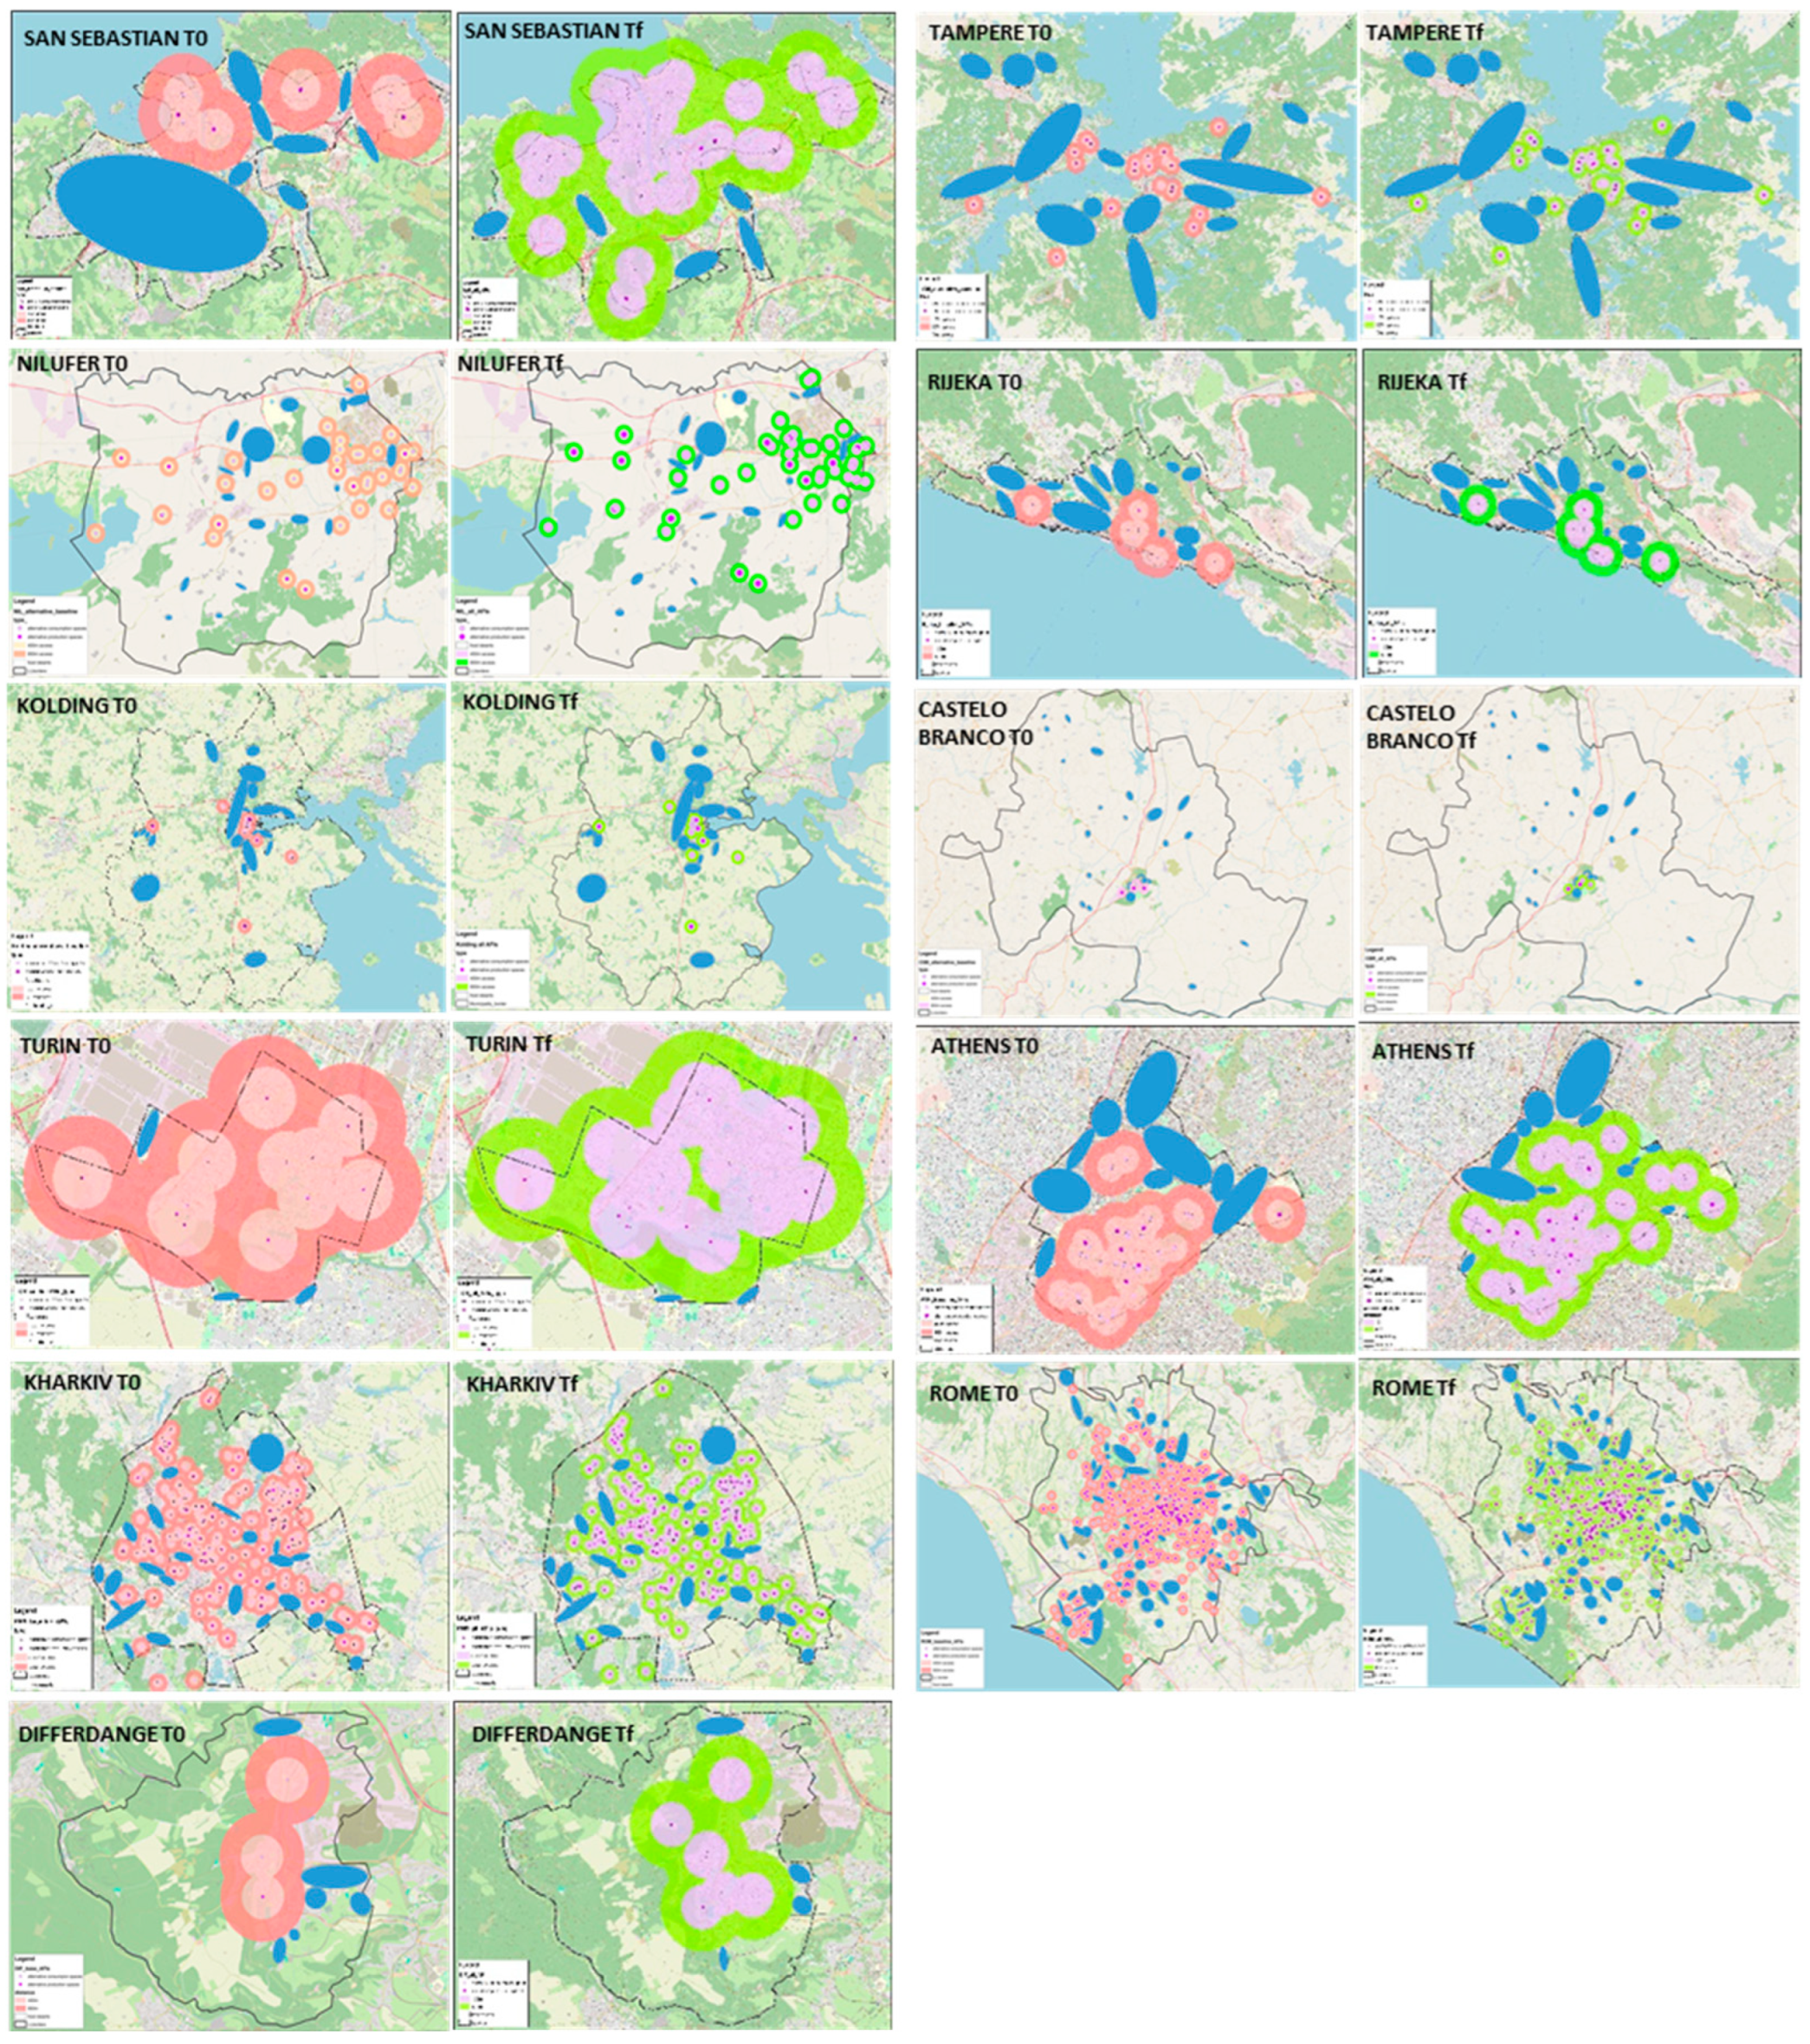

Table 1.
Main APS and ACS located.
| Alternative Production Spaces | Alternative Consumption Spaces |
|---|---|
| Urban farms | Farmers markets |
| Urban community gardens | Local food markets |
| Food roof-top gardens | Ecologic markets/shops |
| Community supported agriculture | Fair trade markets/shops |
| Producers cooperatives | Food festivals and gastronomic fairs |
| Ecovillages | Community kitchens |
| Agri-parks | Consumers cooperatives |
| Buyers food clubs | |
| Neighborhood food communities | |
| Farm side produce sale | |
| Van markets |
Source: Elaborated by authors.
Table 2.
Analysis of accessible areas and food deserts results at T0 and Tf in the 11 LL cities.
| City LL | Time | LL population | Area of LL border (km2) | Total accessible area (km2) | Food deserts area (km2) |
|---|---|---|---|---|---|
| San Sebastian | T0 | 188,743 | 60 | 8.7 | 8.5 |
| Tf | 26.3 | 1.3 | |||
| Nilüfer | T0 | 536,365 | 507.1 | 59.3 | 17.6 |
| Tf | 67.5 | 12.6 | |||
| Kolding | T0 | 90,000 | 605 | 22 | 43 |
| Tf | 25 | 41 | |||
| Turin | T0 | 33,816 | 8 | 11.7 | 0.1 |
| Tf | 12.5 | 0.05 | |||
| Kharkiv | T0 | 1,158,485 | 344 | 156 | 34.3 |
| Tf | 158 | 32 | |||
| Differdange | T0 | 29,764 | 22.2 | 5.1 | 1.1 |
| Tf | 7.8 | 0.4 | |||
| Tampere | T0 | 250,353 | 523.4 | 59 | 99 |
| Tf | 63 | 97 | |||
| Rijeka | T0 | 107,964 | 43.4 | 9.9 | 7.1 |
| Tf | 9.9 | 7.1 | |||
| Castelo Branco | T0 | 47,849 | 1,438.2 | 7 | 15.6 |
| Tf | 9.1 | 12.6 | |||
| Athens | T0 | 643,452 | 39 | 20 | 10 |
| Tf | 28.7 | 5.6 | |||
| Rome | T0 | 2,873,000 | 1,285 | 339 | 102.7 |
| Tf | 339 | 102.7 |
Source: Own elaboration of authors based on cities statistics and GIS data.
Table 3.
Total accessible area vs. LL area and vs. population at T0 and Tf.
| City LL | Time | Total accessible area (km2) | Total accessible area vs LL border area (%) | Total accessible area vs population (m2 /inhab.) | |
|---|---|---|---|---|---|
| San Sebastian | T0 | 8,7 | 14,5 | 46,1 | |
| Tf | 26,3 | 43,8 | 139,3 | ||
| Nilüfer | T0 | 59,3 | 11,7 | 110,6 | |
| Tf | 67,5 | 13,3 | 125,8 | ||
| Kolding | T0 | 22 | 3,6 | 244,4 | |
| Tf | 25 | 4,1 | 277,8 | ||
| Turin | T0 | 11,7 | 146,3 | 346,0 | |
| Tf | 12,5 | 156,3 | 369,6 | ||
| Kharkiv | T0 | 156 | 45,3 | 134,7 | |
| Tf | 158 | 45,9 | 136,4 | ||
| Differdange | T0 | 5,1 | 23,0 | 171,3 | |
| Tf | 7,8 | 35,1 | 262,1 | ||
| Tampere | T0 | 59 | 11,3 | 235,7 | |
| Tf | 63 | 12,0 | 251,6 | ||
| Rijeka | T0 | 9,9 | 22,8 | 91,7 | |
| Tf | 9,9 | 22,8 | 91,7 | ||
| Castelo Branco | T0 | 7 | 0,5 | 146,3 | |
| Tf | 9,1 | 0,6 | 190,2 | ||
| Athens | T0 | 20 | 51,3 | 31,1 | |
| Tf | 28,7 | 73,6 | 44,6 | ||
| Rome | T0 | 339 | 26,4 | 118,0 | |
| Tf | 339 | 26,4 | 118,0 | ||
| Average | T0 | 32,4 | 152,3 | ||
| Tf | 39,5 | 182,5 |
Source: Own elaboration based on cities statistics and GIS data.
Table 4.
Food deserts area vs. LL area and vs. population at T0 and Tf.
| City LL | Time | Food deserts area (km2) | Food deserts area vs LL border area (%) | Food deserts area vs population (m2/inhab.) | |
|---|---|---|---|---|---|
| San Sebastian | T0 | 8,5 | 14,2 | 45,0 | |
| Tf | 1,3 | 2,1 | 6,9 | ||
| Nilüfer | T0 | 17,6 | 3,5 | 32,8 | |
| Tf | 12,6 | 2,5 | 23,5 | ||
| Kolding | T0 | 43 | 7,1 | 477,8 | |
| Tf | 41 | 6,8 | 455,6 | ||
| Turin | T0 | 0,1 | 1,3 | 3,0 | |
| Tf | 0,05 | 0,6 | 1,5 | ||
| Kharkiv | T0 | 34,3 | 10 | 29,6 | |
| Tf | 32 | 9,3 | 27,6 | ||
| Differdange | T0 | 1,1 | 5,0 | 37,0 | |
| Tf | 0,4 | 1,8 | 13,4 | ||
| Tampere | T0 | 99 | 18,9 | 395,4 | |
| Tf | 97 | 18,5 | 387,5 | ||
| Rijeka | T0 | 7,1 | 16,4 | 65,8 | |
| Tf | 7,1 | 16,4 | 65,8 | ||
| Castelo Branco | T0 | 15,6 | 1,1 | 326,0 | |
| Tf | 12,6 | 0,9 | 263,3 | ||
| Athens | T0 | 10 | 25,6 | 15,5 | |
| Tf | 5,6 | 14,4 | 8,7 | ||
| Rome | T0 | 102,7 | 8 | 35,7 | |
| Tf | 102,7 | 8 | 35,7 | ||
| Average | T0 | 10,1 | 133,1 | ||
| Tf | 7,4 | 117,2 |
Source: Own elaboration based on cities statistics and GIS data.
Disclaimer/Publisher’s Note: The statements, opinions and data contained in all publications are solely those of the individual author(s) and contributor(s) and not of MDPI and/or the editor(s). MDPI and/or the editor(s) disclaim responsibility for any injury to people or property resulting from any ideas, methods, instructions or products referred to in the content. |
© 2024 by the authors. Licensee MDPI, Basel, Switzerland. This article is an open access article distributed under the terms and conditions of the Creative Commons Attribution (CC BY) license (http://creativecommons.org/licenses/by/4.0/).
Copyright: This open access article is published under a Creative Commons CC BY 4.0 license, which permit the free download, distribution, and reuse, provided that the author and preprint are cited in any reuse.


