
Submitted:
17 December 2024
Posted:
18 December 2024
You are already at the latest version
Abstract
The interest in Boron Neutron Capture Therapy (BNCT) has been recently increasing thanks to the latest advancements in accelerator technology which allow to generate the required neutron field from accelerator facilities that could be hosted in hospitals or clinical centres. BNCT is a form of radiation therapy which relies on the highly localised and enhanced biological effects of the boron-10 (B-10) neutron capture (BNC) reaction products to selectively kill cancer cells. The BNC products are low-energy alpha and lithium ions, which are characterised by a high Linear Energy Transfer (LET) and a very short range lower than 9?m. The energy deposition and interaction with critical biological target such as DNA molecules is therefore strongly dependent on the B-10 spatial micro-distribution into the cells. In this framework, the Fluorescent Nuclear Track Detectors (FNTD) could be a promising device for the visualisation of the ion traversals induced in BNCT. FNTD consists of a fluorescent single-crystal aluminium oxide doped with carbon and magnesium, coupled with a Confocal Laser Scanning Microscopy (CLSM) read-out. Its biocompatibility allows to deposit and grow cells samples on its surface. If a layer of borated cells is deposited and irradiated by a neutron field, the energy deposited by the BNC products and their trajectories can be measured by analysing the corresponding track spots induced at different depths of the detector. This allows to reconstruct the position where the measured particles were generated, hence the micro-distribution of B-10. A FNTD was tested in three irradiation conditions to study the feasibility of FNTD for BNCT applications. The device was firstly irradiated by the alpha particles emitted by an Am-241 source (with energy of about 5.5 MeV). The same radiation field moderated by a 23?m layer of Mylar was then used to obtain alpha particles with a lower energy of about 2.5 MeV, thus closer to BNC products. Finally, the FNTD was tested at the University of Pavia’s LENA (Applied Nuclear Energy Laboratory) under a thermal neutron beam. A standard reference material (SRM) consisting of boron implanted on a silicon wafer was placed on the detector surface to reproduce a typical BNCT radiation field. The FNTD allowed to successfully measure the correct alpha particles range and mean penetration depth expected for all the radiation fields employed. This work proved the feasibility of FNTD to reconstruct the tracks of the alpha particles produced in typical BNCT conditions. Hence, FNTD will allow to measure the intra-cellular micro-distribution of B-10, bringing a significant contribution to the advancement of BNCT research. With this purpose, further experiments at LENA irradiating borated cell samples are planned.
Keywords:
BNCT
; Fluorescent Neutron Track Detector
; Particle track
; Radiation detector
1. Introduction
Boron Neutron Capture Therapy (BNCT) is a binary form of particle therapy used in the treatment of tumor pathologies. It consists of two distinct phases: (i) the intravenous administration of a compound enriched in 10B, which selectively accumulates in tumor cells, followed by (ii) the irradiation with a thermal or epithermal neutron beam, depending on the depth of the tumor target [1]. Apoptosis of tumor cells is triggered by significant DNA damage resulting from ionizations caused by the charged products of the 10B neutron capture reactions, specifically an particle and a 7Li nucleus. These products have ranges of approximately 9 µm and 4 µm, respectively, making them capable of depositing their energy primarily within the cell. The selectivity and effectiveness of BNCT thus depend closely on the biodistribution of 10B within the intracellular environment. Specifically, the likelihood of inducing DNA damage and subsequently killing the tumor cell increases with the greater internalization of 10B into the nucleus or its adjacent regions.
Currently, there are two 10B carriers available for BNCT treatments: disodium mercaptoundecahydrododecaborate (BSH, Na2B12H12SH) and p-Boron-L-phenylalanine (BPA, C9H12BNO4). The former accumulates in the intercellular space, while BPA is able to penetrate the cell membrane and potentially reach the nucleus. Therefore, it is evident from the described scenario that the biodistribution of 10B depends on the type of carrier administered to the patient and how this, in turn, is internalized by the individual cell. It is therefore crucial to study this distribution both intercellularly and intracellularly, as it has a significant impact on the efficacy of the treatment.
Several studies are currently underway to develop techniques capable of measuring the microdistribution of 10B within cells using different methods (i.e. secondary ion mass spectrometry, nano-SIMS [2]). This work aims to study the feasibility of an experimental method relying on a Fluorescent Nuclear Track Detector (FNTD) [3]. This device has several key advantages, including an excellent energy and spatial resolution, biocompatible surface, and reusability. FNTDs have already been applied in hadron therapy with the FNTD being the central component of the biosensor Cell-Fit-HD4D [4,5]. This study represents a significant innovation in the field of BNCT, as it is the first time that FNTD detectors are being explored as a potential tool for measuring the microdistribution of boron-10 (B-10).
2. Materials and Methods
The characterisation of FNTD detectors in radiation fields relevant to BNCT was carried out by combining the results of different experiments with reference simulations. The particle transport was simulated by means of the SRIM [6] to describe the particle path in the detector.
2.1. The Fluorescent Neutron Track Detector
Fluorescent Neutron Track Detector (FNTD) is a well-established technology based on a single-crystal made of aluminium oxide doped with carbon and magnesium impurities: . The crystal is grown following the Czochralski technique [3]. Carbon and magnesium doping is obtained, respectively, by dissolving carbon monoxide and by adding magnesium compounds (such as or ) in the raw material.
The single and double vacancies found in crystals result in different fluorescent centres: F-centres characterised by an absorption band at 205 and by an emission band at 420 with a 2 lifetime, -centres absorbing at 230 and 255 and emitting at 330 with 2 lifetime, and -centres absorbing at 435 and emitting at 520 with about 9 lifetime. -centres can easily absorb free-electrons generated during irradiations, creating -centres by photochromic and radiochromic transformations. -centres are characterised by excitation bands at 335 and 620 and emission band at 750 with 75 lifetime. The very short emission lifetime of these crystals allows for a fast laser-scanning read-out. To reduce background luminescence, the FNTD is thermally annealed with a 17 hours long specific heating-profile up to 650 °C and successively treated with optical bleaching. Annealing and optical bleaching can be repeated to erase fluorescent tracks, so allowing to reuse the detector. FNTDs can measure particles with LET ranging from 0.5 to 1800 , allowing to reach a fluence of 5 × 107 cm−2 without saturation and to sustain high dose-rate up to 1 × 10⁸ Gy s−1 [5].
From the crystal, a plate-shaped cut with typical dimensions is usually obtained, as for the FNTD employed in this work.
2.2. Read-Out System
The FNTD read-out was carried out by Confocal Laser Scanning Microscopy (CLSM). CLSM allowed a non-destructive read-out with diffraction-limited spatial resolution. A Zeiss LSM710 ConfoCor 3 inverted CLSM was employed for the experiments. Data acquisition was managed using the ZEN software (version 2009). The microscope consists of a 63 oil objective and an Avalanche Photo-Diodes (APD) in Geiger mode, a main beam splitter (BS488/561/633) and a single long-pass emission filter (LP655) placed in front of the APDs for signal separation, and a 633 helium-neon laser excitation source. The pinhole diameter was set to 1 Air Unity (AU) to achieve an optimal trade-off between resolution, contrast and brightness. The FNTD was mounted in a glass-bottom dish. Immersion-oil was applied between the dish and the objective lens.
2.3. Data Processing
The images acquired were processed using Fiji, an image processing software package based on ImageJ, [7]. The 3D image processing routine created a maximum intensity projection along the detector depth allowing to separate each track, which was then processed individually. For each track, the signal of each depth-slice was fitted with a 2D Gaussian. This allowed to obtain: the fluorescence amplitude, the fluorescence background offset, the coordinates of the track centroid (, ), the track maximum and minimum width ( and , respectively), and the azimuthal angle of the track propagation (). The radial extension of the track is the effect of secondary electrons emitted by the interaction of the particle tracked with the detector material. Figure 1 schematically represents the quantities obtained by the data analysis. From the fluorescence signals, the linear enrgy transfer (LET) of the traversing ion in the FNTD can be assessed. In a BNCT context, if the particle emission energy and type are known, the position where the particle detected was originated, thus the B-10 position into the analysed sample, can be estimated. This is achieved by combining the track direction measured, the energy released into the detector, the particle LET into the sample material, and the emission energy. However, only the track length and direction were considered in this work to study the feasibility of FNTD detectors for BNCT applications.
2.4. The Experiments
Three experiments were carried out to characterise the FNTD readout signal in BNCT-relevant radiation fields, thus to assess its feasibility for BNCT applications.
Two preliminary tests were carried out employing an Am-241 radioactive source. The three most probable decay channels of Am-241 emit particles of 5.486, 5.442 and 5.388 in the 84.8%, 13.1% and 1.6% of emissions, respectively. The source, disk-shaped with 4 diameter, had an activity of 2638 to the irradiation day. The measurement was carried out placing the detector at from the source inside a vacuum chamber. A fluence of 4.466 × 105 cm−2 was estimated.
Since the boron neutron capture produces particles at in the 93.7% of reactions or at in the 6.3%, a second test was carried out to better reproduce such irradiation condition. With this purpose, a 23 layer of Mylar () was interposed between the Am-241 source and the FNTD. The Mylar layer worked as a moderator, lowering the energy of the particles emitted to about . In addition, a hole was made in the centre of the Mylar layer to assess the capability of the FNTD to discriminate between the two resulting energies (about 5.5 and 2.5 ).
Following the successful results of the two preliminary tests, the FNTD was eventually used to measure the radiation field produced by the boron neutron capture reaction.
A sample of the standard reference material (SRM) SRM-2137, certificated by the National Institute of Standards and Technology (NIST), was irradiated by a thermal neutron field in the thermal column of the TRIGA Mark II research reactor of University of Pavia’s LENA (Applied Nuclear Energy Laboratory). The SRM-2137 consists of a single-crystal silicon substrate with a superifical concentration of B-10 obtained by ion implantation. As shown in Figure 2, the FNTD was placed in contact with the SRM sample inside a Teflon structure which held them in position. The low neutron activation of Teflon allowed to minimise the background radiation generated by the holder structure. A portion of FNTD was kept outside the SRM sample to observe and evaluate the background resulting from neutron irradiation. The irradiation was carried out with a reactor nominal power of 10 . The irradiation time was evaluated to allow the measurement of an fluence of about 5 × 105 cm−2.
3. Results
3.1. Preliminary Tests with Am-241
The results of SRIM simulations are shown in Figure 3 and Figure 4 for the measurement without and with the Mylar layer, respectively.
The simulations were carried out considering an isotropic surface-source of particles, reproducing the Am-241 emission. The thickness of the Am-241 source was not considered in the simulations. Figure 3b and Figure 4b represents the distribution of particles as a function of their penetration depth inside the FNTD. In the case of isotropically emitted without Mylar layer, their penetration depth was evenly distributed between 0 and about 15 . 15 corresponds indeed to the particle range in the FNTD material (i.e. the penetration depth of those particles emitted in the detector-axis direction). The mean penetration depth was . When the 23 layer of Mylar is interposed between the Am-241 source and the detector, as clearly shown in Figure 4b, a significant amount of particles was not able to reach the FNTD detector. According to the results of SRIM simulation, the particles that were capable to reach the detector had a mean energy of about and could penetrate up to 5 into the FNTD detector.
The results of the experiments well agreed with what expected from the simulations. The preliminary experiments also proved the capability of the FNTD detector read by the CLSM to measure the tracks of the particle produced by Am-241 both with and without the 23 Mylar layer moderation. Figure 5 shows an example of the tracks measured in a subregion of the FNTD at different depths, in the case of no moderator.
Dirt on the FNTD surface, such as the two brightest features visible at the bottom-right of the FNTD region showed in Figure 5, were excluded from data analysis by properly setting a threshold system. After reaching maximum brightness at about 4 , the majority of the tracks measured vanished at around 7 deep into the FNTD, in agreement with the mean penetration depth predicted by the simulations. The tracks had an oval shape as their direction was predominantly different than the detector-axis due to the isotropic emission. The average track area resulted , corresponding to an equivalent diameter of approximately . The result obtained well aligned with previous studies in literature [8]. The fluence resulting from the measurement was 6.1 × 105 cm−2 which agreed within uncertainty to the nominal fluence expected of 4.466 × 105 cm−2.
The measurement of the Am-241 source moderated by a 23 thick Mylar layer is reported in Figure 6 and Figure 7. They show, respectively, a subregion of the FNTD beneath the Mylar layer and a subregion beneath the central hole.
In both cases, the resulting track size was consistent with what measured in the case without moderator. In the subregion beneath the Mylar, most of the tracks could penetrate to 4-5 and almost none could reach 6 , as predicted by the simulations. In correspondence of the central hole, as expected, the tracks measured were all able to penetrate down to 14 into the FNTD. The number of that were detected at 15 significantly dropped and almost zeroed at 16 . The Mylar layer, indeed, basically worked as a collimator in the central hole region. Considering the small diameter of the hole with respect to the Am-241 source, only those non-moderated particles having a direction similar to the detector axis (perpendicular to the detector surface) were allowed to reach the detector in the hole region. As already discussed, the penetration depth of such particles could be reasonably approximated with their range, 15 .
The results obtained also allowed the reconstruction of the 3D particle track, as shown by Figure 8.
3.2. Measurement of a Reference Boron Neutron Capture Therapy Radiation Field
Boron neutron capture has two reaction channels. The first occurs with the 93.7% of probability and produces a particle, a lithium ion and a 478 -ray. The second reaction channel occurs with the 6.3% of probability and produces a particle and a lithium ion. While the particles are characterised by a range in the FNTD material of (at ) and (at ), the lithium ions have a range of just (at ) and (at ). Since the and the lithium produced by the neutron reaction are emitted isotropically with opposite directions, the FNTD detects a comparable amount of the two particles. The read-out and data analysis was significantly more complicated than in the experiment with the Am-241, especially within the first 2 of detector sensitive volume due to the radiation field heterogeneity. However, since lithium has a higher atomic number than helium, its corresponding track spot should be of greater diameter and of higher intensities (because of the higher ionisation density and stopping power). Hence, a meticulous analysis might allow to discriminate between the two particles, especially when their impinging angle is perpendicular to the detector surface and their track-shape is circular. When considering an isotropic emission of and lithium with boron neutron capture reaction energies and probabilities, the mean penetration depth resulting from SRIM simulations was and for, respectively, and lithium ions.
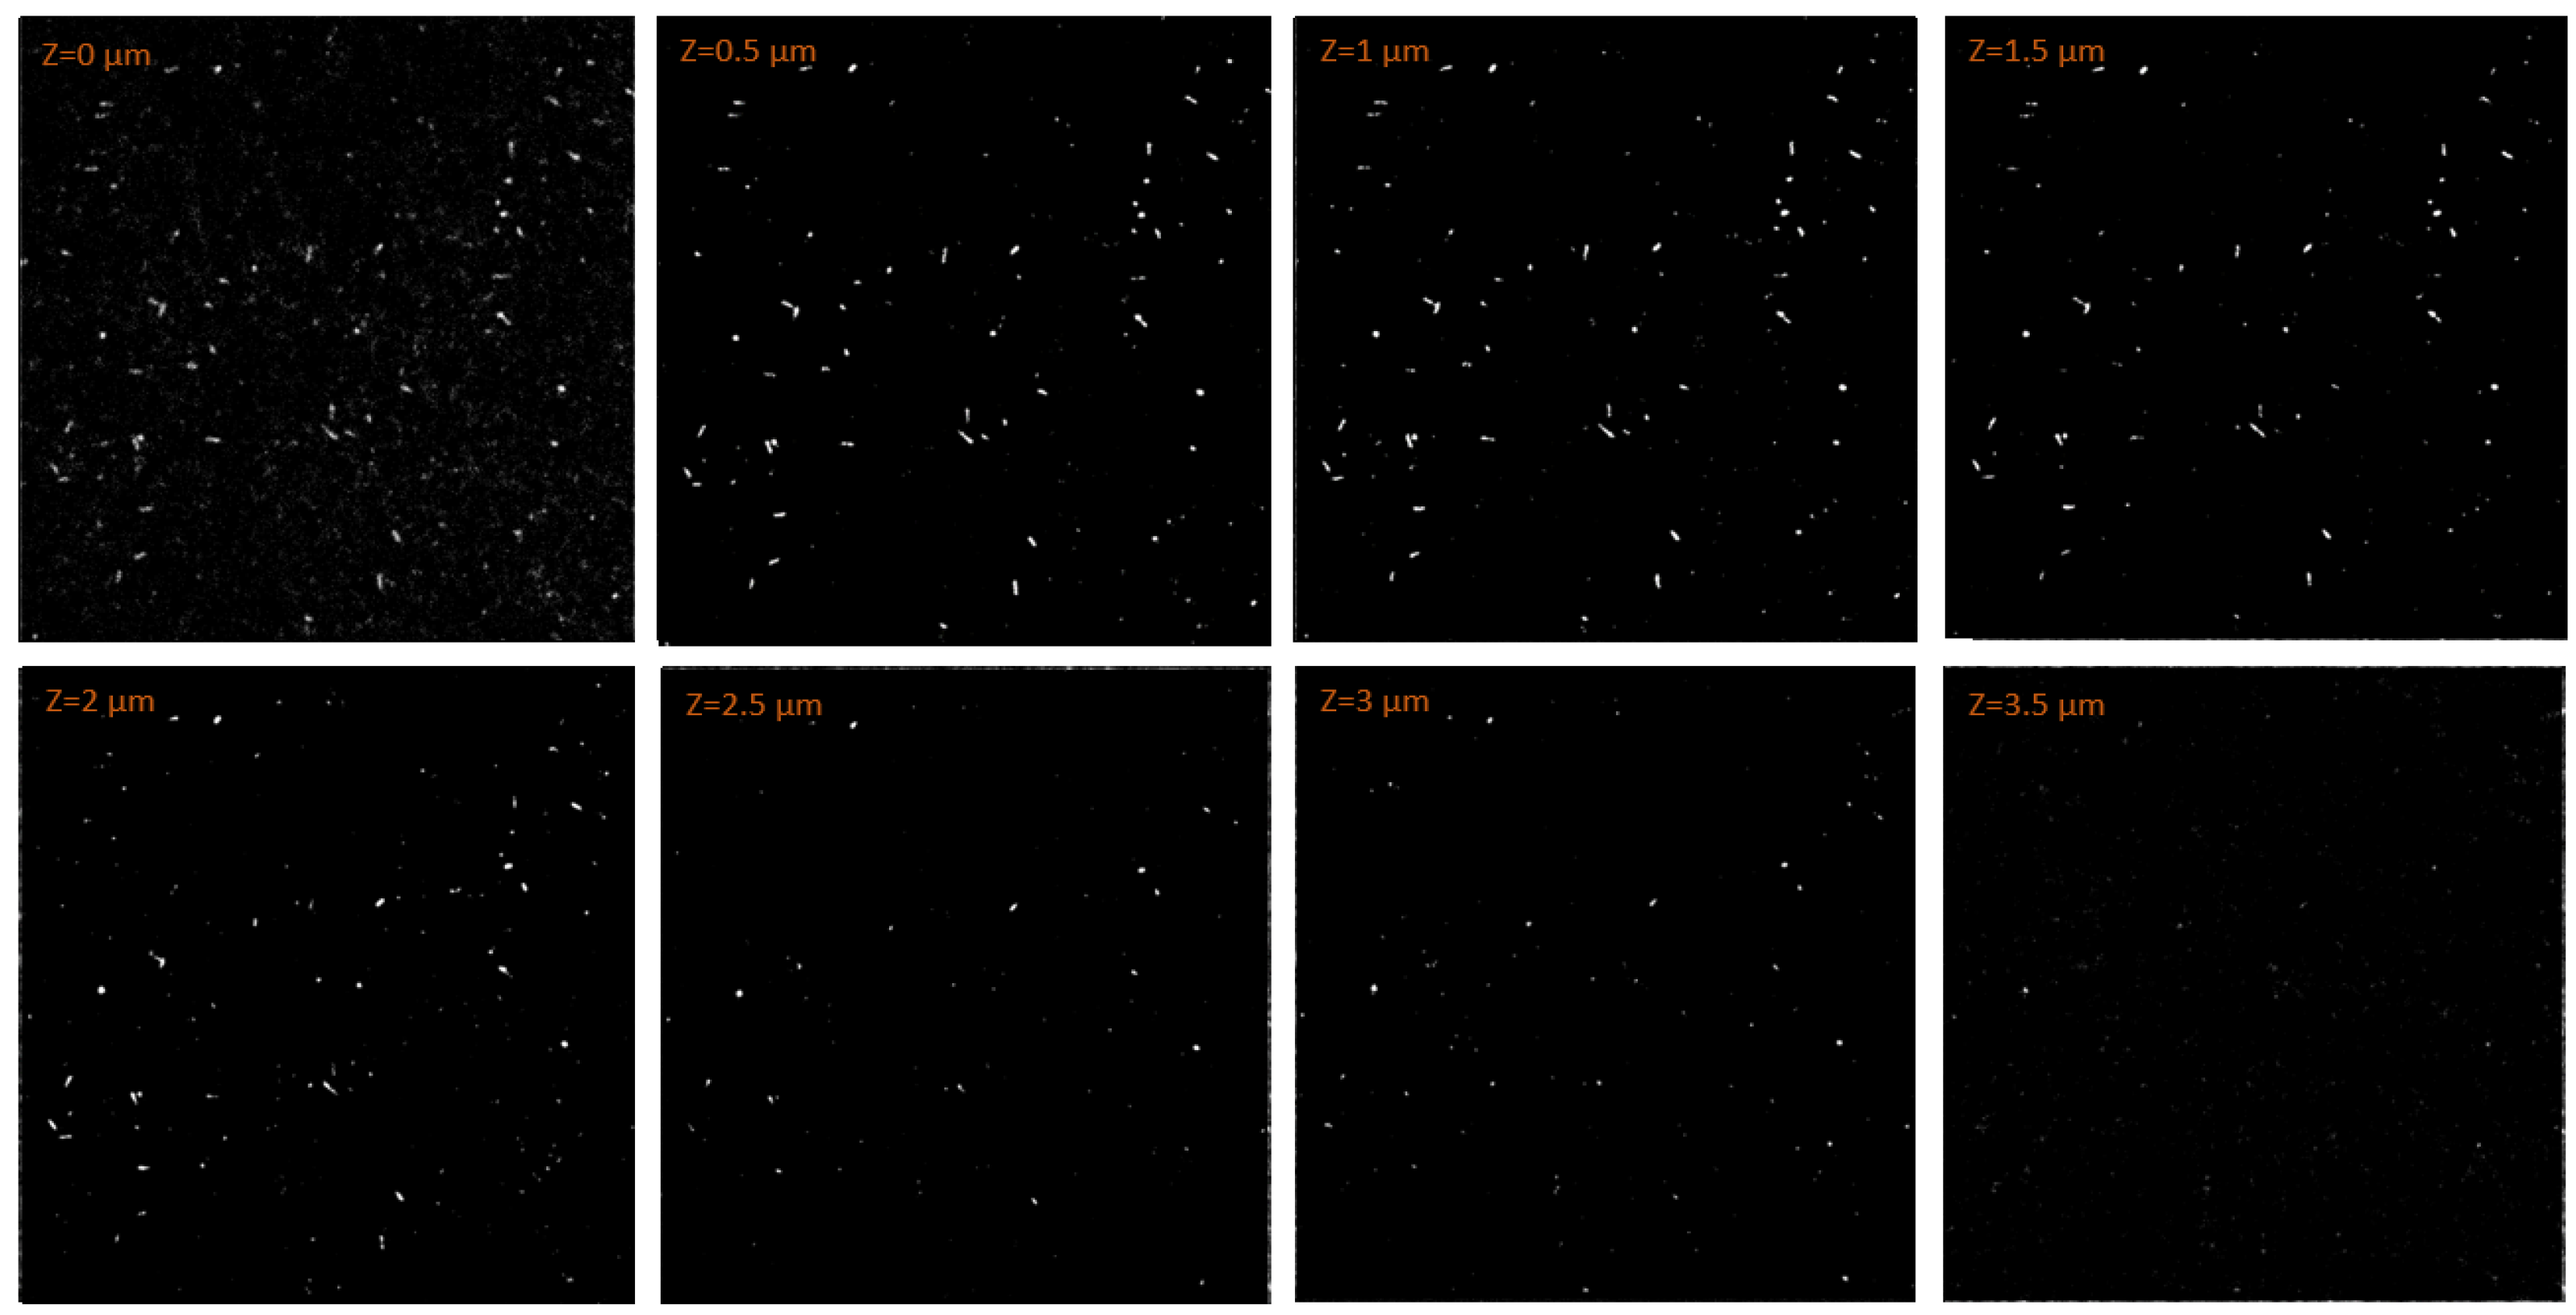
The data processing was further complicated by the high background created by the neutron field and by the photons produced in the reactor. Nevertheless, thanks to the background data collected allowing to accurate set thresholds and clean CLSM images, the tracks of boron neutron capture reaction products were successfully discriminated from the background. Figure 9 shows the particle tracks measured by a subregion of the FNTD. The results of the experiment were in agreement with what was predicted by the simulations. The higher density of tracks was observed within the first of the FNTD, where the radiation field was composed by both reaction products. Deeper than 2 the amount of tracks measured significantly dropped, reasonably in line with the mean penetration depth simulated. Eventually, only very few tracks with circular shape were found at a depth of . These were the few particles which entered the FNTD parallel to the detector axis and whose penetration depth thus corresponded to their range in the FNTD material.
4. Conclusions
Fluorescent Neutron Track Detector (FNTD) can have a pivotal role in Boron Neutron Capture Therapy (BNCT) as they could allow the measurement of the B-10 micro-distribution in tumour cells. This work presented a feasibility study and a very first characterisation of FNTD for BNCT. The detector was read by Confocal Laser Scanning Microscopy (CLSM). To reproduce a typical BNCT radiation field, the FNTD was employed in three experimental conditions: using an Am-241 source, using the same Am-241 source moderated by a 23 thick Mylar layer, and using the NIST Standard Reference Material (SRM) 2137 irradiated by a thermal neutron field. The third experiments was carried out at the University of Pavia’s LENA (Applied Nuclear Energy Laboratory), where the system made of the FNTD and the SRM-2137 sample was irradiated in the research reactor thermal column. The FNTD successfully measured the range and mean penetration depth of the particles in all the experimental conditions tested. Hence, the results of this work proved the feasibility of FNTD detectors to reconstruct the tracks of the reaction products created in typical BNCT conditions.
While a clear 3D reconstruction of the tracks was obtained for the experiments with the Am-241 source, the higher background generated in the LENA’s reactor significantly complicated the 3D track reconstruction for the experiment with the SRM. Additional efforts should be put into the improvement of the radiation background to allow a clearer reconstruction of 3D tracks even in this experimental condition. However, this limitation did not hinder the successful visualisation and measurement of particle tracks on 2D planes at different depths in the FNTD. This measurement allowed to obtain the track shape, size, length and direction. Hence, despite the challenges posed by the high radiation background, the quantities required to estimate the emission point of the reaction products could still be measured by the FNTD.
By proving the track reconstruction capability of FNTD for boron neutron capture products, this work proved the feasibility of this type of detector to measure the B-10 micro-distribution in a material sample placed on the detector surface. Once the particle track is reconstructed, indeed, the particle emission point can be estimated employing existing accredited software. The emission point coincide with the B-10 location and its micro-distribution could finally be estimated.
To characterise the B-10 micro-distribution at cell level, future experiments will be carried out depositing
a layer of B-10 enriched cells on the FNTD. This hybrid detector, known as Cell-Fit-HD,
can be coupled with time-laps microscopy to create the biosensor Cell-Fit-HD4D. Tracking specific
proteins responsible for DNA repair, Cell-Fit-HD4D will allow to study the correlation between DNA
damage dynamics and the stochastic energy deposition at sub-cellular level. The development of such
technique in BNCT is fundamental, as it will allow to experimentally take into account the double
stochastic-nature of radiation interaction involved in BNCT: the B-10 position with respect to the cell
nucleus and the stochastic nature of energy deposition.
References
- Agency, I.A.E. Advances in Boron Neutron Capture Therapy; IAEA: Vienna, 2023; Non-serial Publications. [Google Scholar]
- et al., S.A. Microdistribution and quantification of the boron neutron capture therapy drug BPA in primary cell cultures of human glioblastoma tumour by NanoSIMS. Radiation Oncology 2024, 19, 25. [CrossRef]
- Akselrod, M.; Kouwenberg, J. Fluorescent nuclear track detectors – Review of past, present and future of the technology. Radiation Measurements 2018, 117, 35–51. [Google Scholar] [CrossRef]
- et al., J.S. Biosensor Cell-Fit-HD4D for correlation of single-cell fate and microscale energy deposition in complex ion beams. STAR Protocols 2022, 3, 101798. [CrossRef] [PubMed]
- et al., M.N. Engineering cell-fluorescent ion track hybrid detectors. Radiation Oncology 2013, 8, 141. [CrossRef] [PubMed]
- Ziegler, J.F.; Ziegler, M.D.; Biersack, J.P. SRIM – The stopping and range of ions in matter (2010). Nuclear Instruments and Methods in Physics Research Section B: Beam Interactions with Materials and Atoms 2010, 268, 1818–1823, SRIM. [Google Scholar] [CrossRef]
- Schindelin, J.; Arganda-Carreras, I.; Frise, E.; Kaynig, V.; Longair, M.; Pietzsch, T.; Preibisch, S.; Rueden, C.; Saalfeld, S.; Schmid, B.; Tinevez, J.Y.; White, D.J.; Hartenstein, V.; Eliceiri, K.; Tomancak, P.; Cardona, A. Fiji: an open-source platform for biological-image analysis. Nature Methods 2012, 9, 676–682. [Google Scholar] [CrossRef] [PubMed]
- Kouwenberg, J.J.M.; Wolterbeek, H.T.; Denkova, A.G.; Bos, A.J.J. Fluorescent nuclear track detectors for alpha radiation microdosimetry. Radiation oncology (London, England) 2018, 13, 107. [Google Scholar] [CrossRef] [PubMed]
Figure 1.
Diagram illustrating the data processing of a stack of images separated by a depth increment for the region of interest (ROI) of an individual track. The resulting quantities are represented.
Figure 1.
Diagram illustrating the data processing of a stack of images separated by a depth increment for the region of interest (ROI) of an individual track. The resulting quantities are represented.
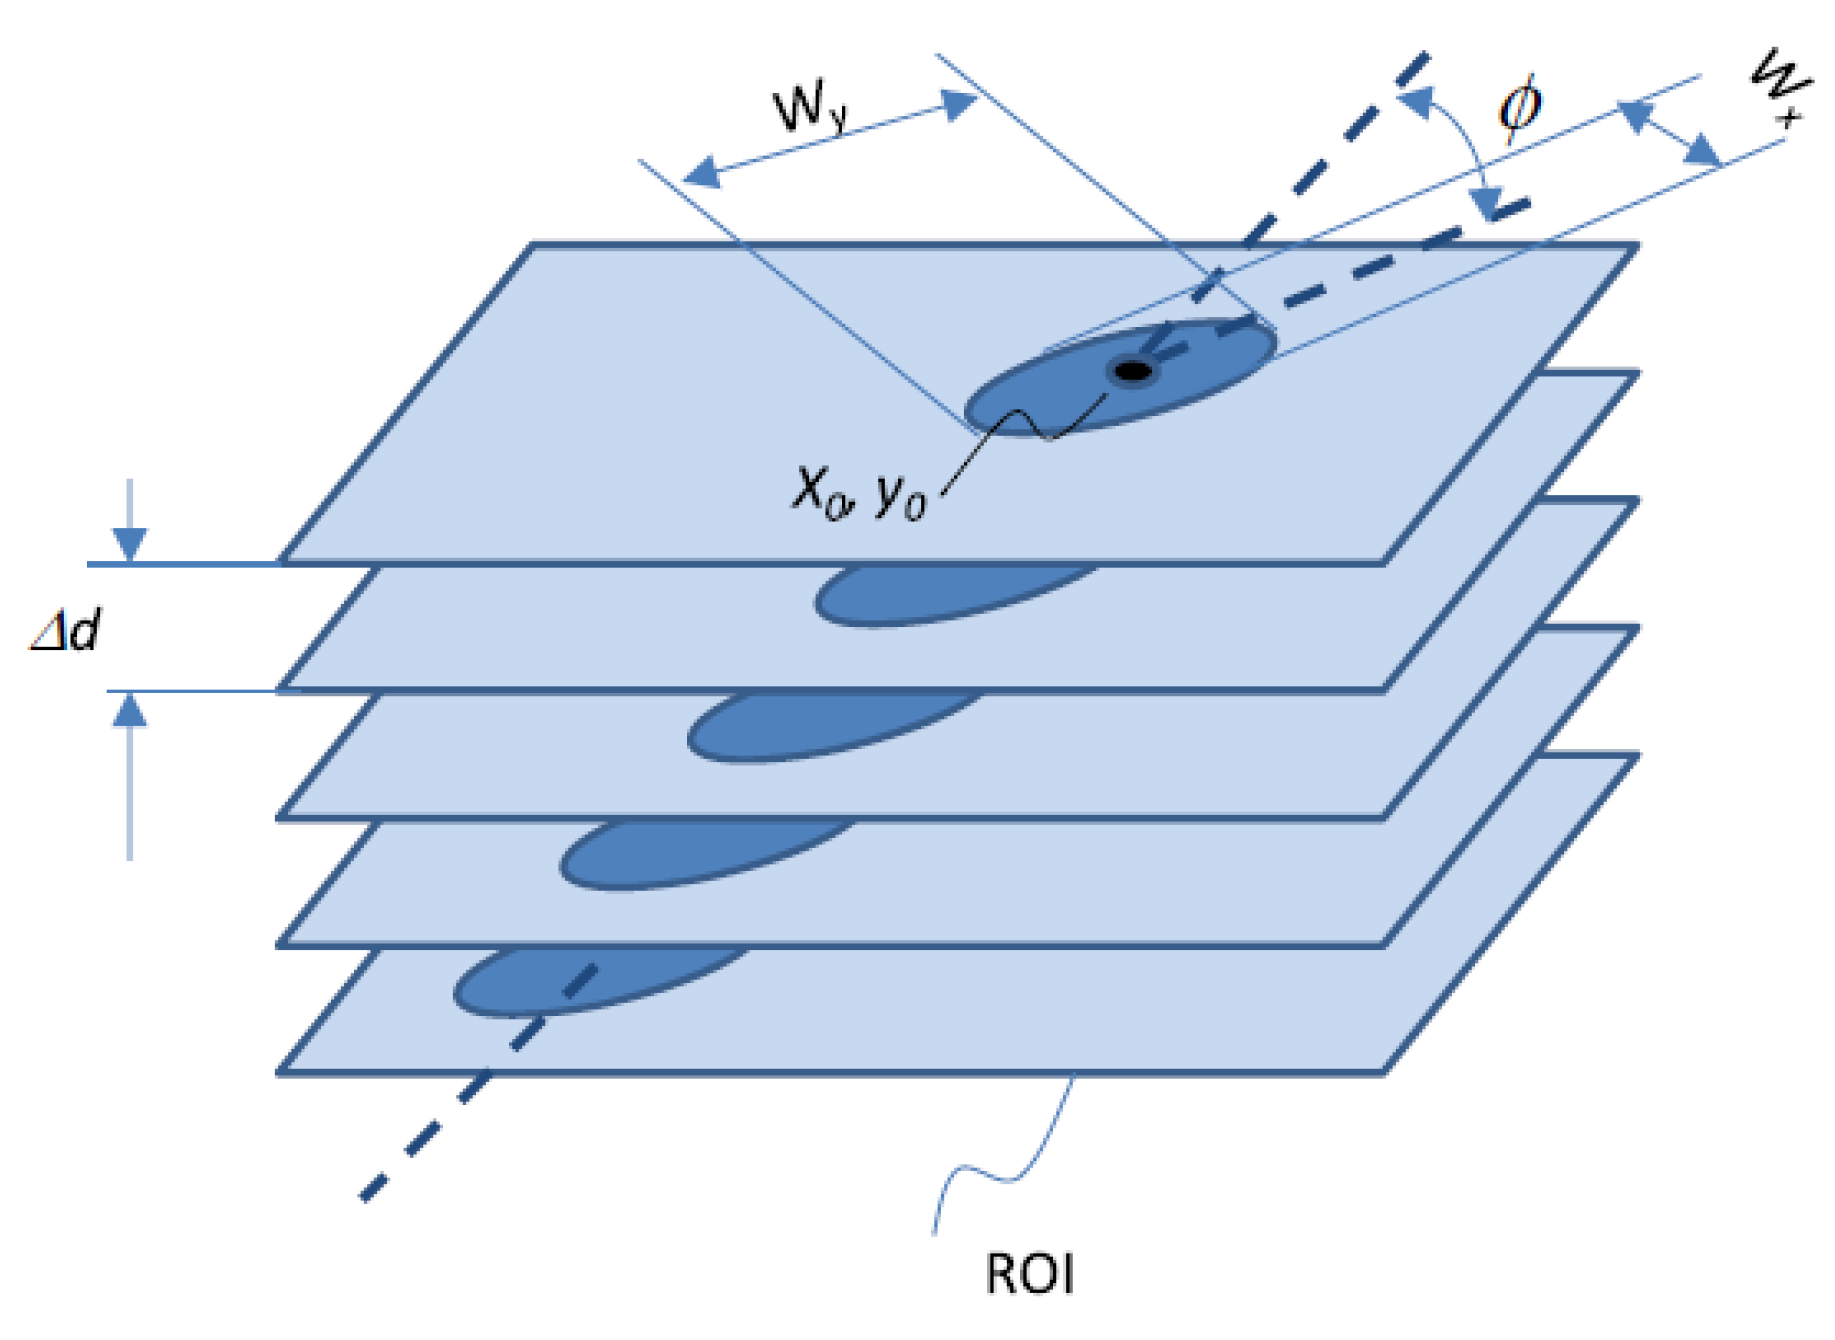
Figure 2.
Schematic representation and picure of the experimental set-up used for the measurement of the SRM-2137 sample using the FNTD.
Figure 2.
Schematic representation and picure of the experimental set-up used for the measurement of the SRM-2137 sample using the FNTD.
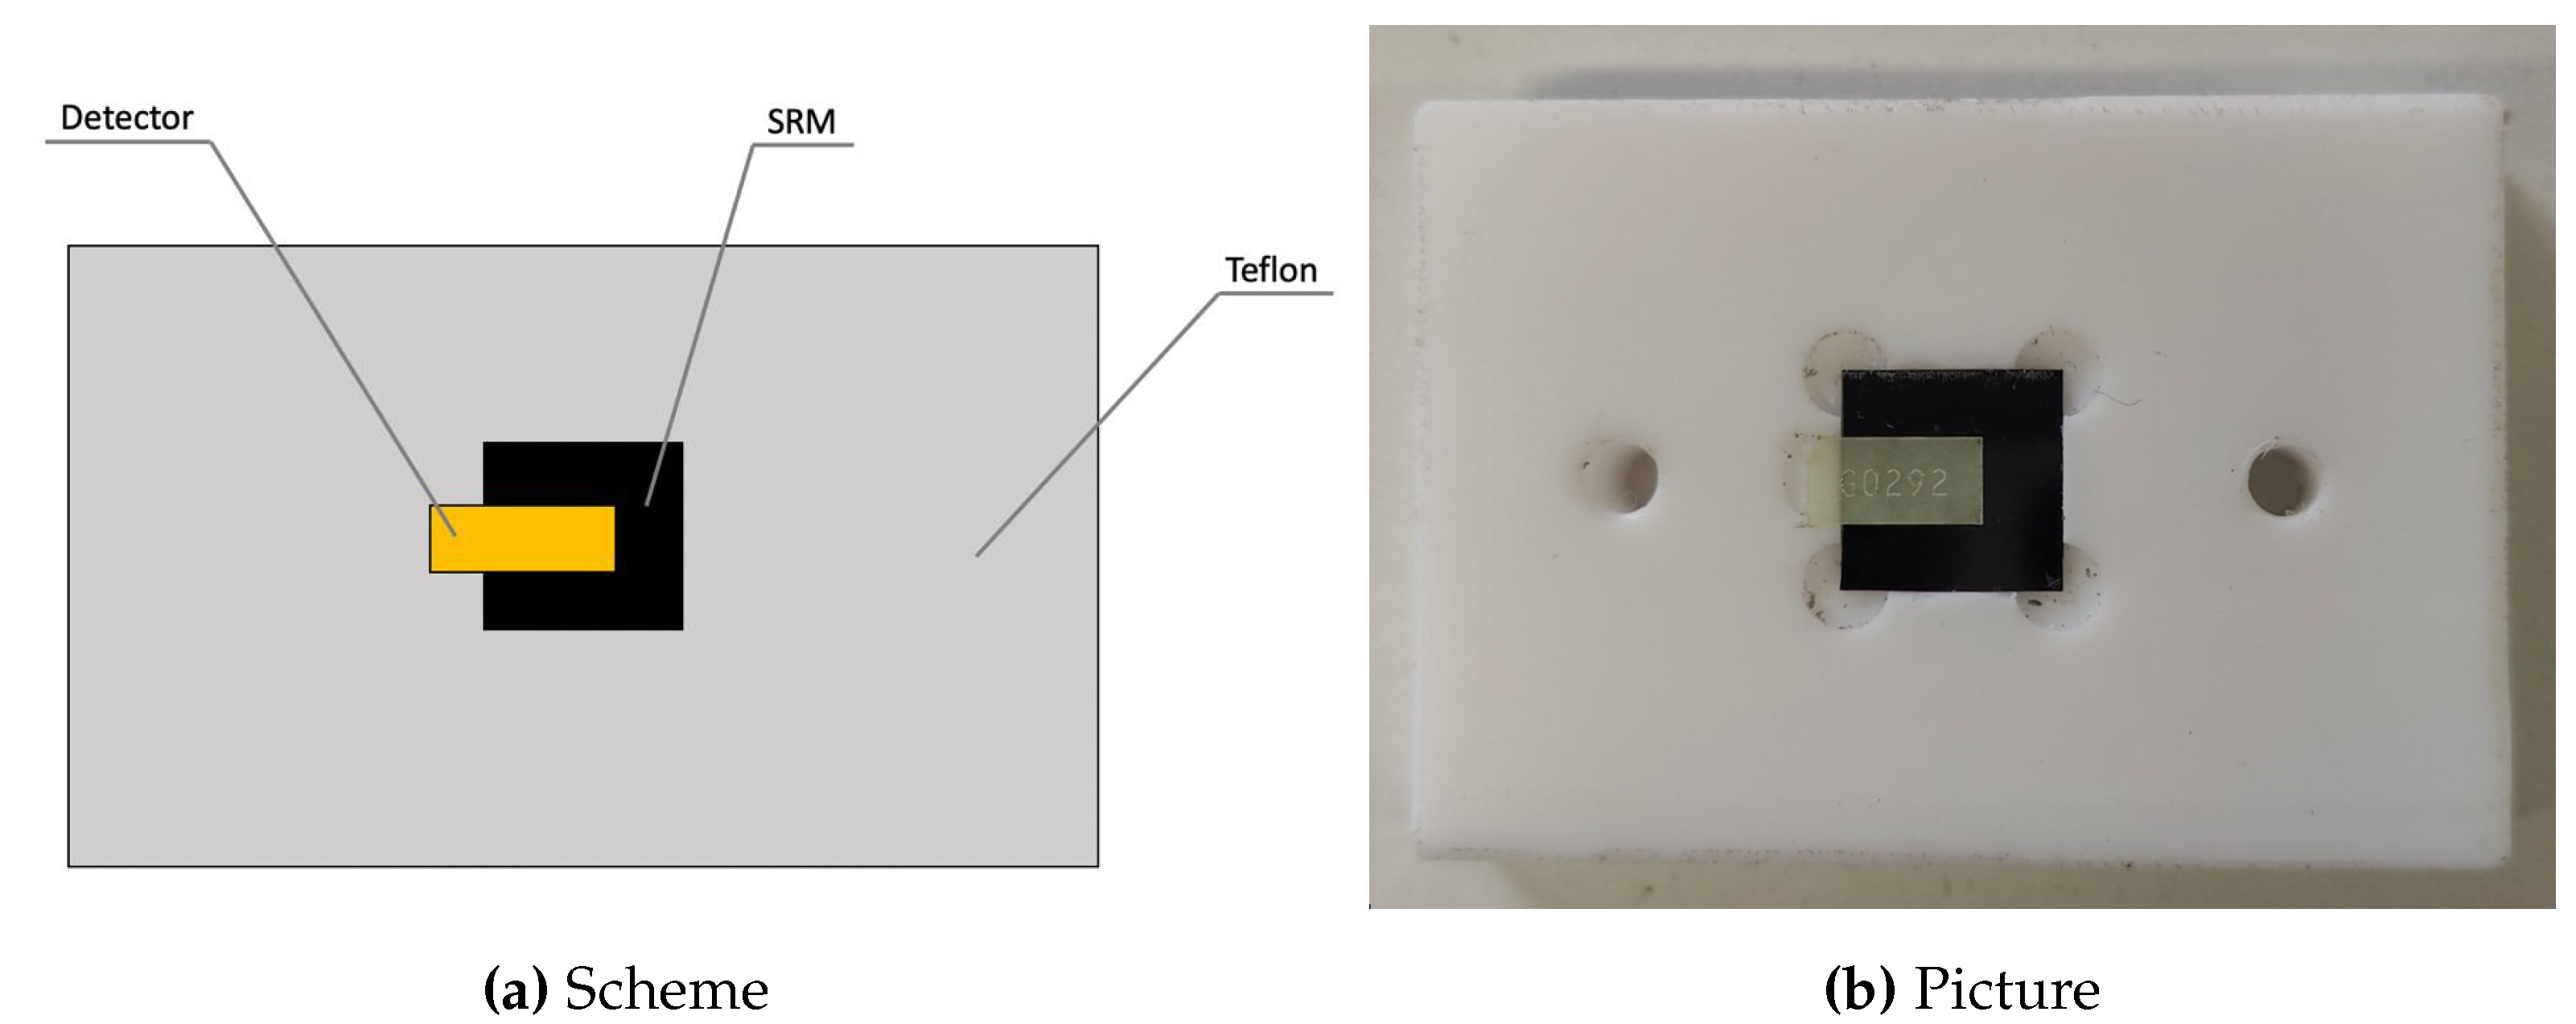
Figure 3.
SRIM Simulation of the particles isotropically emitted by an Am-241 source as they travel into the FNTD.
Figure 3.
SRIM Simulation of the particles isotropically emitted by an Am-241 source as they travel into the FNTD.
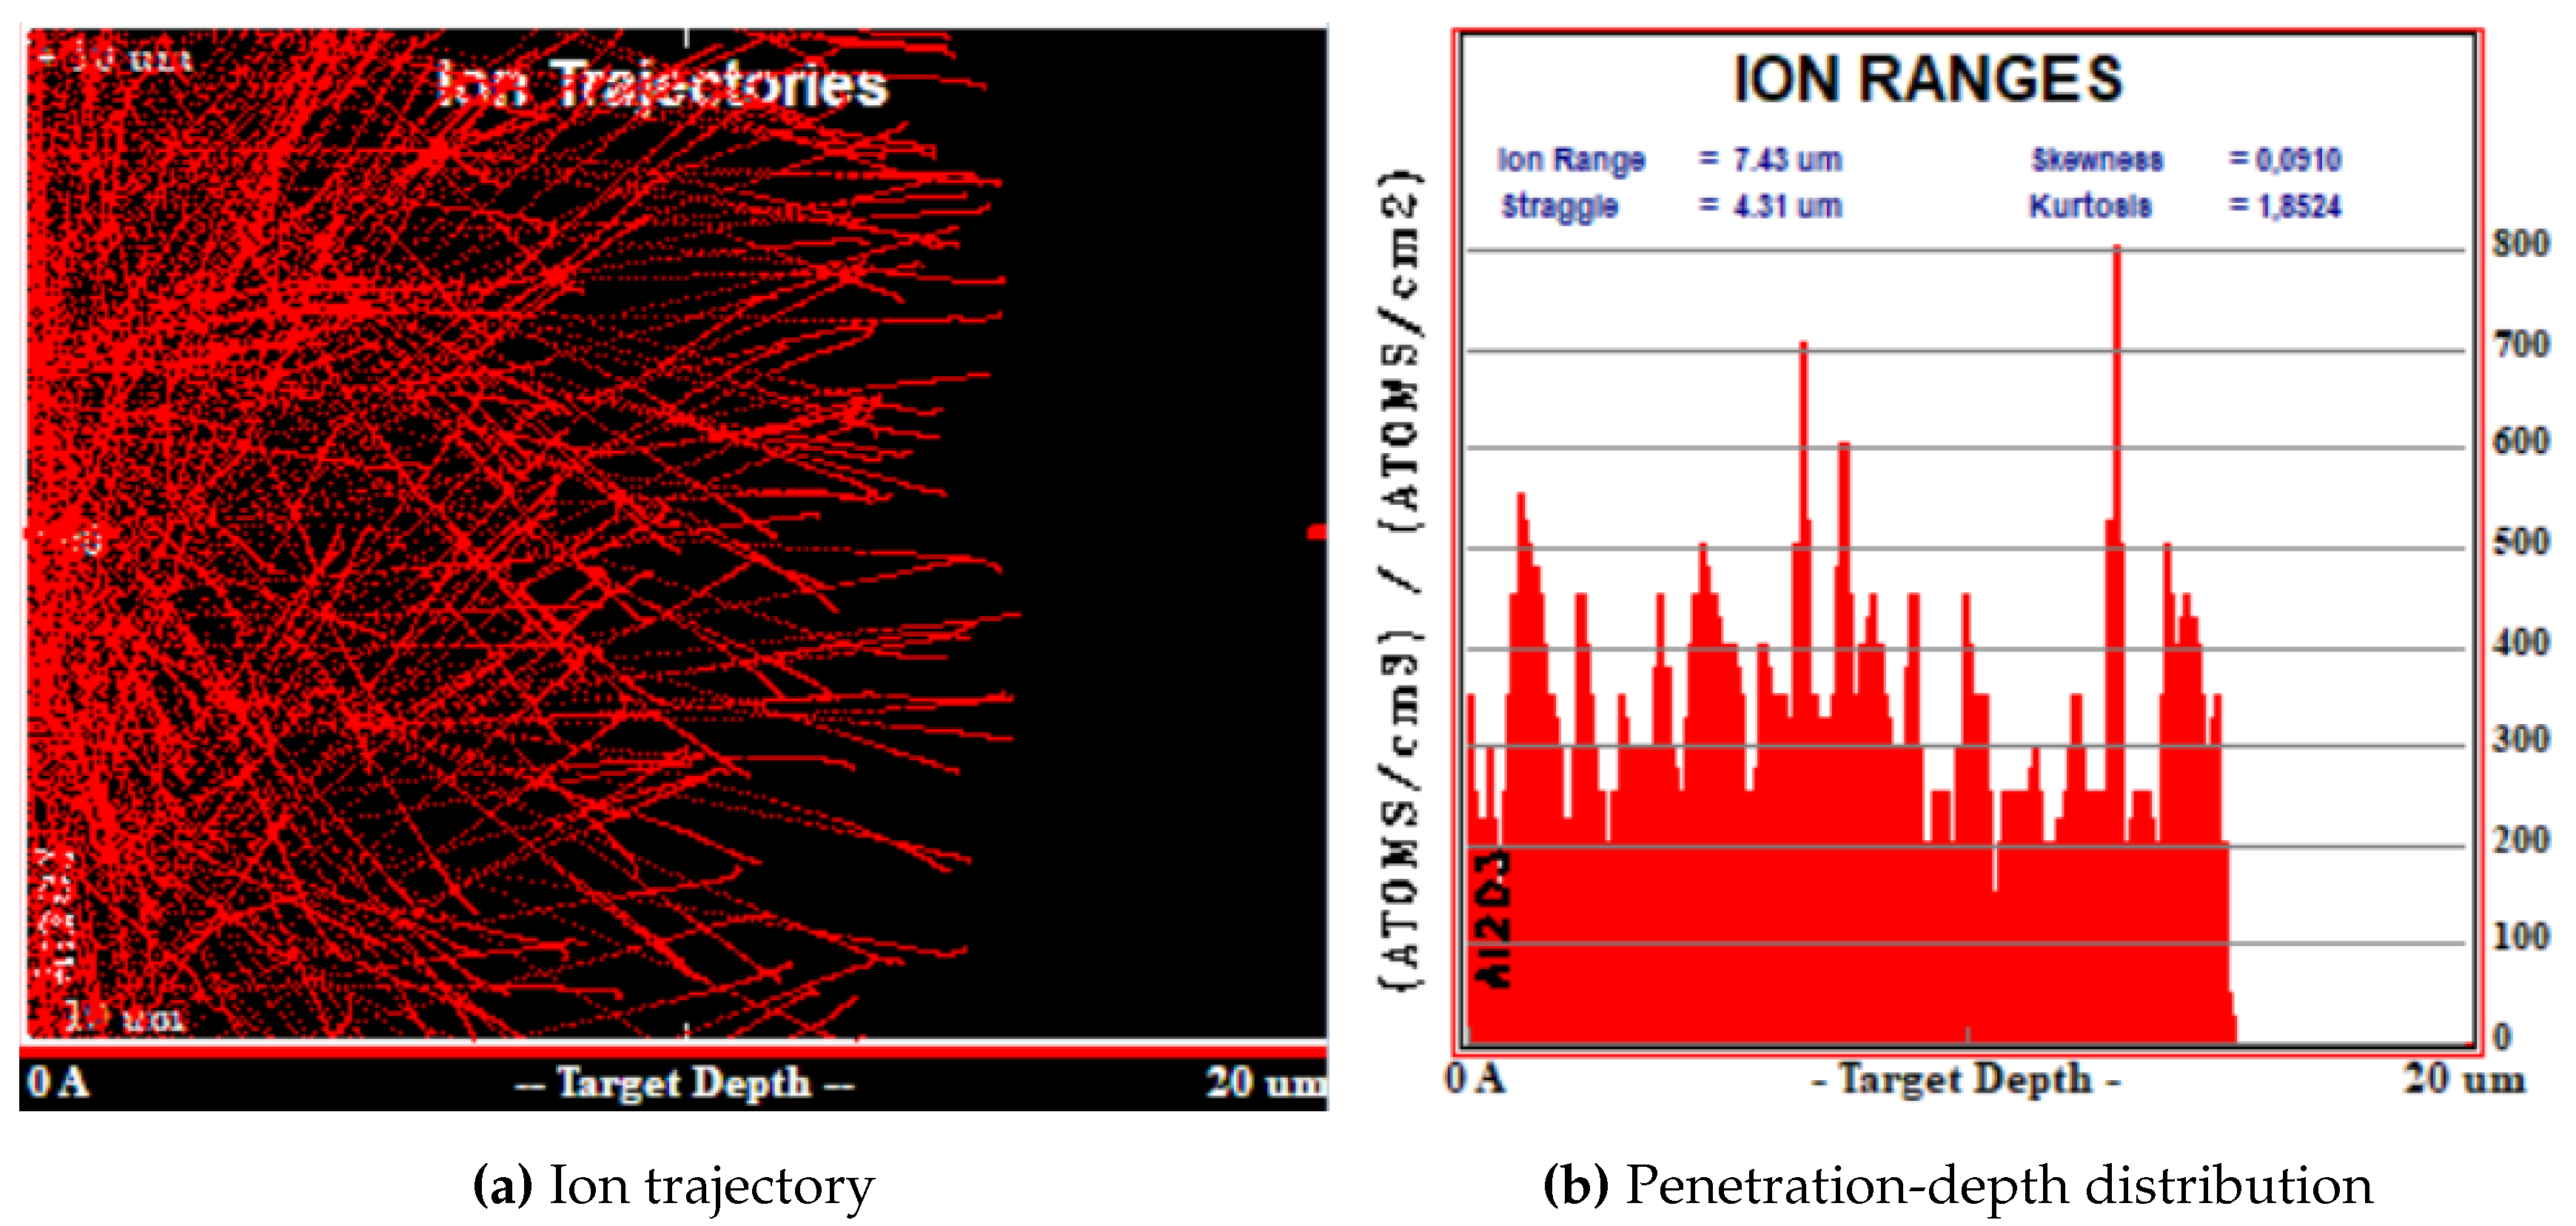
Figure 4.
SRIM Simulation of the particles isotropically emitted by an Am-241 source as they travel into a 23 Mylar layer and successively into the FNTD.
Figure 4.
SRIM Simulation of the particles isotropically emitted by an Am-241 source as they travel into a 23 Mylar layer and successively into the FNTD.
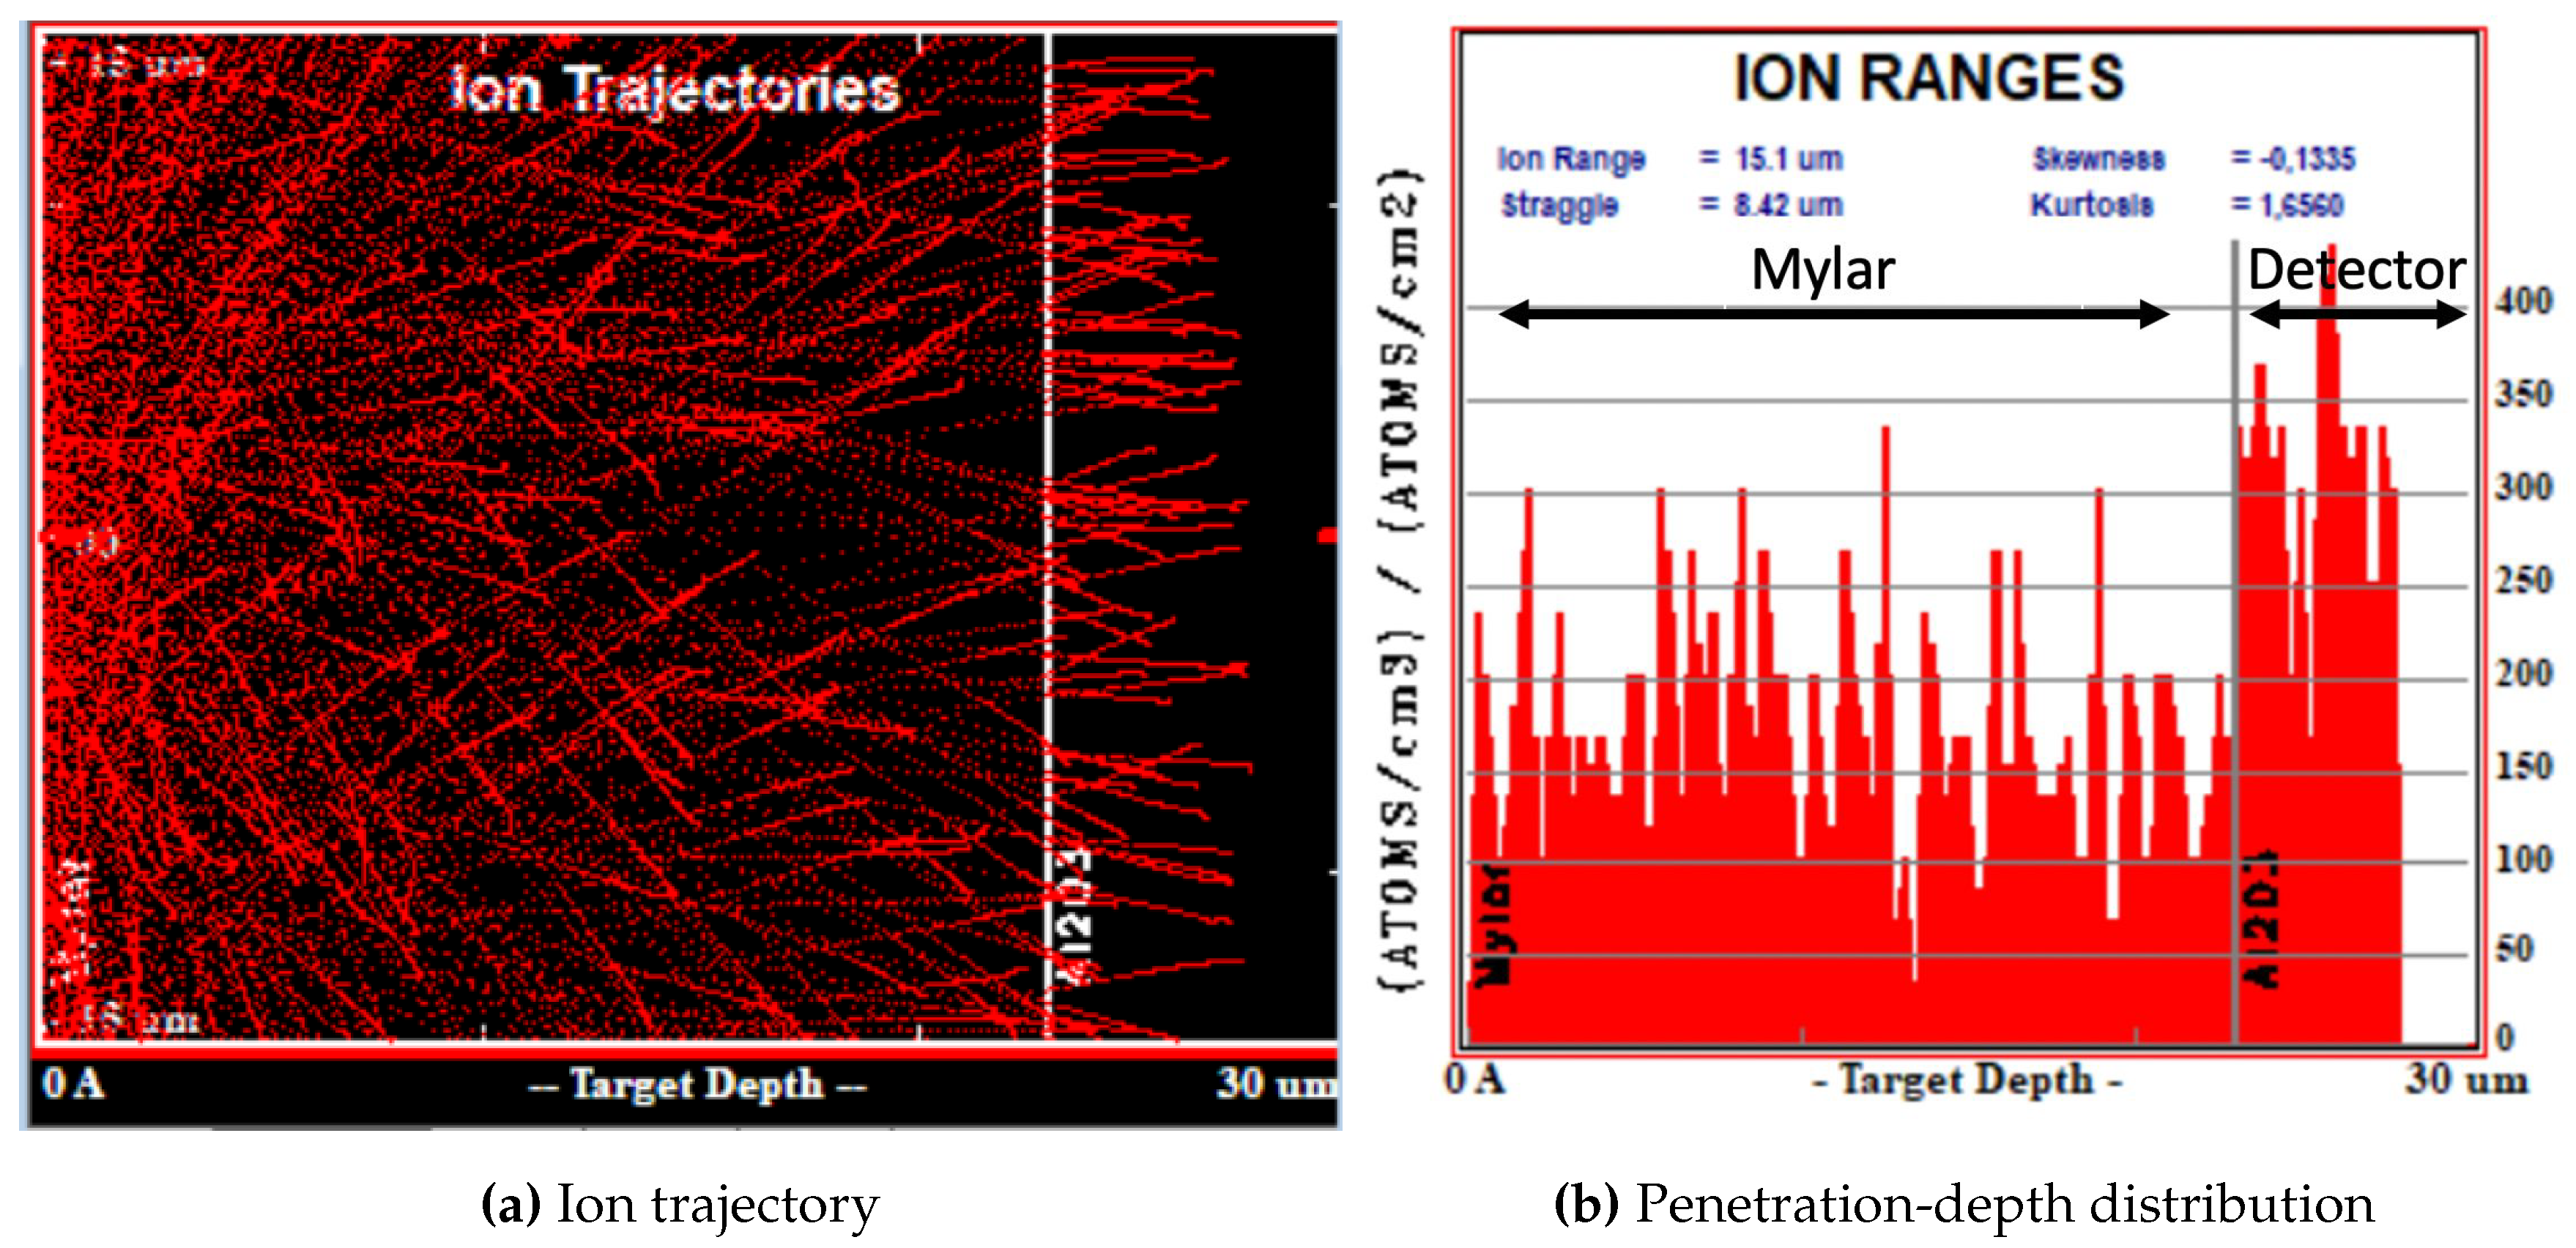
Figure 5.
Fluorescent tracks images measured by the CLSM from a region of the FNTD at different depths. The FNTD was irradiated in a vacuum chamber with the particles emitted by an Am-241 source.
Figure 5.
Fluorescent tracks images measured by the CLSM from a region of the FNTD at different depths. The FNTD was irradiated in a vacuum chamber with the particles emitted by an Am-241 source.
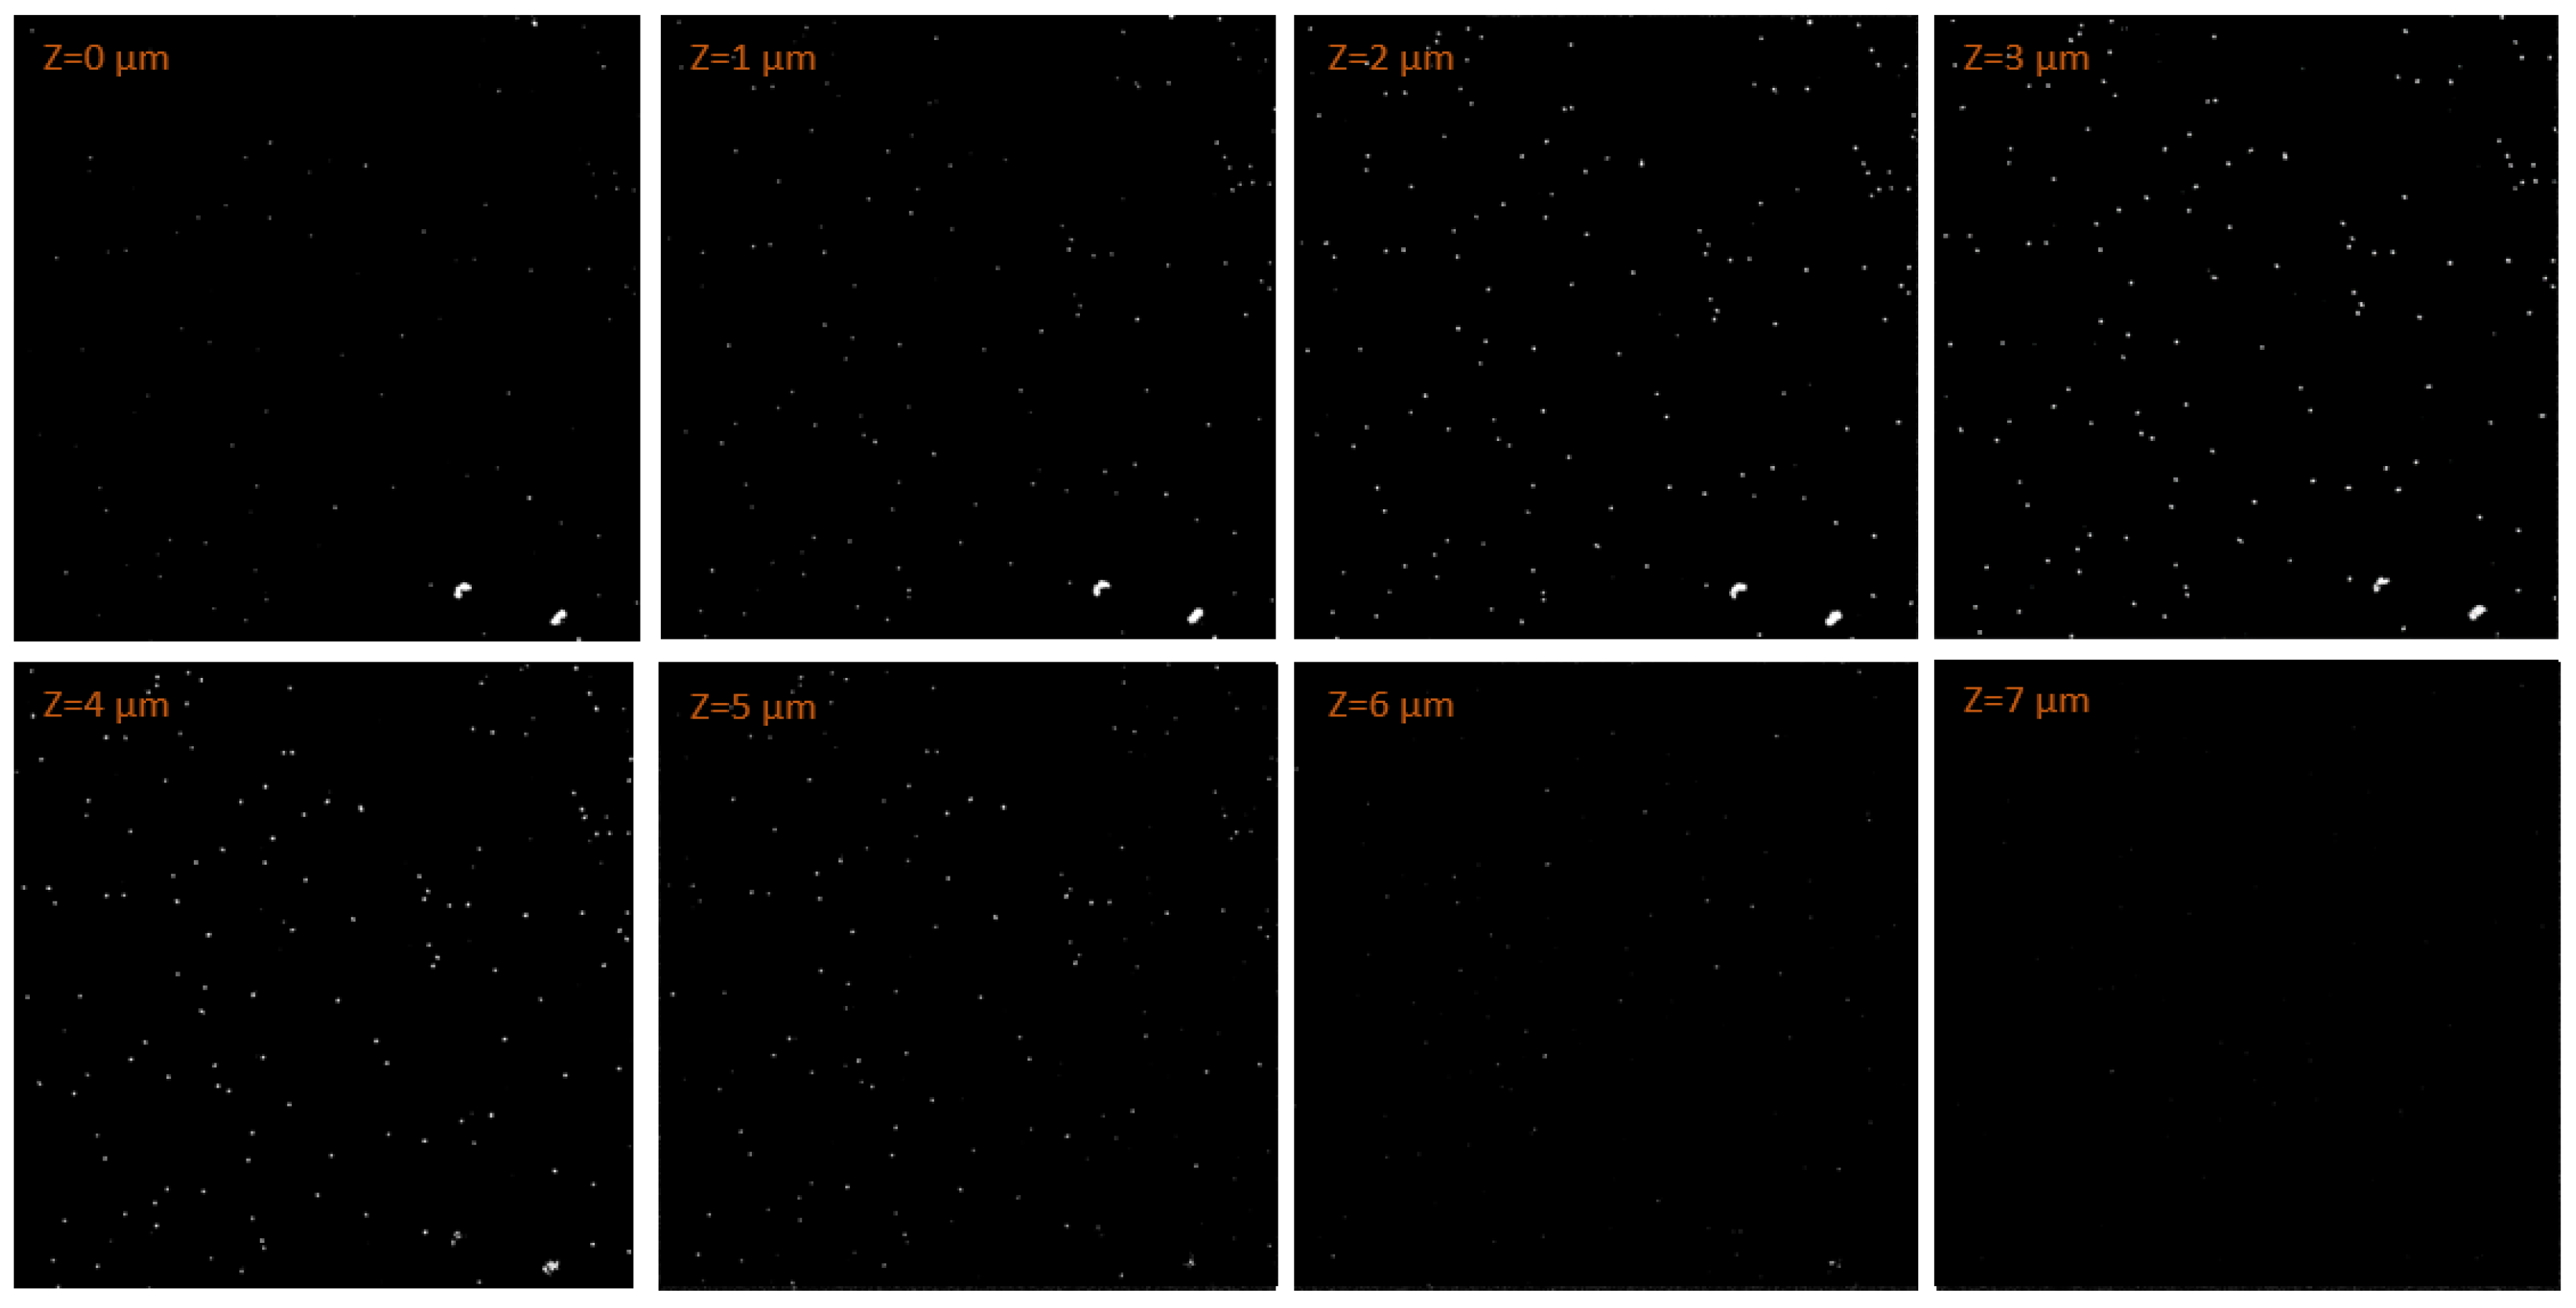
Figure 6.
Fluorescent tracks images measured by the CLSM from a region of the FNTD at different depths. The FNTD was irradiated in a vacuum chamber with the particles emitted by an Am-241 source and moderated by 23 thick Mylar layer.
Figure 6.
Fluorescent tracks images measured by the CLSM from a region of the FNTD at different depths. The FNTD was irradiated in a vacuum chamber with the particles emitted by an Am-241 source and moderated by 23 thick Mylar layer.
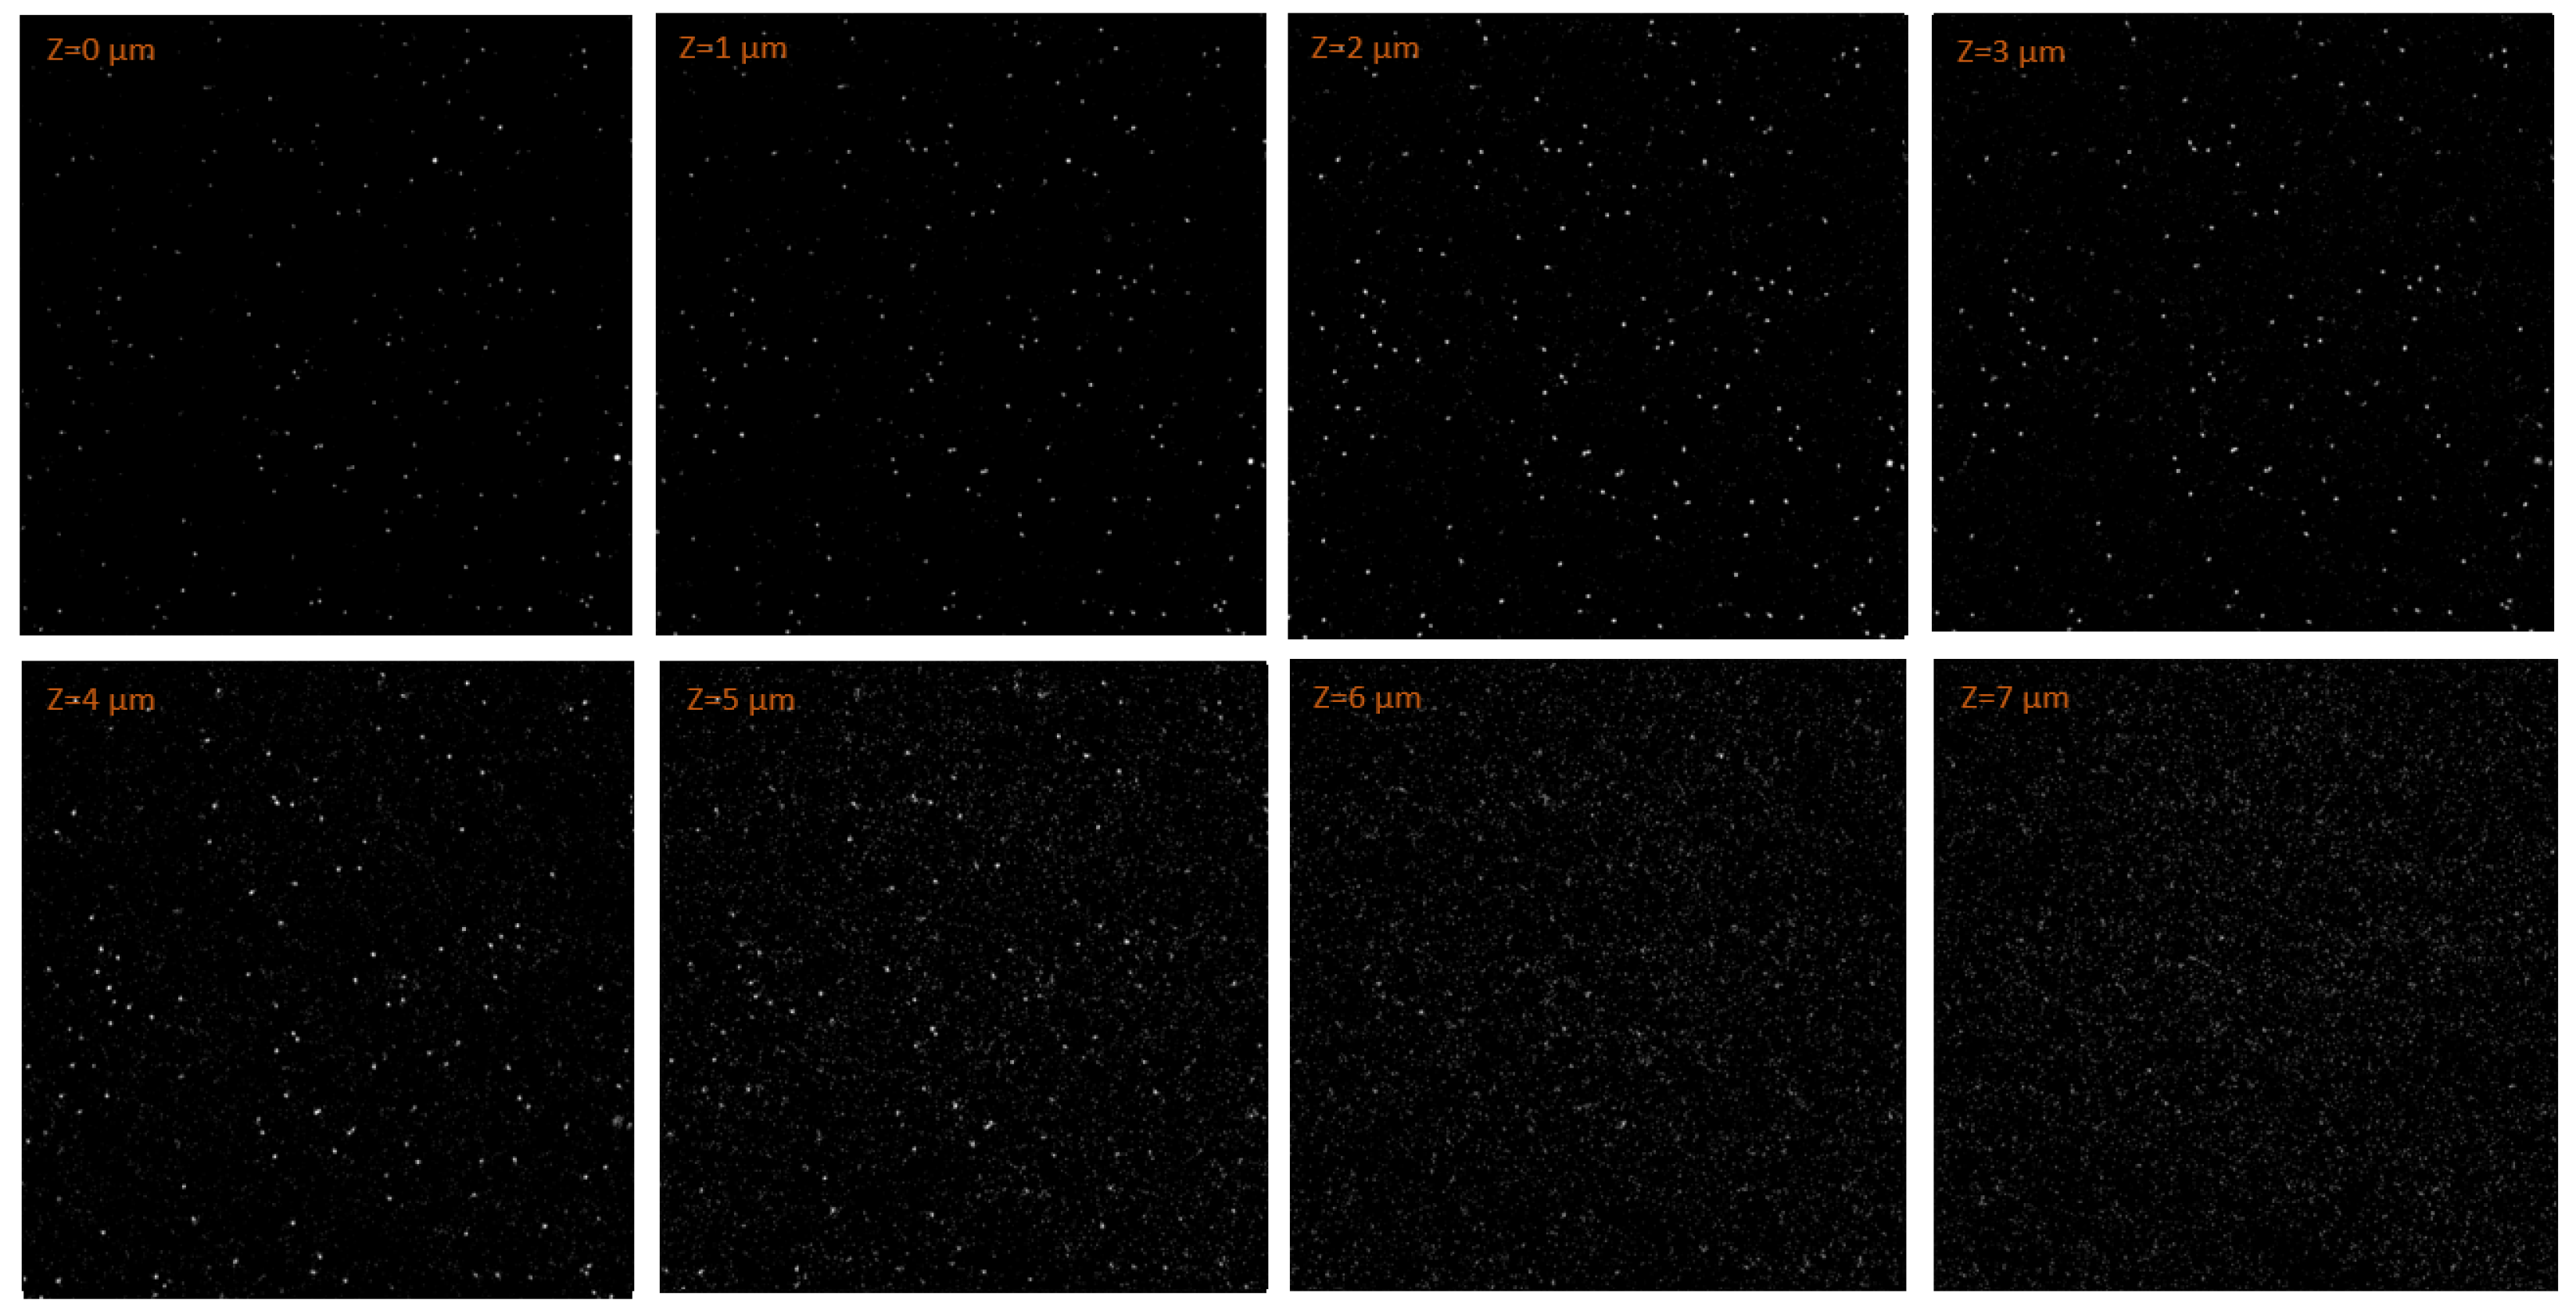
Figure 7.
Fluorescent tracks images measured by the CLSM from a region of the FNTD at different depths. The FNTD was irradiated in a vacuum chamber with the particles emitted by an Am-241 source and collimated by the perforated Mylar layer.
Figure 7.
Fluorescent tracks images measured by the CLSM from a region of the FNTD at different depths. The FNTD was irradiated in a vacuum chamber with the particles emitted by an Am-241 source and collimated by the perforated Mylar layer.
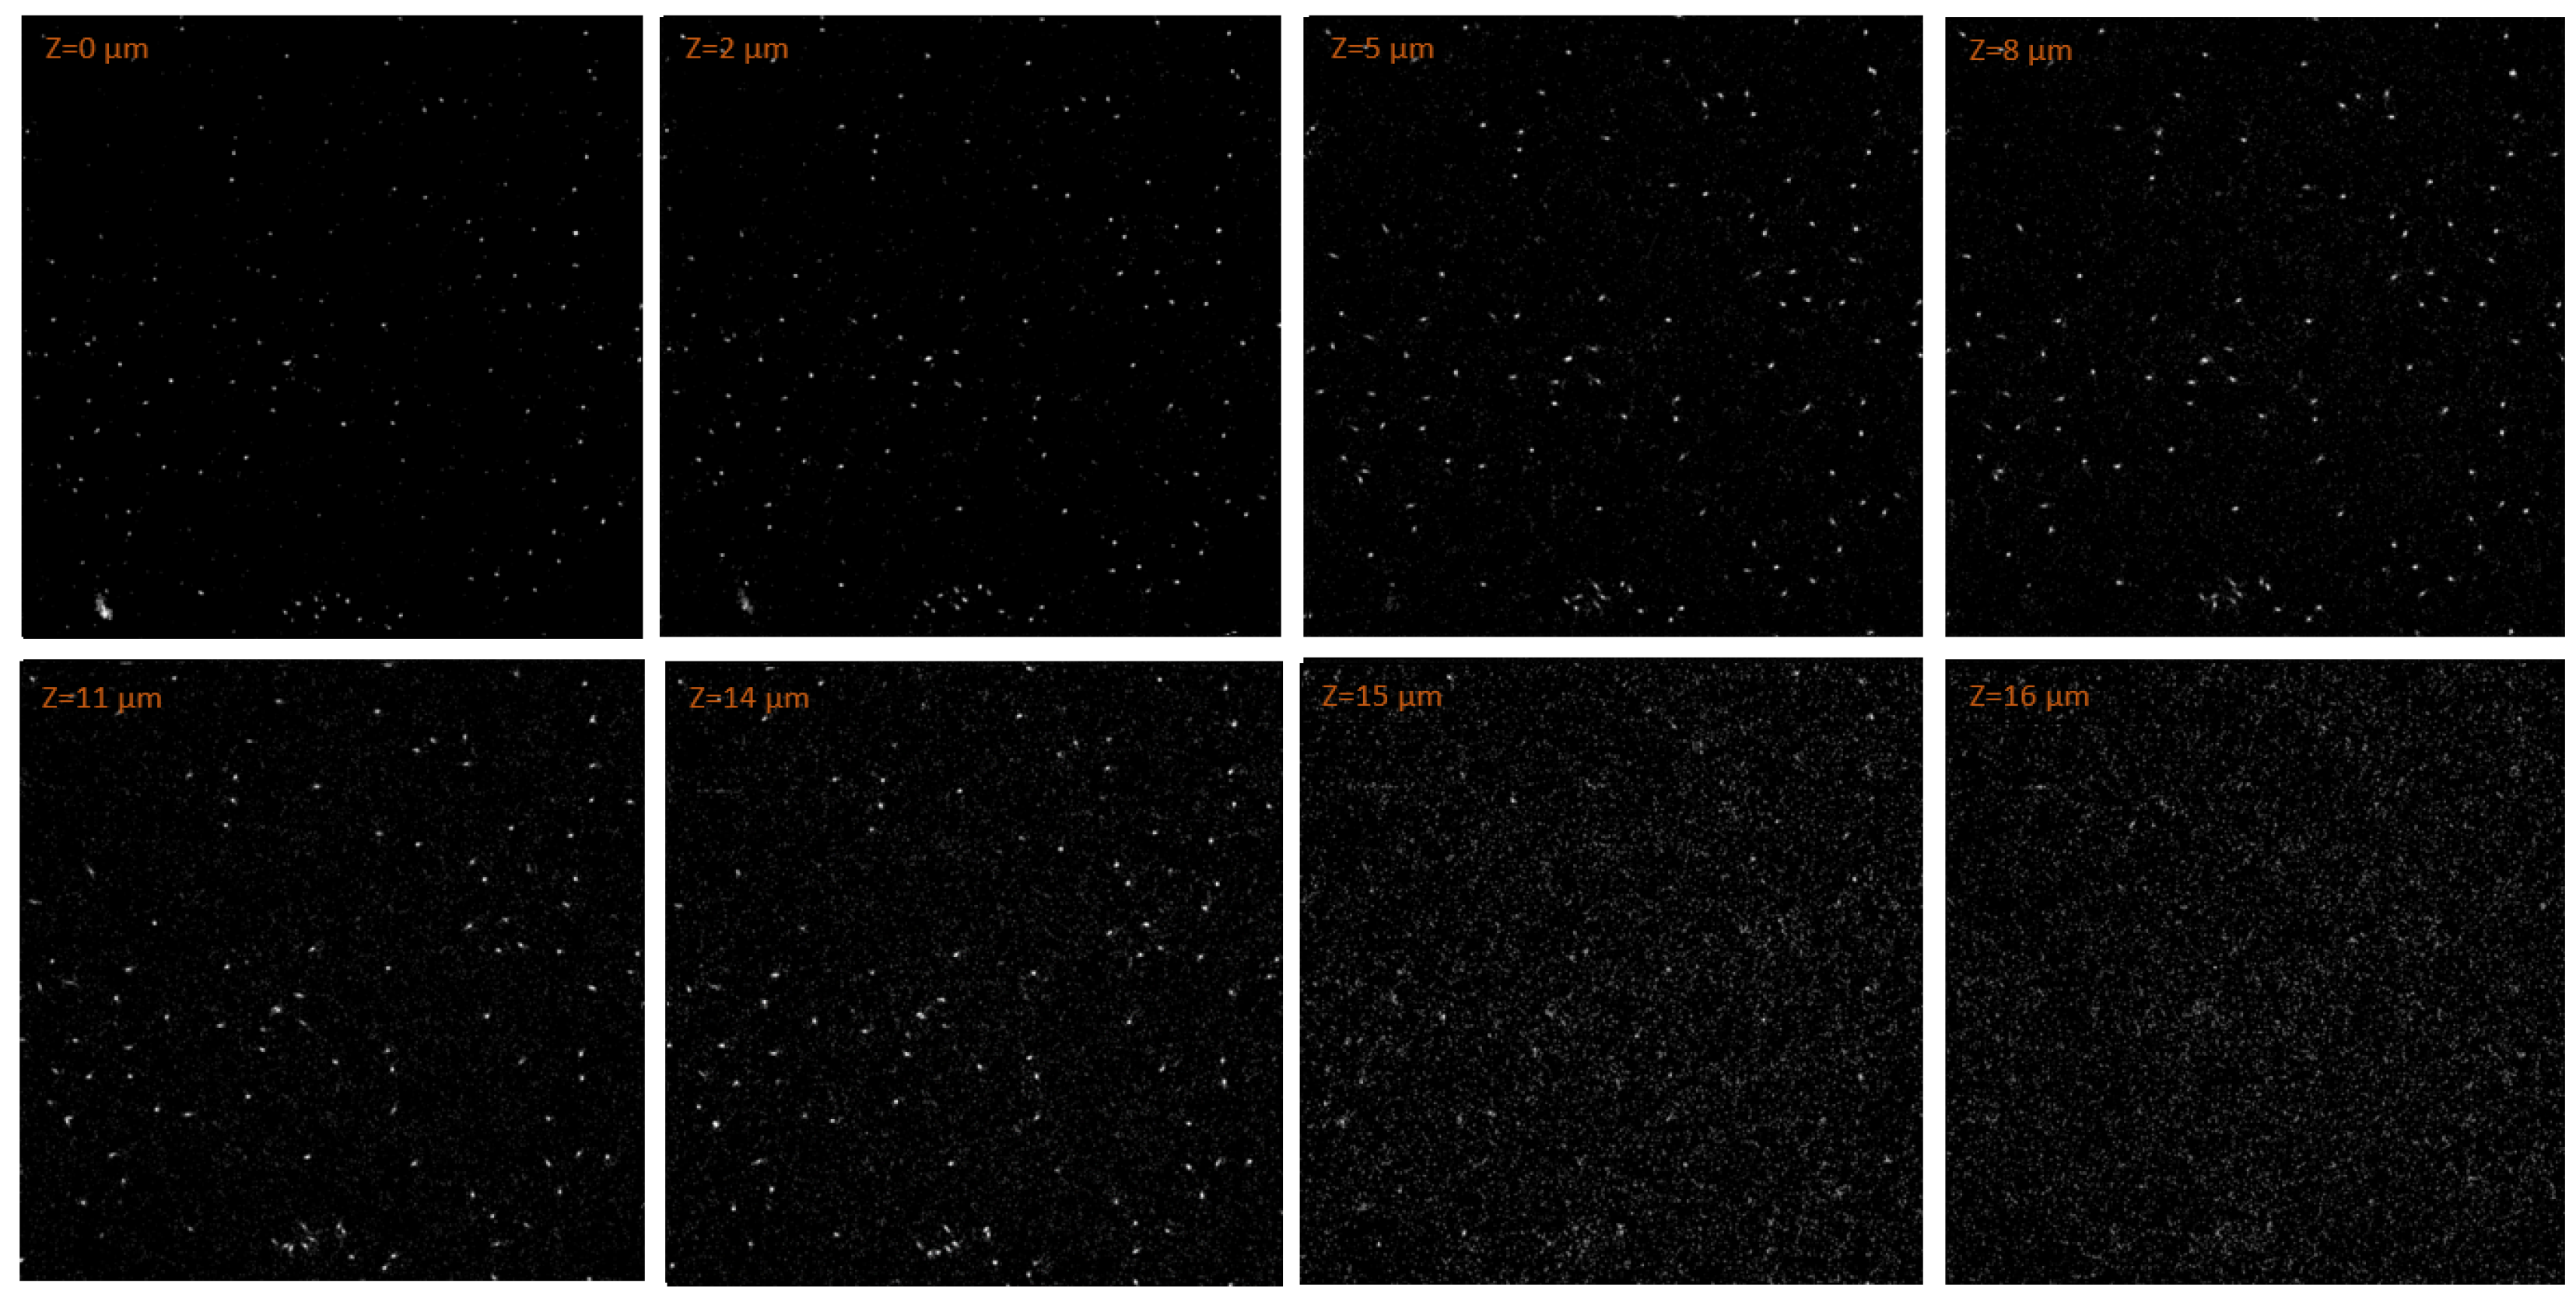
Figure 8.
3D reconstruction of the particles measured by the FNTD when emitted by the Am-241 source without any moderator. The length unit on the three axes is 10.
Figure 8.
3D reconstruction of the particles measured by the FNTD when emitted by the Am-241 source without any moderator. The length unit on the three axes is 10.
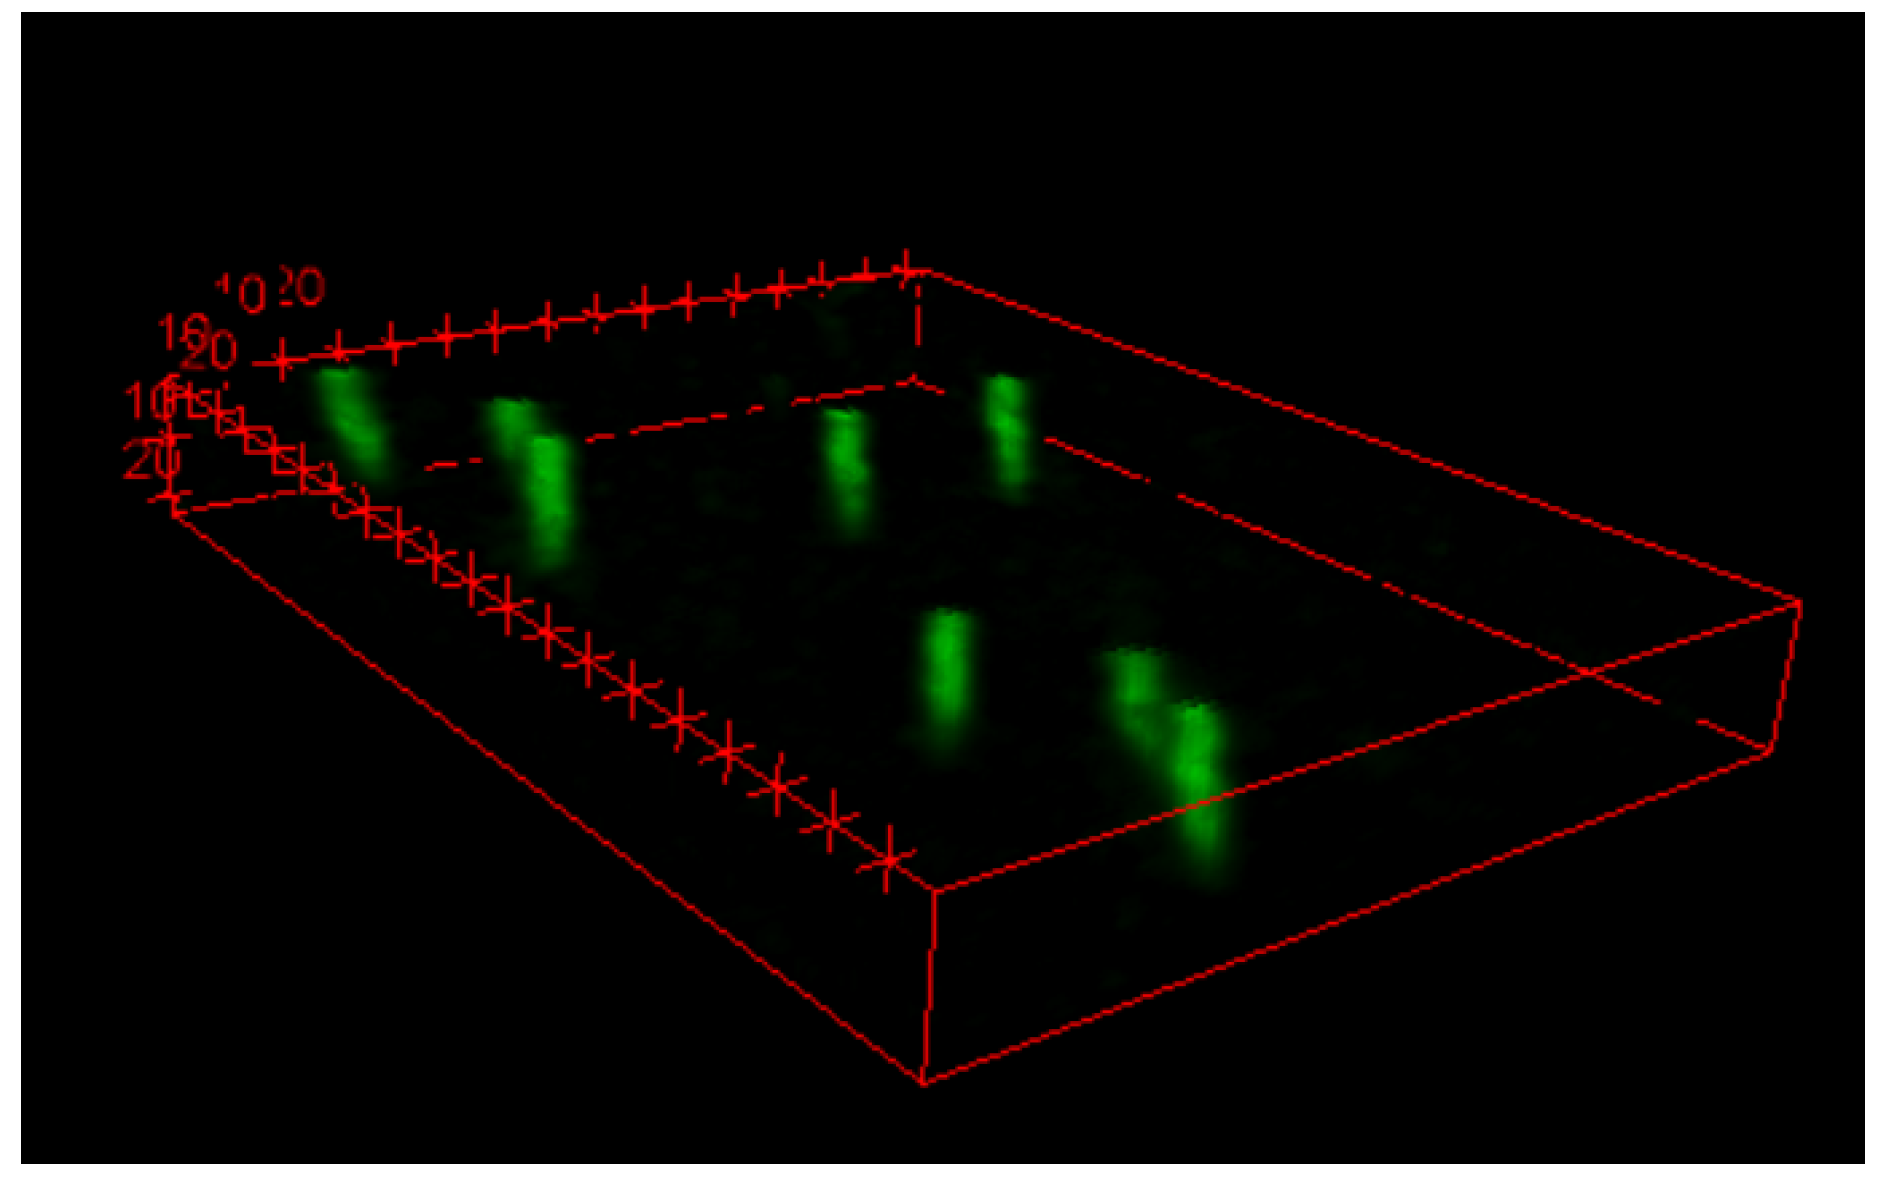
Figure 9.
Fluorescent tracks images measured by the CLSM from a region of the FNTD at different depths. The FNTD measured the radiation field obtained irradiating a sample of NIST SRM-2137 by a thermal neutron field.
Figure 9.
Fluorescent tracks images measured by the CLSM from a region of the FNTD at different depths. The FNTD measured the radiation field obtained irradiating a sample of NIST SRM-2137 by a thermal neutron field.
Disclaimer/Publisher’s Note: The statements, opinions and data contained in all publications are solely those of the individual author(s) and contributor(s) and not of MDPI and/or the editor(s). MDPI and/or the editor(s) disclaim responsibility for any injury to people or property resulting from any ideas, methods, instructions or products referred to in the content. |
© 2024 by the authors. Licensee MDPI, Basel, Switzerland. This article is an open access article distributed under the terms and conditions of the Creative Commons Attribution (CC BY) license (http://creativecommons.org/licenses/by/4.0/).
Copyright: This open access article is published under a Creative Commons CC BY 4.0 license, which permit the free download, distribution, and reuse, provided that the author and preprint are cited in any reuse.


