Preprint
Article

This version is not peer-reviewed.

Investigating The Level of Adoption and Perception Towards Irrigated Wheat Production in North Shawa Zone, Oromia Regional State, Ethiopia

Submitted:

17 December 2024

Posted:

18 December 2024

You are already at the latest version

Abstract

The main objective of the study was investigating the level of adoption and perception of irrigated wheat production in North Shewa Zone of Oromia Regional State. This study combined a qualitative and quantitative research approach with a descriptive research design and a cross-sectional survey type. Multi-stage sampling techniques were also used in the study to choose sample households. Both primary and secondary data were employed. Statistical Package for Social Science Version 20 was utilized to analyse the data using simple descriptive statistics. According to the study's findings, the majority of smallholder farmers expressed dissatisfaction with the extension services provided by DA. They also expressed disapproval of the availability of water sources for irrigated wheat production in the study area, as well as with access to credit services, necessary inputs, technical training on irrigated wheat, and irrigation facilities provided by the government. On the other hand, they confidently agreed that the government program encourages us to cultivate wheat under irrigation, and that the yields from this method are better than those from rainfed wheat. The finding of the study revealed that the overall level of adoption of irrigated wheat producers was low in the study area. In order to better align investments on irrigated wheat production, the study concludes that this new initiative knowledge should be useful through the development of a regular input supply system, the improvement of farmers' skills and knowledge, the development of modern schemes, the development of new disease-resistant varieties, and the strengthening of market linkage by experts, policymakers, researchers, and seed enterprises.

Keywords: 
;  ;  ;  ;  

1. Introduction

Agriculture has long been essential to the growth of the national economy. One of the most effective strategies for reducing extreme poverty, promoting shared prosperity, and ensuring food security is agricultural development (Viana et al., 2022). Around 75% of the world's population lives in rural areas, with around three-quarters of them living in households based on agriculture (Devlet, 2021); it contributes a significantly higher percentage of national revenue and employment in today's middle and low-income countries (Barrett et al., 2022). Nonetheless, low economic activity and high rates of poverty are frequently seen in rural areas (Galvao et al., 2020).
Wheat is among the most important staple food crops and a major diet that is consumed by over 2.5 billion people globally (Bentley et al., 2022). It is the most widely grown crop in the world, with a estimated 217 million hectares under cultivation. It contributes 752 million tons to global production (Faostat, 2020). Wheat is traded more than all any other crops combined, where the amount traded globally reached 25% of the production (Erenstein et al., 2022). Wheat is one of the major food crops that have potential impact on food security. It is the second most produced grain after maize in the world (FAOSTAT, 2022).
Wheat has low productivity in developing countries, particularly those in Sub-Saharan Africa, with rising demand and prices. Sub-Saharan Africa produced a total of 7.5 MT on a total area of 2.9 Mha accounting for 40 and 1.4% of the wheat production in Africa and at global levels respectively (FAO, 2017). Though, increasing wheat production and productivity is crucial for meeting global wheat food demand, and thereby mitigate the impacts of food shortage and rising food prices (Alemu, 2024). Therefore, agricultural technology is among the most significant factors in increasing wheat productivity, reducing poverty, and ensuring food security (Milkias & Muleta, 2021).
The Ethiopian economy as a whole is highly correlated to the agricultural sector which contributes 34.1% to the gross domestic product (GDP), 79% of export earnings, 79% workforce for population, 70% of raw material for industry (Asrat et al., 2022; Endalew et al., 2022; Zegeye et al., 2022; Wordofa et al., 2021; Gebremariam and Ying, 2022). The agricultural sector is diverse, comprising both subsistence and commercial farming practices. This includes the cultivation of a wide range of crops across different farming systems and agro-ecologies (Geleta et al., 2024).
The country’s agriculture is mainly dependent on rainfall (Mengistu et al., 2021) and small scale, dominated by limited access to technology, extension support, market information, and credit access which have contributed to the low agricultural productivity (Kifle et al., 2022; Nakawuka et al., 2018). In fact,, the agricultural production growth in the country is less than the population growth rate over the last four decades (Regasa et al., 2021). According to projections, the higher population growth rate will result in a greater demand for food, necessitating a doubling of stable crop production (Noort et al., 2022; Krupnik et al., 2017). To ensure this food requirement, the expansion of agricultural growth and achieving food security through irrigation using the major stable crops is an alternative option (Ozkan et al., 2022).
According to Belay et al. (2019), Minot et al. (2019), Tadesse et al. (2018), and Dessie et al. (2018), wheat is the second most important food crop in Ethiopia, next to maize. In terms of both volume produced and area covered, it is the most produced cereal crop (Gebreegziabher et al., 2018). It is one of the priority value chain cereal crops and holds a strategic position in the agricultural industry. It also essential for providing raw materials for the agro-processing sector, reducing the need for imports, and ensuring food security (Erenstein et al., 2022; Endalew et al., 2020).
In Ethiopia, wheat is produced by 4.58 million smallholder farmers on 1.80 million hectares of land with an estimated annual production of 5.78 million tons and average productivity of 3.05 ton/ha (Abera et al., 2022; CSA, 2021). This wheat average productivity is much below the research yield and the global average (Fischer et al., 2022; Hodson et al., 2020). This is because only smallholder farmers who cultivate farms less than one hectare are able to produce wheat using rainfed agriculture (Bekele et al., 2019); smallholders cultivate nearly 95% of the total area, and they provide 90% of the total agricultural products, with the majority of the production being for their own consumption (Isinika et al., 2022).
The Ethiopian Central Statistics Agency (2020) estimates that 4.9 million subsistence smallholder farmers depend on wheat for employment, 20.2% of overall production, and 12.2% of harvested area (1.9 million ha). Regionally, the largest volume of wheat originates from Oromia (about 53% of the wheat area and 57–58% of the national output), Amhara (34% of the wheat area and 28–32% of the production), SNNP (8% of the wheat area and 8% of the production), and Tigray (5% of the wheat area and 3–6% of the production) (USDA, 2022).
In many parts of the country, traditional irrigation was practiced for a long period of time. However, traditional irrigation practices was no longer sufficient for ensuring consistent and high crop yields (Hassen & Borana, 2024). As a result, the Ethiopian government is aware of the Homegrown Economic Reform and the irrigated wheat initiative, which can be used as an alternative for a lesson learned, to make the country self-sufficient, and eliminated the negative attitude of farmers that it is incredible to produce wheat by irrigation (Effa et al., 2023). Similarly, the Ethiopian government has set a goal to achieve self-sufficiency in wheat production and have surplus exports by 2023, effectively eliminating the reliance on wheat imports. This goal is set based on the strategies of expanding irrigated wheat land areas and bridging the yield gap in rain-fed wheat production through sustainable intensification (Geleta et al., 2024).
As a result, Ethiopia produced 8.2 million tons of wheat in 2022, setting a new record (Kefena et al., 2023). Rain-fed agriculture contributed 5.58 million tons to this remarkable production, while irrigation-fed agriculture contributed 2.62 million tons. The Ethiopian government's impressive advancements in the wheat industry provide unmistakable proof that the effort is genuinely revolutionary and a turning point in the country wheat production history (Shumeta, 2024).
The Ethiopian government recently implemented an irrigated wheat policy with the goal of drastically increasing output through the development of best-bet wheat technologies in the main agro-ecology for wheat production (Shikur, 2020). This prospect of wheat self-sufficiency can be possible with increasing wheat productivity in the rain-fed and expansion of production to the irrigable land as double crop water resources are available to irrigate wheat (Jambo et al., 2021).By using irrigated wheat production practices, significant attempts have been undertaken to bridge the yield gap in rain-fed wheat production (Senbeta & Worku, 2023). Thus, irrigated wheat production with appropriate technologies can improve wheat yield, water productivity, and nutrient utilization (Tiruye et al., 2022).
Oromia is one of the largest regional states in the country In terms of arable area and irrigated wheat production (Alemu & Tolosa, 2022; Atinafu et al., 2022; CSA, 2021). Based on the land and water potential the government is highly given priority for irrigated wheat production in the region. One of the Oromia Zones with significant irrigation potential is North Shawa (NSHZAO, 2022). For the success of the irrigated wheat production, investigating the level of adoption and perception towards irrigated wheat production are critical issues. Therefore, this study was aimed at investigating the level of adoption and perception towards irrigated wheat production in North Shawa Zone of Oromia.
North Shewa Zone has enormous irrigation potential which is the opportunity for successfully implementing government initiatives of irrigated wheat production. According to the data from North Shewa Zone agricultural office, the total production of wheat in the zone is 73,564.14 areas in hectares, 2.11 million productions in quintals and the productivity of 28.69 (CSA, 2021). Of these, 480,000 quintals obtained from the production of irrigated wheat. Small-scale farmers, that practice rain-fed farming by employing traditional technology, adopting a low input and low output production system and harvest a very low yield (Wondim, et al., 2020: GAIN, 2021).
The production is not enough to meet the increasing demand for food for the ever-increasing population. The point of emphasis in this research is to find out the level of adoption and perception towards irrigated wheat production. But as far as the knowledge of the researchers, no research has been done on the level of adoption and perception of irrigated wheat production in the study area. Understanding the level of adoption and perception towards irrigated wheat production is vital in promoting practice of irrigated wheat production in order to enhance adoption of its production in the study area in particular and in Ethiopia in general.

2. Material and Methods

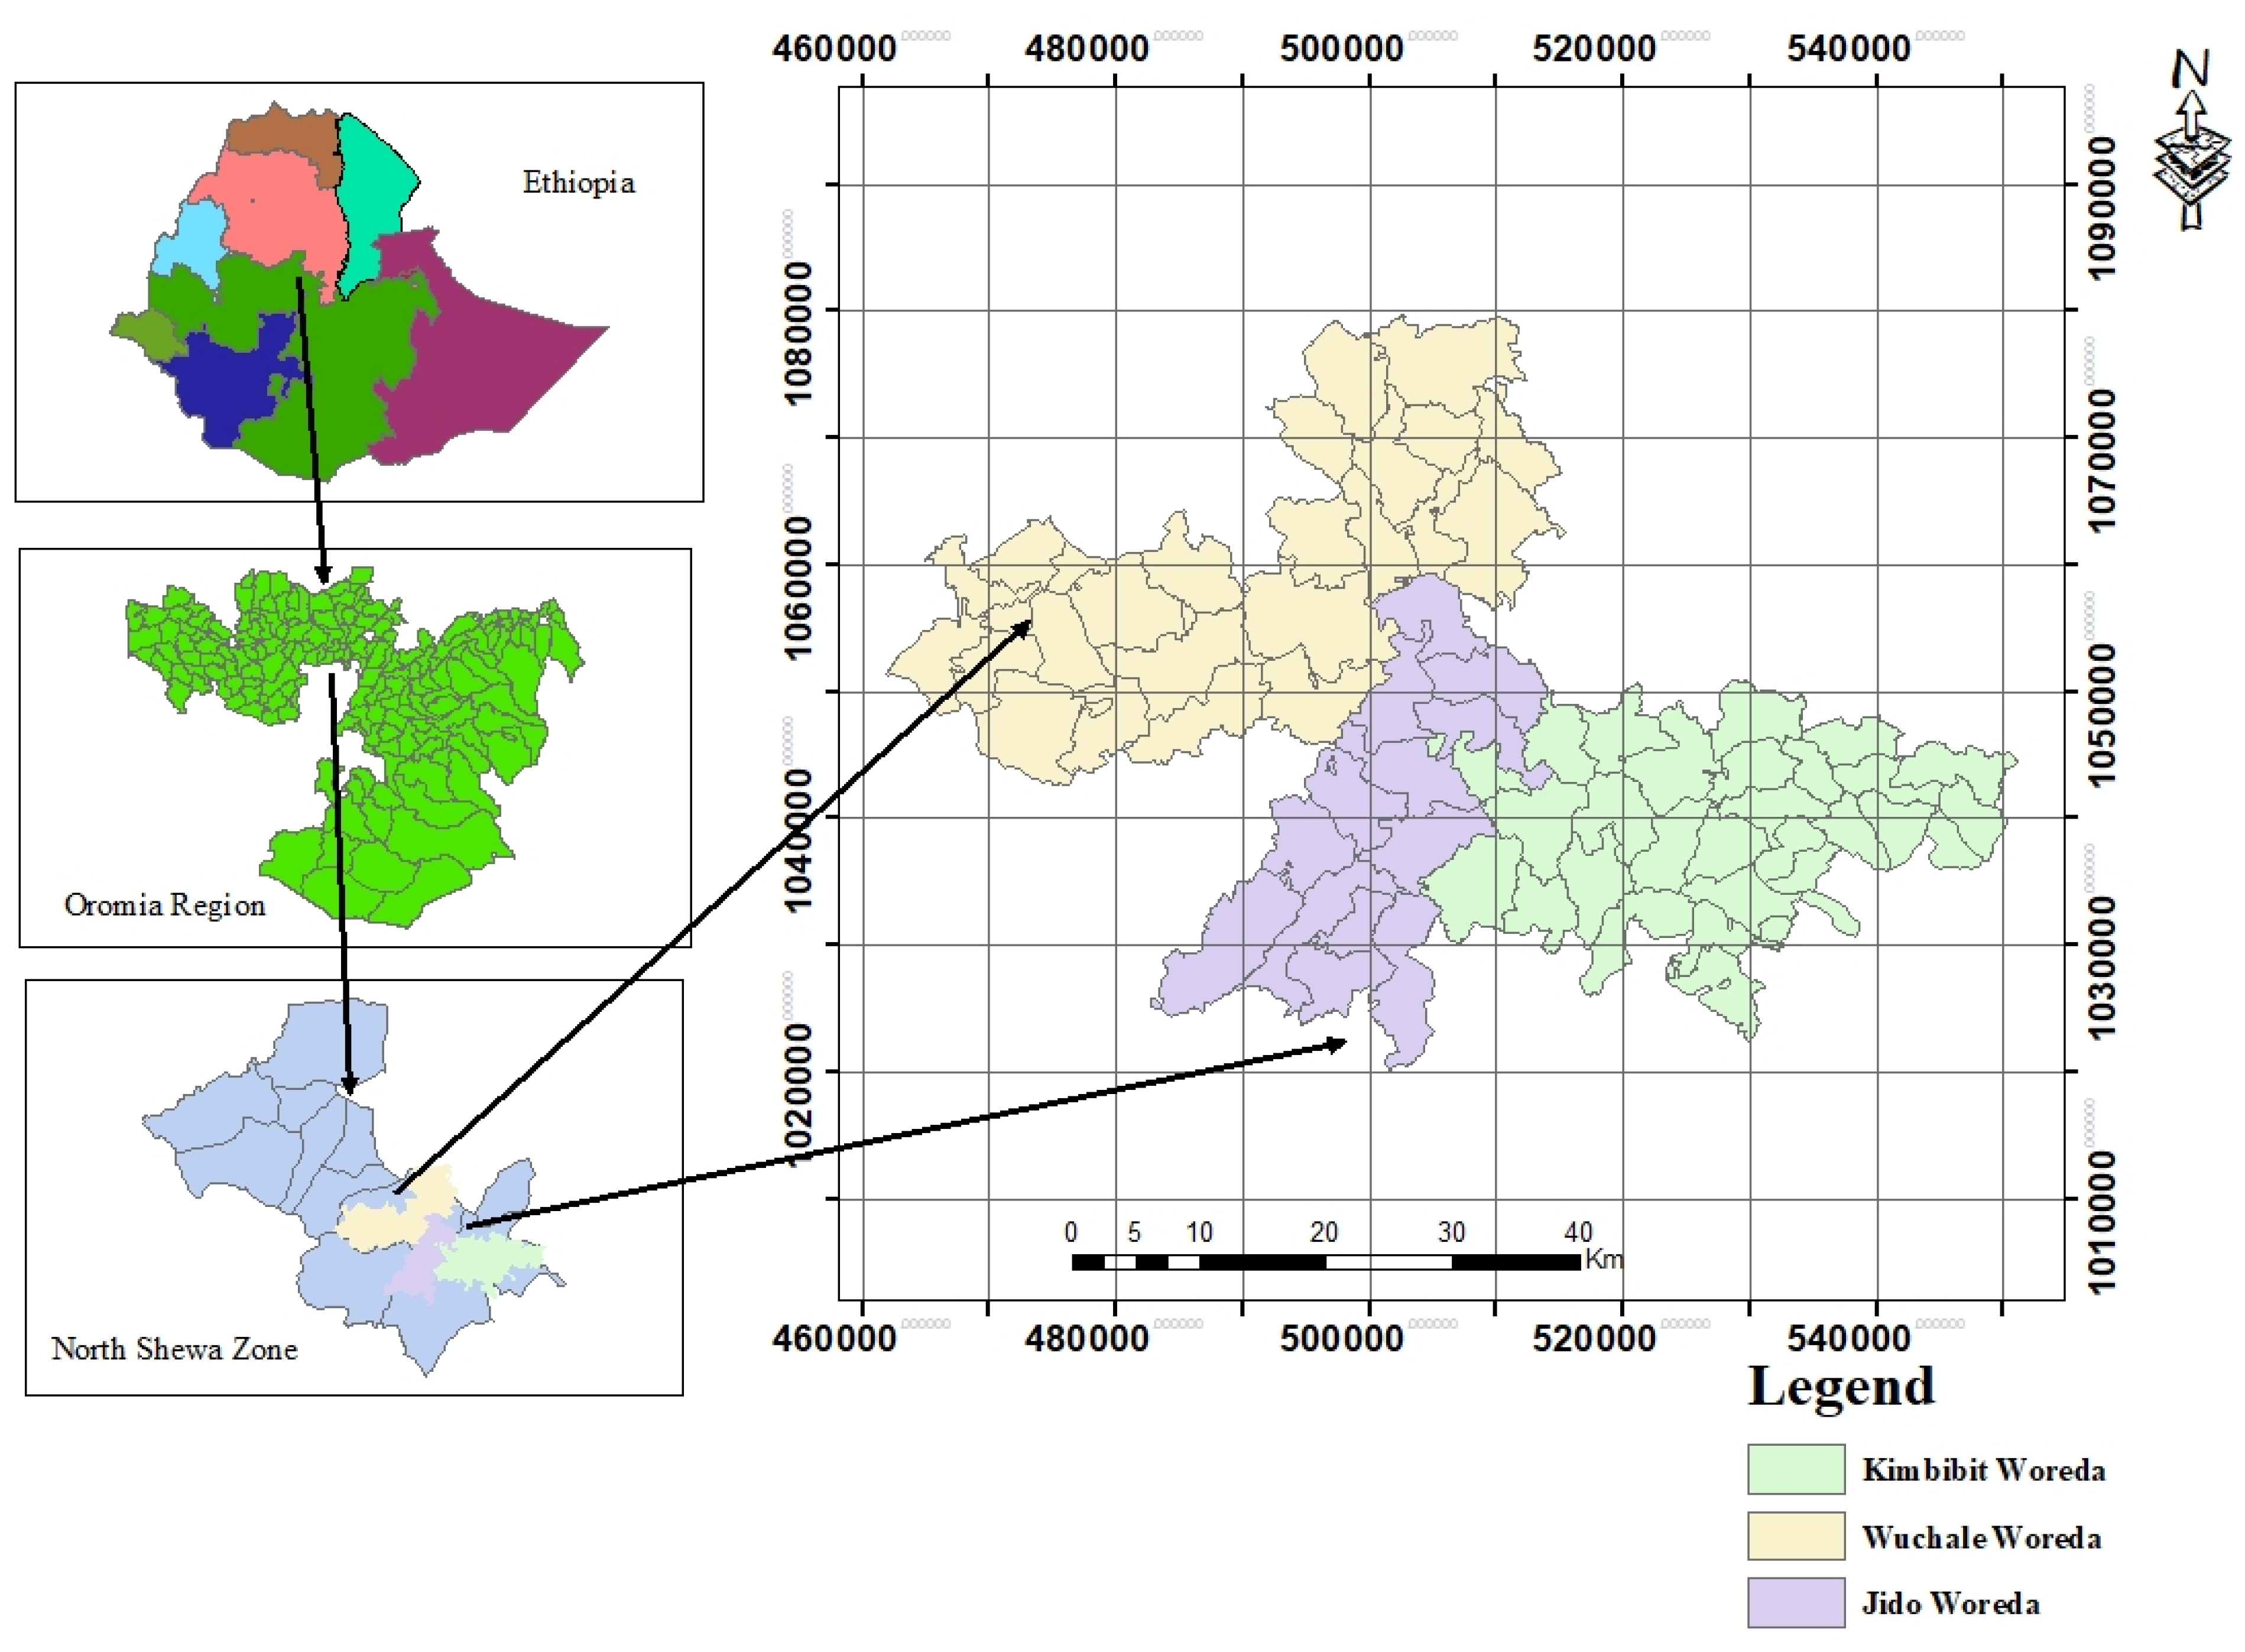
2.1. Description of the Study Area

The study was carried out at North Shawa Zone of Oromia Regional State Ethiopia during 2022/23 offseason under farmers’ condition. North Shawa Zone is located at 112 km North of Addis Ababa (Finfinne), the capital city of Oromia and Ethiopia. This zone is situated between 1000 and 3500 meters above sea level. According to Game and Korecha (2015), it is located at latitude and longitude of 9°48′N 38°44′E. In 2022, the zone had a total population of 1,523,743, of which 1,466,103 were rural residents (730,266 males and 735,837 females). While more than 90% of the population lives in rural areas, the rest were urban residents (NSHZFEDO, 2022). The main economic activities in North Shewa zone are mainly focused on mixed farming and the major agricultural crops include wheat, maize, teff, barley, bean, pea, enset, sorghum, coffee, potato, tomato, onion, cabbage, banana, and others (NSHZAO, 2022).
Figure 1. Map of the study the Study area.
Preprints 143177 g001

2.2. Research Design

The design of the research determines the what, where, when, how much, and what means of an inquiry or research study (Kothari, 2004). Since all relevant data was gathered at one time, a cross-sectional survey type and a descriptive study design were used. A descriptive research design is useful for gathering first-hand information about a population that is too big to examine in person and is therefore suitable for generalization (Nardi 2018). In this study mixed research approach was adopted, because which involves both quantitative and qualitative research methods.

2.3. Sampling Technique, Procedures and Sample Size Determination

The target population of the study was the smallholder growers of irrigated wheat crops in selected districts of North Shewa Zone. Multi-stage sampling procedure will be employed to select the sample. In the First Stage: - three districts namely (Wucale, Jidda, and Qimbibit) from North Shoa Zone were selected purposively depending on high irrigated wheat production potential area. Above all, adopting irrigated wheat production initiatives is low when compared with existence of irrigation potential (NSHZAO, 2022). In the Second Stage: Nine kebeles from three districts (three kebeles from each district) was selected purposively based on irrigation potential and low adoption of irrigated wheat production.
In the third stage: Selection of the sample households which was undertaken by employing simple random sampling techniques to proportional size of these districts population. The respondents were stratified into adopters and non-adopters. Smallholder farmers who used different technology and package for irrigated wheat production was classified as adopters while who didn’t used different technology and package for irrigated wheat production in the area rather simply planting other crop was classified as non-adopters. Finally, a total of 384 representative farmers were selected randomly. The sample size for collecting data through household survey is determined by using the sample size determination formula proposed by Cochran (1977) method. Determine the required sample size at 95 % confidence level.
n o = Z 2 p q e 2 = ( 1.96 ) 2   ( 0.5 0.5 ) ( 0.05 ) 2 = 384
where, no =designates the sample size;
Z=95 confidence limit (interval) under normal curve that is 1.96
P=smallholder farmers adoption of irrigated wheat production that is= (0.5)
q = none occurrence of event= (0.5)
e =designates margin of error considered for this study 5 %( 0.05).

2.4. Data Types, Source and Method of Data Collection

Both primary and secondary data were used in this investigation. While secondary data was gathered from published information on irrigated wheat production, primary data was gathered from study participants. As the name implies, primary data is information that is gathered initially by the researcher, whereas secondary data is information that has previously been gathered or created by others (Ajayi, 2023).
To achieve the stated purpose of this study, quantitative and qualitative data required was collected from primary and secondary sources. Quantitative and qualitative were generated from survey questionnaires and key informant interviews. Empirical data was collected using questionnaires and key informants.

2.5. Method of Data Processing and Analysis

To identify perception of farmers towards adoption of irrigated wheat production in the study area, qualitative data captured through key informant interview, semi structured interview was narrated, interpreted and analyzed in the form of descriptions, and narrations. Quantitative data collected from primary data household survey questionnaire were analyzed in computer with the help of SPSS Version 20 software. Accordingly, simple descriptive statistics like frequencies, percentages, mean and standard deviation were employed. Farmers' perceptions on the adoption of irrigated wheat production were measured using a Likert scale (1–5) i.e. stands for the negative response strongly disagree to the positive response strongly agree.
The level Adoption of irrigated wheat production practice was measured by computing adoption scores for recommended technologies. Scores to given to each technology that varied from 1 to 0 according to the adoption of the suggested technology. A respondent farmer could get a score of “1” for adopting the technology. On the other hand, farmer could receive a score of “0”for not adopting the technology. The mean score became the index of level adoption of the recommended technologies. Farmers were ranked as never-adopted, low adopters, medium adopters, and high level adopters, respectively, based on their scores (Rahman and Haque, 2013). Likewise, as to Rehman and Haque (2013), and Raju, (2019), the mean score below 0.25, 0.26 to 0.50, 0.51 to 0.75, and 0.76 up to 1.00 was considered as non-adopters, low-adopter, medium-adopter and high-adopter respectively as illustrated by given four rank-ordered response options.
The major irrigated wheat production technology indicators (practices) measuring level of adoption of irrigated wheat producers were field preparation, beds and channels, use of high yielding varieties of wheat seeds, right time of sowing, use of row planting technology, organic manure and fertilizer application, right time of watering, soil treatment, seed treatment, weed management, and right time of harvesting with frequency of application were never, rarely, sometimes, and always.

3. Result and Discussions

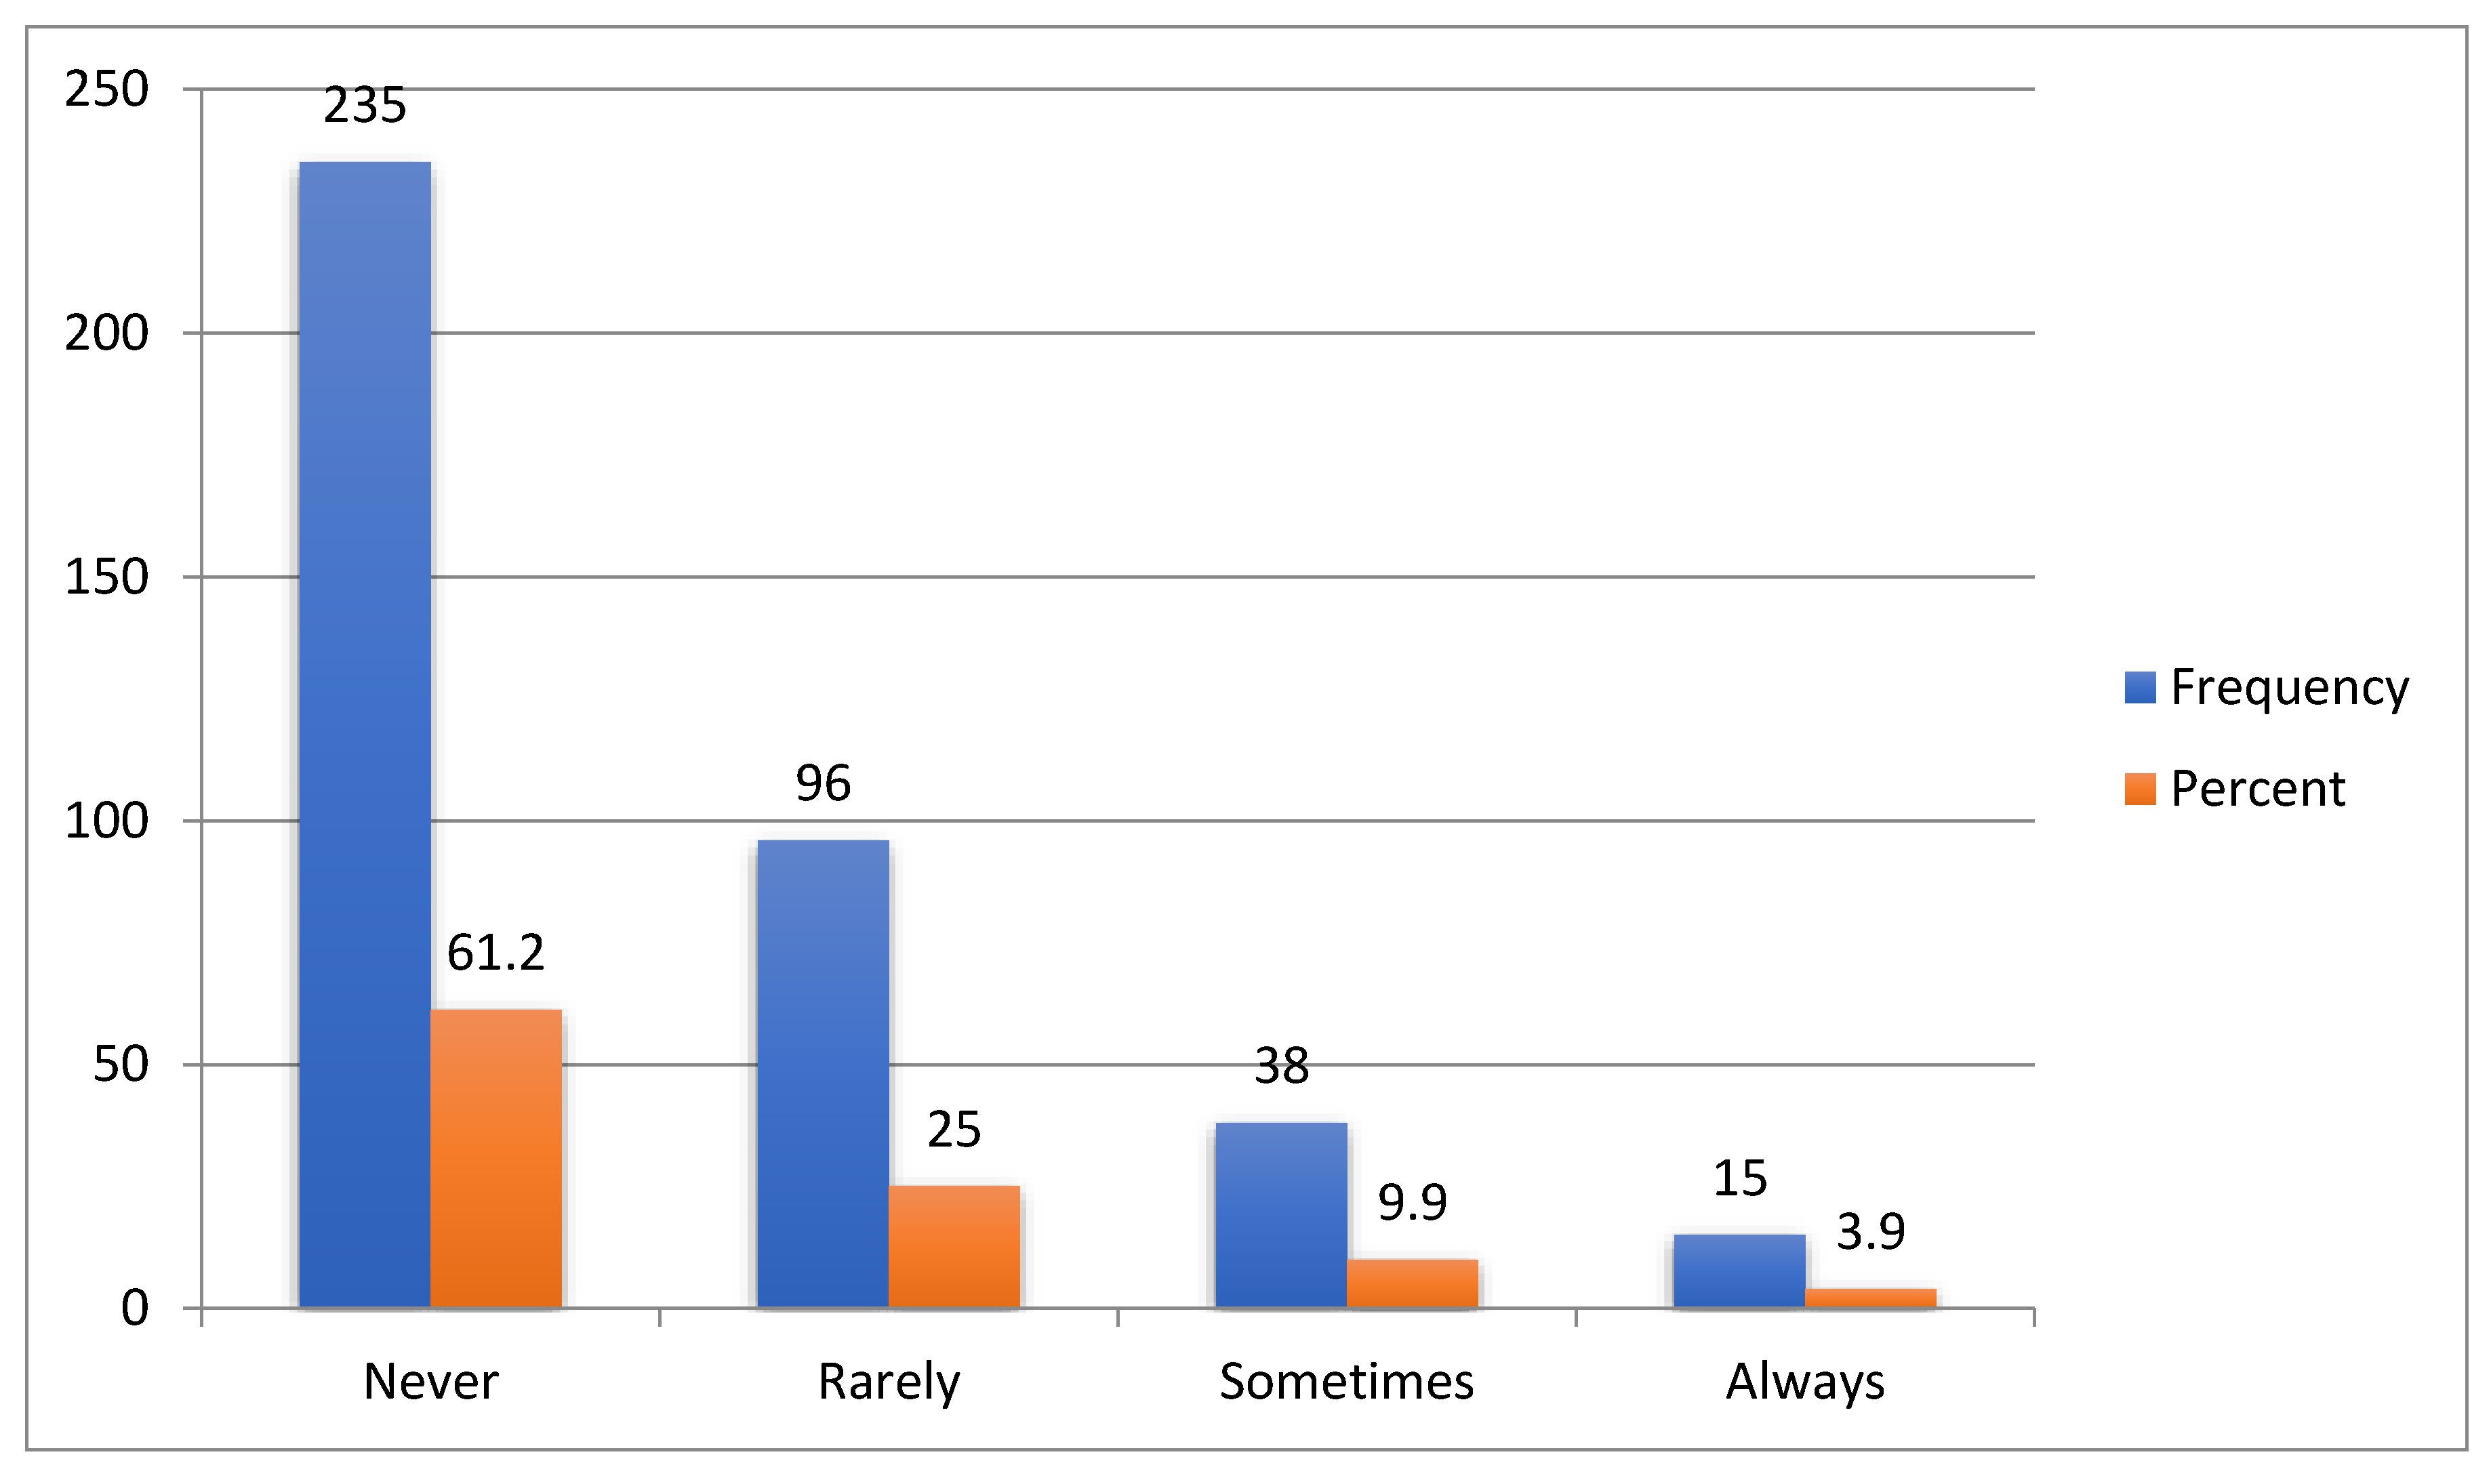
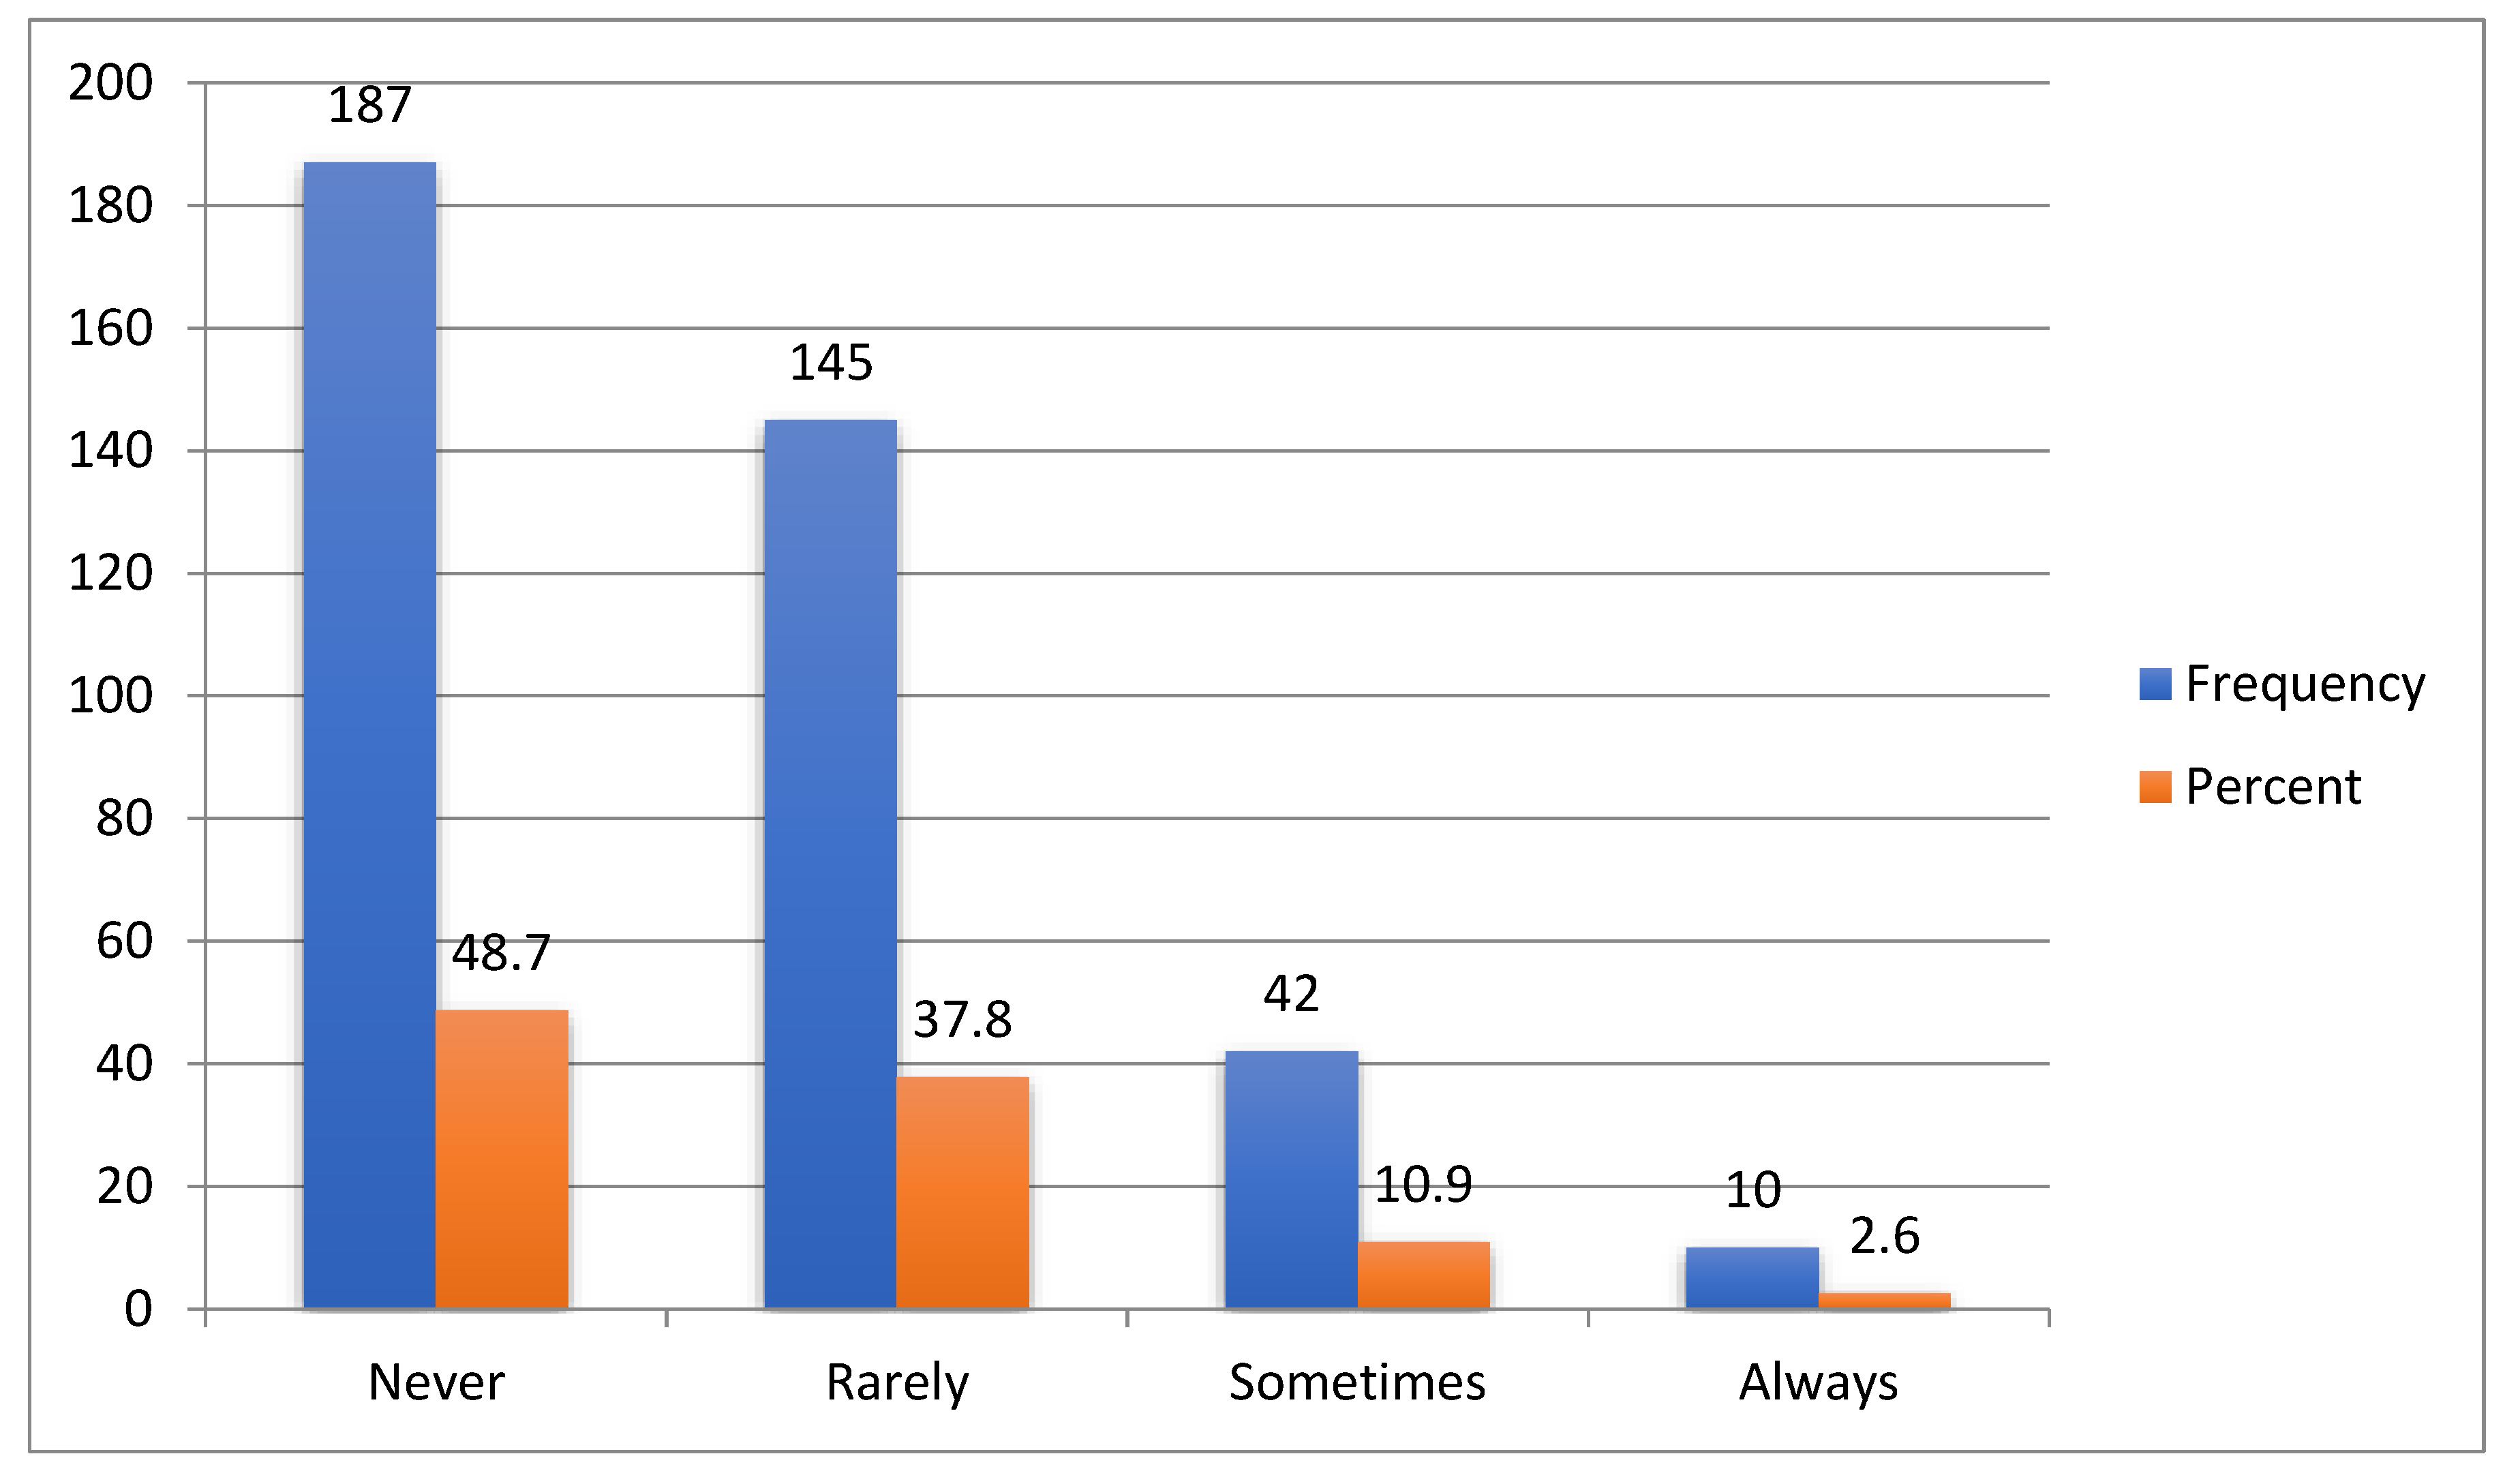
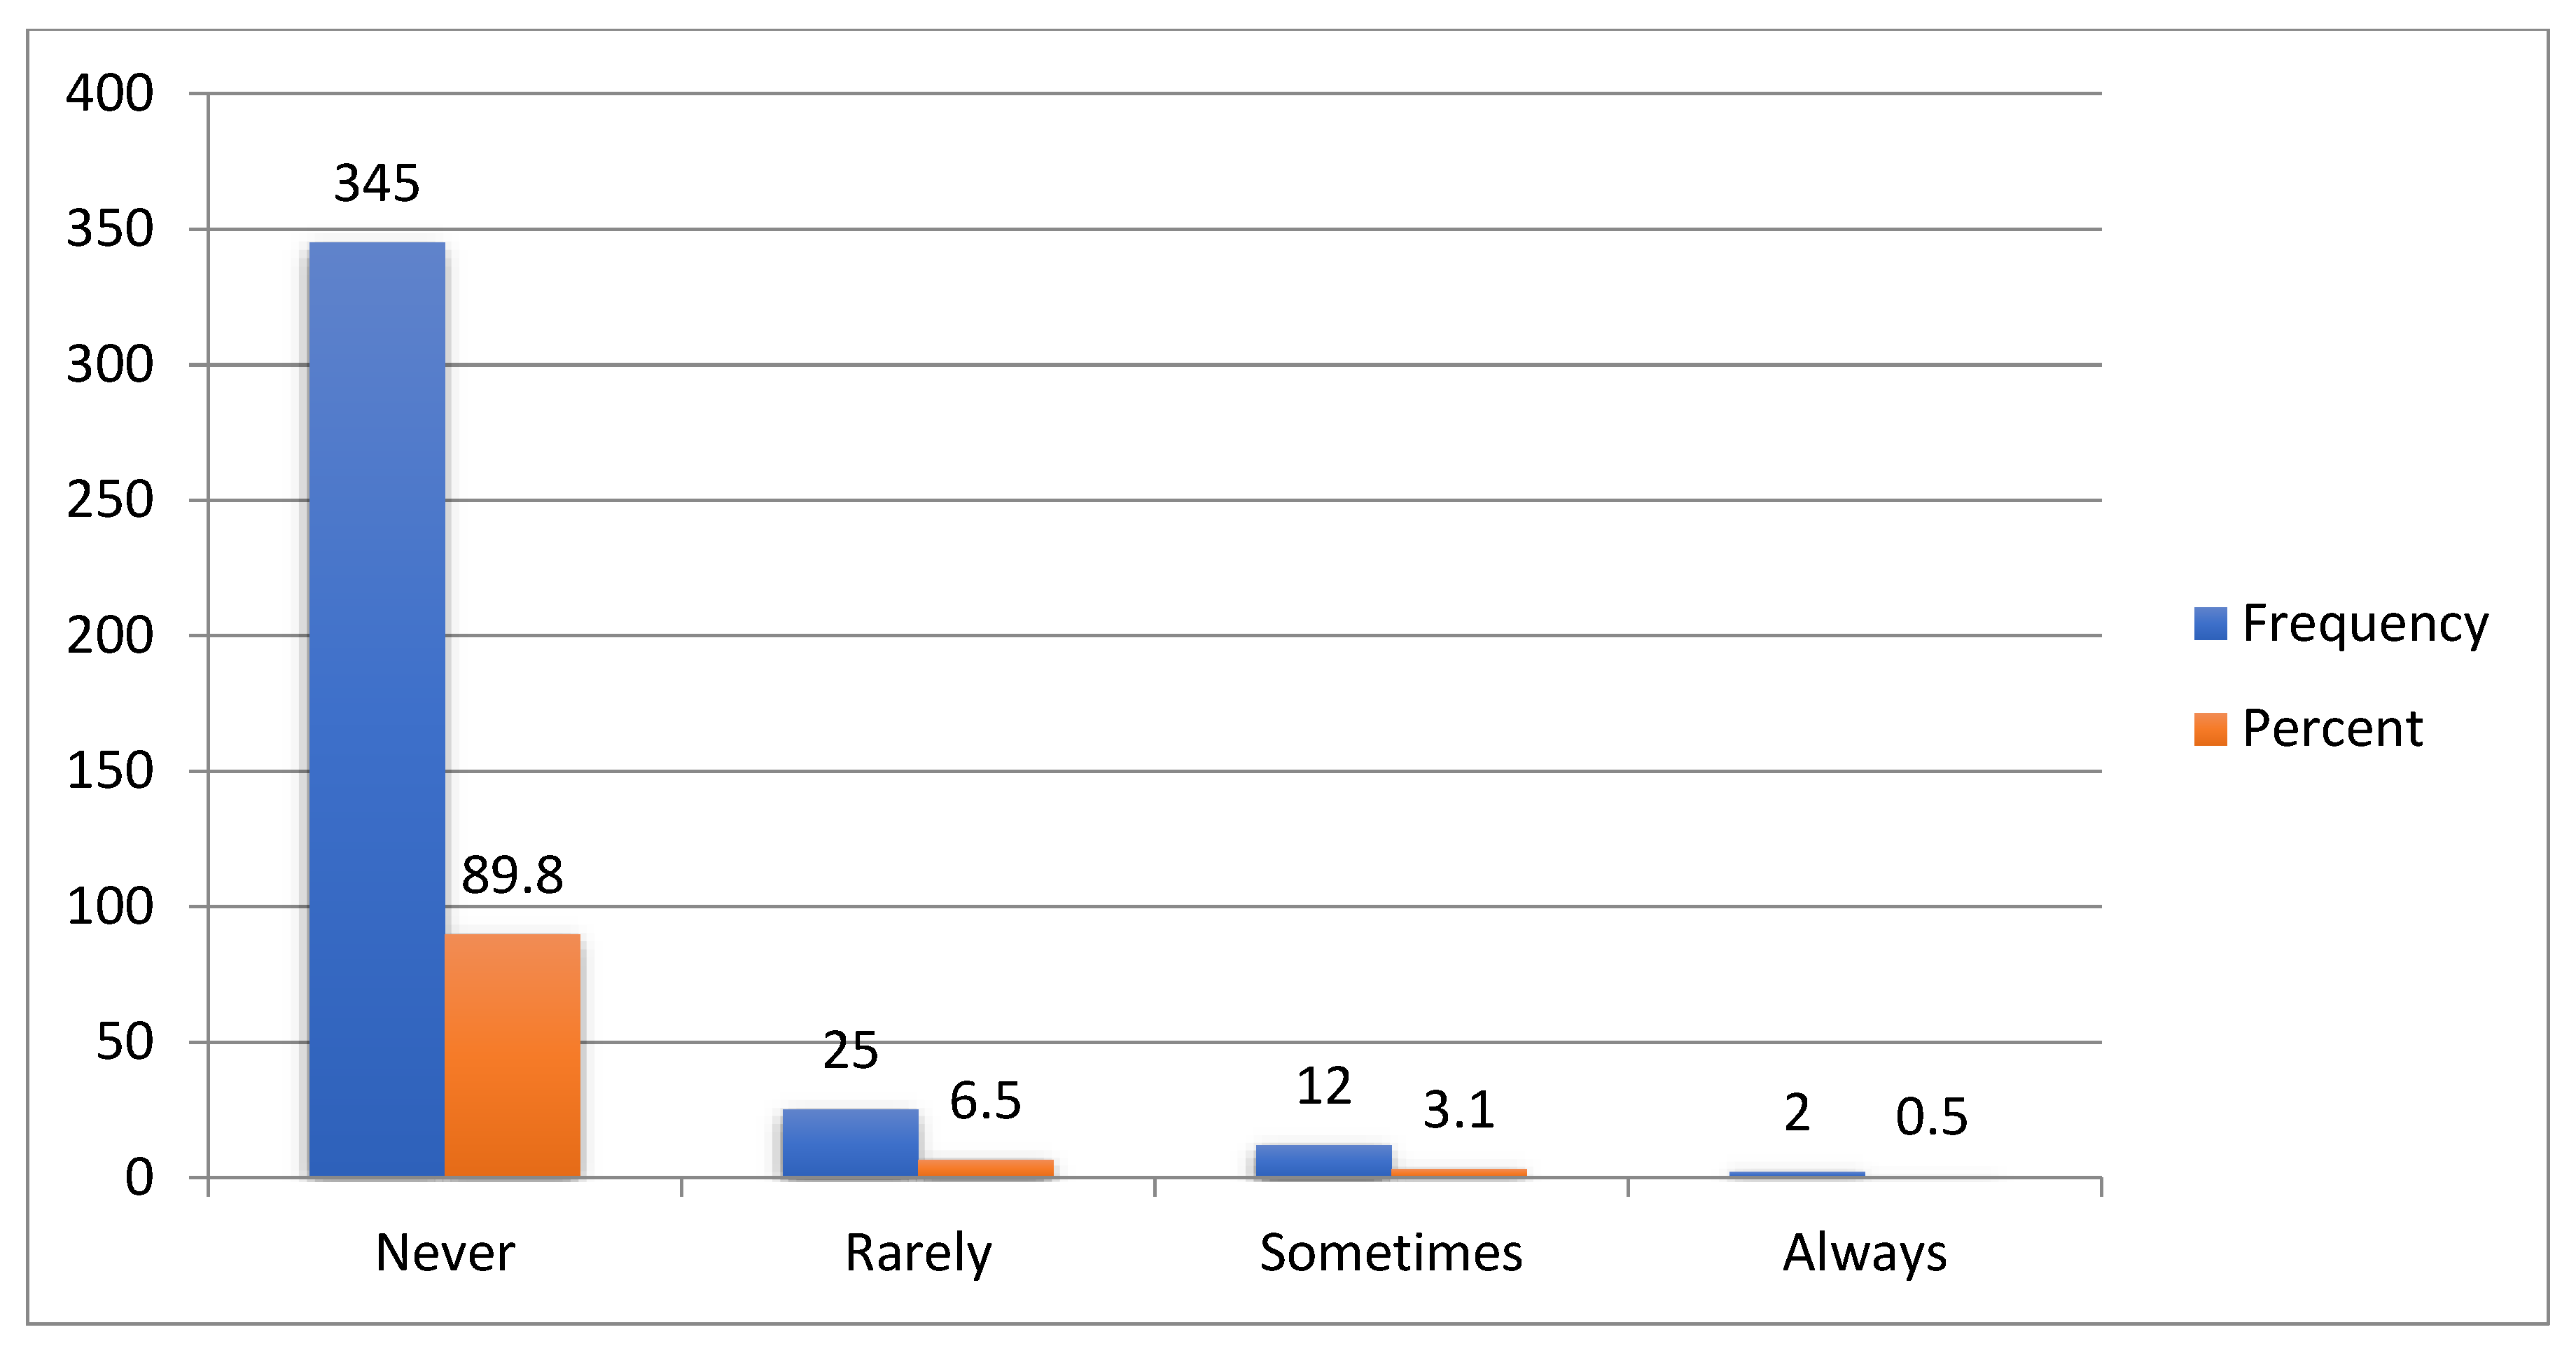
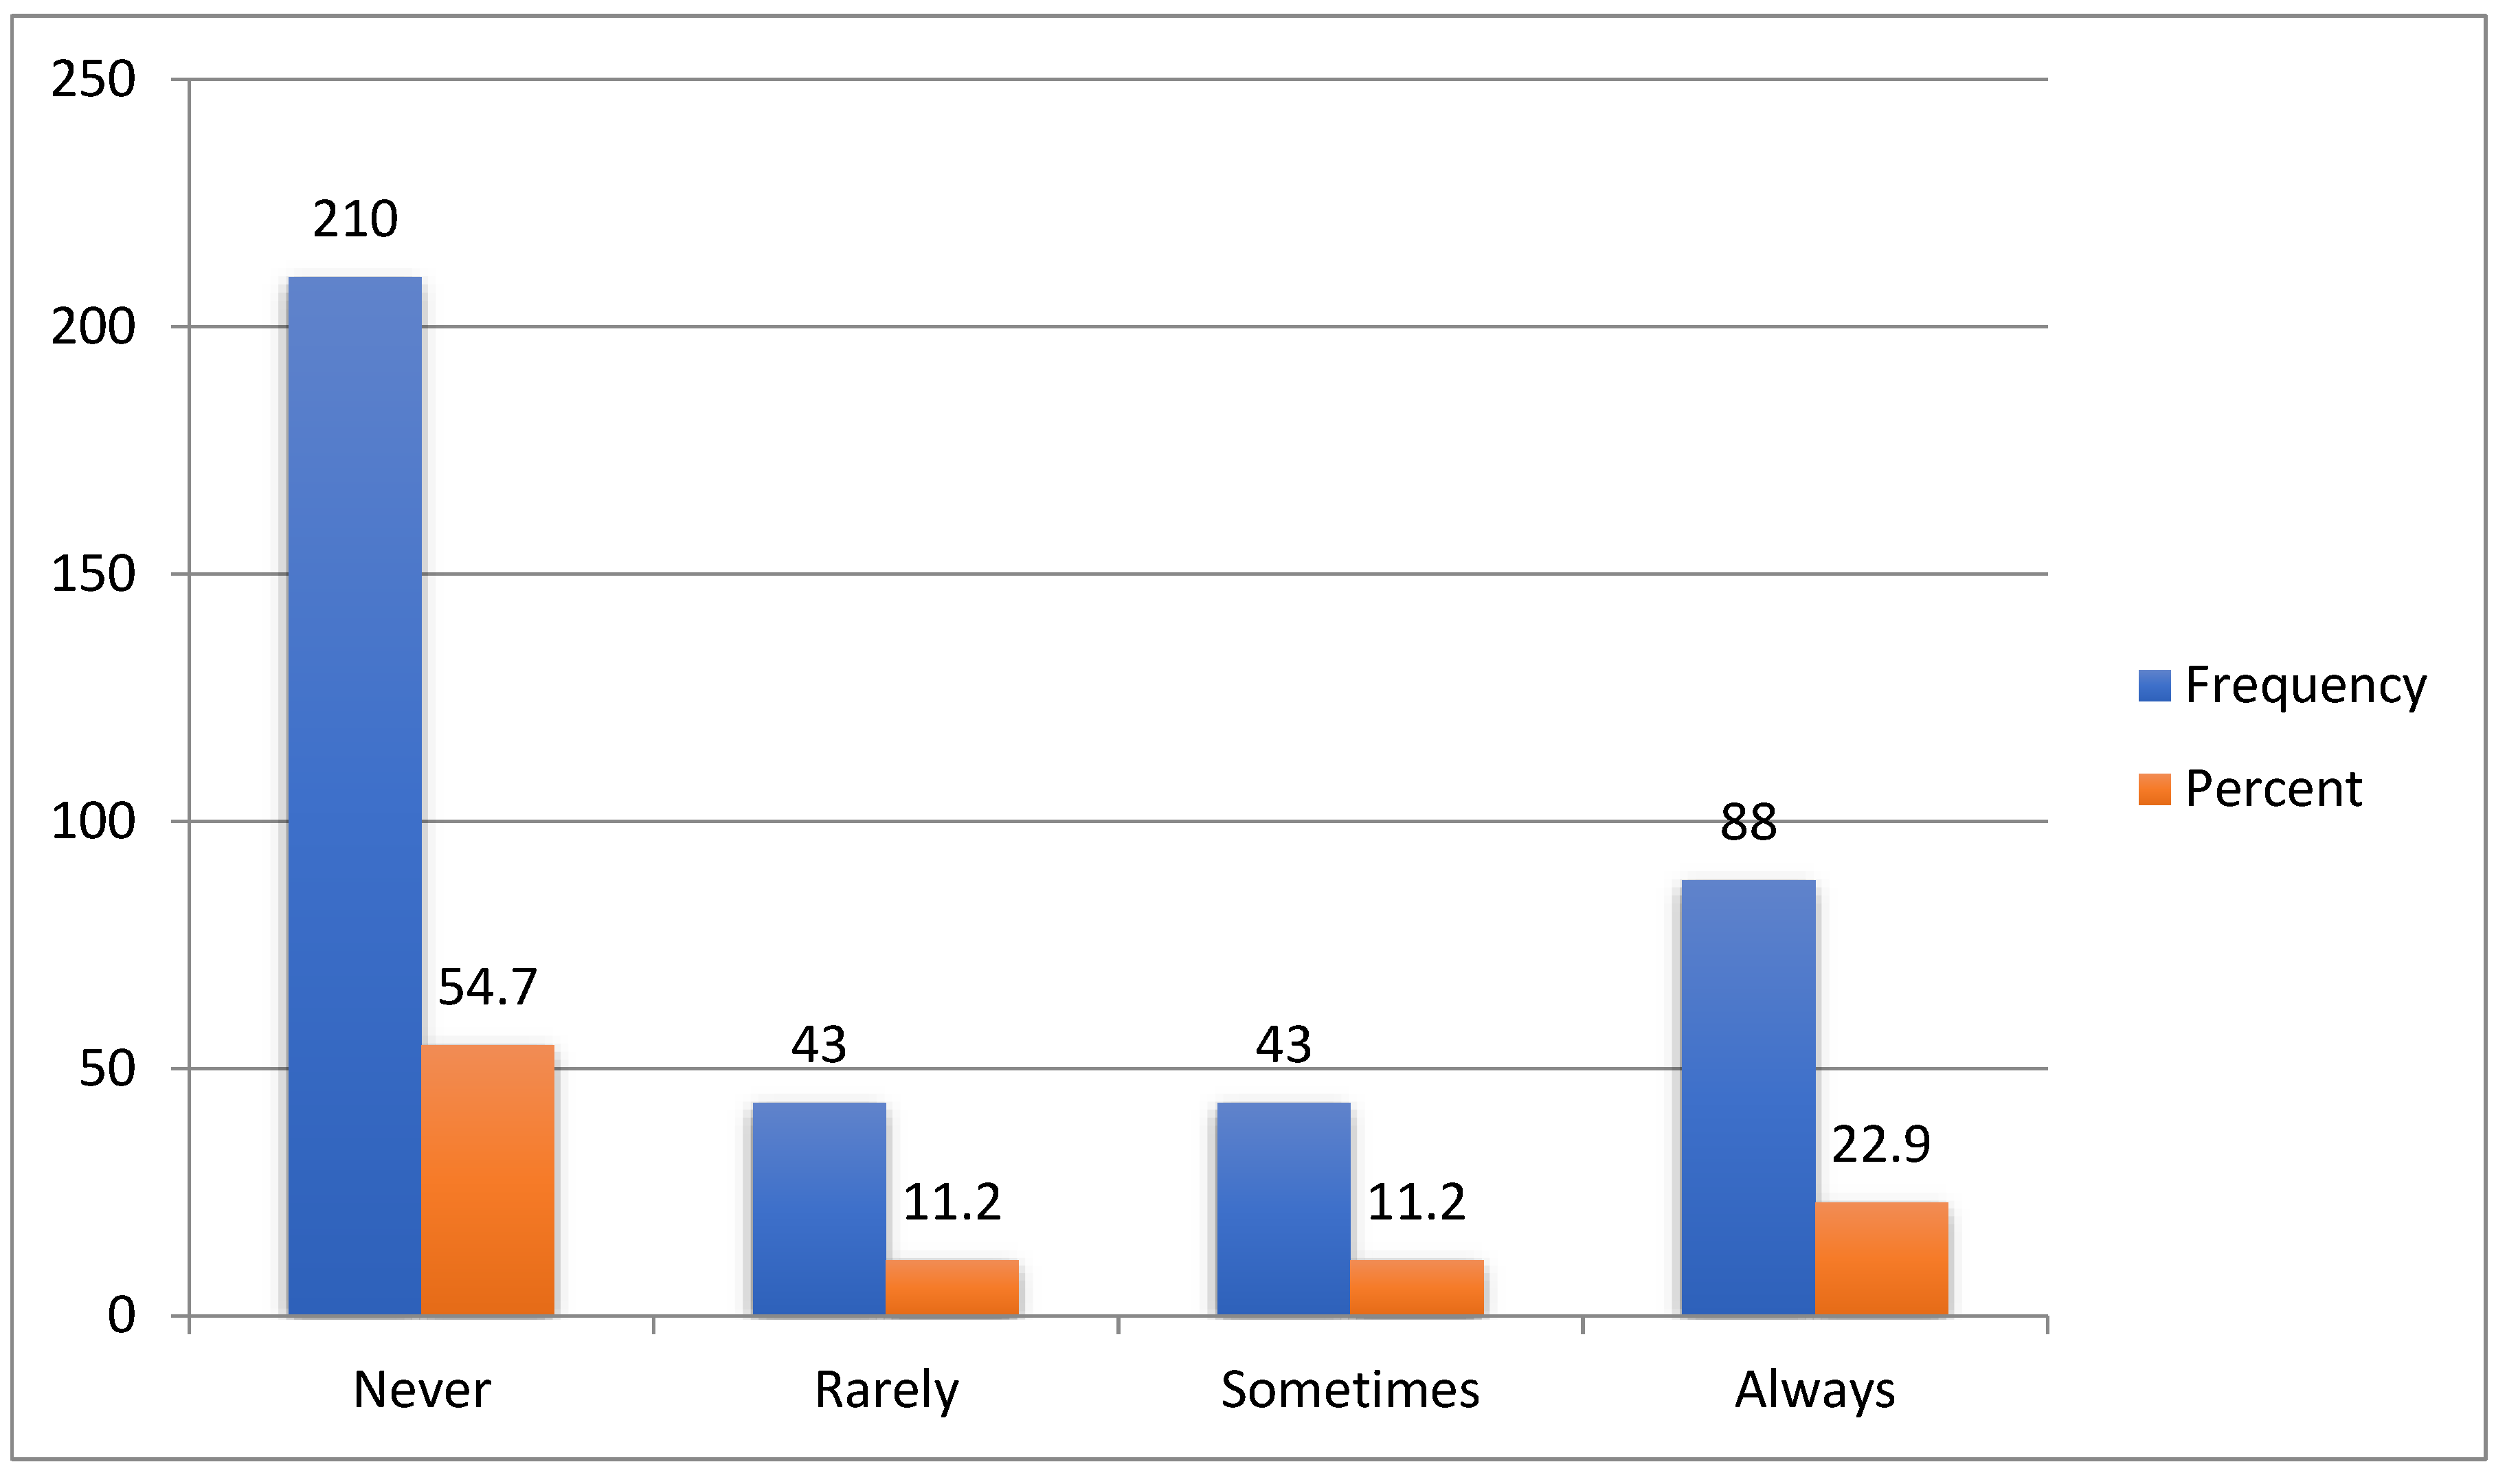
3.1. Perception of Farmers Towards Irrigated Wheat Production

This part of the analysis is made based on survey questionnaires gathered from 384 respondents, using 5-point Likert’s scale. The summary of descriptive statistics of all variables that are evaluated based on a 5-point Likert scale (“1” “strongly disagree” to “5” “strongly agree”).
According Damianus et al., (2022), and Vichea, (2005) the mean scores of the respondents fall between the ranges of 4.20–5.00 are considered as strongly agreed/very high; 3.40–4.09 as agreed/high: 2.60–3.39 as Neutral/Moderate; 1.80–2.59 as disagree/low and 1.00–1.79 was considered as strongly disagree/very low.
Depend on this about, the mean score and standard deviation of farmers perception on the irrigated wheat production was most effective than rainfed was 3.28 and 1.43 respectively in the study area. This finding indicates that, the perception of smallholders in the study area was neutral and they perceived moderately to the statement in the study area. Similarly, the analyses result depicted that, the mean score of farmers perception on the satisfaction on access to extension service given by DA was 2.67. This shows that, the satisfaction of farmers on access to extension service given by DA in the study area was moderate.
The result of the study indicated that the mean score of smallholder farmers on access to credit service, and access to necessary inputs for irrigation wheat production was 2.3281 and 1.9297 respectively in the area. The result of the study revealed smallholder farmers in the study area was disagreed on access to credit service, and access to necessary inputs (for irrigation wheat production) in the area and the perception of farmers was low to the statements.
The analyses result revealed that the mean score of smallholder farmers on Positive perception of irrigated wheat production practices, and access technical training on irrigated wheat in the study area was 3.32, and 3.19 respectively. Meaning that, the perception of farmers on the positive perception of irrigated wheat production practices, and access technical training on irrigated wheat was neutral/moderate in the study area.
Concerning the statements made on access to irrigation facilities from government, respondents were disagreed to the statement with mean score and standard deviation 2.31, and 1.32 respectively. Meaning that, the access to irrigation facilities provision from government for irrigated wheat production was low in the study area.
The result of the study specified that the mean scores of smallholders on the scarcity of water source for irrigated wheat production, government initiative motivate us on irrigated wheat production this year, and the capacity of wheat yields is good than rainfed in the study area was 3.39, 3.45, and 3.19 correspondingly. The result revealed that farmers were agreed to the statements and they were highly perceived on the statements. That means in the study area, there was water scarcity during irrigated wheat production. But, the government initiative motivates farmers to produce irrigated wheat as well as the capacity of wheat yields is good under irrigation than rainfed in the study area.
Table 1. Perception of farmers towards irrigated wheat production.
Variables Mean Std. Dev
Irrigated wheat production was most effective than rainfed 3.2891 1.43703
There were satisfaction on access to extension service given by DA 2.6719 1.51809
There was access to credit services in the area 2.3281 1.42218
There was access to necessary inputs(for irrigation wheat production) 1.9297 1.18421
Positive perception of technology on the irrigated wheat production 3.3281 1.44766
There was access technical training on irrigated wheat 3.1927 1.50520
There was access to irrigation facilities from government 2.3125 1.32312
There was scarcity of water source for irrigated wheat production 3.9141 1.36744
Government initiative motivate me to produce irrigated wheat 3.4505 1.52015
The capacity of wheat yields is good than rainfed 3.1927 1.45043
Source: Field Survey, 2023.

3.2. Farm Household Level of Adoption of Irrigated Wheat Production

The level Adoption of irrigated wheat production practice was measured by computing adoption scores for recommended technologies. For research study, an interview schedule was constructed with the help of experts. Eleven packages of practices of irrigated wheat production technology were included in the schedule and responses of respondents were recorded and filled in the interview schedule. Based on the computed adoption scores, the respondents were asked to rate their level of adoption on the given technology practices with four response categories ranging from never to always. The values for each response category were 0 to 25 for non-adopters, 0.26 to 0.50 for low adopters, 0.51-0.75 for moderate adopters, and 0.76-1 for high adopters of the given major technology packages.

3.2.1. Field Preparation: Prepare the Land to Fine Beds and Channels

Land preparation is the first and foremost activity involved in wheat production. Figure 2 below shows that out of total number of respondents, 174(37%) had never-adopters of field preparation for irrigated wheat production technology. Also, 123(32%) had rarely adopters, 51(13.3%) had medium adopters and 36(9.4%) had high adopters of field preparation for irrigated wheat production technology practices in the study area. The mean score of adoption was found only 0.29 which implies low level of adoption of farmers on field preparation for irrigated wheat production technology practices in the study area. Key informant interview confirmed that there were very few farmers who prepare land very well for irrigation production in the area.

3.2.2. Beds and Channel Preparation and Clearing

It was found that majority 168(43.8%) and 167(43.5%) of the respondents were never adopters and rarely adopters of beds and channel preparation and clearing technology packages for irrigated wheat production in the area. While, 23(6%) and 26(3.8%) of the respondents were sometimes adopters and always adopters of beds and channel preparation and clearing technology packages for irrigated wheat production in the area. The mean score of adoption was found only 0.25 which indicates non-adopter level of adoption of beds and channel preparation and clearing technology packages for irrigated wheat production in the area. Key informants revealed that timely preparation and clearing for irrigation is very essential for watering and for wheat sowing but farmers in the area didn’t prepare channel timely and properly. This leads to unnecessary waste of irrigation water and used for what is required in the area.
Figure 3. Beds and Channel preparation and clearing. Source: Field survey, 2023
Preprints 143177 g003

3.2.3. Use of High Yielding Varieties of Wheat Seeds

The result of the study showed that different farmers have their own different level of adoption on wheat yield varieties production in the study area. The study result indicated that majority 187(48.7%) of the respondents was never used high yielding varieties of wheat seed for irrigated wheat production. Also, 101(26.3%) was rarely used high yielding varieties of wheat seed for irrigated wheat production in the study area (Figure 4). The mean score of adoption was found only 0.28 which indicates low level of adoption high yielding varieties of wheat seed for irrigated wheat production in North Shawa Zone.

3.2.4. Right Time of Sowing

It is evident from Figure 5 that most of the farmers were sowing wheat crops during 1st week of December to the 3rd week of January. This exposes farmers to crop failure when the spring rains enter early as they do not wait for the sowing season. The data result depicted that 39.6% of the farmers sowing irrigated wheat crop not recommended right time of sowing. Following to this, 30.7% and 30.7% was rarely and sometimes sowing irrigated wheat during the time of recommended seed sowing in the area. Mean score of adoption was found 0.32 which shows low level of adoption of right time of sowing irrigated wheat in the study area

3.2.5. Use of Row Planting Technology

The result Figure 6 below revealed that, 49% of the respondents were never adopted and used irrigated wheat technology for irrigation. Similarly, 34.1% of the respondents were rarely used irrigated technology for irrigated wheat production. The mean score of adoption was 0.24 which indicates non-adopter of adoption of row planting technology in the study area. The results of key informant interview indicate that, currently wheat row planting was practiced manually and the application method is more labor intensive. As a result, at planting time three man-powers was required, which means the first person is making a row, the second putting seed in the row, and the third one is applying fertilizers. It was a labor-intensive practice because of this; those households with more active labor force relatively are more adopters of the technology.

3.2.6. Right Time of Watering

Providing adequate water to meet the water needs of the wheat crop allows you to maximize their yield, quality and helps maintain adequate soil moisture to start the second crop. It is revealed from Figure 7 below, 61.2% of the respondents were never used right time of watering in irrigated wheat production followed by 25% rarely used right time of watering for irrigated wheat production. As a result adoption level of right time of sowing was found to be non-adopter in the study areas with an adoption score of only 0.19 (Figure 7).

3.2.7. Organic Manure and Fertilizer Application

It is evident from Figure 8 below, 187 (48.7%), and 145(37.8%) of smallholder farmers were never, and rarely used respectively. While, 42(10.9%), and 10(2.6%) of farmers in the study area were sometimes, and always used organic manure and fertilizer application as recommended rate respectively. This finding indicates that, almost half (48.7%) of irrigated wheat producers was never used the recommended organic manure and fertilizer application for irrigated wheat production in the study area. The mean score of adoption was 0.22 which shows non-adopter level of adoption of recommended organic manure and fertilizer application for irrigated wheat production in North Shawa Zone.

3.2.8. Seed Treatment

It is revealed from the Figure 9 that 345(89.8%) of the respondents were never treat seed before sowing for irrigated wheat production in the area. This result depicted that, almost all of the irrigated wheat producers was never adopted seed treatment for their production. The mean score of adoption was 0.05 which shows non-adopter level of adoption of seed treatment for irrigated wheat production in the area. Abate (2018) indicate that the wheat initiative was successful in making certified seed and fertilizer accessible to farmers and increasing their uptake.

3.2.9. Soil Treatment

Figure 10. Soil treatment. Source: Field survey, 2023.
Preprints 143177 g010
The result of the study depicted that, 181(47.1%) of the respondents were never used soil treatment during irrigated wheat in the study area. Following to this, 60(15.6%), 104(27.1%), and 39(10.2%) of the respondents were rarely used, sometimes used and always used soil treatment by using different locally available materials respectively. The mean score of adoption was 0.33 which shows low-adopter level of adoption of soil treatment for irrigated wheat production in the area.

3.2.10. Weed Management

It is evident from the below Figure 11, 210 (54.7%) of irrigated wheat growers were never adopted weed management for yield increment in the study area. This finding indicates that more than half of farmers in the area didn’t adopt weed management during irrigated wheat production. The mean score of adoption was 0.34 which shows low-adopter level of adoption of weed management for irrigated wheat production in the area. Key informants clearly indicated that many herbicide groups were used and this indicates that farmers are applying herbicides that are provided in the market without knowing real source of herbicides. This makes yield loss of wheat in the area. Awareness creation is essential for the farmers to use the right types of herbicides to control the major yield dipping factors which weed.

3.2.11. Right Time of Harvesting and Storage

As indicated in the below figure, 53.1% of the respondents were never used right time of harvesting and storage of wheat in the study area. In the study areas almost more than half of the respondents replied they never used right time of harvesting and storage. This makes high loss of production and productivity due to harvesting and storage related problems in the area. The mean score of adoption was 0.25 which shows non-adopter level of adoption of right time of harvesting and storage for irrigated wheat production in the area.
Figure 11. Right time of harvesting and storage. Source: Field survey, 2023.
Preprints 143177 g012
The classification was based on the actual score of the respondents obtained for the value of the whole irrigated wheat production technology indicators which is 11 items. Therefore, the mean score of the indicators (wheat irrigation practices) show that 0.26 which are classified under low level of adoption category.
Therefore, the main finding is that the level of adoption of irrigated wheat production technology is low in the study area as the majority is fall in the low actual adoption index category which is 0.26 mean score. This revealed that the extent (level) of irrigated wheat production technology in the study area is low which needs the capacity development of the irrigated wheat growers so as to bring them to high adoption level in irrigated wheat production technology.
Table 2. Level of Adoption score of irrigated wheat production technology practices.
Irrigated wheat production technology practices N Mean Std. Deviation
Field preparation: Prepare the land to fine beds and channels 384 .29 .323
beds and channels 384 .25 .280
Use of high yielding varieties of wheat seeds 384 .28 .326
Right time of sowing 384 .32 .311
Use of row planting technology 384 .24 .292
Right time of watering 384 .19 .273
Organic manure and fertilizer application 384 .22 .256
Seed treatment 384 .19 .272
Soil treatment 384 .33 .356
Weed management 384 .34 .4183
Right time of Harvesting and Storage 384 .25 .311
AD.LEVEL 384 .2634 .15121
Source: Field survey, 2023.

4. Conclusion and Recommendation

To conclude the findings of the study, majority of farmers in the area was non-adopters of irrigated wheat production. Majority of respondents in the area was strongly disagree on irrigated wheat production was most effective than rainfed. Also, they were strongly disagreed on access to extension service given by DA, access to credit service, access to necessary input, positive perception of irrigated wheat production, access technical training on irrigated wheat, and access to irrigation facilities. Contrary, Majority of the respondents were strongly agrees on the government initiative motivate farmers on irrigated wheat production, and on the capacity of irrigated wheat yields is better than rainfed wheat production in the areas. The main finding is that the level of adoption of irrigated wheat production technology is low in the study area as the majority is fall in the low actual adoption index category. This revealed that the extent (level) of irrigated wheat production technology in the study area is low. Therefore, timely provisions of inputs with adequate quality and quantity and at affordable prices such as improved seeds and fertilizer should be addressed adequately. The confidence of smallholder farmers in the area also needs to be increased. On the other hand, it is better to increase the current awareness of farmers and should be continued for improving productivity of irrigated wheat production in a sustainable manner. To ensure level of adoption and improve uptake of irrigated wheat production practice, it necessary be supported with small holder farmer friendly, efficient and cost effective and new technology. Also, strengthening market linkage; policymakers, researchers and seed enterprise for better orienting investments on irrigated wheat production.

References

  1. Abate, D., 2018. Review on market chain analysis of wheat in Ethiopia. The International Journal of Business Management and Technology, 2(6), pp.94-105.
  2. Abera, W., Tamene, L., Tesfaye, K., Jiménez, D., Dorado, H., Erkossa, T., ... & Ramirez-Villegas, J. (2022). A data-mining approach for developing site-specific fertilizer response functions across the wheat-growing environments in Ethiopia. Experimental Agriculture, 58, e9. [CrossRef]
  3. Ajayi, V. O. (2023). A Review on Primary Sources of Data and Secondary Sources of Data.
  4. Alemu, T. (2024). Wheat Production and Consumption Trends and Prospects in Ethiopia. Ethiopian Journal of Agricultural Sciences, 34(1), 1-15.
  5. Alemu, Y., & Tolossa, D. (2022). Livelihood impacts of large-scale agricultural investments using empirical evidence from shashamane rural district of oromia region, Ethiopia. Sustainability, 14(15), 9082. [CrossRef]
  6. Asrat, D., Anteneh, A., Adem, M., & Berhanie, Z. (2022). Impact of Awash irrigation on the welfare of smallholder farmers in Eastern Ethiopia. Cogent Economics & Finance, 10(1), 2024722. [CrossRef]
  7. Atinafu, A., Lejebo, M., & Alemu, A. (2022). Adoption of improved wheat production technology in Gorche district, Ethiopia. Agriculture & Food Security, 11(1), 3. [CrossRef]
  8. Barrett, C. B., Reardon, T., Swinnen, J., & Zilberman, D. (2022). Agri-food value chain revolutions in low-and middle-income countries. Journal of Economic Literature, 60(4), 1316-1377. [CrossRef]
  9. Bekele Gemechu, B. G., Amha Besufekad, A. B., & Abate Mekuriaw, A. M. (2019). Performance evaluation of improved bread wheat (Triticum aestivum L.) varieties and production technologies in Central High Lands of Ethiopia.
  10. Belay, F. Baye D., & Bezabeh, E. (2019). Impact of improved wheat technology package Adoption on productivity in Ethiopia. Greener Journal of Agricultural Sciences, 9(1), 76-85.
  11. Bentley, J. Donovan, K. Sonder, F. Baudron, J.M. Lewis, et al., Near-to long-term measures to stabilize global wheat supplies and food security, Nature Food 3 (7) (2022) 483–486. [CrossRef]
  12. Cochran, W. G. (1977). Sampling techniques (3rd ed.). New York: Wiley.
  13. CSA (Central Statistical Agency). (2021). The Federal Democratic Republic of Ethiopia Central Statistical Agency Agricultural Sample Survey 2020/21 (2013 E.C.).
  14. CSA, Agricultural sample survey 2020/21(2013 E.C.) (september – December, 2020). Report on farm management practices (private peasant holdings, meher season), THE Federal Democratic Republic of Ethiopia Central Statistical Agency: Addis Ababa (2020) 534.
  15. Damianus, A., Ranay, F., Magallanes, T., & Encarnacion, M. (2022). The effect of corporate governance on the individual work performance of employees. International Journal of Research in Business and Social Science (2147-4478), 11, 82-98. [CrossRef]
  16. Dessie, A. B., Abate, T. M., & Mekie, T. M. (2018). Factors affecting market outlet choice of wheat producers in North Gondar Zone, Ethiopia. Agriculture & Food Security, 7, 1-8. [CrossRef]
  17. Devlet, A. (2021). Modern agriculture and challenges. Frontiers in Life Sciences and Related Technologies, 2(1), 21-29. [CrossRef]
  18. Effa, K., Fana, D. M., Nigussie, M., Geleti, D., Abebe, N., Dechassa, N., ... & Berisso, F. E. (2023). The irrigated wheat initiative of Ethiopia: a new paradigm emulating Asia’s green revolution in Africa. Environment, Development and sustainability, 1-26. [CrossRef]
  19. Endalew B, Anteneh A, Tasie K. (2022). Technical Efficiency of Teff Production Among Smallholder Farmers: Beta Regression Approach. Eur J Dev Res., 34(2):1076-1096. [CrossRef]
  20. Endalew, B., Aynalem, M., Assefa, F., & Ayalew, Z. (2020). Determinants of wheat commercialization among smallholder farmers in Debre Elias Woreda, Ethiopia. Advances in Agriculture, 2020(1), 2195823. [CrossRef]
  21. Erenstein, O., Jaleta, M., Mottaleb, K. A., Sonder, K., Donovan, J., & Braun, H. J. (2022). Global trends in wheat production, consumption and trade. In Wheat improvement: food security in a changing climate (pp. 47-66). Cham: Springer International Publishing.
  22. FAO. 2017. FAOSTAT FAO, Rome, available at: http://faostat.fao.org (accessed August 2021).
  23. Faostat, (2020). Database of Agricultural Production, Food and Agriculture Organization of the United Nations, Rome, 2020. Available from: http://faostat.fao.org/ default.aspx.
  24. FAOSTAT. (2022). Food Outlook – Biannual Report on Global Food Markets. Food Outlook, November 2022. Rome. [CrossRef]
  25. Fischer, T., Ammar, K., Monasterio, I. O., Monjardino, M., Singh, R., & Verhulst, N. (2022). Sixty years of irrigated wheat yield increase in the Yaqui Valley of Mexico: Past drivers, prospects and sustainability. Field Crops Research, 283, 108528. [CrossRef]
  26. GAIN. (2021). Ethiopia grain and food manual report. Ethiopia Grain Trade Enterprise.
  27. Galvao, A. R., Mascarenhas, C., Marques, C. S., Braga, V., & Ferreira, M. (2020). Mentoring entrepreneurship in a rural territory–A qualitative exploration of an entrepreneurship program for rural areas. Journal of Rural Studies, 78, 314-324. [CrossRef]
  28. Game, A. T., & Korecha, D. (2015). Recent changes in rainfall, temperature and number of rainy days over Northern Oromia Zone, Ethiopia. Science Discovery, 3(6), 62-70. [CrossRef]
  29. Gebreegziabher, W., Dilnesaw, Z., Hailu, T., Tadesse, M., & Berhe, M. (2018). Adaptation and Promotion of Irrigated Wheat Genotypes at Tendahoo Sugar Factory, Afar Regional State of Ethiopia. Int. J. Adv. Res. Biol. Sci, 5(10), 70-83.
  30. Gebremariam, T. K., & Ying, S. (2022). The foreign direct investment-Export performance nexus: An ARDL based empirical evidence from Ethiopia. Cogent Economics & Finance, 10(1), 2009089. [CrossRef]
  31. Geleta, T., Debele, T., Gemechu, B., Kaske, K., Kifle, T., & Homma, S. (2024). National Wheat Seed Roadmap for Ethiopia. Ethiopian Institute of Agricultural Research, Addis Ababa, Ethiopia. https://www.researchgate.net/publication/383908118.
  32. Hassen, J. M., & Borana, F. R. (2024). Determining Irrigation Frequency and Water Amount for Irrigated Wheat Production in Amibara, Afar Region, Ethiopia. [CrossRef]
  33. Hodson, M. Jaleta, K. Tesfaye, C. Yirga, H. Beyene, et al., Ethiopia’s transforming wheat landscape: tracking variety use through DNA fingerprinting, Sci. Rep. 10 (1) (2020) 1–13. [CrossRef]
  34. Isinika, A., Mlay, G., Mdoe, N., Boniface, G., & Saha, A. (2022). Is Agricultural commercialisation sufficient for poverty reduction? Lessons from rice commercialisation in Kilombero, Tanzania.
  35. Jambo, Y., Alemu, A., & Tasew, W. (2021). Impact of small-scale irrigation on household food security: evidence from Ethiopia. Agriculture & Food Security, 10, 1-16. [CrossRef]
  36. Kifle T, Ayal DY, Mulugeta M. (2022). Factors influencing farmers adoption of climate smart agriculture to respond climate variability in Siyadebrina Wayu District, Central highland of Ethiopia. Climate Services, 26:100290. [CrossRef]
  37. Krupnik TJ, Schulthess U, Ahmed ZU, McDonald AJ. (2017). Sustainable crop intensification through surface water irrigation in Bangladesh? A geospatial assessment of landscape-scale production potential. Land use policy, 60(2017):206–222. [CrossRef]
  38. Mengistu DD, Degaga DT, Tsehay AS. (2021). Analyzing the contribution of crop diversification in improving household food security among wheat dominated rural households in Sinana District, Bale Zone, Ethiopia. Agriculture & Food Security, 10(1):7. [CrossRef]
  39. Milkias, D. and Muleta, G., (2021). International Journal of Agriculture and Biosciences. Int J Agri Biosci, 10(2), pp.94-100.
  40. Minot, N., Warner, J., Lemma, S., Kasa, L., Gashaw, A., & Rashid, S. (2019). The wheat supply chain in Ethiopia: Patterns, trends, and policy options. Gates Open Res, 3(174), 174. [CrossRef]
  41. Nakawuka P, Langan S, Schmitter P, Barron J. (2018). A review of trends, constraints and opportunities of smallholder irrigation in East Africa. Global Food Security, 17(11):196 212.
  42. Nardi, P.M., 2018. Doing survey research: A guide to quantitative methods. Routledge.
  43. Noort MWJ, Renzetti S, Linderhof V, du Rand GE, Marx-Pienaar NJMM, de Kock HL, Magano N, Taylor JRN. (2022). Towards Sustainable Shifts to Healthy Diets and Food Security in Sub-Saharan Africa with Climate-Resilient Crops in Bread-Type Products: A Food System Analysis. Foods, 11(2):135. [CrossRef]
  44. NSHZAO (North Shawa Zone Agricultural office), (2022). Socio-economic data of North Shawa Zone, Fiche Salale. Unpublished data.
  45. NSHZFEDO (North Shawa Zone Finance and Economic Development Office), (2022). Socio-economic profile of North Shawa Zone, Fiche Salale. Unpublished material.
  46. Ozkan B, Dube AK, Reed MR. (2022). Role of Agricultural Extension in Building Climate Resilience of Food Security in Ethiopia. In: Food Security & Climate-Smart Food System, Cham: Springer International Publishing: 219-239.
  47. Regasa MS, Nones M, Adeba D. (2021). A Review on Land Use and Land Cover Change in Ethiopian Basins. Land, 10(6):585. [CrossRef]
  48. Senbeta, A. F., & Worku, W. (2023). Ethiopia’s wheat production pathways to self-sufficiency through land area expansion, irrigation advance, and yield gap closure. Heliyon.
  49. Shikur, Z. H. (2020). Agricultural policies, agricultural production and rural households’ welfare in Ethiopia. Journal of Economic Structures, 9(1), 50. [CrossRef]
  50. Shumeta, Z. (2024). National Wheat Seed Roadmap For Ethiopia.
  51. Tadesse, W., Bishaw, Z., & Assefa, S. (2018). Wheat production and breeding in Sub-Saharan Africa: Challenges and opportunities in the face of climate change. International Journal of Climate Change Strategies and Management, 11(5), 696-715.
  52. Tiruye, A. E., Asres Belay, S., Schmitter, P., Tegegne, D., Zimale, F. A., & Tilahun, S. A. (2022). Yield, water productivity and nutrient balances under different water management technologies of irrigated wheat in Ethiopia. PLoS Water, 1(12), e0000060. [CrossRef]
  53. USDA, (2022). Ethiopia Wheat Area, Yield and Production, Foreign Agriculture Service, United States Department of Agriculture, 2022.
  54. Viana, C. M., Freire, D., Abrantes, P., Rocha, J., & Pereira, P. (2022). Agricultural land systems importance for supporting food security and sustainable development goals: A systematic review. Science of the total environment, 806, 150718. [CrossRef]
  55. Vichea, S. (2005). Key factors affecting the performance of foreign direct investment in Cambodia (Doctoral dissertation, Doctoral dissertation, a thesis submitted in partial fulfillment of Masters of Business Administrations, university of the Tai chamber of commerce).
  56. Wondim, G.B., Kedir, A. and Musema, R., (2020). Adoption of irrigated wheat varieties among agro-pastoralists; the case of Fentale District, Upper Awash Valley of Northeastern Ethiopia. African Journal of Agriculture and Food Security ISSN, 8(12), pp.001-010.
  57. Wordofa MG, Hassen JY, Endris GS, Aweke CS, Moges DK, Rorisa DT. (2021). Adoption of improved agricultural technology and its impact on household income: a propensity score matching estimation in eastern Ethiopia. Agriculture & Food Security, 10(1):5. [CrossRef]
  58. Zegeye MB, Fikrie AH, Asefa AB. (2022). Impact of agricultural technology adoption on wheat productivity: Evidence from North Shewa Zone, Amhara Region, Ethiopia. Cogent Economics & Finance, 10(1). 2101223. [CrossRef]
Figure 2. Field preparation. Source: Field survey, 2023.
Preprints 143177 g002
Figure 4. Use of high yielding varieties of wheat seeds. Source: Field survey, 2023.
Preprints 143177 g004
Figure 5. Right time of sowing. Source: Field survey, 2023.
Preprints 143177 g005
Figure 6. Use of Row planting technology. Source: Field survey, 2023
Preprints 143177 g006
Figure 7. Right time of watering. Source: Field survey, 2023
Preprints 143177 g007
Figure 8. Organic manure and fertilizer application. Source: Field survey, 2023
Preprints 143177 g008
Figure 9. Seed treatment. Source: Field survey, 2023.
Preprints 143177 g009
Figure 11. Soil treatment. Source: Field survey, 2023.
Preprints 143177 g011
Disclaimer/Publisher’s Note: The statements, opinions and data contained in all publications are solely those of the individual author(s) and contributor(s) and not of MDPI and/or the editor(s). MDPI and/or the editor(s) disclaim responsibility for any injury to people or property resulting from any ideas, methods, instructions or products referred to in the content.
Copyright: This open access article is published under a Creative Commons CC BY 4.0 license, which permit the free download, distribution, and reuse, provided that the author and preprint are cited in any reuse.
Prerpints.org logo

Preprints.org is a free preprint server supported by MDPI in Basel, Switzerland.

Subscribe

Disclaimer

Terms of Use

Privacy Policy

Privacy Settings

© 2025 MDPI (Basel, Switzerland) unless otherwise stated