
Submitted:
17 December 2024
Posted:
18 December 2024
You are already at the latest version
Abstract
Experimental laboratory equipment for friction stir welding (FSW) after working out the optimal welding modes at different linear speeds allows to obtain high-quality butt joints from thin ductile metals. With the development of new mathematical tools for modeling of thermo-deformation processes, it became possible to analyze the stress-deformation state and thermomechanical processes occurring in the joint zone of FSW, and this is necessary to predict the operational properties, strength and service life of welded structures. Using mathematical models and fi-nite-element analysis, the temperature distributions from the volume source of heating during FSW were visualized, and the residual deformations and stresses in the zone of butt-welded joints of thin sheets of magnesium alloys were numerically determined. Modeling of the kinetics of changes in temperature fields during the FSW process showed that the width of the HAZ decreases with an increase in the linear speed. It was established that with an increase in the linear speed of welding, the maximum residual stresses increase by 10...15%. Residual plastic deformations de-crease with an increase in the linear speed of welding. In the future, it is advisable to determine the effective balance of linear speed and rotation speed of the FSW tool to obtain greater uniformity of the weld structure and reduce heat transfer to the metal during welding.
Keywords:
friction stir welding
; magnesium alloys
; microstructural simulation
; residual stresses
; intense plastic deformation
; non-stationary thermal conductivity model
1. Introduction
The development of effective technical and technological solutions related to increasing the productivity, controllability, and economy of constructions of the near future inspire engineers to use magnesium alloys [1,2]. Regarding the welding of magnesium alloys, we have an experience of using an ecological and energy-saving technology – friction stir welding (FSW), which is used to connect parts with a relatively simple geometry in the solid phase (Figure 1).
The experience [3,4] of using a FSW tool in the form of a smooth pin with a concave shoulder is statistically successful, because it avoids deformation when joining light and ductile alloys, welds are formed without voids and contain locally strengthened zones along the lower contour of the weld core.
The idea of the following experiments was the mathematical modeling of thermal and deformation processes during the FSW using fundamental regularities [5,6]. Such a comprehensive approach to assessing the quality of the formation of a welded joint is being developed for further use in statistical scaled models to predict the operational properties, strength and service life of welded structures made of thin magnesium alloys.
The purpose of this study is to obtain high-quality FSW butt joints of magnesium alloy at a constant tool rotational speed and at different linear welding speeds, to determine by indentation the mechanical parameters of the material in the FSW zone, to experimentally measure surface temperature fields during FSW and to determine temperature fields, distributions of deformations and residual stresses in FSW butt joints by methods of mathematical modeling.
2. Materials and Methods
2.1. Experimental
Butt joints of thin sheets made from magnesium alloy MA2-1 of the Mg-Al-Zn system (Mg – 92-95 %, Al – 3.8-5.0%, Zn – 0.8-1.5%, Mn – 0.3-0.7% with impurities Fe, Si, Ni, Cu, Be less than 0.1%) with a thickness of 2 mm were welded using experimental laboratory equipment designed for friction stir welding (FSW) (see Figure 2a). The welding process was conducted at a varying linear speeds from 8 m/h to 24 m/h and constant tool rotational speed of 1420 rpm.
A comparative assessment of temperature fields (°C) during the FSW experimentally was done with infrared temperature imager Fluke Ti25 (FLUKE, USA) (Figure 2b), and also the kinetics of temperature field changes during the FSW were simulated in ABAQUS Nonlinear FEA Software.
Welded joints were sliced into thin sections and subjected to treatment with a solution composed of 5% hydrochloric acid and 5% orthophosphoric acid. This procedure aimed to investigate the characteristics of the macro- and microstructure through preparation thin slices of welded joints were fabricated and subsequently treated with a aqueous solution consisting of 5% hydrochloric acid combined with 5% orthophosphoric acid. This process aimed to investigate the characteristics of both macro- and microstructure utilizing optical microscopy, as well as assessing the physical and mechanical properties through indentation testing. Indentation, which involved automatic measurement of micro hardness (μH) and modulus of elasticity (E), was conducted using two precision instruments in accordance with the standard indentation procedures described in ISO/FDIS 14577-1:2015; Metallic materials – Indentation test for hardness and material parameters [7,8]. The automated hardness tester “Micron-Gamma” has a three-sided Berkovich indenter with a range of loads on the indenter of 0.1-500 g.
Automated hardness tester Wilson® VH 3300 (Buehler) is equipped with a Vickers indenter with a range of loads on the indenter of 10…50 kgF. The innovative step-by-step digital zoom function provides the widest magnification range ever used in a hardness tester optical system. The use of a high-precision motorized stage allows for automated test series. All system components, as well as specialized software, are fully integrated. Experimental determination of Young’s modulus was carried out to clarify the data used for welding simulation.
Macrostructure examinations were performed using optical binoculars with a magnification range of x40 to x500. For microstructure analysis and indentation observations a microscope along with a DCM500 digital video camera, offering a 5 MP resolution, were utilized. The dispersion of the microstructure was investigated through scanning electron microscopy (SEM) employing a JSM-840 (JEOL, Japan) in secondary electron imaging (SEI) mode, with an accelerating voltage of 20 kV and a probe current set at 10^(-7) A. This electron microscope features an integrated energy-dispersive microanalysis system known as INCA PentaFet x3 developed by “Oxford Instruments” as well as a digital imaging system called Scan Micro Capture 2.1.
2.1. Modeling
Mathematical modeling of the FSW process was carried out on magnesium alloy plates with a thickness of 2 mm at a constant tool rotational speed of 1420 rpm and for different linear weld-ing speeds of 8 m/h, 16 m/h, 24 m/h using a specialized finite element analysis program of our own development.
In the methodology [6] of the numerical analysis of thermodeformation processes at the FSW, the equation of nonstationary thermal conductivity (equ.1) is used to determine the kinetics of temperature distributions, which considers the power of volumetric heat release W (x, y, z, t), ρ – material density, с – specific heat capacity, λ – thermal conductivity coefficient, T – temperature of the material (Table 2).
Boundary conditions on the surfaces of the joint considering convection heat exchange with the environment:
where Tout – ambient temperature, q – heat flow, h – heat transfer coefficient from the surface (h = 10 W/m2 °C).
The power of heat release during FSW:
at z = 0, R1<r <R2 (on the upper surface in the shoulder area of the tool), at 0<z <δ , r = R1 (by thickness in the tool pin area), where μ – coefficient of friction, Pn – normal force at the point of contact, ω – angular rotational speed of the tool, r– the distance of the contact point from the axis of rotation of the working tool (х0, у0), R1 – pin radius, R2 – shoulder radius, δ – the thick-ness of the plates to be welded.
In the elastoplastic formulation, the strain tensor:
where – elastic deformations tensor, – plastic deformations tensor.
Stress tensors are crucial in understanding how materials respond to external forces. These tensors are composed of various components that describe the internal distribution of stress within a material. Each component captures the intensity of internal forces acting across a particular plane, providing insights into how the material will behave under different loading conditions. The diagonal elements typically represent normal stress values, while the off-diagonal components account for shear stress. The complete description of a stress state within a three-dimensional object is encapsulated in a 3x3 matrix. This matrix not only aids in predicting potential points of failure but also plays a vital role in material design and analysis. By accurately analyzing the components of stress tensors, engineers can better understand the mechanical response of materials, ensuring safety and reliability in various applications ranging from civil engineering to aerospace technologies. Ultimately, the study of these stress tensor components is fundamental for advancing material science and improving structural integrity. Elements of stress tensors and elastic deformations are related to each other by Hooke’s law:
where – unit tensor,, – shear modulus, – volumetric compressibility, E – Young’s modulus, ν – Poisson’s ratio, – function of free relative elongations (volumetric changes) caused by temperature change:
where – coefficient of relative temperature elongation of the material.
Plastic deformations are related to the stress state by the equation of the theory of plastic non-isothermal flow associated with the Mises flow condition. Iterative processes are used to solve a problem with physical non-linearity associated with the development of plastic deformations.
The developed mathematical model allows to determine the residual welding stresses and de-formations in the zone of the butt-welded FSW joint as a result of uneven temperature heating due to the mechanical friction of the tool against the material of the plates during the welding process. The mathematical model can be effective for predicting the general deformations of large structures with a large number of welded joints. To simplify the model the frictional coefficient’s reliance on the temperature of the material, heating and heat transfer to the working tool and fastening equipment were not taken into account
3. Results and discussion
In the optical evaluation of the macrostructure of six samples produced at various linear welding speeds (see Figure 3), it was observed that all exhibited a characteristic asymmetrical weld profile typical of Friction Stir Welding, featuring advancing (AS) and retreating (RS) sides. Each sample displayed a area marked by significant plastic deformation, free from any cavities. The width of the welds measures approximately 10-15 mm.
Thermodynamic processes during welding on the retreating side (RS) form a clear boundary between the thermo-mechanical affected zone (TMAZ) that contains the core of the weld (Figure 4a) and the base metal. The primary magnesium alloy within the Mg-Al-Zn system exhibits a rolled structure characterized by elongated grains (refer to Figure 4b). Within the thermo-mechanically affected zone (TMAZ) on the advancing side (AS), there are horizontal diffusion bands resulting from the initial rotational movement of the friction stir welding (FSW) tool, displaying a microstructure akin to that of the base metal (see Figure 4c). The increase in the plasticity of the weld material, attributed to heating during the twisting deformation process, causes both the stretching and compression of the grain boundaries. This phenomenon subsequently prompts localized extrusion and recrystallization, ultimately leading to the formation of finely grounded grains ranging from 1 to 10 μm in size (Figure 4b and Figure 5).
It is well known that in the temperature range of 550...640 °C in the chemical system Mg-Al-Zn, in which processes of intensive plastic deformation have occurred, the formation of phases enriched with magnesium and aluminum is possible. Significant mobility of atoms at such a temperature allows growth of grains with sizes from 50 nm to 500 nm due to the simultaneous action of diffusion and recrystallization processes.
These recrystallization processes during the mixing of zones with high and low temperature occurs with an in-crease in dislocations density at grain and subgrain boundaries. Lomer-Cottrell junction are created, effectively hindering the movement of dislocations. This occurs due to the development of barriers as a result of their intersecting, which subsequently reduces the formation of new dislocations. Therefore, the more challenging it becomes for dislocations to migrate within the material, the higher the level of strain hardening that occurs. Usually, the formation of a quality highly crushed structure during FSW occurs with the participation of several mechanisms at the same time, and the result depends on the welding conditions, the chemical composition of the material and other factors.
The modulus of elasticity (E) was assessed for five distinct varieties of FSW weld textures, namely the base metal, TMAZ, top, bottom, and core center (Figure 6). In the central part of the core E=30 GPa, the zone contains an ellipsoidal structure and textures drawn from pressing and rotating the tool at the top and bottom sections of the joint. For the top part of the weld E=36 GPa. At the bottom of the core at a distance of 50-150 μm along the lower edge of the sample, the highest value of E=90 GPa was determined. That is, an increase in elasticity by 2–3 times compared to the base metal E= 35 GPa. For the TMAZ zone, the modulus of elasticity E=30 GPa. A comparison of the shape and depth of the indentation diagrams shows a more plastic state of the base metal (Figure 7a), and in the central area beneath the center of transverse section there is an increased elastic response of the material surface (Figure 7b). The penetration depth of the indenter into the base material measures 7.57 μm, with a depth of 5.44 μm observed in the core area situated below the midpoint of the cross-section. This pronounced variation in the textures of the zones within the FSW joints leads to a considerable elastic-deformed state in the thin metal. As a result, the traditional fracture statistics are influenced by the TMAZ zone during tensile strength testing. Consequently, it is generally advisable to conduct an additional heat treatment, which can normalize the material’s condition by approximately 10%. [9].
The hardness distribution study, carried out in the direction transverse to the end face of the plate (Figure 8a), was carried out from the right and left sections of the hole that is raised after the pin tool is immersed (black section in the middle of the sample). The photo clearly shows the ridges formed by the pressure of the shoulder (Figure 8b) of the pin tool.
The study was conducted on both sides of the sample in order to determine the characteristics of the hardness distribution at the entry of the pin tool (AS) into the metal, and at the exit (RS) from it. The distribution of micro hardness analysis points on the left side is shown in Figure 8b.
Comparison of the distribution map of micro hardness НV0.2 with the microstructure of the HAZ sample in the welding zone shows a non-uniform distribution of micro hardness over the surface. The hardness changes almost twice – from 57.8 НV0.2 to 84.9 НV0.2. It was found that the areas with the lowest hardness from 57 to 64 НV0.2 correspond to the areas where “vortices” of plasticized metal are formed, that is, when the metal behaves like a hyperelastic-plastic material (Mooney-Rivlin model). The highest hardness level of 80…85 НV0.2 is observed in the TMAZ zone.
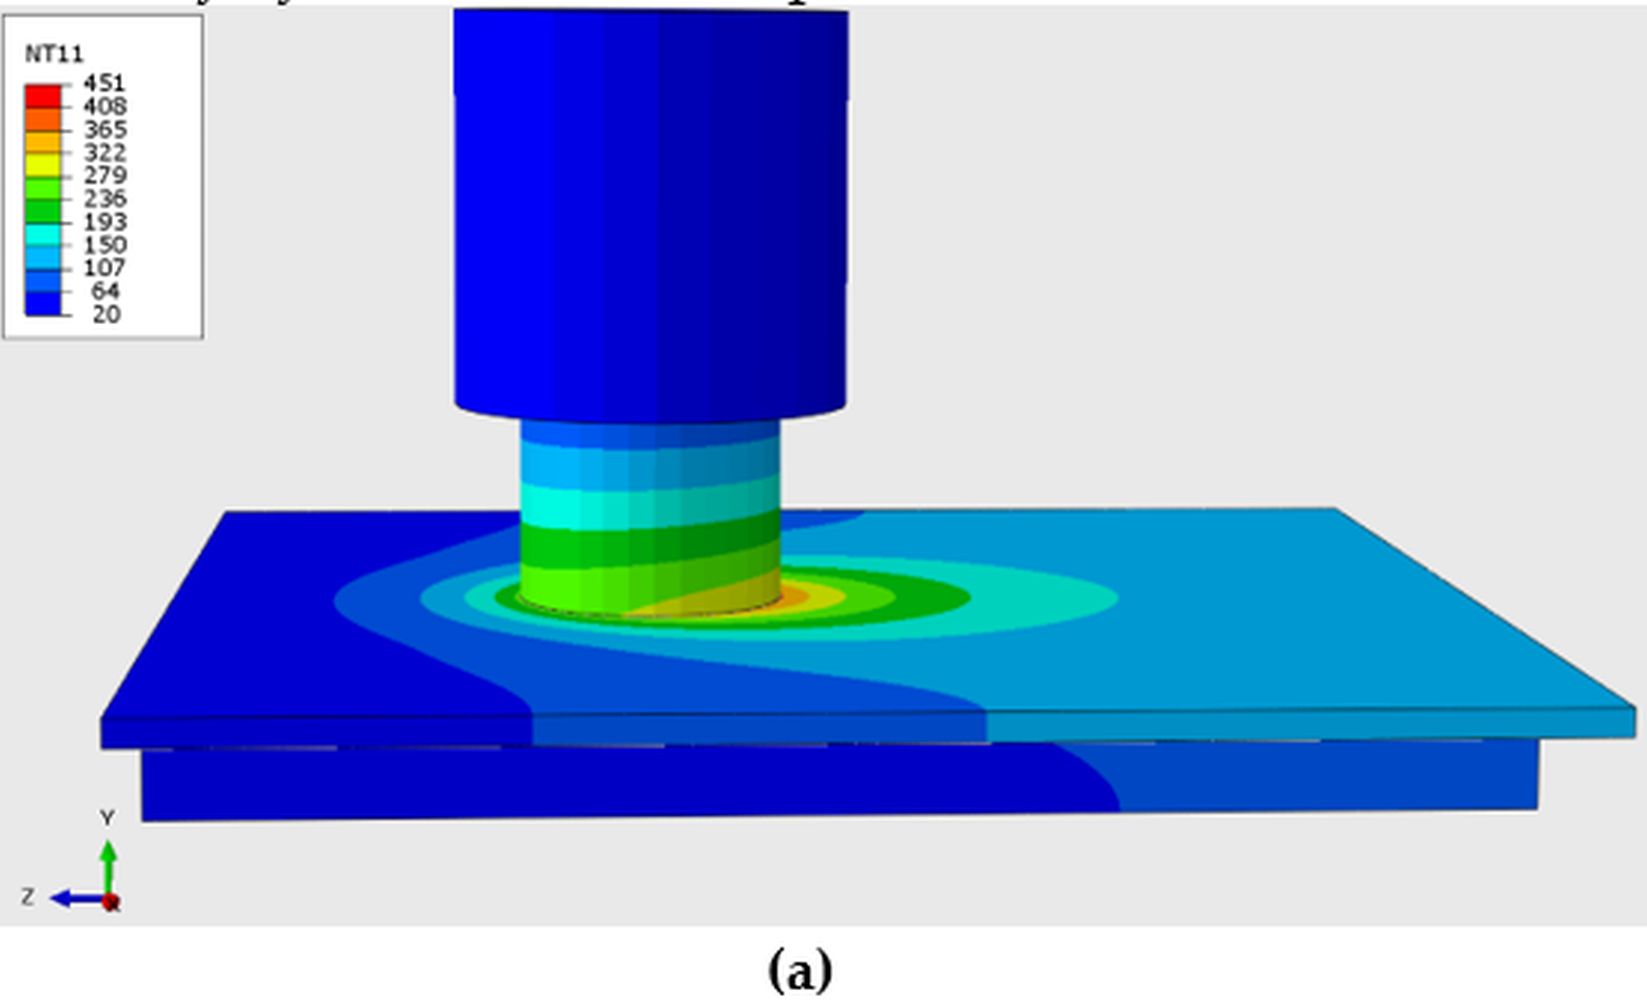
Based on the infrared image obtained from the welding process using the thermal imager (Figure 2), it has been roughly assessed that the temperature of the external surface of the magnesium alloy and the tool during the welding operation does not exceed 355.8°C. The model of the temperature fields with the specified welding parameters (Figure 9) shows a similar temperature at a small distance from the point of contact of the cylindrical FSW tool with the metal. Following the operation of the FSW, the temperature registers at 410°C. Within the weld core region, where a consolidated microstructure emerges and elasticity is enhanced by a factor of 2-3, the temperature reaches 500°C.
Thermal cycles during FSW and the distribution of maximum temperatures along the volume of the plates depending on the welding speed were plotted by the results of the finite element analysis. The maximum temperature of the thermal cycle (Figure 10a) is approximately 600°C, and when the linear welding speed is increased above 16 m/h, it changes to 450°C. That is, the maximum temperature in the contact zone of the tool with the material of the plates is mainly deter-mined by the rotational speed and by the pressing force of the tool against the plates. The width of the temperature fields in the joint zone (Figure 10b) is 8 mm, 6 mm, and 4 mm, with increasing linear speeds step by step from 8 m/h to 24 m/h respectively.
The width of the weld of experimentally obtained samples of FSW joints at a linear welding speed of 8 m/h is approximately 10 mm (Figure 11) is represented in the calculation data by a similar.
Calculations of the maximum residual tensile stresses showed that they reach the yield point of the material of 140 MPa. The level of the maximum calculated residual plastic shrinkage deformations is relatively low, up to - 0.35% (Figure 12b). When the linear speed of welding is increased, the maximum residual tensile stresses increase by 10…15%, which is associated with an increase in the temperature gradient during welding. It was also established that residual plastic deformations (longitudinal) have a slight decrease in level with an increase in the linear speed of welding.
The calculations showed that despite the rather significant deviations of the maximum temperatures (24% and 47%, respectively) for different options for taking into account heat dissipation in the tool and the backing plate, the distributions of residual stresses change to a lesser extent. Thus, for the maximum value of tensile stresses, the longitudinal residual stresses when taking into account heat dissipation increase by 5% and 7%, respectively (Figure 12a), and the transverse ones decrease by 11% and 18%. For the width of the tensile stress zone, the longitudinal residual stresses when taking into account heat dissipation narrow by 17% and 21%, respectively, and the transverse ones almost do not change.
As for the distributions of residual plastic deformations in the butt joint of 2 mm thick magnesium alloy plates (Figure 12b), the maximum value of the residual longitudinal plastic deformations, taking into account the heat dissipation, increases by 3%, and their width narrows by 18% and 29%, respectively. At the same time, the transverse residual plastic deformations, at the maximum value of the tensile stresses, decrease by 2 and 4 times, respectively, and their width narrows by 1.13 and 1.2 times, respectively.
Thus, taking into account heat dissipation in the working tool and substrate when modeling welding thermal cycles, as well as residual welding deformations and stresses, is important for thin sheets (e.g., 2 mm thick), that can have a substantial impact on the precision of the computed outcomes. In the case of thick sheets (8 mm thick), taking into account heat dissipation in the welding process of magnesium alloys does not lead to a significant increase in the accuracy of the results.
4. Conclusions
Well-crafted welded connections of thin sheets of magnesium alloy are obtained at a constant 1420 rpm rotation speed of the friction stir welding tool and progressive welding speeds from 8 m/h up to 24 m/h. A clear textured border is formed between the weld core and thermo-mechanic affected zone from the side of the tool pin withdrawal, the weld core contains a refined ellipsoidal structure with 2-3 times increase in the modulus of elasticity compared to the base metal. The calculated temperature field characterizing the FSW process correlates with the experimentally determined surface temperature and has a maximum temperature of 600°C in the core zone, so the metal in the joint zone is in a plastic state. Modeling of the kinetics of changes in temperature fields during the FSW process showed that the width of the HAZ decreases with an increase in linear speed. It was established that with an increase in the linear speed of welding, the maximum residual stresses increase by 10...15%. Residual plastic deformations decrease with an increase in the linear speed of welding. To obtain uniform structure of the FSW weld of thin sheet magnesium alloy, it can be effective to reduce the heat transfer to the metal by increasing the FSW linear speed, or by reducing the rotational speed of the FSW tool.
In upcoming endeavors, it would be beneficial to establish the equilibrium between the linear velocity and the rotational velocity of the FSW (Friction Stir Welding) tool. Achieving the right balance is crucial for optimizing performance and ensuring the desired quality of the weld. By carefully analyzing and adjusting these speeds, one can enhance the efficiency of the welding process and improve the mechanical properties of the joint produced. Continuous assessment and fine-tuning of these parameters can lead to more reliable and consistent results in fabrication. Emphasizing this aspect will facilitate better control during the welding operation and ultimately contribute to the advancement of FSW techniques in various applications. As the field evolves, understanding the interplay between the linear and rotational speeds will remain a key factor in refining welding methodologies. Monitoring these variables will not only aid in achieving optimal welds but also push the boundaries of what can be accomplished through innovative welding solutions. Therefore, prioritizing this balance is a significant step towards enhancing overall welding performance and quality.
Author Contributions
Conceptualization, V.K. and J.K.; methodology, investigation, V.K., M.K. and O.B.; mathematical model and computer simulation, O.M. and A.M.; supervision, V.K.; writing, J.K., M.K. and A.M.; review and editing, A.M. and J.K. All authors have read and agreed to the published version of the manuscript.
Funding
This research received no external funding.
Institutional Review Board Statement
Not applicable.
Informed Consent Statement
Not applicable.
Data Availability Statement
Data are contained within the article.
Conflicts of Interest
The authors declare no conflicts of interest.
References
- Y. Yanga, X. Xionga, J. Chen at all. Review. Research advances of magnesium and magnesium alloys worldwide in 2022. Journal of Magnesium and Alloys, 2023, 11(4), 2611–2654. [CrossRef]
- Jiangfeng Song, Jing Chen, Xiaoming Xiong, Xiaodong Peng, Daolun Chen, Fusheng Pan. Research advances of magnesium and magnesium alloys worldwide in 2021. Journal of Magnesium and Alloys, 2022, 10(4), 863–898.. [CrossRef]
- Krzysztof Krasnowski at all. Relation between geometry of FSW tools and formation of nano- dispersed zones in macrostructure EN AW 6082-T6 alloy welded joints. Biuletyn Instytutu Spawalnictwa, 2021, 65(5), 7–16. [CrossRef]
- K. Krasnovsky, Yu.A. Khokhlova, M.A. Khokhlov. Influence of tool shape for friction stir welding on physicomechanical properties of zones of welds of aluminium alloy EN AW 6082-T6. The Paton Welding Journal, 2019, 7, 7-11. [CrossRef]
- A.A. Makarenko, O.V. Makhnenko Mathematical modeling of residual stresses in composite welded joints of WWER-1000 reactor vessel cover with CSS nozzles. The Paton Welding Journal, 2022, 1, 33–40. [CrossRef]
- B.R. Tsaryk, O.F. Muzhichenko, O.V. Makhnenko Mathematical model of determination of residual stresses and strains in friction stir welding of aluminium alloy. The Paton Welding Journal, 2022, 9, 37–44. [CrossRef]
- Oliver W.C., Pharr G.M. Measurement of hardness and elastic modulus by instrumented indentation: Advances in understanding and refinements to methodology. Ibid, 2004, 19(1), 3–21. [CrossRef]
- NASA Technical Reports Server (NTRS). Available online:, October 21, 2024. https://ntrs.nasa.gov/api/citations/20020070606/downloads/20020070606.pdf.
- Kulwant Singh, Gurbhinder Singh, Harmeet Singh. Microstructure and mechanical behaviour of friction-stir-welded magnesium alloys: As-Welded and post weld heat treated. Materials Today Communications, 2019, 20, 100600.. [CrossRef]
Figure 1.
The scheme (a) and working tool (b) of FSW process.
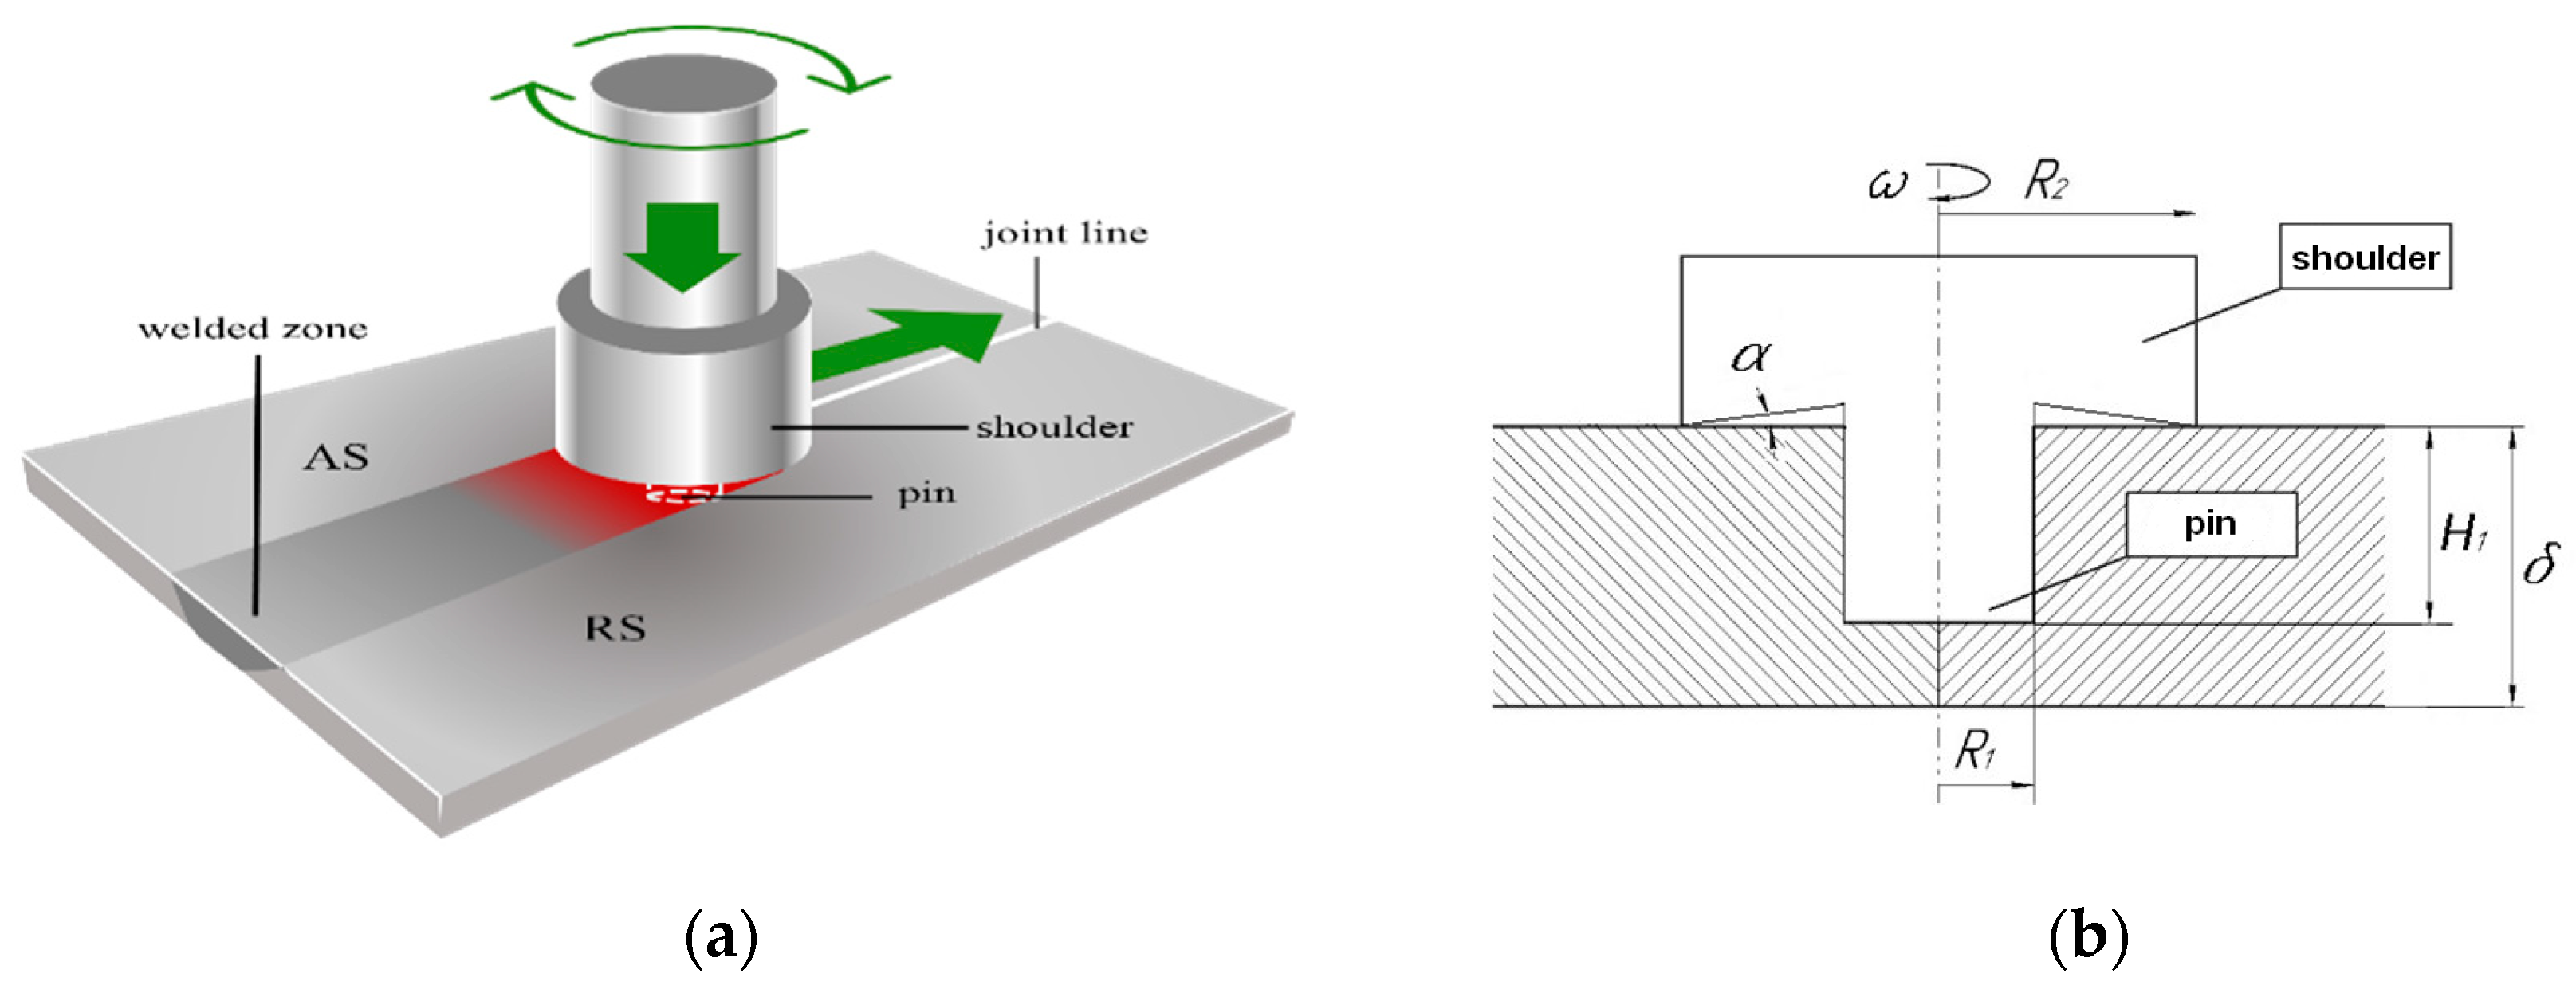
Figure 2.
Experimental laboratory welding equipment (a) and temperature measuring equipment Fluke Ti25 (b) for studies FSW of a 2 mm thick magnesium alloy butt joint.
Figure 2.
Experimental laboratory welding equipment (a) and temperature measuring equipment Fluke Ti25 (b) for studies FSW of a 2 mm thick magnesium alloy butt joint.
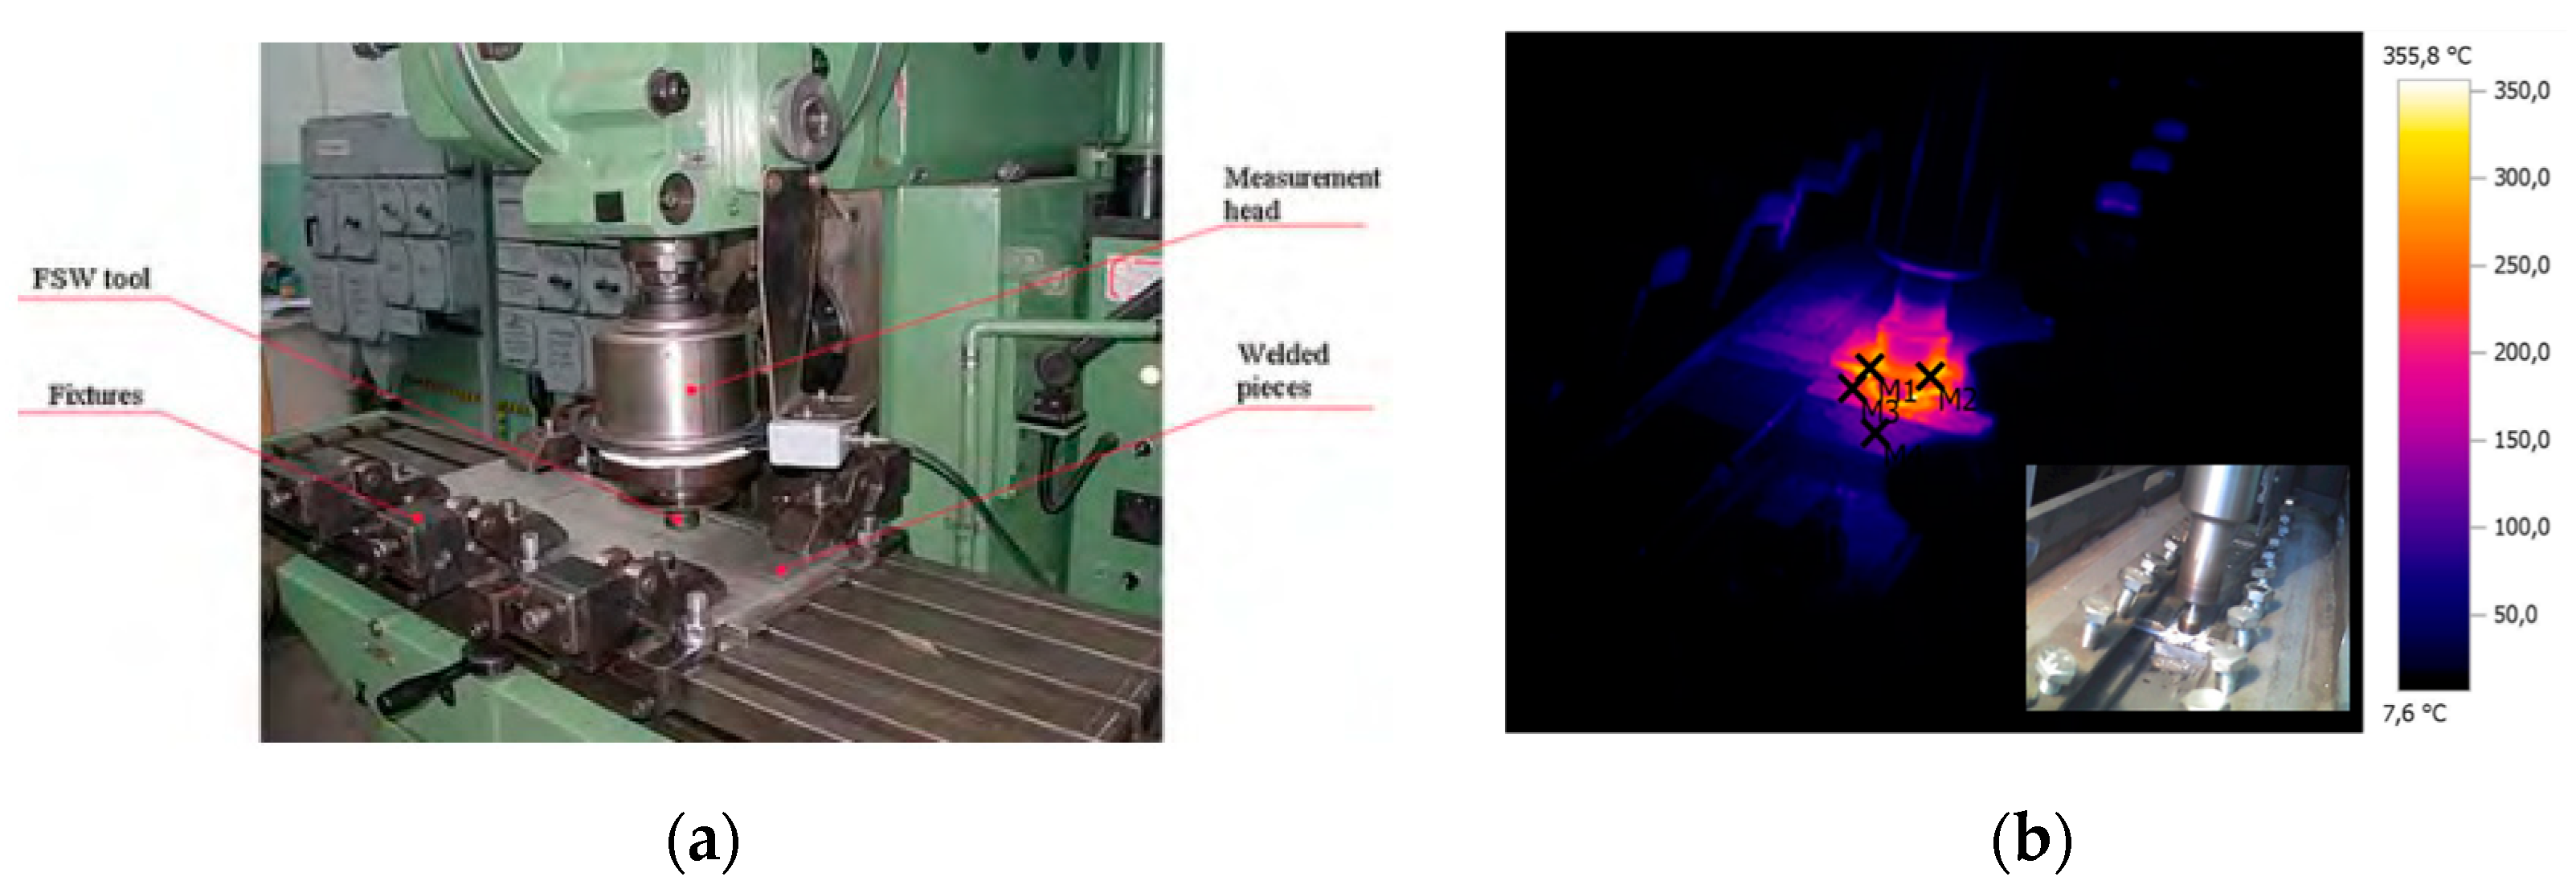
Figure 3.
Macrostructure of the FSW butt joints (6 welds).
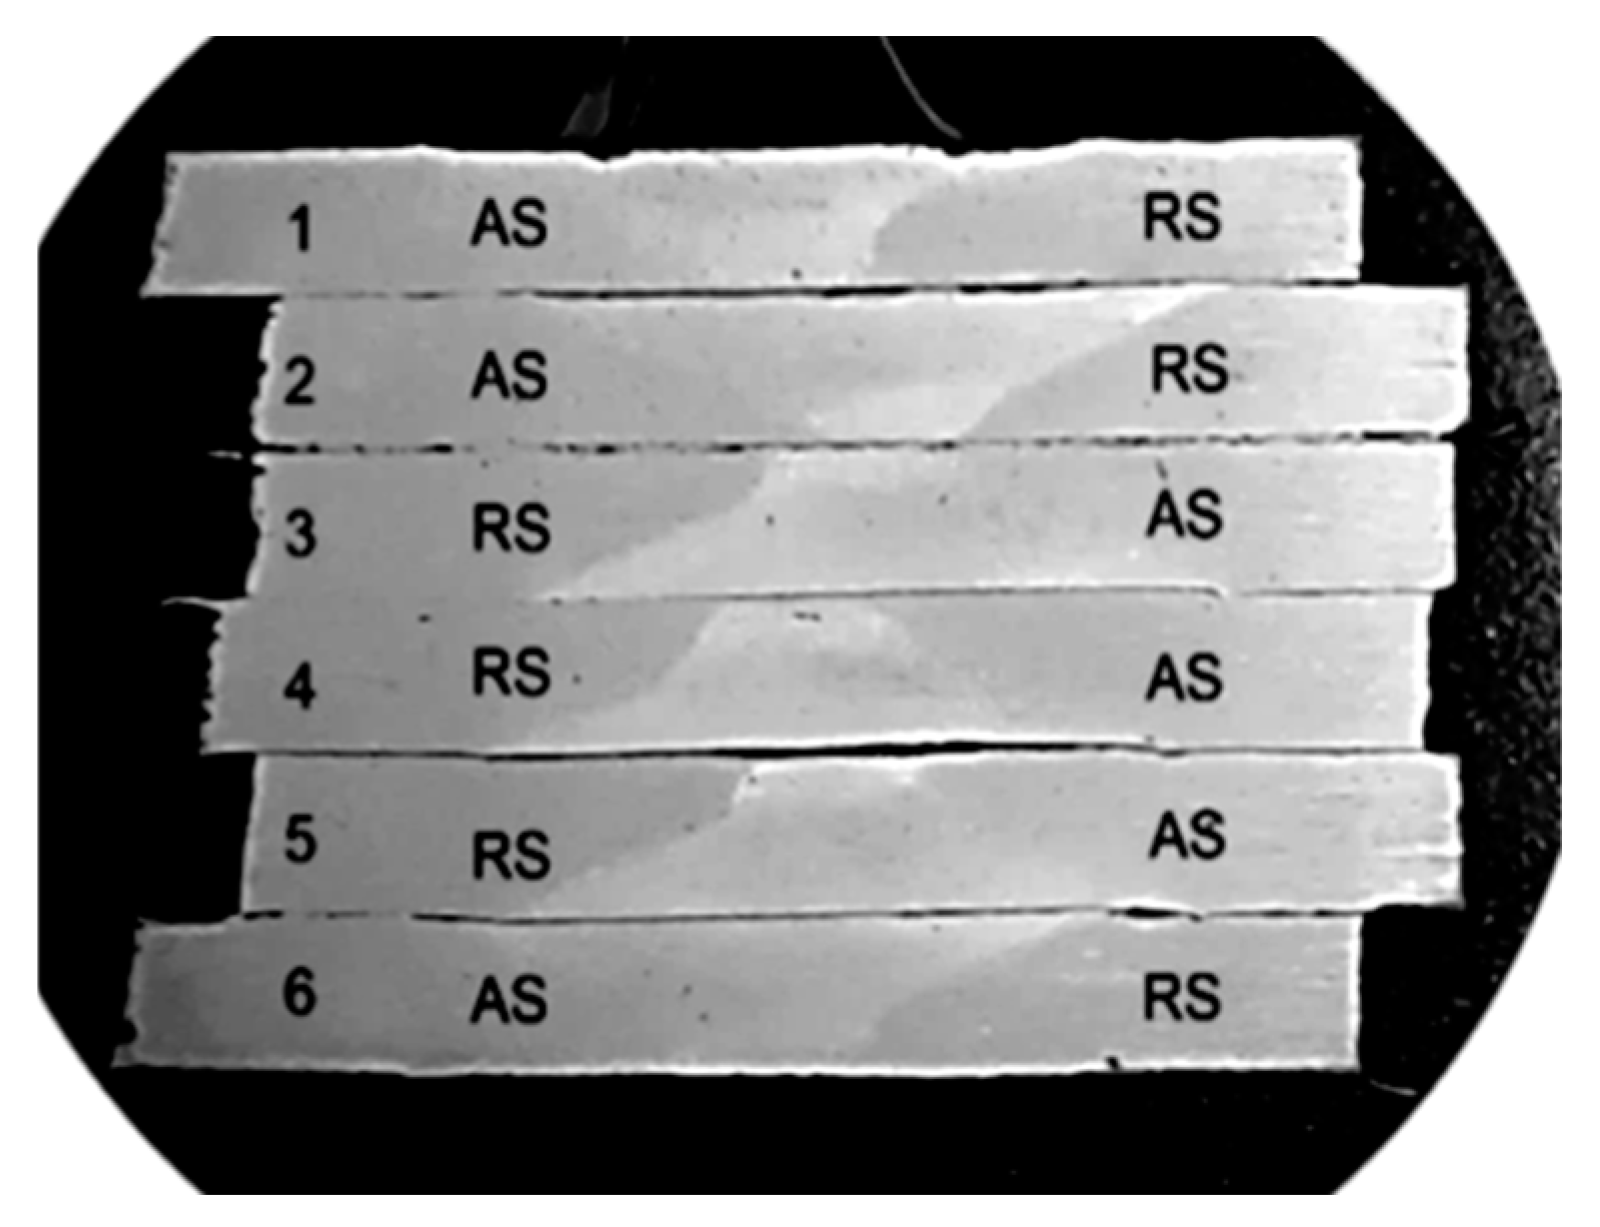
Figure 4.
The microstructure of base metal (a) and the FSW weld on the retreating side (RS) –HAZ (b), HAZ-TMAZ-weld core (c) and the middle of the weld core (d) (SEM).
Figure 4.
The microstructure of base metal (a) and the FSW weld on the retreating side (RS) –HAZ (b), HAZ-TMAZ-weld core (c) and the middle of the weld core (d) (SEM).
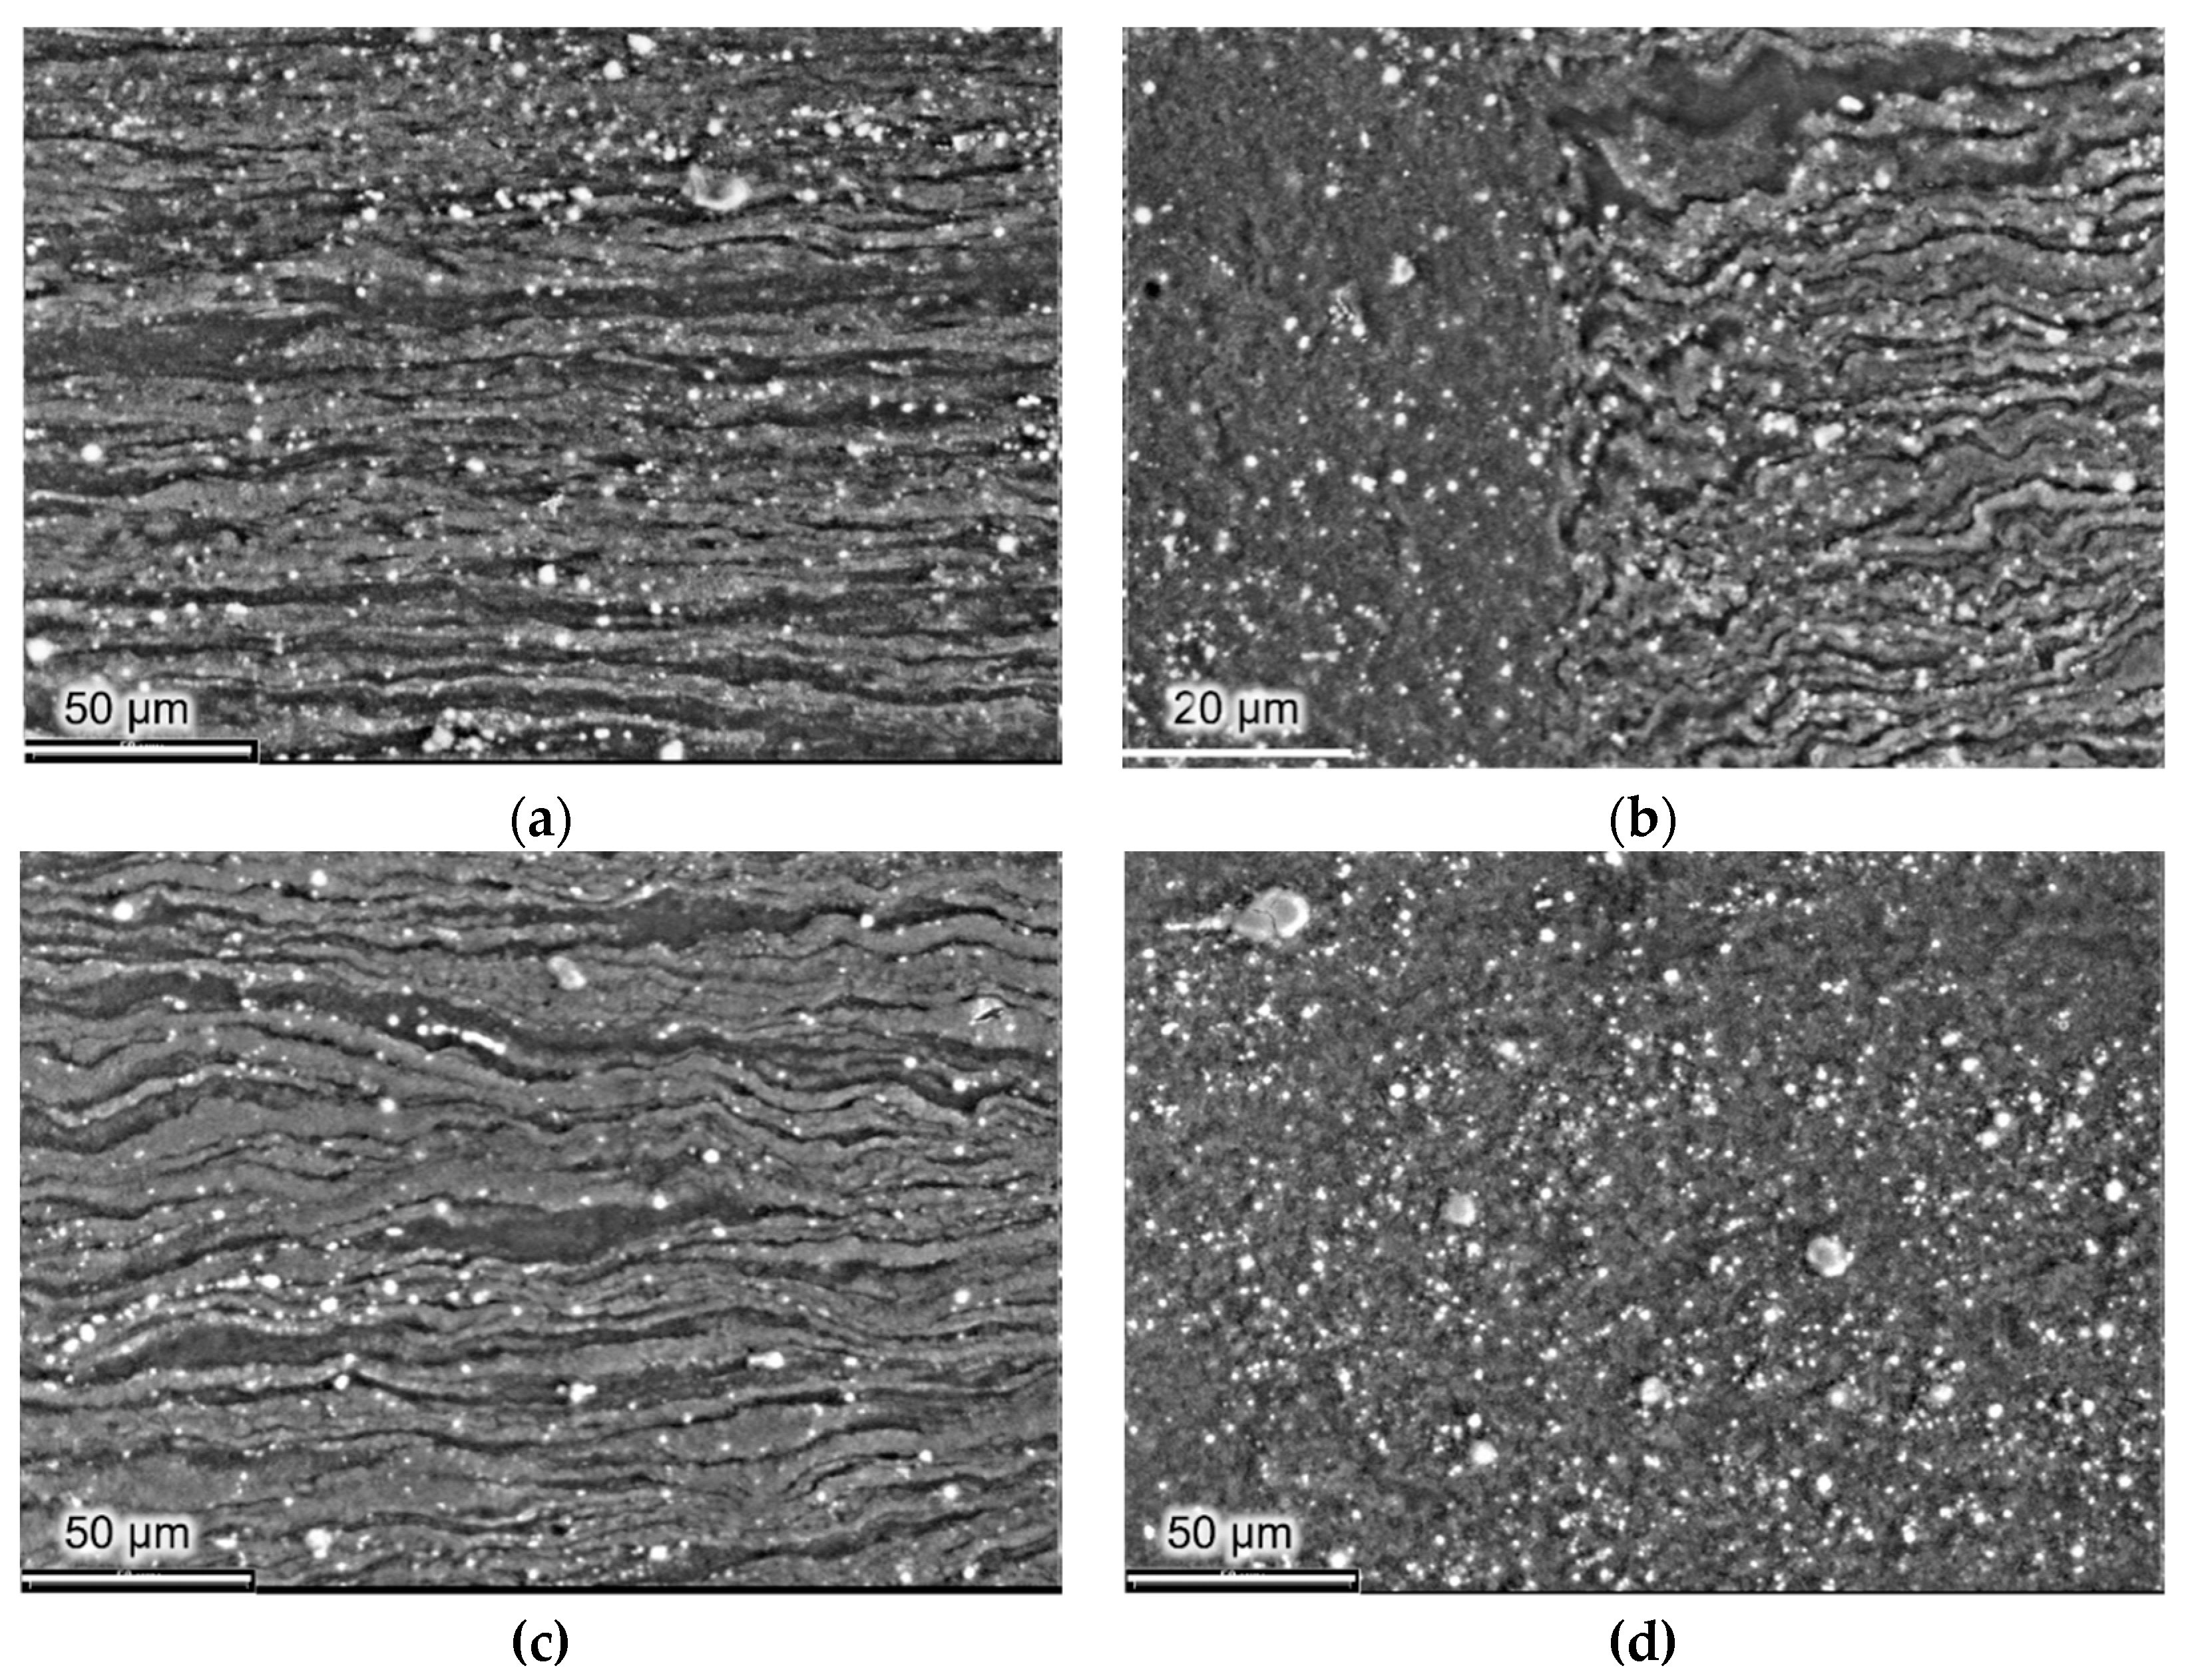
Figure 5.
The core zone contains highly dispersed grains (SEM).
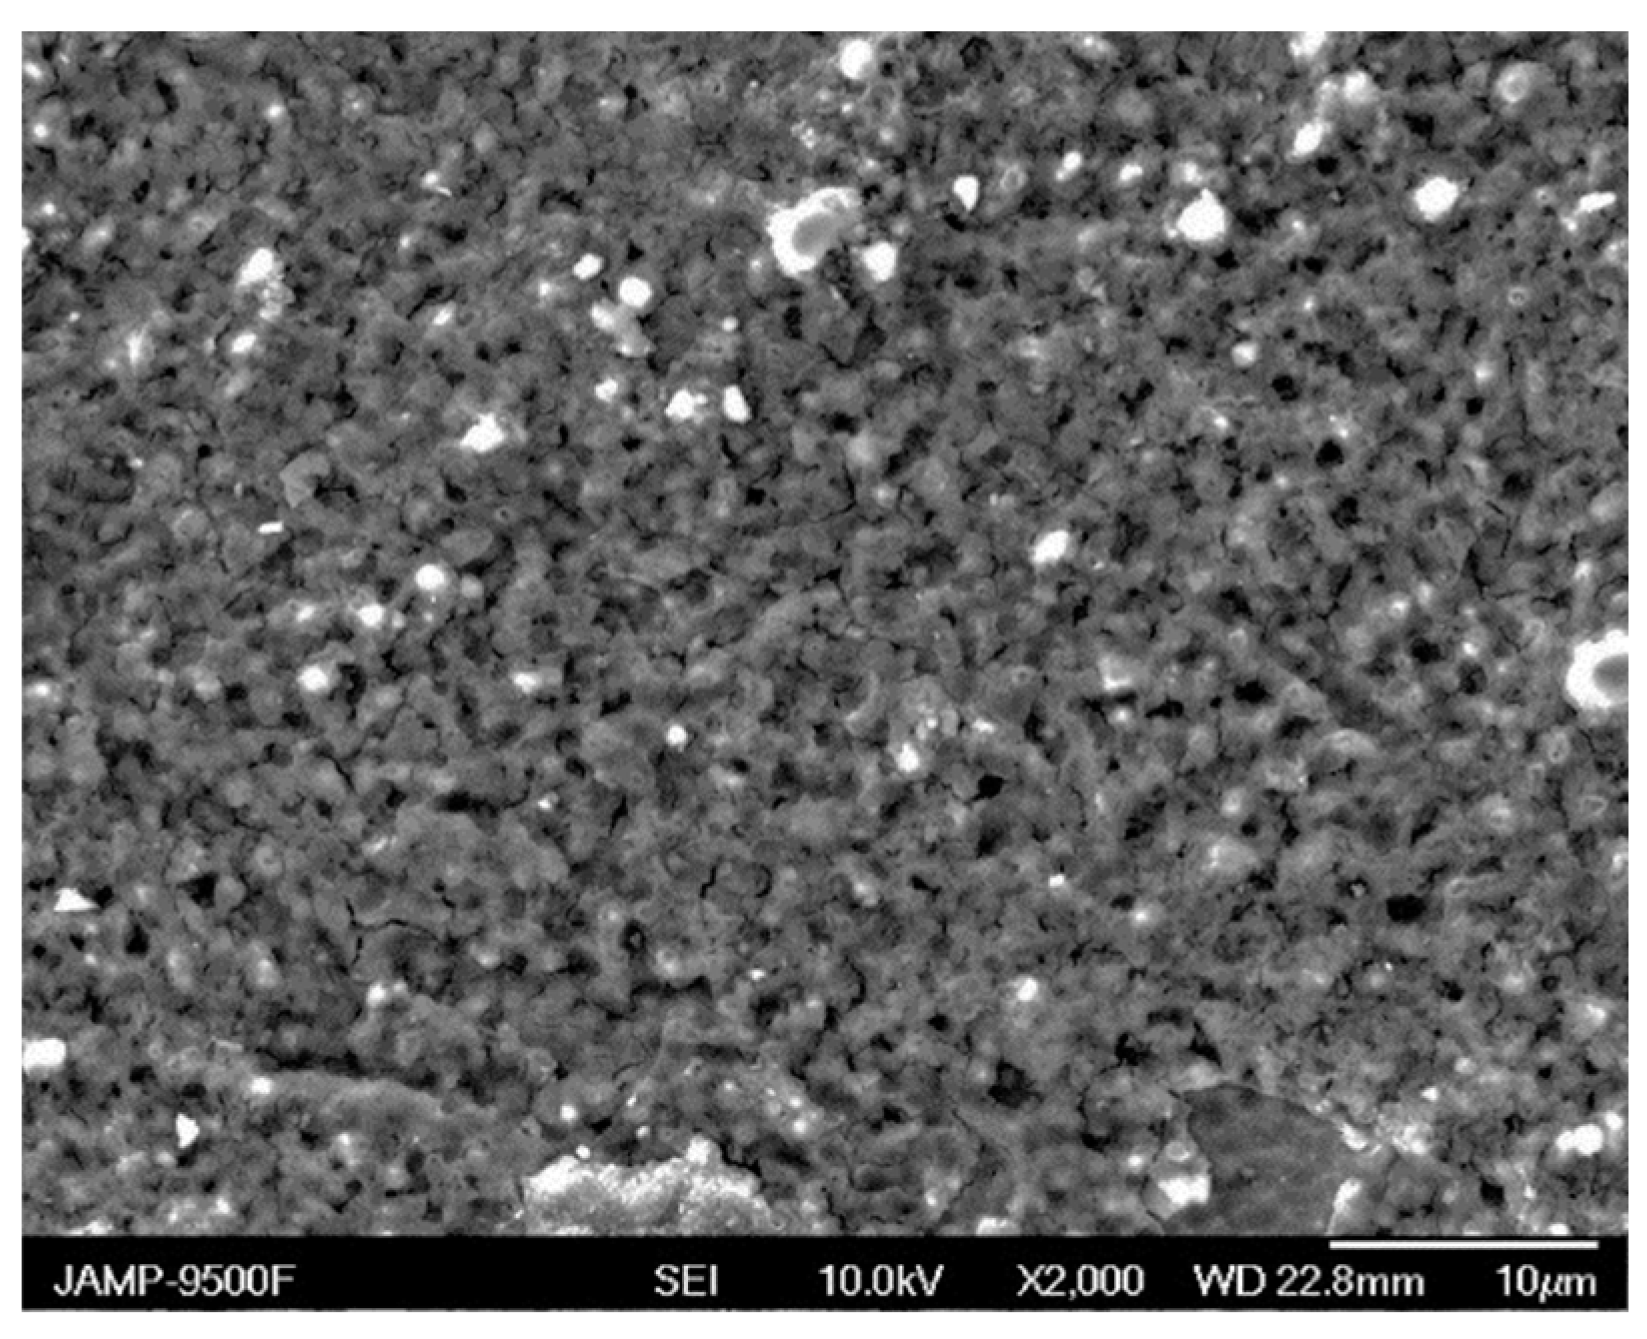
Figure 6.
Microstructure of the central part of the FSW weld with indenter imprints.
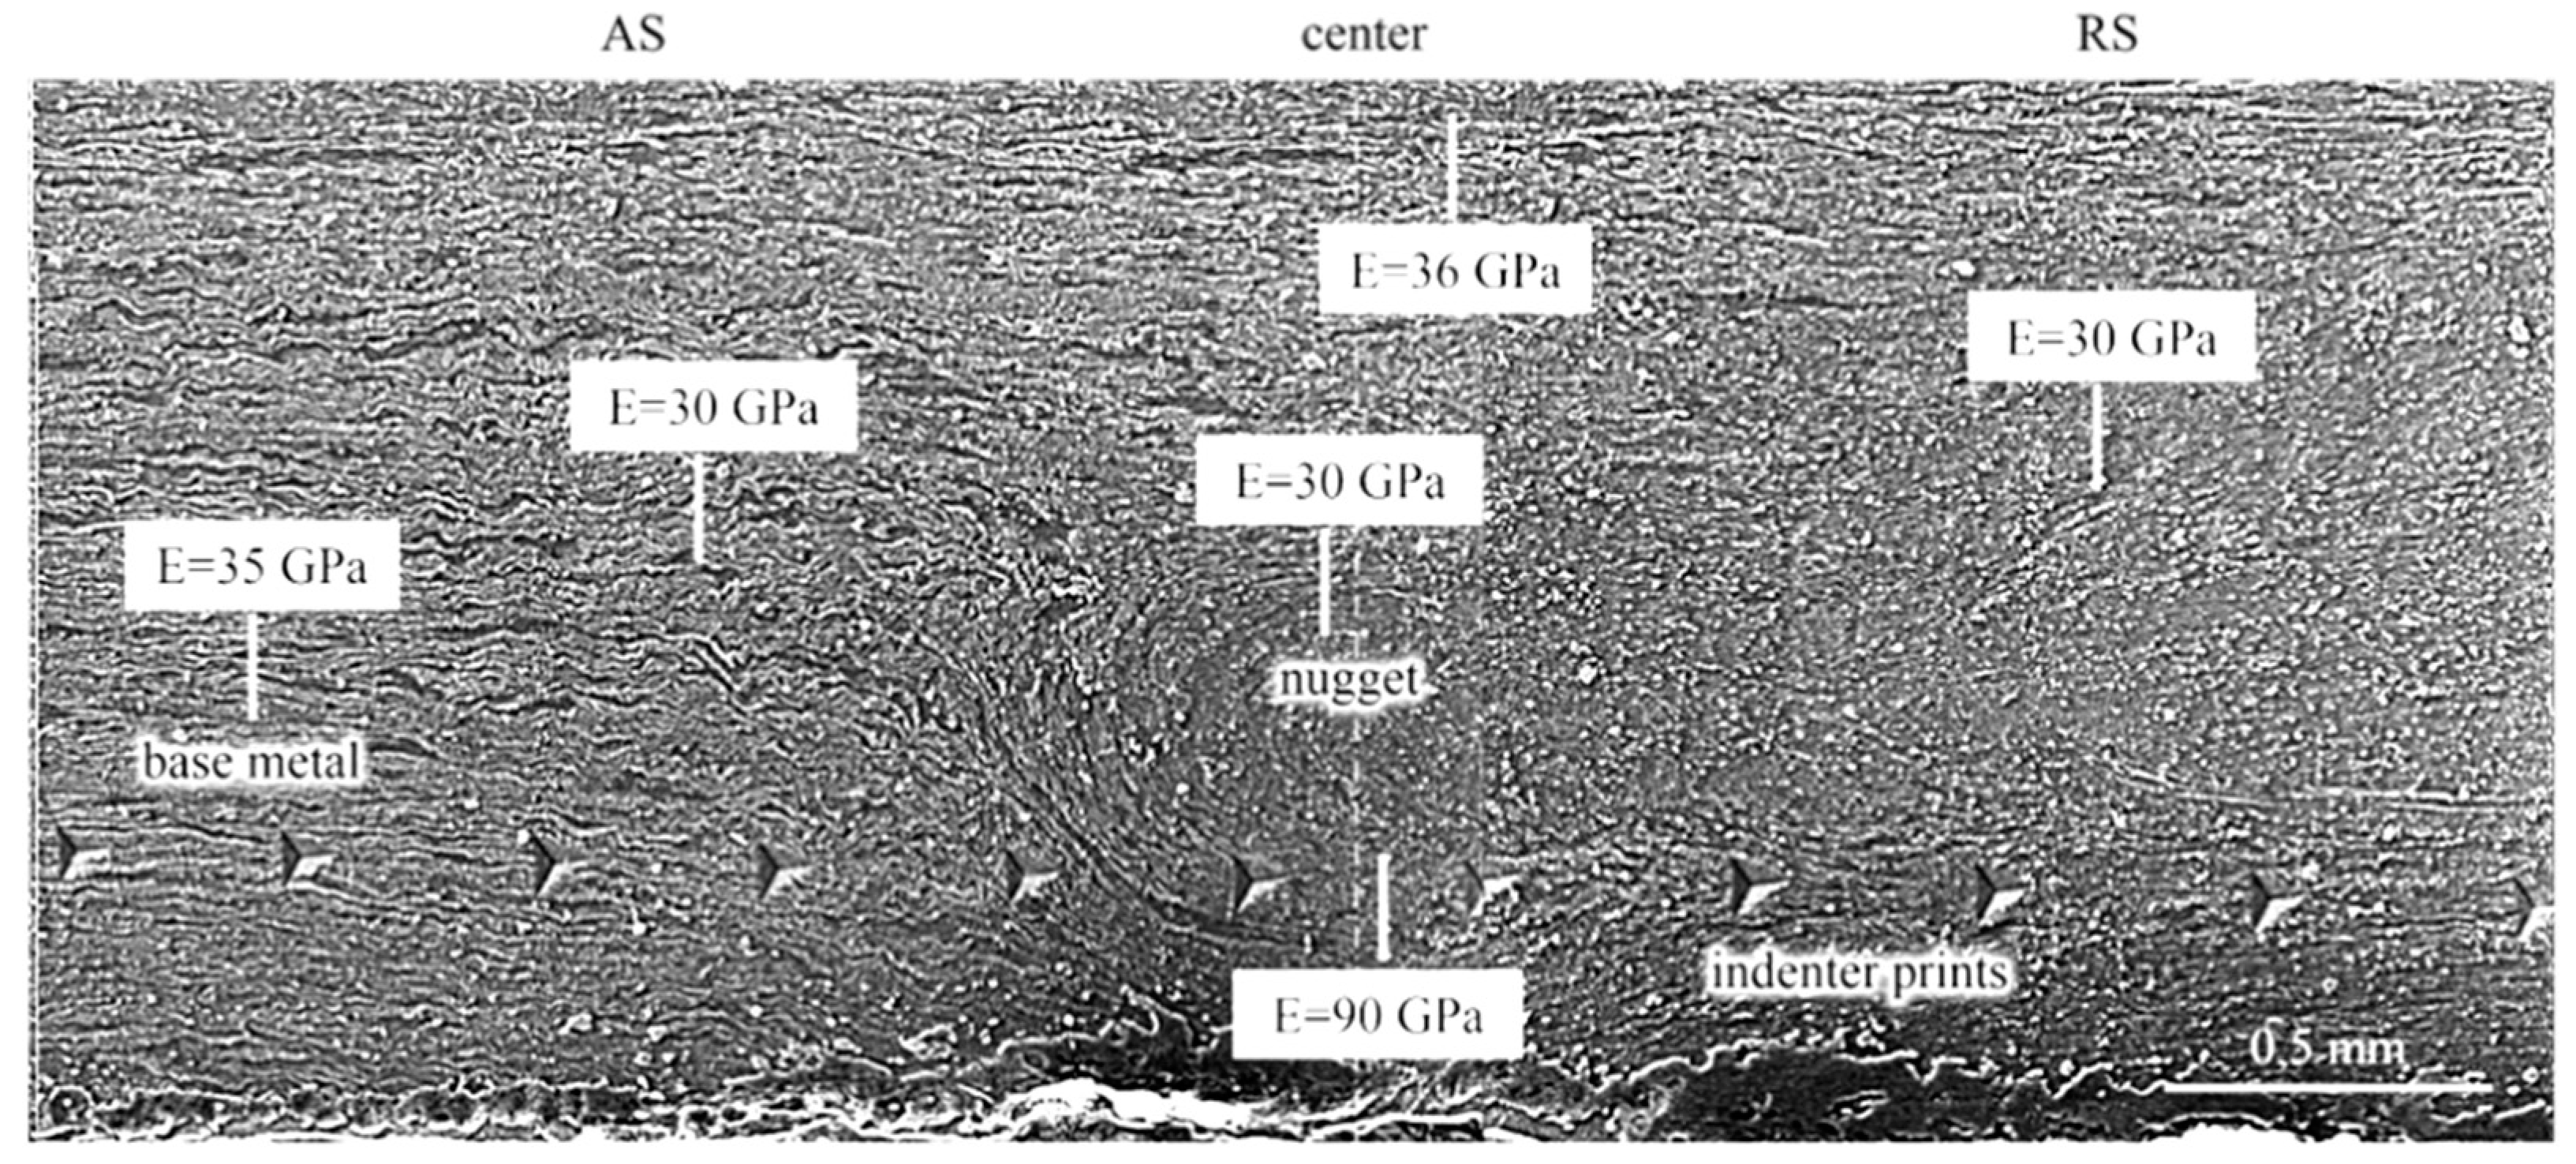
Figure 7.
Diagrams of indentation of the base metal (a) and weld core (b).
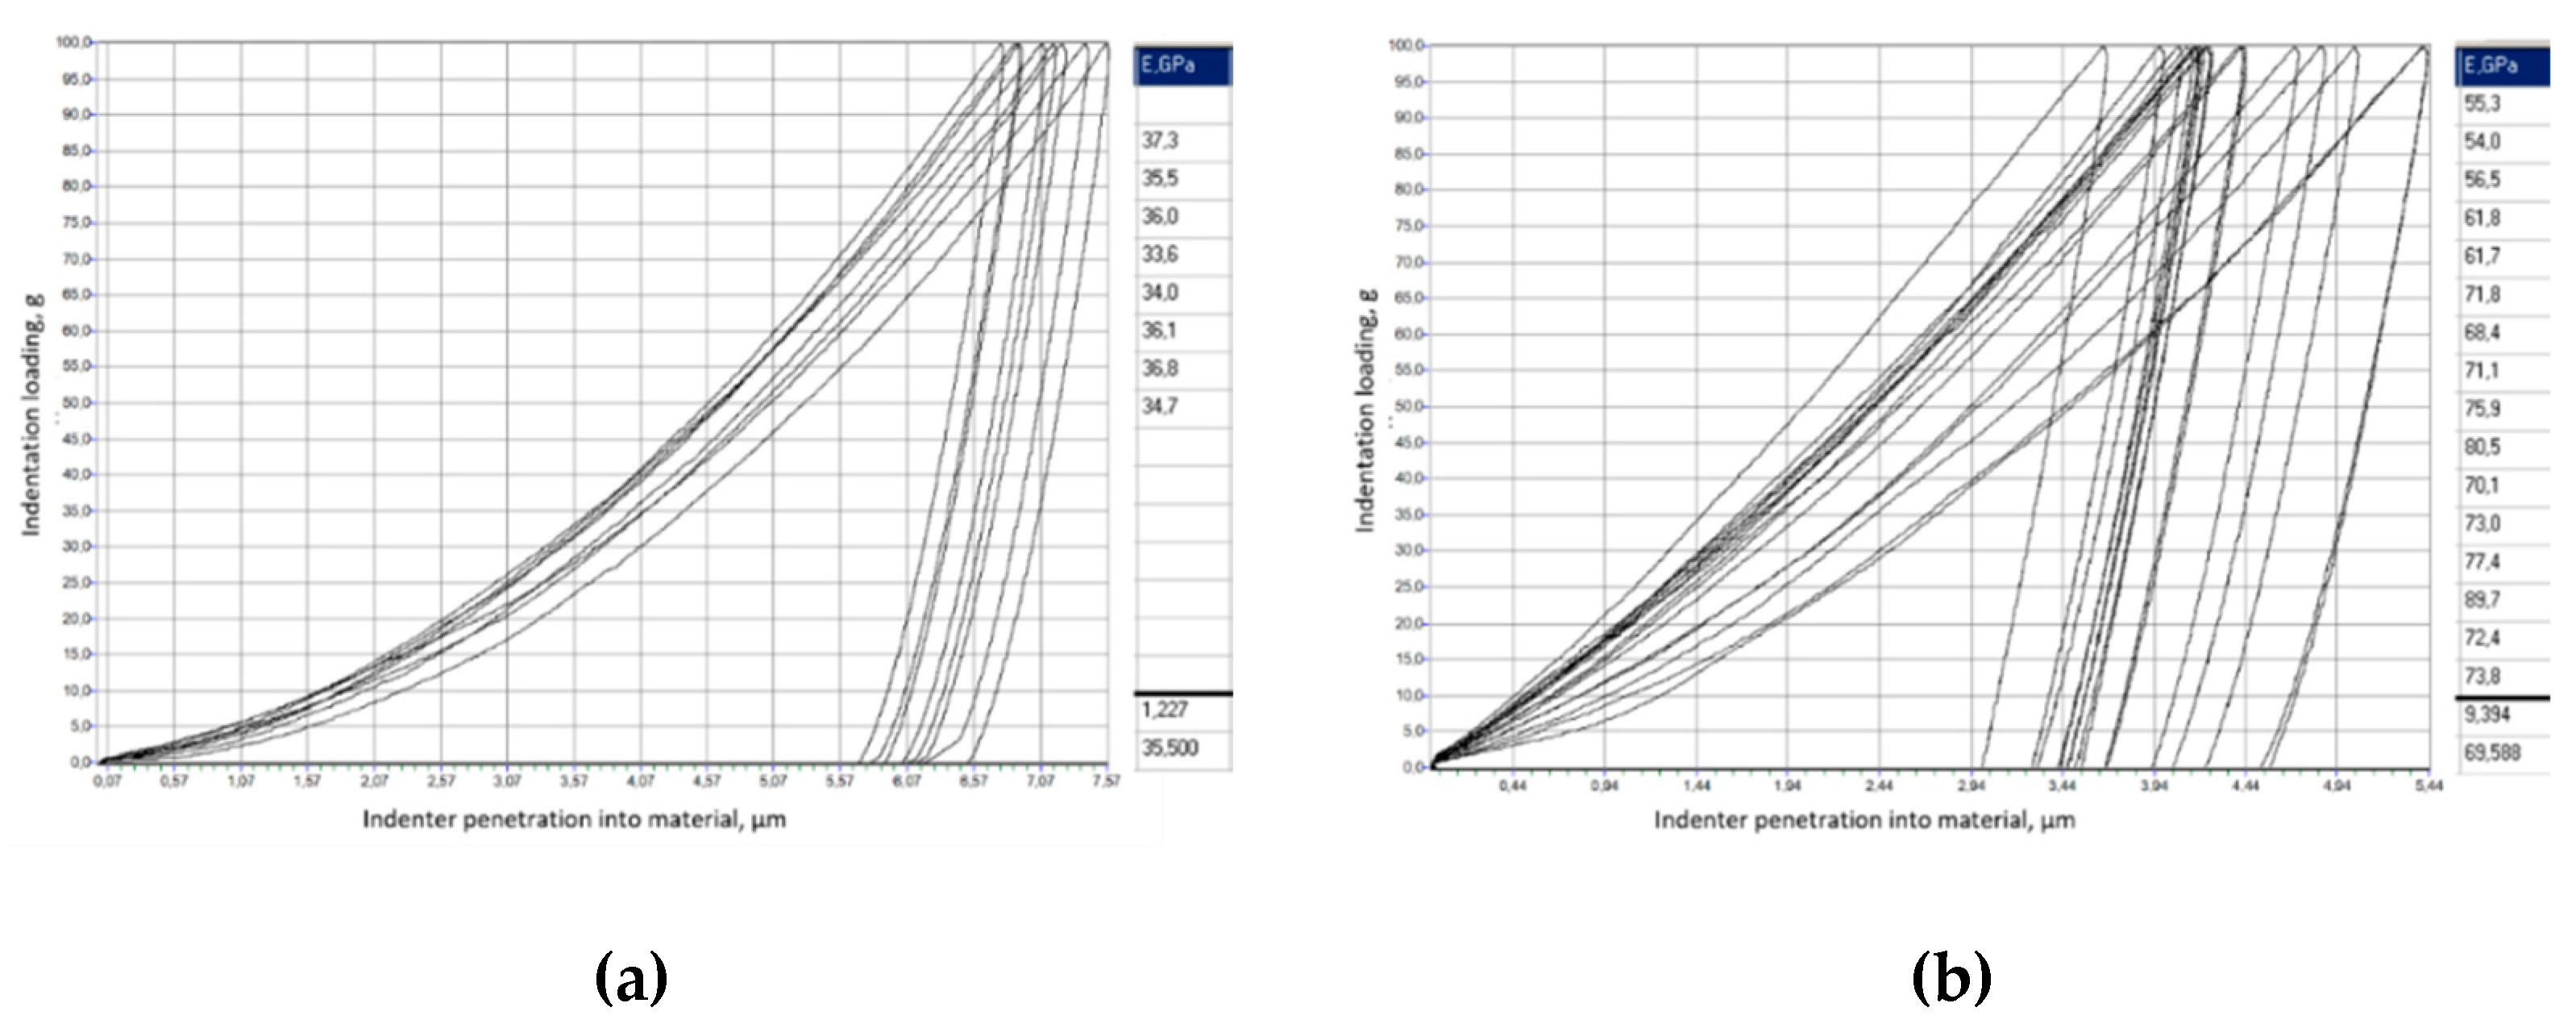
Figure 8.
Micro hardness study of the magnesium alloy: (a) – general view of the test specimen; (b) – analysis area; (c) – micro hardness distribution map.
Figure 8.
Micro hardness study of the magnesium alloy: (a) – general view of the test specimen; (b) – analysis area; (c) – micro hardness distribution map.
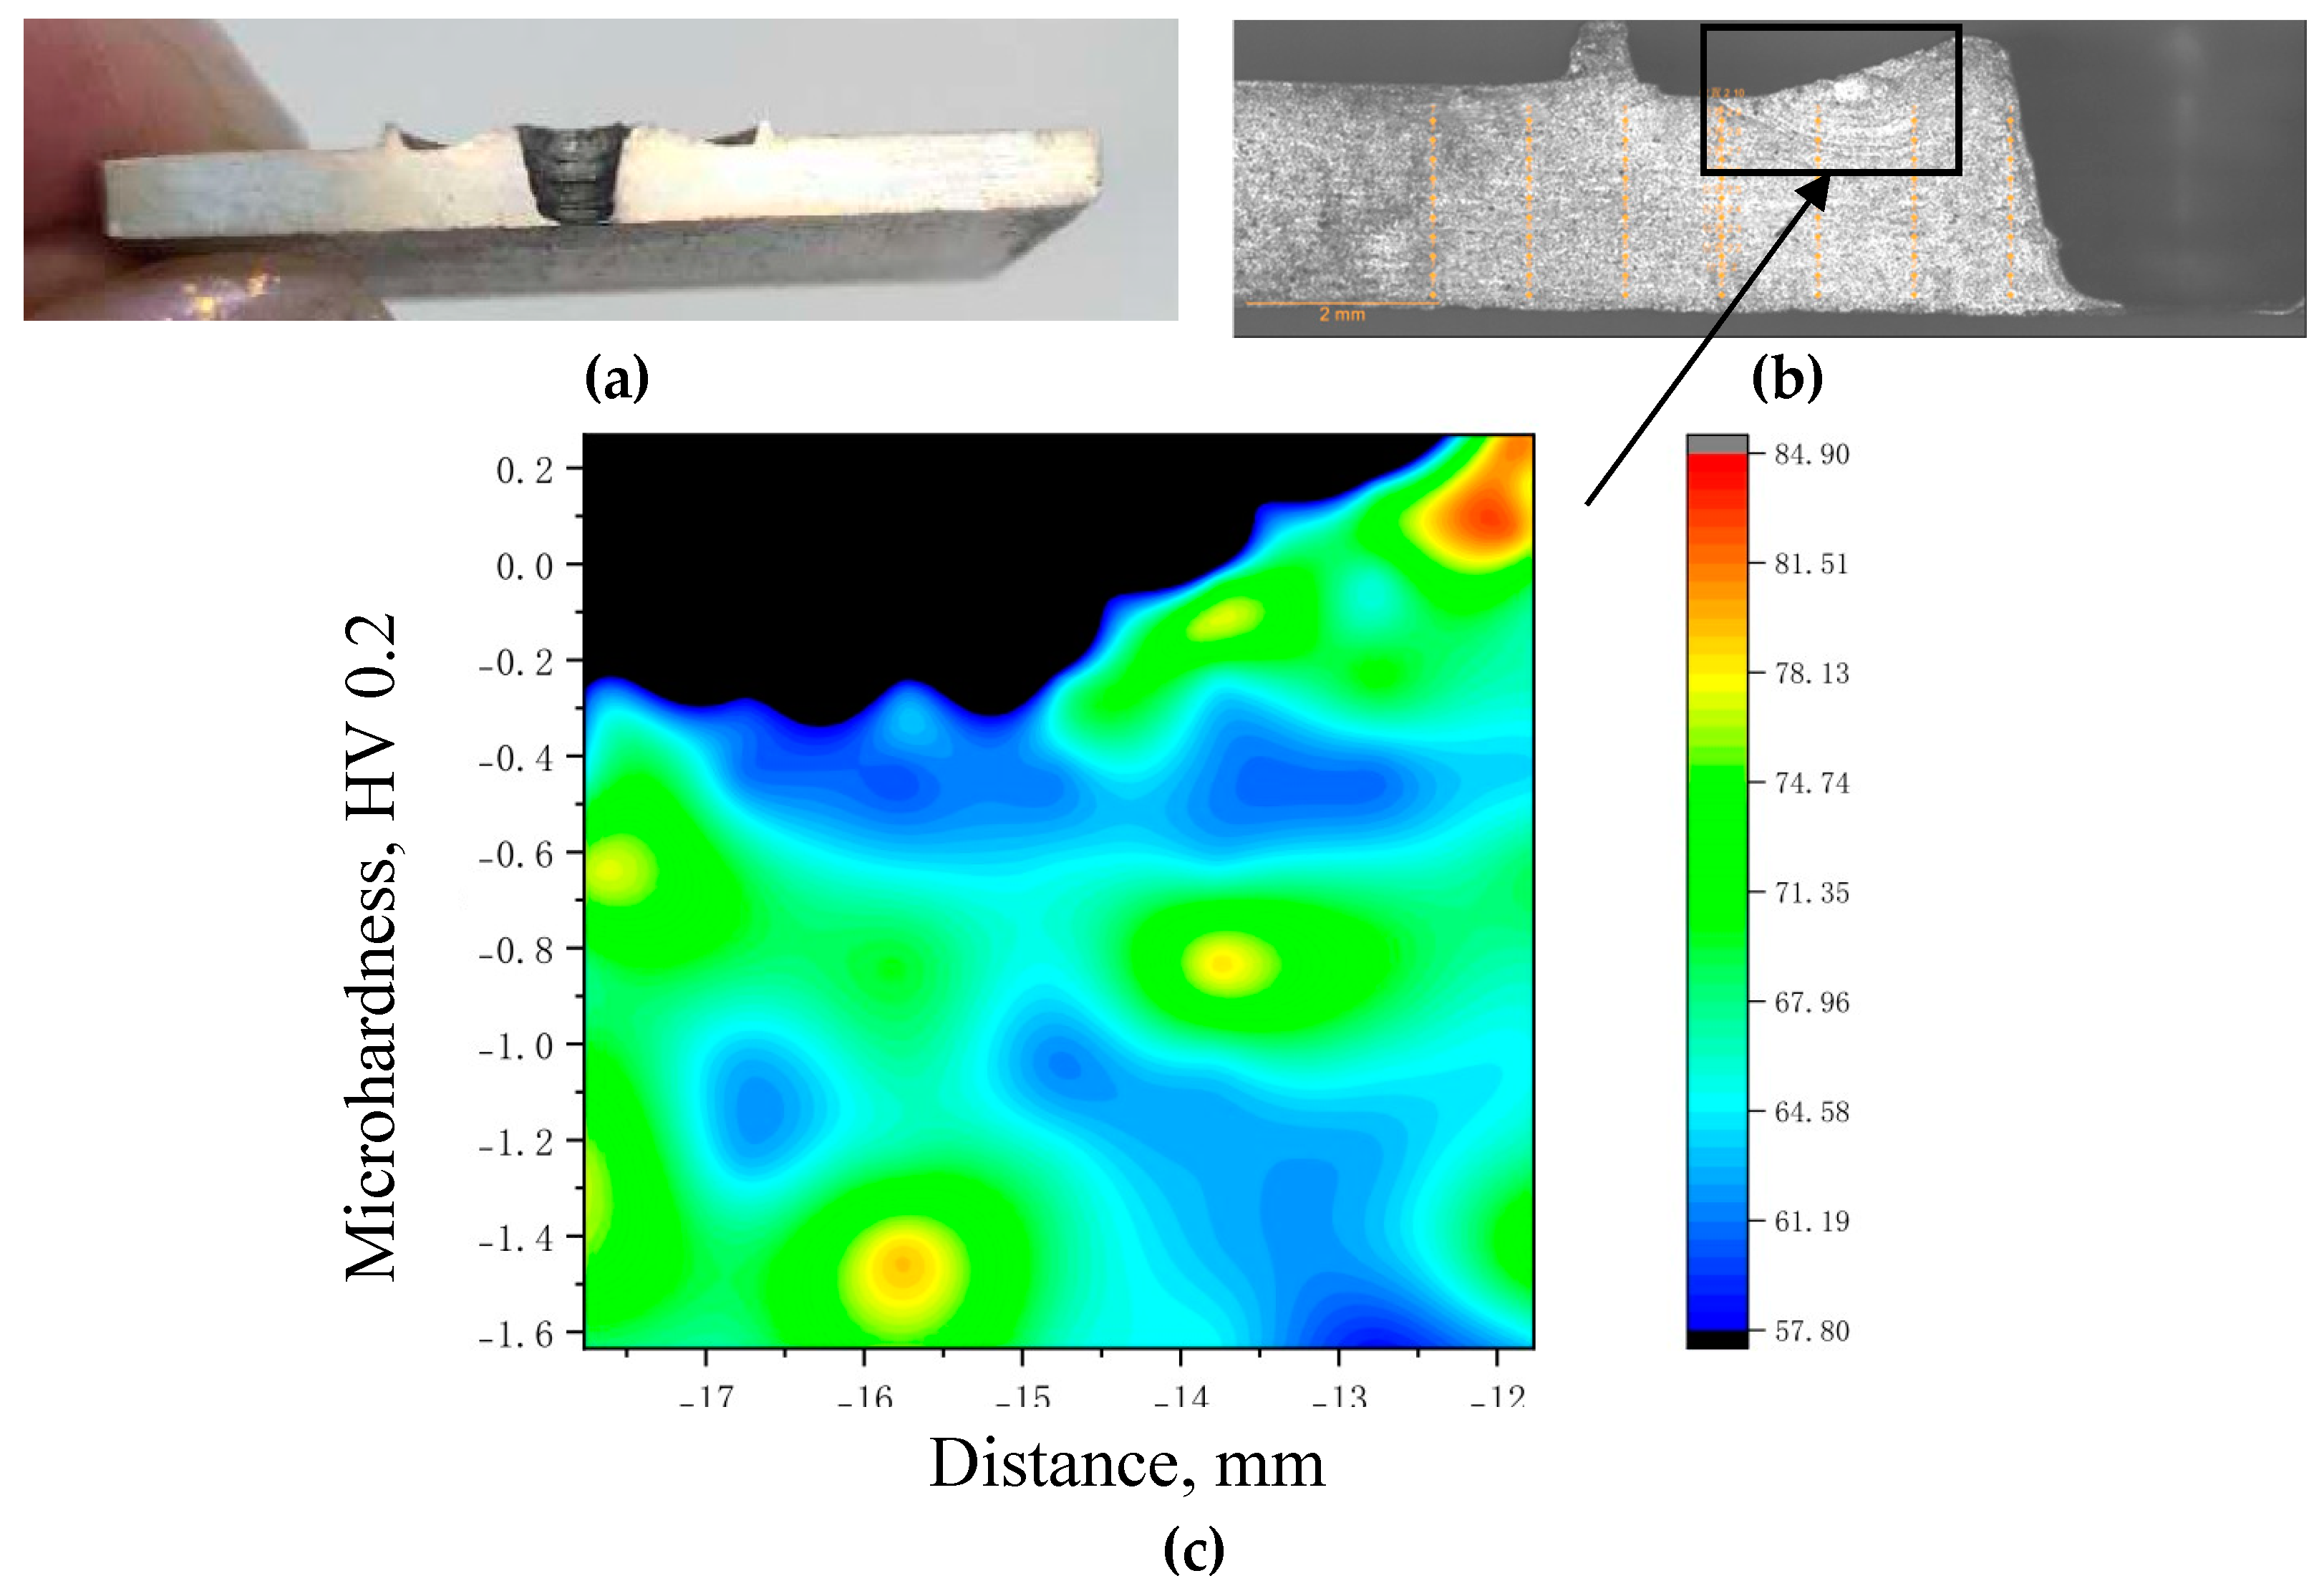
Figure 9.
Model of the temperature fields with heat dissipation into the tool and substrate of the friction stir welding process at a linear speed of 8 m/h with thick plates: (a) – 2 mm; (b) – 8 mm.
Figure 9.
Model of the temperature fields with heat dissipation into the tool and substrate of the friction stir welding process at a linear speed of 8 m/h with thick plates: (a) – 2 mm; (b) – 8 mm.
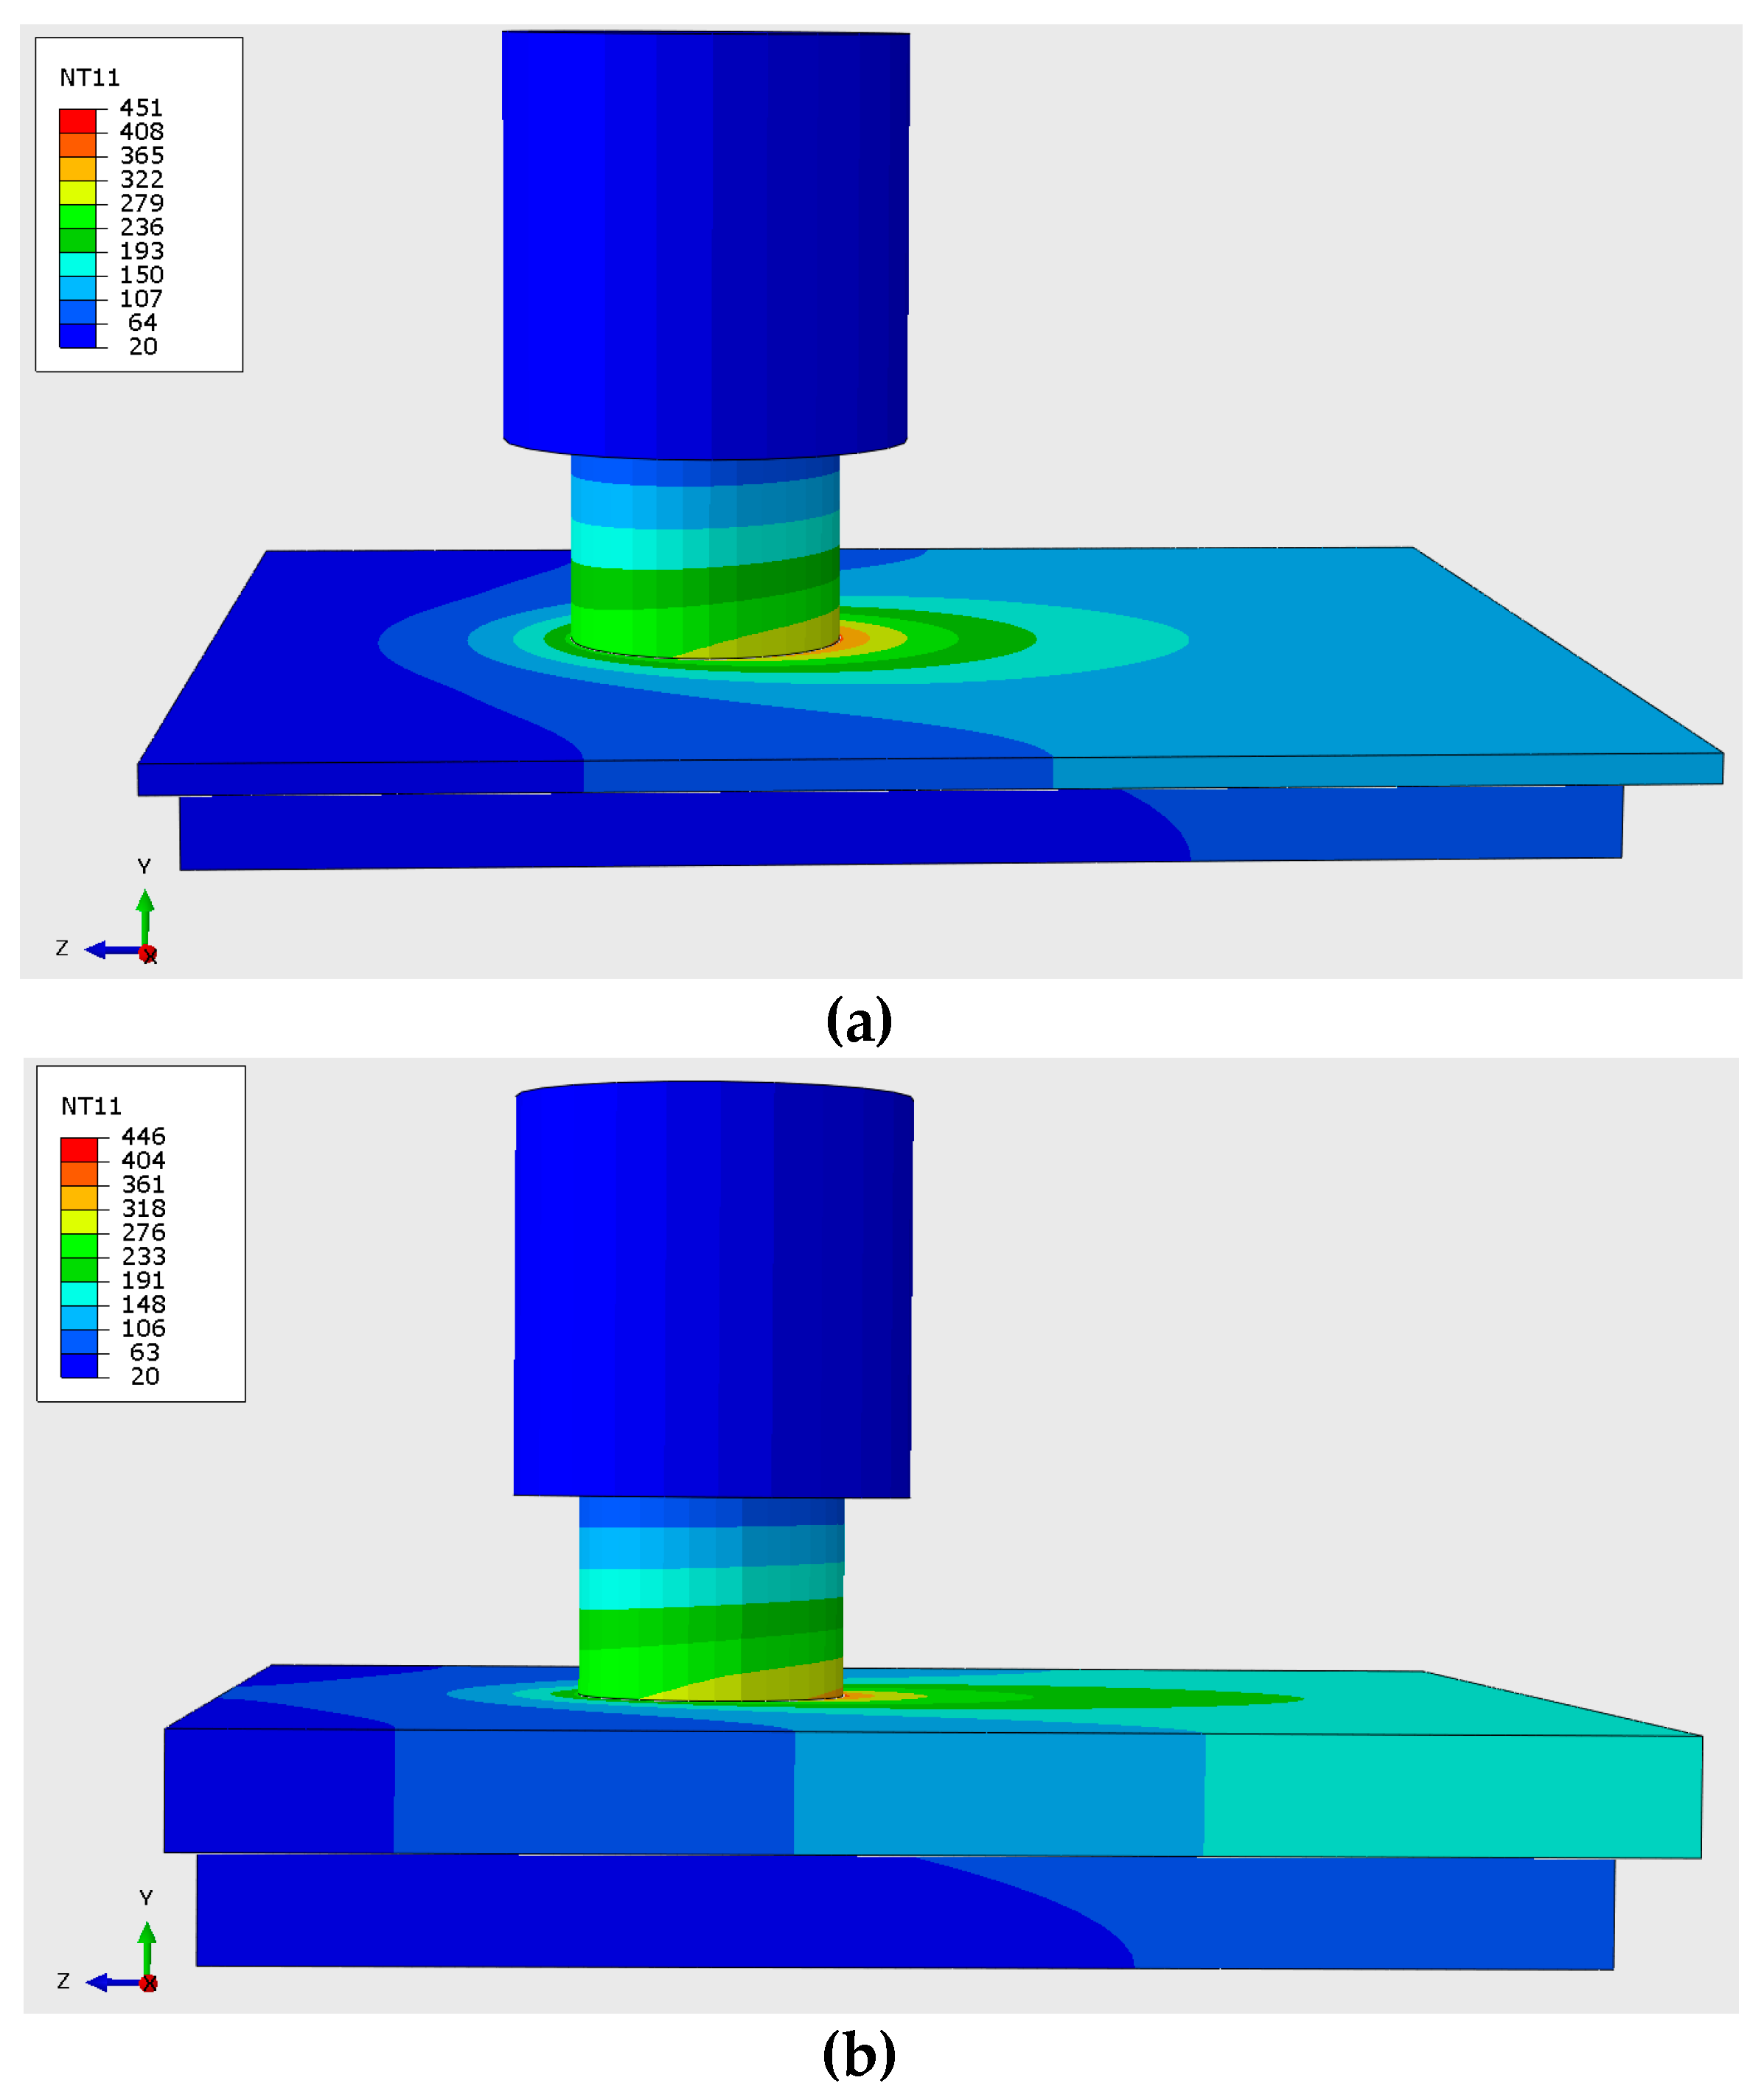
Figure 10.
Thermal cycles (a) and distribution of temperature fields (b) during FSW of 2 mm-thick magnesium alloy plates at progressive welding speeds 8, 16, 24 m/h.
Figure 10.
Thermal cycles (a) and distribution of temperature fields (b) during FSW of 2 mm-thick magnesium alloy plates at progressive welding speeds 8, 16, 24 m/h.
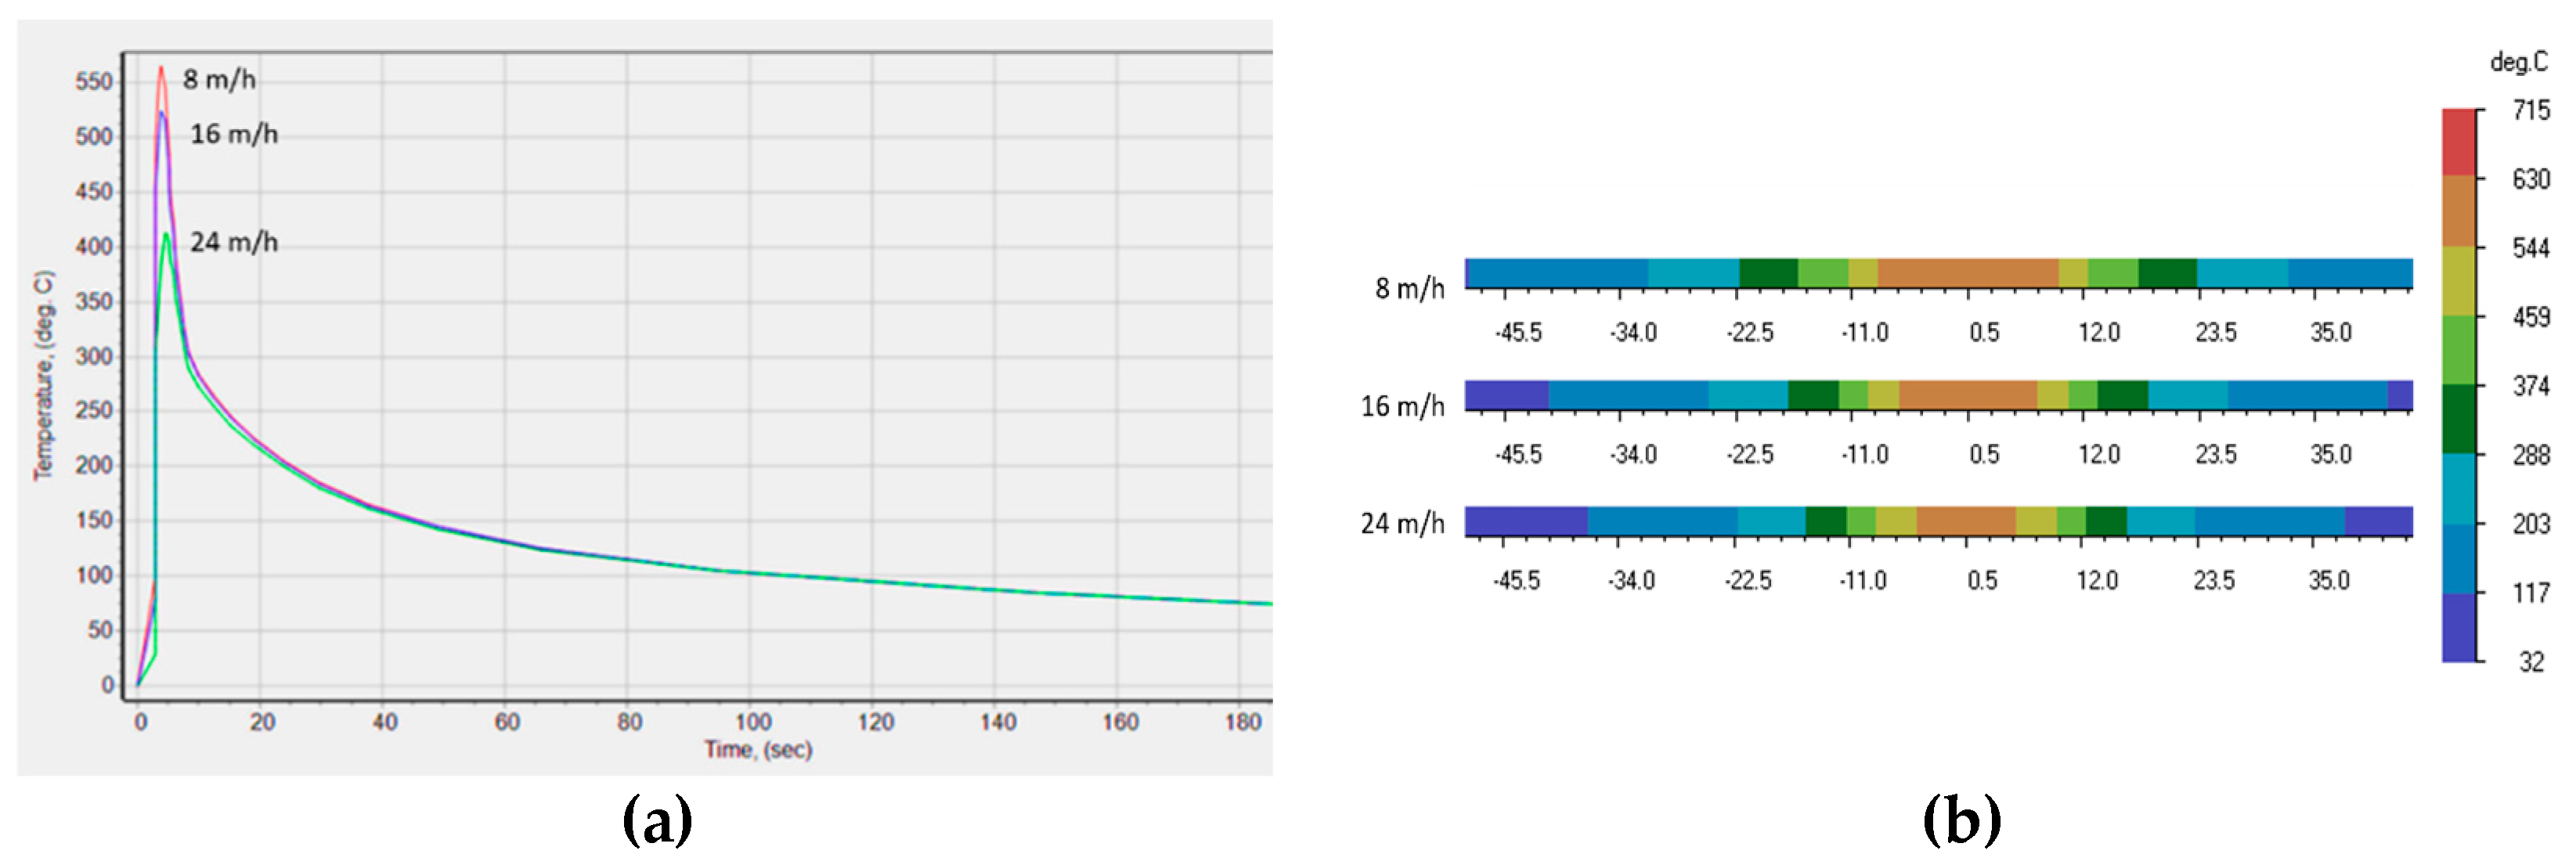
Figure 11.
The width of TMAZ at 8 m/h linear speed in the sample and model.
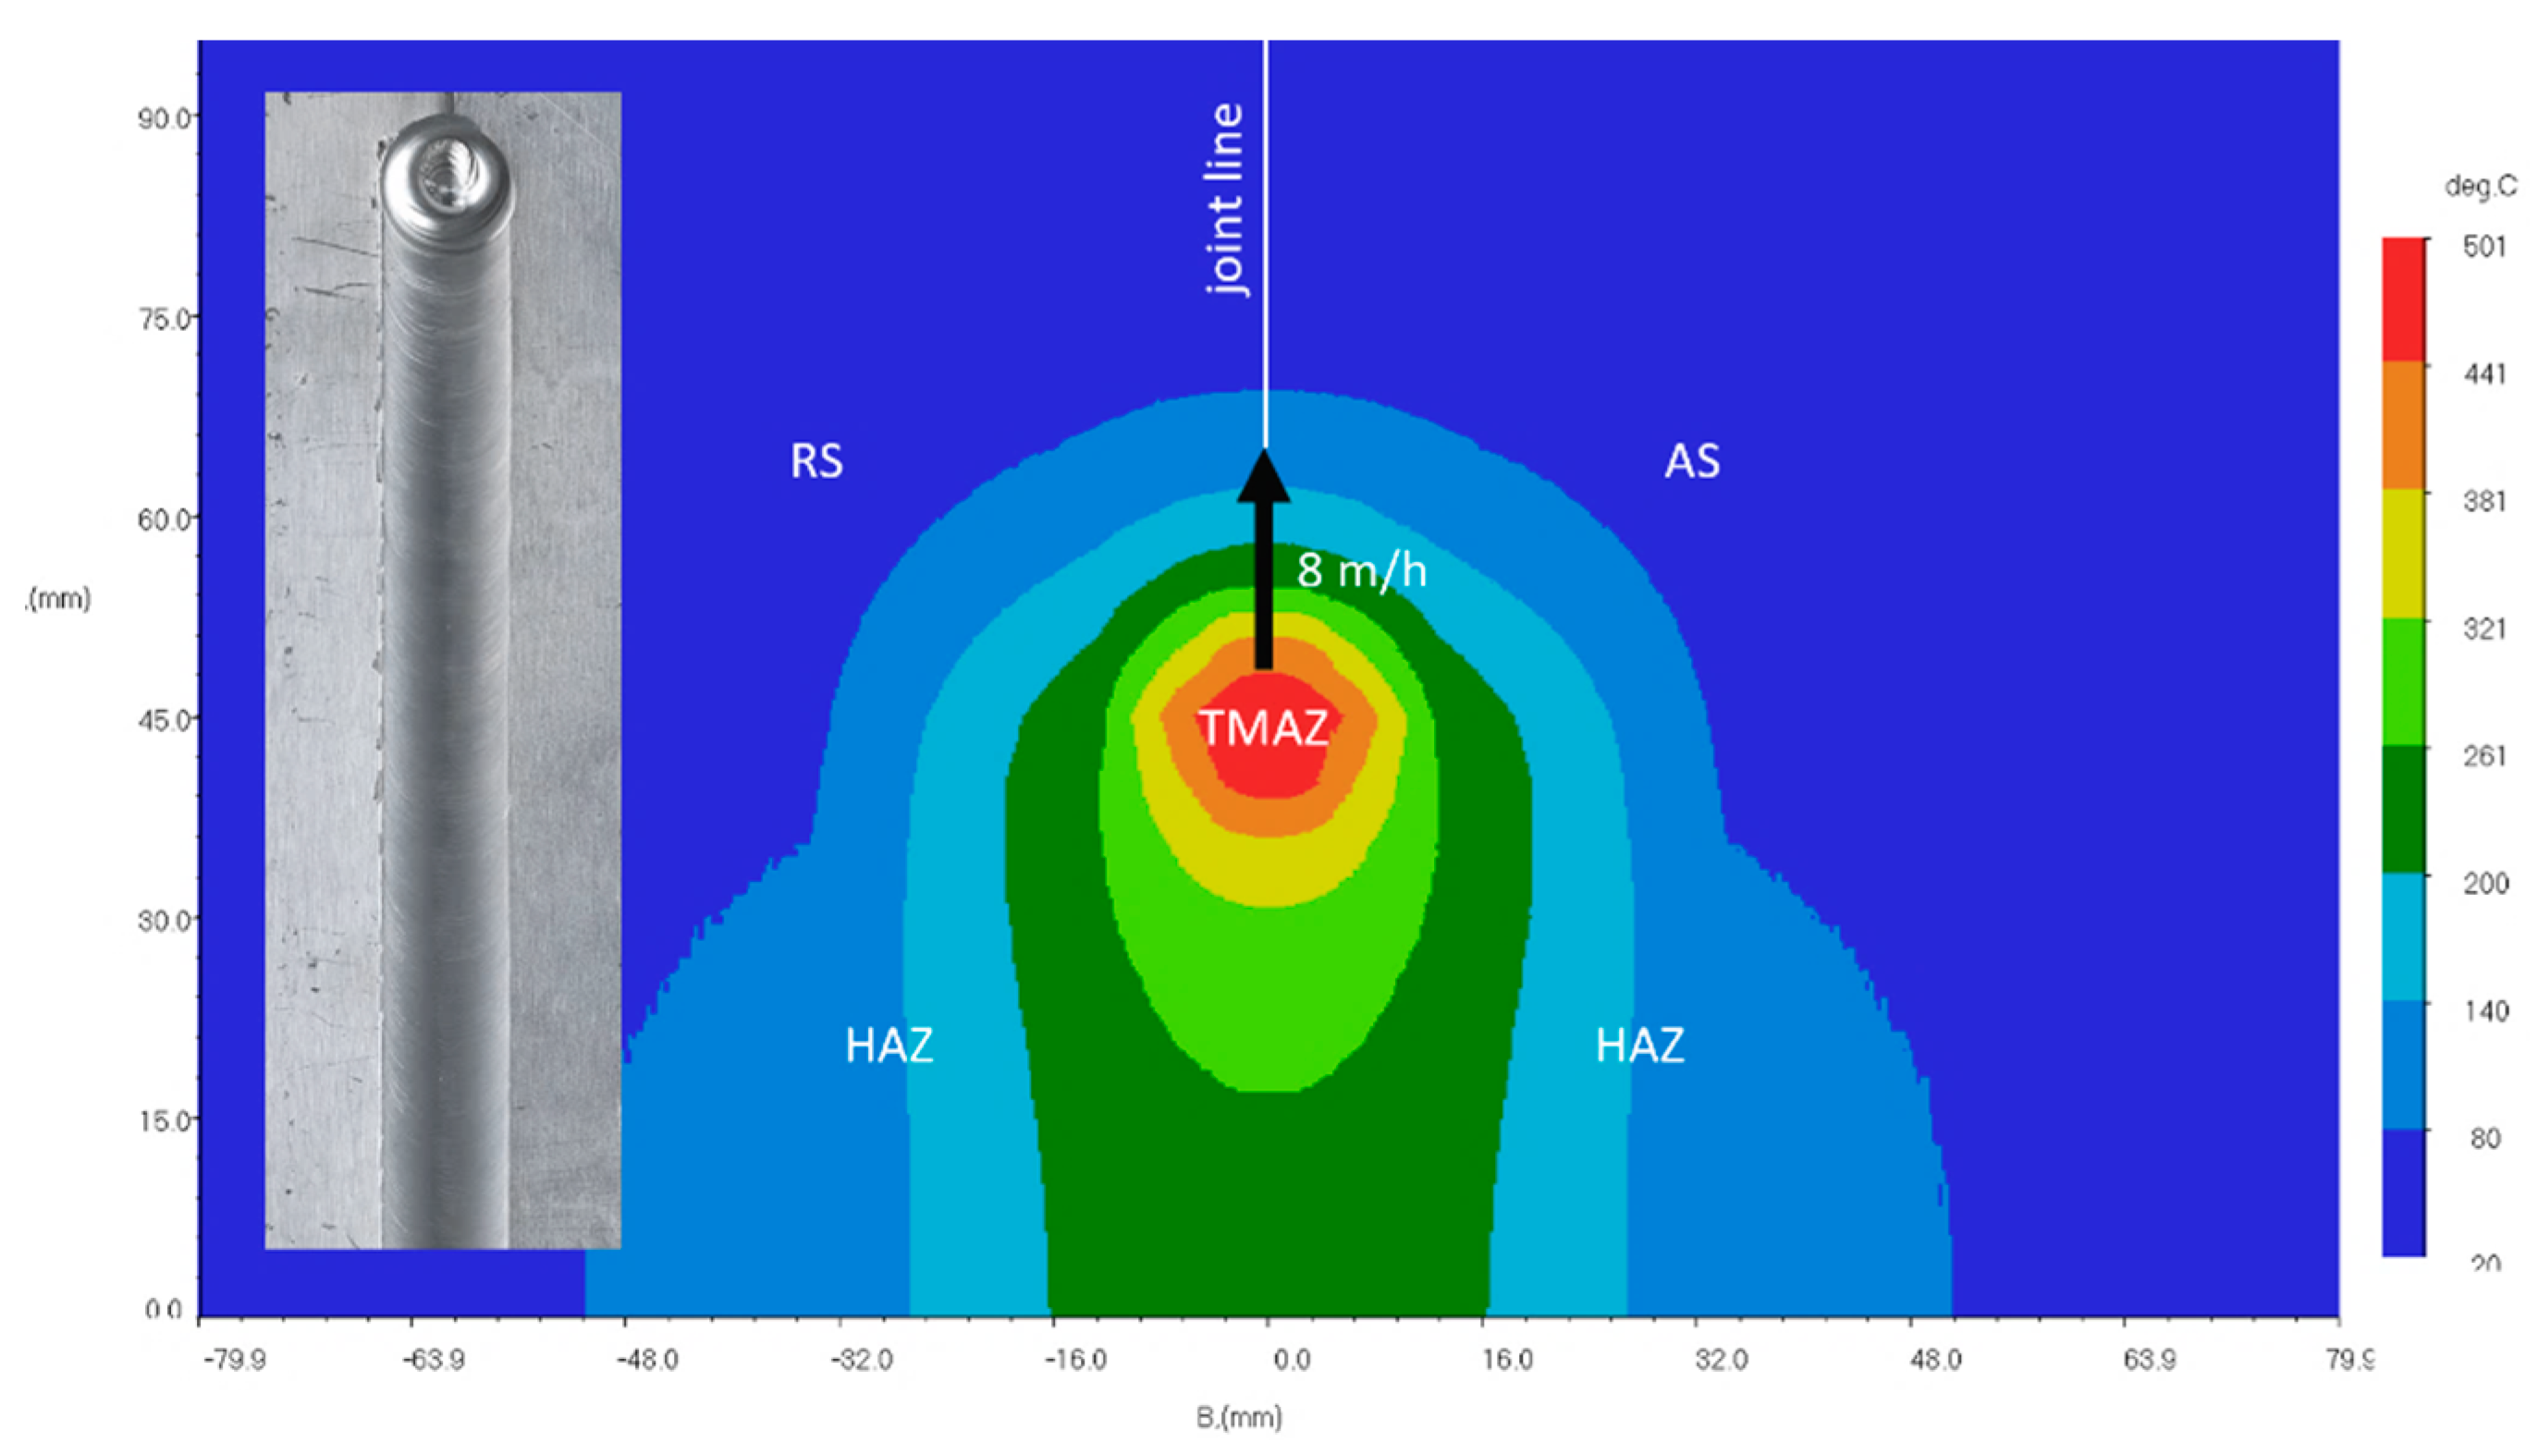
Figure 12.
Distribution of longitudinal residual stresses (a) and longitudinal plastic deformations (b) in the butt joint of 2-mm-thick magnesium alloy plates at different FSW linear speeds.
Figure 12.
Distribution of longitudinal residual stresses (a) and longitudinal plastic deformations (b) in the butt joint of 2-mm-thick magnesium alloy plates at different FSW linear speeds.
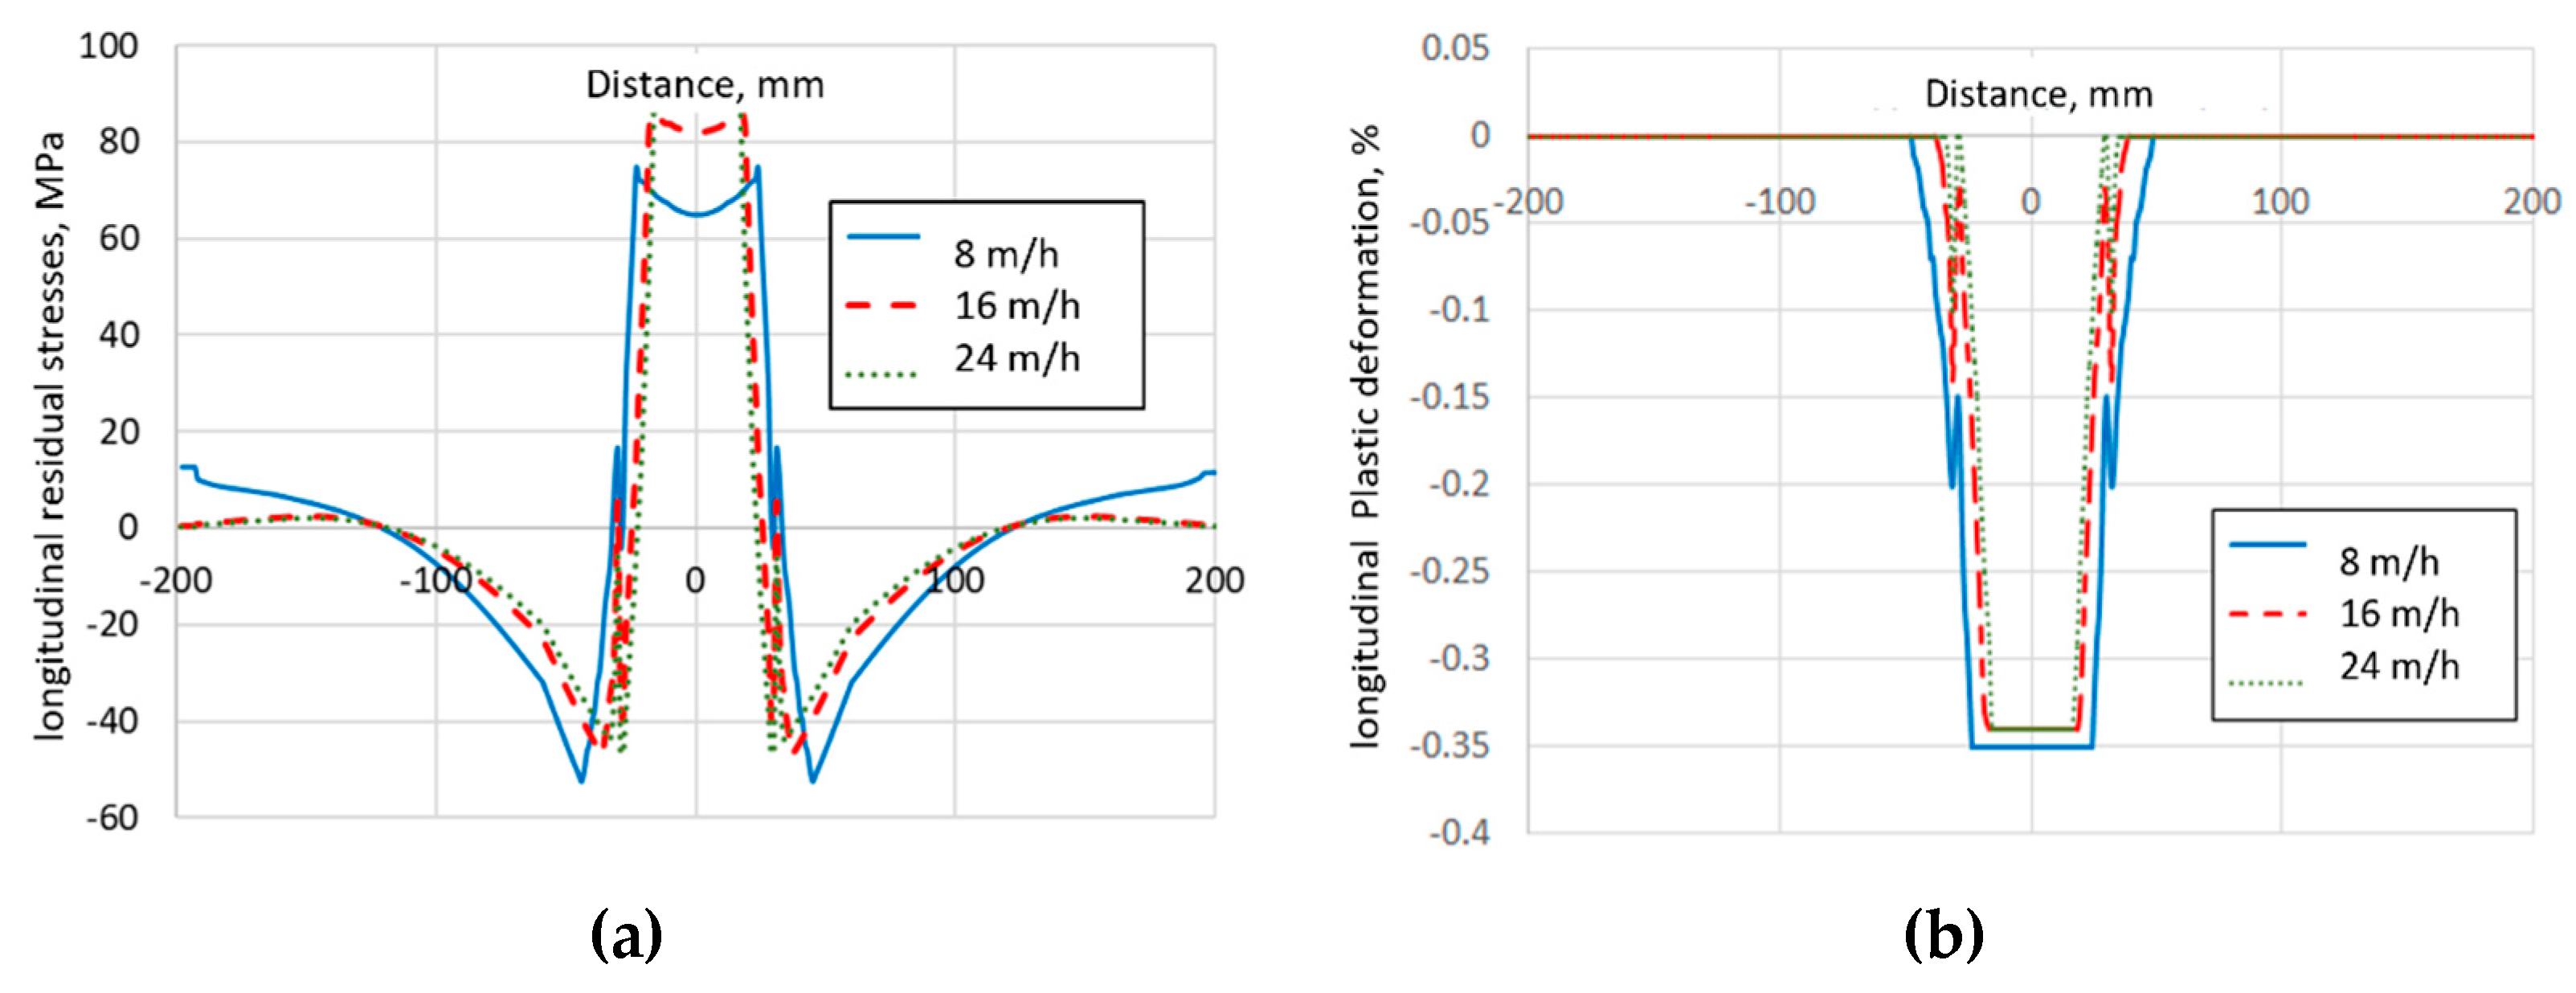

Table 2.
Thermophysical and mechanical properties of magnesium alloy (Тm = 650°C).
| T, °C | Density, kg/m3 | Young’s modulus of elasticity, GPa | Yield strength, MPa | Thermal conductivity coefficient (λ), W/m×°C | Specific heat capacity (с), J/(cm×°C) |
|---|---|---|---|---|---|
| 20 | 1785 | 42 | 140 | 1,02 | 1,80 |
| 100 | 1785 | 40 | 137 | 1,07 | 1,86 |
| 200 | 1761 | 37 | 134 | 1,12 | 1,92 |
| 300 | 1746 | 35 | 129 | 1,18 | 1,98 |
| 400 | 1730 | 32 | 88 | 1,23 | 2,04 |
| 500 | 1714 | 29 | 63 | 1,25 | 2,13 |
Disclaimer/Publisher’s Note: The statements, opinions and data contained in all publications are solely those of the individual author(s) and contributor(s) and not of MDPI and/or the editor(s). MDPI and/or the editor(s) disclaim responsibility for any injury to people or property resulting from any ideas, methods, instructions or products referred to in the content. |
© 2024 by the authors. Licensee MDPI, Basel, Switzerland. This article is an open access article distributed under the terms and conditions of the Creative Commons Attribution (CC BY) license (http://creativecommons.org/licenses/by/4.0/).
Copyright: This open access article is published under a Creative Commons CC BY 4.0 license, which permit the free download, distribution, and reuse, provided that the author and preprint are cited in any reuse.


