
Submitted:
16 December 2024
Posted:
17 December 2024
You are already at the latest version
Abstract
Effect of electroless deposited on (non-anodized and anodized) Al 1050 of: monolayer Ce2O3+Ce2O4; consecutive deposited be-layer Ce2O3+Ce2O4/Ca5(PO4)3OH or consecutive deposited be-layer Ce2O3+CeO2/(AlPO4+AlOOH+CePO4) systems on the indentation modulus (ЕIT) and hardness (HIT), as well as their corrosion-protective ability were investigated. For structural, chemical, electrochemical and mechanical characterization of the investigated systems following methods were used: scanning electron microscopy (SEM), energy dispersive X-rays analysis (EDXS), X-ray photoelectron spectroscopy (XPS), polarization resistance (Rp), corrosion rate (CR) analysis, and Nanoindentation. It was found that the HIT and ЕIT of the coatings deposited on an anodized aluminum substrate were much higher than those deposited on a non-anodized alumi-num substrate. It is established a specific influence of the morphology and chemical composition of formed conversion layers on HIT and EIT as well as as on the improvement of corrosion-protective effect of these layers. The obtained results are valuable, since there are no data on the mechanical properties of such coatings in the literature up to this point.
Keywords:
aluminum
; anodization
; ceria/phosphate conversion coatings
; corrosion
; mechanical properties
; nanoindentation
1. Introduction
The deposition of mono- and multilayer functional coatings on different type of metal substrates is commonly accepted practice. In particularly corrosion-protective metal and/or oxide layers are applied on the “active” from corrosion point of view metal`s and alloy`s substrates have wide application. At this each protective layer has its own specific function. Specific, for example, is the influence of widely applied ceria layers deposited on different types of Al alloys [1,2,3,4,5,6,7,8,9,10,11,12,13,14,15,16,17]. It is proven that ceria oxide conversion coatings (СOCС) deposition on Al is driven by the potential opportunity to replace [18,19,20,21,22,23] highly effective but strongly toxic and carcinogenic Cr6+ containing conversion layers [24]. It is necessary to note that the ceria conversion layers, upon drying (due to the removal of crystal water in the ceria layers) [25,26] form cracks and pores, which to a certain extent reduce their corrosion-protective ability. In connection with the elimination of this effect, a number of studies and successful solutions have been carried out, based on the modification of the COCC with various direct [27] or post-treatment operations. based on Na3PO4, NH4H2PO4, NaH2PO4, etc. solutions [28,29,30,31].
Recently, the highly effective application of hydroxyapatite/Ca5(PO4)3OH (marked below shortly as CaPhL) as a chemically deposited corrosion-protective coating on aluminum (deposited on a steel substrate by Wire Arc Sprayed Aluminum Coatings process) was investigated and proven. In this case, direct immersion phosphating of aluminum (in mixed NaH2PO4 and Ca(NO3)2 solution) was applied, which was carried out without prior formation of COCC on it [32,33,34,35]. In subsequent studies aimed at reducing energy consumption and increasing the environmental friendliness of technological processes, the positive protective effect of CaPhL was also confirmed in the deposition of much thinner conversion layers on (non-anodized and anodized) Al 1050 aluminum substrates. Moreover, the deposition of CaPhL was combined with the prior formation of a protective COCC layer on this substrate [36,37,38]. In parallel to these studies, results comparing the corrosion-protective behavior of phosphate coatings formed on Al 1050 during its chemical surface treatment in NH4H2PO4 solution[37] (marked below shortly as NH4PhL).were obtained [37].
The studies noted above characterize some of the possibilities for successful replacement of environmentally unsuitable and toxic corrosion-protective coatings on aluminum through the application and combination of ceria and phosphate conversion coatings. The assessments of these capabilities are based on the analysis of the changes occurring in their physicochemical properties, established in the publications cited above. In our opinion, however, these assessments are not able to fully characterize their protective capabilities if some of their physicomechanical properties are not quantitatively investigated. This assumption is related to the above-mentioned ceria and phosphate layers modifying the surface of Al 1050, which are characterized by specific structural features and defects. In the context of these considerations, the search and establishment of possible interrelations between physicochemical and physicomechanical properties of the studied systems is necessary. They can be established, clarified and commented on in cases where the occurring changes in the morphology, structure, chemical and phase composition as well as some of the physicomechanical properties of the studied systems are analyzed and compared explicitly in qualitative and quantitative aspects. An initiating example in this regard are the results presented in [39,40] , in which results were obtained and commented on, convincingly illustrating сorrelations between microstructure, hardness and corrosion. In connection with the above comments, the aim of the present study was to characterize, through nanoindentation experiments, two of the main mechanical properties of the mono- and bi-layer conversion coatings discussed above – Indentation modulus (EIT) and Indentation hardness (HIT). The results obtained from these measurements were compared with the data from the physicochemical and corrosion studies carried out on the same samples.
2. Materials and Methods
The cerium oxide(s) (Ce2O3 and CeO2) conversion coatings (CОСC), obtained by chemical immersion treatment, were deposited on substrates of “technically pure” Al 1050 (containing 0.40% Fe, 0.25% Si, 0.05% Mn, 0.05% Cu, 0.07% Zn, 0.05% Mg) selected as a model object by us as it finds wide range of applications as a construction material. The studied samples of dimensions 2.5×2.5×0.1 cm, were cut out of rolled Al 1050 sheets. Their pre-treatment, as described in [8], involved consecutively degreasing in organic solvent and etching in 1.5 M NaOH. (The abbreviator of these samples/substrates in the further text is “S1” (See also Table 1).
In the case when S1 is additionally anodized in solution of sulphuric acid (15% H2SO4; 15°C; 1.5 A.dm2; 48 min, thickness of Al2O3 ≈ 18 µm) the abbreviator of sample is market by “`”, i.e. as S1`).
The formation of COCC on S1 was implemented in a solution containing 0.5 M CeCl3 x 7H2O + 1 x 10⁻⁵ M CuCl2 x 2H2O (at a temperature 25 oC and with a time of immersion 2 h). No H2O2, or other type of oxidizing agent, was added [9,10]. (The abbreviator of these samples in the further text is “S2”. In the cases when S1 is additionally anodized the abbreviator is “S2`”). The thickness of the deposited COCCs was 110 nm (as measured from XPS in-depth profiles, displaying in detail the change of the ratio between the elements Ce, Al and O in the depth of COCC [10]).
After formation of COCC, the specimens were rinsed fully in distilled water, dried and post-treated in mixed 0.5 M NaH2PO4 + 0.1 M Ca(NO3)2 solution, according to procedure, described in [36] prior to exposure and investigation in model corrosion medium of 0.1 M NaCl (CM). The thickness of the so deposited phosphate layers is ~ 1 µm (measured by SEM observations of cross sections of the samples). (The abbreviator of these samples in the further text is “S3”). In the cases when S1 substrate is additionally anodized the abbreviator is “S3`”. Similar procedure was realized in the case when Al substrate(s) (non anodized or anodized), after formation of COCC, where post-treated in solution of 0.22 M NH4H2PO4 (Alfa Aesar), applied and studied in details as described in [37]. (The abbreviators of these samples in the further text are “S4” and “S4`”, respectively - Таble 1).
The surface morphology, structure and chemical composition (in mass %) in the bulk of the studied systems were investigated by electron microscopy (JEOL JSM 6390, Tokyo, Japan) under the conditions of secondary electron image (SEM), back-scattered electrons (BEI) and characteristic energy dispersive X-rays analysis (EDXS) as it is described in [6,8,10,30,31]. The X-ray photoelectron spectroscopy (XPS) was carried on an AXIS Supra electron spectrometer (Kratos Analytical Ltd., Manchester, UK) using achromatic Al-Kα radiation with photon energy of 1486.6 eV. The analyzed area(s) was 0.3 x 0.75 mm2. The chemical composition (in at. %) and the state of the elements of cerium-based COCC on anodized Al 1050 were examine and determined for the as-deposited samples and after their post-treatment in mixed 0.5 M NaH2PO4 + 0.1 M Ca(NO3)2 or 0.22 M NH4H2PO4 solutions (Figure 1, Table 2, Table 3 and Table 4).
The polarization resistance (Rp, Ω.cm2), as well as the corrosion rate (CR, μm/year) of the studied samples (showed on Table 5) were carried out on Gamry Interface 1000 (Software and Frequency Response Analyzer EIS300, Warminster, PA, USA). The scan range was 15 mV relative to Ecorr. The initial delay was 15 min, and the temperature was 25°C +/- 0.5°C. Rp of the coatings was calculated by the Stern-Geary equation [41], which is based on the fact that a higher Rp value (in Ω cm2) corresponds to higher corrosion resistance and to lower corrosion current (icor) as well, i.e., Rp ~ 1/icor. The results obtained with this method are highly relevant to standard measurements conducted in natural corrosion conditions.
The mechanical properties (HIT and EIT) of electroless deposited (on non-anodized and anodized technically pure Al 1050 substrate(s)) thin mono- and multi-layer (based on mixed: Ce2O3+Ce2O4 – b and b` [6,7,8,9,10]; Ca5(PO4)3(OH) + CePO4 + AlPO4 + Al(OH)3 – c and c` [36,38]; AlPO4 and AlOOH, CePO4, as well as PO3-, P2O5 and P4O10 compounds with Al and Се – d and d` [29,30,31,37]) coatings showed on Figure 3 and Figure 4 were investigated by means of nanoindentation experiments according to the ISO 14577 standard [42], using a Nanoindenter G200 (KLA Corporation, Milpitas, CA, USA) with a Berkovich tip. Indentation method with depth control, depth limit of 60 nm and 10s peak hold time at maximum load was used. 25 indentations of all investigated samples were made.
3. Results and Discussion
3.1. SEM, EDS and XPS data Subsection
Figure 1 shows SEM observations of the surface of obtained conversion layers, deposited on Al 1050: after its pre-treatment in 1.5 M NaOH – (a) – sample S1 and after anodization of S1in 15% H2SO4 – (a`) – sample S1` (See Table 1). Their immersion treatment in solution of 0.5 M CeCl3 x 7H2O + 1 x 10⁻⁵ M CuCl2 x 2H2O are marked on Figure 1 as (b) S2 and (b`) S2`, respectively. The samples S2 and S2`followed by post-treatments sealing in mixed 0.5 M NaH2PO4 + 0.1 M Ca(NO3)2 are marked as (c) and (c`) – S3 and S3`, respectively. And the samples S2 and S2`followed by sealing post-treatment in 0.22 M NH4H2PO4 solutions are marked on Figure 1 as (d) and (d`) – S4 and S4`, respectively.
From the presented results, it appears that the alkaline etching of Al 1050 (Figure 1a) and its anodization (Figure 1a`) in greatest degree are built of spherical agglomerates. They are relatively uniformly distributed over the entire surface, reproducing the profile of the Al substrates. Therefore, the roughness and the rigidity determined by the mechanical treatment of the rolled Al 1050 sheet/substrate influence in a specific way the formation of the chemically deposited COCC [10]. The results presented in Figure 1a,a` and Figure 1b` show that the formed COCC on the anodized Al (the system S2/b`) essentially reproduces the anodized Al substrate’s (S1/a`) topology – a conclusion that was also established and elucidated in [43,44]. The structural changes of sealing post-treated samples S2 and S2` in mixed 0.5 M NaH2PO4 + 0.1 M Ca(NO3)2 solution lead to the formation of a calcium phosphate layer (CaPhL) on S3 and S3`[36]. Moreover, its morphology and structure differ significantly from that of the COCC layers deposited on S2 and S2` (Figure 1b,b`). In S3, the agglomerates forming the phosphate layer are larger and more strongly striated by cracks (Figure 1(c)) compared to the ceria layers formed on S2 (Figure 1b). At the same time, the deposited CaPhL layers on sample S2` - the S3` system - are built up of a regular network of cracks, the width of which is several times smaller (Figure 1c`) compared to the S3 system. Specific are the changes of the surface morphology and structure of (coated by COCC) samples S2 and S2` after their sealing post-treated in 0.22 M NH4H2PO4 solution (forming NH4PhL layer). The results obtained in this case are shown on Figure 1d,d`. From them, it can be seen that the deposited NH4PhLs layers reproduce the morphology of the non-anodized and anodized aluminum substrates S1 and S1` (Figure 1a,a`). The NH4PhL deposited on S2 (Figure 1b) contains numerous pores and cracks (Figure 1d), whereas on the S2, i.e. on the anodized substrates, similar defects are not observed (see Figure 1a`,b`,d`).
Chemical composition in the bulk of the studied systems determined by EDS analysis (in weight %) is shown in Table 2 (and under the photographs in Figure 1). In parallel with these studies, XPS analyses (Table 3) were performed on the same samples, illustrating the surface concentration (in atomic %) and the chemical state of the elements constituting the formed conversion coatings. By duplicating and comparing the results of the two analysis methods, we aimed to establish possible differences in the chemical composition and chemical state of the elements along the depth of the conversion layers: on the surface (the zone in which the corrosion processes mainly develop) and in depth (the zone in which the chemical and phase compositions determine their physico-mechanical properties).
The comparison of the changes in the concentrations of the elements Ce, Ca and P characteristic of the formed conversion layers, registered in the EDS analyses (Table 2) shows that the concentration of Ce changes insignificantly in all the studied samples, varying in the range of 2.0 – 3.1 wt. %. About four times greater (on the anodized substrates) is the change in the Ca content in samples S3 and S3` (СS3: СS3` = 0.8:3.1% , respectively), while the change in the concentration of P is even more pronounced in samples S3 and S3` (СS3: СS3` = 5.1:21.6%) and to a lesser extent in samples S4 and S4` (СS4: СS4`=` 0.8:2.3 %). (The registered presence of Fe, S and Cl is due to: the manifestation of traces of Fe as a component of Al 1050; residual traces of S, after washing the anodized Al 1050 in H2SO4, are due to the difficult washing of H2SO4 from the pores of the anodized samples; residual traces of Cl- are a component of the ССОС deposited on the studied samples).
The results of XPS analyses (Table 3) characterize the concentration distribution of the characteristic elements of the conversion cerium oxide and phosphate coatings in a somewhat different manner. The analysis of the obtained data shows that the concentration of Ce on the surface of S2 is 15.8 at.%, while on the anodized Al – S2` – it is more than fifteen times lower (0.9 at.%). In samples S3 and S3` the concentration of Ce decreases to 0.5, respectively – 0.4 at.%, while the concentration of Ca in both samples (unanodized and anodized) is 1.7 at. %. The P concentrations are 11.6 (on unanodized substrate) and 17.9 at.% (on anodized substrate), respectively. XPS analysis of these samples also registered the presence of the elements Na (0.6 at.% for S3 and 0.2 at. % for S3`), and N (1.0 at.% for S3 and 2.1 at. % for S3`). The registration of these two elements also indicates the presence of additional Na and N containing phases on the surface of the conversion layers of the systems S3 and S3` (Table 4). In samples S4 and S4`, subjected to sealing post-treatment only in 0.22 M NH4H2PO4, the concentration of cerium in the cerium-containing phases is very close - 1.4 at. % in S4 and 1.3 at. % in S4`. The concentration of P is 14.1 at. % in S4 and 6.5 at. % in S4`. In sample S4`, the presence of 4.5 at. % N is also registered, respectively, in phases in which N is present (see Table 4).
Based on the results obtained from XPS analyses of the chemical composition and chemical state of the elements found in the studied samples, the most probable phases that were formed during the directed preparation of the modeled corrosion protection systems on Al 1050 were defined. The chemical formulas of these phases are presented in Table 4. According to these data, the physico-mechanical (HIT and EIT) and physico-chemical (Rp and CR) properties, respectively behavior, of the studied samples depend on the presence and concentrations of: Al2O3, Се2О3 and СеО2 for S2 и S2`; Al2O3, AlPO4, AlOOH, Се2О3, CePO4, NaH2PO4, Ca(PO4)3(ОH) and Ca(NO3)2 for S3 and S3`; AlPO4, CePO4, PO3-, P2O5(P4O10) and NaH2PO4 for S4 and S4`.
The quantitative characterization of the concentration of the characteristic elements (Ce, Ca, P) found in the volume (EDS) of the formed conversion layers is presented in Table 2. According to these data, their arrangement in descending order, for each of the studied systems (or their concentration in the chemical compounds formed by them), is the following:
Ce: S2 > S2` > S4` > S3 = S3` > S4;
Ca: S3` > S3;
P: S3` > S3 > S4` > S4.
The similar characterization can represent for the quantitative characterization of the concentration of the characteristic elements found on the surface (XPS) of the formed conversion layers presented in Table 3.
Ce: S2 > S4 > S4` > S2` > S3` > S3`;
Ca: S3 = S3`;
P: S3` > S4 > S3;
Na: S3 > S3`;
N: S4` > S3` > S3.
3.2. Polarization Resistance and Corrosion Rate of the Studied Systems
The results obtained regarding the corrosion resistance Rp and the corrosion rate CR for the studied systems are presented in Figure 2 and Table 5. Figure 2a shows the results for the change in Rp for samples S1 – S4 (formed on unanodized Al 1050) with a standard increase in the exposure time of the samples (up to 168 h) in CM. It can be seen from them that the highest value for Rp at the initial moment of exposure (till 15 min) is characterized by sample S1 (Rp ≈ 350 Ωcm2), while the most resistant and reaching the highest value after 168 h of exposure in CM is sample S4 (Rp ≈ 690 Ωcm2). For samples S1` – S4` (formed on anodized Al 1050 substrates), both in terms of absolute value of Rp and in terms of resistance, upon prolonged exposure to CM, the results differ by orders of magnitude (Figure 2b). From them it can be seen that in the initial moments of exposure (till 15 min – 24 h) Rp for S1` is characterized by values of the order of ≈ 8.5x10⁵ Ω cm2), after which it decreases sharply and after only 168 hours of exposure in CM it reaches ≈ 1.8x10³ Ω cm2. Sample S3` (≈ 10x106 Ω cm2) has the highest and relatively weak (up to the 168-th hour of exposure in the CM) changing values for Rp. Compared to S3`, sample S4`, at the initial moment of exposure in CM, is characterized by a value of the order of 1.4x10⁶ Ω cm2, which gradually increases and only after the 168th hour of exposure reaches ≈ 10x106 Ω cm2. Rp of sample S2` practically does not change throughout the entire time interval of exposure in CM, characterized by values Rp ≈ 0.6x10⁶ Ω cm2.
The changes in the corrosion rate (CR) of the studied samples and the values for Rp (compared in numerical terms) as a function of the exposure time in CM (systematized in Table 5) show that:
- -
- For the unanodized Al 1050 substrate (sample S1), Rp (after 15 min and 168 h, respectively exposure in CM) decreases about three and a half times (3.5x10² vs. 1.0x10²), which leads to a more than threefold increase in CR (0.8 vs. 2.8 µm/y).The sealing treatment in ceria containing solution (leading to the formation of COCC on S1 – sample S2) decreases Rp about more of an order (2.6.102 vs. 1.4x101) which leads to the fact of about twenty times (1.1 vs 21 µm/year) increase of CR.
- -
- For the sample S3 Rp decreases strongly (1.1x101 vs 2.2x10²) and CR decreases about twenty times (25 vs. 1.3 µm/y).
- -
- For the sample S4 Rp increases about five times (1.4x10² vs 6.9x10²) and CR decreases five times (2.0 vs. 0.4 µm/y).
The similar, but in more strong degree, are analogous tendencies for the samples S1`, S2`, S3` and S4` for which the values are quite higher (See Table 5).
The variation of Rp and CR (up to 7 orders of magnitude – Table 5) depending on whether the studied protective conversion systems are implemented on a non-anodized or anodized substrate is impressive. An interesting example in this regard are samples S2 and S2`. While CR for as deposited samples S2 increases ~ 20 times after 168 hours of exposure in CM, for sample S2` this ratio in the corrosion rate is practically the same, although 4 orders of magnitude lower compared to the S2 system (effect more probably connected with formation of non soluble corrosion products on the sample`s surface). These results suggest that the cause of this effect is due to the presence of deep pores and cracks in the protective COCC coating on sample S2 (Figure 1b and the absence of such on sample S2` (Figure 1b`. A very significant contribution to this effect is also made by the Al2O3 layer formed during the anodization of Al 1050. This assumption is supported by the results (Figure 1c,c`,d,d`), obtained with additional post-sealing treatments, realized at S3 and S3`, and S4 and S4`, respectively, which blocked pores and cracks in COCC conversion layers [36,37,38].Confirming this assumption are the results presented in Fig. 2. Moreover, they provide grounds for the conclusion that for the non-anodized substrates (samples S1, S2, S3 and S4) the secondary sealing treatment of COCC by NH4H2PO4 solution (forming NH4PhL layer) (see sample S3 on Figure 2a) is more effective while for the anodized Al 1050 substrates sealed by COCC (S1`, S2`, S3` and S4`) more effective is secondary sealing treatment in mixed NaH2PO4 + Ca(NO3)2 solution (forming CaPhL layer) (see sample S3` on Figure 2b).
3.3. Nanoindentation Investigations
As a results from nanoindentation experiments were obtained the experimental load-displacement curves and were calculated two mechanical properties of investigated coatings and their substrates-indentation hardness HIT and indentation modulus EIT, using approximation method of Oliver and Pharr [45]. The results are shown on Figure 3 and Figure 4.
Our investigations showed that the indentation hardness and modulus of the coatings deposited on an anodized aluminum substrate were much higher than those deposited on a non-anodized aluminum substrate. The possible reason is the formed on the substrate surface hard Al2O3 film.
The highest indentation hardness and modulus of all samples is found in sample S1` (the anodized substrate), due to the influence of the hard Al2O3 layer formed during the anodization of Al 1050 and the lack of soft ceria (mix of Ce2O3 and CeO2) layer in the composition, which is present in all investigated coatings. As the nanoindentation experiments have been made at very small depth of indentation (only 60 nm), we don’t expect to have influence of the substrate with exception of sample S2, where the thickness of the coating is 110 nm only. The influence of the hard anodized substrate is one of the reasons why sample S2` has a higher hardness than samples S1, S2, S3, S4 and S3`. Since the concentration of soft ceria on the surface of S2 is 15.8 at.%, (Table 3) while on the anodized Al – S2` – it is more than fifteen times lower (0.9 at.%), this is another reason for the higher hardness of sample S2` compared to S2, and a third factor that has an influence is the presence of pores and cracks in sample S2, which are not present in sample S2`. In samples S3 and S3`, the ceria concentration decreases to 0.5, respectively – 0.4 at.%. This is the reason for the slightly higher hardness of sample S3` compared to S3 (Figure 3). In samples S4 and S4`, subjected to sealing post-treatment only in 0.22 M NH4H2PO4, the concentration of cerium in the cerium-containing phases is 1.4 at. % in S4 and 1.3 at. % in S4` (Table 3). This is another reason for the greater hardness of sample S4` compared to S4 (Table 3). The presence of cracks, pores and defects, as well as the phase composition, also influences the mechanical properties. S3` contains numerous pores and cracks, while in sample S4` similar defects are not observed. This is probably one of the reasons why sample S4` is harder than S3`(Figure 1). Another possible reason why sample S4` is harder than S3` and S2` is the influence of the PO3- and P4O10 phases, present only in sample S4`. Also, due to the three times lower concentration of soft aluminum in its composition, S4` is harder than S2`. It can be seen from the SEM images and EDS analysis of studied samples (Fig.1) that the chemical composition and content in different points (Figure 1, analysis “in point” 1, 2, 3, 4, 5 and 6 at high magnification – 300 000x) on the sample`s surface is different, which means inhomogeneity of the sample surface, which is the main reason for the large confidence intervals of the experimental results of nanoindentation, which are visible on Figure 3 and Figure 4. Another reason is the high roughness of the samples surfaces.
We found literature data for mechanical properties of such films from nanoindentation experiments only of hydroxyapatite or calcium phosphate films, mainly for biomedical applications, deposited in most cases on titanium, silicon wafers or steel substrates [46,47,48,49,50] by means of other deposition techniques (micro-arc oxidation, pulsed laser deposition, microplasma spraying, radio-frequency (RF)-sputtered ). The different deposition techniques and substrates lead to different structure of the obtained films, respectively different mechanical properties. In addition to the scarcity of literature data about mechanical properties of such films, this determines the importance of the present study. Our results about the hydroxyapatite films are in good agreement with the results, obtained by Dey and coauthors [49].
Authors should discuss the results and how they can be interpreted from the perspective of previous studies and of the working hypotheses. The findings and their implications should be discussed in the broadest context possible. Future research directions may also be highlighted.
4. Conclusions
In present work we investigated the mechanical properties and corrosion resistance of thin ceria and phosphate mono- and multilayers, deposited on technically pure Al 1050. SEM, EDS, XPS, Rp, CR and nanoindentation methods were used for structural, chemical, electrochemical and mechanical characterization of the investigated systems.
Our SEM investigation showed big cracks on the surface especially of the samples S3 and S3`, which affects both their corrosion protection ability and their mechanical properties. The comparison of the changes in the concentrations of the elements Ce, Ca and P, characteristic of the formed conversion layers, registered during EDS analyses, shows that the concentration of Ce changes insignificantly in all studied samples, varying in the range of 2.0 – 3.1 wt.%. The change in Ca content is about four times greater in samples S3 and S3`, while the change in P concentration is even more pronounced in samples S3 and S3` and to a lesser extent in samples S4 and S4`. As a result of XPS studies, it was obtained that the concentration of Ce on the surface of S2 is 15.8 at.%, while on the anodized Al – S2` – it is more than fifteen times lower (0.9 at.%). In samples S3 and S3`, the concentration of Ce decreases to 0.5, respectively – 0.4 at.%, while the concentration of Ca in both samples (unanodized and anodized Al substrates) is 1.7 at.%. The P concentrations are respectively 11.6 (on a non-anodized substrate) and 17.9 at.% (on anodized substrate) as the most probable phases that were formed during the directed preparation of the modeled corrosion protection systems on Al 10 50 are: Al2O3, Се2О3 and СеО2 for S2 and S2`; Al2O3, AlPO4, AlOOH, Се2О3, CePO4, NaH2PO4, Ca(PO4)3(ОH) and Ca(NO3)2 for S3 and S3`; AlPO4, CePO4, PO3-, P2O5(P4O10) and NaH2PO4 for S4 and S4`.
The study of the corrosion resistance Rp and the corrosion rate CR of samples S1 – S4 shows that sample S1 is characterized by the highest value for Rp at the initial moment of exposure, while the most resistant and reaching the highest value after 168 h of exposure in CM is sample S4. In samples S1` – S4`, the highest and relatively weakly changing values for Rp are sample S3`, followed by sample S4’. The study of the mechanical properties of samples S1-S4 shows that their indentation hardness remains almost constant, while for samples deposited on an anodized aluminum substrate (S1` – S4`) the indentation hardness and modulus were much higher than those deposited on a non-anodized aluminum substrate. From the results obtained, we can conclude that the thin ceria and phosphate conversion coatings deposited on anodized aluminum Al 1050 not only protect better from corrosion, but also have improved mechanical properties, which is very important for many applications, for example such as marine applications, total joint replacement, tooth root implantation and others.
Author Contributions
Experimental design, S.C., R.A. and D.S.; Conceptualization, D.S.; methodology, D.S. and S.C..; investigation, S.C and R.A.; resources, D.S and R.A.; data curation, S.C. and R.A.; writing—original draft preparation, D.S.and S.C.; writing—review and editing, D.S.; visualization, S.C and R.A.; supervision, D.S.; project administration, D.S.; funding acquisition, D.S. All authors have read and agreed to the published version of the manuscript
Funding
Equipment supported/obtained under the project INFRAMAT (National Roadmap for Research Infrastructure) financed by Bulgarian Ministry of Education and Science was used in this investigation“, as well as by the European Regional Development Fund within the OP “Science and Education for Smart Growth 2014– 2020”, Project CoE “National Center of Mechatronicsand Clean Technologies“, No BG05M2OP001-1.001-0008-C01; CoC „Clean technologies for sustainable environment – water, waste, energy for circular economy“, (Project BG05M2OP001-1.002-0019), supported by the ERDF within the Bulgarian OP “SESG 2014–2020.“
Institutional Review Board Statement
Not applicable
Informed Consent Statement
Not applicable
Data Availability Statement
Not applicable
Conflicts of Interest
The authors declare no conflicts of interest
References
- Hinton, B. 2009 Frank Newman Speller Award Lecture: Prevention and Control of Corrosion in Aircraft Components—Changesover Four Decades. Corrosion 2010, 66, 0850011–08500115. [Google Scholar] [CrossRef]
- Harvey, T.G. Cerium-Based Conversion Coatings on Aluminium Alloys: A Process Review. Corros. Eng. Sci. Technol. 2013, 48, 248–269. [Google Scholar] [CrossRef]
- Heller, D. K.; Fahrenholtz, W. G.; O’Keefe, M. J. The effect of post-treatment time and temperature on cerium-based conversion coatings on Al 2024-T3. Corros. Sci. 2010, 52, 360–368. [Google Scholar] [CrossRef]
- Girginov, C.; Kozhukharov, S. in: Extended Abstracts of 7th Regional RSE-SEE Symposium on Electrochemistry and 8th Kurt Schwabe Symposium, V. Horvat-Radošević, K. Kvastek, Z. Mandić (eds.), International Association of Physical Chemists, Split, Croatia. 2019, 132.
- Castano, C. E.; Fahrenholtz, W. G.; O’Keefe, M. J. in: Metal oxides, Elsevier`s Book series "Ceria-Based Coatings and Pigments - Synthesis, Properties and Applications", 2020, 211- 257. [CrossRef]
- Andreeva, R.; Stoyanova, E.; Tsanev, A.; Stoychev, D. Corrosion behaviour of anodically formed oxide films on aluminium, sealed in cerium-ions containing solutions. Bulg. Chem.Commun. 2016, 48 (Special Issue B), 96–102. [Google Scholar]
- Andreeva, R.; Stoyanova, E.; Stoychev, D. Study of the Chemical Formation of Cerium Oxide Conversion Layers on Aluminium AD-3. J. Int. Sci. Publ. Mater. Methods Technol. 2014, 8, 751–759. [Google Scholar]
- Andreeva, R.; Stoyanova, E.; Tsanev, A.; Stoychev, D. Influence of the surface pre-treatment of aluminium on the processes of formation of cerium oxides protective films. Journal of Physics: Conference Series 2016, 012049. [Google Scholar]
- Andreeva, R. ; Stoyanova, E; Tsanev, A; Stoychev, D. Effect of cerium ions on the protective ability of Al2O3 films formed anodically during their sealing in aqueous solutions. Bulg. Chem.Commun. 2017; 49 (Special Issue F), 5–14. [Google Scholar]
- Andreeva, R.; Stoyanova, E.; Tsanev, A.; Datcheva, M.; Stoychev, D. On the Role of pre-treatment of Aluminum Substrate on Deposition of Cerium Based Conversion Layers and Their Corrosion-Protective Ability. Int. J. Electrochem. Sci. 2018, 13, 5333–5351. [Google Scholar] [CrossRef]
- Kozhukharov, S.; Girginov, C. Recent trends of the use of rare earth elements for efficient environmentally compliant corrosion protection of aluminum and its alloys. Nanoscience and nanotechnology in security and protection against CBRN threats, 2020, 437-445 in: NATO Science for Peace and Security Series B: Physics and Biophysics, P. Petkov, M. Achour, C. Popov (eds.), Springer, Dordrecht, 2020. [CrossRef]
- Zhu, Q.; Zhang, B.; Zhao, X.; Wang, B. Binary additives enhance micro arc oxidation coating on 6061Al alloy with improved anti-corrosion property. Coatings 2020, 10, 128. [Google Scholar] [CrossRef]
- So, J.; Choi, E.; Kim, J. T.; Shin, J. S.; Song, J. B.; Kim, M. ,... & Yun, J. Y. Improvement of plasma resistance of anodic aluminum-oxide film in sulfuric acid containing Cerium (IV) ion. Coatings 2020, 10, 103. [Google Scholar] [CrossRef]
- Czerwinski, F. Cerium in aluminum alloys. J.Mater. Sci. 2020, 55, 24–72. [Google Scholar] [CrossRef]
- Girginov, C.; Portolesi, S.; Kozhukharov, S.; Tsanev, A.; Lilov, E.; Petkov, P. Selection of appropriate electrochemical deposition regime for cerium conversion coating on anodized AA2024-T3 aircraft alloy. J. Appl. Electrochem. 2024, 54, 1171–1202. [Google Scholar] [CrossRef]
- Girginov, C.; Kozhukharov, S.; Tsanev, A.; Georgieva, M.; Petrova, M.; Lilov, E.; Petkov, P. Influence of the final thermal sealing on the properties of combined anodic alumina/cerium conversion coatings on AA2024-T3 aircraft alloy. J. Chem. Technol. Metall. 2023, 58, 881–896. [Google Scholar] [CrossRef]
- Kozhukharov, S.; Girginov, C.; Portolesi, S. Tsanev, A., Lilova, V., & Petkov, P. Optimal current density for cathodic CeCC deposition on anodized AA2024-T3 aircraft alloy. J. Appl. Electrochem. 2024, 54, 2887–2918. [Google Scholar] [CrossRef]
- Official Journal of the European Union, ‘COMMISSION DIRECTIVE (EU) 2017/ 2096 - of 15 November 2017 - Amending Annex II to Directive 2000/ 53/ EC of the European Parliament and of the Council on End-of Life Vehicles’(2017).
- Official Journal of the European Union, ‘COMMISSION IMPLEMENTING DECISION (EU) 2019/2193 of 17 December 2019 Laying down Rules for the Calculation, Verification and Reporting of Data and Establishing Data Formats for the Purposes of Directive 2012/19/EU of the European Parliament and of the Council on Waste Electrical and Electronic Equipment (WEEE)’ (2019).
- Lukanova, R.; Stoyanova, E.; Damyanov, M.; Stoychev, D. Formation of protective films on Al in electrolytes containing no Cr 6+ ions. Bulg. Chem.Commun. 2008, 40, 340–347. [Google Scholar]
- Andreeva, R.A.; Stoyanova, E.A.; Tsanev, A.S.; Stefanov, P.K.; Stoychev, D.S. Protective ability of cerium-containing conversion films on aluminium. Trans. Inst. Met. Finish 2014, 92, 203–211. [Google Scholar] [CrossRef]
- Andreeva, R.; Stoyanova, E.; Stoychev, D. Study of the chemical formation of cerium oxide conversion layers on Aluminium AD-3. J. Int. Sci. Publ. : Mater. Methods Technol. 2014; 8, 751–759. [Google Scholar]
- Kozhukharov, S.; Girginov, C.; Lilova, V.; Petkov, P. Innovative Applications of Cerium Oxide-Based Materials in Civil Engineering, Automation, and Energy Sectors, 2024, Open access peer-reviewed chapter. [CrossRef]
- S. Wernick, R. Pinner, P. Sheasby, ‘The Surface Treatments of Aluminium and Its Alloys’, 5th edn., ASM M Metals Park, Ohio, 1987. International and Finishing Publications Ltd.
- Hinton, B. R. W.; Arnott, D. R.; Ryan, N. E. Cerium conversion coatings for the corrosion protection of aluminum. Materials Forum 1986, 9, 162–173. [Google Scholar]
- Hughes, A.E.; Gorman, J.D.; Miller, P.R.; Sexton, B.A.; Paterson, P.J.K.; Taylor, R.J. Development of cerium-based conversion coatings on 2024-T3 Al alloy after rare-earth desmutting. Surf. Interface Anal. 2004, 36, 290–303. [Google Scholar] [CrossRef]
- Heller, D.K. Phosphate Post-Treatment of Cerium-Based Conversion Coatings on Al 2024-T3, 2010, Ph.D. Thesis, Missouri Universityof Science and Technology, Rolla, MO, USA.
- Tang, J.L.; Tang, Y.M.; Zuo, Y. Effect of Post-Treatment by Molybdenate on Corrosion Resistance of Cerium-Based Chemical Conversion Film on Aluminum Alloy. Mater. Prot. 2006, 39, 27–28. [Google Scholar]
- Andreeva, R.; Stoyanova, E.; Tsanev, A.; Stoychev, D. XPS characterisation of the influence of phosphate post-treatment of chemically deposited ceria protective layers on aluminum. C. R. Acad. Bulg. Sci. 2019, 72, 1336–1342. [Google Scholar]
- Andreeva, R.; Stoyanova, E.; Tsanev, A.; Stoychev, D. .Influence of the processes of additional phosphate post-treatment of ceria conversion coatings deposited on Al 1050 on their corrosion protective behavior. J. Phys. Conf. Ser. 2020, 1492, 012019. [Google Scholar] [CrossRef]
- Andreeva, R.; Stoychev, D. Corosion charactersation or the influence of phosphate post-treatment of chemically deposited ceria protective conversion coatings on aluminium. C. R. Acad. Bulg. Sci. 2021, 74, 1314–1323. [Google Scholar] [CrossRef]
- Lee, H.S.; Kumar, A.; Mandal, S.; Singh, J.K.; Aslam, F.; Alyousef, R.; Albduljabbar, H. Effect of Sodium Phosphate and Calcium Nitrate Sealing Treatment on Microstructure and Corrosion Resistance of Wire Arc Sprayed Aluminum Coatings. Coatings 2020, 10, 33. [Google Scholar] [CrossRef]
- Lee, H.S.; Singh, J.K.; Ismail, M.A. An Effective and Novel Pore Sealing Agent to Enhance the Corrosion Resistance Performance of Al Coating in Artificial Ocean Water. Sci. Rep. 2017, 7, 41935. [Google Scholar] [CrossRef] [PubMed]
- Lee, H.S.; Singh, J.K. Influence of Calcium Nitrate on Morphology and Corrosion Characteristics of Ammonium Phosphate Treated Aluminum Coating Deposited by Arc Thermal Spraying Process. Corros. Sci. 2019, 146, 254–268. [Google Scholar] [CrossRef]
- Jeong, H.R.; Lee, H.S.; Jalalzai, P.; Kwon, S.J.; Singh, J.K.; Hussain, R.R.; Alyousef, R.; Alabduljabbar, H.; Aslam, F. Sodium Phosphate Post-Treatment on Al Coating: Morphological and Corrosion Study. J. Therm. Spray Technol. 2019, 28, 1511–1531. [Google Scholar] [CrossRef]
- Tsanev, A.; Andreeva, R.; Stoychev, D. Influence of the Chemical Composition of Ceria Conversion Coatings, Sealed in Solution of NaH2PO4 and Ca(NO3)2, on the Corrosion Behavior of Aluminum. Materials 2023, 16, 6499. [Google Scholar] [CrossRef] [PubMed]
- Andreeva, R.; Tsanev, A.; Stoychev, D. Formation of environmentally friendly protective Ce2O3-CeO2 conversion coatings on Al, modified by phosphate layers: chemical and electrochemical characterization. Bulg. Chem. Commun. 2023, 55, 390–406. [Google Scholar] [CrossRef]
- Andreeva, R.; Tsanev, A.; Stoychev, D. Improving the Corrosion Resistance of Anodized Al 1050 Alloy by Sealing in Cerium-Containing and Mixed Sodium Phosphate Mono Basic and Calcium Nitrate Solutions. Metals 2024, 14, 768. [Google Scholar] [CrossRef]
- Ralston, K.D.; Birbilis, N. Effect of Grain Size on Corrosion: A Review. Corosion 2010, 66, 075005–12. [Google Scholar] [CrossRef]
- Wang, S.; Huang, Y.H.; Xuan, F.Z.; Luoet, L.H. Correlation between Microstructure, Hardness and Corrosiopn of Welded Joints of Disc Rotors. Procedia Eng. 2015, 130, 1761–1769. [Google Scholar] [CrossRef]
- Stern, M.; Geary, A.L. Electrochemical Polarization: I. A Theoretical Analysis of the Shape of Polarization Curves. J. Electrochem.Soc. 1957, 104, 56–63. [Google Scholar] [CrossRef]
- ISO 14577-1:2015; Metallic Materials—Instrumented Indentation Test for Hardness and Materials Parameters—Part 1: TestMethod. ISO: Geneva, Switzerland, 2015.
- Kozhukharov, S.V.; Girginov, C.A. Comparative Electrochemical and Topographical Elucidation of Anodic Aluminum Oxide (AAO) Layers Formed on Technically Pure Aluminum (TPA) and AA2024-T3 Aircraft Alloy. Bulg. Chem. Commun. 2018, 50, 13–21. [Google Scholar]
- Girginov, C.A.; Kozhukharov, S. V; Milanes, M.J. Durability of Anodic Aluminum Oxide (AAO) Films Formed on Technically Pure AA1050 Alloy against Corrosion. Bulg. Chem. Commun. 2018, 50, 6–12. [Google Scholar]
- Oliver, W.C.; Pharr, G.M. An improved technique for determining hardness and elastic modulus using load and displacementsensing indentation experiments. J. Mater. Res. 1992, 7, 1564–1583. [Google Scholar] [CrossRef]
- Nelea, V.; Pelletier, H.; Müller, D.; Broll, N.; Mille, P.; Ristoscu, C; Mihailescu, I. N. Mechanical properties improvement of pulsed laser-deposited hydroxyapatite thin films by high energy ion-beam implantation. Appl. Surf. Sci. 2002, 186, 483–489. [Google Scholar] [CrossRef]
- Jie, J.; Shuwei, Z.; Dacai, Z. Corrosion behavior and mechanical properties of FHAP/MAO composite coating on pure titamium substrate prepared by micro-arc oxidation and electrochemical deposition. Rare Metal Mat.Eng. 2019, 48, 1725–1733. [Google Scholar]
- Nelea, V.; Craciun, V.; Iliescu, M.; Mihailescu, I.N.; Pelletier, H.; Mille, P.; Werckmann, J. Growth of calcium phosphate thin films by in situ assisted ultraviolet pulsed laser deposition. Appl. Surf. Sci. 2003; 208–209, 638–644. [Google Scholar] [CrossRef]
- Dey, A.; Mukhopadhyay, A.K.; Gangadharan, S.; Sinha, M.K.; Basu, D.; Bandyopadhyay, N.R. Nanoindentation study of microplasma sprayed hydroxyapatite coating. Ceram. Int. 2009, 35(6), 2295–2304. [Google Scholar] [CrossRef]
- Snyders, R.; Bousser, E.; Music, D.; Jensen, J.; Hocquet, S.; Schneider, J.M. Influence of the Chemical Composition on the Phase Constitution and the Elastic Properties of RF-Sputtered Hydroxyapatite Coatings. Plasma Process. Polym. 2008, 5, 168–174. [Google Scholar] [CrossRef]
Figure 1.
SEM images and EDS analysis of studied samples after: (a) pre-treated of Al 10 50 in NaOH (Al(NaOH)); (b) immersion treatment of Al(NaOH) in 0.5 M CeCl3×7H2O + 1×10⁻⁵ M CuCl2×2H2O; (c) consecutively immersion treatment of Al(NaOH) in 0.5 M CeCl3×7H2O + 1×10⁻⁵ M CuCl2×2H2O and 3x5 min in mixed 0.5 M NaH2PO4 + 0.1 M Ca(NO3)2 solution and 72h exposure in humidity atmosphere; (d) consecutively immersion treatment of Al(NaOH) in 0.5 M CeCl3×7H2O + 1×10⁻⁵ M CuCl2×2H2O and 5 min in NH4H2PO4 solution; (a`) pre-treated in NaOH and anodized Al 10 50 (Alanod); (b`) immersion treatment of Alanod in 0.5 M CeCl3×7H2O + 1×10⁻⁵ M CuCl2×2H2O; (c`) consecutively immersion treatment of Alanod in 0.5 M CeCl3×7H2O + 1×10⁻⁵ M CuCl2×2H2O and 3x5 min in mixed 0.5 M NaH2PO4 + 0.1 M Ca(NO3)2 solution and 72h exposure in humidity atmosphere; (d`) consecutively immersion treatment of Alanod. in 0.5 M CeCl3×7H2O + 1×10⁻⁵ M CuCl2×2H2O and 5 min in NH4H2PO4 solution.
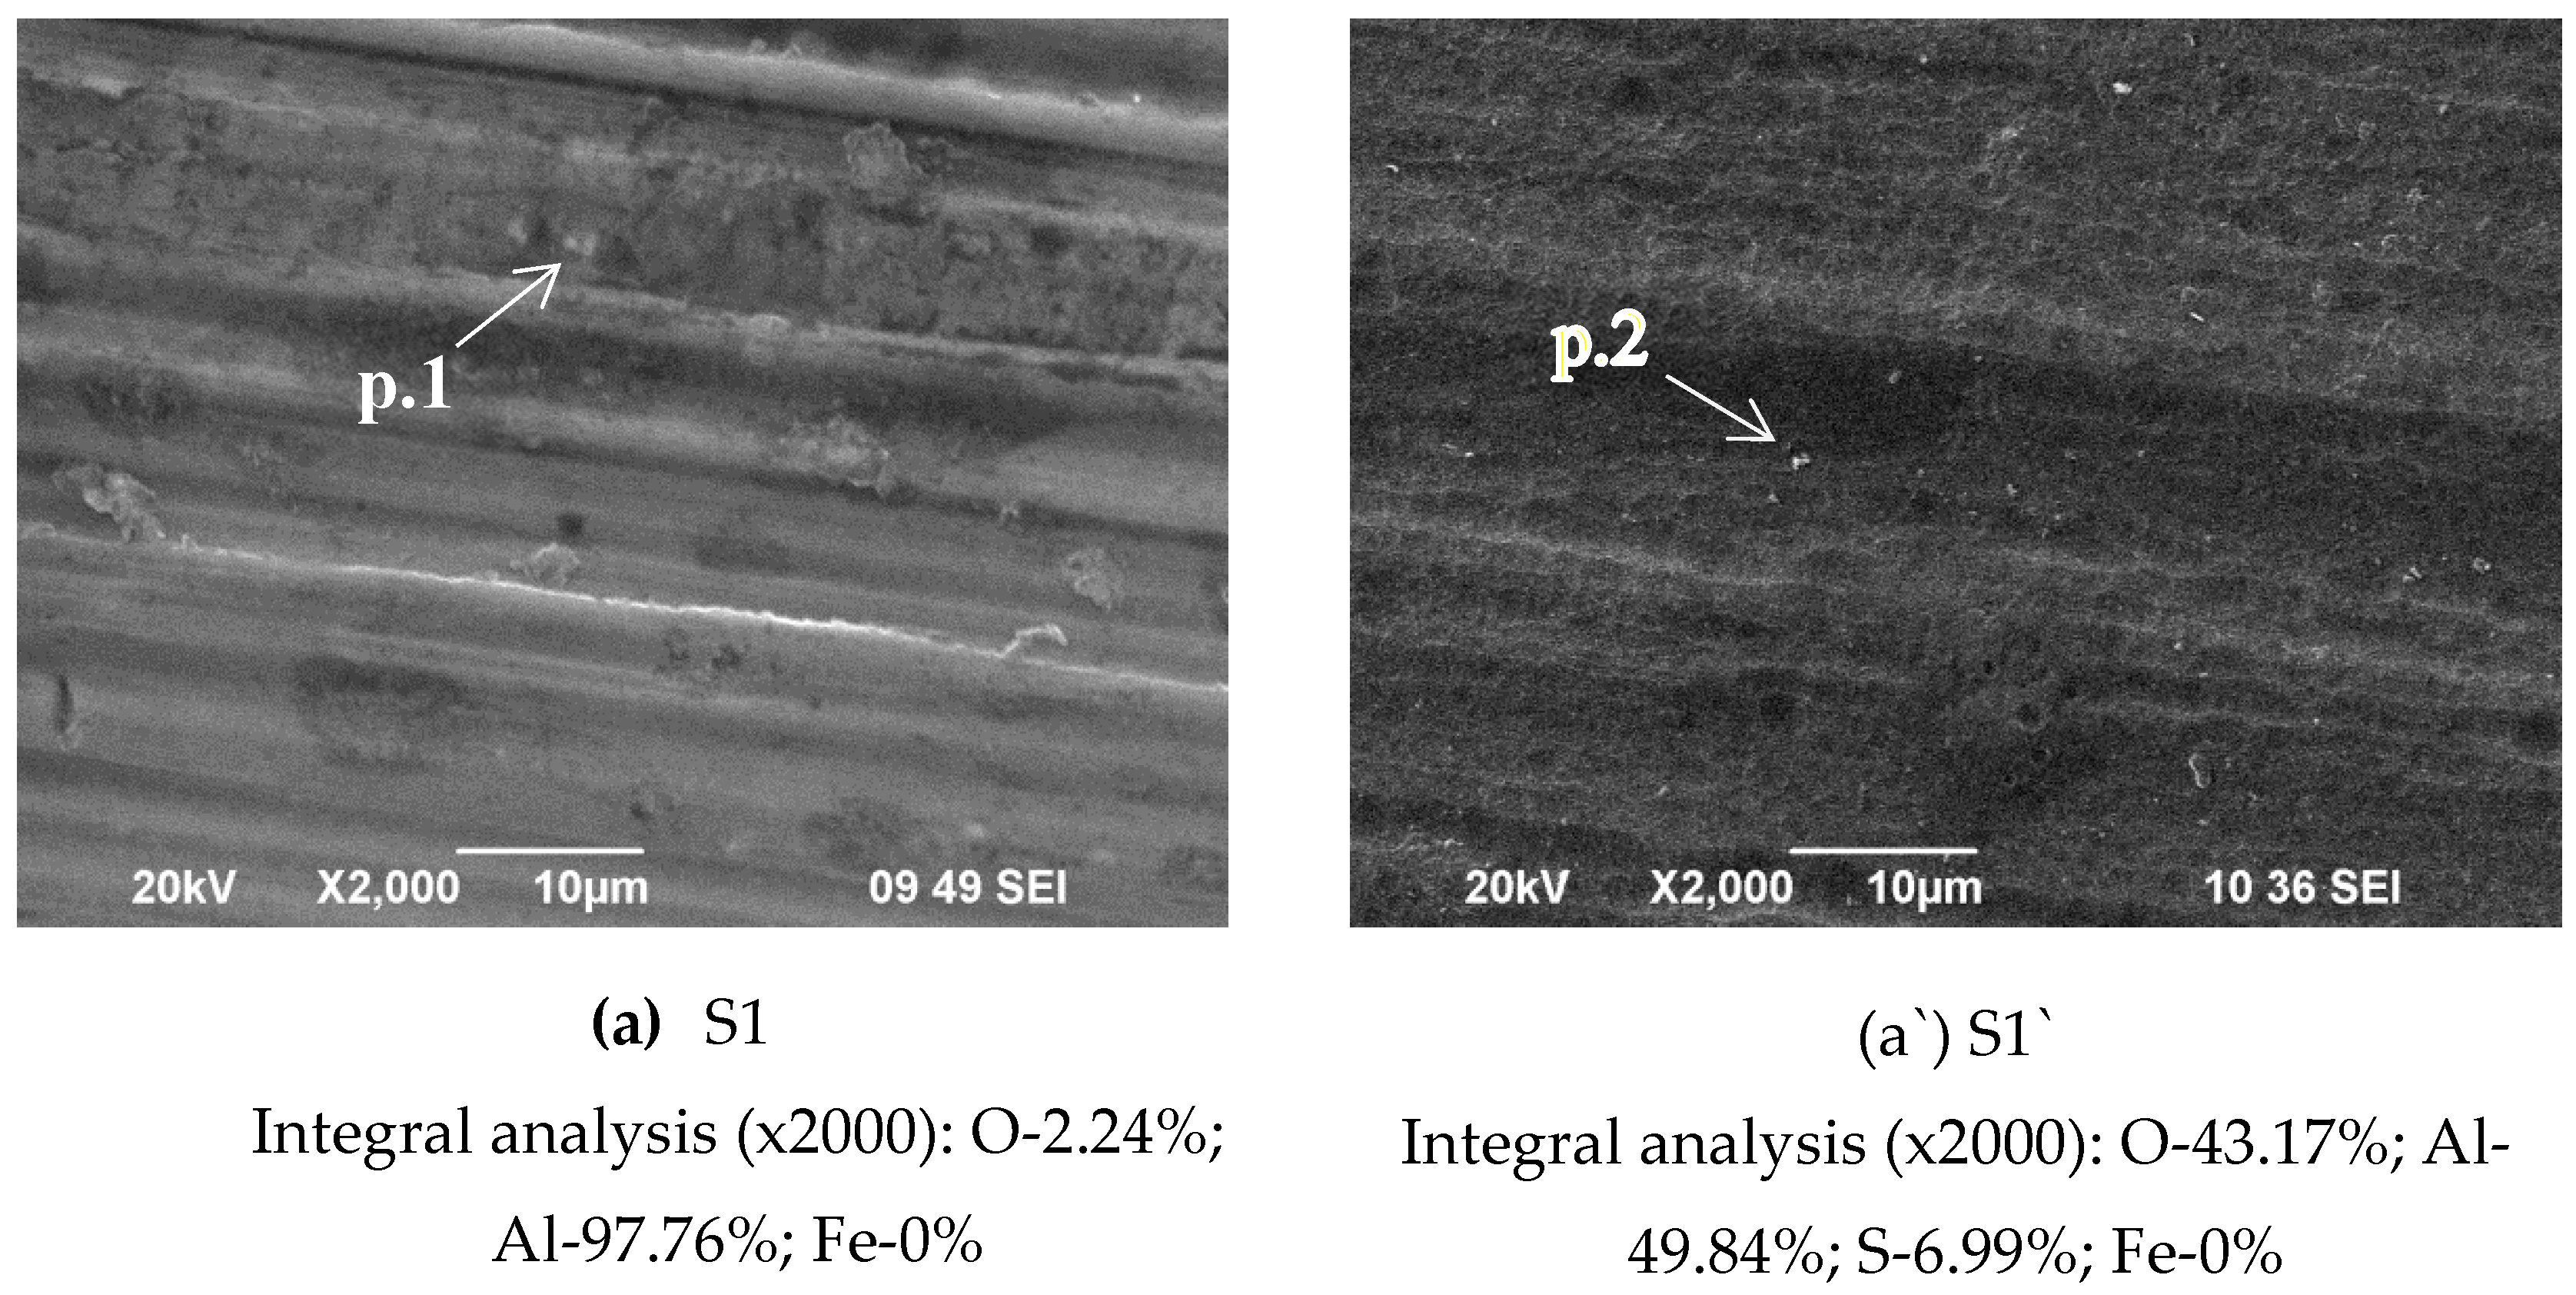
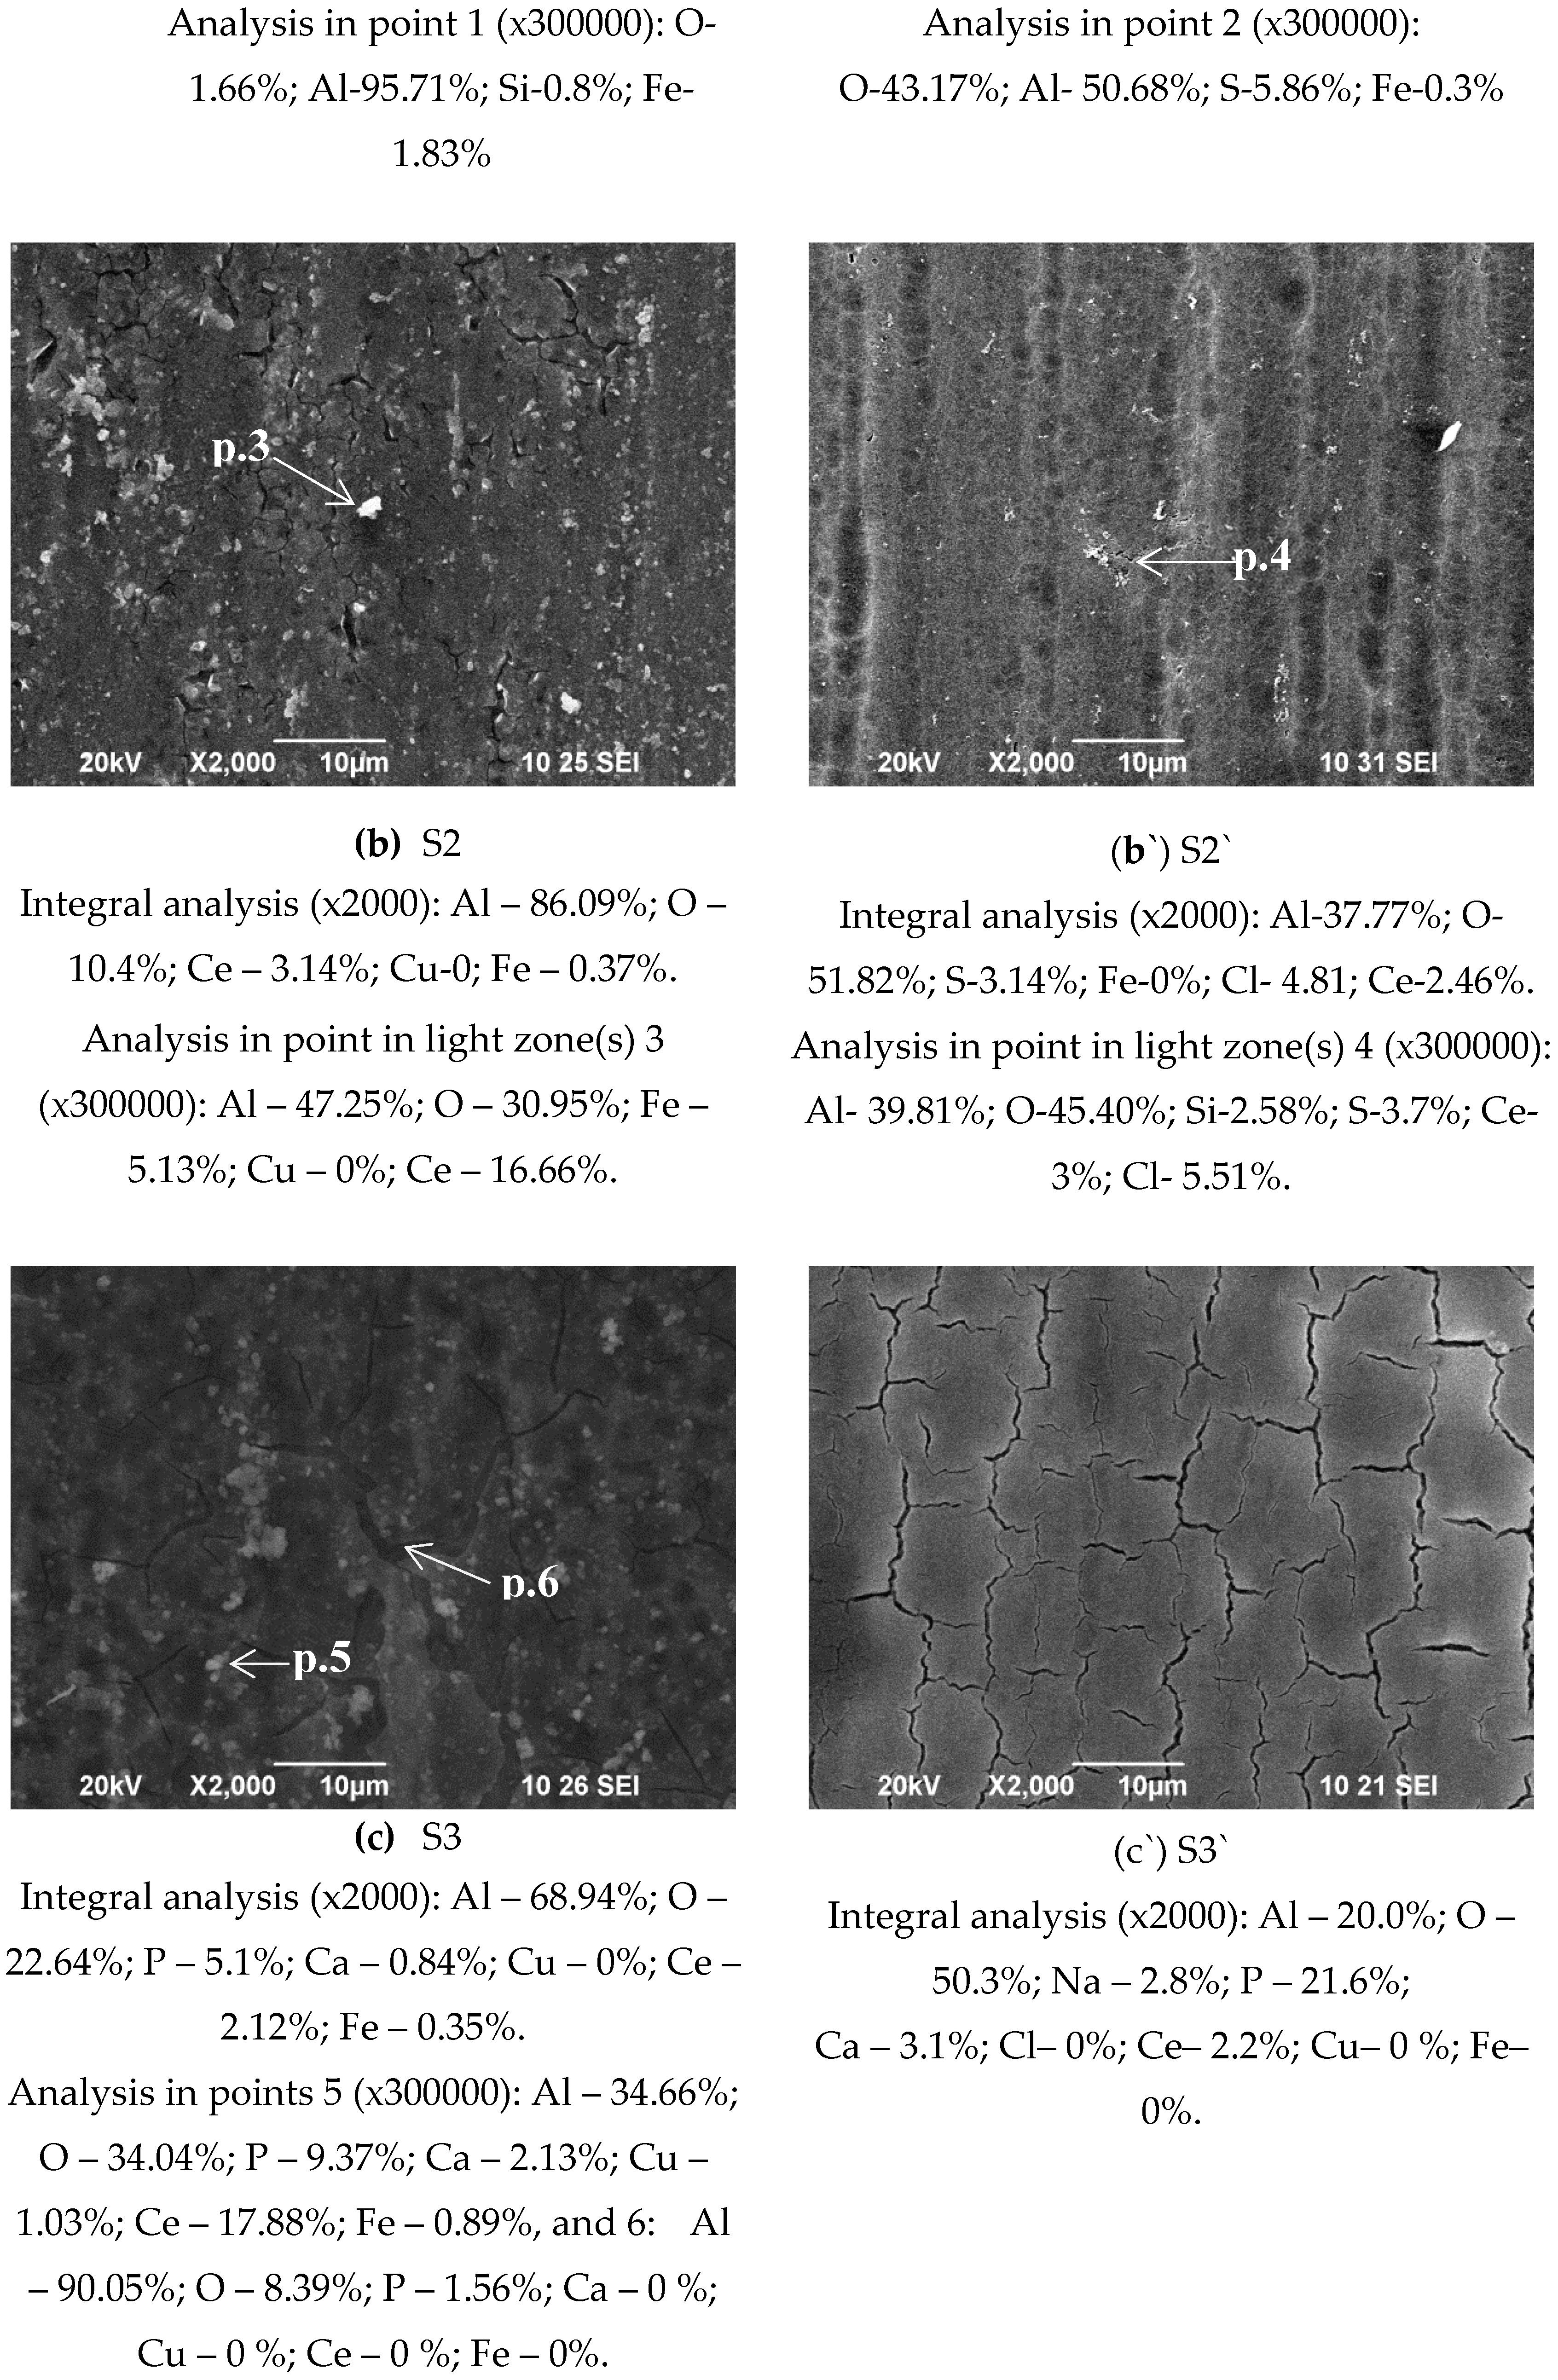
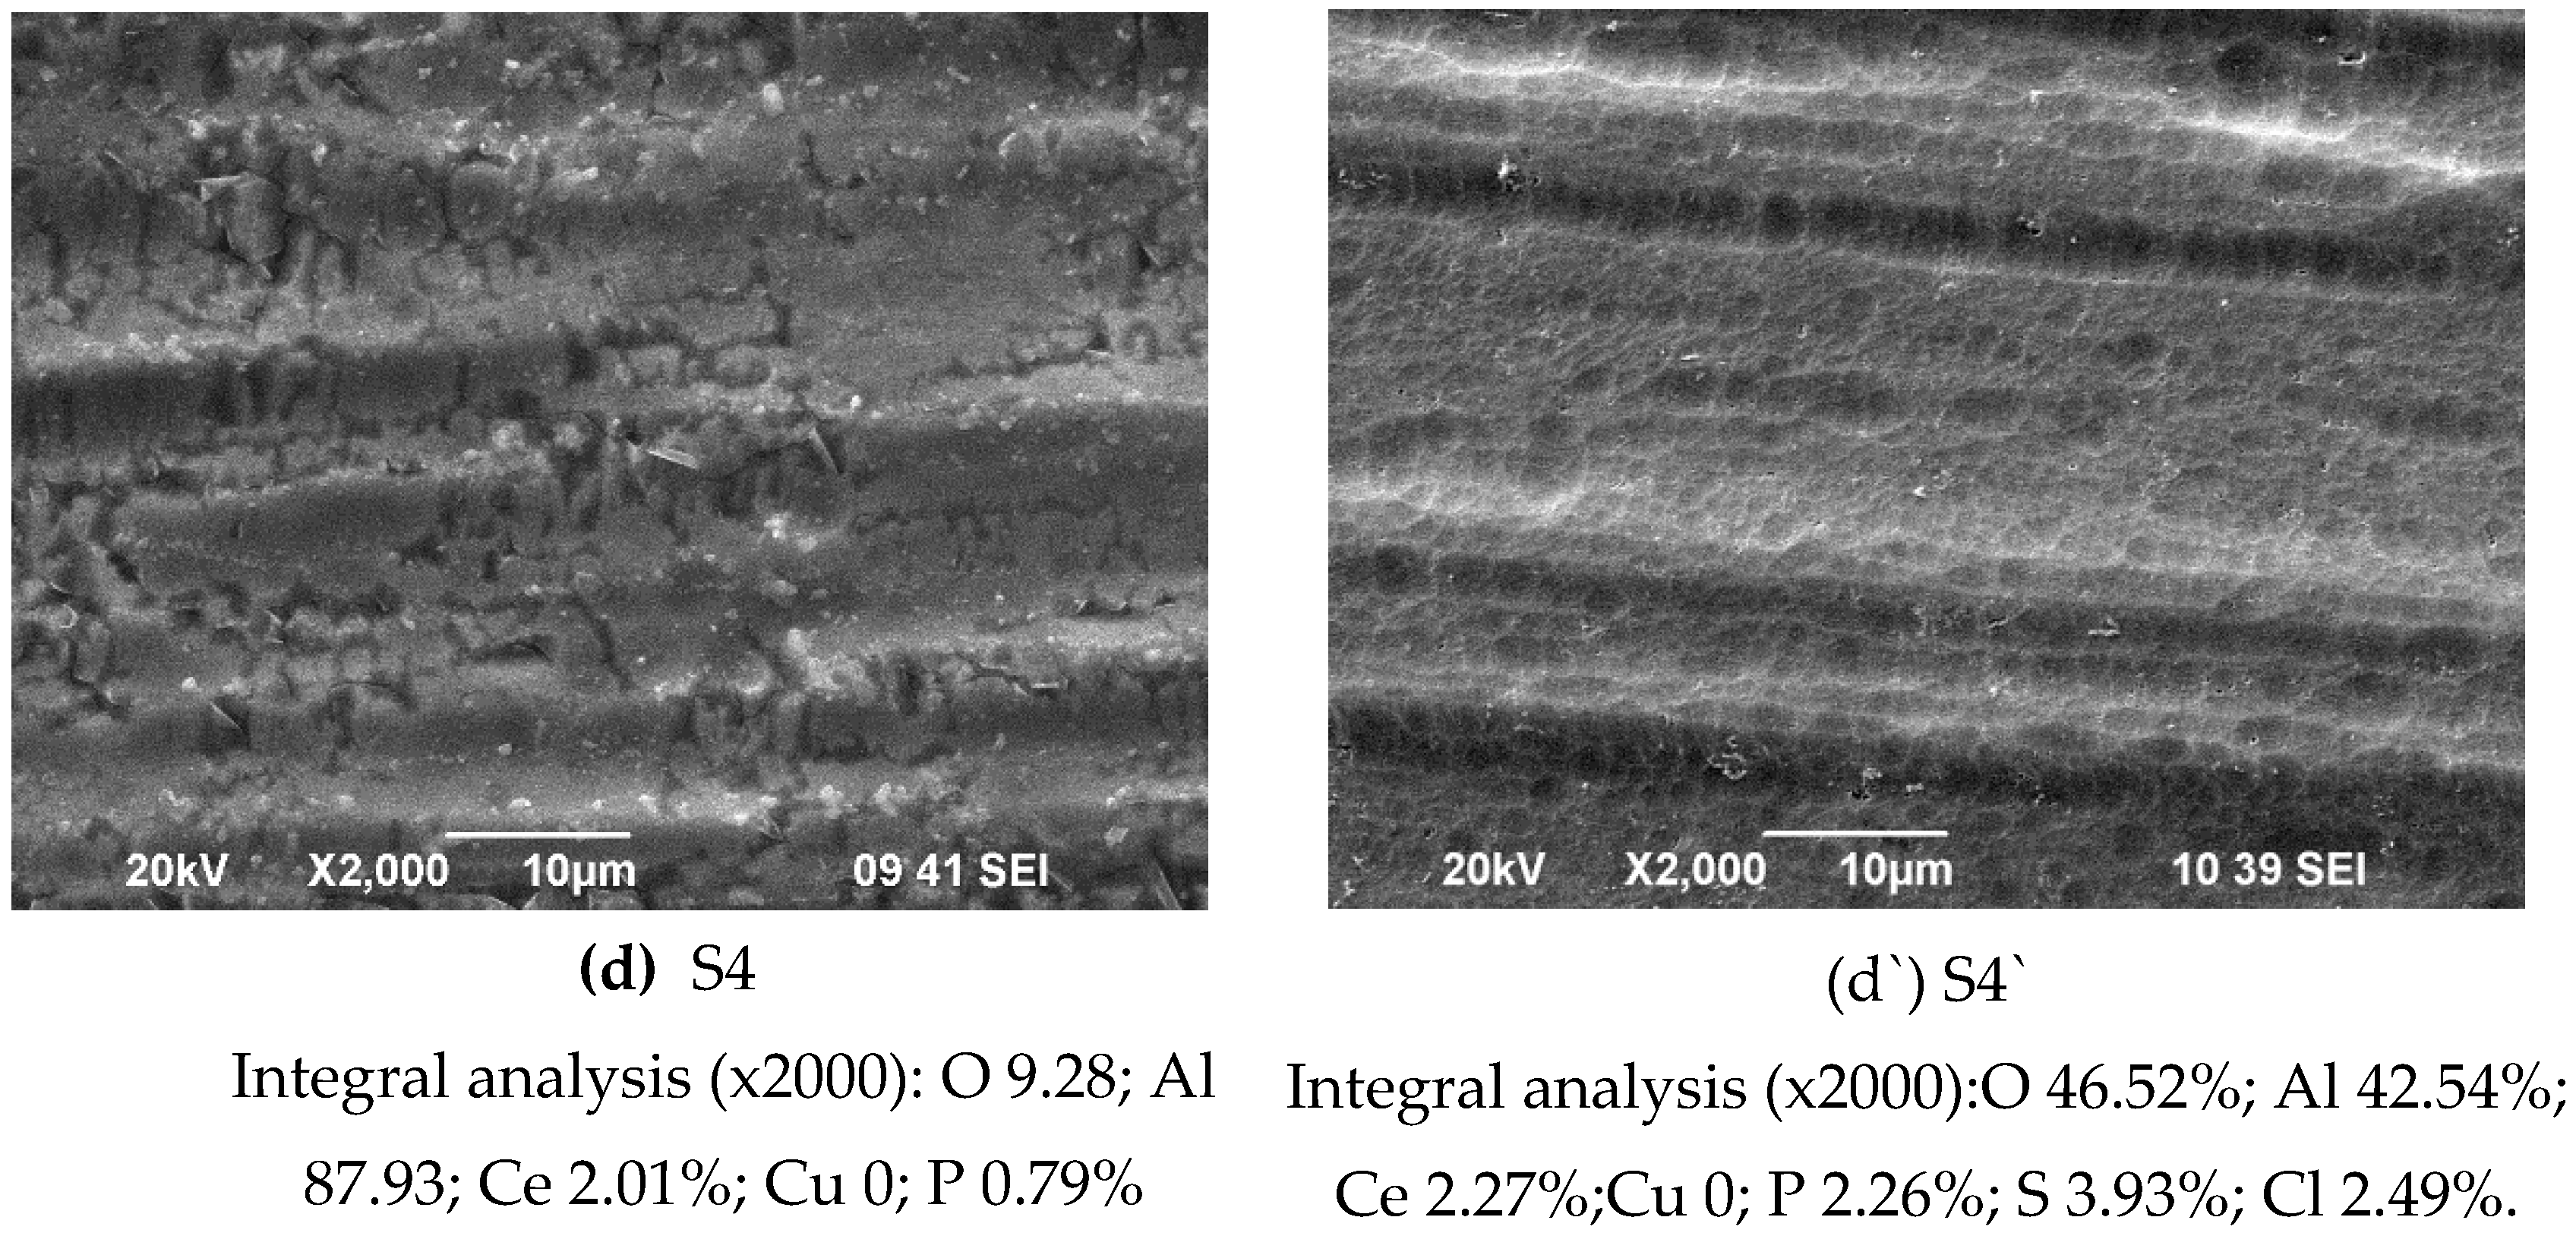
Figure 2.
Change in Rp vs. time of exposure (for 0.25 h; 24 h; 48 h; 120 h; 144 h and 168 h) in the CM of the samples: (a) S1, S2 , S3, S4 (obtained on non-anodized Al 1050 substrates); (b) S1`; S2`; S3`; S4` (obtained on anodized Al 1050 substrates.).
Figure 2.
Change in Rp vs. time of exposure (for 0.25 h; 24 h; 48 h; 120 h; 144 h and 168 h) in the CM of the samples: (a) S1, S2 , S3, S4 (obtained on non-anodized Al 1050 substrates); (b) S1`; S2`; S3`; S4` (obtained on anodized Al 1050 substrates.).
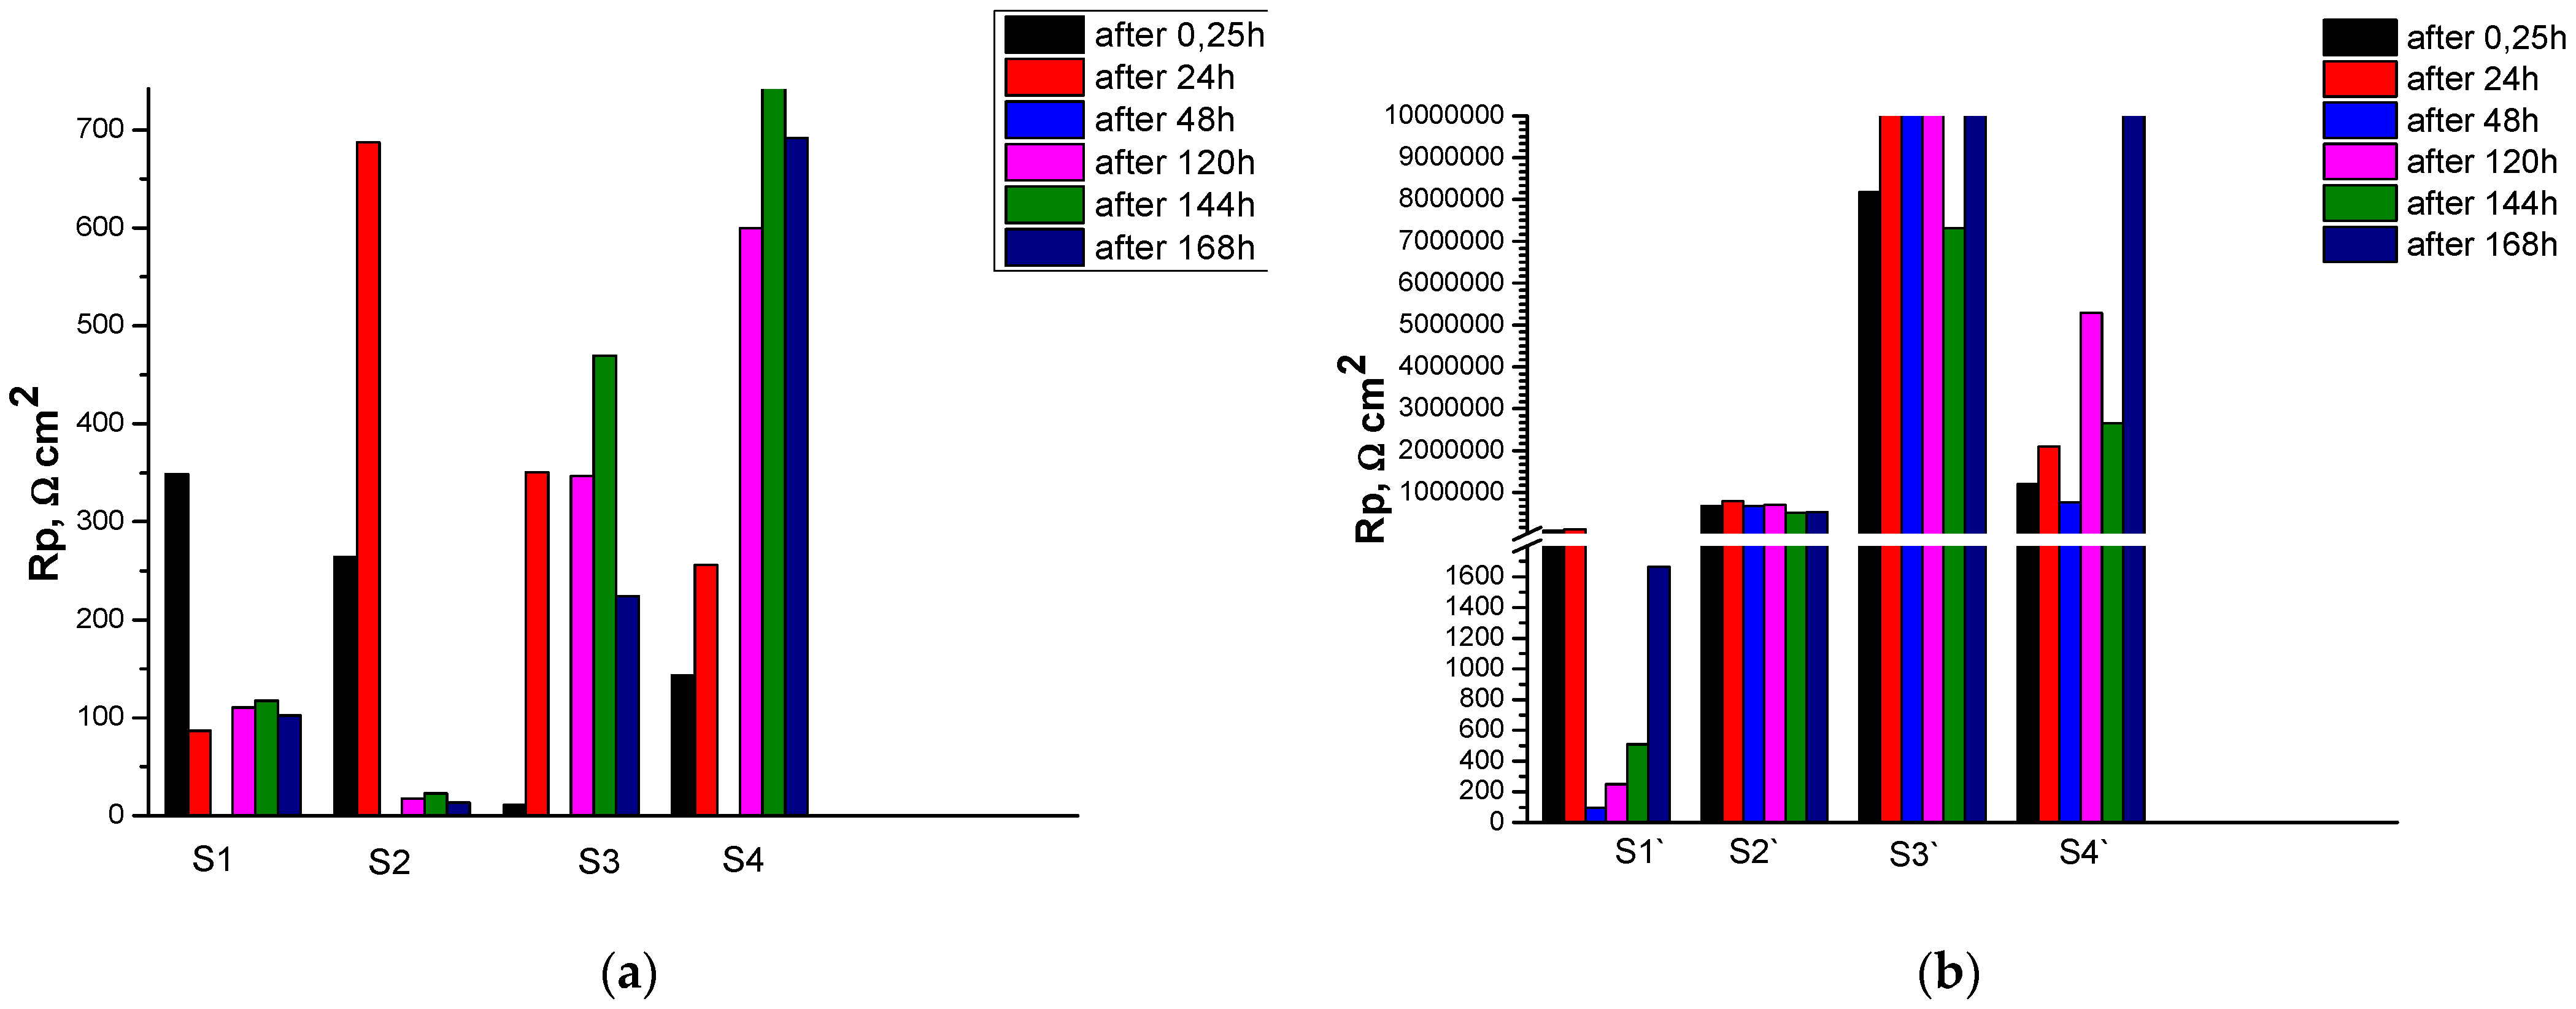
Figure 3.
Comparison of indentation hardness of investigated films and substrates.
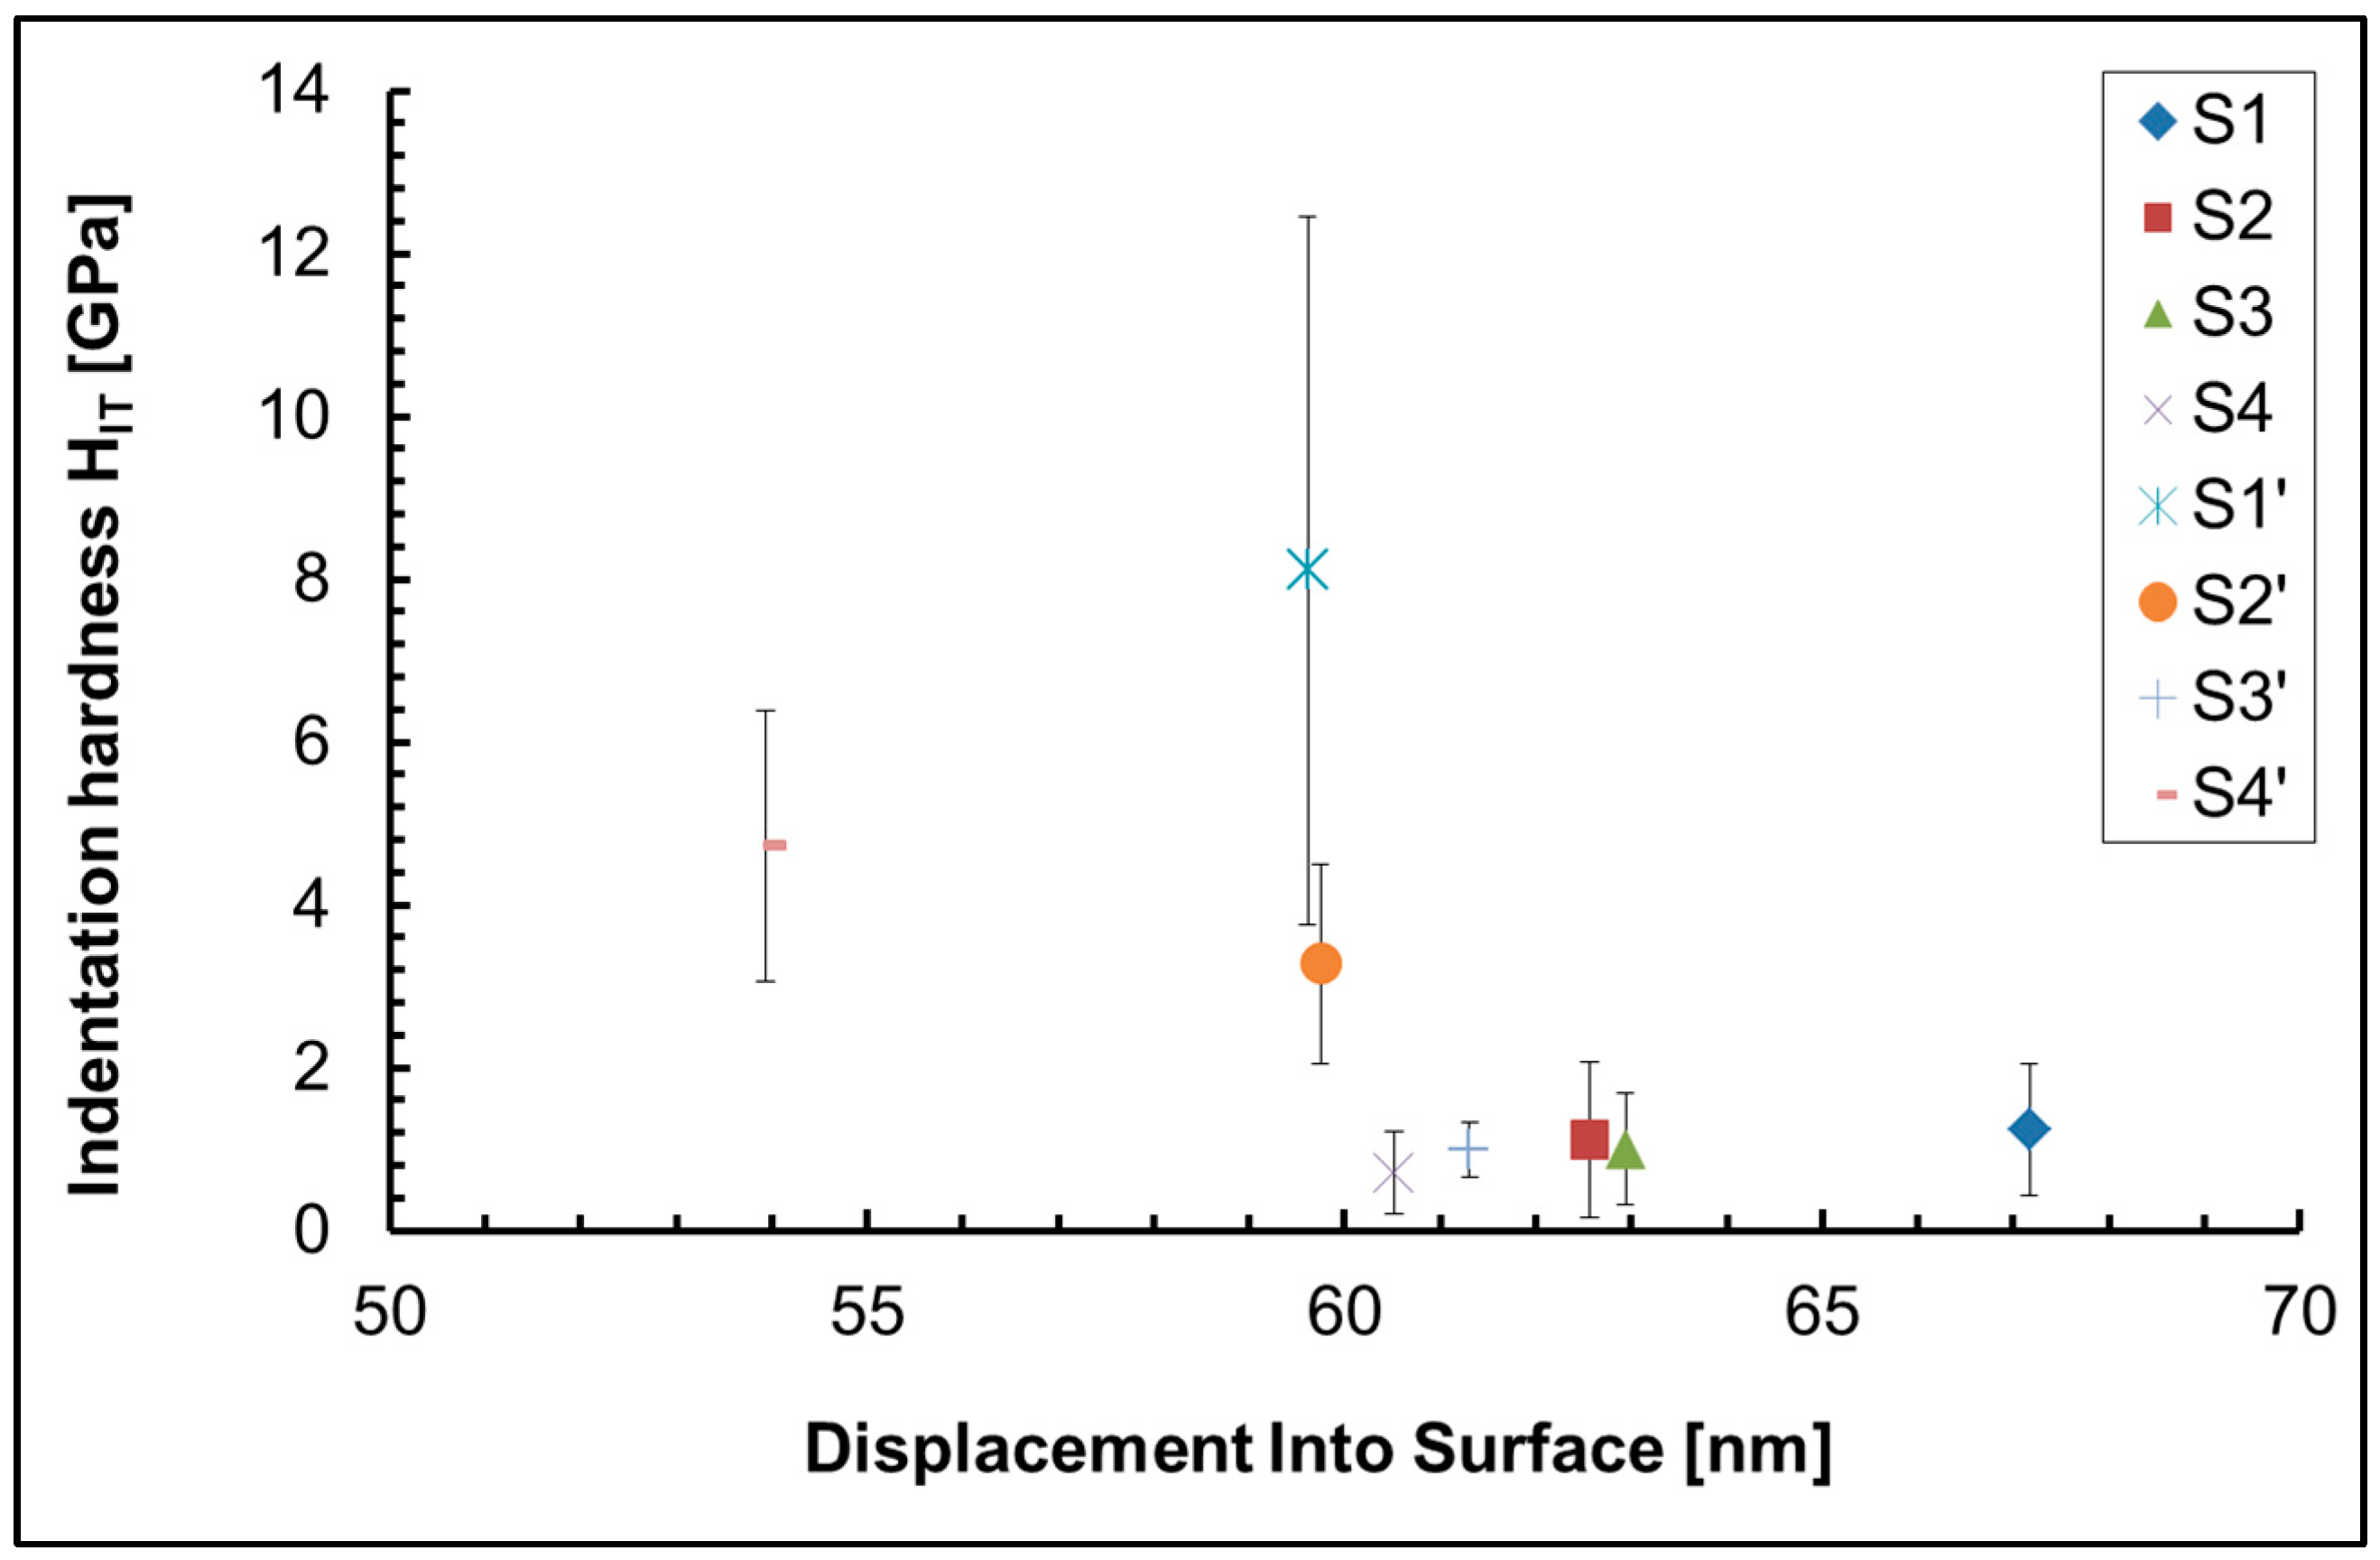
Figure 4.
Comparison of indentation modulus of investigated films and substrates.
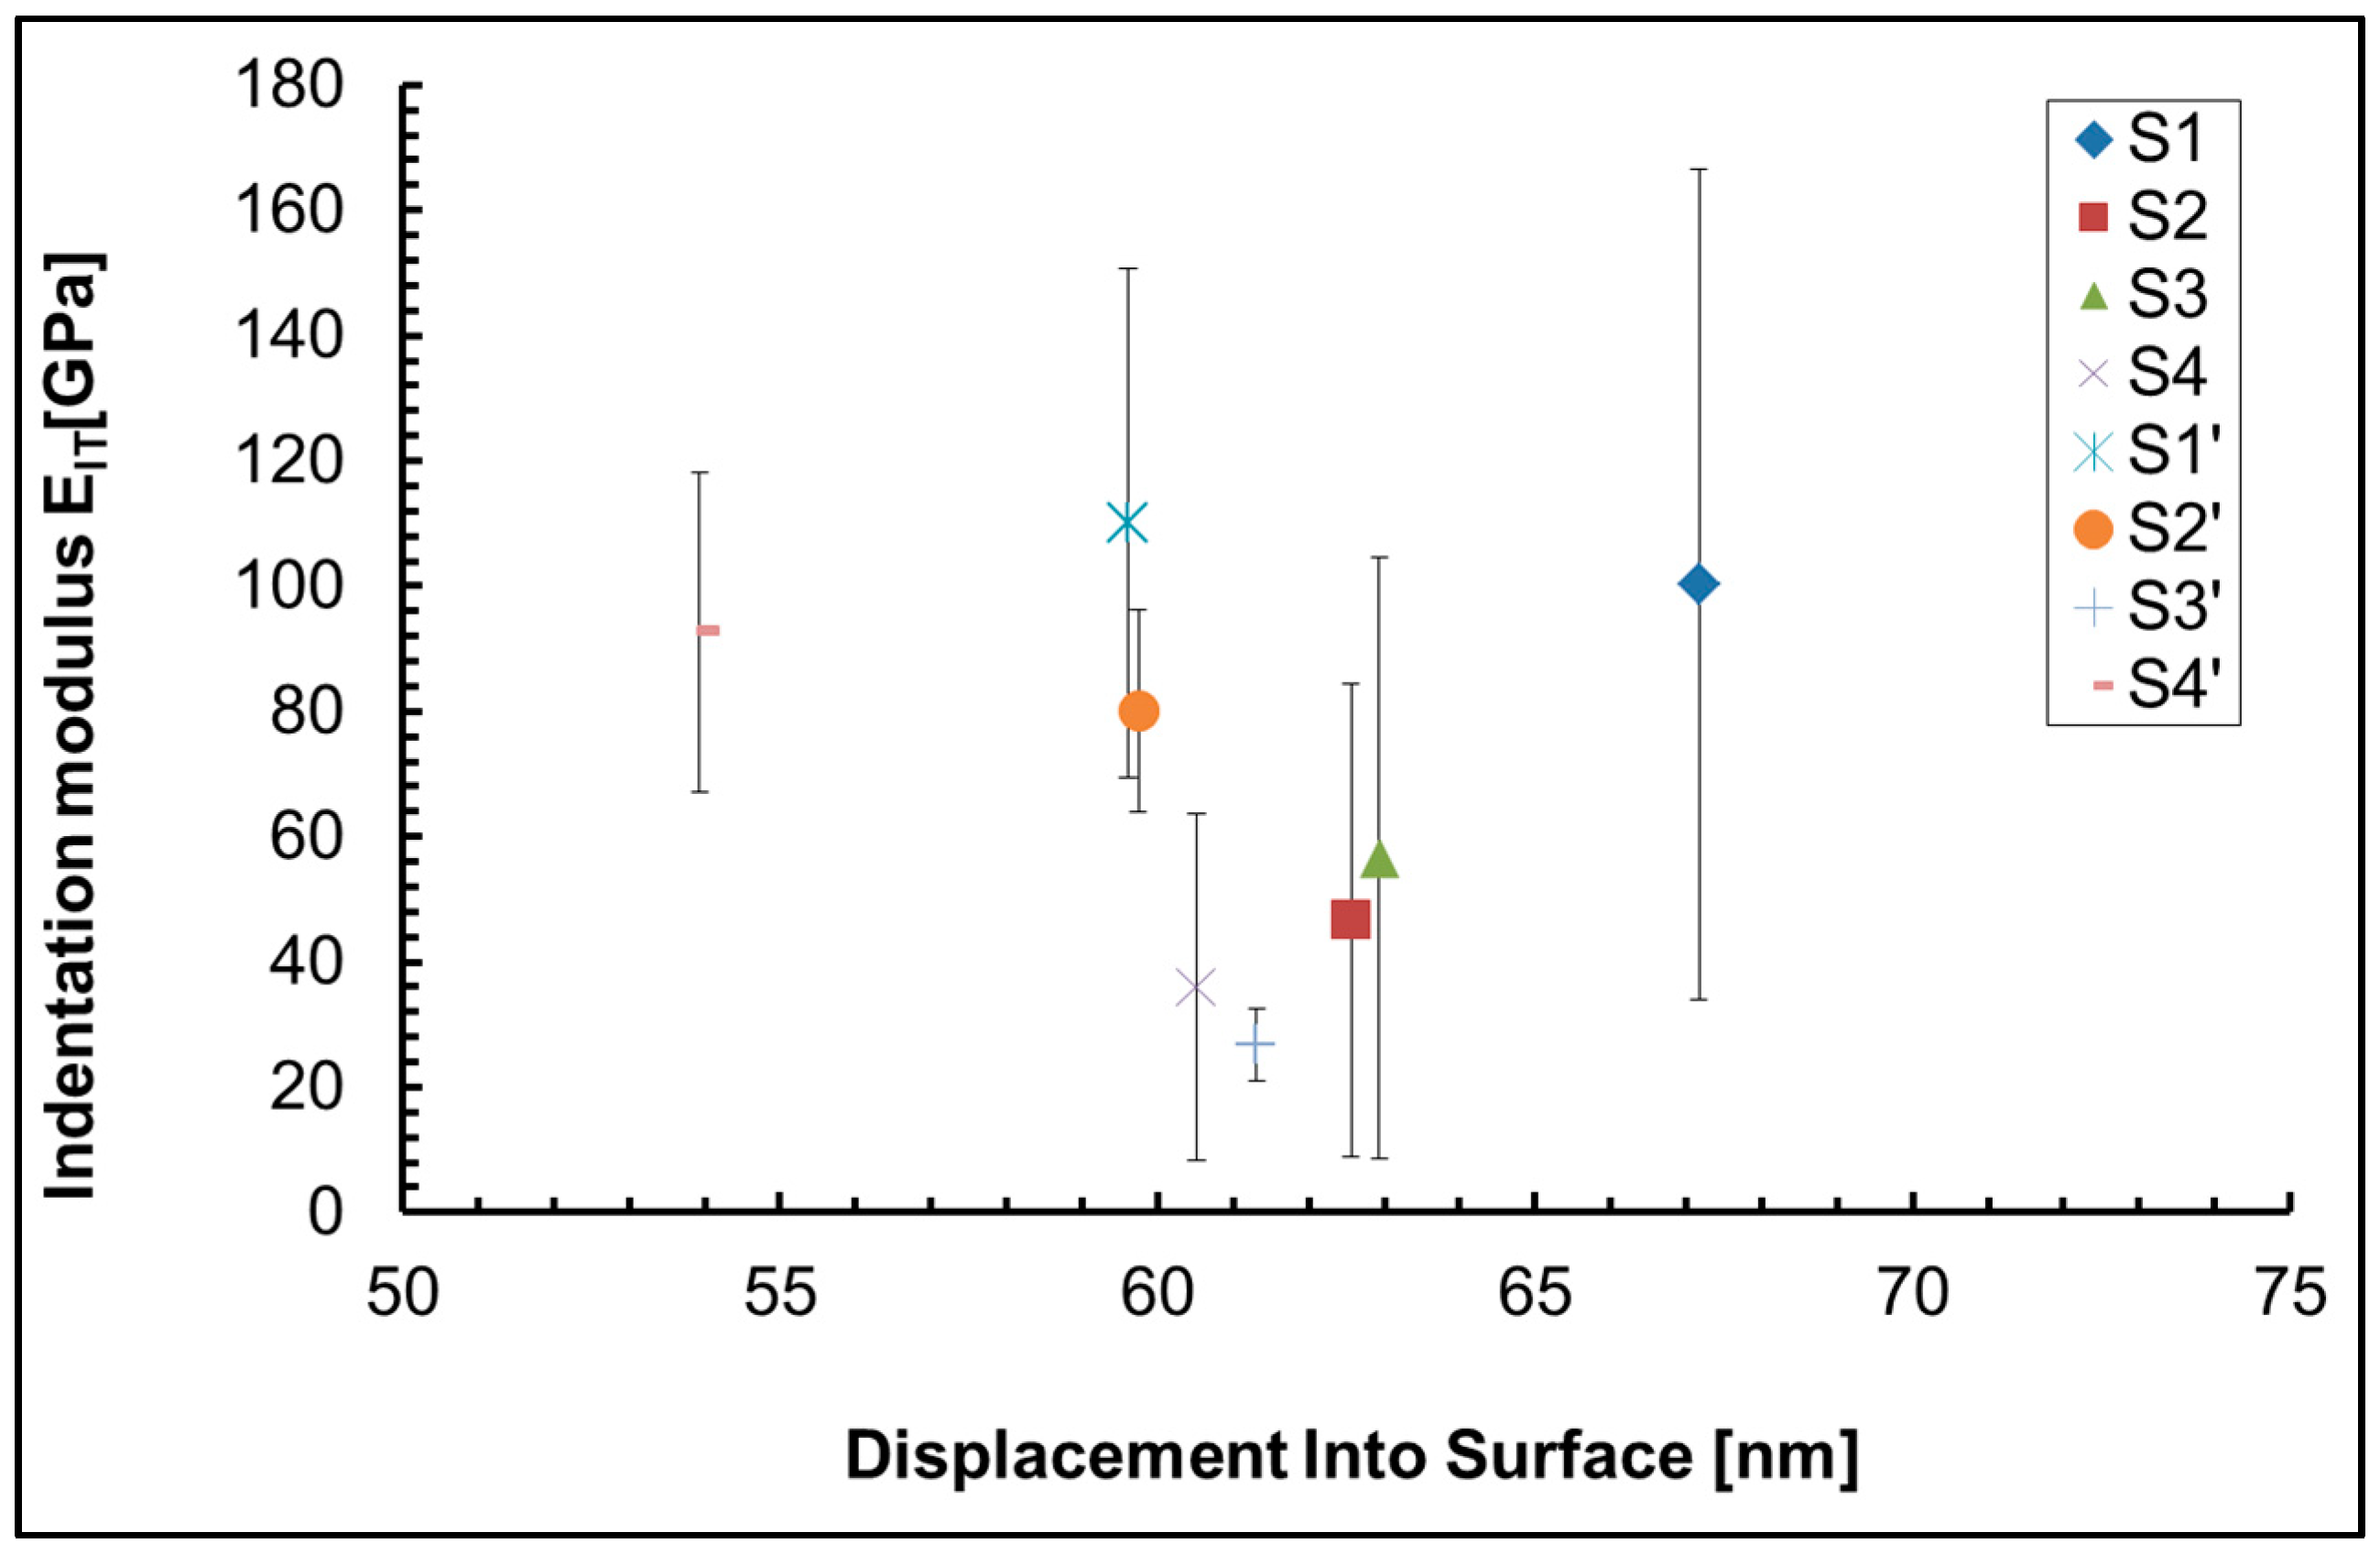

Table 1.
Type of treatment of the samples.
|
Abbreviation of the samples: |
Type of treatment of the samples: | |||
|
in 15% H2SO4, 15°C; ian = 1.5 A.dm-2, 48 min |
in 0.5 M CeCl3×7H2O + 1×10⁻⁵ M CuCl2×2H2O (25°C; 2 h) |
in 0.5 M NaH2PO4 + 0.1 MCa(NO3)2 solution (85°C) 3 x 5 min + 72h in humidity atmosphere |
in 0.22 M NH4H2PO4 solution (85°C, 5 min) | |
| S1 | No | NO | NO | NO |
| S1` | YES | NO | NO | NO |
| S2 | NO | YES | NO | NO |
| S2` | YES | YES | NO | NO |
| S3 | NO | YES | YES | NO |
| S3` | YES | YES | YES | NO |
| S4 | NO | YES | NO | YES |
| S4` | YES | YES | NO | YES |
Table 2.
Chemical composition of the studied as deposited systems determined by EDS analysis.
| Sample | Al, wt.% | O, wt.% | Fe, wt.% | Ce, wt.% | S, wt.% | Ca, wt.% | Cl, wt.% | P, wt.% | Cu, wt.% | Na, wt.% | N, wt.% |
| S1 | 97.8 | 2.2 | 0 | 0 | 0 | 0 | - | - | 0 | - | - |
| S1` | 49.8 | 43.2 | 0 | 0 | 7.0 | 0 | - | - | 0 | - | - |
| S2 | 86.1 | 10.4 | 0.4 | 3.1 | 0 | - | 0 | - | 0 | - | - |
| S2` | 37.8 | 51.8 | 0 | 2.5 | 3.1 | - | 4.8 | - | 0 | 0 | 0 |
| S3 | 68.9 | 22.6 | 0.4 | 2.2 | 0 | 0.8 | 0 | 5.1 | 0 | 0 | 0 |
| S3` | 20.0 | 50.3 | 0 | 2.2 | 0 | 3.1 | 0 | 21.6 | 0 | 2.8 | 0 |
| S4 | 87.9 | 9.3 | 0 | 2.0 | 0 | 0 | 0 | 0.8 | 0 | 0 | 0 |
| S4` | 42.5 | 46.5 | 0 | 2.3 | 3.9 | 0 | 2.5 | 2.3 | 0 | 0 | 0 |
Table 3.
Chemical composition of the studied as deposited systems determined by XPS analysis .
| Sample | Al, at.% | O, at.% | Ce, at.% | Ca, at.% | P, at.% | Cu, at.% | Na, at.% | N, at.% |
| S1 | 39.0 | 61.0 | - | - | - | 0 | - | - |
| S1` | 36.8 | 63.2 | - | - | - | 0 | - | - |
| S2 | 11.0 | 70.5 | 15.8 | - | - | 2.7 | - | - |
| S2` | 32.0 | 66.7 | 0.9 | - | - | 0.4 | 0 | 0 |
| S3 | 19.6 | 65.1 | 0.5 | 1.7 | 11.6 | 0 | 0.6 | 1.0 |
| S3` | 13.1 | 64.4 | 0.4 | 1.7 | 17.9 | 0.2 | 0.2 | 2.1 |
| S4 | 7.6 | 76.3 | 1.4 | - | 14.1 | 0 | 0 | 0 |
| S4` | 12.6 | 75.1 | 1.3 | - | 6.5 | 0 | 0 | 4.5 |
Table 4.
The most probable phases on the aluminum surface according to the analysis of the studied samples.
Table 4.
The most probable phases on the aluminum surface according to the analysis of the studied samples.
| Sample | Al | Ce | P | Ca |
| S2 and S2` | Al2O3 | Ce2O3+ CeO2 |
||
| S3 and S3` | Al2O3; AlPO4 AlOOH |
Ce2O3 CePO4 |
NaH2PO4 | Ca5(PO4)3(OH) Ca(NO3)2 |
| S4 and S4` | AlPO4 | CePO4 | PO3- P2O5 (P4O10) NaH2PO4 |
Table 5.
Changes of the Rp and CR values depending of the type of Al substrate(s) (non-anodized or anodized) and the time of exposure in corrosion medium (as deposited and after 168 h in CM).
Table 5.
Changes of the Rp and CR values depending of the type of Al substrate(s) (non-anodized or anodized) and the time of exposure in corrosion medium (as deposited and after 168 h in CM).
| Sample | Rp, Ω.cm2 | CR, µm/year | |
| S1 | as deposited | 3.5x10² | 0.8 |
| after 168 h in CM | 1.0x10² | 2.8 | |
| S1` | as deposited after 168 h in CM |
0.9x10⁵ 1.7x10³ |
1.5x10⁻⁵ 2.0x10⁻¹ |
| S2 | as deposited | 2.6x10² | 1.1 |
| after 168 h in CM | 1.4x101 | 21 | |
| S2` | as deposited after 168 h in CM |
6.8x10⁵ 5.3x10⁵ |
4.2x10⁻⁴ 5.4x10⁻⁴ |
| S3 | as deposited after 168 h in CM |
1.1x101 2.2x10² |
25 1.3 |
| S3` | as deposited after 168 h in CM |
8.2x10⁶ 2.3x10⁷ |
3.5x10⁻⁵ 1.2x10⁻⁵ |
| S4 | as deposited after 168 h in CM |
1.4x10² 6.9 x10² |
2.0 0.4 |
| S4` | as deposited after 168 h in CM |
1.2x10⁶ 6.9x10⁷ |
2.4x10⁻⁴ 4.1x10⁻⁶ |
Disclaimer/Publisher’s Note: The statements, opinions and data contained in all publications are solely those of the individual author(s) and contributor(s) and not of MDPI and/or the editor(s). MDPI and/or the editor(s) disclaim responsibility for any injury to people or property resulting from any ideas, methods, instructions or products referred to in the content. |
© 2024 by the authors. Licensee MDPI, Basel, Switzerland. This article is an open access article distributed under the terms and conditions of the Creative Commons Attribution (CC BY) license (http://creativecommons.org/licenses/by/4.0/).
Copyright: This open access article is published under a Creative Commons CC BY 4.0 license, which permit the free download, distribution, and reuse, provided that the author and preprint are cited in any reuse.


