
Submitted:
13 December 2024
Posted:
16 December 2024
You are already at the latest version
Abstract
Implementing models able to estimate house values accurately is a great challenge for real estate market stakeholders. This concerns homeowners, buyers and sellers, real estate agents and policymakers. This paper presents a powerful novel approach to this problem by utilizing a model based on Kolmogorov-Arnold Networks (KANs). KAN Networks are Neural Networks (NNs) based on Kolmogorov-Arnold theorem which is a mathematical concept with wide applicability. The experimental findings indicate that the KAN-based model can be used to predict housing prices with great success. Two different datasets were used to test the validity of the KAN model, and the results show that the model can outperform existing state-of-the-art methods that are used to predict house prices. One of the key contributions of this study is that by achieving more precise house price forecasts, the model can support better decision-making processes for various real estate stakeholders. Furthermore, the findings suggest the broader applicability of Kolmogorov-Arnold Networks beyond just real estate. This modeling approach holds promise for addressing other complex prediction tasks in data science. Overall, this study presents an innovative solution to the longstanding challenge of accurate house price estimation. The strong performance of the KAN model underscores its potential to deliver tangible benefits for the real estate industry and beyond.
Keywords:
Kolmogorov-Arnold Networks (KANs)
; Real Estate forecasting
; House price prediction
; Neural Networks (NNs)
; Deep Learning
; Regression
; Artificial Intelligence
; Machine earning
1. Introduction
The real estate sector plays a vital role in the economy and includes various domains such as residential, commercial, industrial and retail. It relates to a broad spectrum of activities centered on purchase, sale, rental, lease, and management of properties [1]. Its dynamics and developments have a pertinent impact on people, companies, and state authorities around the globe [2].
The residential real estate sector is clearly an integral part of the overall property market. Specifically, this is for the purchase and sale or leasing of residential property (single-family homes, townhomes, condominiums)[2]. This segment has a huge impact for the overall economy [3]. Residential properties represent about 65% of the entire real estate market in the USA. Home sales in the United States hit an all-time high of nearly seven million in 2021, after consistently increasing from a low level that year. The average price per square foot of floor space in new single-family housing fell after the great financial crisis and then stagnated for several years. Since 2012, the price has continuously increased, reaching approximately 144 U.S. dollars per square foot in 2021. In the same year, the average sales price of a new home was over 454,000 U.S. dollars and in 2022, house prices increased further1.
The above indicate that understanding its current state, trends, and prospects is essential for both industry participants and investors. Like the broader real estate market, the house real estate domain is subject to various factors that influence its growth and performance. Searching for the factors that have an impact on the prices of houses has been a topic of interest for many years. House prices are one of the most important economic indicators and their values are a vital economic gauge. Changes in prices have substantial consequences for households, policymakers, investors etc. Understanding the dynamics of house prices is important for assessing the health of the housing market and crucial for evaluating its state [4]. Also knowing how house prices work helps investors predict trends, forecast future changes and make successful decisions about buying and selling property [5].
Some factors and trends that influence the price of a house are the following [5]:
-
Factors
- ◦
- Location and accessibility
- ◦
- Size and layout of the house
- ◦
- Condition and age of the property
- ◦
- Amenities and features of the property
- ◦
- Supply and demand in the local market
- ◦
- Interest rates and mortgage availability
- ◦
- Economic conditions and job growth in the area
- ◦
- Tax laws and regulations
-
Trends:
- ◦
- Use of technology in the industry
- ◦
- Increasing demand for sustainable and energy-efficient homes
- ◦
- Impact of the COVID-19 pandemic on housing preferences and work-from-home options
- ◦
- Development of smart homes and home automation technology
- ◦
- Growing interest in walkable neighborhoods and urban areas
- ◦
- Rising demand for affordable housing options
- ◦
- Fluctuations in interest rates and overall economic conditions.
Researchers and industries are actively working on projects related to predicting house prices [5]. Machine learning techniques and Deep Neural Networks (Deep NNs) have been widely employed for this purpose [6]. In this study, a novel approach using a Kolmogorov-Arnold Network (KAN) is proposed. Unlike the static, non-learnable activation functions in MLPs, KANs incorporate univariate functions that act as both weights and activation functions, adapting as part of the learning process. By decentralizing activation functions to edges rather than nodes, KANs align with the Kolmogorov-Arnold representation theorem, enhancing model interpretability and performance [7]. These models are designed to handle complex, non-linear relationships within the data, capturing intricate patterns that traditional models might miss. KANs excel in representing highly non-linear functions, making them particularly suited for customer behavior analysis, where interactions between features can be complex and multi-faceted. By leveraging the Kolmogorov-Arnold representation theorem, these networks can approximate any continuous function, providing high flexibility and accuracy in prediction problems[8].
The scientific and potential social contributions of this study can be summarized as follows:
- Advancement in House Price Estimation: This research introduces a novel approach to house price estimation by utilizing Kolmogorov-Arnold Networks (KANs), a method that effectively models complex, nonlinear relationships. By outperforming state-of-the-art techniques, the study demonstrates KANs’ ability to deliver more accurate predictions, which are crucial for various stakeholders in the real estate market, including buyers, sellers, investors, and policymakers.
- Economic and Social Impact: By improving prediction accuracy in housing price estimation, this research contributes to a more transparent and informed real estate market. Enhanced predictive capabilities help stakeholders make better decisions, optimize investments, and mitigate risks. Furthermore, the insights gained from the study can lead to the development of smarter urban planning and housing policies, ultimately benefiting society by fostering equitable and sustainable growth in the housing sector.
- Methodological Contribution: The study expands the methodological landscape in regression problems by showcasing KANs as a powerful alternative to traditional models such as gradient boosting algorithms, neural networks, and ensemble methods. The work highlights KANs’ capacity to generalize well in scenarios with high-dimensional, intricate datasets, providing a robust framework for tackling similar regression challenges across domains.
- Broader Applicability Across Industries: While the focus is on house price estimation, the versatile nature of KANs offers potential applications beyond real estate. KANs can be applied in areas such as financial modeling, healthcare predictions, environmental analysis, and supply chain optimization. The study underscores the adaptability of this approach, setting a precedent for its application in diverse regression and prediction tasks.
This work not only establishes the utility of KANs in regression problems but also sets the stage for future exploration of their potential across a wide range of applications. Section 2 provides an overview of related works in the field of KANs and house price prediction, while section 3 explains the research methodology and the proposed KAN model in detail. In sections 4 and 5, the experiments are described, and the results are discussed. Finally, section 6 concludes the paper and provides insights for future research in this area.
2. Literature Review and State-of-the-Art
2.1. Kolmogorov Arnold Neural Networks Approaches
Liu et al. introduced Kolmogorov-Arnold Networks (KANs), a novel neural network architecture inspired by the Kolmogorov-Arnold representation theorem, and showed that it has significant advantages over traditional Multi-Layer Perceptrons (MLPs)[8]. KANs are designed to effectively capture compositional structures in data, enabling them to approximate complex functions, such as exponential and sine functions, with greater efficiency and accuracy. The authors demonstrate that KANs not only outperform MLPs in terms of accuracy, particularly in small-scale AI and science tasks, but also enhance interpretability by revealing the underlying compositional structures in symbolic formulas. Furthermore, KANs can utilize grid extension techniques to further improve their performance, positioning them as a promising foundation for future AI applications in scientific discovery and mathematical exploration.
Moradi et al. (2024) investigate the potential of Kolmogorov-Arnold Networks (KANs) as a transformative approach to deep learning, particularly in the context of autoencoders for image representation tasks. The study compares KAN-based autoencoders against traditional Convolutional Neural Networks (CNNs) across several datasets, revealing competitive reconstruction accuracy and suggesting KANs' viability in advanced data analysis applications [9].
Jiang et al. present a novel hybrid model combining Kolmogorov-Arnold Networks (KANs) and Artificial Neural Networks (ANNs) for short-term load forecasting (STLF), addressing the limitations of traditional ANN approaches. By leveraging KANs to identify essential periodic and nonlinear patterns in load data, while utilizing ANNs to fit the residual components, the proposed method enhances both interpretability and predictive accuracy. The integration of regularization techniques ensures that KAN-derived predictions maintain dominance, leading to clearer analytical expressions for forecasting. Experimental validation against various models demonstrates superior performance of the hybrid approach, marking a significant advancement in STLF methodologies [10].
Yang et al. propose the Kolmogorov–Arnold Transformer (KAT), an innovative architecture that enhances traditional transformer models by substituting multi-layer perceptron (MLP) layers with Kolmogorov-Arnold Network (KAN) layers [11]. This approach significantly improves expressiveness and performance, addressing key challenges in integrating KANs into transformers and paving the way for more efficient deep learning models.
Hollόsi et al. present a study focused on enhancing road safety by detecting mobile phone usage among bus drivers [12]. The research utilizes Kolmogorov-Arnold Networks (KAN) to improve the accuracy of driver monitoring systems (DMS) in compliance with regulations against phone use while driving.
2.2. Literature Review House Price Prediction
Predicting house prices is a popular task in machine learning, and there are numerous state-of-the-art papers that use neural networks (NNs) and other machine learning techniques for this task.
Limsombunc et al. is one of the first researches that demonstrated that the artificial neural network model has significant potential in predicting house prices The purpose of this research is to evaluate and compare the effectiveness of the hedonic model and an artificial neural network model in predicting house prices. The study uses a sample of 200 houses in Christchurch, New Zealand obtained randomly from the Harcourt website, taking into account factors such as house size, age, type, number of bedrooms, bathrooms, garages, amenities, and location [13]
Afonso et al. propose a hybrid model that combines deep learning RNN networks and random forest algorithms for predicting housing prices. The model uses features extracted from images and text data of the houses, along with other relevant numerical data. The results show that the proposed model outperforms both standalone deep learning and random forest models for prediction of housing prices in Brazil [14].
Nouriani et al. propose a novel approach for estimating housing prices using a combi- nation of interior and exterior images of houses, as well as satellite images. The proposed method utilizes deep convolutional neural networks to extract features from images and then (along with other house features) employs multiple regression models to estimate house prices based on these features [15].
Mora_Garcia et al. present a study on the use of machine learning algorithms for housing price prediction in California during the COVID-19 pandemic. The authors analyzed different regression models, including linear regression, decision trees, and other to predict the price of houses in different regions of California. The study also evaluated the impact of the pandemic on the housing market and the performance of the different models [6].
Kim et al. explore the application of various machine learning algorithms, including support vector machine, random forest, XGBoost, LightGBM, and CatBoost, as automatic real estate valuation models. The study involves analyzing approximately 57,000 records on apartment transactions in Seoul in 2018 and proposes combination methods to improve the models' predictive power. The findings suggest that ML-based predictors outperform conventional models, and an efficient averaging of the predictors can improve their predictive accuracy. Additionally, ML algorithms can recommend which algorithm should be selected for making predictions [16].
Joshi et al. proposed to use multiple different model which can be used for prediction and focuses on more accurate results. They proposed to use ensemble learning method and combine multiple ML models to improve the results [17].
Ragb et el. propose a hybrid GRU-LSTM model for real estate price prediction. The model combines the strengths of both GRU and LSTM recurrent neural networks. The results of these experiments in Boston dataset showed that the proposed model has better performance when the networks are used in the fusion process than when they act individually [18].
3. Materials and Methods
The research methodology consists of the following phases (Figure 1):
- 1.
- Literature Review
First, a thorough literature review was made to identify state-of-the-art models and available datasets. This step was crucial for deciding which models will be implemented and compare the proposed KAN-based model with them in the corresponding datasets.
- 2.
- Data Collection and Preprocessing
After that, data collection, preprocessing and cleaning to ensure the quality and consistency of the data for subsequent analysis. Next section provides all the necessary details.
- 3.
- Model Development and Validation
State-of-the-art models found in the literature were developed and validated, specifically tailored for regression and house price prediction task.
In detail, the following deep learning neural network models were implemented:
- Proposed ΚAΝ
Kolmogorov–Arnold Networks (KANs) are designed based on the Kolmogorov–Arnold theorem, which asserts that any multivariate continuous function can be represented as a finite sum of univariate functions. This philosophy forms the backbone of KANs, where the network architecture is structured to decompose a complex multivariate function into simpler univariate components and their interactions. The mathematical representations for the multivariate function and the output neuron are given below:
Where Φq(u)=tanh(u) or Φq(u)=max(0,u) (ReLU)
- Multilayer Perceptron (MLP)
The Multilayer Perceptron (MLP) is a type of feedforward neural network comprising an input layer, one or more hidden layers, and an output layer. Each layer is fully connected to the subsequent layer, and neurons use an activation function to introduce non-linearity. The mathematical representation for a neuron in a hidden layer is given by:
Where:
h = f(Wx + b)
- -
- h is the output of the neuron
- -
- W is the weight matrix
- -
- x is the input vector
- -
- b is the bias vector
- -
- f is the activation function (e.g., ReLU, sigmoid)
- Gated Recurrent Unit (GRU)
The Gated Recurrent Unit (GRU) is a variant of the Recurrent Neural Network (RNN) that addresses the vanishing gradient problem through gating mechanisms[19]. GRUs utilize reset and update gates to control the flow of information. The mathematical formulations are the following:
- Long Short-Term Memory (LSTM)
The Long Short-Term Memory (LSTM) network enhances the RNN by incorporating memory cells and three gating mechanisms: input, forget, and output gates[19]. These gates enable the model to retain long-term dependencies. The mathematical operations are provided below:
- Regression-Based Models
These models are primarily focused on fitting data through regression techniques. First, Linear Regression (LR) was utilized. Linear Regression tries to fit a straight line to minimize errors between predictions and actual values. Also. Random Forest Regressor was developed and tested. This algorithm combines multiple decision trees by averaging predictions for robustness.
- Boosting-Based Models
These models use boosting techniques to combine weak learners (e.g., decision trees) into a strong ensemble. XGBoost, CatBoost and LightGBM were implemented and tested [20,21,22].
- 4.
- Integration and Testing - Experiments
Comprehensive testing was conducted to evaluate the performance of the models. Two widely-used datasets were utilized for conducting the experiments, namely the Greece listings2 and the California house pricing3. Metrics such as MAE RMSE and SMAE were used to assess model effectiveness. Based on testing outcomes, iterative refinement of the models was undertaken to enhance their performance and reliability. The next section provides detailed information about the experiments and the results.
4. Results
The performance of the models was evaluated using Mean Absolute Error (MAE) Mean Squared Error (MSE) and Symetric MAE (SAME). In both situations, 90% of the records were randomly assigned for training the models, while 10% were used for testing. The experiments were carried out in Google Colab using the Python programming language and its relevant libraries (e.g. Deep-KAN for implementing the Kolmogorov-Arnold Network and TensorFlow for MLP and GRU-LSTM). To ensure a fair comparison between the models in predicting the house prices the study adhered to the following principles:
- (a)
- Exclusion of Feature Extraction Models: No feature extraction methods, such as autoencoders or Boltzmann Machines, were used beforehand. This decision was made to focus exclusively on the performance of the neuron classes themselves.
- (b)
- Model Optimization: The most effective configuration parameters (number of layers, neurons, optimizer, regularization, biases etc.) for each model were identified through hyperparameter tuning, which is a critical aspect of model development and validation. Hyperparameters play a pivotal role in defining both the structural and operational characteristics of a model, significantly influencing its performance. The prediction models underwent meticulous hyperparameter tuning using a combination of techniques. The process began with simpler methods, such as manual trial-and-error, and progressed to more systematic approaches, such as grid search. Grid search involves selecting a subset of the hyperparameter space and exhaustively testing different combinations. Table 1 below shows the optimal values for the KAN-based model in Datasets A and B.
- Dataset A – Greece Listings
The Greece House Listing dataset provides information on numerous properties for sale in Greece. The dataset comprises 20,000 rows and 25 columns, where each row represents a distinct property for sale. The columns that are included are the following:
- location_name (Municipal of the house. Categorical feature. 73 unique values. Most common Athens 21%).
- location_region (Region of the house. Categorical feature. Possible values: Attiki/Thessaloniki. Most common Attiki 94%).
- res_type (Type of the property. Possible values: Building, Apartment etc. 5 unique values).
- res_address (Secondary location attribute. This stands for the exact neighborhood of the property. Categorical feature. 987 unique values)
- res_price (Advertised Price for the property (in euro). This is the feature that the model has to predict. Mean value is 367000.
- res_sqr (Square meters of the property. Mean value is 169).
- construction_year (Construction year of the property).
- levels (levels for the property e.g. 1st floor, 2nd floor etc.).
- bedrooms (Number of bedrooms. Mean is 2.58).
- bathrooms (Number of bathrooms. Mean is 1.48).
- status (Current status for the property. Categorical feature. Possible values such as ‘good’, ‘renovated’ etc.8 unique values).
- energyclass (Categorical feature. The energy class is from the lowest level (H) to the highest (A+) in the following order: H, Ζ, Ε, Δ, Γ, Β, Β+, A, A+. There are also 3 possible values for the energy class: Non-effective, Excluded and Pending)
- auto_heating (Autonomous heating: 1 for Yes, 0 for No)
- solar (Solar Water heater: 1 for Yes, 0 for No)
- cooling (Cooling: 1 for Yes, 0 for No)
- safe_door (Safety door: 1 for Yes, 0 for No)
- gas (1 for Yes, 0 for No)
- fireplace (1 for Yes, 0 for No)
- furniture (1 for Yes, 0 for No)
- student (Is it appropriate for students? 1 for Yes, 0 for No)
Beginning with the data cleaning process, dependent columns, such as price per square meter, and columns that showed no statistically significant correlation (e.g. parking) were removed. Also rows that contained empty fields were also removed. Additionally, 5% of the outliers with respect to the price were removed, including the minimum and maximum values. Categorical variables were encoded using one-hot encoding and ordinal encoding techniques. Numerical variables were standardized using a standard scaler. Table 1 and Figure 2 below demonstrate the results sorted by performance (error), showing KAN outperforming significantly all the existing state-of-the-art approaches.

Table 2.
Results in Dataset A.
| Model Name | MAE | RMSE | SMAE (%) |
|---|---|---|---|
| KAN | 35861 | 52158 | 16,53 |
| GRU-LSTM | 36972 | 53763 | 16,92 |
| CatBoost | 37615 | 54918 | 17,14 |
| XGBoost | 38157 | 55711 | 17,41 |
| LGB | 38961 | 55906 | 17,98 |
| MLP | 39123 | 57034 | 18,07 |
| Random Forest | 46124 | 67341 | 21,16 |
| LR | 46451 | 68176 | 21,65 |
- Dataset B – California Housing
The California Housing Prices dataset is a popular dataset from Kaggle that contains information on the median house prices for various districts in California. The dataset contains a total of 20,640 records, with each record representing a different district in California. The dataset has a total of 10 columns, with each column representing a different attribute of the district. The attributes included in the dataset are as follows:
- longitude: Represents the longitude coordinate of the district. Mean value is -119.57.
- latitude: Represents the latitude coordinate of the district. Mean value is 35.63.
- housing_median_age: Represents the median age of the houses in the district. Mean value is 28.64.
- total_rooms: Represents the total number of rooms in the district. Mean is 2643.66.
- total_bedrooms: Represents the total number of bedrooms in the district. Mean is 538.43
- population: Represents the total population of the district. Mean is 1425.48.
- households: Represents the total number of households in the district. Mean is 499.54.
- median_income: Represents the median income of the households in the district. Mean value is 3.87.
- median_house_value: Represents the median house value in the district. 206855.
- ocean_proximity: Represents the proximity of the district to the ocean. It contains five different categories.
Regarding the data cleaning process, rows that contained empty fields were removed. Additionally, 5% of the outliers with respect to the median house value were removed, including the minimum and maximum values. The Categorical variable was encoded using one-hot encoding. Numerical variables were standardized using a standard scaler. Table 2 and Figure 3 below demonstrate the results sorted by performance (error), showing KAN outperforming significantly all the existing state-of-the-art deep NN approaches. Traditional machine learning algorithms XGBoost and LGB have better slightly better results because of the nature of the dataset. California housing has few input variables and also not so many rows, which makes it hard for NN-based models to get their full potential.
Table 3.
Results in Dataset B - California Housing.
| Model Name | MAE | RMSE | SMAE (%) |
|---|---|---|---|
| XGBoost | 30625 | 42477 | 15.81 |
| LGB | 30792 | 42709 | 15.93 |
| KAN | 31961 | 44191 | 16.45 |
| Random Forest | 32774 | 45458 | 16.87 |
| GRU-LSTM | 33174 | 46012 | 16.98 |
| MLP | 35723 | 49548 | 17.14 |
| CatBoost | 36345 | 50411 | 18.67 |
| LR | 40452 | 56107 | 20.26 |
5. Discussion
Starting with the first dataset, the Kolmogorov-Arnold Network (KAN) demonstrated its strength by achieving the lowest Mean Absolute Error (MAE) of 35,861, Root Mean Squared Error (RMSE) of 52,158 and SMAE 16,53%. It outperformed advanced architectures like GRU-LSTM and widely used machine learning models such as CatBoost, XGBoost, and LightGBM. These results underline KAN's capability to capture complex nonlinear relationships and deliver robust performance on intricate datasets. In contrast, in the California housing dataset XGBoost and LightGBM emerged as the top performers, achieving the lowest MAE (30,625, RMSE (42,477) and SMAE 15,81%. KAN, while competitive, registered a slightly higher MAE of 31,961, RMSE of 44,191 and SMAE 16,45%. This difference highlights a notable aspect of KAN's behavior: its performance tends to excel with larger datasets and high-dimensional inputs, where its advanced approximation capabilities and ability to model intricate patterns shine. However, on smaller datasets like California housing, with fewer rows and limited input variables, ensemble-based methods such as XGBoost and LightGBM might be better suited due to their inherent ability to optimize simpler feature interactions and adapt efficiently to constrained datasets.
These findings highlight both the strengths and the challenges of KANs in regression problems. KANs have demonstrated exceptional capabilities in scenarios that demand complex function approximation. This makes such models particularly transformative for datasets characterized by extensive variables and intricate high-dimensional relationships, such as those found in marketing, financial modeling etc. By modeling non-linear interactions and identify subtle patterns within data, KANs can often surpass conventional regression techniques in terms of accuracy and insight generation.
However, one of their most significant challenges lies in its performance on small or low-dimensional datasets. In such cases, simpler models like linear regression, decision trees, or ensemble methods (e.g., Random Forest or Gradient Boosting) can often outperform KANs and (NNs in general) due to their ability to effectively capture straightforward relationships with minimal computational overhead. The added complexity of KAN can lead to overfitting or unnecessary computational expenses when simpler methods suffice. Further challenges with KANs include its computational complexity, the need for careful hyperparameter tuning, and the expertise required for effective implementation. Addressing these challenges—by streamlining its computational requirements and enhancing its adaptability to diverse datasets—could unlock its broader application in predictive regression tasks, reinforcing its potential as a leading model in advanced machine learning applications.
6. Conclusions
In this study, a custom KAN-based Deep Neural Network model is proposed for house price estimation problem. The network architecture supports a deep neural network, consisting of multiple layers. To evaluate the performance of the KAN network, we used two datasets: the Greek Listings dataset, which consists of real estate listings in Greece, and the California House dataset, which contains data related to houses in California. Both datasets were obtained from Kaggle and are available there.
Based on the analysis conducted on the two datasets, the results show that the custom KAN-based model can outperform the best regression algorithms and traditional neural network models in terms of predictive accuracy (regarding MAE and MSE metrics that were tested). These findings demonstrate that KANs have significant potential for improving predictive performance in real-world applications. Furthermore, the outcomes prove the efficiency of spiking neural networks in modeling complicated, dynamic systems with incomplete and noisy data. Overall, the results provide strong evidence for the use of KANs as a powerful and adaptable tool for data analysis and decision-making.
Regarding the future directions of this research, multiple plans have been outlined to further extend this study. One direction is to conduct more experiments with various types of KAN-based architectures to explore their full potential in greater detail. Another potential approach is to investigate the applicability of KANs in other domains beyond housing price prediction, such as healthcare and finance, to identify any similarities or differences in their performance. Finally, it is hoped that this research will inspire new research directions and collaborations in the field of neural networks, opening the way for further innovation and breakthroughs in the field of artificial intelligence.
Author Contributions
Conceptualization, I.V. and A.T.; Approach, I.V. and A.T.; Implementation, I.V.; Resources, I.V.; Writing—original draft preparation, I.V.; Writing—review and editing, V.I and A.T.; Supervision, A.T.; Project administration, I.V. and A.T.; All authors have read and agreed to the published version of the manuscript
Funding
Please add: “This research received no external funding”.
Data Availability Statement
The following datasets can be downloaded at https://www.kaggle.com.
Conflicts of Interest
“The authors declare no conflicts of interest.”
References
- M. Feth, “Proptech: The real estate industry in transition,” The Routledge Handbook of FinTech, no. 2017, pp. 385–391, 2021. [CrossRef]
- N. Siniak, T. Kauko, S. Shavrov, and N. Marina, “The impact of proptech on real estate industry growth,” IOP Conf Ser Mater Sci Eng, vol. 869, no. 6, 2020. [CrossRef]
- X. He, Z. Lin, and Y. Liu, “Volatility and Liquidity in the Real Estate Market,” Journal of Real Estate Research, vol. 40, no. 4, pp. 523–550, Oct. 2018. [CrossRef]
- F. Braesemann and A. Baum, “PropTech: Turning Real Estate Into a Data-Driven Market?,” SSRN Electronic Journal, pp. 1–22, 2020. [CrossRef]
- T. Adamczyk and A. Bieda, “The applicability of time series analysis in real estate valuation,” Geomatics and Environmental Engineering, vol. 9, no. 2, p. 15, 2015. [CrossRef]
- R. T. Mora-Garcia, M. F. Cespedes-Lopez, and V. R. Perez-Sanchez, “Housing Price Prediction Using Machine Learning Algorithms in COVID-19 Times,” Land (Basel), vol. 11, no. 11, 2022. [CrossRef]
- A. Kundu, A. Sarkar, and A. Sadhu, “KANQAS: Kolmogorov-Arnold Network for Quantum Architecture Search,” EPJ Quantum Technol, vol. 11, no. 1, p. 76, 2024. [CrossRef]
- Z. Liu et al., “KAN: Kolmogorov-Arnold Networks,” pp. 1–50, 2024, [Online]. Available: http://arxiv.org/abs/2404.19756.
- M. Moradi, S. Panahi, E. Bollt, and Y.-C. Lai, “Kolmogorov-Arnold Network Autoencoders,” 2024, [Online]. Available: http://arxiv.org/abs/2410.02077.
- B. Jiang, Y. Wang, Q. Wang, S. Member, and H. Geng, “A Hybrid KAN-ANN based Model for Interpretable and Enhanced Short-term Load Forecasting,” 2024.
- X. Yang and X. Wang, “Kolmogorov-Arnold Transformer,” pp. 1–19, 2024, [Online]. Available: http://arxiv.org/abs/2409.10594.
- J. Hollósi, Á. Ballagi, G. Kovács, S. Fischer, and V. Nagy, “Detection of Bus Driver Mobile Phone Usage Using Kolmogorov-Arnold Networks,” Computers, vol. 13, no. 9, p. 218, 2024. [CrossRef]
- V. Limsombunc, C. Gan, and M. Lee, “House Price Prediction: Hedonic Price Model vs. Artificial Neural Network,” Am J Appl Sci, vol. 1, no. 3, pp. 193–201, 2004. [CrossRef]
- B. Afonso, L. Melo, W. Oliveira, S. Sousa, and L. Berton, “Housing Prices Prediction with a Deep Learning and Random Forest Ensemble,” no. September, pp. 389–400, 2020. [CrossRef]
- A. Nouriani and L. Lemke, “Vision-based housing price estimation using interior, exterior & satellite images,” Intelligent Systems with Applications, vol. 14, 2022. [CrossRef]
- J. Kim, Y. Lee, M. H. Lee, and S. Y. Hong, “A Comparative Study of Machine Learning and Spatial Interpolation Methods for Predicting House Prices,” Sustainability (Switzerland), vol. 14, no. 15, 2022. [CrossRef]
- H. Joshi and S. Swarndeep, “A Comparative Study on House Price Prediction using Machine Learning,” International Research Journal of Engineering and Technology, pp. 782–788, 2022.
- H. Ragb, A. Muntaser, E. Jera, A. Saide, and I. Elwarfalli, “Hybrid GRU-LSTM Recurrent Neural Network-Based Model for Real Estate Price Prediction Hybrid GRU-LSTM Recurrent Neural Network-Based Model for Real Estate Price Prediction,” 2023. [CrossRef]
- H. Ragb, A. Muntaser, E. Jera, A. Saide, and I. Elwarfalli, “Hybrid GRU-LSTM Recurrent Neural Network-Based Model for Real Estate Price Prediction Hybrid GRU-LSTM Recurrent Neural Network-Based Model for Real Estate Price Prediction,” 2023. [CrossRef]
- A. Natekin and A. Knoll, “Gradient boosting machines, a tutorial,” Front Neurorobot, vol. 7, p. 21, 2013. [CrossRef]
- L. Prokhorenkova, G. Gusev, A. Vorobev, A. V. Dorogush, and A. Gulin, “Catboost: Unbiased boosting with categorical features,” Adv Neural Inf Process Syst, vol. 2018-Decem, no. Section 4, pp. 6638–6648, 2018.
- G. Ke et al., “LightGBM: A highly efficient gradient boosting decision tree,” Adv Neural Inf Process Syst, vol. 2017-Decem, no. Nips, pp. 3147–3155, 2017.
| 1 | https://www.statista.com/statistics/682549/average-price-per-square-foot-in-new-single-family-house s-usa/ |
| 2 | https://www.kaggle.com/datasets/argyrisanastopoulos/greece-property-listings |
| 3 | https://www.kaggle.com/code/ahmedmahmoud16/california-housing-prices |
Figure 1.
Research Methodology.
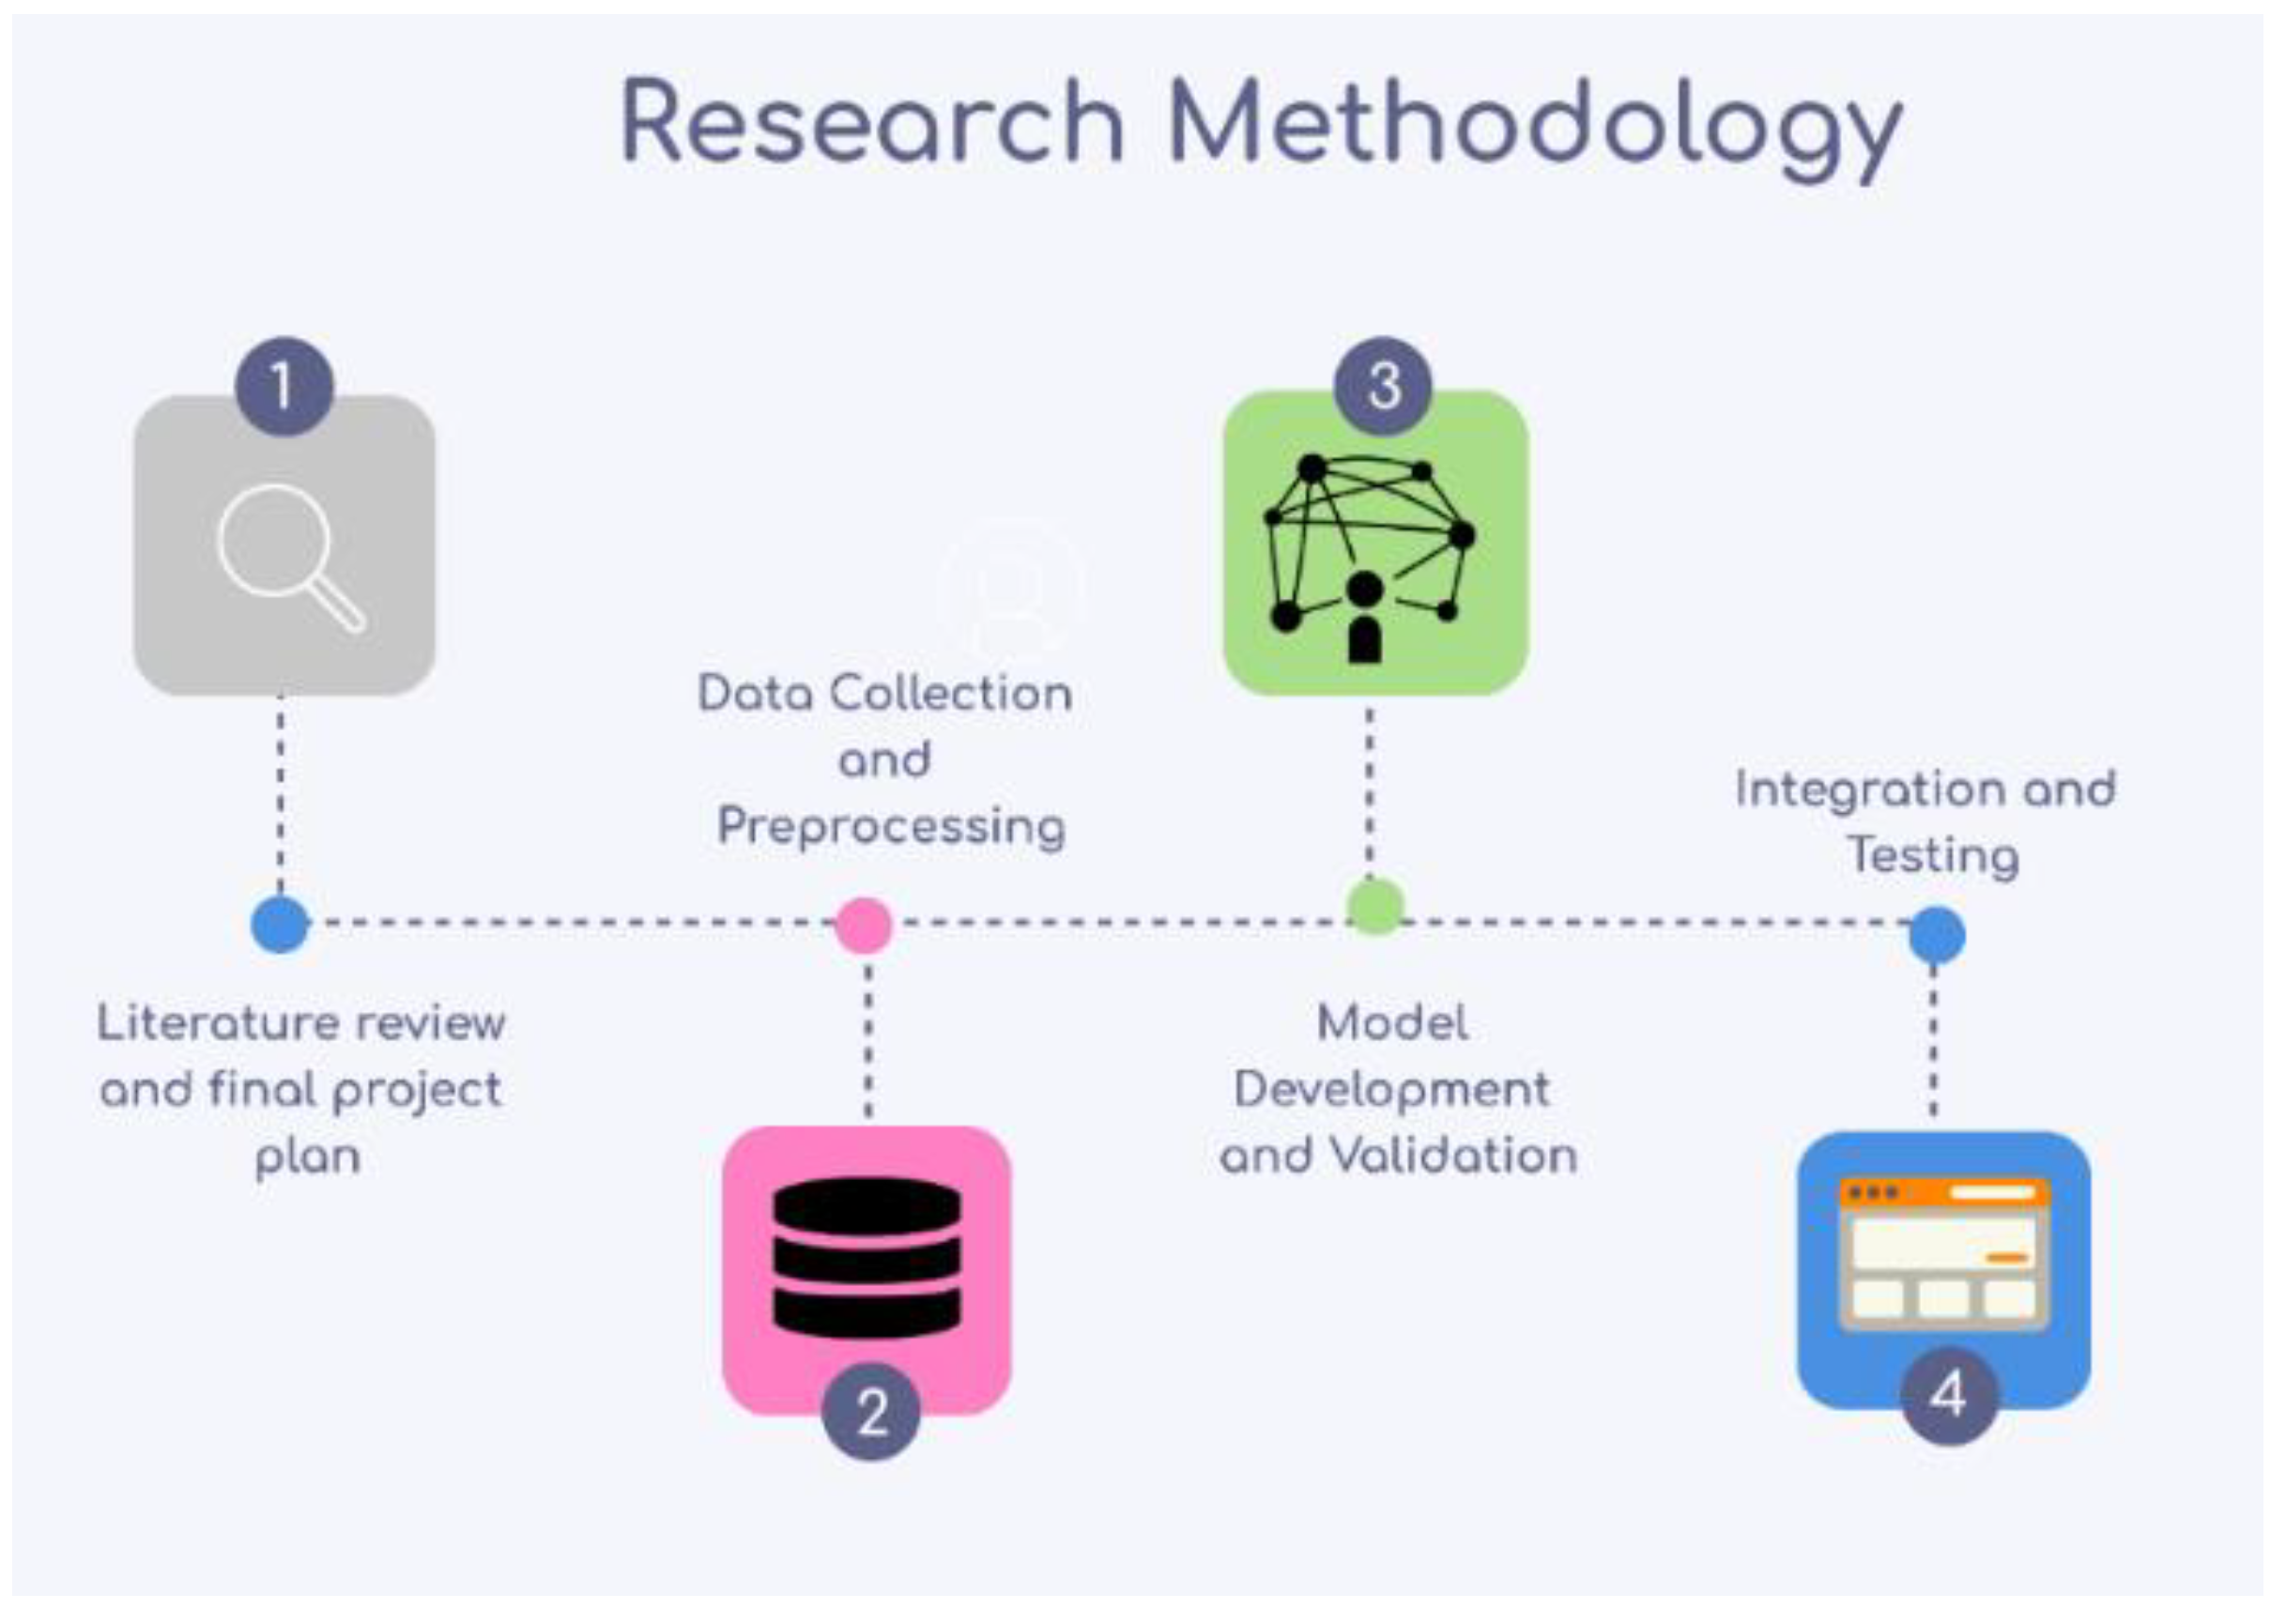
Figure 2.
Models’ Performance in Dataset A.
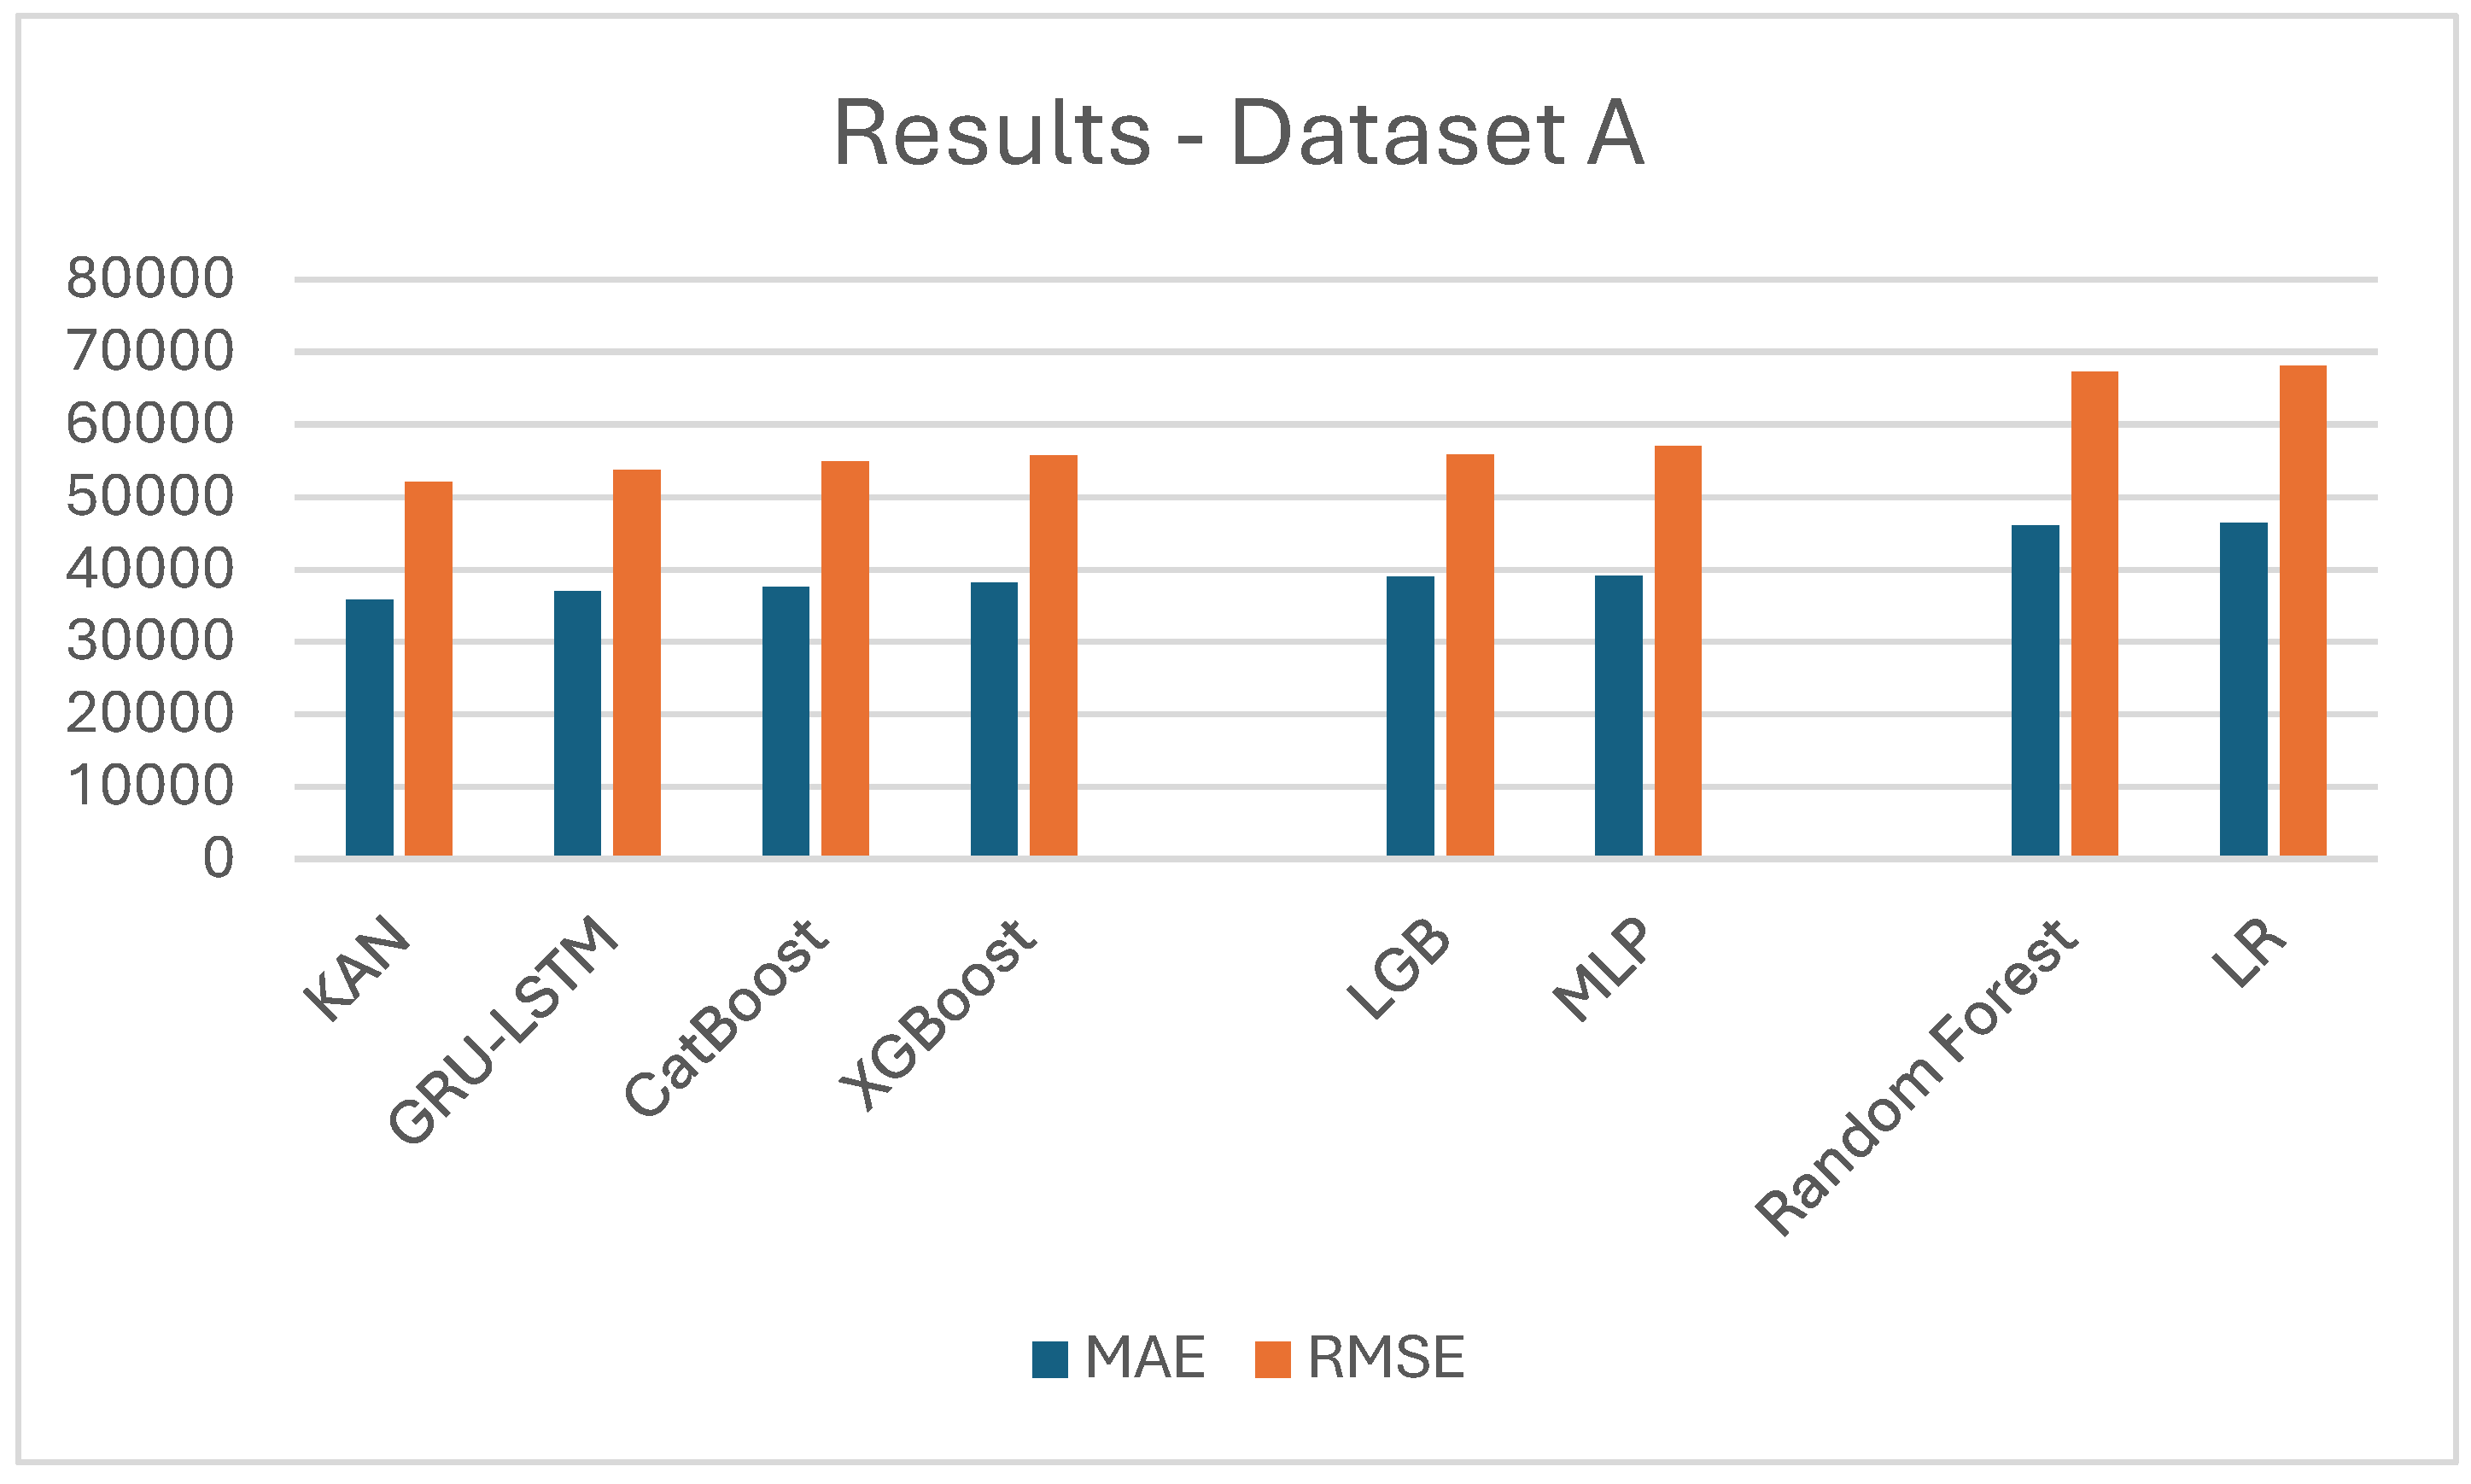
Figure 3.
Models’ Performance in Dataset B.
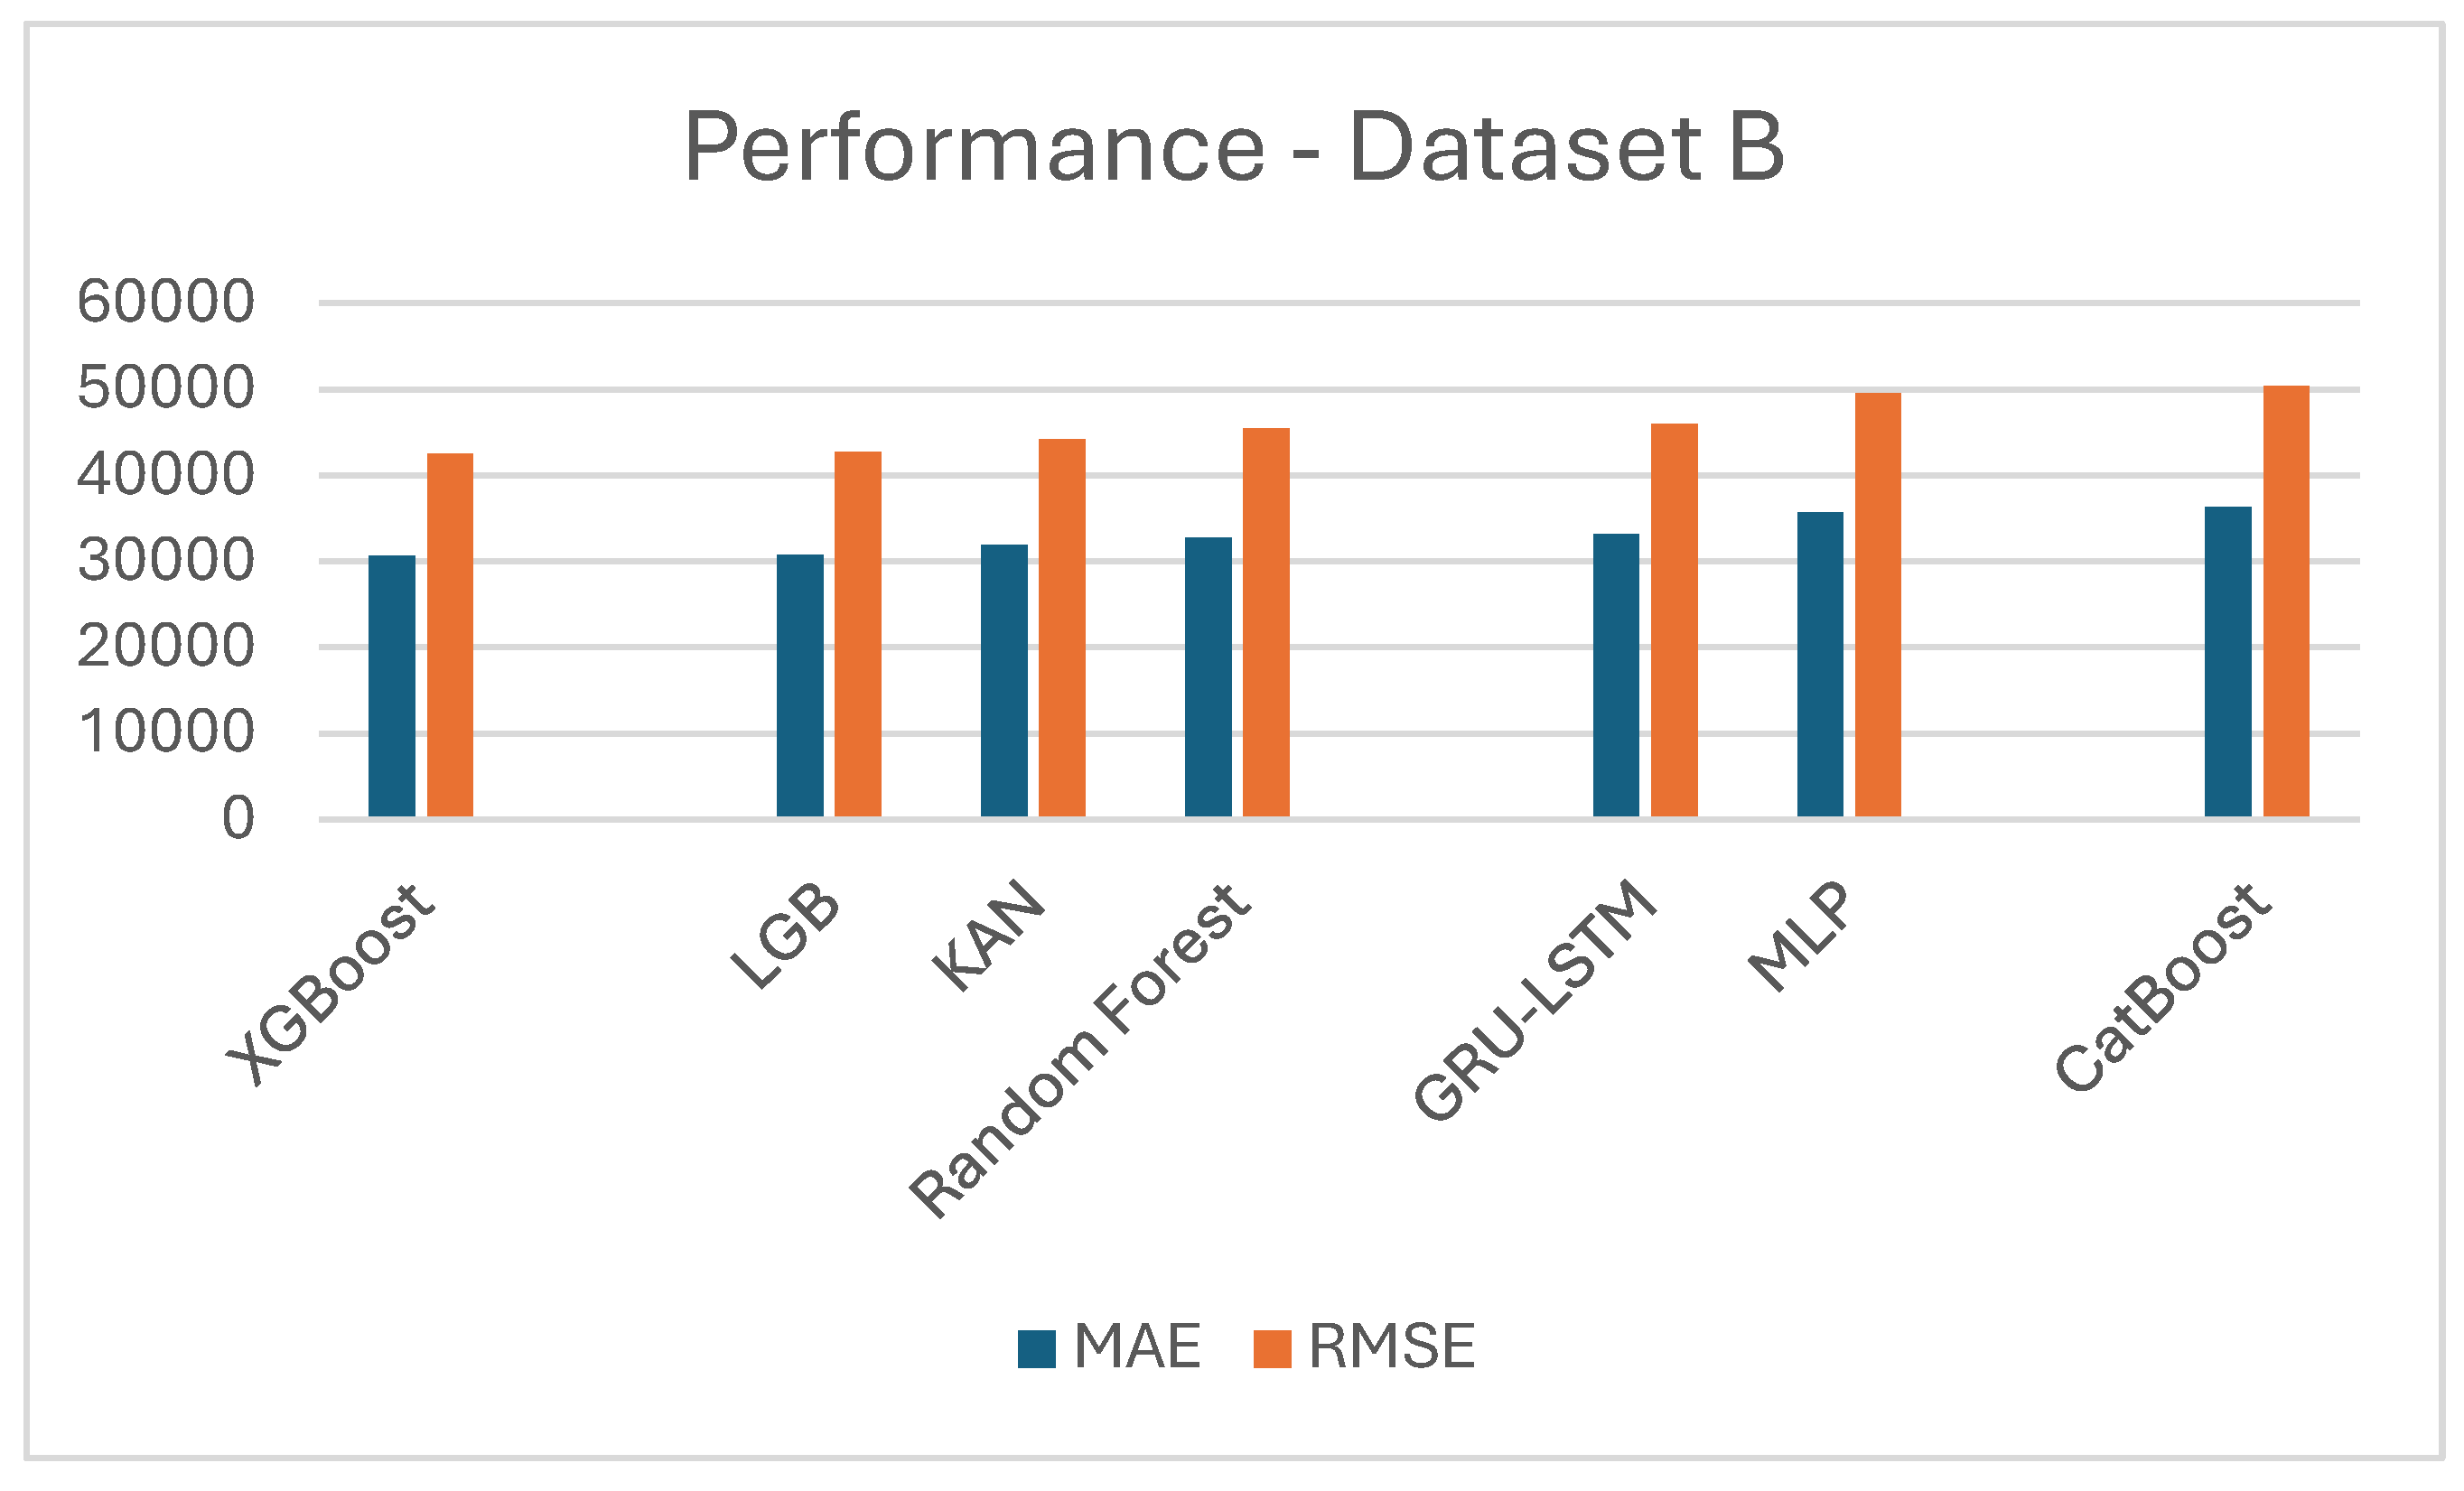
Table 1.
Optimal Parameters for KAN.
| Parameter | Optimal Values Dataset A | Optimal Values Dataset B |
|---|---|---|
| Model Architecture | 256-128-64-32-1 | 50-40-30-20-1 |
| Optimizer | Adam | Adam |
| Activation Function | ReLU | ReLU |
| Number of knots | 5 | 5 |
| Spline Layer | 9 | 9 |
| Learning Rate | 0.001 | 0.01 |
| Batch size | 8 | 8 |
| Number of Epochs | 200 | 200 |
Disclaimer/Publisher’s Note: The statements, opinions and data contained in all publications are solely those of the individual author(s) and contributor(s) and not of MDPI and/or the editor(s). MDPI and/or the editor(s) disclaim responsibility for any injury to people or property resulting from any ideas, methods, instructions or products referred to in the content. |
© 2024 by the authors. Licensee MDPI, Basel, Switzerland. This article is an open access article distributed under the terms and conditions of the Creative Commons Attribution (CC BY) license (http://creativecommons.org/licenses/by/4.0/).
Copyright: This open access article is published under a Creative Commons CC BY 4.0 license, which permit the free download, distribution, and reuse, provided that the author and preprint are cited in any reuse.


