
Submitted:
16 December 2024
Posted:
17 December 2024
You are already at the latest version
Abstract
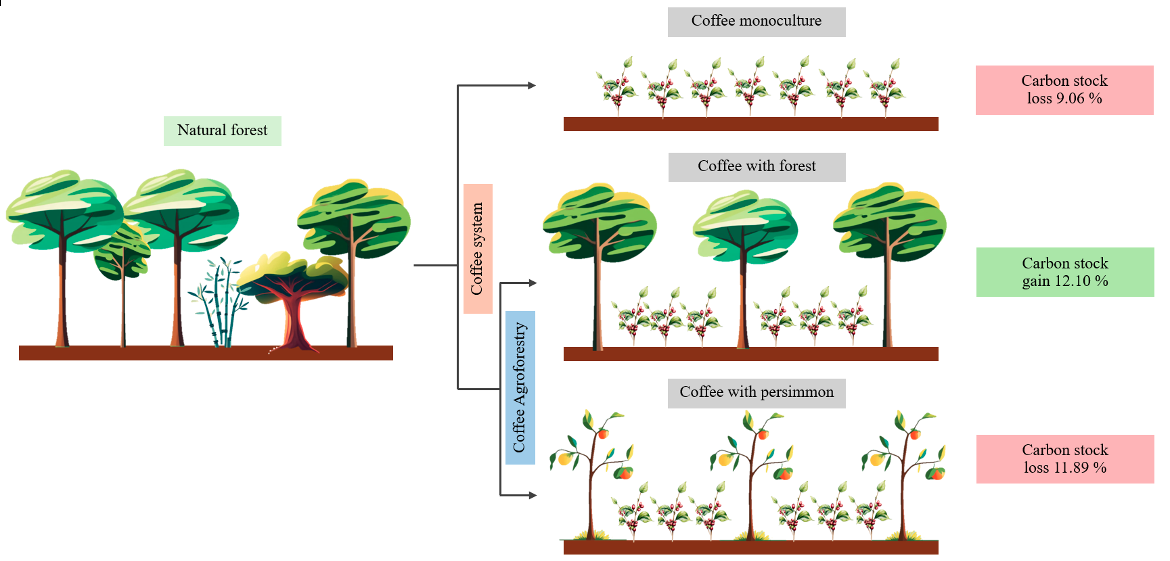
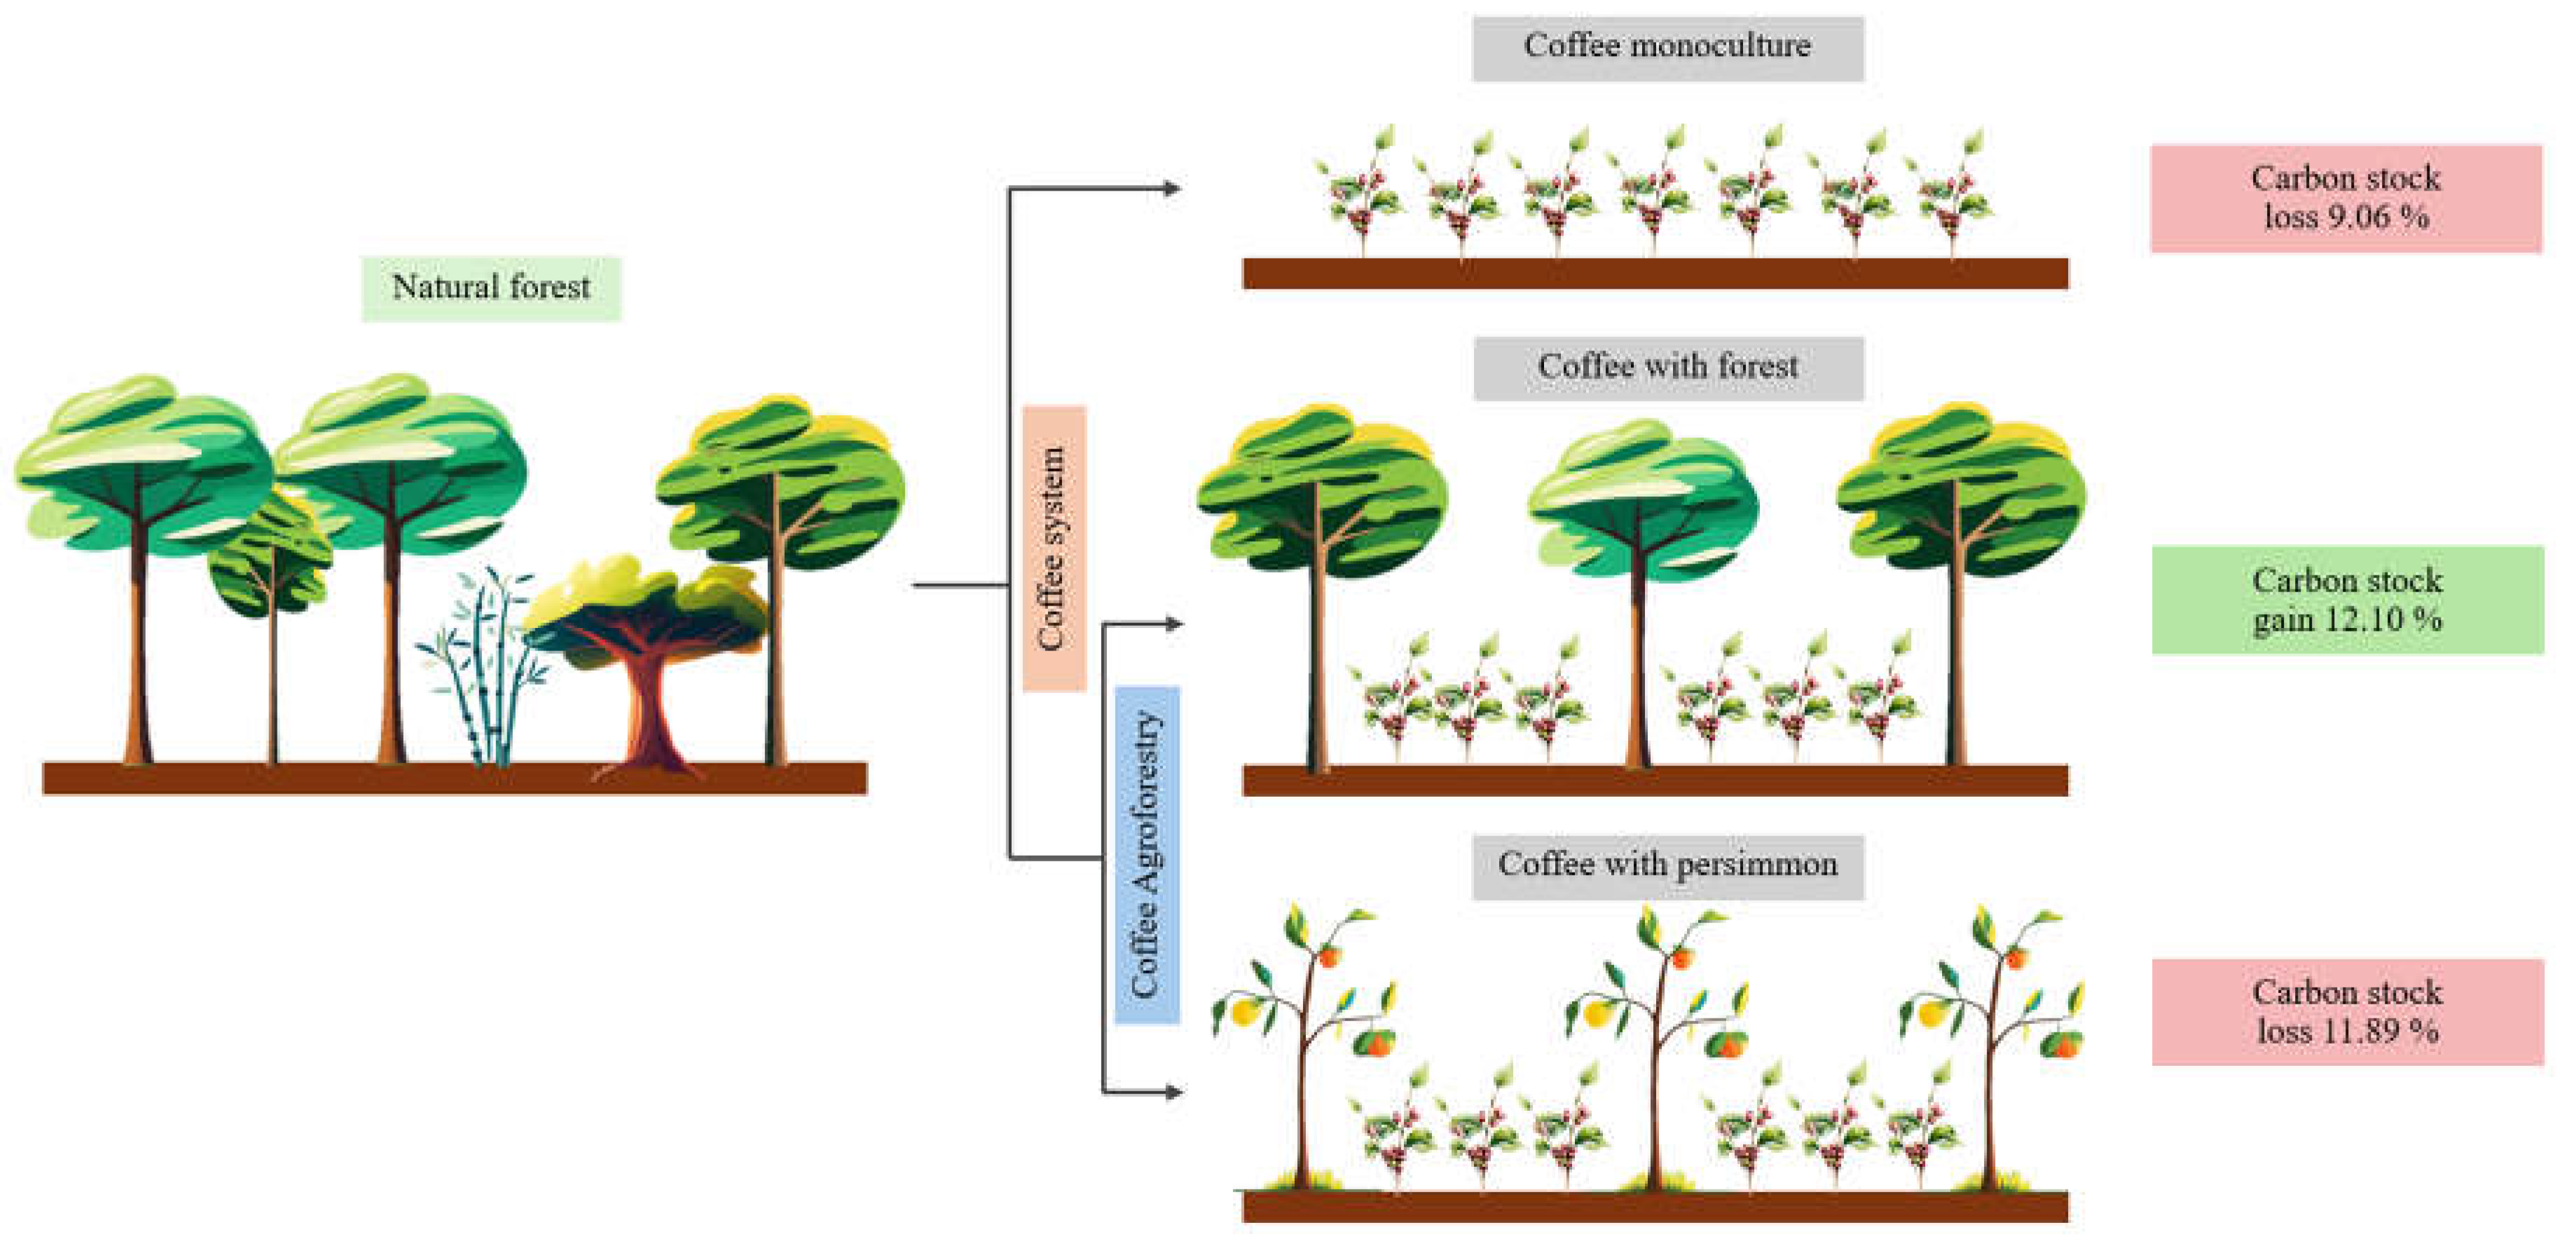
The increasing demand for agricultural land is driving deforestation, which contributes to rising greenhouse gas emissions—a primary driver of climate change. Agroforestry systems present a valuable alternative approach for mitigating these emissions. This study investigates the influence of various agroforestry systems on key parameters for assessing soil carbon dynamics, including soil carbon stock, microbial biomass carbon (MBC), and microbial respiration (MR) in northern Thailand. The study compared different agroforestry systems: coffee monoculture (CA), coffee intercropped with forest trees (CF), coffee intercropped with persimmon trees (CP), and natural forest (NF) as reference areas. Soil samples were collected from three depths (0–20, 20–40, and 40–60 cm) across three seasons (rainy, cold, and summer). Results showed that soil carbon from land-use changes from NF to coffee agroforestry systems led to a 12.10% increase in CF and an 11.89% decrease in CP. The CA system showed a non-significant 9.06% decrease compared to the natural forest. MBC levels were higher in the agroforestry coffee areas (CF and CP), comparable to those in NF. However, CA exhibited significantly lower MBC (p < 0.05) compared to other treatments. While MBC and MR showed a positive correlation, higher MBC did not necessarily indicate increased microbial activity or significant dissolved organic carbon (DOC) accumulation. Environmental factors, particularly seasonal variations, significantly influenced the results across all three investigations. This study demonstrates that both agroforestry coffee systems (CF and CP) more effectively mitigate deforestation impacts and enhance soil fertility compared to coffee monoculture. For carbon stock enhancement specifically, CF emerged as the optimal choice.
Keywords:
agroforestry
; coffee system
; soil carbon stock
; mineralization rates
; SDGs15
Graphical Abstract
1. Introduction
Northern Thailand, a region known for its dense forests and rich biodiversity, has experienced significant deforestation in recent decades, primarily driven by agricultural expansion. Local farmers, often using slash-and-burn practices, clear vast areas of forest to meet the growing demand for cash crops like maize, rubber, and coffee. While these agricultural activities contribute to the local economy, the environmental costs are profound (Kamthonkiat et al., 2021). Deforestation in this region not only threatens local ecosystems and biodiversity (Saikhammoon et al., 2023; Xiao et al., 2023) but also plays a significant role in exacerbating climate change. As stored carbon is released into the atmosphere in the form of carbon dioxide, deforestation for agriculture has become a critical concern for both regional and global climate initiatives (Arunrat et al., 2024; Kamolrattanakul et al., 2022; Masson-Delmotte et al., 2021).
Arabica coffee has become a valuable economic crop in northern Thailand, particularly in the highland regions where cool temperatures and fertile soil create ideal conditions for its cultivation. Initially introduced as part of efforts to promote sustainable livelihoods and replace opium cultivation, Arabica coffee quickly gained importance for its economic benefits to local farmers and its potential to thrive in mountainous areas (Lilavanichakul, 2020; Noppakoonwong et al., 2014). However, its expansion posed challenges, as monoculture practices often led to deforestation and environmental degradation. Agroforestry systems that integrate Arabica coffee with native trees and other crops have emerged as a solution to balance economic growth and environmental preservation. Agroforestry not only improves coffee quality and yields but also helps reduce deforestation, restore soil fertility, and protect biodiversity by maintaining forest cover (Angkasith, 2002). This shift towards more sustainable agricultural practices underscores the role of Arabica coffee as both a key economic driver and a tool for environmental conservation in northern Thailand.
Agroforestry is thus a representative of a forest in which plants can use carbon dioxide in the photosynthesis process to create organic carbon and accumulate plant biomass. When plant parts fall to the ground and are digested by microorganisms in the soil, organic carbon is deposited in the soil. This contains plant root-exuded organic matter, dead microbial cells, and chemicals synthesized by microbes. The process of storing carbon in the soil is known as carbon sequestration. This is considered one of the carbon management approaches to reduce carbon dioxide emissions in the atmosphere by storing carbon in the soil. The primary carbon stores are soil, air, and water (Tippayachan, 2006). Forest areas store more carbon in the soil than general agricultural areas (Jagadesh et al., 2023). Especially in the part of the fine roots and small soil fragments. This represents long-term stable carbon storage and restoration of soils in degraded areas (Ferreiro-Domínguez et al., 2022), and includes agroforestry as well (Lorenz & Lal, 2005; Rodríguez et al., 2021). Soil fertility encompasses more than merely plant nutrition. However, here are involve the living microorganisms in the soil systems. The respiration of plant roots, benthic animals, and soil microorganisms that decompose organic matter all control the production of nutrients in the soil (Arun Jyoti et al., 2015; Llorente & Turrión, 2010; Soleimani et al., 2019).
Although several studies have reported the benefits of agroforestry systems, there is still remaining the gap information on studying the land use change from forest to coffee plantation on the soil carbon dynamic. Additionally, research on how coffee agroforestry and monoculture coffee cultivation influence carbon sequestration in Thailand remains inadequately documented. Therefore, the objectives of this study are (i) to assess soil carbon stock in different coffee cropping systems, (ii) to understand carbon cycle and its mineralization under various coffee cropping systems, and (iii) to examine the seasonal changes across three distinct seasons to understand the short-term carbon dynamics. The systematic examination of land use alterations on soil carbon reserves across several agroforestry systems was assessed. Comparisons between traditional coffee cultivation and agroforestry adaptation were also examined to promote sustainable coffee production and mitigate greenhouse gas emissions.
2. Material and Methods
2.1. Study Area
The study area is located at the Nhong Hoi Highland Agricultural Research Station in Pong Yang Sub-district, Mae Rim District, Chiang Mai Province, Thailand (18◦55′19.6″N 98◦48′55.0″E) (Figure 1). The total land area is about 13 ha, with an elevation ranging from 850 to 900 meters above mean sea level. The average annual precipitation amounts to 1,355 mm. The mean temperature is approximately 28.5 °C. The average slope is about 20%. Within the boundaries of the area lies an unclassified natural deciduous forest, devoid of any specific categorization of tree species. The primary agricultural crop testing area encompasses arabica coffee (Coffea arabica L.), persimmon (Diospyros virginiana L.), plum (Prunus domestica L), and avocado (Persea americana). The area is initially a pristine deciduous forest. Subsequently, it is designated as a research zone for the cultivation of crops suitable for highland environments. The development of Arabica coffee cultivars with various planting strategies is the primary goal. These coffee systems encompass coffee monoculture systems, coffee grown with forests systems, and coffee grown with persimmons systems.
2.2. Data Collection
The sampling sites represented four distinct land-use types: natural forest (NF), coffee monoculture (CA), coffee intercropped with forest trees (CF), and coffee intercropped with persimmon trees (CP). Soil samples were randomly collected in 3 replicates of each sampling site across three seasons: the rainy season (September), the cold season (December), and the summer season (April) of the 2022-2023 period. At each sampling site, soils were extracted at depths of 0-20 cm, 20-40 cm, and 40-60 cm, from both disturbed and undisturbed methods. The disturbed soil samples were carefully processed by removing stones and roots, drying, and sieving through a 2 mm mesh to eliminate unwanted particles. A subset of samples was kept at 4°C for subsequent analysis of soil microbial activity. Environmental data, including temperature and humidity, were recorded daily from 9:00 a.m. to 4:00 p.m. using TinyTag Plus 2 data loggers for a period of 223 days, spanning from October 9, 2022 to April 20, 2023 (Figure 2).
2.3. Soil Physicochemical and Microbial Analysis
Undisturbed soil samples were collected to determine bulk density (BD) using the core method (Klute, 1986). Soil sample was quantified water content (SWC) by gravimetrically method (Reynolds, 1970) in oven-dried at 105°C until constant weight. The air-dried and sieved soil samples were analyzed for various physicochemical properties. Soil particle size distribution was determined using the hydrometer method (Gee & Or, 2002) to assess soil texture. Soil pH and electrical conductivity (EC) were measured in deionized water (1:5 soil:water ratio) using a pH meter (Peech, 1965) and an EC meter (Rhoades, 1996), respectively. Total carbon and nitrogen concentrations were determined by dry combustion using an elemental analyzer (CHN-O-RAPID, Heraeus, Germany). Soil available phosphorus (P) was extracted using the Bray II method and quantified colorimetrically (Aquino & Hanson, 1984). Soil exchangeable potassium (K), exchangeable calcium (Ca) and magnesium (Mg) were extracted with ammonium acetate and measured by atomic emission spectrophotometry (Fukuda et al., 2017). Soil carbon stock (C stock) and soil nitrogen stock (N stock) for each soil depth were calculated using the following Formulas (1) and (2), respectively:
where C stock indicates soil C stock (t C ha−1); N stock indicates the soil total nitrogen (t N ha−1); C is the percentage of total C content; N is the percentage of total nitrogen; BD is the bulk density (g cm−3); d is a soil thickness (cm) (Hergoualc’h et al., 2012).
C stock = C (%) × BD × d
N stock = N (%) × BD × d
To assess soil organic matter mineralization, soil microbial activity, including microbial respiration rate (MR), microbial biomass carbon (MBC), and dissolved organic carbon (DOC), freshly collected surface soil samples (0-20 cm depth) were stored at 4°C prior to analysis. MR was determined by quantifying the CO2 evolved during a 50-day incubation period at 25°C, using a modified alkaline adsorption method (Leifeld et al., 2002; Usman et al., 2004). Fifty gram of soil was placed in a 1 L jar with 1 bottle of 0.1 M NaOH 20 ml solution, then sealed the jar. NaOH was then titrated with 0.1 M HCl using a 0.5 M BaCl solution and 1% phenolphthalein on days 3, 7, 14, 21, 35, and 50 after incubation and changing the NaOH solution every time (Reis dos Santos Bastos et al., 2023). MBC and DOC were measured using the chloroform fumigation-extraction method (Vance et al., 1987). Soil sample (10 gram) was extracted with 50 ml of 0.5 M K2SO4 for 45 minutes on a shaker (240 RPM). The extractable carbon was released into K2SO4 extracted solution from non-fumigated soil (Llorente & Turrión, 2010), and the soil was fumigated with chloroform for 48 hours at 25°C. The extracted solution was analyzed for carbon content by the wet oxidation method with 0.07 M K2Cr2O7, then titrated with 0.01 M (NH4)2 [Fe(SO4)2.6H2O. The DOC and MBC were calculated using the Equations (3) and (4), respectively.
DOC (µg kg-1 soil) = Cfum
MBC (µg kg-1 soil) = (Cfum - Cnon-fum)
where:
DOC = Dissolved Organic Carbon
MBC = Microbial Biomass Carbon
Cfum = Carbon in fumigated sample
Cnon-fum = Carbon in non-fumigated sample
2.4. Statistical Analyses
Statistical analyses were conducted using Statistix version 10 software. One-way analysis of variance (ANOVA) followed by the least significant difference (LSD) test at a significance level of p ≤ 0.05 was employed to evaluate the differences in soil variables among different land-use types and soil depths independently. A two-way ANOVA coupled with the LSD test (p ≤ 0.05) was used to assess the main and interactive effects of land use and soil depth on the measured soil properties. The T-test was employed to assess alterations in carbon stock comparing natural forest areas and coffee cultivation areas, specifically the changes from NF to CA, CF, and CP. To elucidate and evaluate alterations in carbon stocks across various depths (0–20, 20–40, and 0–60 cm). Linear regression analysis was performed to examine the relationships between microbial activity parameters (MR, MBC, and DOC) and C stock. Pearson’s correlation coefficients were calculated to quantify the strengths of associations among the measured soil parameters. Additionally, principal component analysis (PCA) was conducted on the soil parameter dataset to explore the patterns of variation and potential underlying drivers across the different land-use types.
3. Result
3.1. Soil Physical and Chemical Characteristics Before Experiment
The statistical analysis of soil characteristics between different land uses and soil depths is presented in Table 1. The significant interactions between land use type and soil depth were observed for key soil properties, including bulk density, clay content, total C and N, and available P. These interactive effects indicate that the influence of land use on these soil attributes varied across different soil depth intervals, or conversely, the depth-wise patterns of these properties differed among the various land use systems.
3.2. Changes in Soil Characteristics across the Different Land Uses and Seasons
The average values of soil characteristics across the different land uses in various seasons is shown in Figure 3a–l. As a BD result analysis (Figure 3a), the NF system exhibited the lowest BD among three seasons, indicating a less compacted soil structure within the study area. In contrast, the CA system consistently demonstrated the highest BD values, suggesting increased soil compaction likely due to intensive management practices. During the summer season, the CP system exhibited the highest BD values. Soil pH varied significantly among land uses and seasons (Figure 3b). During the rainy season, the coffee-forest (CF) and CA systems exhibited higher pH values compared to NF and CP. In the cold season, the pH order was CF > CP > CA > NF. However, no significant differences in pH were observed among the land uses during the summer season. Soil EC patterns also differed across land uses and seasons (Figure 3c). In the rainy season, EC followed the order CF > CA > CP > NF, while during the cold season, the order was CF > CP > CA > NF. Notably, no significant differences in EC were detected among the land uses during the summer season. However, total C and N concentrations, C/N ratio, and C and N stocks did not exhibit significant variations across the three seasons, regardless of land use (Figure 3d–h).The CA system consistently exhibited the highest levels of P across all three seasons, potentially due to fertilization practices associated with monoculture coffee cultivation (Figure 3i).Exchangeable K levels varied among land uses and seasons (Figure 3j). During the rainy season, CF and NF had higher exchangeable K levels than CA and CP, while in the cold season, CF and CP had higher exchangeable K than CA and NF. However, no significant differences in exchangeable K were observed during the summer season. The CF system exhibited the highest levels of exchangeable Ca, while NF had the lowest (Figure 3k). Furthermore, exchangeable Mg levels were significantly higher in CF and NF compared to CA and CP (Figure 3l).
3.3. Impacts of Coffee Agroforestry Systems on Soil Carbon Stock
The impact of soil depth on C stock was evident. Each land use type experienced distinct seasonal changes in C stock (Figure 4a–c). Changes in C stock were observed in the 0-20 cm soil layer (Figure 4a). Under rainy conditions, the C stock changes followed the pattern: CF > NR > CA > CP. In contrast, under cold conditions, the pattern was: CF > NR = CP > CA. During the summer, the C stock in the 20-40 cm soil layer decreased in the CF compared to the CA (Figure 4b). The CA exhibited the lowest C stock, with a decrease in the 40-60 cm soil layer (Figure 4b). However, no significant difference in C stock was observed due to land utilization. When comparing the 0-60 cm depth across seasons, no significant differences in C stock were found among the land use types (Figure 5).
Table 2 displays the results of the alterations in C stock due to the conversion of forest to various coffee growing systems. The soil layer at 0–60 cm has shown an increase in carbon stock accumulation due to conservation farming, with a significance value of P = 0.0037. However, C stock in the treatment of CA and CH decreased at the soil depth at 0–60 cm with values of P = 0.0729 and P = 0.0388, respectively.
3.4. Impacts of Coffee Agroforestry Systems on Microbial Activity
The results of coffee agroforestry systems on microbial activity including MBC and DOC are shown in Figure 6a and 6b, respectively. During the rainy season, the MBC was found to be highest in CF and NR treatments, and lowest in the CA treatment (Figure 6a). When entering the cold season, MBC was found to be similar results in NR, CF, and CP treatments, while CA remained the lowest value. However, no significant difference was found in MBC across the land use types in the summer season. The CA treatment had the highest DOC concentration during the rainy season, whereas the NR treatment had the highest DOC value throughout the summer (Figure 6b).
The result of MR analysis under coffee agroforestry systems during rainy, cold, and summer is shown in Figures 7a, 7b and 7c, respectively. The MR rate peaked on day 3 for every treatment. It was found that the order of MR rates was significant, with the order following of CF > CA > CP > NR, and MR values gradually decreased all three studied seasons (Figure 7a–c). CF had the highest MR value, and NR had the lowest. The results found that the cumulative MR was highest in CF and lowest in NR during rainy conditions (Figure 7a). Regularly, MR exhibited similar changes across the three seasons, and in the cold season after 10 days, no differences in MR were found between treatments during cold season (Figure 7b). As the weather turned to summer, there was a slight reversal of the cumulative MR position, namely CF > CP > NR = CA (Figure 8).
3.5. Relationships of Soil Parameters Through Linear Regression Correlation and Principal Component Analysis
Figure 9 shows the linear regression correlation between soil characteristics and influence C stock factors and soil depth at 0–20 cm., 20-40 cm. , and 40-60 cm. Relationship between soil characteristics and influence C stock factors and soil surface area (0–20 cm) positive parameters (P < 0.001) were C, N, and STN ; (P < 0.01) were clay, pH, EC, and Mg; and (P < 0.05) were CA, but the negative correlation in the soil surface was silt (P < 0.001) and BD (P < 0.05) (Figure 9a). Next, the soil stratum is 20–40 cm depth (Figure 9b), only C, N, and STN have a positive connection (P < 0.001). The parameters C/N, K, and Mg have p values less than 0.01, while pH has p valued less than 0.05. Lastly, the soil layer measures 40–60 cm soil depth, Positive correlations were seen with C and C/N (P < 0.001) (Figure 9c).
Figure 10 displays the result of linear regression among soil microbial activity, comprising MBC, DOC, MR, and C stock with different seasons. MBC during the rainy season (R2 = 0.4567) and winter (R2 = 0.3531) exhibited a relationship with C stock (p < 0.05) (Figure 10a), Similar observation was found in the treatment of MR. During the rainy season (R2 = 0.5164) MR has a relationship with C stock (P < 0.05) (Figure 10b). In terms of DOC, it was determined that all three seasons exhibited a value of (p > 0.05) (Figure 10c).
4. Discussion
4.1. Soil Physical and Chemical Characteristics
According to the obtained results from soil properties analysis under different land use types, the highlights of this study are discussed. Soil BD exhibited a statistically significant variation among land use types (p<0.001). The CA of each area has a unique characteristic, depending on the surface cover (Ferreiro-Domínguez et al., 2022; Jagadesh et al., 2023). Increasing plant cover can help reduce BD due to increased organic matter (Castro et al., 2008), and reduced plowing can also reduce BD (Adiyah et al., 2023a). In general, as the depth increased, the bulk density increased (Grüneberg et al., 2014; Parras-Alcántara & Lozano-García, 2014). Jagadesh et al. (2023) reported that the forest ecosystem had the lowest bulk density value, which was 1.31 g cm-3, compared to the tea plantation ecosystem at 1.40 g cm-3 and agricultural land at 1.35 g cm-3.
With respect to soil texture, higher sand content typically results in lower C content. Our findings in natural forest (NF) and coffee with forest (CF) areas align with Stevenson et al. (2024), who found that forest soils generally have higher clay content. While Castro et al. (2008) reported a positive correlation between clay and carbon content, our study found no significant differences in soil texture (sand, silt, and clay contents) across different land uses. These soils exhibit a characteristic clay distribution pattern resulting from pedogenetic processes, specifically clay migration. This process creates an argillic horizon in the subsoil with higher clay content compared to the topsoil. According to Parras-Alcántara & Lozano-García, (2014), a key characteristic of these soils is their low organic matter content. The soil texture analysis revealed exclusively clay content, which showed a significant increase with depth (p<0.01).
Although no significant difference was found in C content (p > 0.05), NF and CF areas showed higher values compared to CA and CP. This can be attributed to their natural forest characteristics and coffee-forest tree intercropping systems. Forest ecosystems generally store more soil carbon than agricultural areas, with fine roots and small soil fragments playing crucial roles (Ferreiro-Domínguez et al., 2022), alongside traditional plant diversity (Wu et al., 2020). Agroforestry systems demonstrate higher soil carbon sequestration compared to conventional row-crop systems (Chen et al., 2017; Negash et al., 2022; Paudel et al., 2011).
Nitrogen (N) patterns closely followed carbon trends, as N accumulation typically results from organic matter decomposition in plant residues (Castro et al., 2008; Oscar Kisaka et al., 2023a, 2023b; Souza et al., 2012) and microbial activity (Reis dos Santos Bastos et al., 2023; Singh et al., 2024). High carbon levels typically correlate with elevated nitrogen concentrations (Castro et al., 2008; Zipei et al., 2024), and agroforestry systems can help maintain nitrogen in its preferred ammonium form (Heimsch et al., 2023).
Essential plant nutrients (N, P, K, Ca, and Mg) showed decreasing concentrations with soil depth (Parras-Alcántara & Lozano-García, 2014). Soil available phosphorus (P) was notably high in CA due to P fertilizer applications in this monoculture system. Potassium (K) was lowest in CA, possibly due to reduced plant diversity compared to other systems (Chase & Singh, 2014), while NF and CF maintained higher magnesium (Mg) retention. Soil pH significantly influences nutrient availability (Ferreiro-Domínguez et al., 2022; Parras-Alcántara & Lozano-García, 2014; Villafuerte et al., 2024), and calcium (Ca) enhances organic matter-mineral interactions and microbial activity (Steinfeld et al., 2023). Microbial biomass carbon (MBC) in soils without Ca treatment ranged from 11 to 59 µg g⁻¹, which is considered low compared to reported values in similar soils (Llorente & Turrión, 2010).
4.2. Soil Carbon Stock Across Different Land Use Types
Carbon stock is calculated from the total carbon percentage, which comprises both organic and inorganic carbon. In this study, soil samples collected from forest and agricultural areas showed equivalent amounts of soil organic carbon (SOC) to total C. Therefore, this discussion incorporates SOC findings from other research studies (Nelson & Sommers, 1982).
Carbon stocks vary with land use (Castro et al., 2008; Lorenz & Lal, 2005) and land cover (Franzluebbers, 2005; Jinger et al., 2024) through complex processes involving multiple factors. The carbon balance is influenced by additions and losses (Lorenz & Lal, 2005), temperature, humidity, and climate (Nazir et al., 2024), as well as microbial activities (Lori et al., 2022). Converting forest land to agricultural use typically reduces soil carbon stocks (Ferreiro-Domínguez et al., 2022; Jagadesh et al., 2023). For instance, Jagadesh et al. (2023) found that forest ecosystems contained an average carbon stock of 77.94 t C ha⁻¹ at 0-45 cm depth, significantly higher than agricultural ecosystems at 32.30 t C ha⁻¹. However, agricultural lands can experience rapid carbon increases when supplemented with organic matter (Melero et al., 2009).
Carbon stock values generally decrease with soil depth (Castro et al., 2008). Surface layers are more susceptible to carbon fluctuations due to organic matter decomposition instability (Lorenz & Lal, 2005). The highest carbon stock concentrations typically occur in the shallow 0-20 cm soil layer, decreasing in deeper layers (Bania et al., 2024). Consistent with these findings, our research showed carbon stocks beginning to stabilize at 20-40 cm and 40-60 cm depths.
Land cover patterns primarily influence carbon dynamics, while microbial activity plays a secondary role through the breakdown of plant biomolecules and their constituents, which in turn shapes microbial selection (Lorenz & Lal, 2005). As mentioned earlier, agroforestry agriculture can promote carbon stock (Adiyah et al., 2023b; Paudel et al., 2011; Primo et al., 2023), particularly by increasing soil organic carbon content (Verma et al., 2023). Agroforestry areas maintain soil carbon stocks comparable to natural forests and significantly higher than conventional monoculture systems (Ferreiro-Domínguez et al., 2022; Niether et al., 2019). Growing many crops together with agricultural crops increases biodiversity, causing more organic matter to be produced and more material falling to the ground, facilitating the nutrient cycling process (Mehta et al., 2024; Niether et al., 2019; Primo et al., 2023). Notably, root systems from diverse plant species contribute more stable, long-term carbon compared to leaf litter (Ferreiro-Domínguez et al., 2022; Rodríguez et al., 2021). Carbon assessment is an indicator of soil health and ecosystem preservation (Zipei et al., 2024). However, agroforestry does not always increase carbon stock, depending on the plants grown in the system selecting trees in agroforestry requires local and scientific knowledge, which has many criteria to consider (Souza et al., 2012). Chen et al. (2017) reported that agroforestry systems (except for growing rubber along with coffee) can increase organic carbon better than growing rubber alone. Our study showed that when coffee was grown with persimmon trees, the amount of carbon stock in the soil layer 0–60 cm decreased from natural forests by 11.89% (p<0.05), which was more than when coffee was grown by itself, which decreased by 9.06% (p>0.05). However, when coffee was grown with forest trees, the amount of carbon stock can increase by 12.10% (p<0.01). Noponen et al. (2013) reported that during the first 9 years of the coffee system, soil carbon stocks at depths of 0–40 cm decreased by an average of 12.4% in Costa Rica and 0.13% in Nicaragua. This underscores the need for effective management of coffee systems and the significance of boosting soil carbon levels.
A research study on agroforestry coffee cultivation found that in the 0-40 cm soil layer, agroforestry coffee cultivation had a carbon stock of 111.29 Mg C ha⁻¹, while monoculture coffee cultivation had a value of 110.11 Mg C ha⁻¹. This indicates that carbon accumulation in the soil is similar for both systems. However, when focusing on the topsoil layer (0-10 cm), agroforestry coffee cultivation showed a higher value than coffee monoculture, with an average of 32.08 Mg C ha⁻¹ compared to 29.67 Mg C ha⁻¹ (Hergoualc’h et al., 2012). Moreover, Tumwebaze & Byakagaba (2016) reported that carbon sequestration under agroforestry systems of Arabica coffee cultivation and monoculture Arabica coffee cultivation in Uganda had the following values: coffee intercropped with fruit trees: 54.010 t C ha⁻¹, coffee intercropped with timber and fruit trees: 54.543 t C ha⁻¹, coffee intercropped with timber trees: 51.170 t C ha⁻¹, and monoculture coffee system: 50.987 t C ha⁻¹.
During the research period, we collected soil samples at three intervals to represent the seasons in Thailand. Rainfall has a direct relationship with organic carbon because it plays a crucial role in supporting plant growth. Plants carry out photosynthesis and produce organic carbon, which is transferred to the soil through roots and dead plant debris. Moreover, rainfall helps dissolve nutrients and promotes microbial activity in the soil (Hodges et al., 2023; Karunaratne et al., 2024). The soil carbon stock exhibited minimal variations over the three seasons. It was noted that during summer, values were only marginally elevated compared to other seasons. This occurs because of the seasonal shedding of deciduous leaves resulting from elevated temperatures and reduced moisture from precipitation (WANI et al., 2023). The modest rise in soil carbon stock may result from a gradual enhancement in decomposition attributed to the constraints faced by soil microorganisms (Lori et al., 2022).
4.3. Soil Microbial Respiration and Microbial Biomass Carbon
Microbial respiration (MR) is an important process of organic matter decomposition that releases energy for soil microorganisms and directly affects the release of carbon dioxide (CO₂) into the atmosphere. This process is an indicator of microbial activity in the soil, as well as the soil’s ability to cycle nutrients. Assessing the health of the soil and its associated ecosystems involves measuring soil basal respiration rates. MBC has a positive correlation with MR, meaning that as the amount of MBC increases, microbial respiration also increases. This is because microorganisms play a crucial role in decomposing organic matter and releasing CO₂. Studies have found that changes in land use, such as agriculture or afforestation, significantly affect microbial activity and MR (Lori et al., 2022; Soleimani et al., 2019). Additionally, MBC has a positive correlation with the amount of SOC, which means that an increase in MBC is often associated with an increase in SOC in the soil. A high microbial biomass aids in organic matter decomposition and increases soil carbon content (Jinger et al., 2024; Lori et al., 2022; Reis dos Santos Bastos et al., 2023). Land use changes impact MBC, which can be used to assess the effects of managed land in various forms. MBC and C–CO₂ are important indicators for evaluating land use changes and their effects on carbon cycling in soil ecosystems (Singh et al., 2024; Soleimani et al., 2019; Zhou et al., 2024). Research has found that C–CO₂ and MBC in soil covered by trees, such as forests, have higher carbon retention compared to soil used for agricultural activities (Llorente & Turrión, 2010). Singh et al. (2024) reported that MBC varies according to the type of area and land use, with several factors affecting the quantity and quality of MBC in different areas. Agroforestry systems have MBC levels that are 6–34% higher compared to agricultural systems. Agroforestry systems are one of the agricultural practices that promote the conservation of biodiversity and soil sustainability (Singh et al., 2024). Findings show that coffee agroforestry systems can keep MBC levels as same as natural forests. This is because agroforestry systems are better at supporting soil microbial biomass than monoculture systems. Coffee agroforestry systems have the potential to enhance MBC, which is a crucial indicator of soil health. There is a study on MBC in various systems, finding that the native forest had the highest value at 783.05 μg g⁻¹, followed by coffee with Grevillea robusta agroforestry system at 259.1 μg g⁻¹, coffee with cedar agroforestry system at 468.43 μg g⁻¹, and coffee monoculture had the lowest value at 187.60 μg g⁻¹. This is similar to our research, where CA had the lowest MBC, while CF had a value close to that of the natural forest (NR). However, a high MBC does not always mean that MR will also be high (Reis dos Santos Bastos et al., 2023). When comparing MBC and MR in our study, we found that MR in the NF is relatively low, similar to that of CA, even though NF has the highest MBC. Additionally, we found an inverse relationship between the MR of CF and MBC, which could potentially depend on other factors like soil management and environmental conditions that influence microbial activity and nutrient cycling in the soil system (Reis dos Santos Bastos et al., 2023). This is also link to the DOC in soil. The DOC consists of small organic carbon compounds that are soluble in water, typically resulting from the decomposition of plants and animals as well as the activity of microorganisms in the soil. DOC is important for ecosystems and soil management because it can affect water quality, nutrient mobility, and carbon storage in the soil. Additionally, erosion and water runoff can lead to the loss of DOC, potentially affecting the soil’s total organic carbon content (Zhou et al., 2024), which is most commonly found in monoculture coffee systems.
Seasons affect the decomposition process and carbon storage (SOC). Seasonal changes as shown in our study demonstrate the relationship between microbial activity in the soil and the changing environmental conditions throughout the seasons. Higher temperatures can accelerate the decomposition of organic matter, resulting in increased CO₂ emissions and a reduction in soil organic carbon (SOC) levels. Adequate moisture supports microbial activity and carbon storage in the soil, but excessive moisture can lead to oxygen depletion in the soil, thereby reducing SOC retention. Good aeration promotes microbial activity, while poor aeration can decrease microbial respiration and lead to lower carbon storage (Nazir et al., 2024). Rainfall, an important factor in controlling temperature and soil moisture, helps dissolve nutrients and promotes the decomposition and accumulation of SOC (Karunaratne et al., 2024). MBC significantly decreases under conditions of drought and heat stress (Guillot et al., 2019). Microorganisms in the soil collected from agroforestry systems showed better recovery capabilities after changes in soil moisture (Rivest et al., 2013).
The role of nitrogen in the soil: a high nitrogen content in the soil can support the growth of microorganisms and lead to an increase in MBC. This is because nitrogen is an essential nutrient for the synthesis of proteins and other biomolecules necessary for microbial growth. A high nitrogen content in the soil can enhance microbial growth and increase MBC as well (Oscar Kisaka et al., 2023b; Reis dos Santos Bastos et al., 2023; Soleimani et al., 2019).
5. Conclusions
The research results indicate that the impact of land use changes, particularly the alteration of vegetation cover, on soil physicochemical and biological properties and soil carbon stock. Coffee agroforestry system was able to enhance the carbon stock compared to coffee monoculture. Contrarily, compared to the initial levels, the carbon stock decreased in the coffee monoculture and the CP. It is well understood that agricultural activities typically lead to disturbances caused by human actions, resulting in a reduction in carbon stock. However, the finding of CF is an exception to this rule. Carbon stock has a positive correlation with soil total nitrogen, which results in the treatment of CF having a higher total nitrogen content. The study on MBC found the highest levels in natural forests and coffee in agroforestry systems: coffee intercropped with forest trees and coffee intercropped with persimmon trees. It was also discovered that there was a significant positive correlation between MR, MBC, and DOC. Despite high MBC levels, low MR levels is showed in natural forests, suggesting that high MBC content does not necessarily translate into high microbial activity, and DOC is also present more in coffees monoculture. Seasonal changes also influence the amount of carbon stock and microbial activity, which fluctuate throughout the year in response to various environmental factors. We can conclude that coffee agroforestry can mitigate the effects of deforestation and help maintain soil fertility for long-term sustainable agriculture. Additionally, selecting appropriate species for cultivation has potential benefits for carbon sequestration and soil microbial activity.
Author Contributions
Conceptualization, Phonlawat Soilueang, Yupa Chromkaew, Nipon Mawan, Yu-Ting Wu, Kesinee Iamsaard and Nuttapon Khongdee; Methodology, Phonlawat Soilueang, Yupa Chromkaew, Nipon Mawan, Suwimon Wicharuck, Sasiprapa Kullachonphuri, Sureerat Buachun, Yaoliang Chen and Nuttapon Khongdee; Validation, Nuttapon Khongdee; Formal analysis, Phonlawat Soilueang, Kesinee Iamsaard and Nuttapon Khongdee; Investigation, Nuttapon Khongdee; Resources, Sureerat Buachun, Yaoliang Chen and Nuttapon Khongdee; Data curation, Phonlawat Soilueang, Nipon Mawan, Suwimon Wicharuck, Sasiprapa Kullachonphuri and Nuttapon Khongdee; Writing – original draft, Phonlawat Soilueang, Yupa Chromkaew and Nuttapon Khongdee; Writing – review & editing, Phonlawat Soilueang, Yupa Chromkaew, Nipon Mawan, Suwimon Wicharuck, Sasiprapa Kullachonphuri, Sureerat Buachun, Yu-Ting Wu, Yaoliang Chen, Kesinee Iamsaard and Nuttapon Khongdee; Visualization, Phonlawat Soilueang and Nuttapon Khongdee; Supervision, Yupa Chromkaew, Nipon Mawan, Suwimon Wicharuck, Yu-Ting Wu, Yaoliang Chen, Kesinee Iamsaard and Nuttapon Khongdee; Funding acquisition, Nuttapon Khongdee.
Data Availability Statement
the data presented in this study are available on request from the corresponding author.
Acknowledgments
This study was supported by Faculty of Agriculture, Chiang Mai University.
Conflicts of Interest
Authors declare that they have no competing interests.
References
- Adiyah, F., Csorba, Á., Dawoe, E., Ocansey, C. M., Asamoah, E., Szegi, T., Fuchs, M., & Michéli, E. (2023a). Soil organic carbon changes under selected agroforestry cocoa systems in Ghana. Geoderma Regional, 35. [CrossRef]
- Angkasith, P. (2002). Coffee production status and potential of organic Arabica coffee in Thailand. AU Journal of Technology, 5(3).
- Aquino, B. F., & Hanson, R. G. (1984). Soil phosphorus supplying capacity evaluated by plant removal and available phosphorus extraction. Soil Science Society of America Journal, 48(5), 1091–1096.
- Arun Jyoti, N., Lal, R., & Das, A. K. (2015). Ethnopedology and soil quality of bamboo (Bambusa sp.) based agroforestry system. Science of the Total Environment, 521–522, 372–379. [CrossRef]
- Arunrat, N., Kongsurakan, P., Solomon, L. W., & Sereenonchai, S. (2024). Fire Impacts on Soil Properties and Implications for Sustainability in Rotational Shifting Cultivation: A Review. Agriculture, 14(9), 1660.
- Bania, J. K., Sileshi, G. W., Nath, A. J., Paramesh, V., & Das, A. K. (2024). Spatial distribution of soil organic carbon and macronutrients in the deep soil across a chronosequence of tea agroforestry. Catena, 236. [CrossRef]
- Castro, J., Fernández-Ondoño, E., Rodríguez, C., Lallena, A. M., Sierra, M., & Aguilar, J. (2008). Effects of different olive-grove management systems on the organic carbon and nitrogen content of the soil in Jaén (Spain). Soil and Tillage Research, 98(1), 56–67. [CrossRef]
- Chase, P., & Singh, O. P. (2014). Soil nutrients and fertility in three traditional land use systems of Khonoma, Nagaland, India. Resources and Environment, 4(4), 181–189.
- Chen, C., Liu, W., Jiang, X., & Wu, J. (2017). Effects of rubber-based agroforestry systems on soil aggregation and associated soil organic carbon: Implications for land use. Geoderma, 299, 13–24. [CrossRef]
- Ferreiro-Domínguez, N., Palma, J. H. N., Paulo, J. A., Rigueiro-Rodríguez, A., & Mosquera-Losada, M. R. (2022). Assessment of soil carbon storage in three land use types of a semi-arid ecosystem in South Portugal. Catena, 213. [CrossRef]
- Franzluebbers, A. J. (2005). Soil organic carbon sequestration and agricultural greenhouse gas emissions in the southeastern USA. Soil and Tillage Research, 83(1 SPEC. ISS.), 120–147. [CrossRef]
- Fukuda, M., Nakamura, S., Fonseca, A. da C. L., Nasukawa, H., Ibraimo, M. M., Naruo, K., Kobayashi, K., & Oya, T. (2017). Evaluation of the Mehlich 3 reagent as an extractant for cations and available phosphorus for soils in Mozambique. Communications in Soil Science and Plant Analysis, 48(12), 1462–1472.
- Gee, G. W., & Or, D. (2002). 2.4 Particle-size analysis. Methods of Soil Analysis: Part 4 Physical Methods, 5, 255–293.
- Grüneberg, E., Ziche, D., & Wellbrock, N. (2014). Organic carbon stocks and sequestration rates of forest soils in Germany. Global Change Biology, 20(8), 2644–2662. [CrossRef]
- Guillot, E., Hinsinger, P., Dufour, L., Roy, J., & Bertrand, I. (2019). With or without trees: Resistance and resilience of soil microbial communities to drought and heat stress in a Mediterranean agroforestry system. Soil Biology and Biochemistry, 129, 122–135. [CrossRef]
- Heimsch, L., Huusko, K., Karhu, K., Mganga, K. Z., Kalu, S., & Kulmala, L. (2023). Effects of a tree row on greenhouse gas fluxes, growing conditions and soil microbial communities on an oat field in Southern Finland. Agriculture, Ecosystems and Environment, 352. [CrossRef]
- Hergoualc’h, K., Blanchart, E., Skiba, U., Hénault, C., & Harmand, J. M. (2012). Changes in carbon stock and greenhouse gas balance in a coffee (Coffea arabica) monoculture versus an agroforestry system with Inga densiflora, in Costa Rica. Agriculture, Ecosystems and Environment, 148, 102–110. [CrossRef]
- Hodges, C., Araujo, P. I., Hess, L. J. T., Vivanco, L., Kaye, J., & Austin, A. T. (2023). Metal cation concentrations improve understanding of controls on soil organic carbon across a precipitation by vegetation gradient in the Patagonian Andes. Geoderma, 440. [CrossRef]
- Jagadesh, M., Selvi, D., Thiyageshwari, S., Srinivasarao, C., Kalaiselvi, T., Lourdusamy, K., Kumaraperumal, R., & Allan, V. (2023). Soil Carbon Dynamics Under Different Ecosystems of Ooty Region in the Western Ghats Biodiversity Hotspot of India. Journal of Soil Science and Plant Nutrition, 23(1), 1374–1385. [CrossRef]
- Jinger, D., Kakade, V., Bhatnagar, P. R., Paramesh, V., Dinesh, D., Singh, G., N, N. K., Kaushal, R., Singhal, V., Rathore, A. C., Tomar, J. M. S., Singh, C., Yadav, L. P., Jat, R. A., Kaledhonkar, M. J., & Madhu, M. (2024). Enhancing productivity and sustainability of ravine lands through horti-silviculture and soil moisture conservation: A pathway to land degradation neutrality. Journal of Environmental Management, 364. [CrossRef]
- Kamolrattanakul, K., Tungkananuruk, K., Rungratanaubon, T., & Sillberg, C. V. (2022). Analytical Approach to Deforestation Effect on Climate Change Using Metadata in Thailand. EnvironmentAsia, 15(1).
- Kamthonkiat, D., Thanyapraneedkul, J., Nuengjumnong, N., Ninsawat, S., Unapumnuk, K., & Vu, T. T. (2021). Identifying priority air pollution management areas during the burning season in Nan Province, Northern Thailand. Environment, Development and Sustainability, 23(4), 5865–5884.
- Karunaratne, S., Asanopoulos, C., Jin, H., Baldock, J., Searle, R., Macdonald, B., & Macdonald, L. M. (2024). Estimating the attainable soil organic carbon deficit in the soil fine fraction to inform feasible storage targets and de-risk carbon farming decisions. Soil Research , 62(2). [CrossRef]
- Klute, A. (1986). Part 1. Physical and mineralogical methods. Methods of Soil Analysis.
- Leifeld, J., Siebert, S., & Kögel-Knabner, I. (2002). Changes in the chemical composition of soil organic matter after application of compost. European Journal of Soil Science, 53(2), 299–309.
- Lilavanichakul, A. (2020). The economic impact of Arabica coffee farmers’ participation in geographical indication in northern Highland of Thailand. Journal of Rural Problems, 56(3), 124–131.
- Llorente, M., & Turrión, M. B. (2010). Microbiological parameters as indicators of soil organic carbon dynamics in relation to different land use management. European Journal of Forest Research, 129(1), 73–81. [CrossRef]
- Lorenz, K., & Lal, R. (2005). The depth distribution of soil organic carbon in relation to land use and management and the potential of carbon sequestration in subsoil horizons. Advances in Agronomy, 88, 35–66.
- Lori, M., Armengot, L., Schneider, M., Schneidewind, U., Bodenhausen, N., Mäder, P., & Krause, H. M. (2022). Organic management enhances soil quality and drives microbial community diversity in cocoa production systems. Science of the Total Environment, 834. [CrossRef]
- Masson-Delmotte, V. P., Zhai, P., Pirani, S. L., Connors, C., Péan, S., Berger, N., Caud, Y., Chen, L., Goldfarb, M. I., & Scheel Monteiro, P. M. (2021). Ipcc, 2021: Summary for policymakers. in: Climate change 2021: The physical science basis. contribution of working group i to the sixth assessment report of the intergovernmental panel on climate change.
- Mehta, H., Rathore, A. C., Tomar, J. M. S., Mandal, D., Kumar, P., Kumar, S., Sharma, S. K., Kaushal, R., Singh, C., Chaturvedi, O. P., & Madhu, M. (2024). Minor millets based agroforestry of multipurpose tree species of Bhimal (Grewia optiva Drummond J.R. ex Burret) and Mulberry (Morus alba L.) for resource conservation and production in north western Himalayas – 10-year study. Agriculture, Ecosystems and Environment, 359. [CrossRef]
- Melero, S., López-Garrido, R., Murillo, J. M., & Moreno, F. (2009). Conservation tillage: Short- and long-term effects on soil carbon fractions and enzymatic activities under Mediterranean conditions. Soil and Tillage Research, 104(2), 292–298. [CrossRef]
- Nazir, M. J., Li, G., Nazir, M. M., Zulfiqar, F., Siddique, K. H. M., Iqbal, B., & Du, D. (2024). Harnessing soil carbon sequestration to address climate change challenges in agriculture. In Soil and Tillage Research (Vol. 237). Elsevier B.V. [CrossRef]
- Negash, M., Kaseva, J., & Kahiluoto, H. (2022). Determinants of carbon and nitrogen sequestration in multistrata agroforestry. Science of the Total Environment, 851. [CrossRef]
- Nelson, D. W., & Sommers, L. E. (1982). Total carbon, organic carbon, and organic matter. Methods of Soil Analysis: Part 2 Chemical and Microbiological Properties, 9, 539–579.
- Niether, W., Schneidewind, U., Fuchs, M., Schneider, M., & Armengot, L. (2019). Below- and aboveground production in cocoa monocultures and agroforestry systems. Science of the Total Environment, 657, 558–567. [CrossRef]
- Noponen, M. R. A., Healey, J. R., Soto, G., & Haggar, J. P. (2013). Sink or source-The potential of coffee agroforestry systems to sequester atmospheric CO2 into soil organic carbon. Agriculture, Ecosystems and Environment, 175, 60–68. [CrossRef]
- Noppakoonwong, U., Khomarwut, C., Hanthewee, M., Jarintorn, S., Hassarungsee, S., Meesook, S., Daoruang, C., Naka, P., Lertwatanakiat, S., & Satayawut, K. (2014). Research and development of Arabica coffee in Thailand. Proc. 25th International Conference on Coffee Science (ASIC), 8–13.
- Oscar Kisaka, M., Shisanya, C., Cournac, L., Raphael Manlay, J., Gitari, H., & Muriuki, J. (2023a). Integrating no-tillage with agroforestry augments soil quality indicators in Kenya’s dry-land agroecosystems. Soil and Tillage Research, 227. [CrossRef]
- Oscar Kisaka, M., Shisanya, C., Cournac, L., Raphael Manlay, J., Gitari, H., & Muriuki, J. (2023b). Integrating no-tillage with agroforestry augments soil quality indicators in Kenya’s dry-land agroecosystems. Soil and Tillage Research, 227. [CrossRef]
- Parras-Alcántara, L., & Lozano-García, B. (2014). Conventional tillage versus organic farming in relation to soil organic carbon stock in olive groves in Mediterranean rangelands (southern Spain). Solid Earth, 5(1), 299–311. [CrossRef]
- Paudel, B. R., Udawatta, R. P., & Anderson, S. H. (2011). Agroforestry and grass buffer effects on soil quality parameters for grazed pasture and row-crop systems. Applied Soil Ecology, 48(2), 125–132. [CrossRef]
- Peech, N. (1965). Hydrogen ion activity. P 914-926. Methods of Soil Analysis. American Society of Agronomy. Madison. Wisconsin.
- Primo, A. A., Araújo Neto, R. A. de, Zeferino, L. B., Fernandes, F. É. P., Araújo Filho, J. A. de, Cerri, C. E. P., & Oliveira, T. S. de. (2023). Slash and burn management and permanent or rotation agroforestry systems: A comparative study for C sequestration by century model simulation. Journal of Environmental Management, 336. [CrossRef]
- Reis dos Santos Bastos, T., Anjos Bittencourt Barreto-Garcia, P., de Carvalho Mendes, I., Henrique Marques Monroe, P., & Ferreira de Carvalho, F. (2023). Response of soil microbial biomass and enzyme activity in coffee-based agroforestry systems in a high-altitude tropical climate region of Brazil. Catena, 230. [CrossRef]
- Reynolds, S. G. (1970). The gravimetric method of soil moisture determination Part IA study of equipment, and methodological problems. Journal of Hydrology, 11(3), 258–273.
- Rhoades, J. D. (1996). Salinity: Electrical conductivity and total dissolved solids. Methods of Soil Analysis: Part 3 Chemical Methods, 5, 417–435.
- Rivest, D., Lorente, M., Olivier, A., & Messier, C. (2013). Soil biochemical properties and microbial resilience in agroforestry systems: Effects on wheat growth under controlled drought and flooding conditions. Science of the Total Environment, 463–464, 51–60. [CrossRef]
- Rodríguez, L., Suárez, J. C., Rodriguez, W., Artunduaga, K. J., & Lavelle, P. (2021). Agroforestry systems impact soil macroaggregation and enhance carbon storage in Colombian deforested Amazonia. Geoderma, 384. [CrossRef]
- Saikhammoon, R., Sungkaew, S., Thinkampaeng, S., Phumphuang, W., Kamyo, T., & Marod, D. (2023). Forest Restoration in an Abandoned Seasonally Dry Tropical Forest in the Mae Klong Watershed, Western Thailand: 10.32526/ennrj/21/20230121. Environment and Natural Resources Journal, 21(5), 443–457.
- Singh, A., Choudhury, B. U., Balusamy, A., & Sahoo, U. K. (2024). Restoring the inventory of biomass and soil carbon in abandoned croplands: An agroforestry system approach in India’s eastern Himalayas. Agriculture, Ecosystems and Environment, 362. [CrossRef]
- Soleimani, A., Hosseini, S. M., Massah Bavani, A. R., Jafari, M., & Francaviglia, R. (2019). Influence of land use and land cover change on soil organic carbon and microbial activity in the forests of northern Iran. Catena, 177, 227–237. [CrossRef]
- Souza, H. N. de, de Goede, R. G. M., Brussaard, L., Cardoso, I. M., Duarte, E. M. G., Fernandes, R. B. A., Gomes, L. C., & Pulleman, M. M. (2012). Protective shade, tree diversity and soil properties in coffee agroforestry systems in the Atlantic Rainforest biome. Agriculture, Ecosystems and Environment, 146(1), 179–196. [CrossRef]
- Steinfeld, J. P., J.J.A. Bianchi, F., Luiz Locatelli, J., Rizzo, R., Eduarda Bispo de Resende, M., Ramos Ballester, M. V., Cerri, C. E. P., Bernardi, A. C. C., & Creamer, R. E. (2023). Increasing complexity of agroforestry systems benefits nutrient cycling and mineral-associated organic carbon storage, in south-eastern Brazil. Geoderma, 440. [CrossRef]
- Stevenson, A., Zhang, Y., Huang, J., Hu, J., Paustian, K., & Hartemink, A. E. (2024). Rates of soil organic carbon change in cultivated and afforested sandy soils. Agriculture, Ecosystems and Environment, 360. [CrossRef]
- Tippayachan, H. (2006). The Determination of Cabon Loss by Soil Erosion and Sediment Transport Processes in Mea Thang Watershed, Rong Kwang District, Phrae Province. Mahidol University.
- Tumwebaze, S. B., & Byakagaba, P. (2016). Soil organic carbon stocks under coffee agroforestry systems and coffee monoculture in Uganda. Agriculture, Ecosystems and Environment, 216, 188–193. [CrossRef]
- Usman, A. R. A., Kuzyakov, Y., & Stahr, K. (2004). Dynamics of organic C mineralization and the mobile fraction of heavy metals in a calcareous soil incubated with organic wastes. Water, Air, and Soil Pollution, 158, 401–418.
- Vance, E. D., Brookes, P. C., & Jenkinson, D. S. (1987). An extraction method for measuring soil microbial biomass C. Soil Biology and Biochemistry, 19(6), 703–707.
- Verma, T., Bhardwaj, D. R., Sharma, U., Sharma, P., Kumar, D., & Kumar, A. (2023). Agroforestry systems in the mid-hills of the north-western Himalaya: A sustainable pathway to improved soil health and climate resilience. Journal of Environmental Management, 348. [CrossRef]
- Villafuerte, A. B., Soria, R., Rodríguez-Berbel, N., Zema, D. A., Lucas-Borja, M. E., Ortega, R., & Miralles, I. (2024). Short-term evaluation of soil physical, chemical and biochemical properties in an abandoned cropland treated with different soil organic amendments under semiarid conditions. Journal of Environmental Management, 349. [CrossRef]
- Wani, O. A., Kumar, S. S., Hussain, N., Wani, A. I. A., Babu, S., Alam, P., Rashid, M., Popescu, S. M., & Mansoor, S. (2023). Multi-scale processes influencing global carbon storage and land-carbon-climate nexus: A critical review. In Pedosphere (Vol. 33, Issue 2, pp. 250–267). Soil Science Society of China. [CrossRef]
- Wu, J., Zeng, H., Zhao, F., Chen, C., Liu, W., Yang, B., & Zhang, W. (2020). Recognizing the role of plant species composition in the modification of soil nutrients and water in rubber agroforestry systems. Science of the Total Environment, 723. [CrossRef]
- Xiao, C., Li, P., & Feng, Z. (2023). Agricultural expansion and forest retreat in Mainland Southeast Asia since the late 1980s. Land Degradation & Development, 34(17), 5606–5621.
- Zhou, S., Li, P., & Zhang, Y. (2024). Factors influencing and changes in the organic carbon pattern on slope surfaces induced by soil erosion. Soil and Tillage Research, 238. [CrossRef]
- Zipei, L., Qi, S., Ndzana, G. M., Lijun, C., Yuqi, C., sheng, L., & Lichao, W. (2024). Dynamic of Organic Matter, Nutrient Cycling, and PH in Soil Aggregate Particle Sizes Under Long-Term Cultivation of Camellia Oleifera. Journal of Soil Science and Plant Nutrition, 24(2), 2599–2606. [CrossRef]
Figure 1.
Location of the study sites and the distribution of the field sample sites in the Nong Hoi Highland Agricultural Station in Pong Yeang Subdistrict, Muang District, Chiang Mai Province, Thailand.
Figure 1.
Location of the study sites and the distribution of the field sample sites in the Nong Hoi Highland Agricultural Station in Pong Yeang Subdistrict, Muang District, Chiang Mai Province, Thailand.
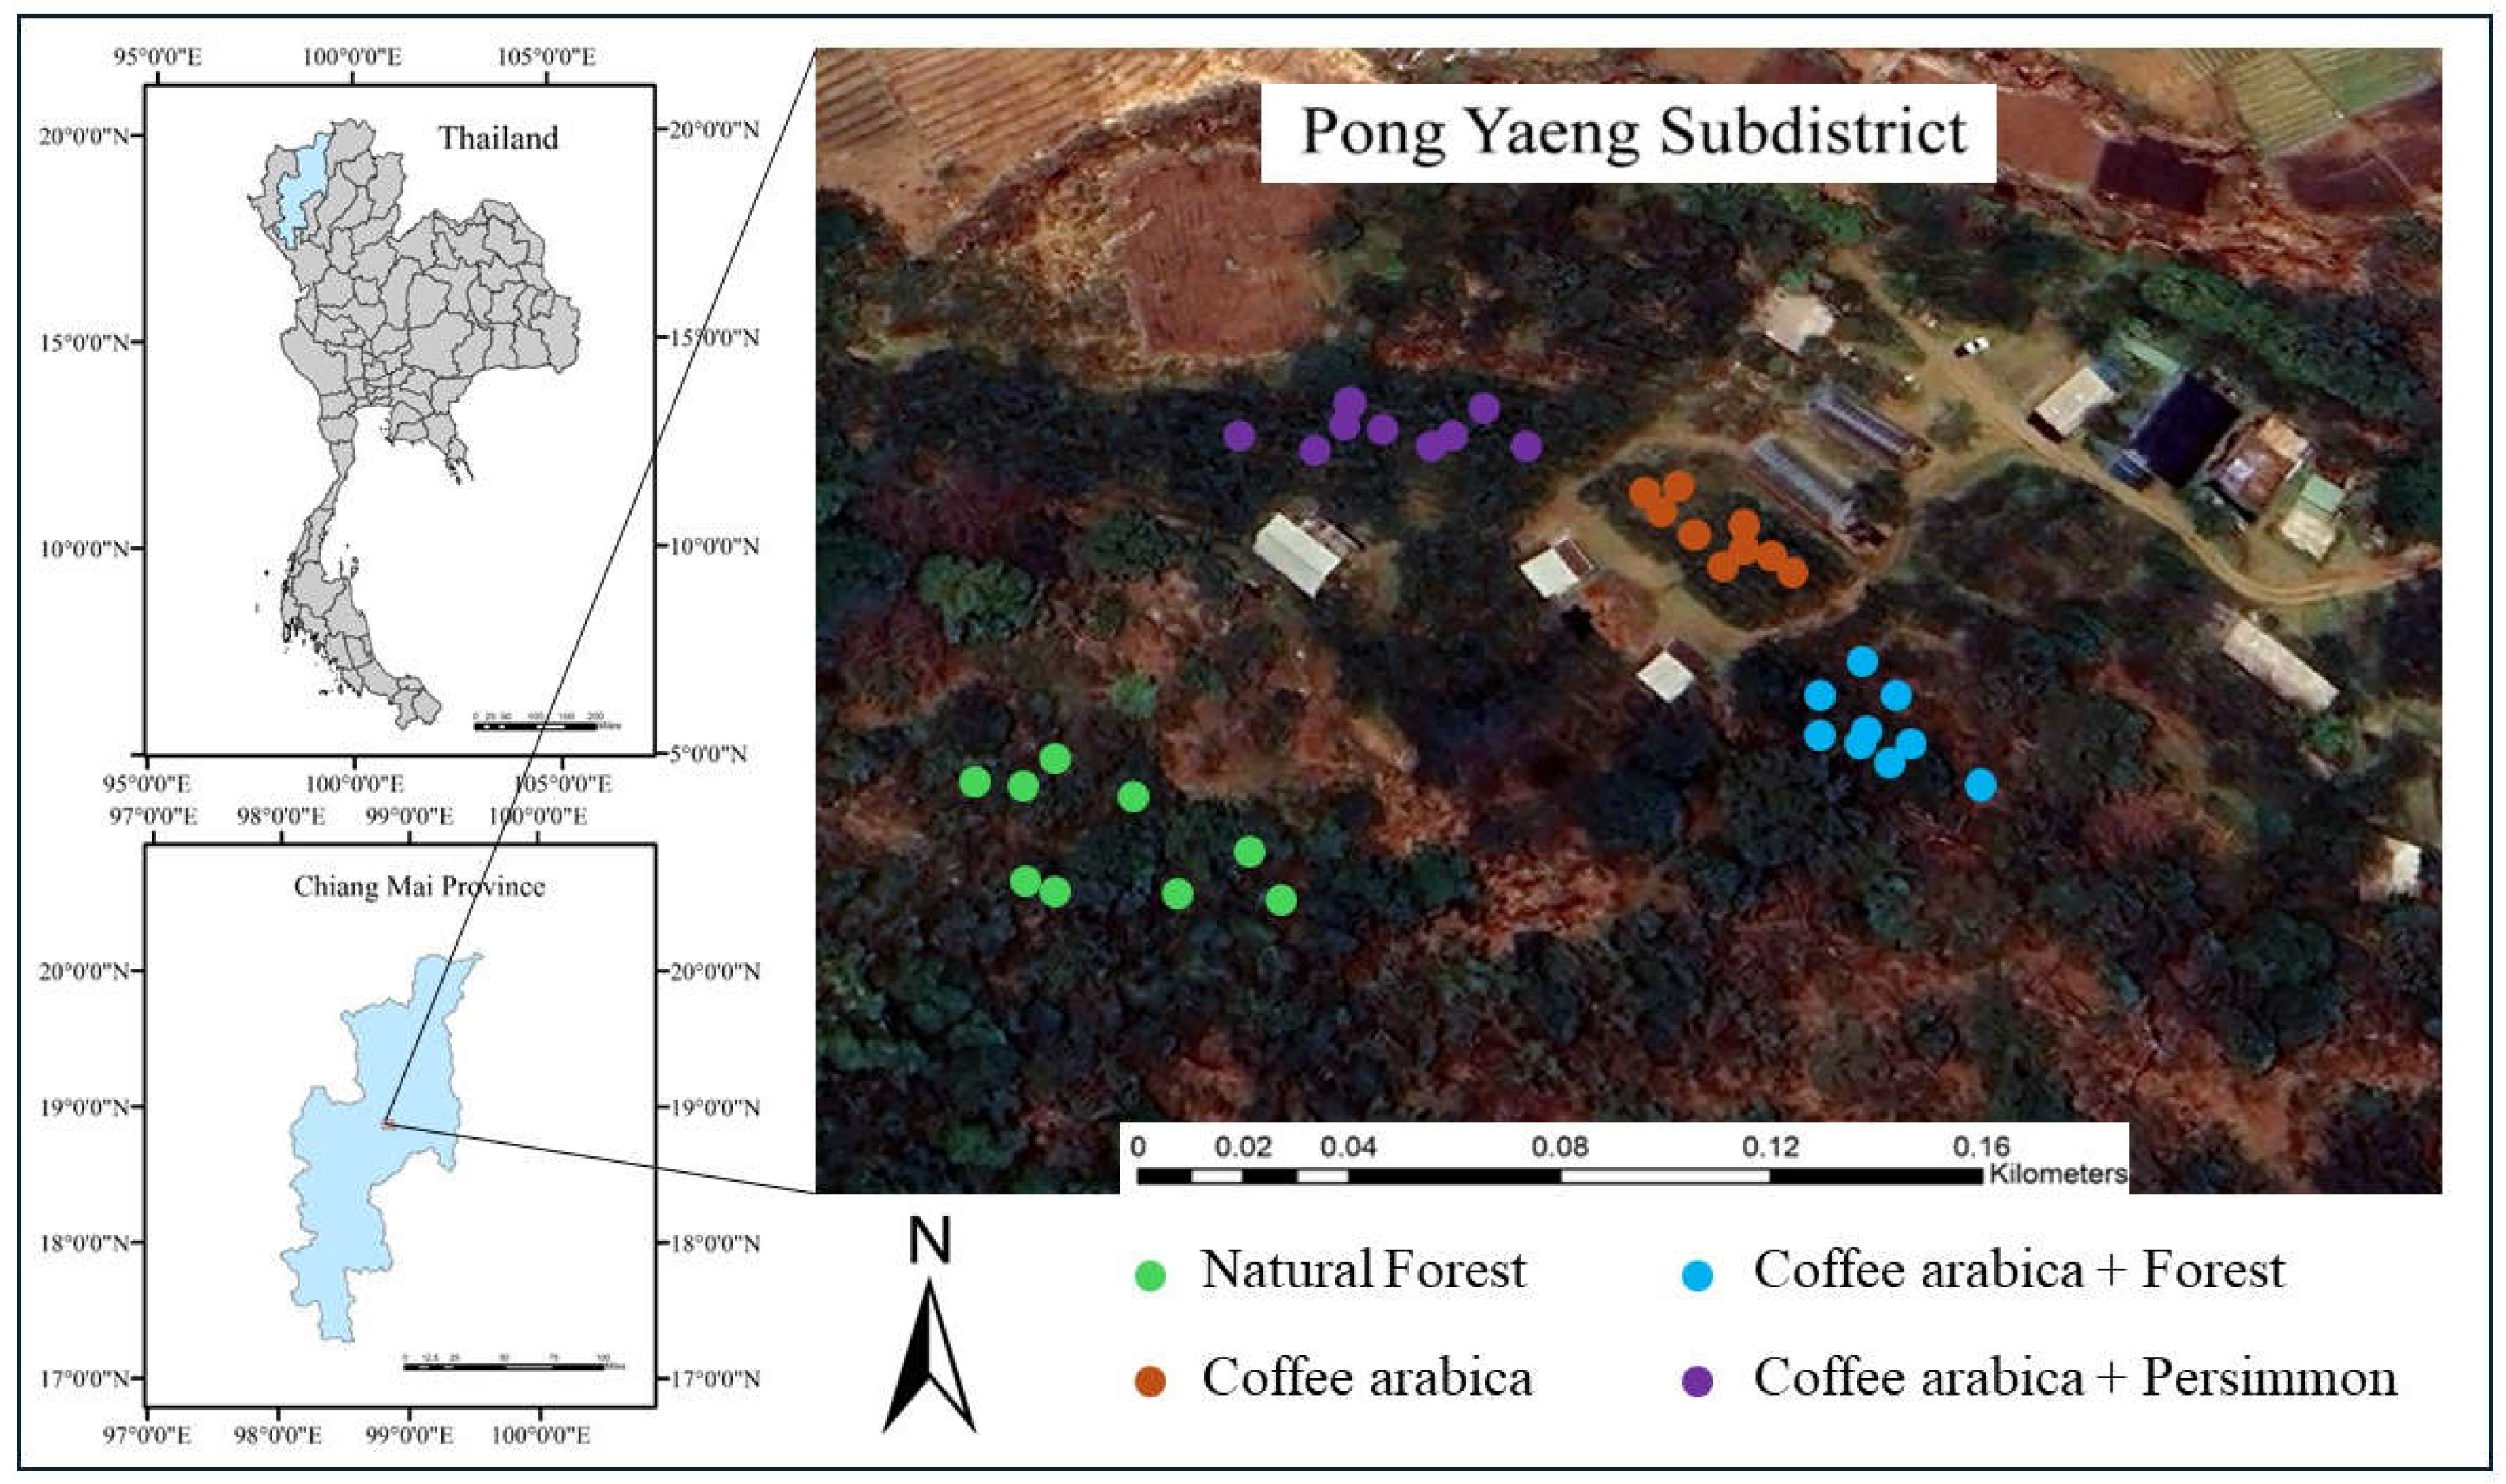
Figure 2.
Mean temperature (aboveground and belowground) and relative humidity during the experimental period (September 2022 to April 2023).
Figure 2.
Mean temperature (aboveground and belowground) and relative humidity during the experimental period (September 2022 to April 2023).
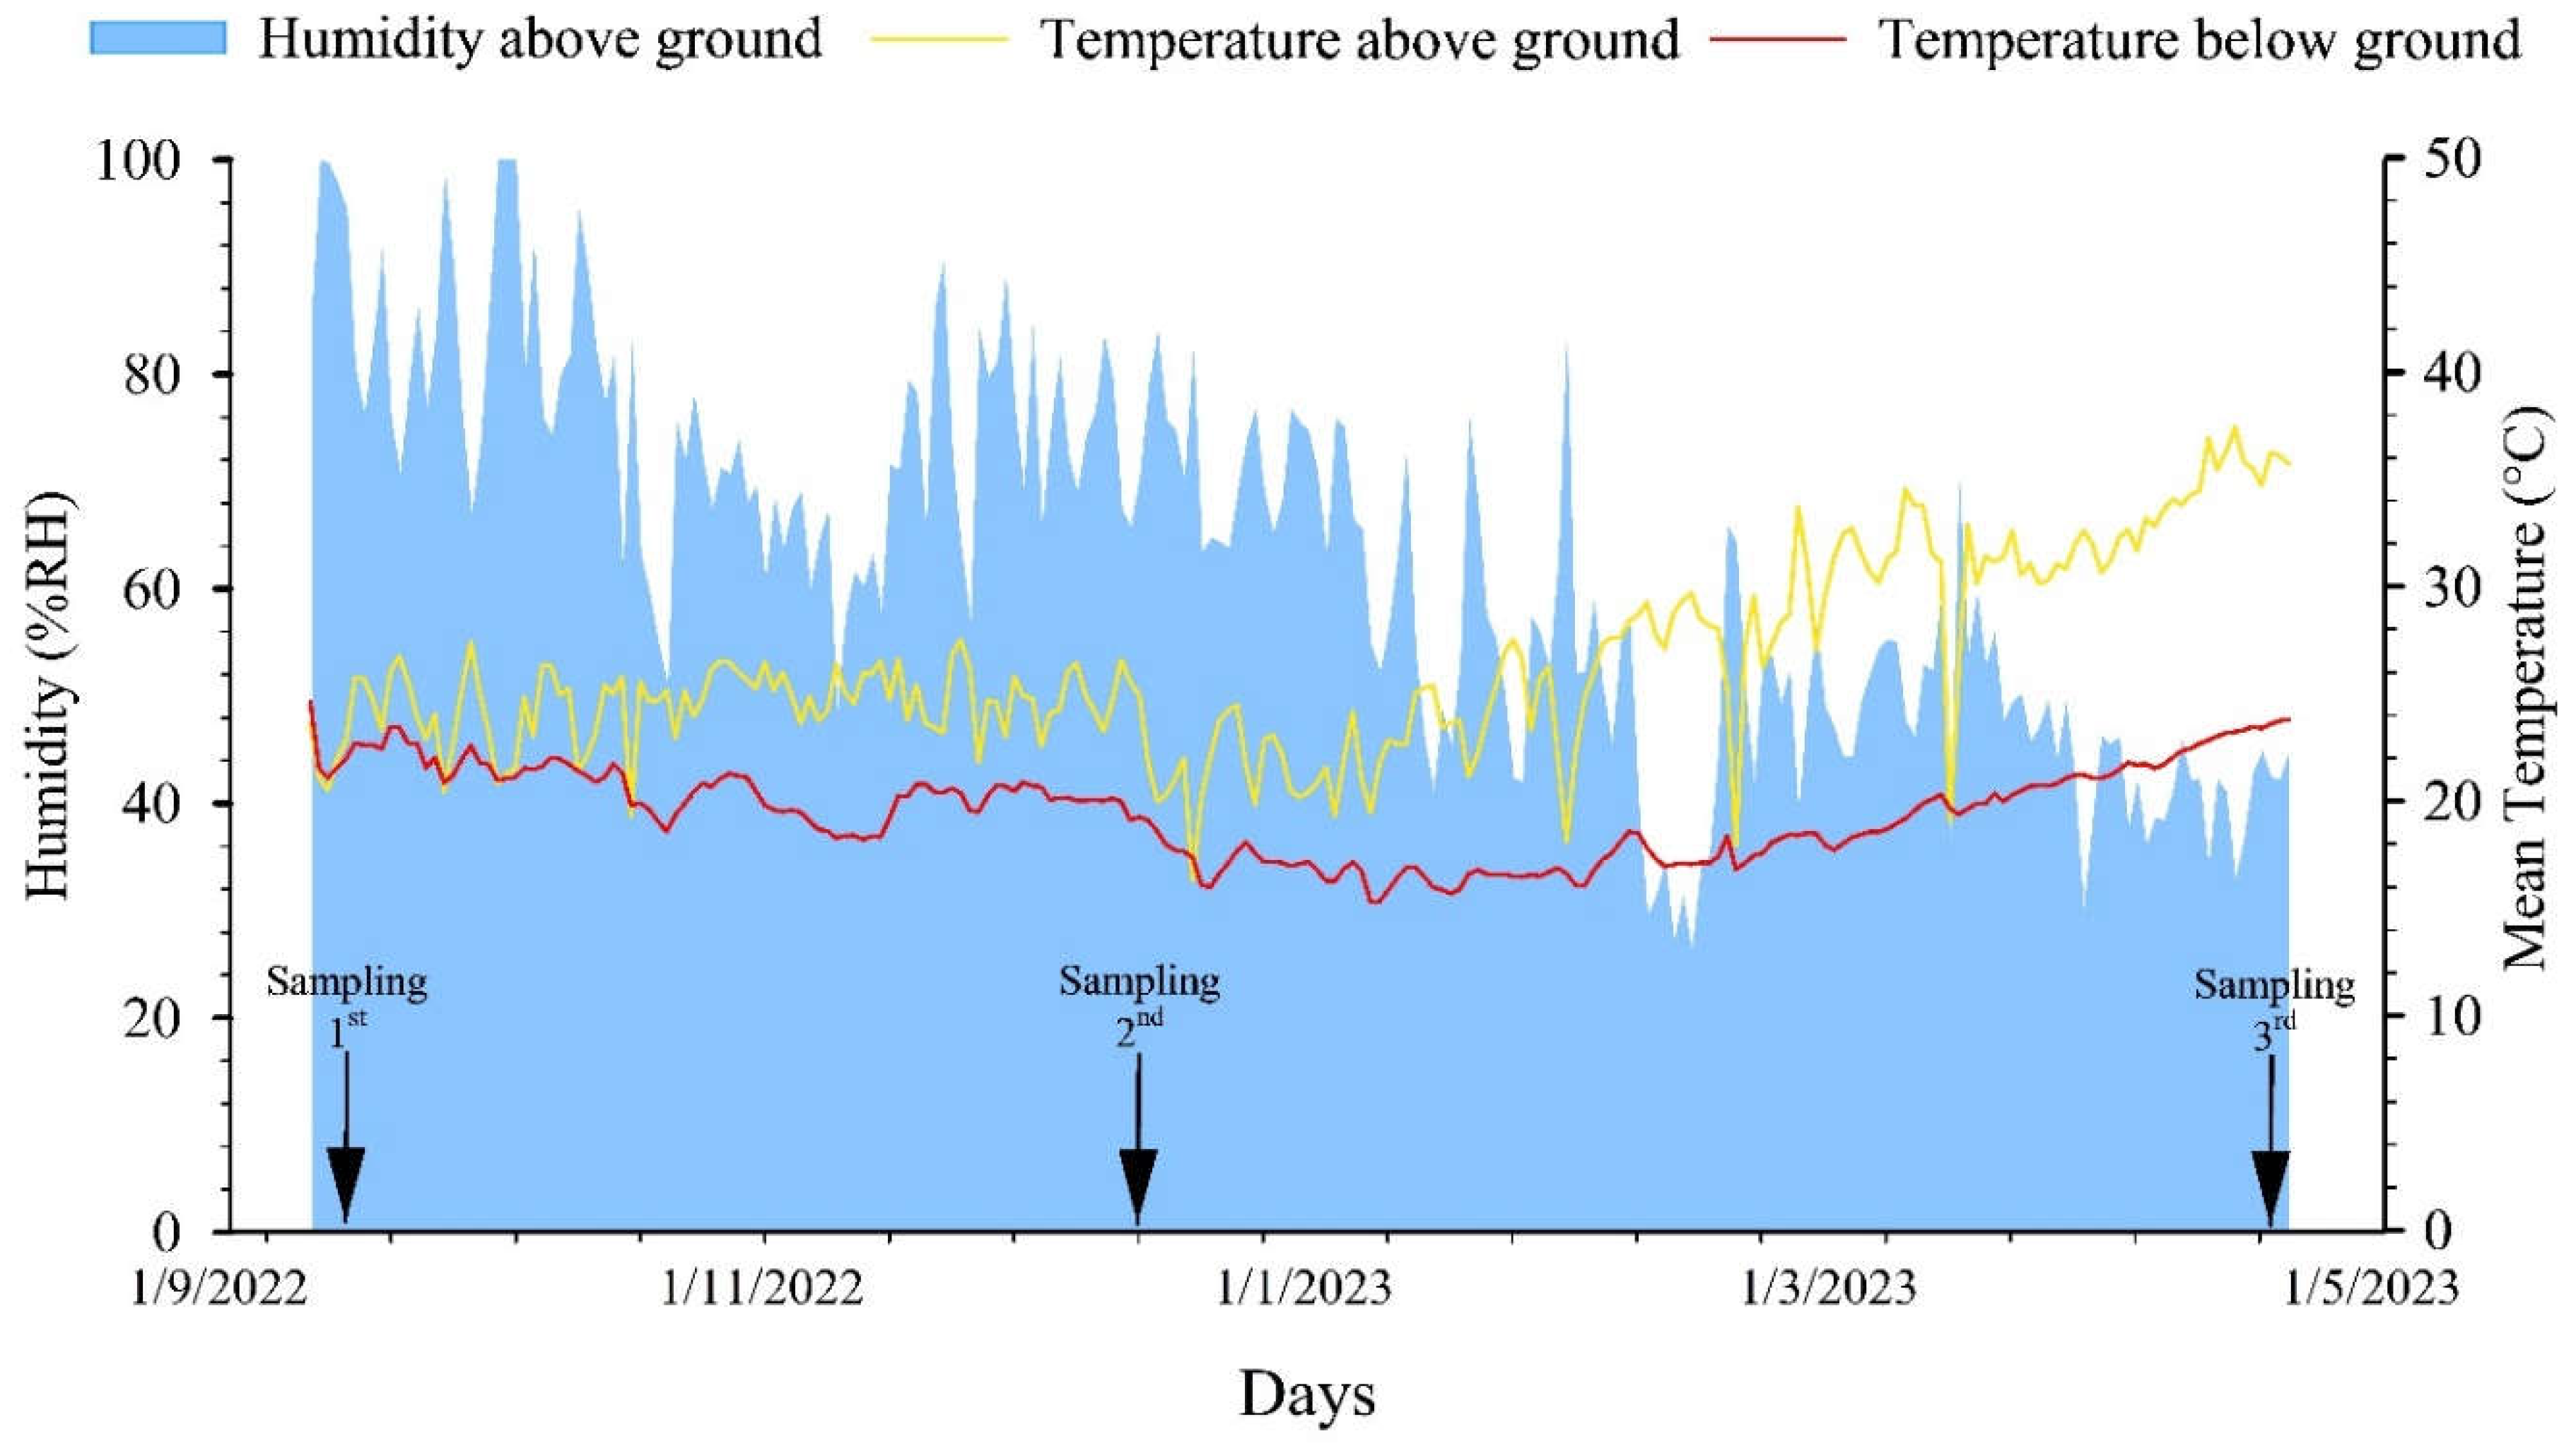
Figure 3.
Soil characteristics across different land use in three seasons (a) BD, (b) pH, (c) EC, (d) C (%), (e)N (%), (f) C/N, (g) C stock, (h) STN, (i) available P, (j) Exchangeable K, (k) Exchangeable Ca, and (l) Exchangeable Mg. Note: NF: natural forest; CA: coffee monoculture; FC; coffee combined with forest; CP: Arabica coffee combined with persimmon; BD: bulk density; EC: electrical conductivity; C (%): carbon; N (%): nitrogen; C/N: C:N ratio; P: phosphorus; K: potassium; Ca: calcium; Mg: magnesium. Different letters indicate the significance of different land uses.
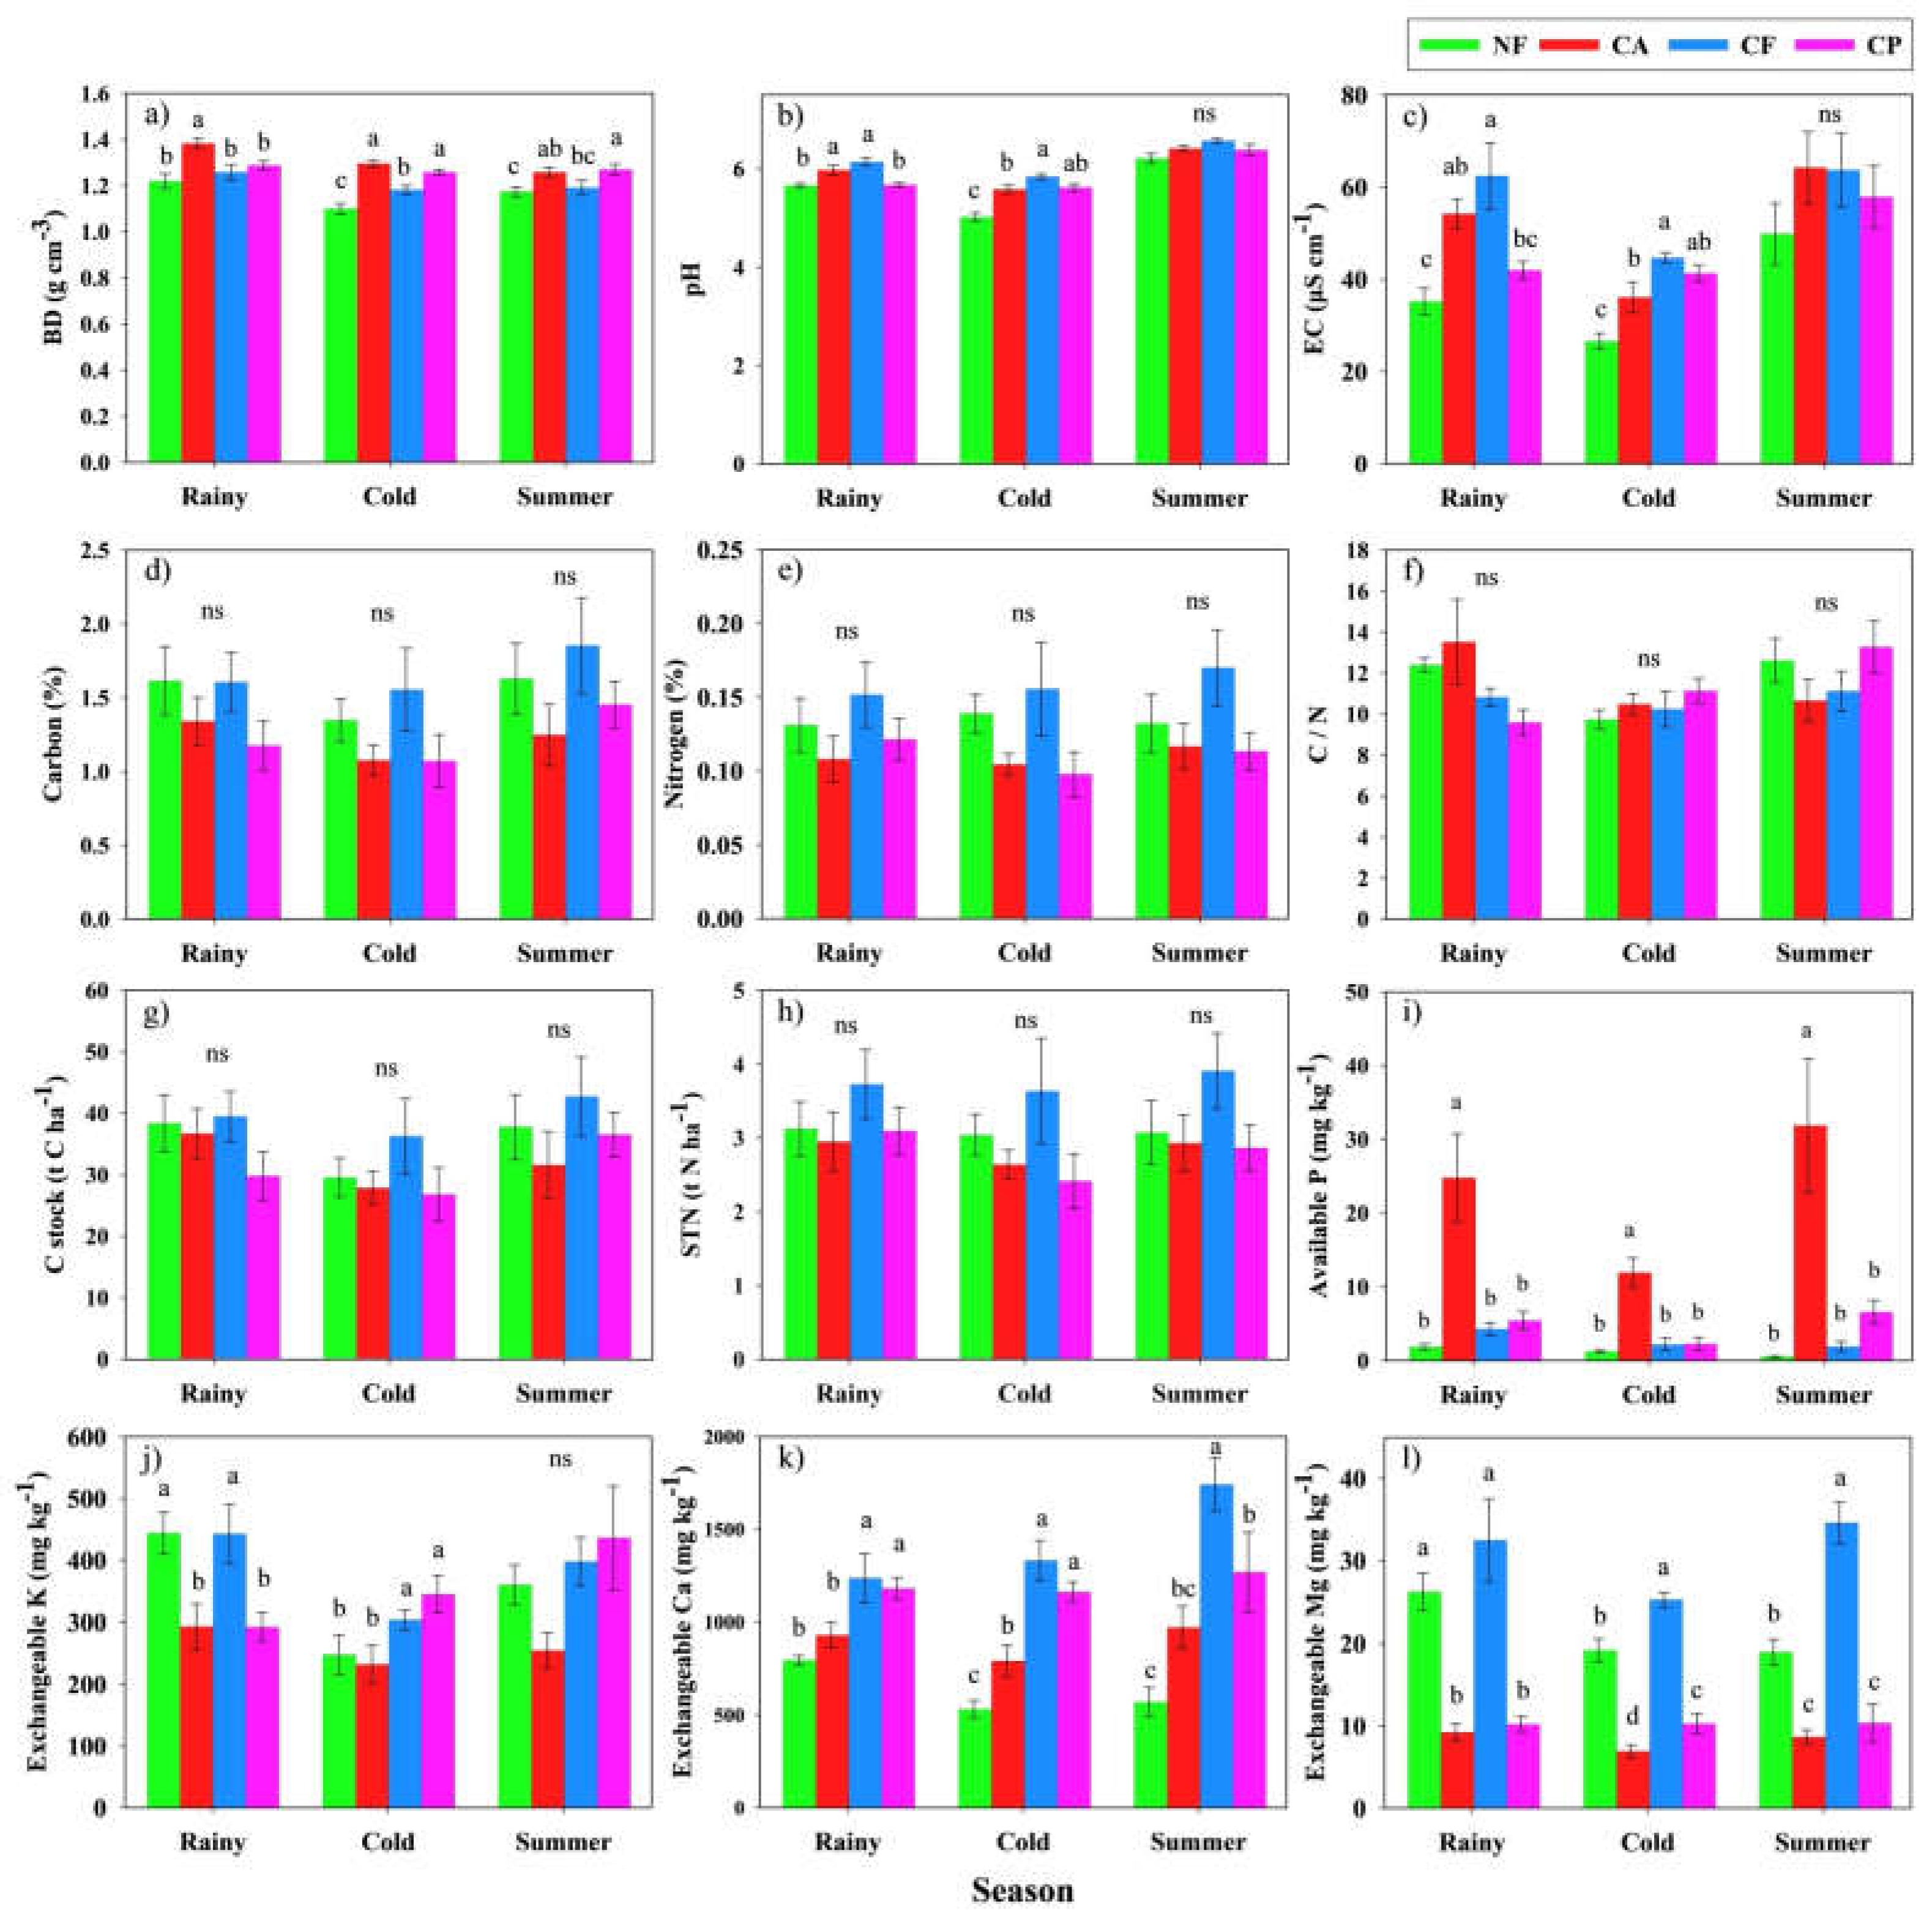
Figure 4.
Soil C stock across the different land uses in three seasons and three depths (a) 0-20 cm., (b) 20-40 cm., and (c) 40-60 cm. NF: natural forest; CA: coffee monoculture; FC; coffee combined with forest; CP: Arabica coffee combined with persimmon. Different letters indicate the statistical significance at p<0.05.
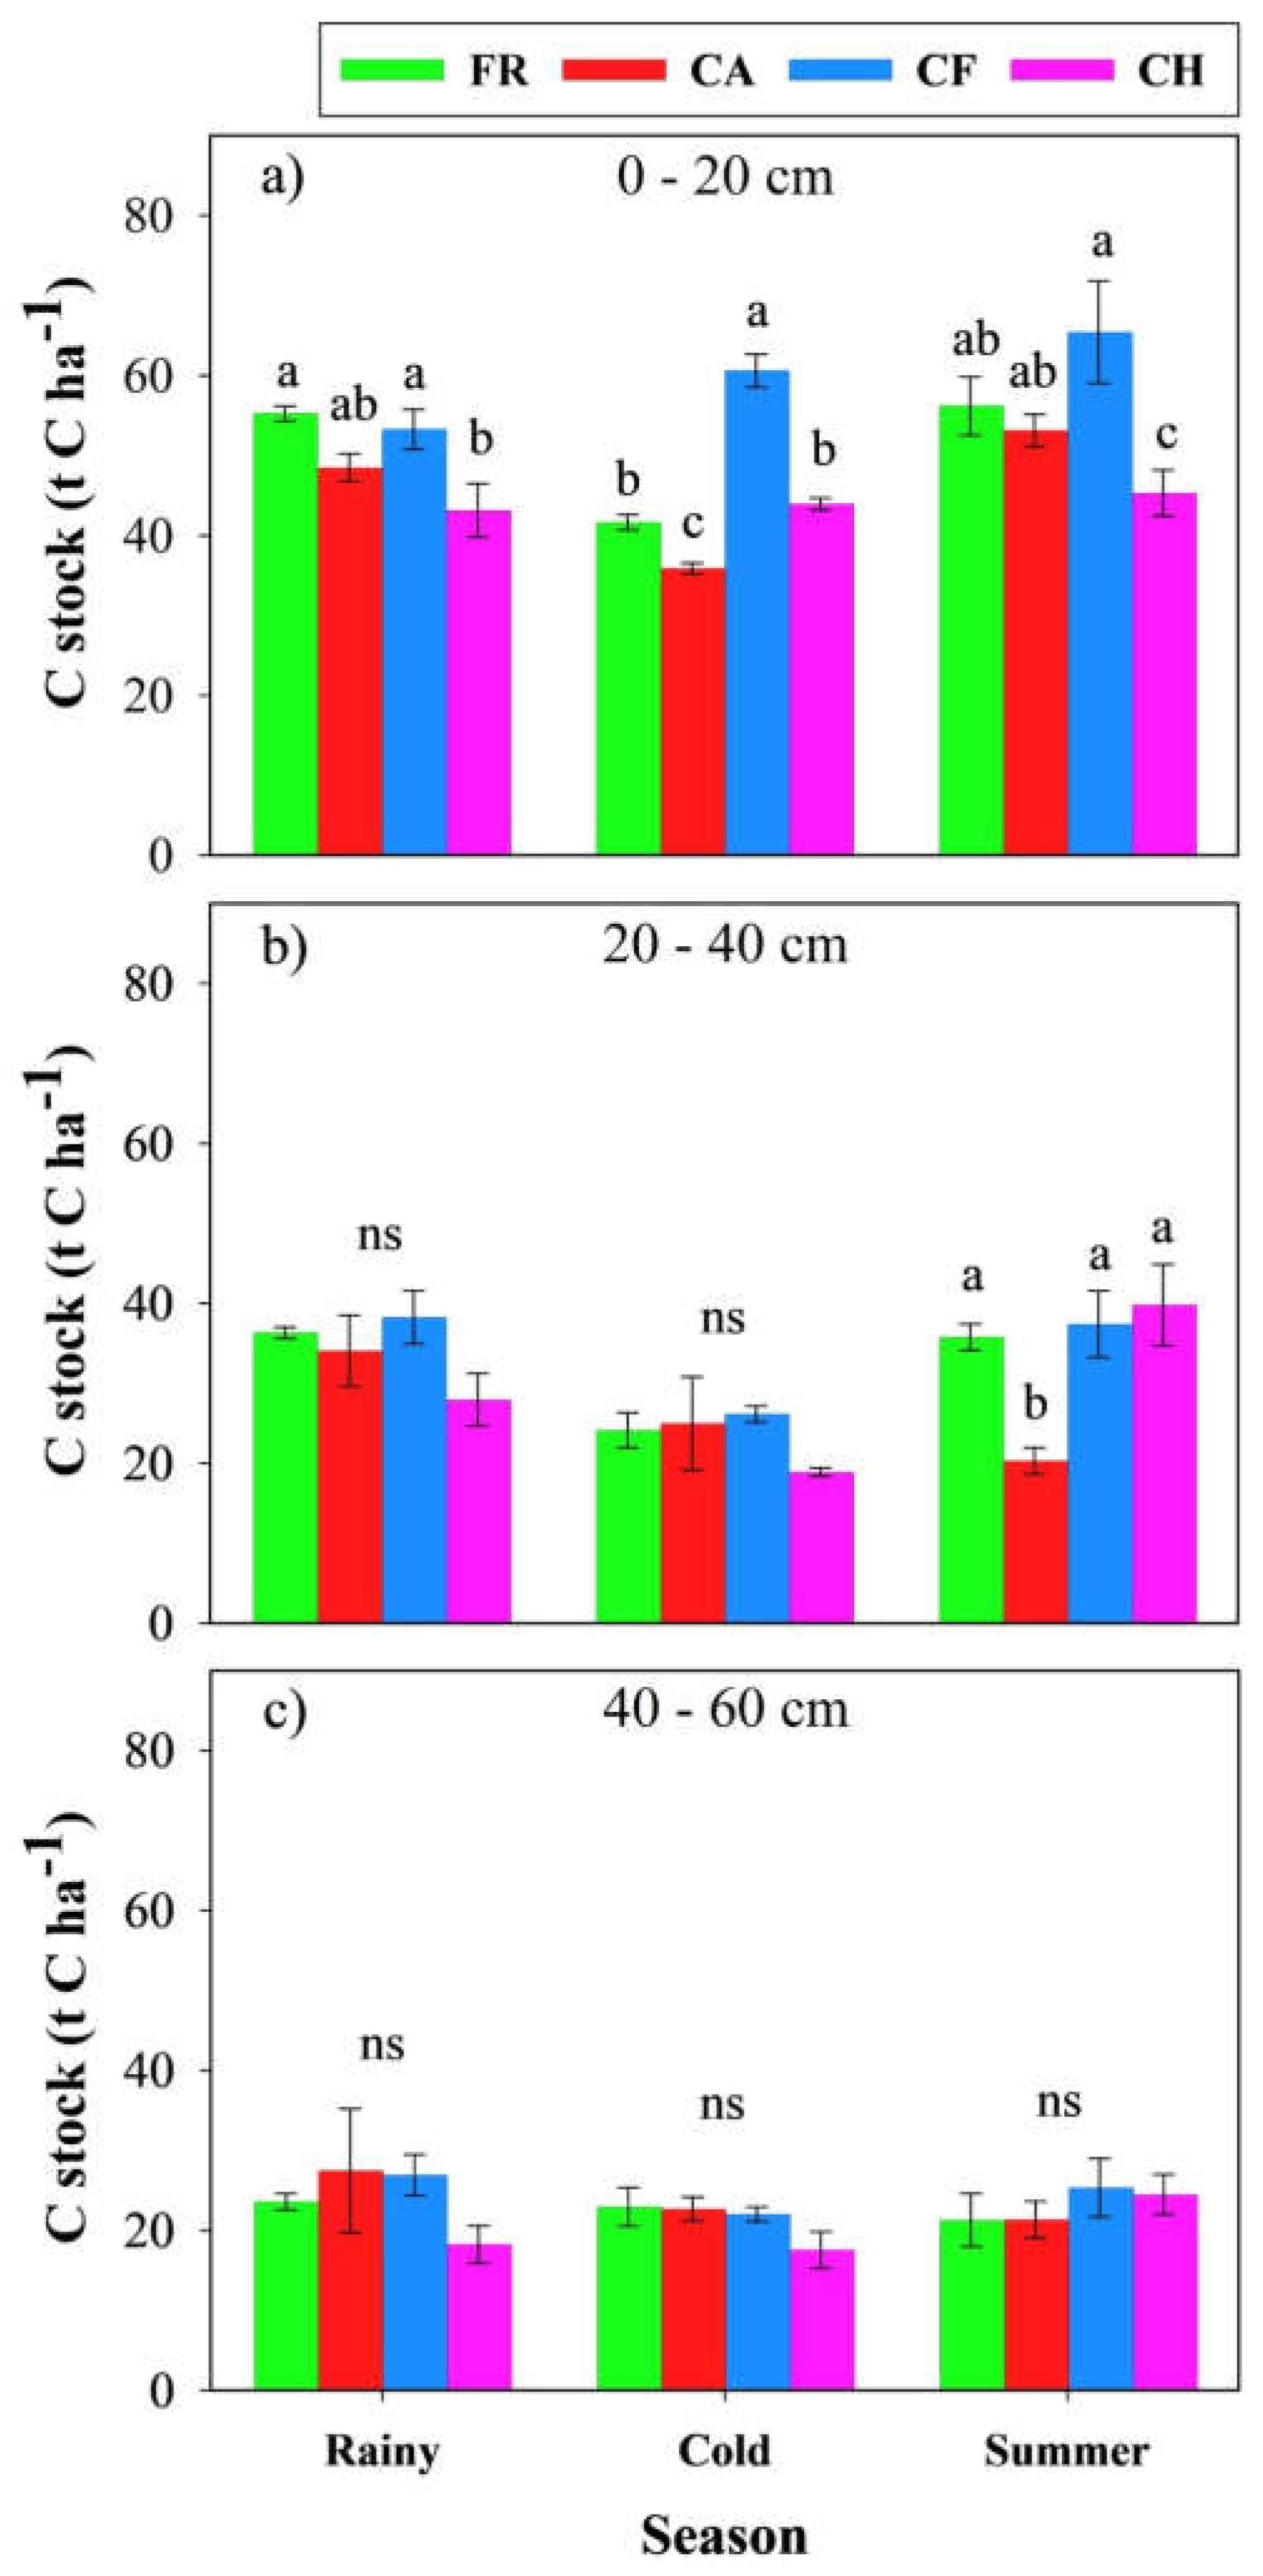
Figure 5.
soil stock C stack bar varies according to various land uses in three seasons and three depths (a) rainy season, (b) cold season, and (c) summer season. NF: natural forest; CA: coffee monoculture; FC: coffee combined with forest; CP: Arabica coffee combined with persimmon. Different letters indicate the statistical significance at p<0.05.
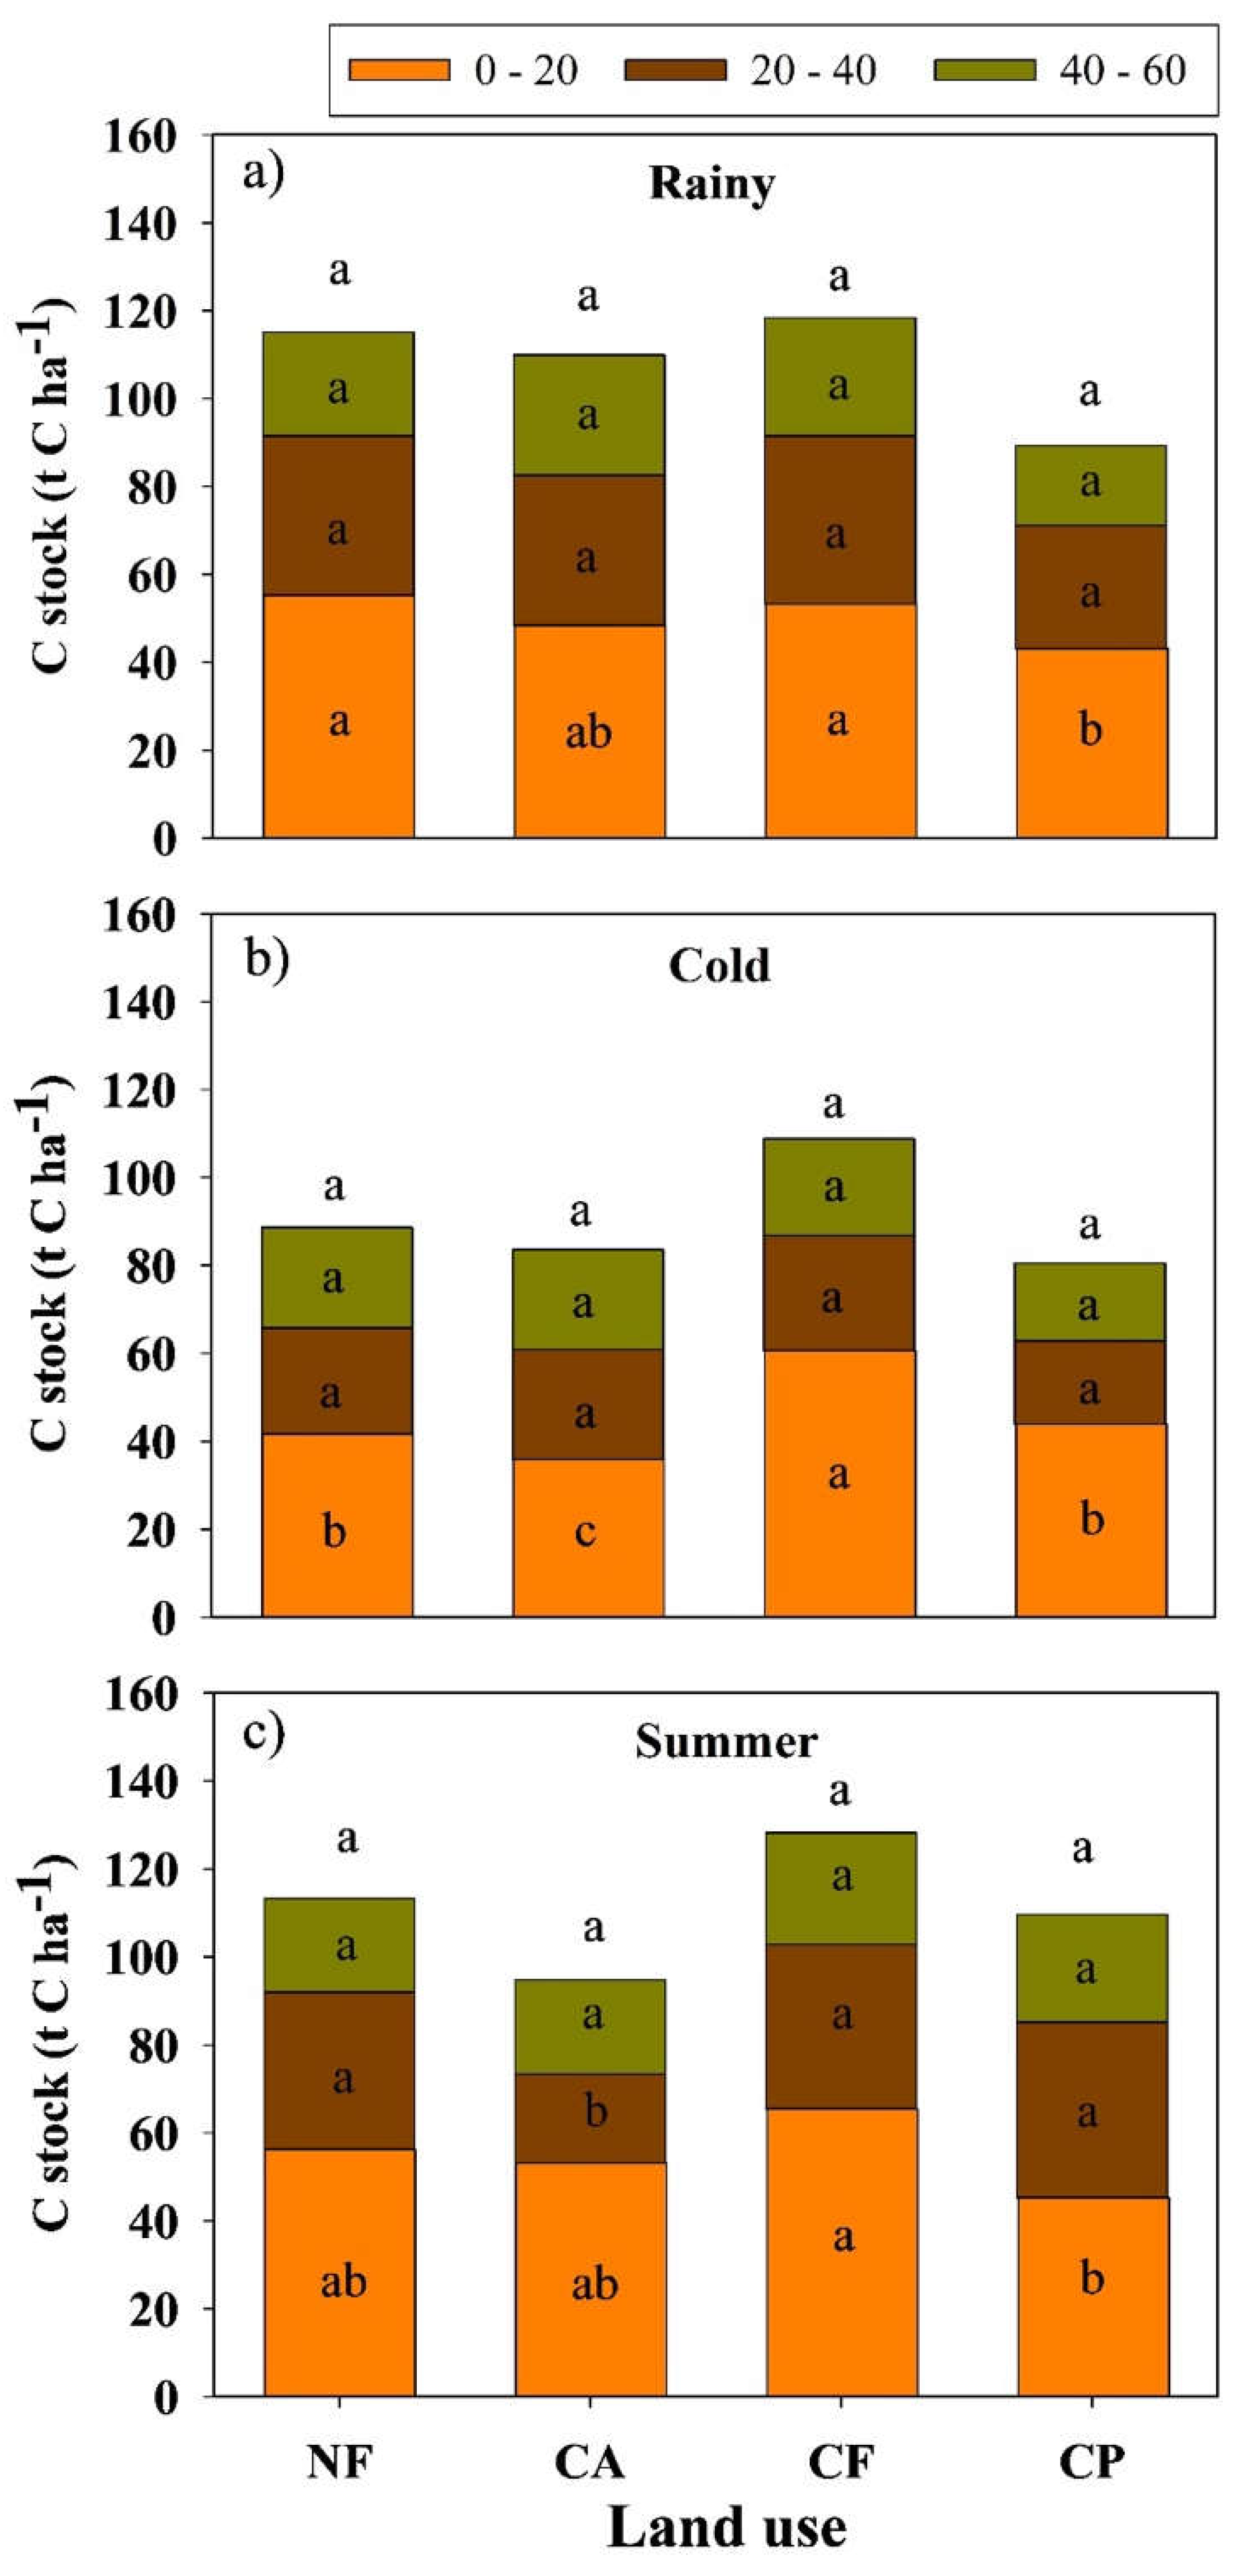
Figure 6.
(a) MBC and (b) DOC analysis across the different land uses in three seasons. NF: natural forest; CA: coffee monoculture; FC: coffee combined with forest; CP: Arabica coffee combined with persimmon; MBC: microbial biomass carbon; DOC: dissolved organic carbon. Different letters indicate the statistically significant difference at p<0.05.

Figure 7.
Result of MR across the different land uses in three seasons (a) rainy season, (b) cold season, and (c) summer season. NF: natural forest; CA: coffee monoculture; FC: coffee combined with forest; CP: Arabica coffee combined with persimmon; MR: microbial respiration; *: significant; ns: nonsignificant. Different letters in the table indicate the significance of different land uses. Error bars indicate Standard Error.
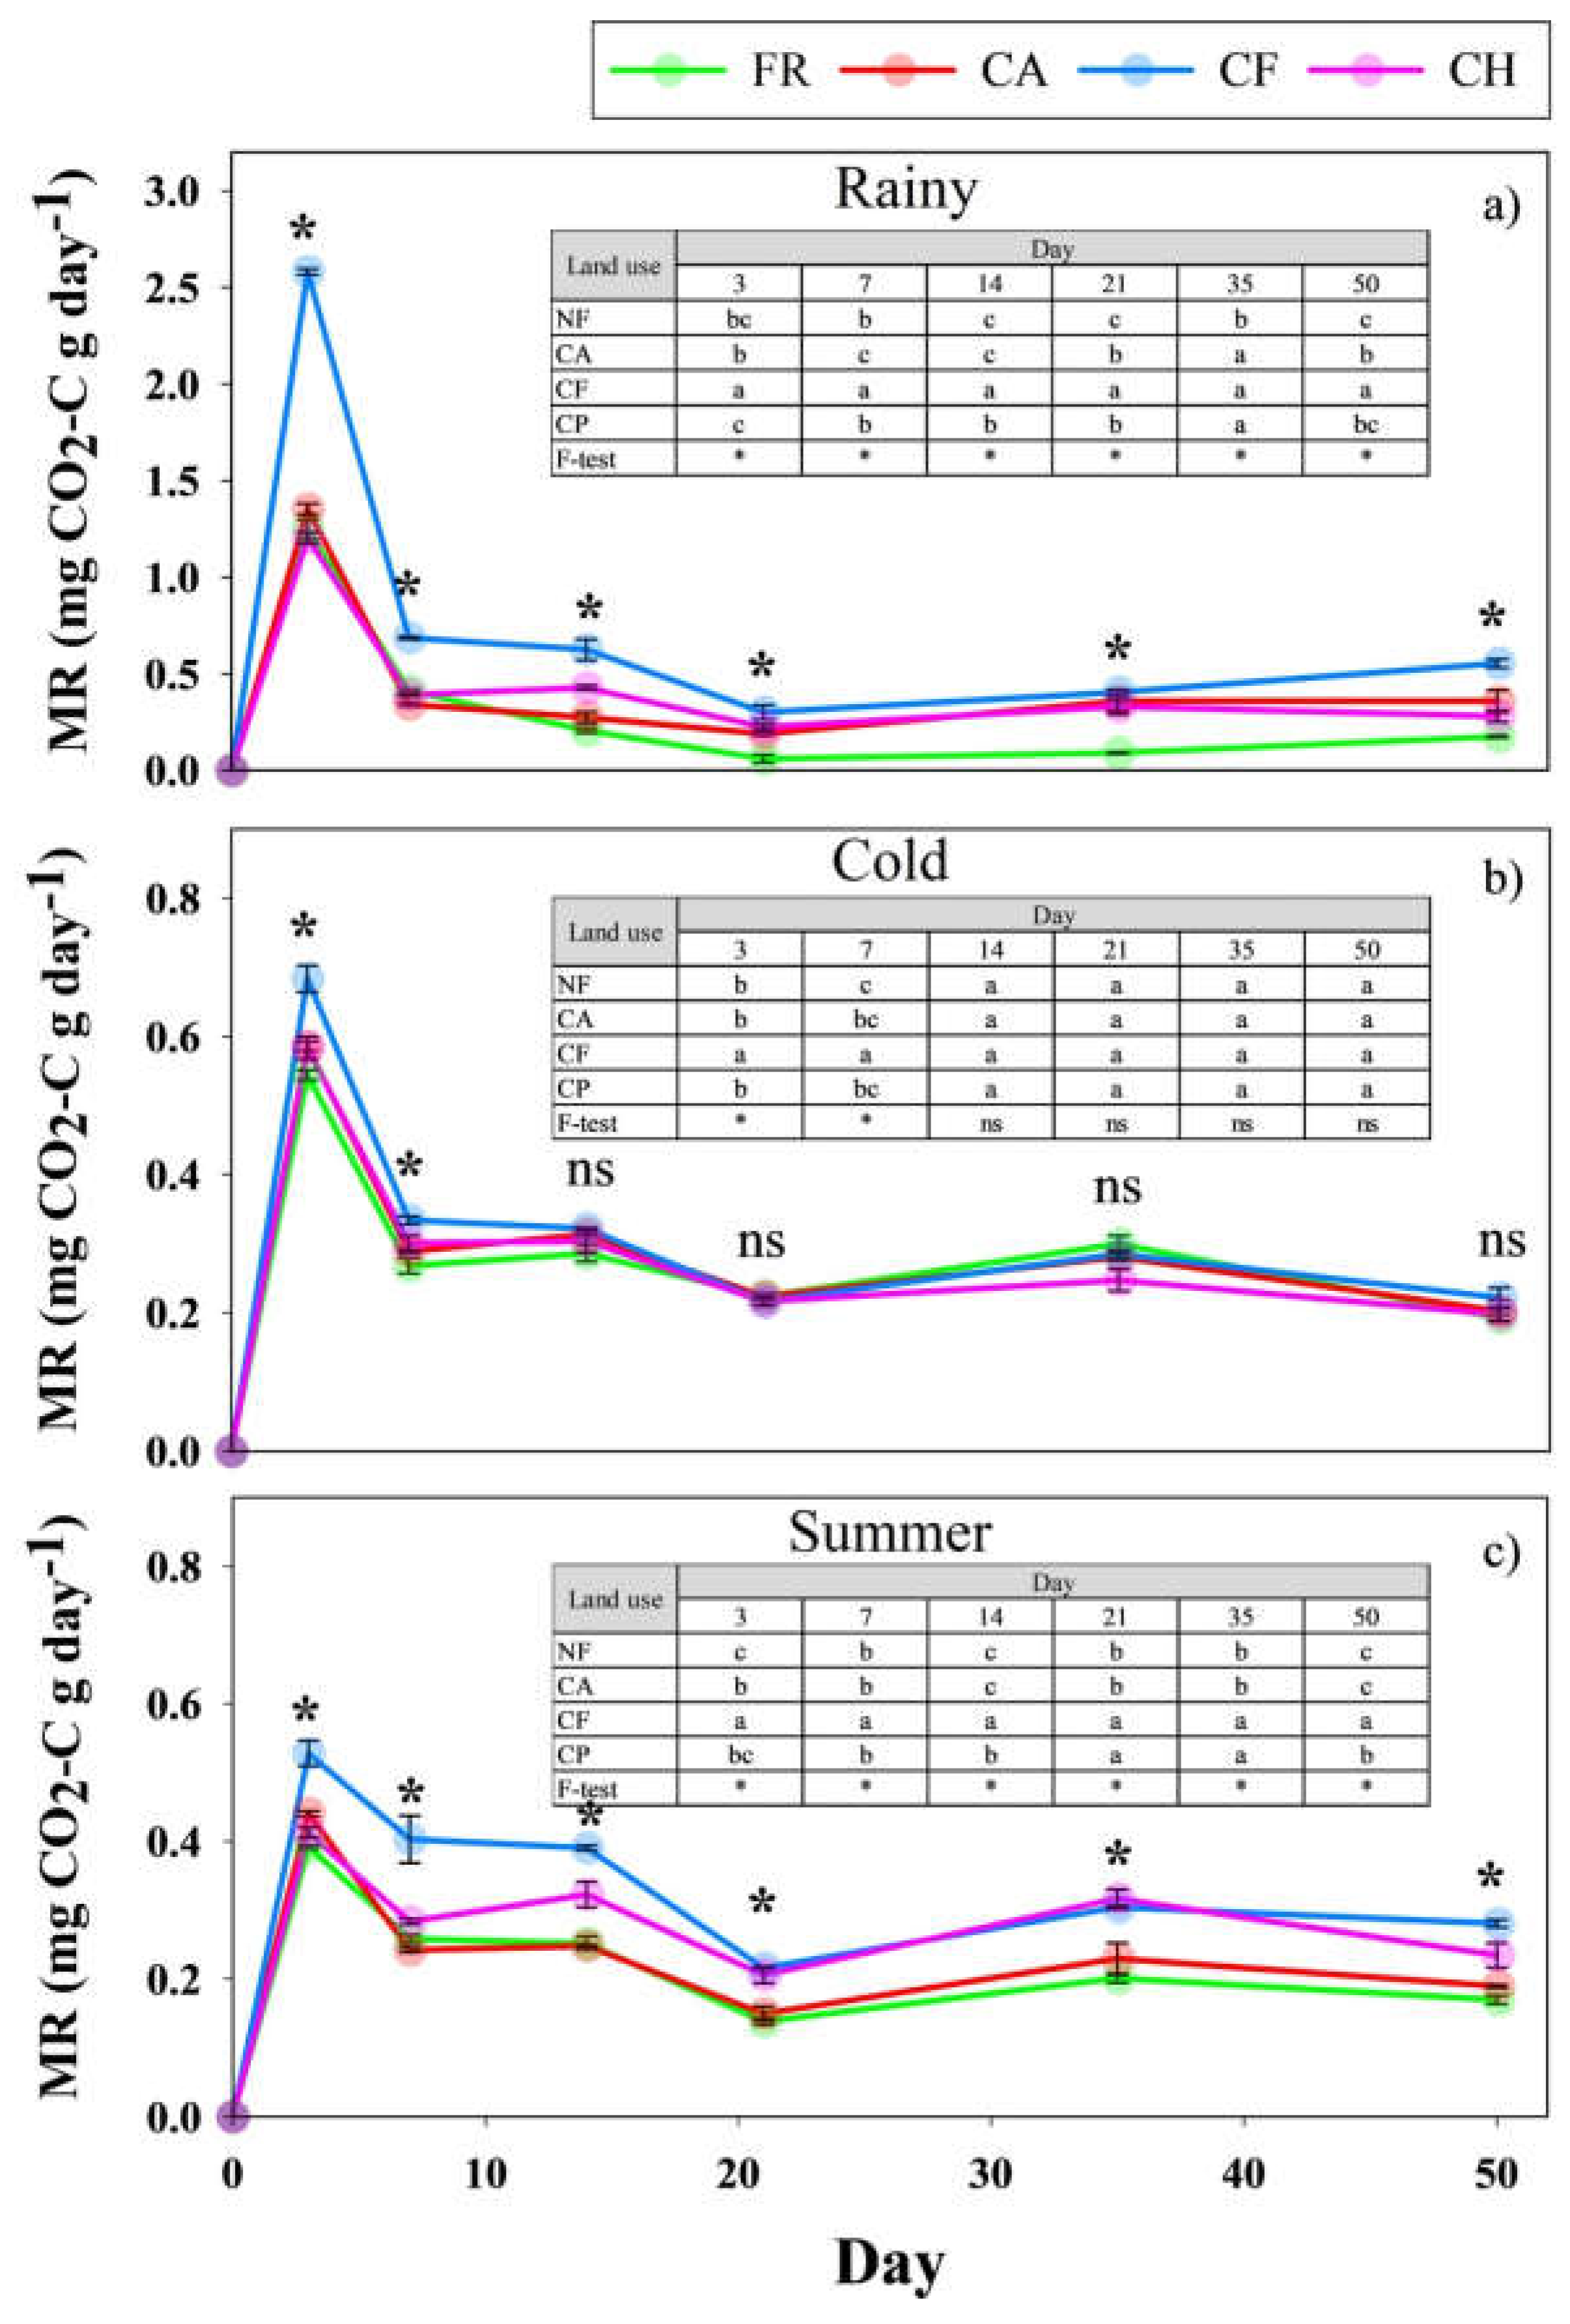
Figure 8.
Mean commutative values of MR across the different land uses in three seasons (a) rainy season, (b) cold season, and (c) summer season. NF: natural forest; CA: coffee monoculture; FC: coffee combined with forest; CP: Arabica coffee combined with persimmon; MR: microbial respiration; *: significant; ns: nonsignificant. Different letters in the table indicate the significance of different land uses.

Figure 9.
Relationship between soil characteristics with different soil depths (a) 0-20 cm, (b) 20-40 cm, (c) 40-60 cm. Note: *** significant at p < 0.001, ** significant at p < 0.01, * significant at p < 0.05. BD: bulk density; C: carbon; N: nitrogen; C/N: C:N ratio; C stock:soil carbon stock; STN: soil total nitrogen; P: available phosphorus; K: Exchangeable potassium; Ca: exchangeable calcium; Mg: exchangeable magnesium; MR: microbial respiration; MBC: microbial biomass carbon; DOC: dissolve organic carbon.
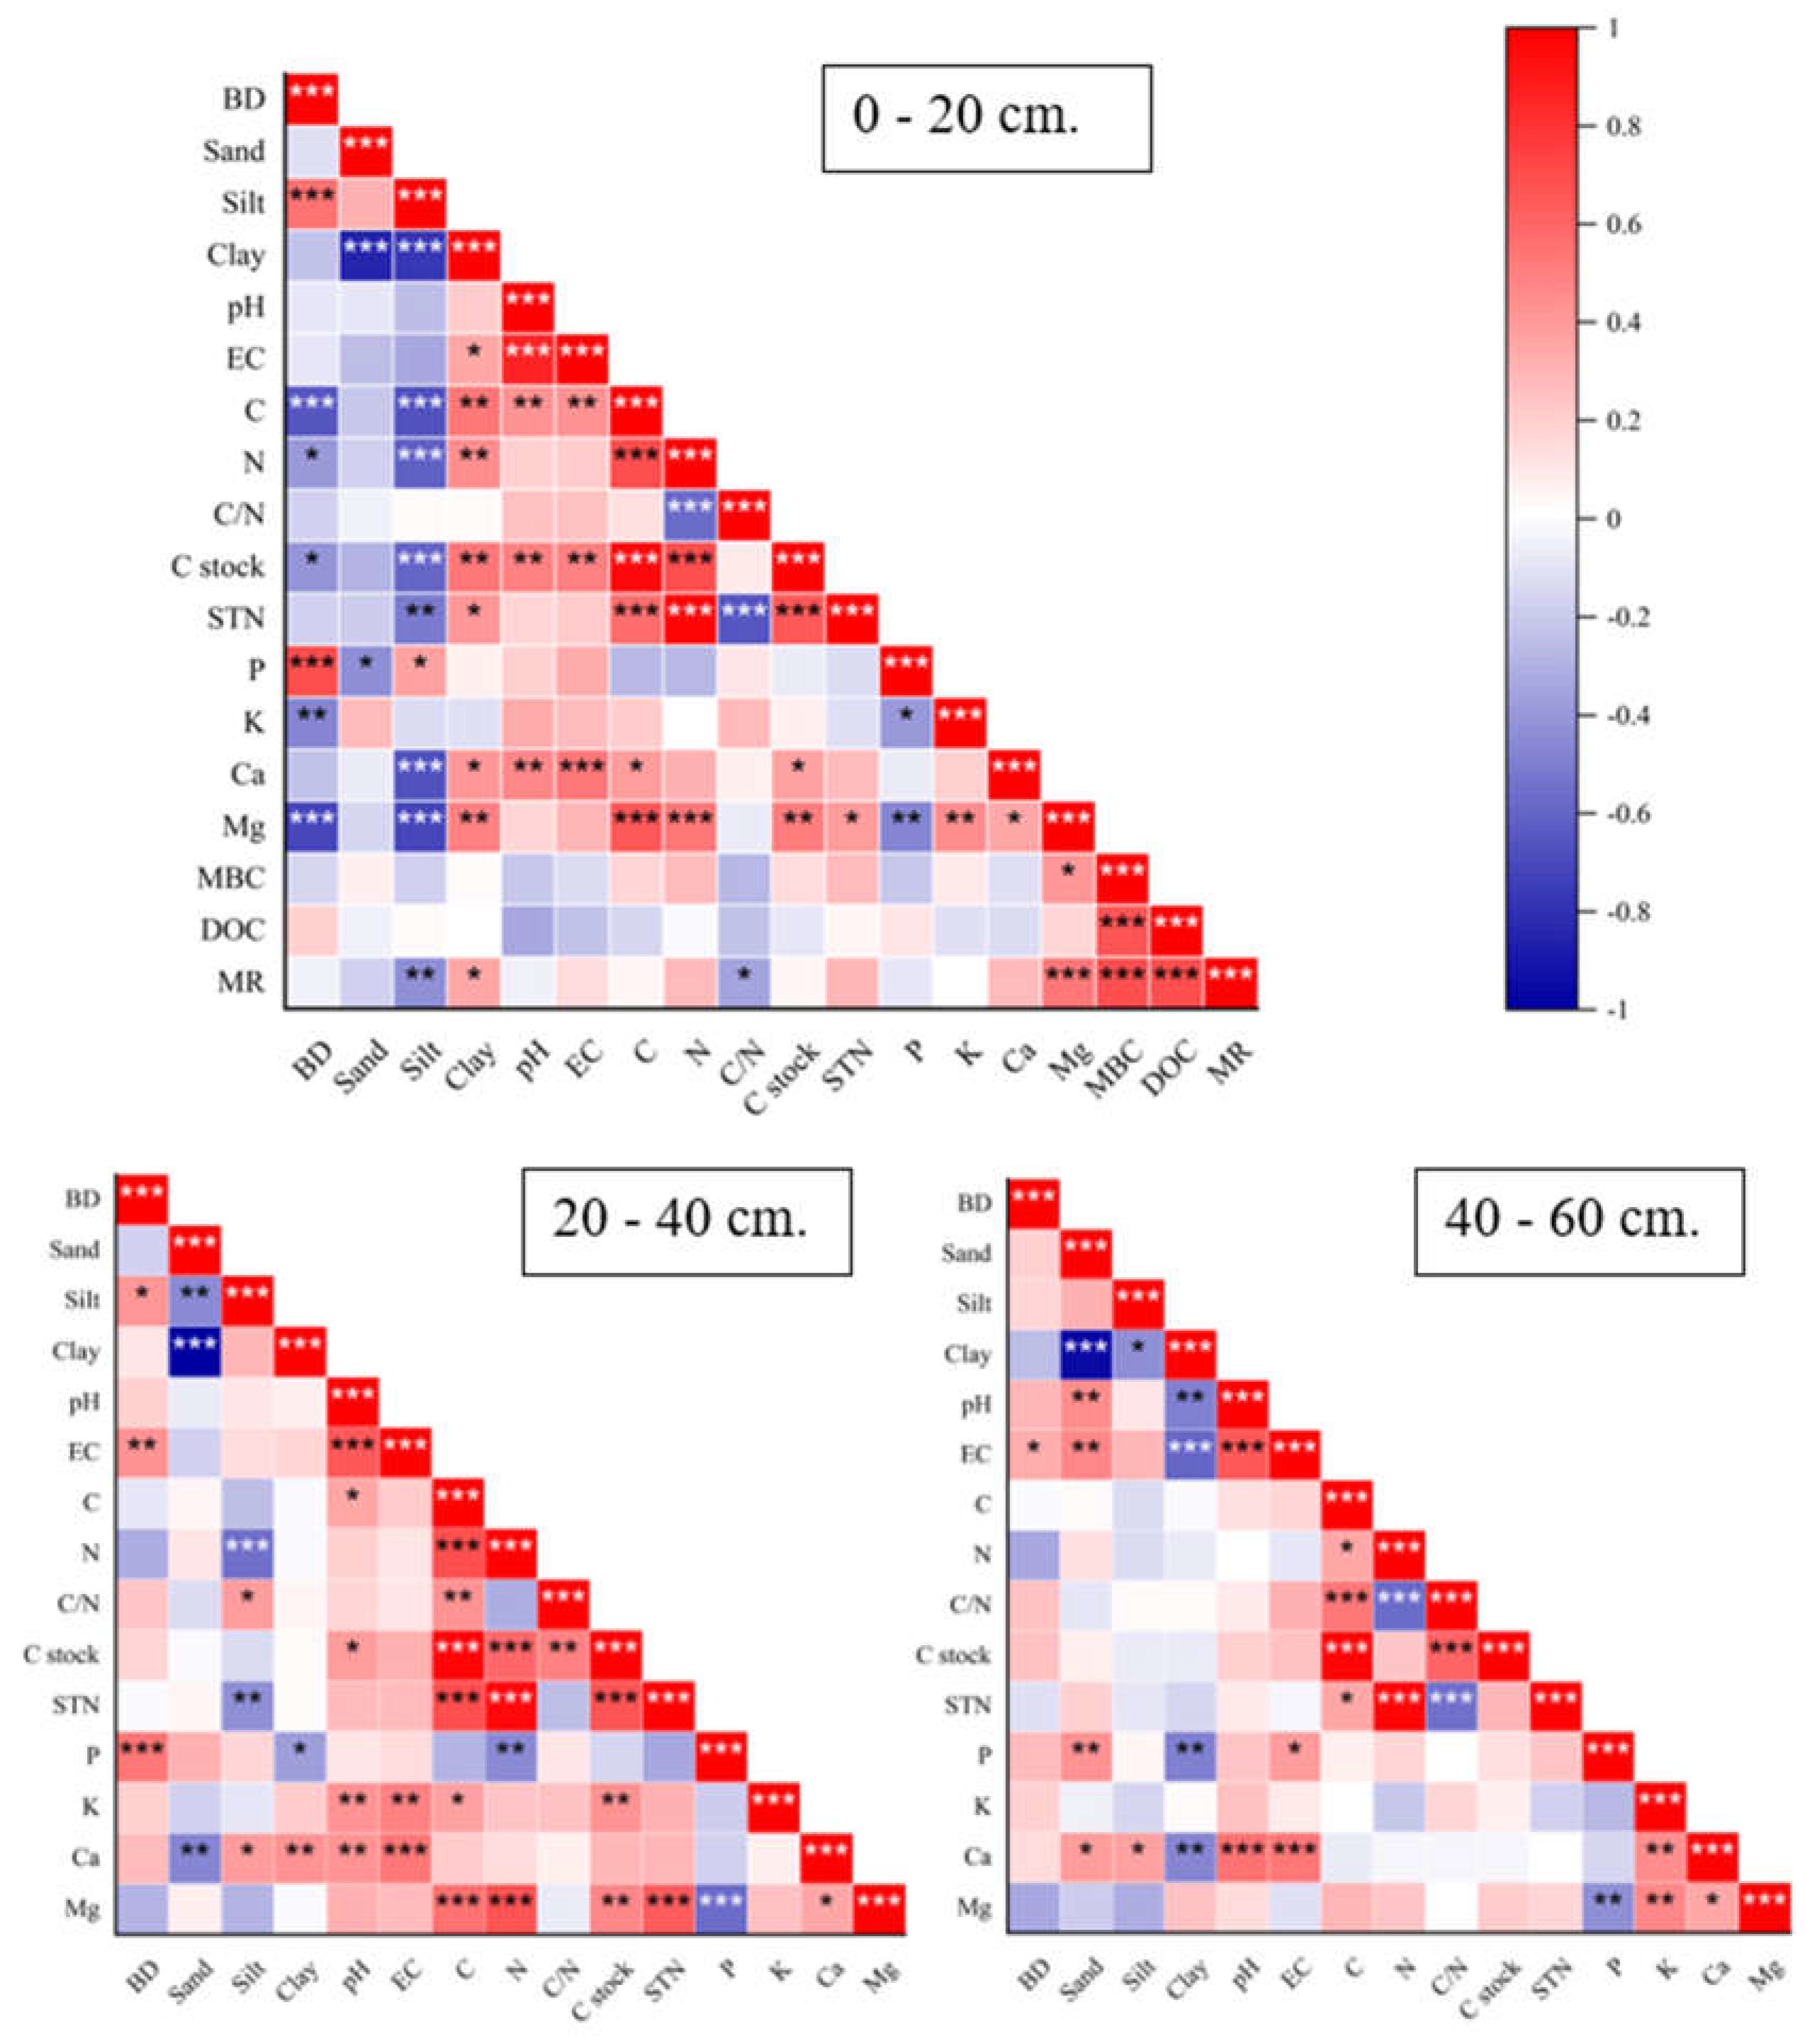
Figure 10.
Relationships between C stock and microbial activity (a) MBC, (b) DOC, and (c) MR. MR: microbial respiration; MBC: microbial biomass carbon; DOC: dissolve organic carbon.
Figure 10.
Relationships between C stock and microbial activity (a) MBC, (b) DOC, and (c) MR. MR: microbial respiration; MBC: microbial biomass carbon; DOC: dissolve organic carbon.
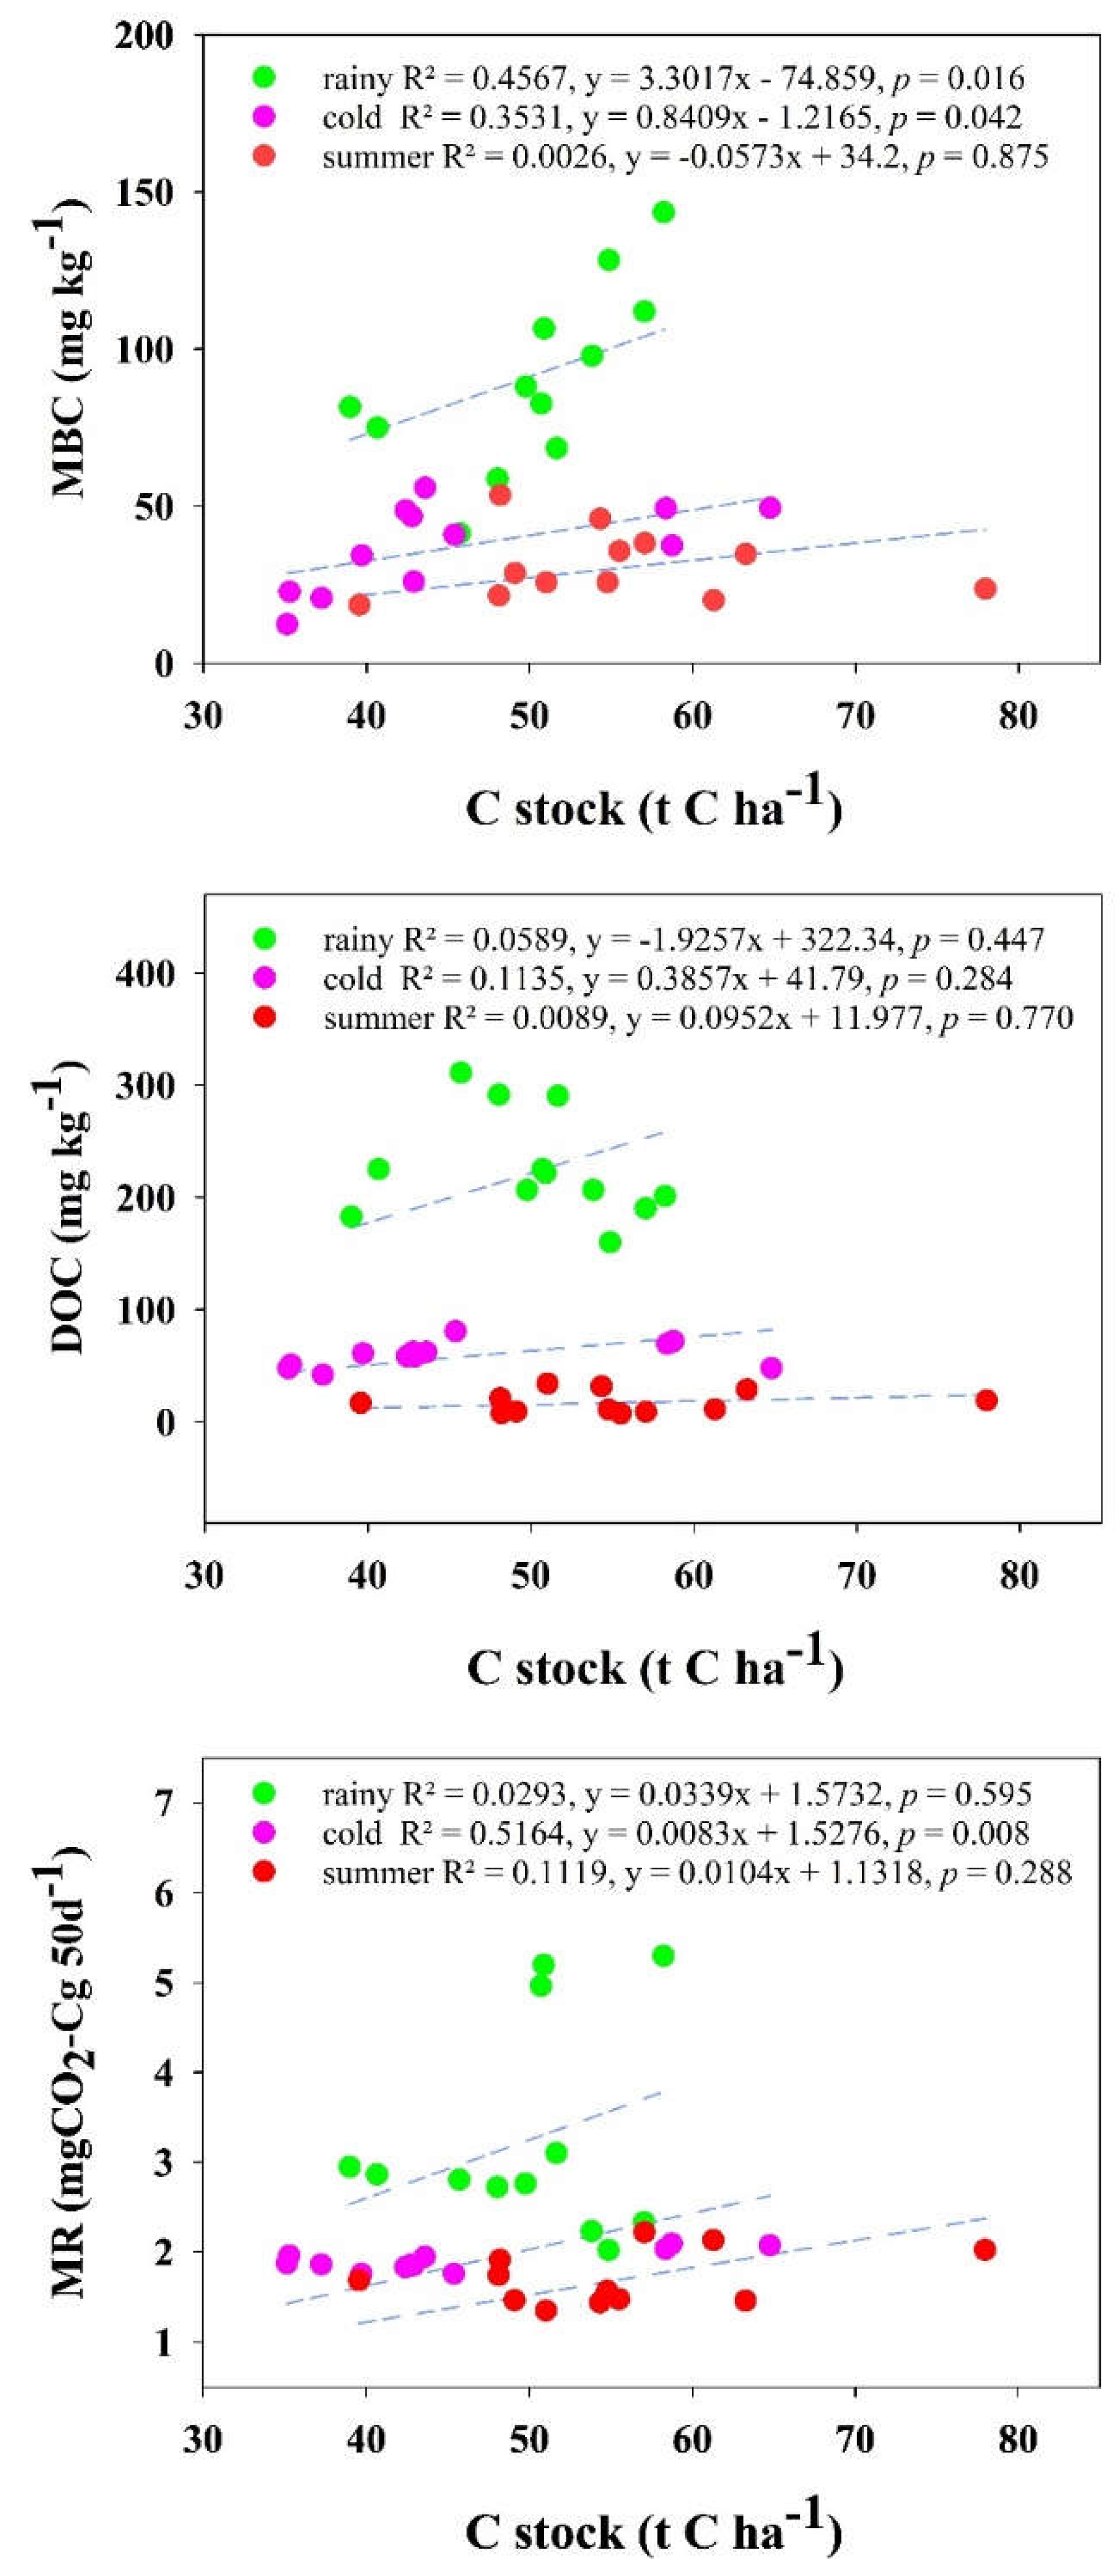

Table 1.
Result of Two-way ANOVA for soil characteristics in the different land use and soil depth before experiment.
Table 1.
Result of Two-way ANOVA for soil characteristics in the different land use and soil depth before experiment.
|
Land use × Depth |
Physical characteristics | Chemical characteristics | ||||||||||||
| BD | Sand | Silt | Clay | pH | EC | C | N | C/N | Available | Exchangeable | ||||
| P | K | Ca | Mg | |||||||||||
| g cm-3 | % | % | % | μS cm-1 | % | % | mg kg-1 | mg kg-1 | mg kg-1 | mg kg-1 | ||||
| FR 0 – 20 | 1.11 | 44.67 | 27.33 | 28.00 | 5.76 | 49.82 | 2.29 | 0.19 | 12.68 | 1.92 | 461 | 760 | 26.61 | |
| FR 20 – 40 | 1.15 | 50.67 | 24.67 | 24.67 | 5.73 | 34.31 | 1.39 | 0.13 | 10.79 | 1.22 | 327 | 616 | 20.67 | |
| FR 40 – 60 | 1.23 | 36.00 | 16.67 | 47.33 | 5.39 | 27.55 | 0.91 | 0.09 | 11.26 | 0.49 | 301 | 520 | 17.05 | |
| CA 0 – 20 | 1.30 | 40.00 | 28.67 | 31.33 | 5.95 | 64.73 | 1.76 | 0.15 | 12.15 | 43.14 | 251 | 1116 | 10.59 | |
| CA 20 – 40 | 1.33 | 50.00 | 26.00 | 24.00 | 5.95 | 44.63 | 0.99 | 0.09 | 10.87 | 20.73 | 274 | 801 | 7.03 | |
| CA 40 – 60 | 1.31 | 46.00 | 22.67 | 31.33 | 6.07 | 45.18 | 0.91 | 0.09 | 11.63 | 4.67 | 255 | 779 | 7.13 | |
| CF 0 – 20 | 1.12 | 41.33 | 20.67 | 38.00 | 6.12 | 76.38 | 2.68 | 0.25 | 11.36 | 5.97 | 380 | 1889 | 37.91 | |
| CF 20 – 40 | 1.24 | 44.00 | 26.00 | 30.00 | 6.22 | 52.62 | 1.36 | 0.13 | 10.29 | 1.55 | 341 | 1293 | 28.56 | |
| CF 40 – 60 | 1.27 | 44.00 | 21.33 | 34.67 | 6.21 | 41.82 | 0.97 | 0.09 | 10.52 | 1.00 | 385 | 1128 | 25.85 | |
| CP 0 – 20 | 1.22 | 50.00 | 28.00 | 22.00 | 5.92 | 55.95 | 1.81 | 0.16 | 11.68 | 8.93 | 417 | 1430 | 15.29 | |
| CP 20 – 40 | 1.28 | 38.67 | 26.67 | 34.67 | 5.92 | 43.99 | 1.12 | 0.10 | 12.05 | 4.45 | 338 | 1151 | 8.83 | |
| CP 40 – 60 | 1.32 | 43.33 | 28.67 | 35.33 | 5.84 | 41.23 | 0.76 | 0.08 | 10.25 | 0.88 | 319 | 1031 | 6.63 | |
| P values | 0.013 | 0 | 0.112 | 0 | 0.67 | 0.530 | 0 | 0 | 0.890 | 0 | 0.358 | 0.094 | 0.403 | |
| CV | * | 6.24 | 16.14 | 9.14 | 7.66 | 30.37 | 19.43 | 23.88 | 27.72 | 82.71 | 37.75 | 26.07 | 31.24 | |
Note: BD: bulk density; EC: electrical conductivity; C (%): carbon; N (%): nitrogen; C/N: C:N ratio; P: phosphorus; K: potassium; Ca: calcium; Mg: magnesium.
Table 2.
Comparison of changes soil carbon stocks among natural forest and coffee growing systems.
| Depth (cm) |
Carbon Stock (t C ha-1) |
Carbon Stock (t C ha-1) |
Δ Carbon Stock (t C ha-1) |
Change Loss |
% Change |
P-value |
|---|---|---|---|---|---|---|
| NF | CA | |||||
| 0 – 20 | 51.03 ± 2.61 | 45.83 ± 2.70 | -5.20 ± 1.14 | - | 10.18 | 0.002 |
| 20 – 40 | 32.06 ± 2.15 | 26.44 ± 2.97 | -5.62 ± 3.60 | - | 17.53 | 0.157 |
| 40 – 60 | 22.59 ± 1.27 | 23.83 ± 2.55 | 1.24 ± 3.04 | + | 5.48 | 0.694 |
| 0 – 60 | 105.68 ± 4.49 | 96.10 ± 5.56 | -9.58 ± 4.64 | - | 9.06 | 0.073 |
| NF | CF | |||||
| 0 – 20 | 51.03 ± 2.61 | 59.78 ± 2.72 | 8.75 ± 4.10 | + | 17.15 | 0.065 |
| 20 – 40 | 32.06 ± 2.15 | 33.93 ± 2.50 | 1.87 ± 1.37 | + | 5.84 | 0.208 |
| 40 – 60 | 22.59 ± 1.27 | 24.76 ± 1.50 | 2.16 ± 1.37 | + | 9.57 | 0.153 |
| 0 – 60 | 105.68 ± 4.49 | 118.47 ± 3.73 | 12.79 ± 3.15 | + | 12.10 | 0.004 |
| NF | CP | |||||
| 0 – 20 | 51.03 ± 2.61 | 44.13 ± 1.33 | -6.90 ± 2.68 | - | 13.51 | 0.033 |
| 20 – 40 | 32.06 ± 2.15 | 28.88 ± 3.56 | -3.18 ± 2.89 | - | 9.92 | 0.304 |
| 40 – 60 | 22.59 ± 1.27 | 20.11 ± 1.62 | -2.49 ± 2.26 | - | 11.02 | 0.304 |
| 0 – 60 | 105.68 ± 4.49 | 93.12 ± 5.25 | -12.56 ± 5.09 | - | 11.89 | 0.039 |
Note: loss (-), gain (+). NF: natural forest; CA: coffee monoculture; FC: coffee combined with forest; CP: Arabica coffee combined with persimmon.
Disclaimer/Publisher’s Note: The statements, opinions and data contained in all publications are solely those of the individual author(s) and contributor(s) and not of MDPI and/or the editor(s). MDPI and/or the editor(s) disclaim responsibility for any injury to people or property resulting from any ideas, methods, instructions or products referred to in the content. |
© 2024 by the authors. Licensee MDPI, Basel, Switzerland. This article is an open access article distributed under the terms and conditions of the Creative Commons Attribution (CC BY) license (http://creativecommons.org/licenses/by/4.0/).
Copyright: This open access article is published under a Creative Commons CC BY 4.0 license, which permit the free download, distribution, and reuse, provided that the author and preprint are cited in any reuse.


