Submitted:
21 February 2025
Posted:
25 February 2025
Read the latest preprint version here
Abstract
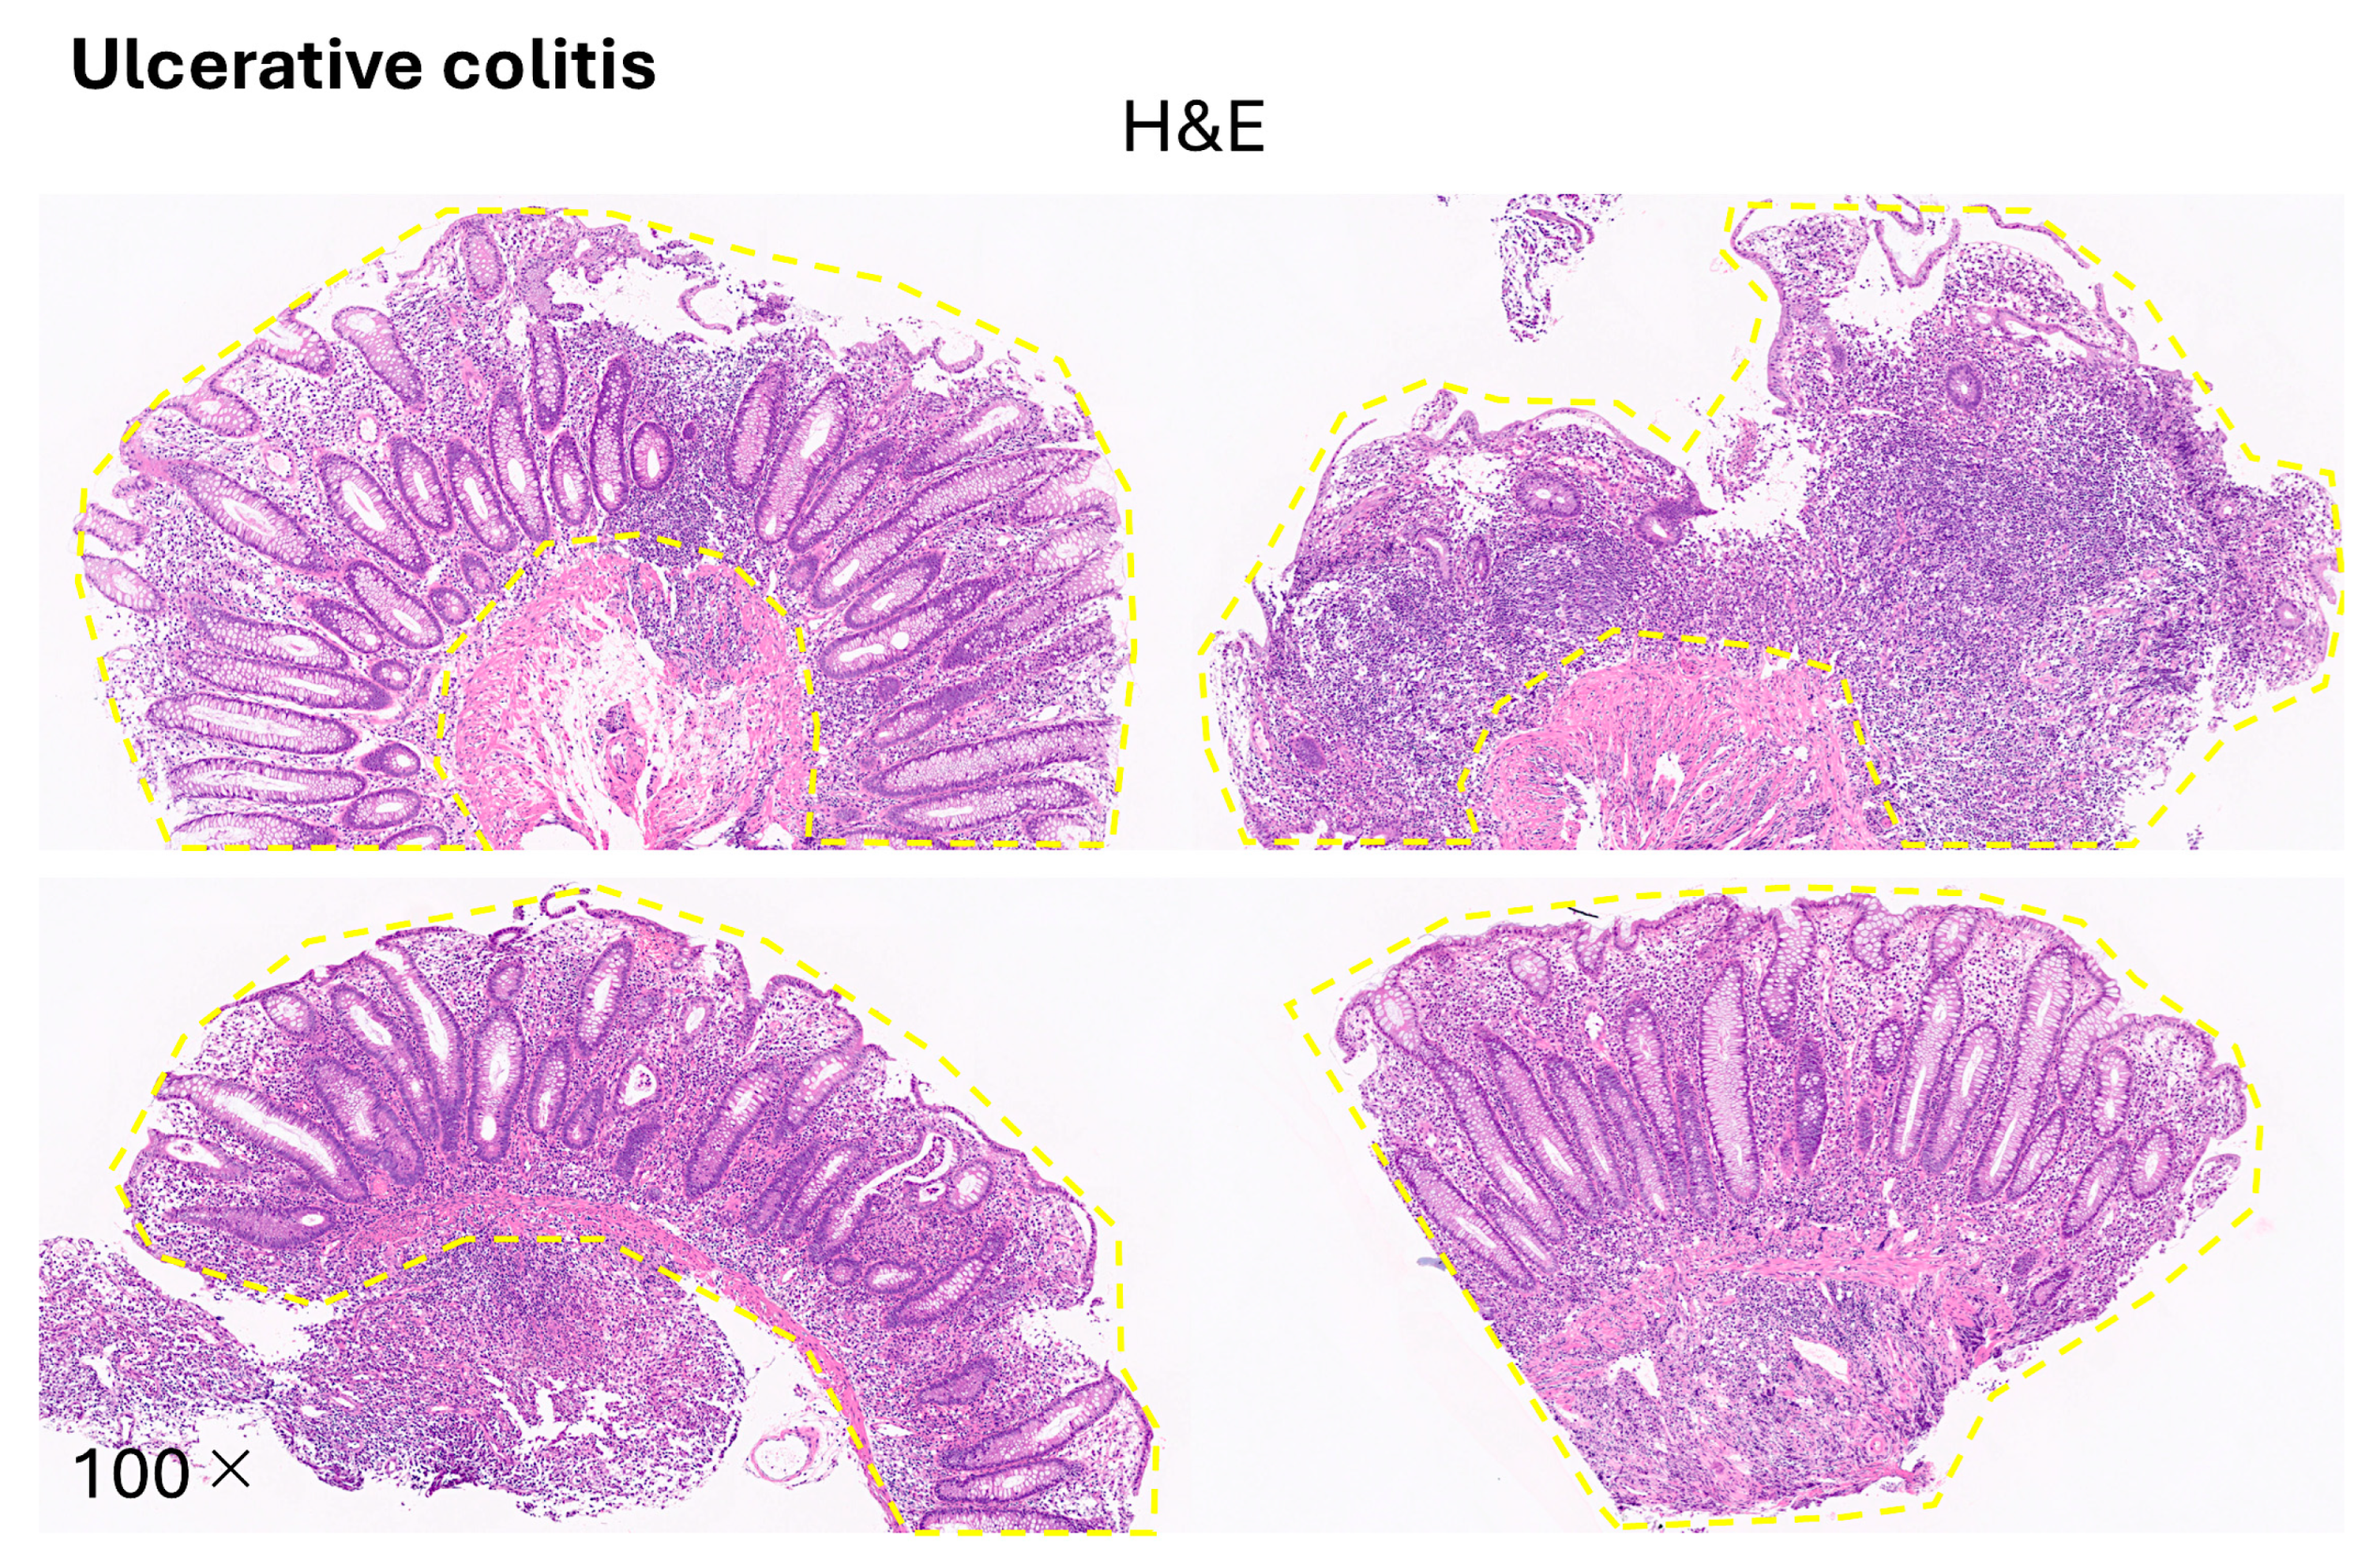
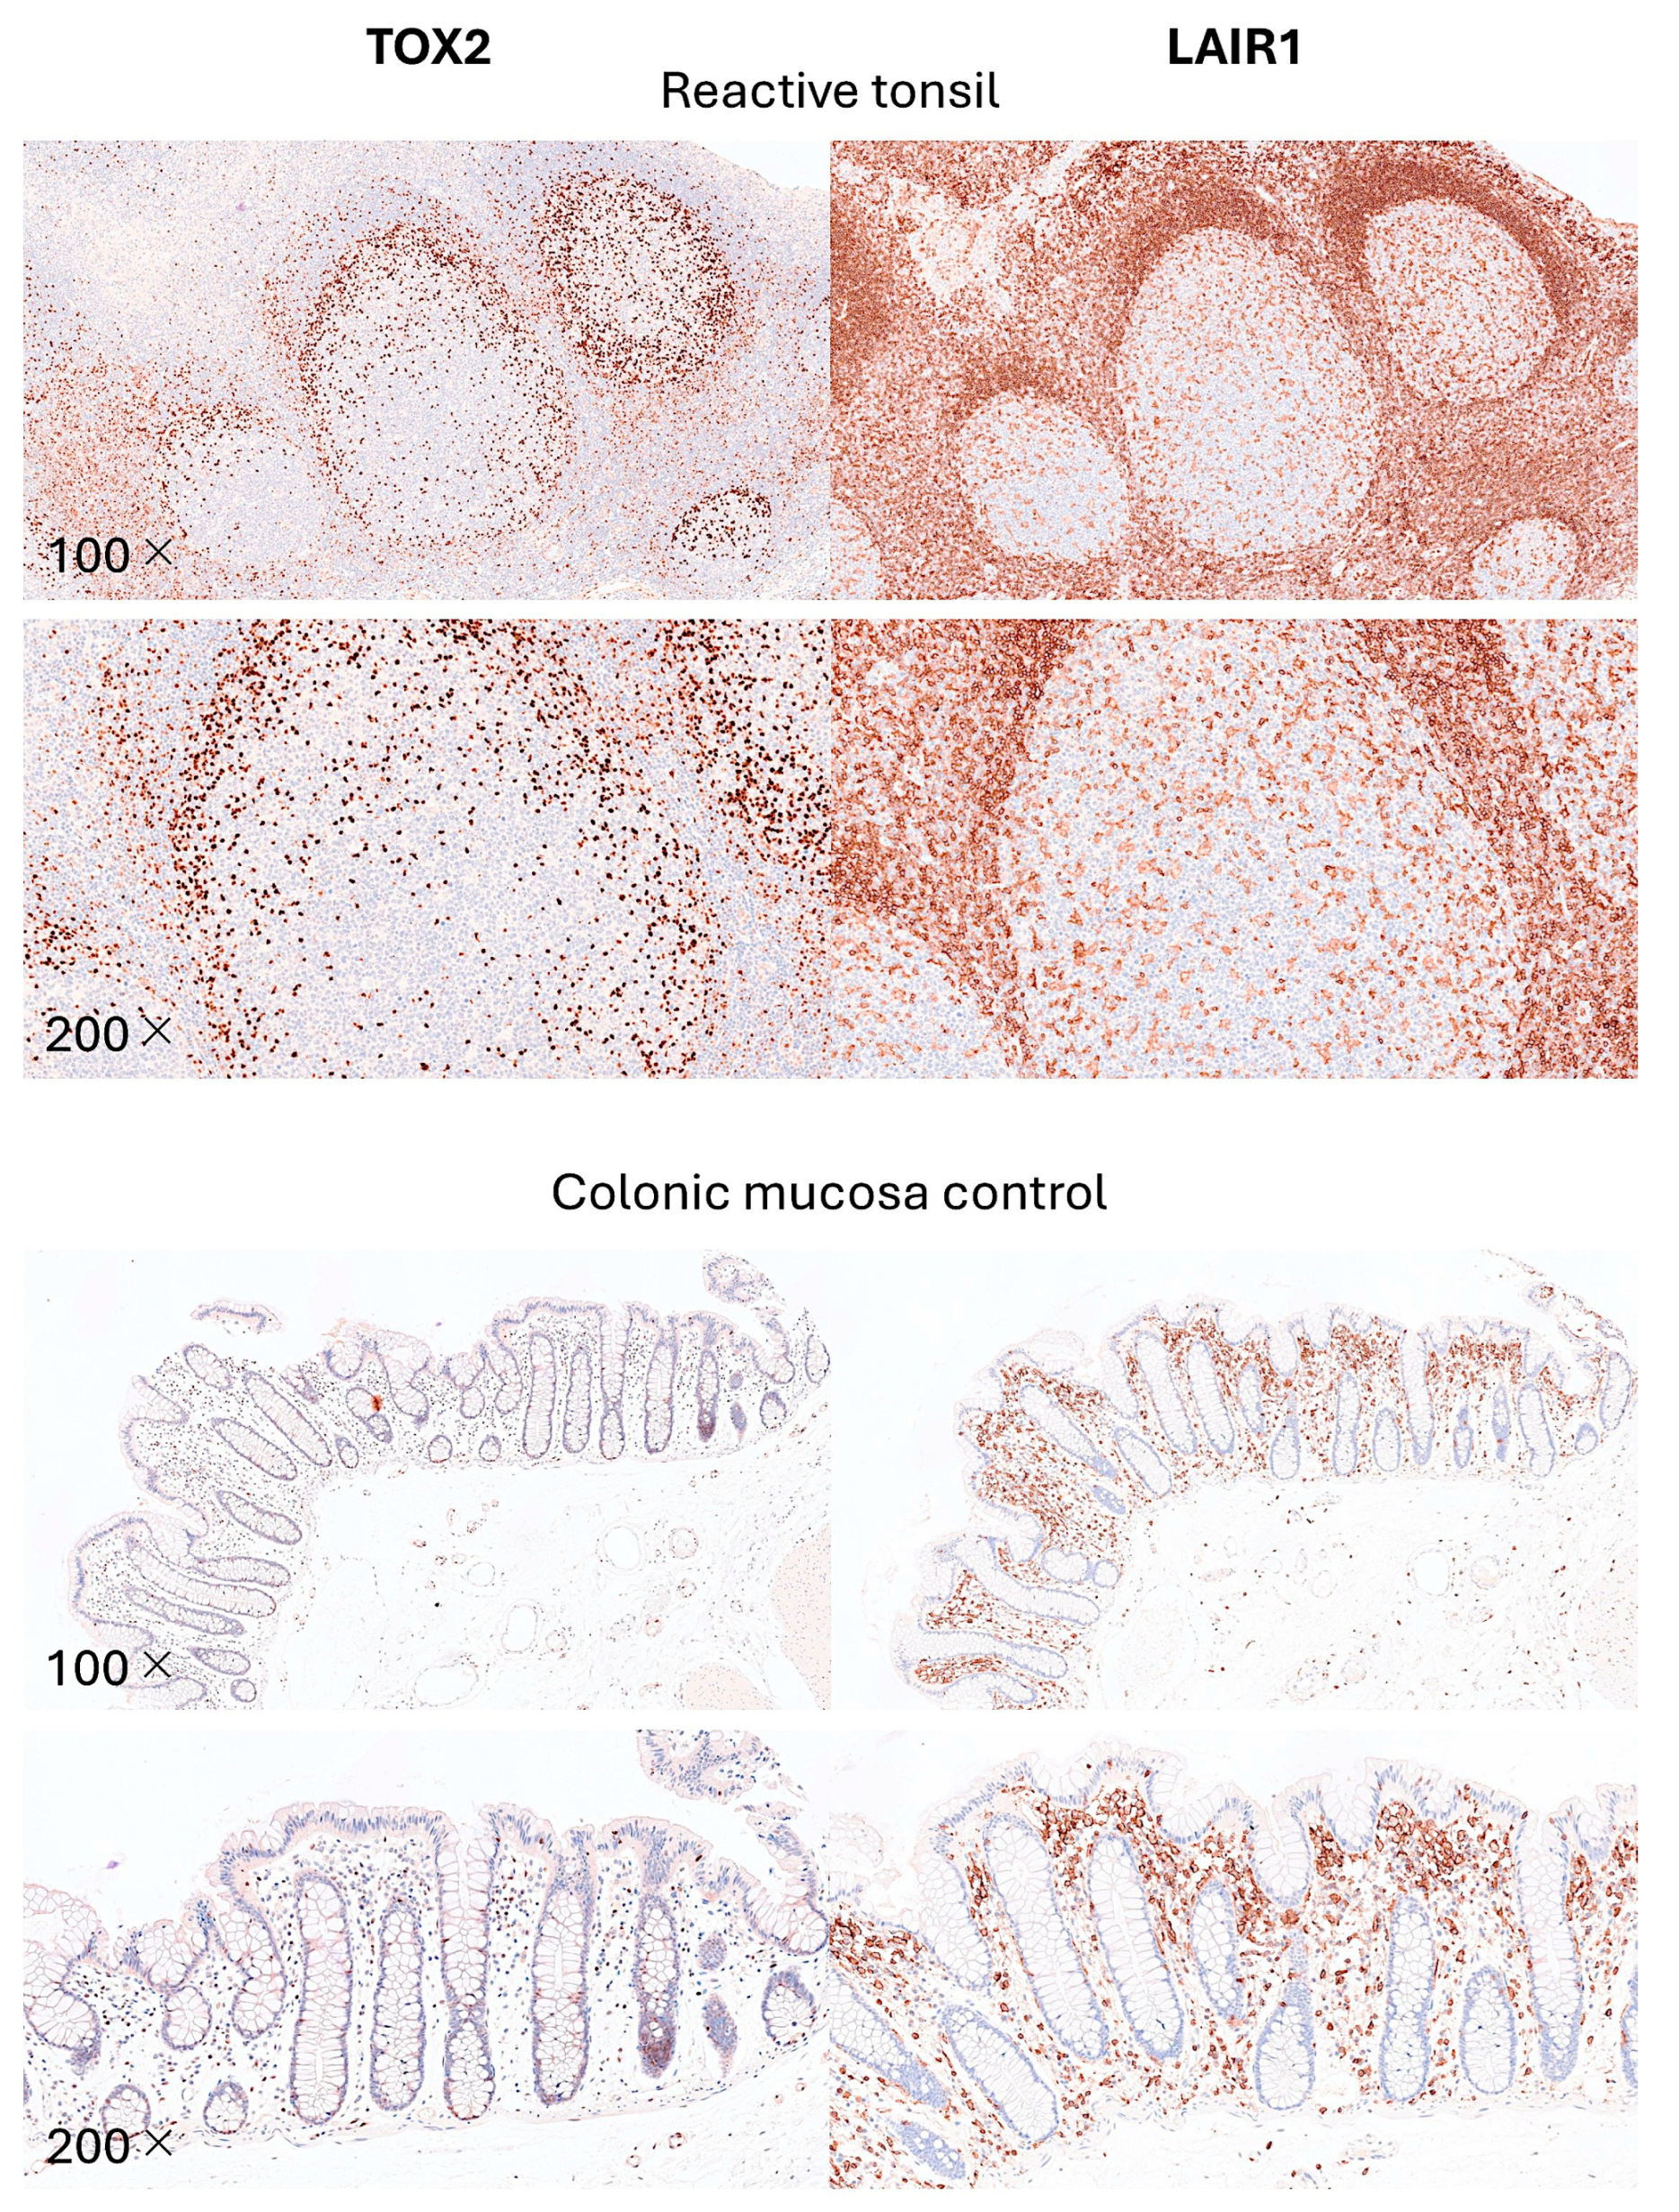
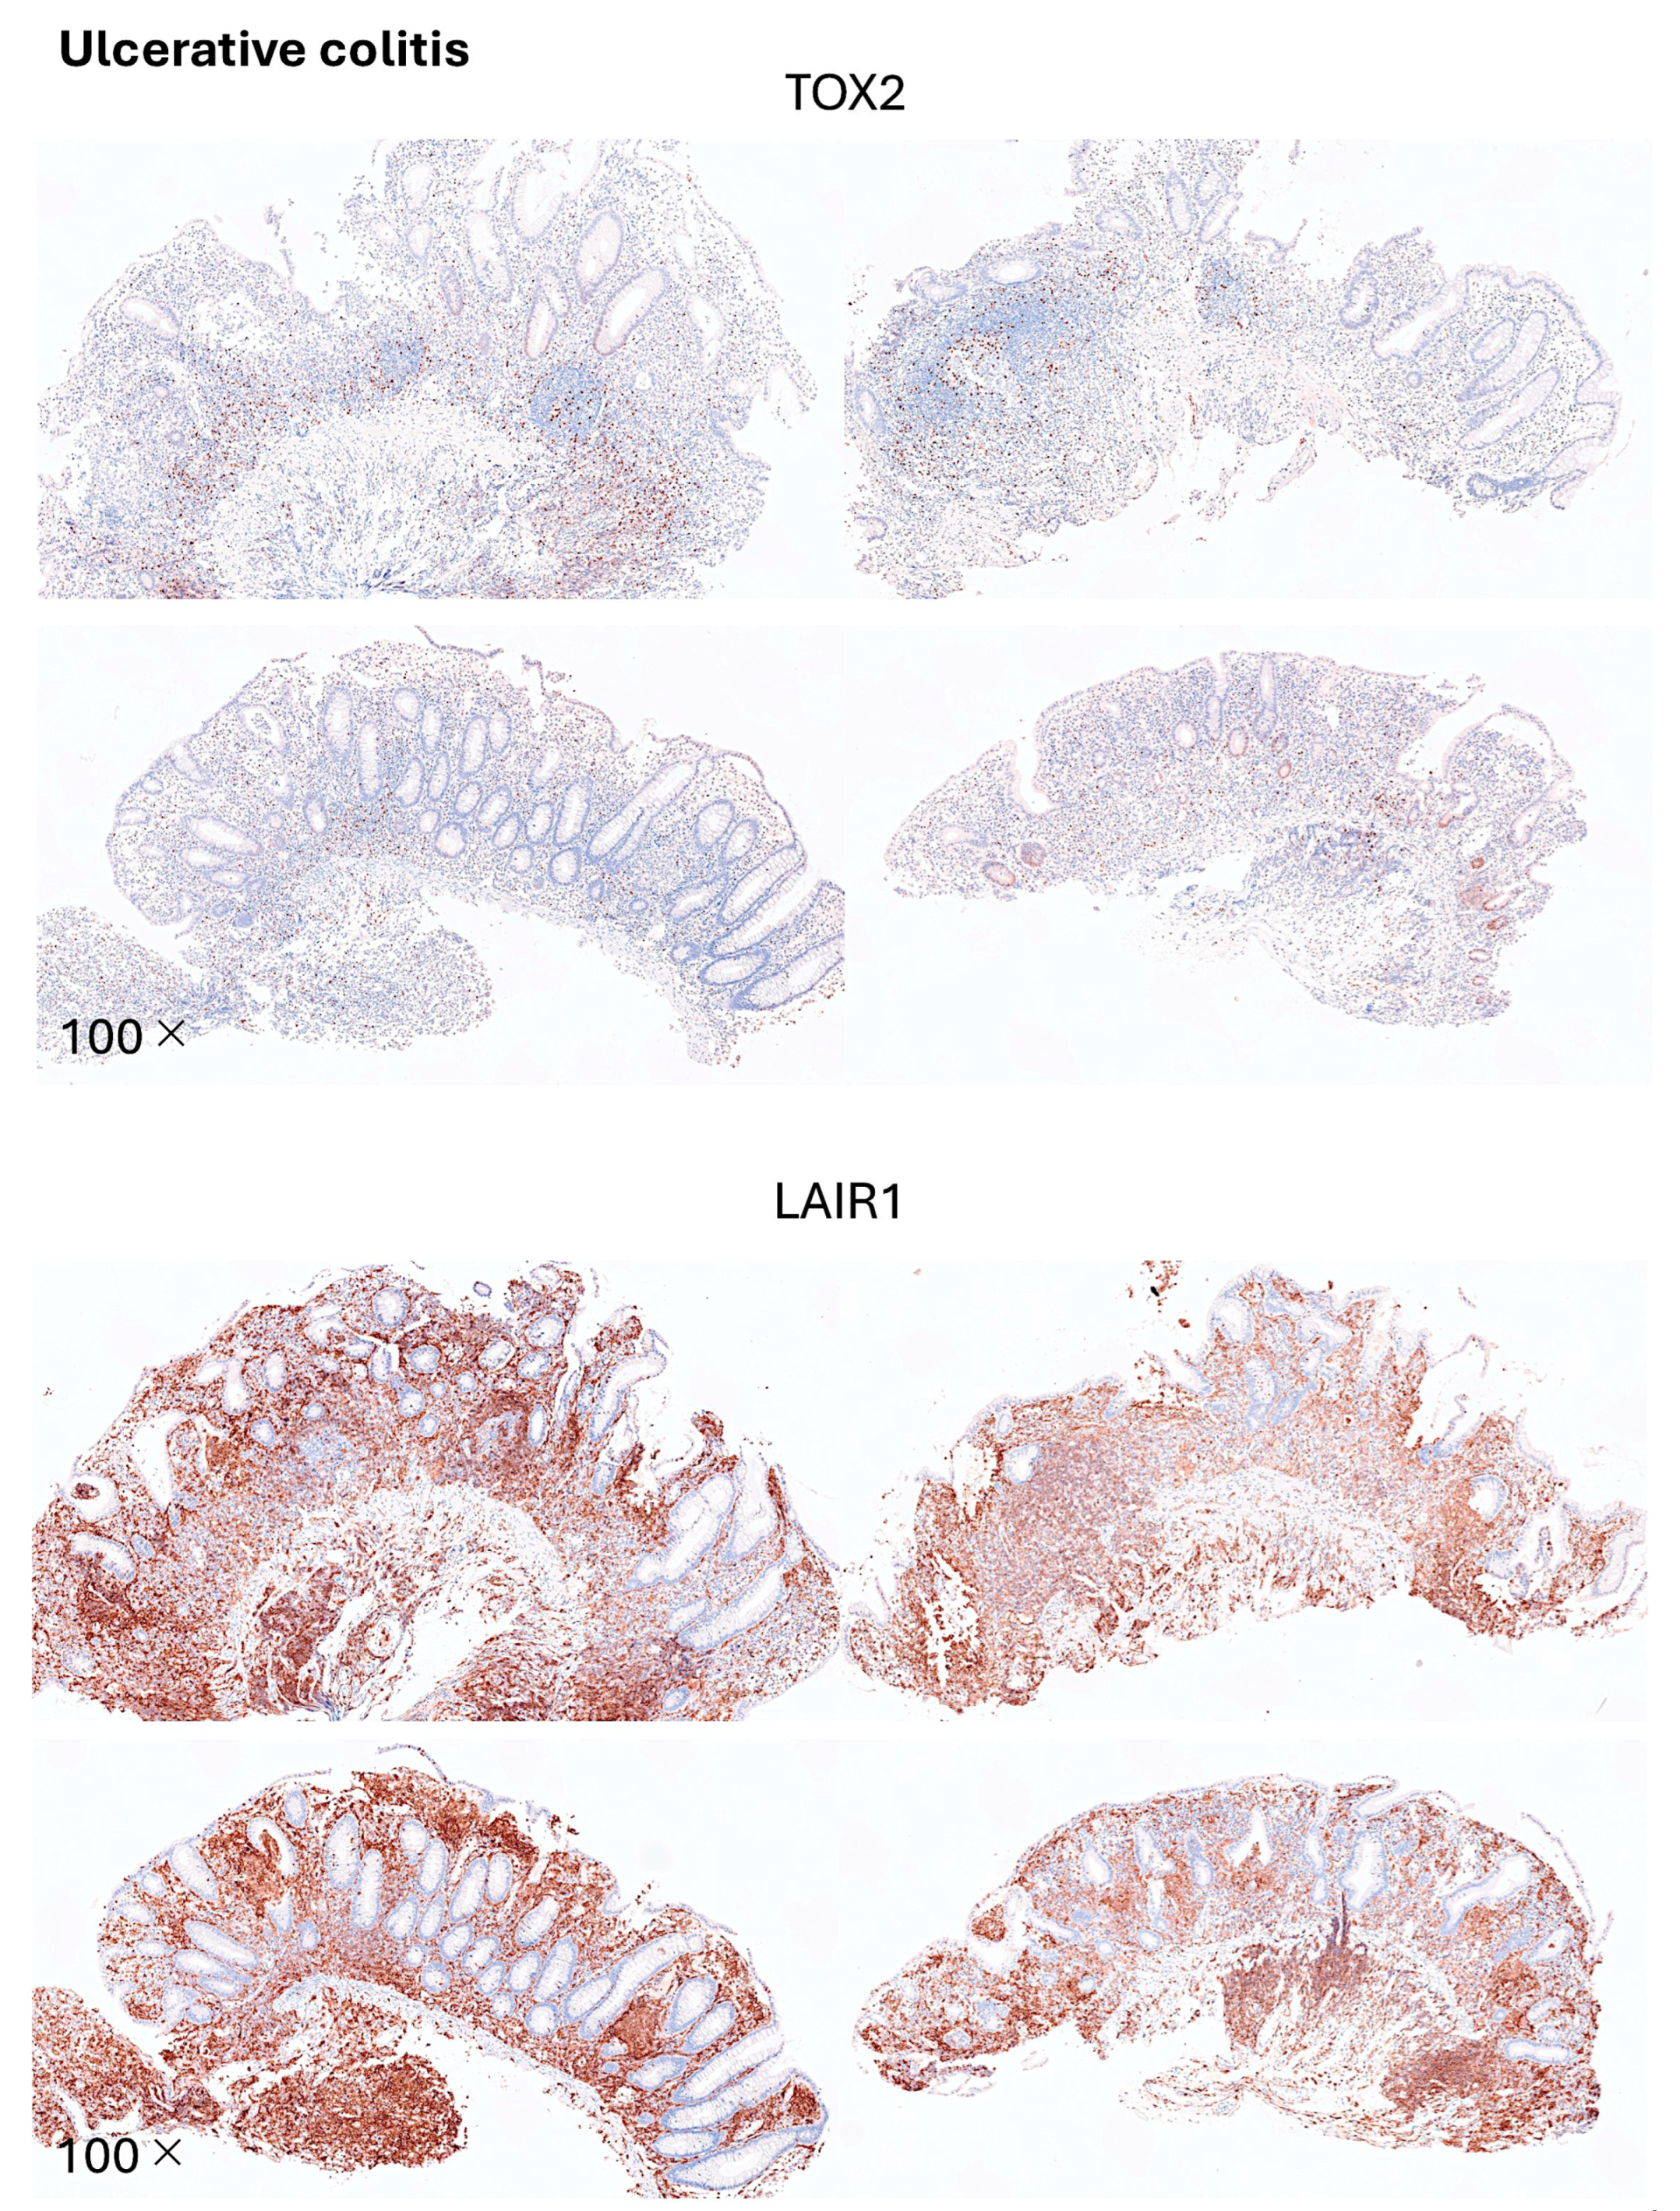
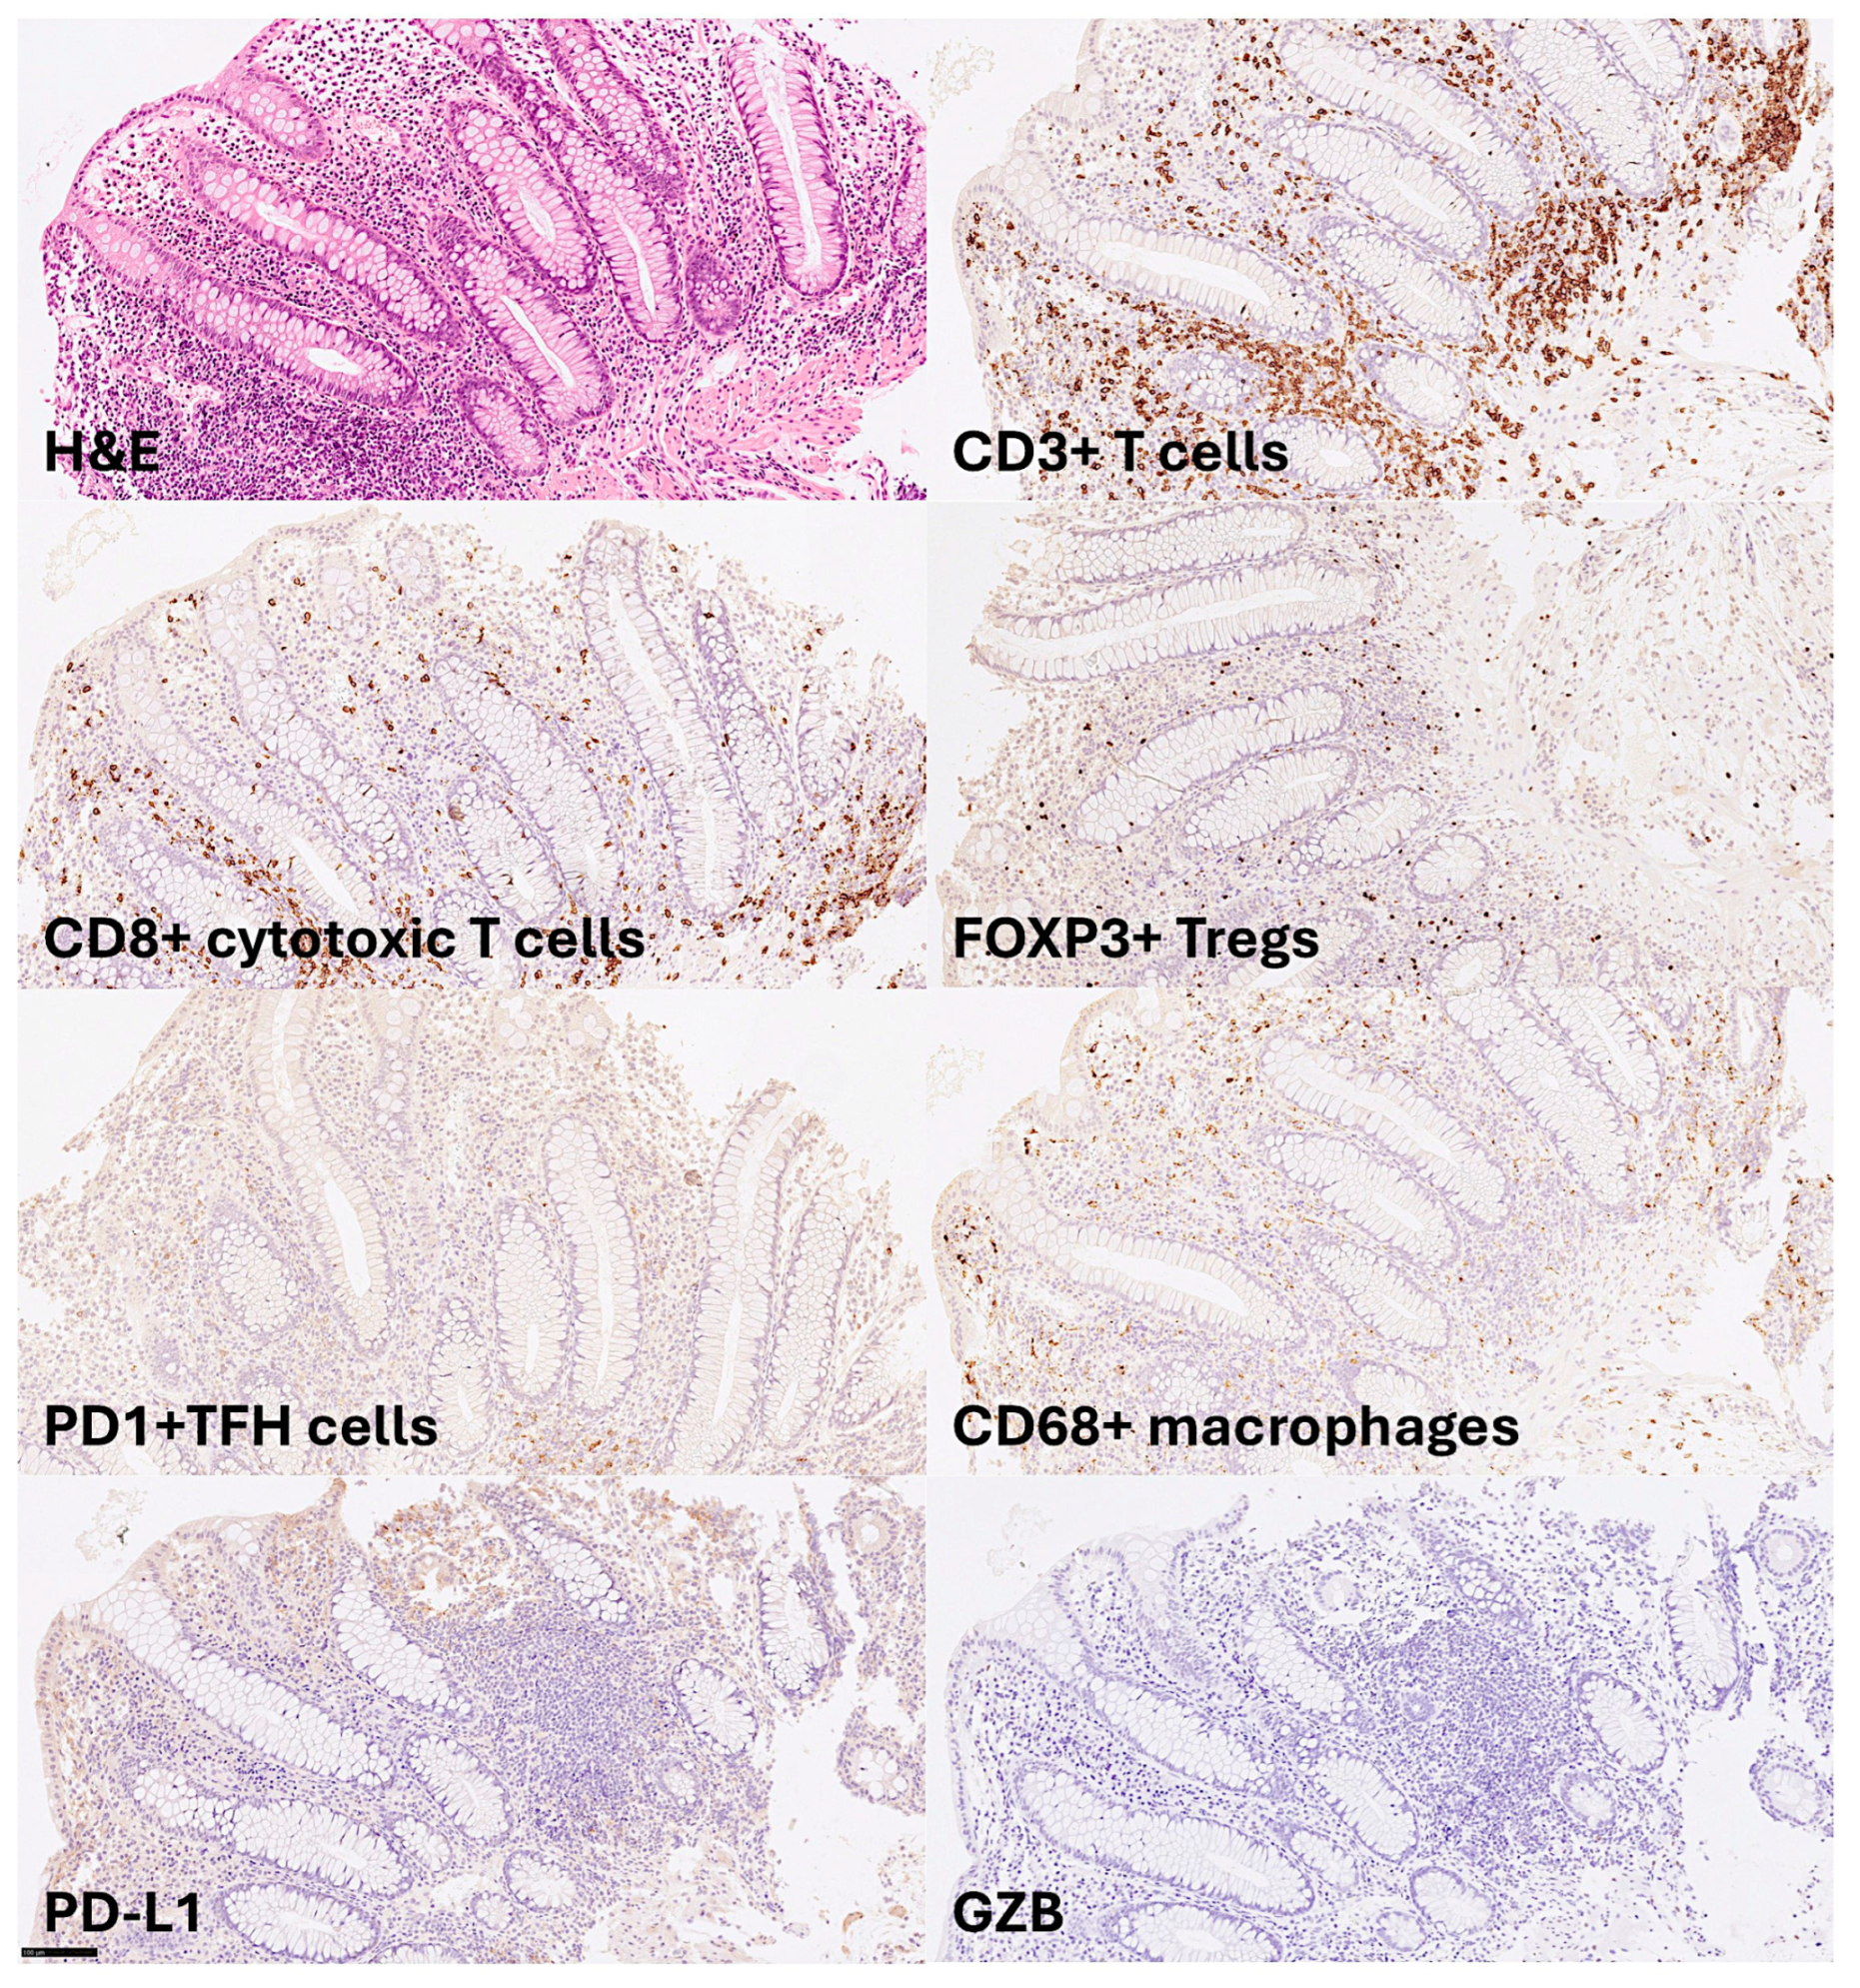
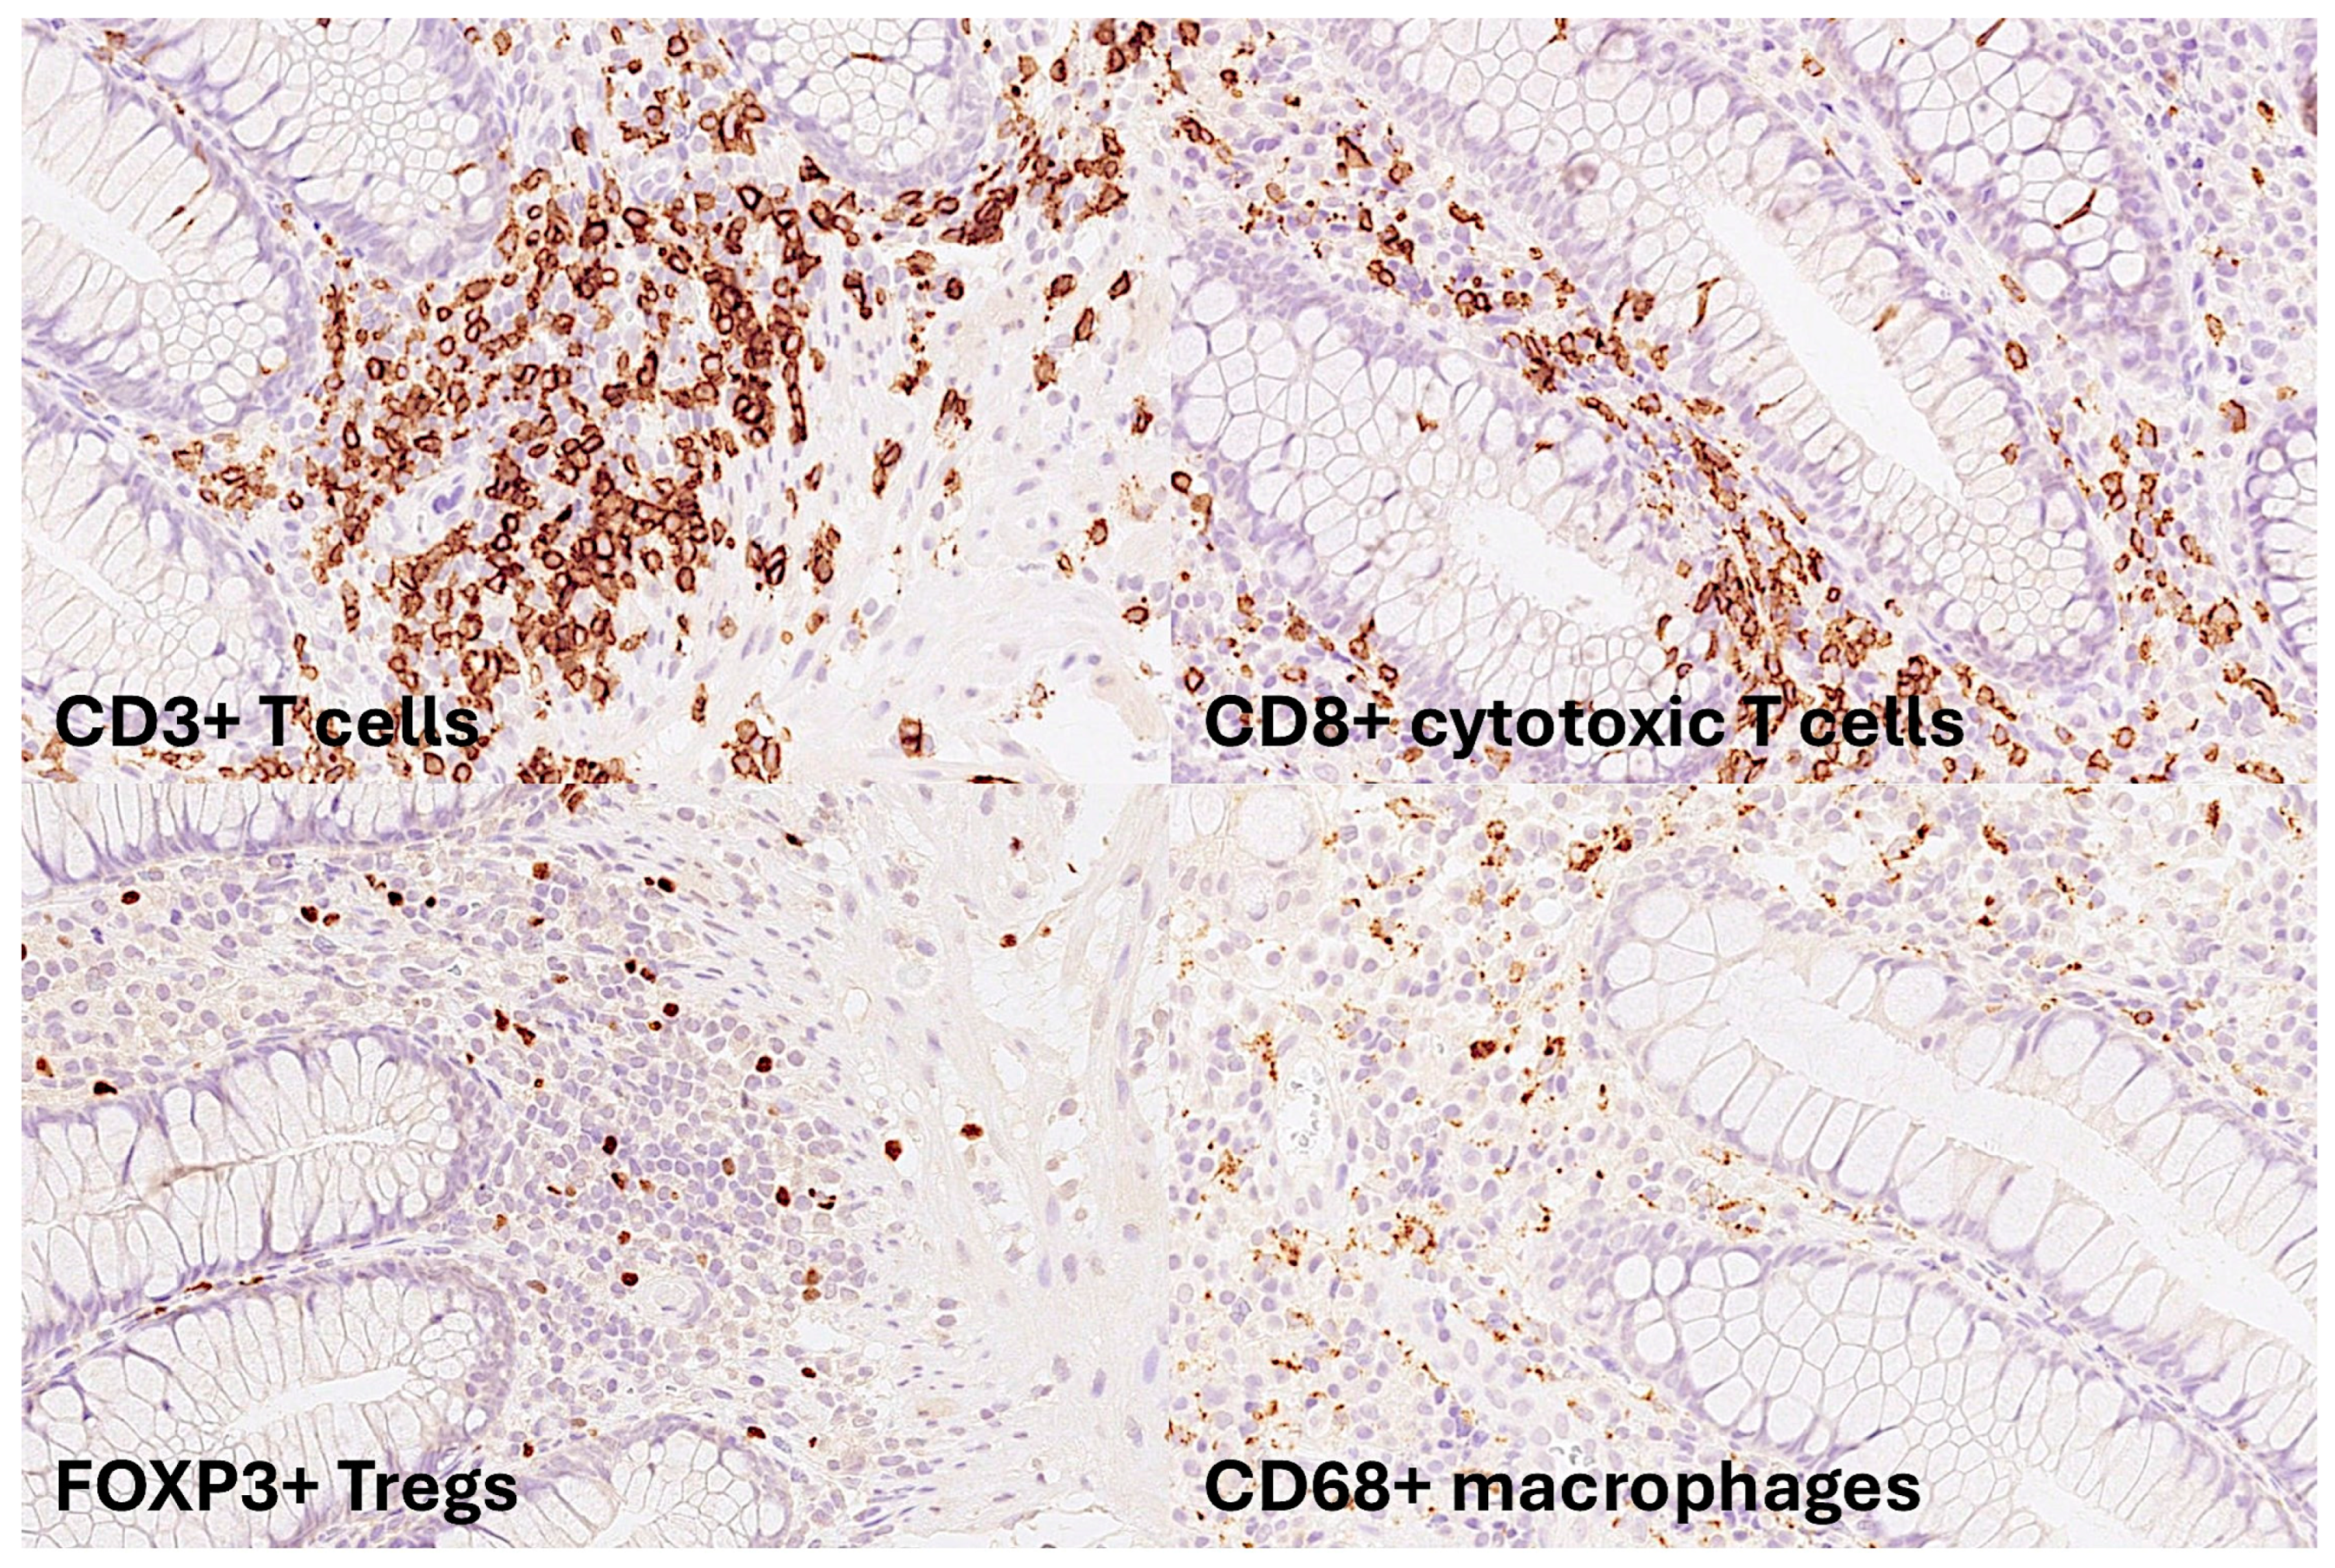
Inflammatory bowel disease (IBD) is a chronic inflammatory condition of the gastrointestinal tract characterized by the deregulation of immuno-oncology markers. IBD includes ulcerative colitis and Chron disease. Chronic active inflammation is a risk factor for the development of colorectal cancer (CRC). Deep learning is a form of machine learning that is applicable to computer vision, and it includes algorithms and workflows used for image processing, analysis, visualization, and algorithm development. This publication of Data Descriptor type, describes a dataset of histological images of ulcerative colitis, colorectal cancer (adenocarcinoma), and colon control. The samples were stained with hematoxylin and eosin (H&E), and immunohistochemically analyzed for LAIR1 and TOX2 markers. The methods used for collecting and producing the data, analysis using convolutional neural networks (CNNs), where the dataset can be found, and information about its use are also described.
Keywords:
1. Summary
1.1. Background of Ulcerative Colitis
1.2. Background of Colorectal Cancer
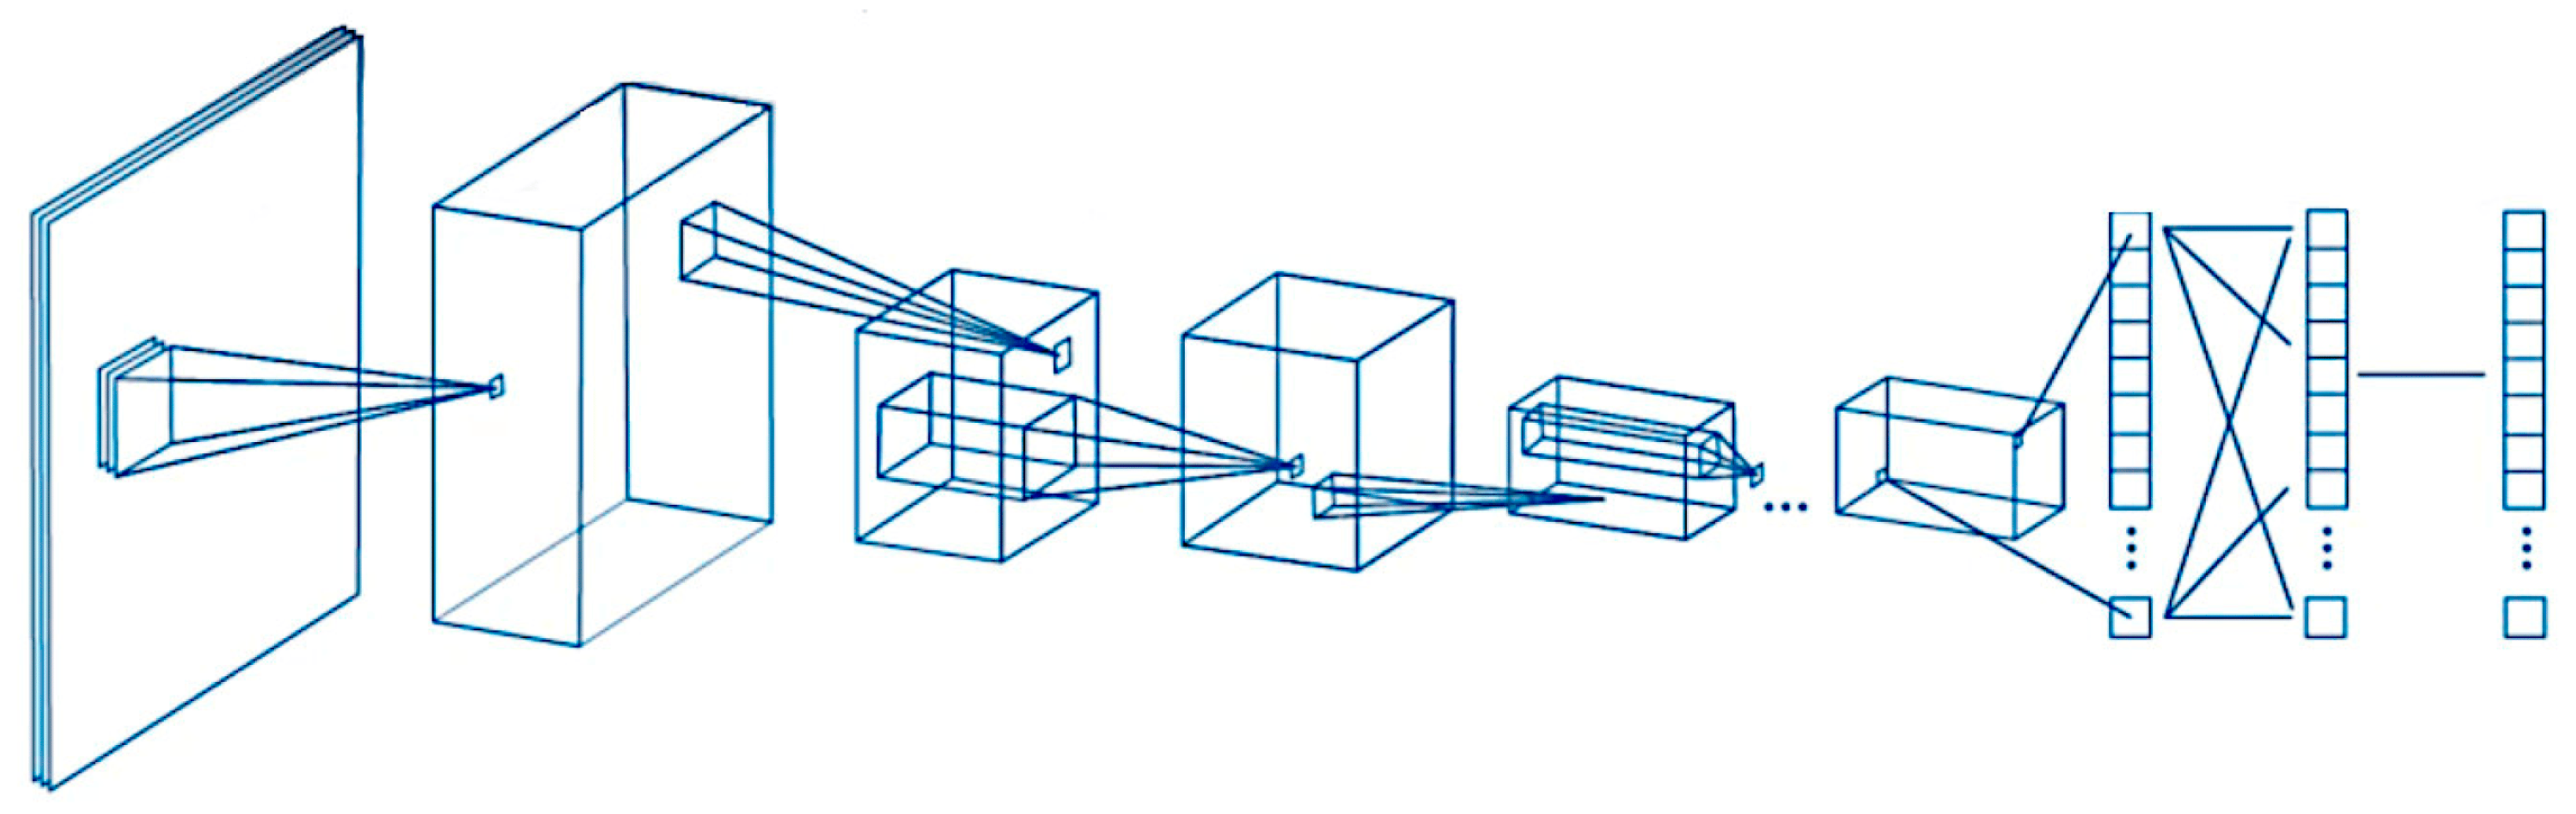
1.3. Background of Computer Vision for Deep Learning Image Classification
1.4. Dataset and Research Project Description
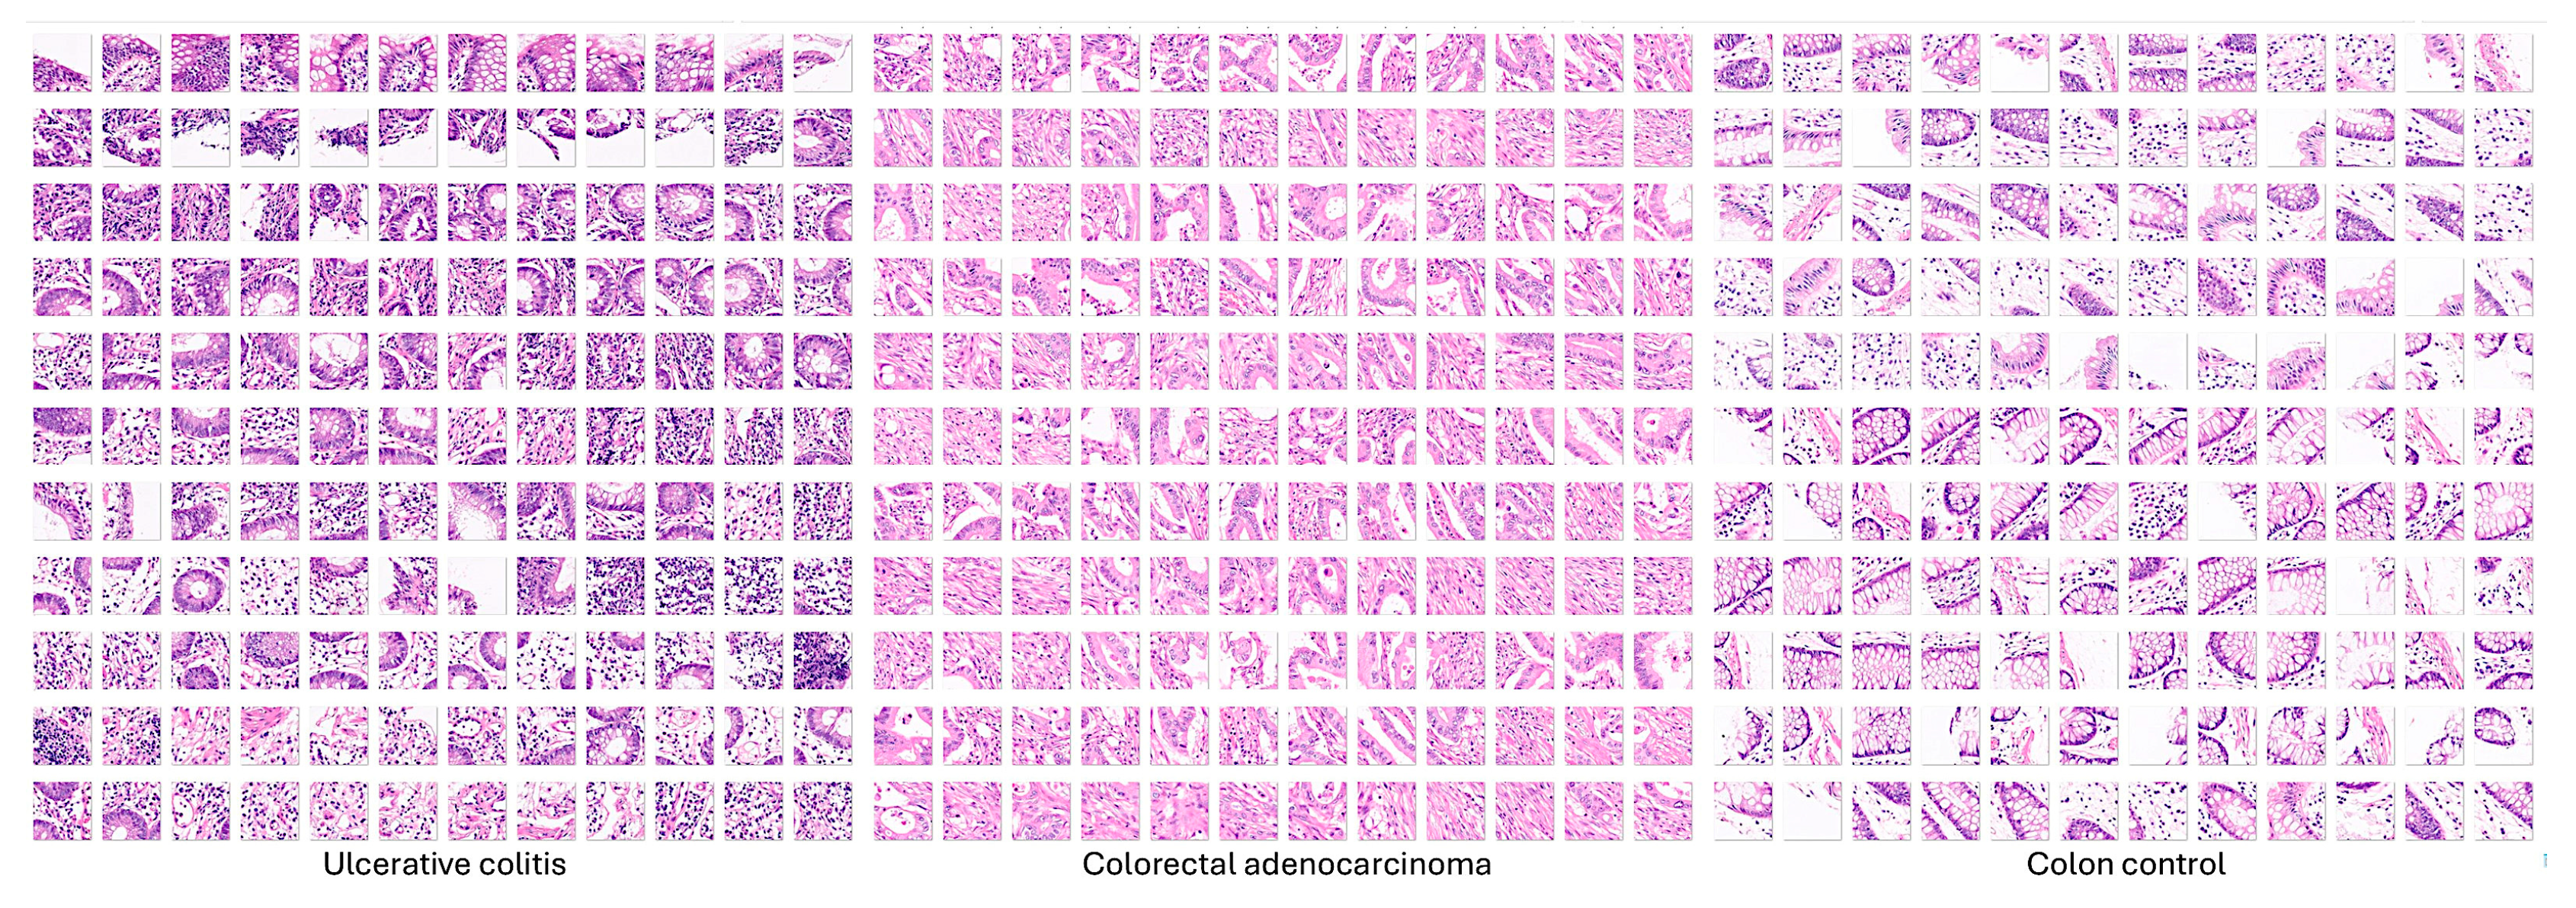
2. Data Description
3. Methods
3.1. Hematoxylin and Eosin (H&E) Staining
3.2. Score Evaluation
3.2. Immunohistochemistry
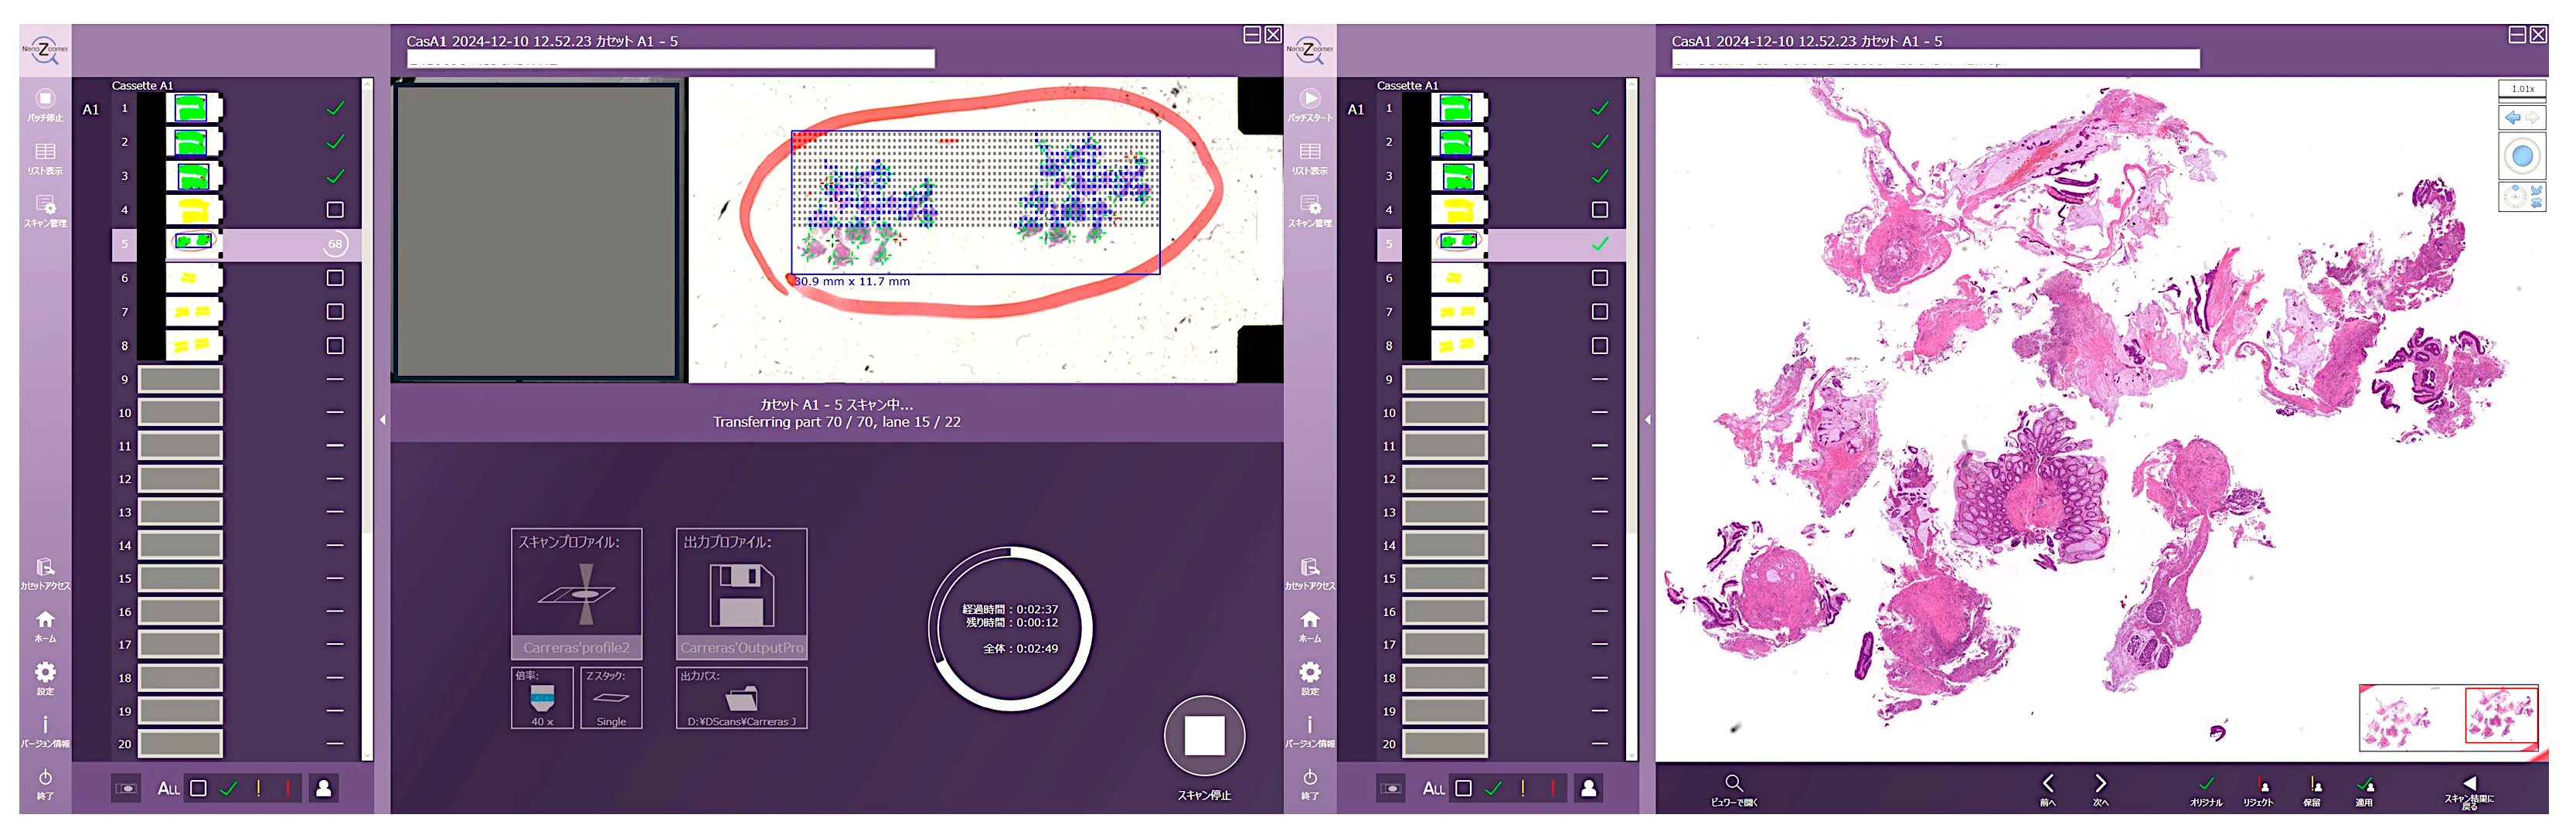
3.3. Whole-Slide Imaging
3.4. Digital Image Quantification
3.5. Image Classification Using CNNs
3.6. Computational Requirements
Supplementary Materials
Author Contributions
Funding
Institutional Review Board Statement
Informed Consent Statement
Data Availability Statement
Conflicts of Interest
Appendix A

| 0 | Normal: matte mucosa, ramifying vascular pattern clearly visible, no spontaneous bleeding, no bleeding to light touch. |
| 1 | Abnormal, but non-hemorrhagic: appearance between 0 and 2. |
| 2 | Moderately hemorrhagic: bleeding to light touch, but no spontaneous bleeding ahead of the instrument on initial inspection |
| 3 | Severely hemorrhagic: spontaneous bleeding ahead of instrument at initial inspection and bleeding to light touch |
| Grade 0 | Structural (architectural changes) |
| Subgrades | |
| 0 | No abnormality |
| 0.1 | Mild abnormality |
| 0.2 | Mild or moderate diffuse or multifocal abnormalities |
| 0.3 | Severe diffuse or multifocal abnormalities |
| Grade 1 | Chronic inflammatory infiltrate |
| Subgrades | |
| 1 | No increase |
| 1.1 | Mild but unequivocal increase |
| 1.2 | Moderate increase |
| 1.3 | Marked increase |
| Grade 2 | Lamina propria neutrophils and eosinophils |
| 2A Eosinophils | |
| 2A.0 | No increase |
| 2A.1 | Mild but unequivocal increase |
| 2A.2 | Moderate increase |
| 2A.3 | Marked increase |
| 2B Neutrophils | |
| 2B.0 | No increase |
| 2B.1 | Mild but unequivocal increase |
| 2B.2 | Moderate increase |
| 2B.3 | Marked increase |
| Grade 3 | Neutrophils in epithelium |
| Subgrades | |
| 3.0 | None |
| 3.1 | < 5% Crypts involves |
| 3.2 | < 50% Crypts involves |
| 3.3 | > 50% Crypts involves |
| Grade 4 | Crypt destruction |
| Subgrades | |
| 4.0 | None |
| 4.1 | Probable — local excess of neutrophils in part of crypt |
| 4.2 | Probable — marked attenuation |
| 4.3 | Unequivocal crypt destruction |
| Grade 5 | Erosion or ulceration |
| Subgrades | |
| 5.0 | No erosion, ulceration, or granulation tissue |
| 5.1 | Recovering epithelium + adjacent inflammation |
| 5.2 | Probable erosion focally stripped |
| 5.3 | Unequivocal erosion |
| 5.4 | Ulcer or granulation tissue |
| Data normalization was applied to the input images: imageInputLayer (an image input layer inputs 2-D images to a neural network and applies data normalization), and batchNormalizationLayer (a batch normalization layer normalizes a mini-batch of data across all observations for each channel independently. To speed up training of the convolutional neural network and reduce the sensitivity to network initialization, batch normalization layers are used between convolutional layers and nonlinearities, such as ReLU layers. Layer = batchNormalizationLayer (Name, Value) creates a batch normalization layer and sets the optional TrainedMean, TrainedVariance, Epsilon, Parameters and Initialization, Learning Rate and Regularization, and Name properties using one or more name-value pairs. After normalization, the layer scales the input with a learnable scale factor γ and shifts it by a learnable offset β) [80,81] |
|
Ⓐ To load training setup data: trainingSetup = load("…”) Ⓑ Import data: imdsTrain = trainingSetup.imdsTrain; imdsValidation = trainingSetup.imdsValidation; Ⓒ Resize the images to match the network input layer: augimdsTrain = augmentedImageDatastore([224 224 3],imdsTrain); augimdsValidation = augmentedImageDatastore([224 224 3],imdsValidation); Ⓓ Set training options: opts = trainingOptions("sgdm",... "ExecutionEnvironment","auto",... "InitialLearnRate",0.001,... "MaxEpochs",5,... "Shuffle","every-epoch",... "Plots","training-progress",... "ValidationData",augimdsValidation); Ⓔ Create layer graph: lgraph = layerGraph(); Ⓕ Add layer branches: tempLayers = [ imageInputLayer([224 224 3],"Name","data","Normalization","zscore","Mean",trainingSetup.data.Mean,"StandardDeviation",trainingSetup.data.StandardDeviation) convolution2dLayer([7 7],64,"Name","conv1","BiasLearnRateFactor",0,"Padding",[3 3 3 3],"Stride",[2 2],"Bias",trainingSetup.conv1.Bias,"Weights",trainingSetup.conv1.Weights) batchNormalizationLayer("Name","bn_conv1","Offset",trainingSetup.bn_conv1.Offset,"Scale",trainingSetup.bn_conv1.Scale,"TrainedMean",trainingSetup.bn_conv1.TrainedMean,"TrainedVariance",trainingSetup.bn_conv1.TrainedVariance) reluLayer("Name","conv1_relu") maxPooling2dLayer([3 3],"Name","pool1","Padding",[1 1 1 1],"Stride",[2 2])]; lgraph = addLayers(lgraph,tempLayers); tempLayers = [ convolution2dLayer([3 3],64,"Name","res2a_branch2a","BiasLearnRateFactor",0,"Padding",[1 1 1 1],"Bias",trainingSetup.res2a_branch2a.Bias,"Weights",trainingSetup.res2a_branch2a.Weights) batchNormalizationLayer("Name","bn2a_branch2a","Offset",trainingSetup.bn2a_branch2a.Offset,"Scale",trainingSetup.bn2a_branch2a.Scale,"TrainedMean",trainingSetup.bn2a_branch2a.TrainedMean,"TrainedVariance",trainingSetup.bn2a_branch2a.TrainedVariance) reluLayer("Name","res2a_branch2a_relu") convolution2dLayer([3 3],64,"Name","res2a_branch2b","BiasLearnRateFactor",0,"Padding",[1 1 1 1],"Bias",trainingSetup.res2a_branch2b.Bias,"Weights",trainingSetup.res2a_branch2b.Weights) batchNormalizationLayer("Name","bn2a_branch2b","Offset",trainingSetup.bn2a_branch2b.Offset,"Scale",trainingSetup.bn2a_branch2b.Scale,"TrainedMean",trainingSetup.bn2a_branch2b.TrainedMean,"TrainedVariance",trainingSetup.bn2a_branch2b.TrainedVariance)]; lgraph = addLayers(lgraph,tempLayers); tempLayers = [ additionLayer(2,"Name","res2a") reluLayer("Name","res2a_relu")]; lgraph = addLayers(lgraph,tempLayers); tempLayers = [ convolution2dLayer([3 3],64,"Name","res2b_branch2a","BiasLearnRateFactor",0,"Padding",[1 1 1 1],"Bias",trainingSetup.res2b_branch2a.Bias,"Weights",trainingSetup.res2b_branch2a.Weights) batchNormalizationLayer("Name","bn2b_branch2a","Offset",trainingSetup.bn2b_branch2a.Offset,"Scale",trainingSetup.bn2b_branch2a.Scale,"TrainedMean",trainingSetup.bn2b_branch2a.TrainedMean,"TrainedVariance",trainingSetup.bn2b_branch2a.TrainedVariance) reluLayer("Name","res2b_branch2a_relu") convolution2dLayer([3 3],64,"Name","res2b_branch2b","BiasLearnRateFactor",0,"Padding",[1 1 1 1],"Bias",trainingSetup.res2b_branch2b.Bias,"Weights",trainingSetup.res2b_branch2b.Weights) batchNormalizationLayer("Name","bn2b_branch2b","Offset",trainingSetup.bn2b_branch2b.Offset,"Scale",trainingSetup.bn2b_branch2b.Scale,"TrainedMean",trainingSetup.bn2b_branch2b.TrainedMean,"TrainedVariance",trainingSetup.bn2b_branch2b.TrainedVariance)]; lgraph = addLayers(lgraph,tempLayers); tempLayers = [ additionLayer(2,"Name","res2b") reluLayer("Name","res2b_relu")]; lgraph = addLayers(lgraph,tempLayers); tempLayers = [ convolution2dLayer([3 3],128,"Name","res3a_branch2a","BiasLearnRateFactor",0,"Padding",[1 1 1 1],"Stride",[2 2],"Bias",trainingSetup.res3a_branch2a.Bias,"Weights",trainingSetup.res3a_branch2a.Weights) batchNormalizationLayer("Name","bn3a_branch2a","Offset",trainingSetup.bn3a_branch2a.Offset,"Scale",trainingSetup.bn3a_branch2a.Scale,"TrainedMean",trainingSetup.bn3a_branch2a.TrainedMean,"TrainedVariance",trainingSetup.bn3a_branch2a.TrainedVariance) reluLayer("Name","res3a_branch2a_relu") convolution2dLayer([3 3],128,"Name","res3a_branch2b","BiasLearnRateFactor",0,"Padding",[1 1 1 1],"Bias",trainingSetup.res3a_branch2b.Bias,"Weights",trainingSetup.res3a_branch2b.Weights) batchNormalizationLayer("Name","bn3a_branch2b","Offset",trainingSetup.bn3a_branch2b.Offset,"Scale",trainingSetup.bn3a_branch2b.Scale,"TrainedMean",trainingSetup.bn3a_branch2b.TrainedMean,"TrainedVariance",trainingSetup.bn3a_branch2b.TrainedVariance)]; lgraph = addLayers(lgraph,tempLayers); tempLayers = [ convolution2dLayer([1 1],128,"Name","res3a_branch1","BiasLearnRateFactor",0,"Stride",[2 2],"Bias",trainingSetup.res3a_branch1.Bias,"Weights",trainingSetup.res3a_branch1.Weights) batchNormalizationLayer("Name","bn3a_branch1","Offset",trainingSetup.bn3a_branch1.Offset,"Scale",trainingSetup.bn3a_branch1.Scale,"TrainedMean",trainingSetup.bn3a_branch1.TrainedMean,"TrainedVariance",trainingSetup.bn3a_branch1.TrainedVariance)]; lgraph = addLayers(lgraph,tempLayers); tempLayers = [ additionLayer(2,"Name","res3a") reluLayer("Name","res3a_relu")]; lgraph = addLayers(lgraph,tempLayers); tempLayers = [ convolution2dLayer([3 3],128,"Name","res3b_branch2a","BiasLearnRateFactor",0,"Padding",[1 1 1 1],"Bias",trainingSetup.res3b_branch2a.Bias,"Weights",trainingSetup.res3b_branch2a.Weights) batchNormalizationLayer("Name","bn3b_branch2a","Offset",trainingSetup.bn3b_branch2a.Offset,"Scale",trainingSetup.bn3b_branch2a.Scale,"TrainedMean",trainingSetup.bn3b_branch2a.TrainedMean,"TrainedVariance",trainingSetup.bn3b_branch2a.TrainedVariance) reluLayer("Name","res3b_branch2a_relu") convolution2dLayer([3 3],128,"Name","res3b_branch2b","BiasLearnRateFactor",0,"Padding",[1 1 1 1],"Bias",trainingSetup.res3b_branch2b.Bias,"Weights",trainingSetup.res3b_branch2b.Weights) batchNormalizationLayer("Name","bn3b_branch2b","Offset",trainingSetup.bn3b_branch2b.Offset,"Scale",trainingSetup.bn3b_branch2b.Scale,"TrainedMean",trainingSetup.bn3b_branch2b.TrainedMean,"TrainedVariance",trainingSetup.bn3b_branch2b.TrainedVariance)]; lgraph = addLayers(lgraph,tempLayers); tempLayers = [ additionLayer(2,"Name","res3b") reluLayer("Name","res3b_relu")]; lgraph = addLayers(lgraph,tempLayers); tempLayers = [ convolution2dLayer([3 3],256,"Name","res4a_branch2a","BiasLearnRateFactor",0,"Padding",[1 1 1 1],"Stride",[2 2],"Bias",trainingSetup.res4a_branch2a.Bias,"Weights",trainingSetup.res4a_branch2a.Weights) batchNormalizationLayer("Name","bn4a_branch2a","Offset",trainingSetup.bn4a_branch2a.Offset,"Scale",trainingSetup.bn4a_branch2a.Scale,"TrainedMean",trainingSetup.bn4a_branch2a.TrainedMean,"TrainedVariance",trainingSetup.bn4a_branch2a.TrainedVariance) reluLayer("Name","res4a_branch2a_relu") convolution2dLayer([3 3],256,"Name","res4a_branch2b","BiasLearnRateFactor",0,"Padding",[1 1 1 1],"Bias",trainingSetup.res4a_branch2b.Bias,"Weights",trainingSetup.res4a_branch2b.Weights) batchNormalizationLayer("Name","bn4a_branch2b","Offset",trainingSetup.bn4a_branch2b.Offset,"Scale",trainingSetup.bn4a_branch2b.Scale,"TrainedMean",trainingSetup.bn4a_branch2b.TrainedMean,"TrainedVariance",trainingSetup.bn4a_branch2b.TrainedVariance)]; lgraph = addLayers(lgraph,tempLayers); tempLayers = [ convolution2dLayer([1 1],256,"Name","res4a_branch1","BiasLearnRateFactor",0,"Stride",[2 2],"Bias",trainingSetup.res4a_branch1.Bias,"Weights",trainingSetup.res4a_branch1.Weights) batchNormalizationLayer("Name","bn4a_branch1","Offset",trainingSetup.bn4a_branch1.Offset,"Scale",trainingSetup.bn4a_branch1.Scale,"TrainedMean",trainingSetup.bn4a_branch1.TrainedMean,"TrainedVariance",trainingSetup.bn4a_branch1.TrainedVariance)]; lgraph = addLayers(lgraph,tempLayers); tempLayers = [ additionLayer(2,"Name","res4a") reluLayer("Name","res4a_relu")]; lgraph = addLayers(lgraph,tempLayers); tempLayers = [ convolution2dLayer([3 3],256,"Name","res4b_branch2a","BiasLearnRateFactor",0,"Padding",[1 1 1 1],"Bias",trainingSetup.res4b_branch2a.Bias,"Weights",trainingSetup.res4b_branch2a.Weights) batchNormalizationLayer("Name","bn4b_branch2a","Offset",trainingSetup.bn4b_branch2a.Offset,"Scale",trainingSetup.bn4b_branch2a.Scale,"TrainedMean",trainingSetup.bn4b_branch2a.TrainedMean,"TrainedVariance",trainingSetup.bn4b_branch2a.TrainedVariance) reluLayer("Name","res4b_branch2a_relu") convolution2dLayer([3 3],256,"Name","res4b_branch2b","BiasLearnRateFactor",0,"Padding",[1 1 1 1],"Bias",trainingSetup.res4b_branch2b.Bias,"Weights",trainingSetup.res4b_branch2b.Weights) batchNormalizationLayer("Name","bn4b_branch2b","Offset",trainingSetup.bn4b_branch2b.Offset,"Scale",trainingSetup.bn4b_branch2b.Scale,"TrainedMean",trainingSetup.bn4b_branch2b.TrainedMean,"TrainedVariance",trainingSetup.bn4b_branch2b.TrainedVariance)]; lgraph = addLayers(lgraph,tempLayers); tempLayers = [ additionLayer(2,"Name","res4b") reluLayer("Name","res4b_relu")]; lgraph = addLayers(lgraph,tempLayers); tempLayers = [ convolution2dLayer([3 3],512,"Name","res5a_branch2a","BiasLearnRateFactor",0,"Padding",[1 1 1 1],"Stride",[2 2],"Bias",trainingSetup.res5a_branch2a.Bias,"Weights",trainingSetup.res5a_branch2a.Weights) batchNormalizationLayer("Name","bn5a_branch2a","Offset",trainingSetup.bn5a_branch2a.Offset,"Scale",trainingSetup.bn5a_branch2a.Scale,"TrainedMean",trainingSetup.bn5a_branch2a.TrainedMean,"TrainedVariance",trainingSetup.bn5a_branch2a.TrainedVariance) reluLayer("Name","res5a_branch2a_relu") convolution2dLayer([3 3],512,"Name","res5a_branch2b","BiasLearnRateFactor",0,"Padding",[1 1 1 1],"Bias",trainingSetup.res5a_branch2b.Bias,"Weights",trainingSetup.res5a_branch2b.Weights) batchNormalizationLayer("Name","bn5a_branch2b","Offset",trainingSetup.bn5a_branch2b.Offset,"Scale",trainingSetup.bn5a_branch2b.Scale,"TrainedMean",trainingSetup.bn5a_branch2b.TrainedMean,"TrainedVariance",trainingSetup.bn5a_branch2b.TrainedVariance)]; lgraph = addLayers(lgraph,tempLayers); tempLayers = [ convolution2dLayer([1 1],512,"Name","res5a_branch1","BiasLearnRateFactor",0,"Stride",[2 2],"Bias",trainingSetup.res5a_branch1.Bias,"Weights",trainingSetup.res5a_branch1.Weights) batchNormalizationLayer("Name","bn5a_branch1","Offset",trainingSetup.bn5a_branch1.Offset,"Scale",trainingSetup.bn5a_branch1.Scale,"TrainedMean",trainingSetup.bn5a_branch1.TrainedMean,"TrainedVariance",trainingSetup.bn5a_branch1.TrainedVariance)]; lgraph = addLayers(lgraph,tempLayers); tempLayers = [ additionLayer(2,"Name","res5a") reluLayer("Name","res5a_relu")]; lgraph = addLayers(lgraph,tempLayers); tempLayers = [ convolution2dLayer([3 3],512,"Name","res5b_branch2a","BiasLearnRateFactor",0,"Padding",[1 1 1 1],"Bias",trainingSetup.res5b_branch2a.Bias,"Weights",trainingSetup.res5b_branch2a.Weights) batchNormalizationLayer("Name","bn5b_branch2a","Offset",trainingSetup.bn5b_branch2a.Offset,"Scale",trainingSetup.bn5b_branch2a.Scale,"TrainedMean",trainingSetup.bn5b_branch2a.TrainedMean,"TrainedVariance",trainingSetup.bn5b_branch2a.TrainedVariance) reluLayer("Name","res5b_branch2a_relu") convolution2dLayer([3 3],512,"Name","res5b_branch2b","BiasLearnRateFactor",0,"Padding",[1 1 1 1],"Bias",trainingSetup.res5b_branch2b.Bias,"Weights",trainingSetup.res5b_branch2b.Weights) batchNormalizationLayer("Name","bn5b_branch2b","Offset",trainingSetup.bn5b_branch2b.Offset,"Scale",trainingSetup.bn5b_branch2b.Scale,"TrainedMean",trainingSetup.bn5b_branch2b.TrainedMean,"TrainedVariance",trainingSetup.bn5b_branch2b.TrainedVariance)]; lgraph = addLayers(lgraph,tempLayers); tempLayers = [ additionLayer(2,"Name","res5b") reluLayer("Name","res5b_relu") globalAveragePooling2dLayer("Name","pool5") fullyConnectedLayer(3,"Name","fc") softmaxLayer("Name","prob") classificationLayer("Name","classoutput")]; lgraph = addLayers(lgraph,tempLayers); Ⓖ Clean up helper variable: clear tempLayers; Ⓗ Connect layer branches: lgraph = connectLayers(lgraph,"pool1","res2a_branch2a"); lgraph = connectLayers(lgraph,"pool1","res2a/in2"); lgraph = connectLayers(lgraph,"bn2a_branch2b","res2a/in1"); lgraph = connectLayers(lgraph,"res2a_relu","res2b_branch2a"); lgraph = connectLayers(lgraph,"res2a_relu","res2b/in2"); lgraph = connectLayers(lgraph,"bn2b_branch2b","res2b/in1"); lgraph = connectLayers(lgraph,"res2b_relu","res3a_branch2a"); lgraph = connectLayers(lgraph,"res2b_relu","res3a_branch1"); lgraph = connectLayers(lgraph,"bn3a_branch2b","res3a/in1"); lgraph = connectLayers(lgraph,"bn3a_branch1","res3a/in2"); lgraph = connectLayers(lgraph,"res3a_relu","res3b_branch2a"); lgraph = connectLayers(lgraph,"res3a_relu","res3b/in2"); lgraph = connectLayers(lgraph,"bn3b_branch2b","res3b/in1"); lgraph = connectLayers(lgraph,"res3b_relu","res4a_branch2a"); lgraph = connectLayers(lgraph,"res3b_relu","res4a_branch1"); lgraph = connectLayers(lgraph,"bn4a_branch2b","res4a/in1"); lgraph = connectLayers(lgraph,"bn4a_branch1","res4a/in2"); lgraph = connectLayers(lgraph,"res4a_relu","res4b_branch2a"); lgraph = connectLayers(lgraph,"res4a_relu","res4b/in2"); lgraph = connectLayers(lgraph,"bn4b_branch2b","res4b/in1"); lgraph = connectLayers(lgraph,"res4b_relu","res5a_branch2a"); lgraph = connectLayers(lgraph,"res4b_relu","res5a_branch1"); lgraph = connectLayers(lgraph,"bn5a_branch2b","res5a/in1"); lgraph = connectLayers(lgraph,"bn5a_branch1","res5a/in2"); lgraph = connectLayers(lgraph,"res5a_relu","res5b_branch2a"); lgraph = connectLayers(lgraph,"res5a_relu","res5b/in2"); lgraph = connectLayers(lgraph,"bn5b_branch2b","res5b/in1"); Ⓘ Train network: [net, traininfo] = trainNetwork(augimdsTrain,lgraph,opts); |
References
- Hodson, R. Inflammatory bowel disease. Nature 2016, 540, S97. [CrossRef]
- Sairenji, T.; Collins, K.L.; Evans, D.V. An Update on Inflammatory Bowel Disease. Prim Care 2017, 44, 673-692. [CrossRef]
- Bruner, L.P.; White, A.M.; Proksell, S. Inflammatory Bowel Disease. Prim Care 2023, 50, 411-427. [CrossRef]
- Din, S.; Wong, K.; Mueller, M.F.; Oniscu, A.; Hewinson, J.; Black, C.J.; Miller, M.L.; Jimenez-Sanchez, A.; Rabbie, R.; Rashid, M.; et al. Mutational Analysis Identifies Therapeutic Biomarkers in Inflammatory Bowel Disease-Associated Colorectal Cancers. Clin Cancer Res 2018, 24, 5133-5142. [CrossRef]
- Halliday, G.; Porter, R.J.; Black, C.J.; Arends, M.J.; Din, S. c-MET immunohistochemical expression in sporadic and inflammatory bowel disease associated lesions. World J Gastroenterol 2022, 28, 1338-1346. [CrossRef]
- Hemmer, A.; Forest, K.; Rath, J.; Bowman, J. Inflammatory Bowel Disease: A Concise Review. S D Med 2023, 76, 416-423.
- Khor, B.; Gardet, A.; Xavier, R.J. Genetics and pathogenesis of inflammatory bowel disease. Nature 2011, 474, 307-317. [CrossRef]
- Porter, R.J.; Arends, M.J.; Churchhouse, A.M.D.; Din, S. Inflammatory Bowel Disease-Associated Colorectal Cancer: Translational Risks from Mechanisms to Medicines. J Crohns Colitis 2021, 15, 2131-2141. [CrossRef]
- Zhang, Y.Z.; Li, Y.Y. Inflammatory bowel disease: pathogenesis. World J Gastroenterol 2014, 20, 91-99. [CrossRef]
- Singh, N.; Bernstein, C.N. Environmental risk factors for inflammatory bowel disease. United European Gastroenterol J 2022, 10, 1047-1053. [CrossRef]
- Qiu, P.; Ishimoto, T.; Fu, L.; Zhang, J.; Zhang, Z.; Liu, Y. The Gut Microbiota in Inflammatory Bowel Disease. Front Cell Infect Microbiol 2022, 12, 733992. [CrossRef]
- Jarmakiewicz-Czaja, S.; Zielinska, M.; Sokal, A.; Filip, R. Genetic and Epigenetic Etiology of Inflammatory Bowel Disease: An Update. Genes (Basel) 2022, 13. [CrossRef]
- Graham, D.B.; Xavier, R.J. Pathway paradigms revealed from the genetics of inflammatory bowel disease. Nature 2020, 578, 527-539. [CrossRef]
- Saez, A.; Gomez-Bris, R.; Herrero-Fernandez, B.; Mingorance, C.; Rius, C.; Gonzalez-Granado, J.M. Innate Lymphoid Cells in Intestinal Homeostasis and Inflammatory Bowel Disease. Int J Mol Sci 2021, 22. [CrossRef]
- Saez, A.; Herrero-Fernandez, B.; Gomez-Bris, R.; Sanchez-Martinez, H.; Gonzalez-Granado, J.M. Pathophysiology of Inflammatory Bowel Disease: Innate Immune System. Int J Mol Sci 2023, 24. [CrossRef]
- Lu, Q.; Yang, M.F.; Liang, Y.J.; Xu, J.; Xu, H.M.; Nie, Y.Q.; Wang, L.S.; Yao, J.; Li, D.F. Immunology of Inflammatory Bowel Disease: Molecular Mechanisms and Therapeutics. J Inflamm Res 2022, 15, 1825-1844. [CrossRef]
- Kaplan, G.G.; Windsor, J.W. The four epidemiological stages in the global evolution of inflammatory bowel disease. Nat Rev Gastroenterol Hepatol 2021, 18, 56-66. [CrossRef]
- Agrawal, M.; Jess, T. Implications of the changing epidemiology of inflammatory bowel disease in a changing world. United European Gastroenterol J 2022, 10, 1113-1120. [CrossRef]
- Narula, N.; Wong, E.C.L.; Dehghan, M.; Mente, A.; Rangarajan, S.; Lanas, F.; Lopez-Jaramillo, P.; Rohatgi, P.; Lakshmi, P.V.M.; Varma, R.P.; et al. Association of ultra-processed food intake with risk of inflammatory bowel disease: prospective cohort study. BMJ 2021, 374, n1554. [CrossRef]
- Burisch, J.; Zhao, M.; Odes, S.; De Cruz, P.; Vermeire, S.; Bernstein, C.N.; Kaplan, G.G.; Duricova, D.; Greenberg, D.; Melberg, H.O.; et al. The cost of inflammatory bowel disease in high-income settings: a Lancet Gastroenterology & Hepatology Commission. Lancet Gastroenterol Hepatol 2023, 8, 458-492. [CrossRef]
- Buie, M.J.; Quan, J.; Windsor, J.W.; Coward, S.; Hansen, T.M.; King, J.A.; Kotze, P.G.; Gearry, R.B.; Ng, S.C.; Mak, J.W.Y.; et al. Global Hospitalization Trends for Crohn's Disease and Ulcerative Colitis in the 21st Century: A Systematic Review With Temporal Analyses. Clin Gastroenterol Hepatol 2023, 21, 2211-2221. [CrossRef]
- Wijnands, A.M.; Elias, S.G.; Dekker, E.; Fidder, H.H.; Hoentjen, F.; Ten Hove, J.R.; Maljaars, P.W.J.; van der Meulen-de Jong, A.E.; Mooiweer, E.; Ouwehand, R.J.; et al. Smoking and colorectal neoplasia in patients with inflammatory bowel disease: Dose-effect relationship. United European Gastroenterol J 2023, 11, 612-620. [CrossRef]
- Ham, N.S.; Hwang, S.W.; Oh, E.H.; Kim, J.; Lee, H.S.; Park, S.H.; Yang, D.H.; Ye, B.D.; Byeon, J.S.; Myung, S.J.; et al. Influence of Severe Vitamin D Deficiency on the Clinical Course of Inflammatory Bowel Disease. Dig Dis Sci 2021, 66, 587-596. [CrossRef]
- Mark A Peppercorn, Adam S Cheifetz. Definitions, epidemiology, and risk factors for inflammatory bowel disease. In: UpToDate, Sunanda V Kane (Ed), Wolters Kluwer. (Accessed on December 11, 2024.).
- Ungaro, R.; Mehandru, S.; Allen, P.B.; Peyrin-Biroulet, L.; Colombel, J.F. Ulcerative colitis. Lancet 2017, 389, 1756-1770. [CrossRef]
- Gomez-Bris, R.; Saez, A.; Herrero-Fernandez, B.; Rius, C.; Sanchez-Martinez, H.; Gonzalez-Granado, J.M. CD4 T-Cell Subsets and the Pathophysiology of Inflammatory Bowel Disease. Int J Mol Sci 2023, 24. [CrossRef]
- Cui, G.; Yuan, A.; Sorbye, S.W.; Florholmen, J. Th9 and Th17 Cells in Human Ulcerative Colitis-Associated Dysplastic Lesions. Clin Med Insights Oncol 2024, 18, 11795549241301358. [CrossRef]
- Gerlach, K.; Lechner, K.; Popp, V.; Offensperger, L.; Zundler, S.; Wiendl, M.; Becker, E.; Atreya, R.; Rath, T.; Neurath, M.F.; et al. The JAK1/3 inhibitor tofacitinib suppresses T cell homing and activation in chronic intestinal inflammation. J Crohns Colitis 2020. [CrossRef]
- Mitsialis, V.; Wall, S.; Liu, P.; Ordovas-Montanes, J.; Parmet, T.; Vukovic, M.; Spencer, D.; Field, M.; McCourt, C.; Toothaker, J.; et al. Single-Cell Analyses of Colon and Blood Reveal Distinct Immune Cell Signatures of Ulcerative Colitis and Crohn's Disease. Gastroenterology 2020, 159, 591-608 e510. [CrossRef]
- Shmuel-Galia, L.; Humphries, F.; Lei, X.; Ceglia, S.; Wilson, R.; Jiang, Z.; Ketelut-Carneiro, N.; Foley, S.E.; Pechhold, S.; Houghton, J.; et al. Dysbiosis exacerbates colitis by promoting ubiquitination and accumulation of the innate immune adaptor STING in myeloid cells. Immunity 2021, 54, 1137-1153 e1138. [CrossRef]
- DeGruttola, A.K.; Low, D.; Mizoguchi, A.; Mizoguchi, E. Current Understanding of Dysbiosis in Disease in Human and Animal Models. Inflamm Bowel Dis 2016, 22, 1137-1150. [CrossRef]
- Schroeder, K.W.; Tremaine, W.J.; Ilstrup, D.M. Coated oral 5-aminosalicylic acid therapy for mildly to moderately active ulcerative colitis. A randomized study. N Engl J Med 1987, 317, 1625-1629. [CrossRef]
- Silverberg, M.S.; Satsangi, J.; Ahmad, T.; Arnott, I.D.; Bernstein, C.N.; Brant, S.R.; Caprilli, R.; Colombel, J.F.; Gasche, C.; Geboes, K.; et al. Toward an integrated clinical, molecular and serological classification of inflammatory bowel disease: report of a Working Party of the 2005 Montreal World Congress of Gastroenterology. Can J Gastroenterol 2005, 19 Suppl A, 5A-36A. [CrossRef]
- Truelove, S.C.; Witts, L.J. Cortisone in ulcerative colitis; final report on a therapeutic trial. Br Med J 1955, 2, 1041-1048. [CrossRef]
- Geboes, K.; Riddell, R.; Ost, A.; Jensfelt, B.; Persson, T.; Lofberg, R. A reproducible grading scale for histological assessment of inflammation in ulcerative colitis. Gut 2000, 47, 404-409. [CrossRef]
- Fabian, O.; Kamaradova, K. Morphology of inflammatory bowel diseases (IBD). Cesk Patol 2022, 58, 27-37.
- Feakins, R.M. Ulcerative colitis or Crohn's disease? Pitfalls and problems. Histopathology 2014, 64, 317-335. [CrossRef]
- El-Zimaity, H.; Shaffer, S.R.; Riddell, R.H.; Pai, R.K.; Bernstein, C.N. Beyond Neutrophils for Predicting Relapse and Remission in Ulcerative Colitis. J Crohns Colitis 2023, 17, 767-776. [CrossRef]
- Gupta, R.B.; Harpaz, N.; Itzkowitz, S.; Hossain, S.; Matula, S.; Kornbluth, A.; Bodian, C.; Ullman, T. Histologic inflammation is a risk factor for progression to colorectal neoplasia in ulcerative colitis: a cohort study. Gastroenterology 2007, 133, 1099-1105; quiz 1340-1091. [CrossRef]
- Gros, B.; Kaplan, G.G. Ulcerative Colitis in Adults: A Review. JAMA 2023, 330, 951-965. [CrossRef]
- Russell D Cohen, Adam C Stein. Management of moderate to severe ulcerative colitis in adults. In: UpToDate, Sunanda V Kane (Ed), Wolters Kluwer. (Accessed on December, 2024.).
- Jana Al Hashash, Miguel Regueiro.Medical management of low-risk adult patients with mild to moderate ulcerative colitis. In: UpToDate, Kristen M Robson (Ed), Wolters Kluwer. (Accessed on December 11, 2024.).
- Le Berre, C.; Honap, S.; Peyrin-Biroulet, L. Ulcerative colitis. Lancet 2023, 402, 571-584. [CrossRef]
- Marshall, D.A.; MacDonald, K.V.; Kao, D.; Bernstein, C.N.; Kaplan, G.G.; Jijon, H.; Hazlewood, G.; Panaccione, R.; Nasser, Y.; Raman, M.; et al. Patient preferences for active ulcerative colitis treatments and fecal microbiota transplantation. Ther Adv Chronic Dis 2024, 15, 20406223241239168. [CrossRef]
- Global Cancer Observatory. International Agency for Research on Cancer. World Health Organization. Available at: https://gco.iarc.fr/ (Accessed on December 13, 2023). Available online: (accessed on.
- Finlay A Macrae. Epidemiology and risk factors for colorectal cancer. In: UpToDate, Richard M Goldberg, David Seres (Eds), Wolters Kluwer. (Accessed on December 12, 2024.).
- Baidoun, F.; Elshiwy, K.; Elkeraie, Y.; Merjaneh, Z.; Khoudari, G.; Sarmini, M.T.; Gad, M.; Al-Husseini, M.; Saad, A. Colorectal Cancer Epidemiology: Recent Trends and Impact on Outcomes. Curr Drug Targets 2021, 22, 998-1009. [CrossRef]
- Dekker, E.; Tanis, P.J.; Vleugels, J.L.A.; Kasi, P.M.; Wallace, M.B. Colorectal cancer. Lancet 2019, 394, 1467-1480. [CrossRef]
- Patel, S.G.; Karlitz, J.J.; Yen, T.; Lieu, C.H.; Boland, C.R. The rising tide of early-onset colorectal cancer: a comprehensive review of epidemiology, clinical features, biology, risk factors, prevention, and early detection. Lancet Gastroenterol Hepatol 2022, 7, 262-274. [CrossRef]
- Sullivan, B.A.; Noujaim, M.; Roper, J. Cause, Epidemiology, and Histology of Polyps and Pathways to Colorectal Cancer. Gastrointest Endosc Clin N Am 2022, 32, 177-194. [CrossRef]
- Yokoyama, S.; Watanabe, T.; Fujita, Y.; Matsumura, S.; Ueda, K.; Nagano, S.; Kinoshita, I.; Murakami, D.; Tabata, H.; Tsuji, T.; et al. Histology of metastatic colorectal cancer in a lymph node. PLoS One 2023, 18, e0284536. [CrossRef]
- Nagtegaal, I.D.; Hugen, N. The Increasing Relevance of Tumour Histology in Determining Oncological Outcomes in Colorectal Cancer. Curr Colorectal Cancer Rep 2015, 11, 259-266. [CrossRef]
- Gulsoy, T.; Baykal Kablan, E. FocalNeXt: A ConvNeXt augmented FocalNet architecture for lung cancer classification from CT-scan images. Expert Systems with Applications 2025, 261. [CrossRef]
- Taatjes, D.J.; Bouffard, N.A.; Barrow, T.; Devitt, K.A.; Gardner, J.A.; Braet, F. Quantitative pixel intensity- and color-based image analysis on minimally compressed files: implications for whole-slide imaging. Histochem Cell Biol 2019, 152, 13-23. [CrossRef]
- Hofener, H.; Homeyer, A.; Weiss, N.; Molin, J.; Lundstrom, C.F.; Hahn, H.K. Deep learning nuclei detection: A simple approach can deliver state-of-the-art results. Comput Med Imaging Graph 2018, 70, 43-52. [CrossRef]
- MathWorks. MATLAB for Artificial Intelligence. Design AI models and AI-driven systems. Website: https://www.mathworks.com/ (Accessed on December 12, 2024). Available online: (accessed on.
- Ewaeed, N.A.; Abed, H.N.; Abed, S.N. Detecting and Classifying Household Insects in Iraq by using Transfer Learning Models. Journal of Advanced Research in Applied Sciences and Engineering Technology 2025, 50, 21-33. [CrossRef]
- Xu, H.; Usuyama, N.; Bagga, J.; Zhang, S.; Rao, R.; Naumann, T.; Wong, C.; Gero, Z.; Gonzalez, J.; Gu, Y.; et al. A whole-slide foundation model for digital pathology from real-world data. Nature 2024, 630, 181-188. [CrossRef]
- Das, N.; Das, S. Attention-UNet architectures with pretrained backbones for multi-class cardiac MR image segmentation. Curr Probl Cardiol 2024, 49, 102129. [CrossRef]
- Jiang, X.; Hu, Z.; Wang, S.; Zhang, Y. Deep Learning for Medical Image-Based Cancer Diagnosis. Cancers (Basel) 2023, 15. [CrossRef]
- Weller, J.H.; Scheese, D.; Tragesser, C.; Yi, P.H.; Alaish, S.M.; Hackam, D.J. Artificial Intelligence vs. Doctors: Diagnosing Necrotizing Enterocolitis on Abdominal Radiographs. J Pediatr Surg 2024, 59, 161592. [CrossRef]
- Khan, H.A.; Jue, W.; Mushtaq, M.; Mushtaq, M.U. Brain tumor classification in MRI image using convolutional neural network. Math Biosci Eng 2020, 17, 6203-6216. [CrossRef]
- Karimi, D.; Dou, H.; Gholipour, A. Medical Image Segmentation Using Transformer Networks. IEEE Access 2022, 10, 29322-29332. [CrossRef]
- Wang, X.; Yang, S.; Zhang, J.; Wang, M.; Zhang, J.; Yang, W.; Huang, J.; Han, X. Transformer-based unsupervised contrastive learning for histopathological image classification. Med Image Anal 2022, 81, 102559. [CrossRef]
- Lama, N.; Kasmi, R.; Hagerty, J.R.; Stanley, R.J.; Young, R.; Miinch, J.; Nepal, J.; Nambisan, A.; Stoecker, W.V. ChimeraNet: U-Net for Hair Detection in Dermoscopic Skin Lesion Images. J Digit Imaging 2023, 36, 526-535. [CrossRef]
- TensorFlow. Website: https://www.tensorflow.org/ (Accessed on December 12, 2024). Available online: (accessed on.
- TensorFlow Keras Basic image classification. Website: https://www.tensorflow.org/tutorials/keras/classification (Accessed on December 12, 2024). Available online: (accessed on.
- PyTorch, get started. Website: https://pytorch.org/ (Accessed on December 12, 2024). Available online: (accessed on.
- ONNX, open neural network exchange. Website: https://onnx.ai/ (Accessed on December 12, 2024). Available online: (accessed on.
- Kaiming He, Xiangyu Zhang, Shaoqing Ren, Jian Sun. Deep Residual Learning for Image Recognition. arXiv:1512.03385v1.
- UniProt, C. UniProt: the Universal Protein Knowledgebase in 2023. Nucleic Acids Res 2023, 51, D523-D531. [CrossRef]
- Peng, D.H.; Rodriguez, B.L.; Diao, L.; Chen, L.; Wang, J.; Byers, L.A.; Wei, Y.; Chapman, H.A.; Yamauchi, M.; Behrens, C.; et al. Collagen promotes anti-PD-1/PD-L1 resistance in cancer through LAIR1-dependent CD8(+) T cell exhaustion. Nat Commun 2020, 11, 4520. [CrossRef]
- Van Laethem, F.; Donaty, L.; Tchernonog, E.; Lacheretz-Szablewski, V.; Russello, J.; Buthiau, D.; Almeras, M.; Moreaux, J.; Bret, C. LAIR1, an ITIM-Containing Receptor Involved in Immune Disorders and in Hematological Neoplasms. Int J Mol Sci 2022, 23. [CrossRef]
- Xu, W.; Zhao, X.; Wang, X.; Feng, H.; Gou, M.; Jin, W.; Wang, X.; Liu, X.; Dong, C. The Transcription Factor Tox2 Drives T Follicular Helper Cell Development via Regulating Chromatin Accessibility. Immunity 2019, 51, 826-839 e825. [CrossRef]
- Carreras, J.; Roncador, G.; Hamoudi, R. Ulcerative Colitis, LAIR1 and TOX2 expression and Colorectal Cancer Deep Learning Image Classification Using Convolutional Neural Networks. Preprints 2024, 2024110211. [CrossRef]
- Carreras, J.; Kikuti, Y.Y.; Bea, S.; Miyaoka, M.; Hiraiwa, S.; Ikoma, H.; Nagao, R.; Tomita, S.; Martin-Garcia, D.; Salaverria, I.; et al. Clinicopathological characteristics and genomic profile of primary sinonasal tract diffuse large B cell lymphoma (DLBCL) reveals gain at 1q31 and RGS1 encoding protein; high RGS1 immunohistochemical expression associates with poor overall survival in DLBCL not otherwise specified (NOS). Histopathology 2017, 70, 595-621. [CrossRef]
- Carreras, J.; Kikuti, Y.Y.; Hiraiwa, S.; Miyaoka, M.; Tomita, S.; Ikoma, H.; Ito, A.; Kondo, Y.; Itoh, J.; Roncador, G.; et al. High PTX3 expression is associated with a poor prognosis in diffuse large B-cell lymphoma. Cancer Sci 2022, 113, 334-348. [CrossRef]
- Carreras, J.; Yukie Kikuti, Y.; Miyaoka, M.; Hiraiwa, S.; Tomita, S.; Ikoma, H.; Kondo, Y.; Shiraiwa, S.; Ando, K.; Sato, S.; et al. Genomic Profile and Pathologic Features of Diffuse Large B-Cell Lymphoma Subtype of Methotrexate-associated Lymphoproliferative Disorder in Rheumatoid Arthritis Patients. Am J Surg Pathol 2018, 42, 936-950. [CrossRef]
- Carreras, J.; Kikuti, Y.Y.; Roncador, G.; Miyaoka, M.; Hiraiwa, S.; Tomita, S.; Ikoma, H.; Kondo, Y.; Ito, A.; Shiraiwa, S.; et al. High Expression of Caspase-8 Associated with Improved Survival in Diffuse Large B-Cell Lymphoma: Machine Learning and Artificial Neural Networks Analyses. BioMedInformatics 2021, 1, 18-46. [CrossRef]
- Carreras, J. Celiac Disease Deep Learning Image Classification Using Convolutional Neural Networks. J. Imaging 2024, 10, 200. [CrossRef]
- MathWorks. Batch normalization layer. Available online: https://www.mathworks.com/help/deeplearning/ref/nnet.cnn.layer.batchnormalizationlayer.html (accessed on 28 July 2024).
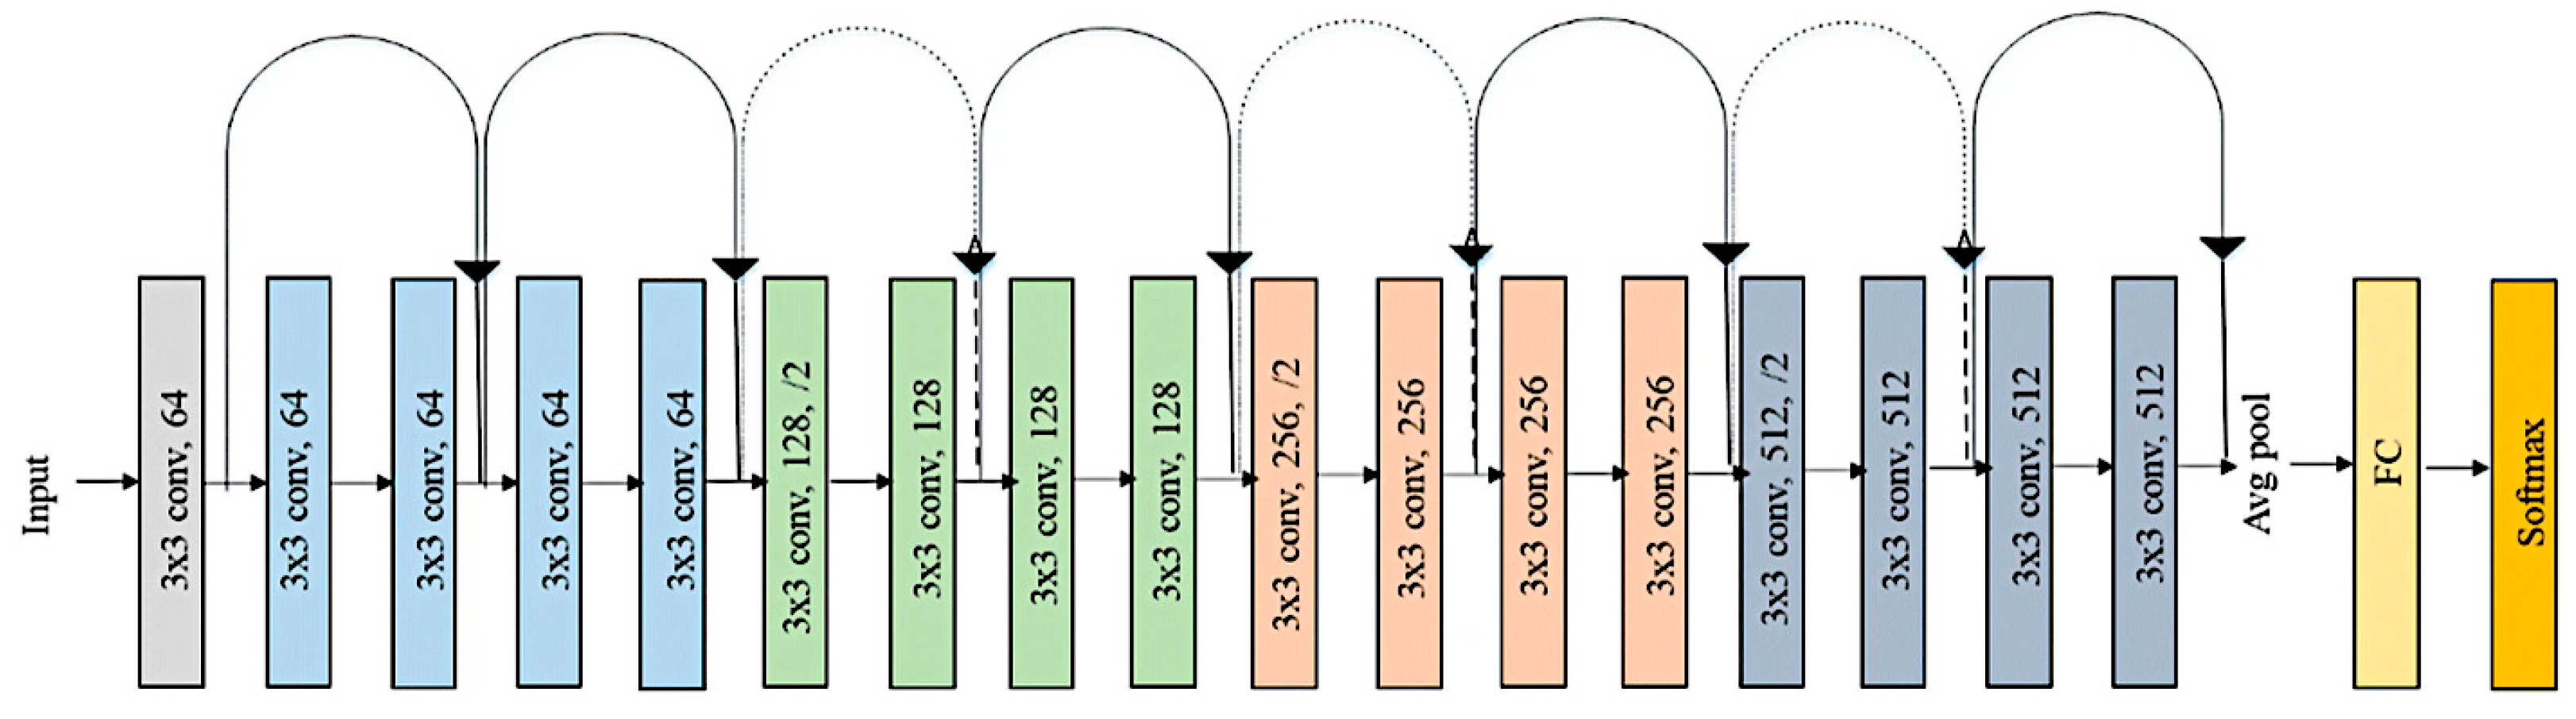
| ResNet-18-Based CNN | Training (70%) | Validation (10%) | Training Options |
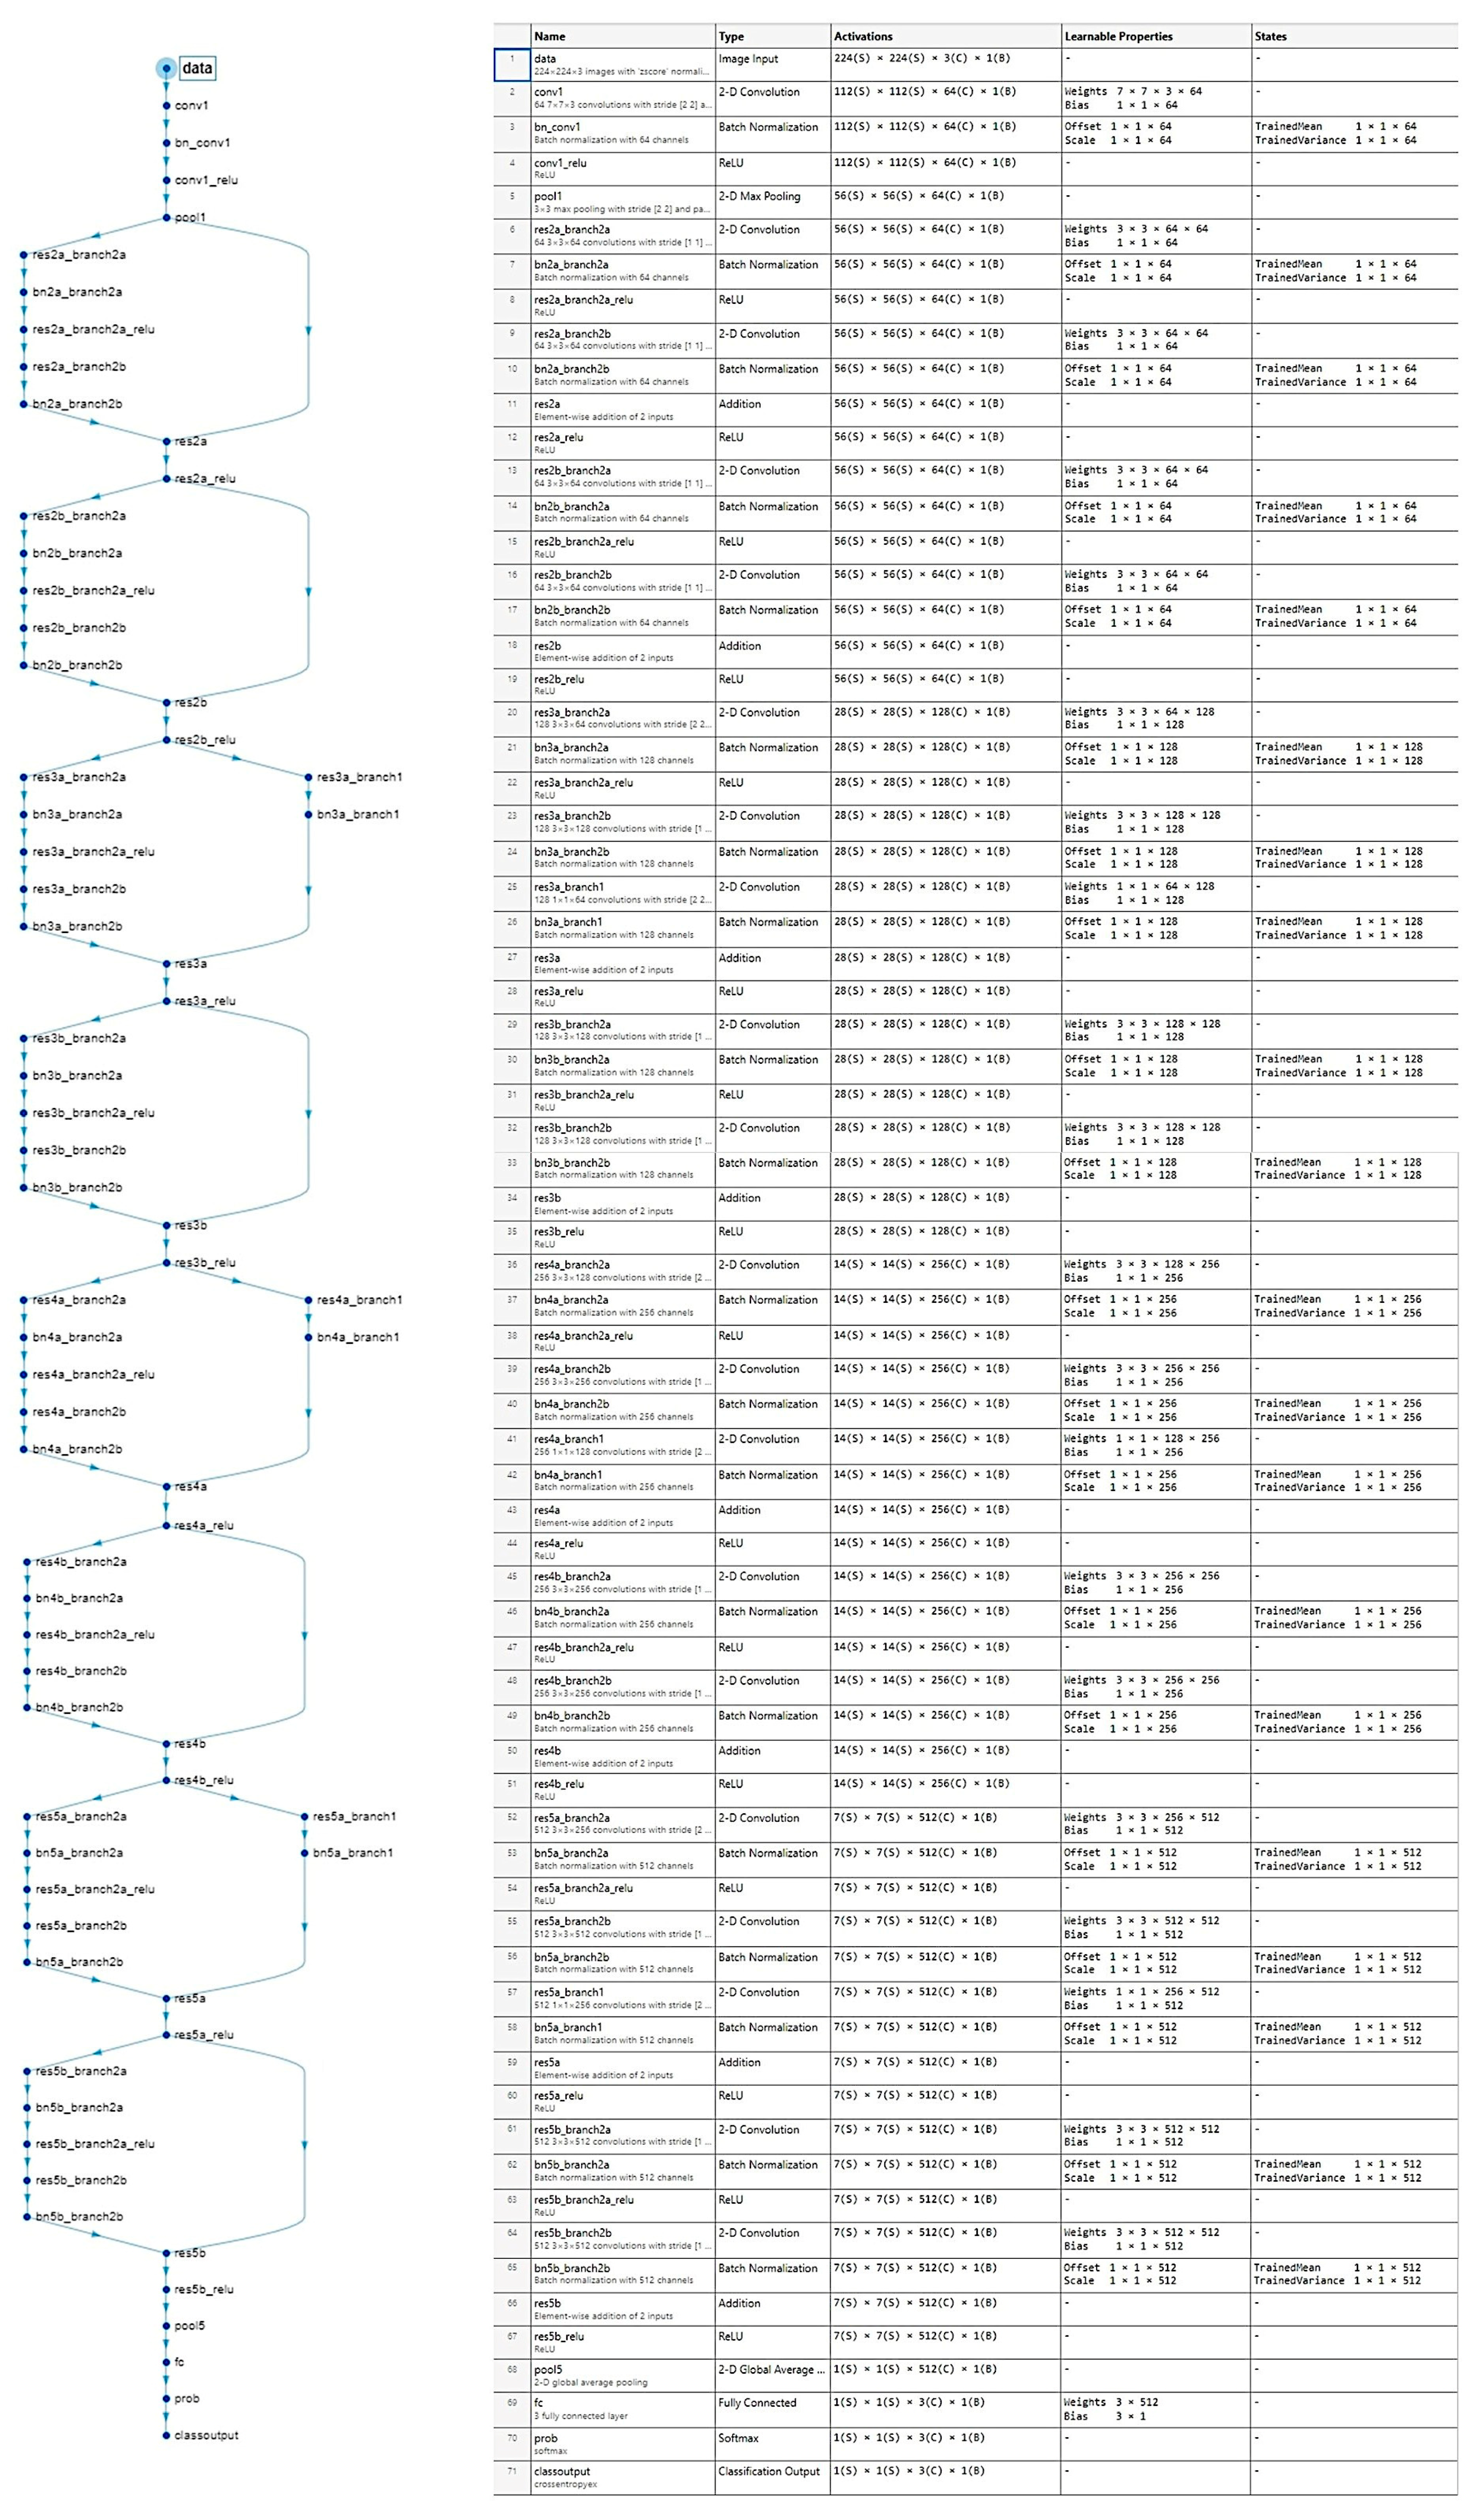
| Input type: image patches Output type: classification Number of layers: 71 Number of connections: 78 |
Observations: 59,677 Classes: 3 Ulcerative colitis: 6497 Colorectal cancer: 44,608 Colon control: 8572 |
Observations: 8525 Classes: 3 Ulcerative colitis: 928 Colorectal cancer: 6372 Colon control: 1225 |
Solver: sgdm Initial learning rate: 0.001 MiniBatch size: 128 MaxEpochs: 5 Validation frequency: 50 Iterations: 2330 Iterations per epoch: 466 |
| Additional detailed training options | |||
|
Import images Augmentation options: none Available parameters Random reflection axis: x, y Random rotation (degrees): min, max Random rescaling: min, max Random horizontal translation (pixels): min, max Random vertical translation (pixels): min, max Resize during training to match network input size: yes, no Solver Momentum: 0.9 Learn rate LearnRateSchedule: none LearnRateDropFactor: 0.1 LearnRateDropPeriod: 10 Normalization and Regularization L2Regularization: 0.0001 ResetInputNormalization: yes BatchNormalizationStatistics: population Mini-Batch: Shuffle: every-epoch Validation and Output: ValidationPatience: Inf OutputNetwork: last-iteration Gradient Clipping: GradientThresholdMethod: I2norm GradientThreshold: Inf Hardware: ExecutionThreshold: auto. Checkpoint CheckpointPath: n/a CheckpointFrequency: 1 CheckpointFrequencyUnit: epoch | |||
Disclaimer/Publisher’s Note: The statements, opinions and data contained in all publications are solely those of the individual author(s) and contributor(s) and not of MDPI and/or the editor(s). MDPI and/or the editor(s) disclaim responsibility for any injury to people or property resulting from any ideas, methods, instructions or products referred to in the content. |
© 2025 by the authors. Licensee MDPI, Basel, Switzerland. This article is an open access article distributed under the terms and conditions of the Creative Commons Attribution (CC BY) license (http://creativecommons.org/licenses/by/4.0/).


